Embed Size (px)
Citation preview

Introduction to Cancer Epidemiology
Epidemiology and Molecular Pathology of Cancer: Bootcamp course
Tuesday, 3 January 2012
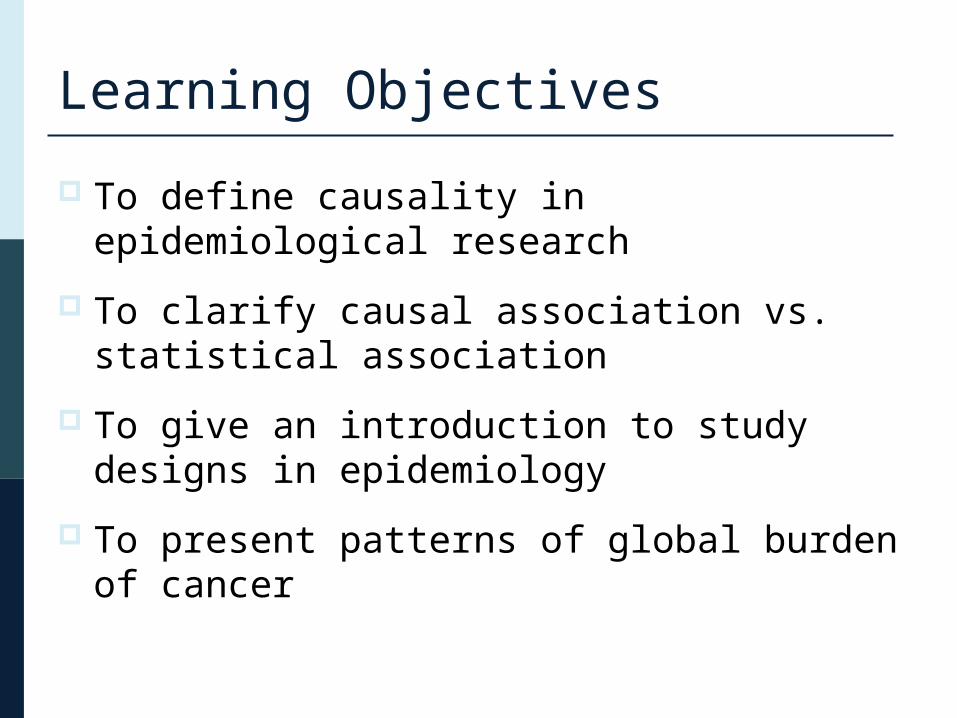
Learning Objectives
To define causality in epidemiological research
To clarify causal association vs. statistical association
To give an introduction to study designs in epidemiology
To present patterns of global burden of cancer

Causality and causal inference

Causation
Definition: A cause of disease is an event, condition or characteristic that preceded the disease and without which the disease would not have occurred, or would not have occurred at that time.
Rothman and Greenland, Am J Public Health 2005

Causation A disease can be caused by more than one causal
mechanism
Causal mechanism involves joint actions of component causes
Necessary, sufficient and component causes: Smoking and lung cancer
Rothman and Greenland, Am J Public Health 2005
smokingGenetic Suscept-ibility
smokingPassive smoke
genetics
Air pollu-tion
genetics
gender

Causation
Most causes are neither necessary nor sufficient
However, elimination of the cause may result in elimination of substantial proportion of disease
Estimating causal associations is paramount in epidemiological research and a prerequisite for prevention
Rothman and Greenland, Am J Public Health 2005

Causation and Causal inference Follow group of exposed
(smoking) individuals over time and observe outcome
What would have happened to same group if not been exposed to smoking?
If the two outcomes differ causal effect
If the two outcomes same no causal effect
“Time Machine”
Ysmoking YNo smoking
Michael 1 0
Jennifer 1 0
Linda 0 0
Jeremy 0 0
Axel 1 0
Sophia 1 1
Elisa 1 0
Hernan, J Epidemiol Comm Health 2004
Counterfactual outcomes of lung cancer among individuals

Causal inference Causal inference – scientific reasoning that allows one to arrive
at the conclusion that something is or is likely to be cause
Goal in epidemiology is to approximate counterfactual to estimate causal effects of exposure on disease risk
Study design to approximate the counterfactual
Unexposed group should be a proxy of counterfactual experience for the exposed group

Causal versus Statistical associations

Causal vs. statistical association
Statistical associations are what we measure in epidemiological study or randomized trial Relative measures: Odds ratios, rate ratios, hazard ratios Absolute measures: Risk difference, rate difference,
number needed to treat/screen
“Men who drink coffee regularly have a 60 percent lower risk of lethal prostate cancer compared to men who don’t drink coffee”

Measures of association
Statistical associations Provide estimate of the size of the association
E.g. Compared to healthy weight individuals, does obesity influence risk of postmenopausal breast cancer by a little or alot?
Informs direction of the effect Does the exposure increase risk of disease or
decrease risk of disease compared to not being exposed
E.g. Compared to nonusers, individuals who take aspirin are at lower risk of colorectal cancer
Aim to approximate causal associations 0
0.2
0.4
0.6
0.8
1
1.2
1.4
<1 per month 1-3 per month 1-2 per week >2 weeks
Relative risk
Total prostate cancer
Advanced cancer
REF
NULL
Lower risk
Increased risk

Causal vs. statistical association
Statistical associations can arise: E D Causal association
D E Reverse causation/recall bias
C E D Confounding
Statistical associations can also arise due to misclassification, missing data, selection bias

Confounding example
Physical activity
Lung cancer?
Smoking
+_
Women with vigorous physical activity had 80 percent lower risk of lung cancer compared to women who did not exercise

Confounding
• In epidemiology, nonrandom allocation of the exposure
• It is a mixing of effects. Association between exposure and disease is distorted because it is mixed with the effect of another factor.
• The result of confounding is to distort the true causal association between an exposure and disease
• The direction of the distortion can be either toward the null or away from the null.
• Extent of confounding depends on pr[C], RR[D]|[C], RR[E]|C

95% Confidence Intervals
Range of plausible values consistent with data
If no bias or confounding
Surround the measure of association (point estimate)
Relative risk = 2.5, 95% Confidence Interval = 1.7 – 3.9
Size of confidence interval is based on size of cohort, number of outcomes, and prevalence of exposure

95% Confidence Intervals Relative risk = 2.5, 95% Confidence Interval = 1.7 – 4.1
UPPER 95% CI

Study design

Randomized Studies Investigator randomly assigns who gets exposure
Cannot directly observe individual effects Compare outcomes in exposed vs. unexposed
Placebo group is proxy for what would have happened to statin group if not exposed to statins
10,000 people
Statin N=5,000
Cancer? Cancer?
Statin N=5,000T ime

Cohort studies
Analagous to the experiment, but investigator does not assign exposure
Cohorts are groups of individuals followed over time
Cohorts are longitudinal and outcome assessed over time
E
Ē
Intervention study
E
Ē
Cohort study

Cohort study
Person
1
2
3
4
5
6
7
8
ExposedUnexposedCase
Time
Cohort = group defined by membership defining event
Once a member, always a member until death
Once defined and follow-up begins, no one is added

Cohort Study
Person
1
2
3
4
5
6
7
8
Exposed
Unexposed
Case
Time
Most exposures vary over time
Weight, diet, smoking, infections, blood pressure

Case control studies
An efficient and valid alternative to cohort study Case-control study attempts to observe a population more
efficiently Efficiency comes from use of control series in place of
complete assessment of cohort experience

Case control studies
Identify and enroll cases
Determine “cohort” that gave rise to cases
Cases give information about numerators of rates that would have calculated in cohort
Controls should be selected from the same cohort
Controls should estimate exposure in the population from where the cases came

Case Control: Risk set sampling
Time
Person
1
2
3
4
5
6
7
8
9
10
Exposed
Unexposed
Case

Case Control: Risk set sampling
Time
Person
1
2
3
4
5
6
7
8
9
10
Exposed
Unexposed
Case

1992 1994 1996 1998 2000 2002
Person
1
2
3
4
5
6
7
8
9
10
11
Exposed
Unexposed
Cancer case
Case Control: Case-cohort sampling

1992 1994 1996 1998 2000 2002
Person
1
2
3
4
5
6
7
8
9
10
11
Exposed
Unexposed
Cancer case
Case Control: Case-cohort sampling

1992 1994 1996 1998 2000 2002
Person
1
2
3
4
5
6
7
8
9
10
11
ExposedUnexposedCancer case
Cases
Case Control: “Traditional” sampling

Global burden of cancer
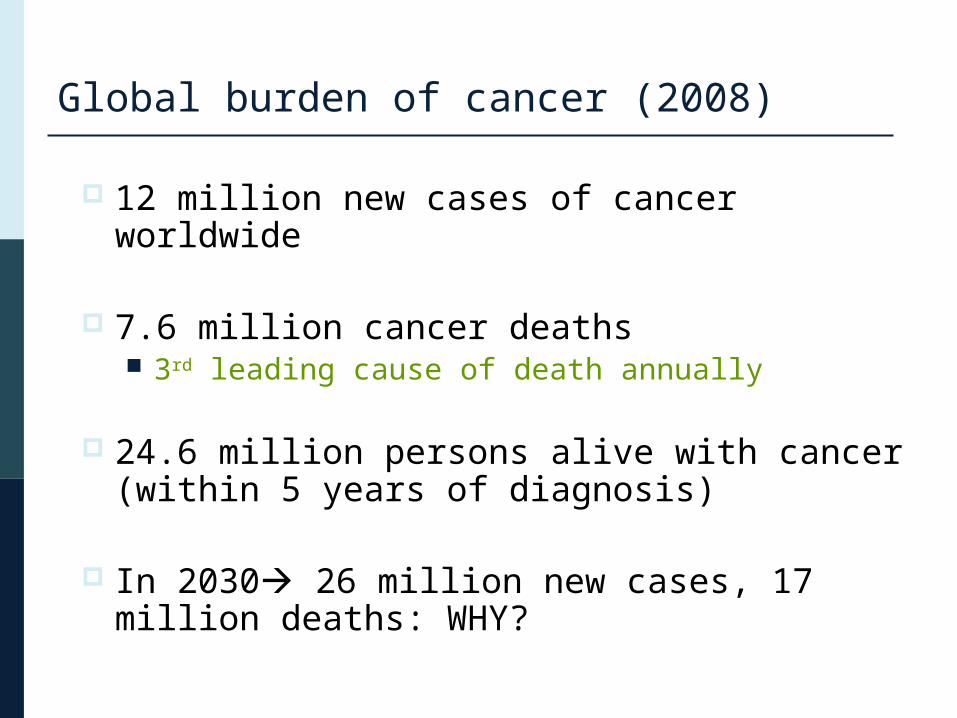
Global burden of cancer (2008)
12 million new cases of cancer worldwide
7.6 million cancer deaths 3rd leading cause of death annually
24.6 million persons alive with cancer (within 5 years of diagnosis)
In 2030 26 million new cases, 17 million deaths: WHY?

Global burden of cancer
Thun et al, 2010

US burden of cancer (2011): 303 million
Estimated 1,596,000 million people will be diagnosed with cancer in 2011 822,000 men; 744,000 women
Estimated 572,000 will die of cancer in 2011 (300,000 men; 272,000 women) 5-year relative survival 68%
American Cancer Society, 2011


Data from the International Agency For Research on Cancer (IARC) website
www.iarc.fr Cancer Epidemiology databases, Globocan 2002 and Cancer Incidence in Five
Countries (CI-VIII, IX)
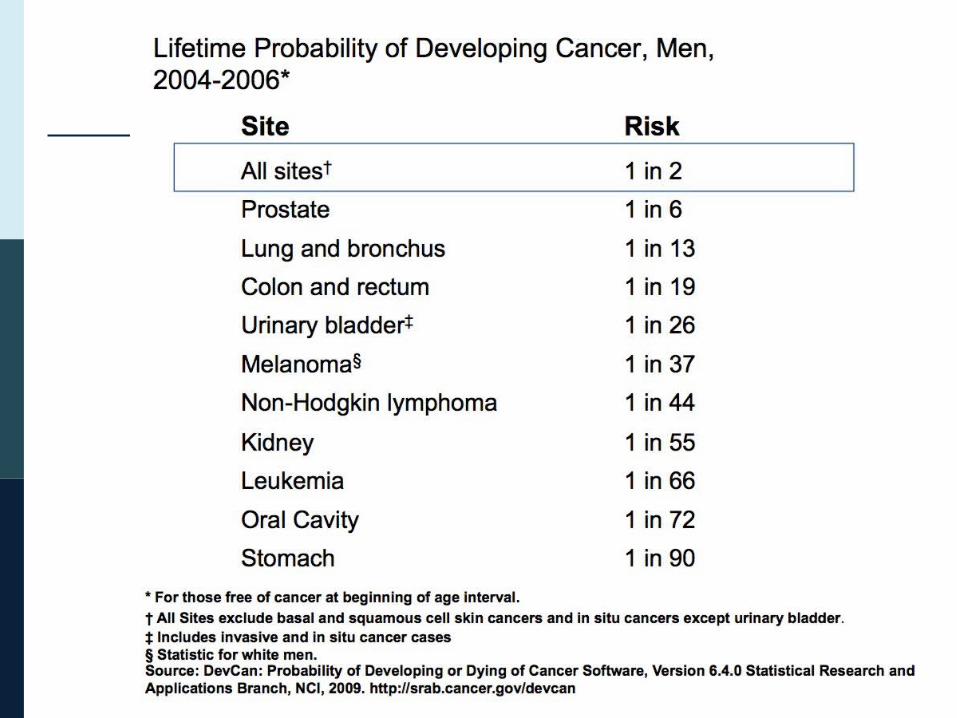
What are the major cancers among men and women?

Cancer Incidence in the World (Men)

Cancer Incidence in the World (Women)

Cancer incidence rates in Africa, 2002
0 25 50 75 100 125 150
Kaposi sarcoma
Liver
Prostate
Esophagus
NHL
Stomach
Colon/rectum
Bladder
Cervix
Breast
Ovary
All sites
ASR per 100,000
Females
Males

Cervix UteriAge-standardized incidence rate per 100,000

Stomach, MalesAge-Standardized incidence rate per 100,000

Stomach, FemalesAge-standardized incidence rate per 100,000

Testis,Age-Standardized incidence rate per 100,000
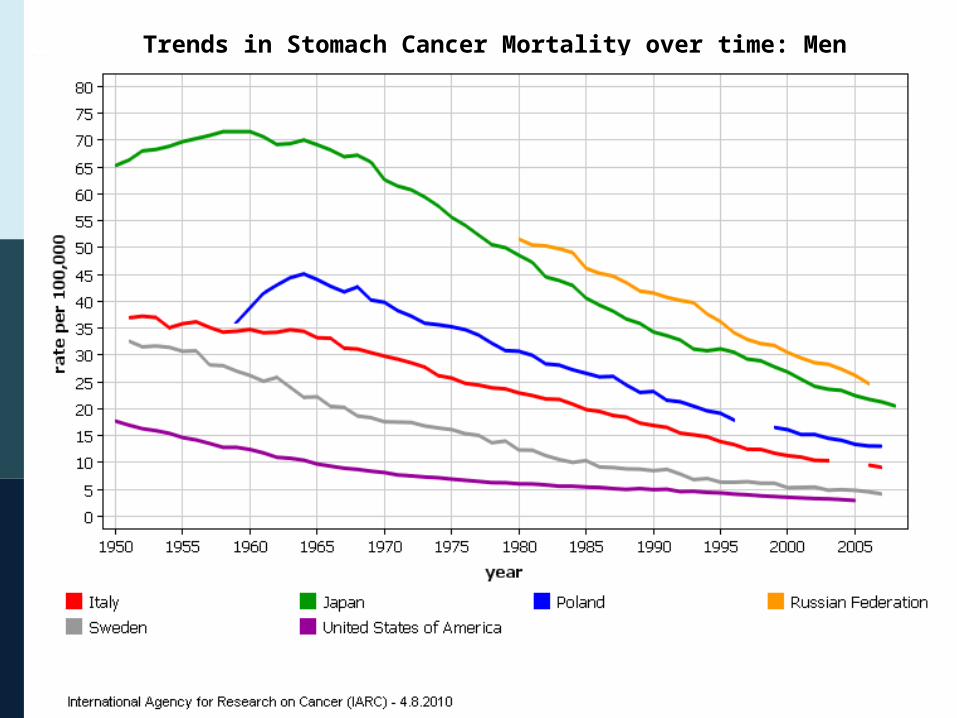
Trends in Stomach Cancer Mortality over time: Men