Embed Size (px)
Citation preview
Plastic Waste Quantification and Characterization – Cebu (2009)
Extracted from the report “Converting Waste Plastics to Fuels – Baseline Study Project. Activity II-1:
Plastic Waste Analysis and Characterization Study-A. Cebu City, Philippines”
Brief Profile of Cebu City Cebu City is located on the central eastern part of Cebu Province, the center island in Central Visayas, Southern Philippines. It is bounded by Mandaue City in the North and Talisay City in the South. On the East is Mactan Channel and on its West are the Municipality of Balamban and the City of Toledo.1 It has a total land area of 326.10 square kilometres or 29,124.78 hectares. Its strategic location makes it accessible by air and sea transport. By plane, it is only an hour away from Manila and just a few hours to reach major cities in the Asia Pacific region. 2 It is composed of eighty barangays, thirty-six in the North District and thirty-four in the South District. Of these barangays, fifty are classified as urban and thirty as rural barangays.3
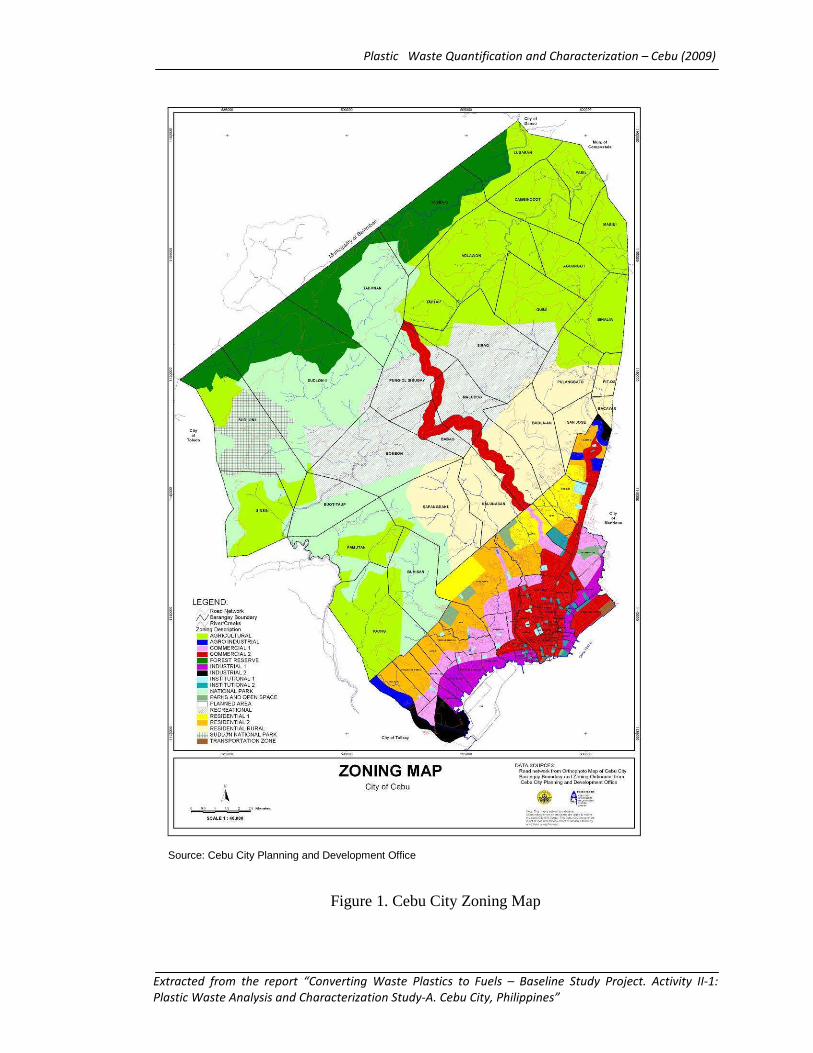
Geographical Area and Zoning Of the city’s 29,124.78 hectares, only 5,598.53 hectares occupy the urban areas. However, 5o of the 80 barangays are classified as urban, while only 30 are classified rural scattered along some 23,526 hectares. The North district has 46 barangays while South district has 34 barangays. While only 28% of the city is within the 18% slope or less range, about 64% of the city’s lands are classified by the national government as alienable and disposable. The rest is classified as forest or timberland. Lands classified as timberland include areas that are within the critical watersheds and other protected areas of the city. Seventy-three percent of the city’s land is under the Nationally Integrated Protected Areas System (NIPAS). Twenty-three of the city’s barangays are totally or partially located in the four watershed areas: Mananga, Kotkot, Lusaran and the Cebu Watershed Reservation in Buhisan. As shown in the city’s Zoning Map (Figure 1), the coastal area facing the Mactan Strait is predominantly industrial. Commercial areas follow inward, followed by urban residential areas. As the slope goes higher, the areas are rural residential, followed the Sudlon National Park, as well as other open areas and parks. Pockets of institutional areas are scattered throughout the narrow coastal flatland where the commercial and industrial, as well as urban residential zones are found.4 1 Cebu, CPDO, City Profile, 2008. 2 “Solid Waste Management in Cebu City,” June 15,2009 <http://kitakyushu.iges.or.jp/docs/sp/swm/3%20Cebu%20(Paper).pdf> 3 Barangay is the smallest political unit in the Philippines. 4 Cebu, CPDO, City Profile, 2008.
Introduction to Cebu (Philippines)
Plastic Waste Quantification and Characterization – Cebu (2009)
Extracted from the report “Converting Waste Plastics to Fuels – Baseline Study Project. Activity II-1:
Plastic Waste Analysis and Characterization Study-A. Cebu City, Philippines”
Source: Cebu City Planning and Development Office
Figure 1. Cebu City Zoning Map
Plastic Waste Quantification and Characterization – Cebu (2009)
Extracted from the report “Converting Waste Plastics to Fuels – Baseline Study Project. Activity II-1:
Plastic Waste Analysis and Characterization Study-A. Cebu City, Philippines”
Population Growth As of August 2007, Cebu City had a total population of 798,809.5 Although trend shows a slight decline in growth rate, at 2.19% (1990) 1.64% from 1995 to 20006, the city’s weekday population is slightly bigger, since it houses the biggest commercial areas, schools, hospitals and public offices that people from neighbouring towns and cities come to during daytime and weekdays. These transients and commuters contribute to the over-all waste generation of the city. With the base figure of 798,809 for 2007 and growth rate at 1.77% (2000), current population can be placed at 824,337. Socio-Economic Patterns Socio-economic events contribute to the fluctuation of waste generation in the City. Tourism is a major contributing industry because Cebu is considered as one of the main tourist destinations in the country. Tourism is at its peak from January to July. Both locals and visitors from other countries participate in celebrating major events. During this period, industrial and commercial establishments are busiest. Tourists go shopping, buy souvenirs and eat out.7 Major events contribute a large volume of wastes. The first event of the year which contributes to a lot of waste is New Year. Generated wastes usually spill off from the Christmas week, wherein people engage in gift-giving and major shopping sprees. However, the single biggest event which contributes the biggest waste generation is the Sinulog Festival. During Sinulog, thousands of pilgrims and visitors join the celebration for the feast of the Sto. Nino. The Festival features street dancing, face painting, party events, show bands, fireworks, a Mardi Gras Parade and other activities. During February, the Cebu X International Furniture & Furnishing Exhibition attracts buyers from around the world. Although commonly featured in this annual exhibit are indigenous materials such as rattan, bamboo, shells, and buri, the waste generated by visitors include PET bottles and Styrofoam. The Chinese New Year, on the other hand, is a vibrant Filipino-Chinese fanfare with dragon dances, fireworks. Valentines’ Day gift giving has also become popular among urban residents. The Lenten Season which falls on the last week of March to the first week of April is observed with religious processions in every church in the city and Visita Iglesia or church visits. A large volume of devotees visit the Sto. Nino during the week-long observance. April and May is summer time during which countryside fiestas are celebrated. People take tours in mango and flower farms of Cebu City’s Hillylands where anyone can stop along the roadside markets to buy fresh fruits and flowers. Flores de Mayo is celebrated all over Cebu City where visitors can watch the Santacruzan Parade where chosen women walk under floral arches in tiaras and ternos.
5 National Statistics Office, June 20, 2009 <www.census.gov.ph/data/census2007/index.html> 6 Cebu, CPDO, City Profile, 2008. 7 Calendar of Activities (Department of Tourism, 2008).
Plastic Waste Quantification and Characterization – Cebu (2009)
Extracted from the report “Converting Waste Plastics to Fuels – Baseline Study Project. Activity II-1:
Plastic Waste Analysis and Characterization Study-A. Cebu City, Philippines”
Classes start in June. Major waste generation includes packaging materials for school supplies. It is also when the Annual Cebu Business Month is held. Cebuano retail merchants take chunks off tags prices and many warehouses hold export overruns and some of the biggest name brands in clothing. The Sugbayanihan, the longest barbecue grill, is also celebrated in June. July and August are usually lean months as tropical storms become more frequent. In July, the Fruits and Vegetables Festival is held at the City Hall Ground. September, on the other hand, signals the entry of the “ber” months before Christmas. Retailers offer a lot of bargains to attract buyers. Restaurant rows hold a series of concerts and events during the month-long Octoberfest. The Queen City International Run is held in November. By this time, the second semester opens in colleges and universities and more wastes are generated from packaging of schools supplies. Christmas in Cebu is more than a month-long celebration. The Christmas Food Street Festival is held and the traditional gift giving, shopping and parties render a surge in waste generation. Economic Growth Despite the global economic slowdown, Central Visayas showed economic resilience during the second quarter and first half of 2008. For Cebu City, the sectors which posted positive growth were the information and communication technology (ICT) and tourism industries. Demand for tourism-related services, building of accommodation establishments and various services increased as the region becomes one the top destinations in Asia. Business processes outsourcing (BPO) increased and expanded. At the Asiatown IT Park alone in Lahug, the number of locators increased from 20 to 30 in 2008. The upbeat tourism and ICT performance led to positive movements in other economic sectors as well, made evident by the vibrant construction industry. This increased the labor market in the region from 92.7% in 2006 to 93.8 in 2007. IT Park alone employed 4,000 more workers in the same period. This translated to growth in retail trade as more disposable income is earned by BPO employees. The ICT sector contributes to more power consumption leading to the development two power reserve projects to add 100 megawatts of the Cebu-Negros-Panay (CNP) power grid, both of which are targeted for completion by 2010. The transportation sector grew as traffic and volume of passengers and cargo handled increase. In particular, Cebu-based Cebu Pacific Air opened new routes national and international, prompting others to follow. 8 Development Outlook 8 NEDA, Central Visayas Remains Tough Amidst Global Financial Turmoil, DevPulse, Vol. 12, No. 23,May 20,2009 <http://www.neda.gov.ph/devpulse/pdf_files/central visayas.pdf>
Plastic Waste Quantification and Characterization – Cebu (2009)
Extracted from the report “Converting Waste Plastics to Fuels – Baseline Study Project. Activity II-1:
Plastic Waste Analysis and Characterization Study-A. Cebu City, Philippines”
Because of international community recognition of Region 7 for its IT and tourism potentials, the region expects sustained growth in these sectors. In fact, the London-based Foreign Direct Investment magazine ranked Cebu City as eighth among 10 top Asian Cities in the future, while a study by Global Services placed the city as one of the favoured outsourcing destinations for global companies. Congruently, the region aims to further expand its tourism industry not only through continuous promotion of its ecotourism destinations, but also by penetrating new markets such as the Russians and Indians who are now becoming frequent visitors. Their numbers are expected to increase following moves by the Department of Tourism to streamline visa requirements for Indian guests.9
9 Ibid.
Plastic Waste Quantification and Characterization – Cebu (2009)
Extracted from the report “Converting Waste Plastics to Fuels – Baseline Study Project. Activity II-1:
Plastic Waste Analysis and Characterization Study-A. Cebu City, Philippines”
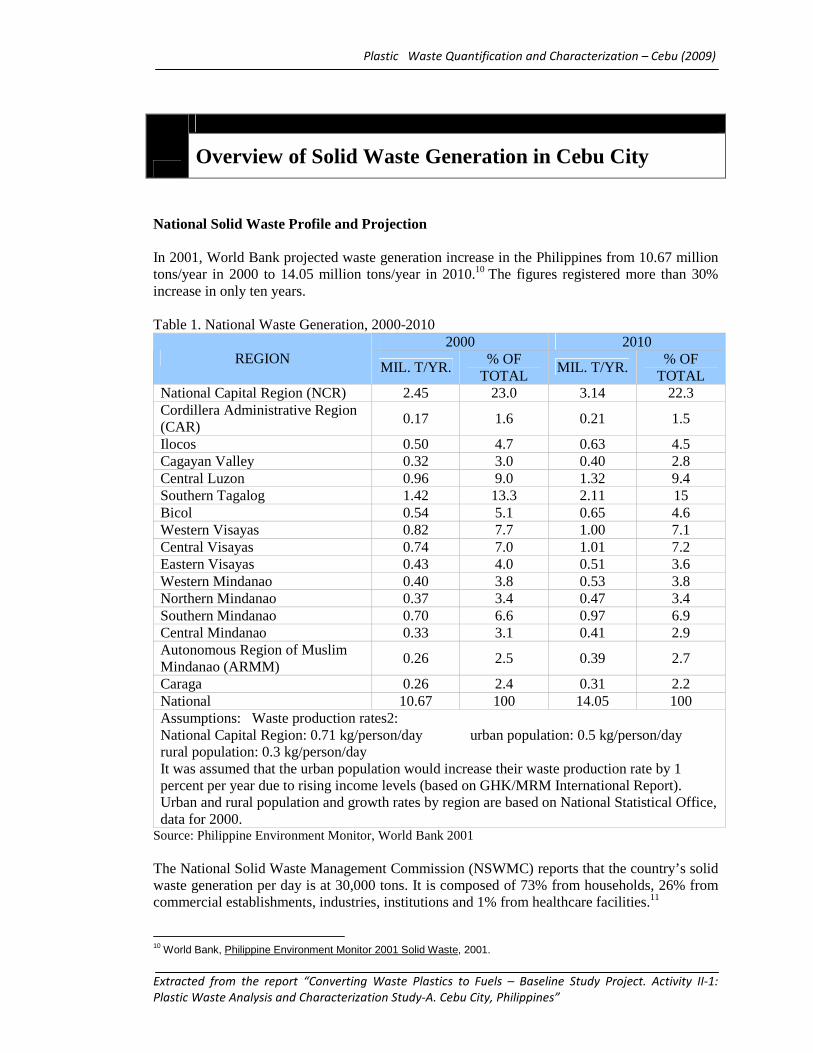
National Solid Waste Profile and Projection In 2001, World Bank projected waste generation increase in the Philippines from 10.67 million tons/year in 2000 to 14.05 million tons/year in 2010.10 The figures registered more than 30% increase in only ten years. Table 1. National Waste Generation, 2000-2010
2000 2010 REGION
MIL. T/YR. % OF
TOTAL MIL. T/YR.
% OF TOTAL
National Capital Region (NCR) 2.45 23.0 3.14 22.3 Cordillera Administrative Region (CAR)
0.17 1.6 0.21 1.5
Ilocos 0.50 4.7 0.63 4.5 Cagayan Valley 0.32 3.0 0.40 2.8 Central Luzon 0.96 9.0 1.32 9.4 Southern Tagalog 1.42 13.3 2.11 15 Bicol 0.54 5.1 0.65 4.6 Western Visayas 0.82 7.7 1.00 7.1 Central Visayas 0.74 7.0 1.01 7.2 Eastern Visayas 0.43 4.0 0.51 3.6 Western Mindanao 0.40 3.8 0.53 3.8 Northern Mindanao 0.37 3.4 0.47 3.4 Southern Mindanao 0.70 6.6 0.97 6.9 Central Mindanao 0.33 3.1 0.41 2.9 Autonomous Region of Muslim Mindanao (ARMM)
0.26 2.5 0.39 2.7
Caraga 0.26 2.4 0.31 2.2 National 10.67 100 14.05 100 Assumptions: Waste production rates2: National Capital Region: 0.71 kg/person/day urban population: 0.5 kg/person/day rural population: 0.3 kg/person/day It was assumed that the urban population would increase their waste production rate by 1 percent per year due to rising income levels (based on GHK/MRM International Report). Urban and rural population and growth rates by region are based on National Statistical Office, data for 2000.
Source: Philippine Environment Monitor, World Bank 2001 The National Solid Waste Management Commission (NSWMC) reports that the country’s solid waste generation per day is at 30,000 tons. It is composed of 73% from households, 26% from commercial establishments, industries, institutions and 1% from healthcare facilities.11
10 World Bank, Philippine Environment Monitor 2001 Solid Waste, 2001.
Overview of Solid Waste Generation in Cebu City
Plastic Waste Quantification and Characterization – Cebu (2009)
Extracted from the report “Converting Waste Plastics to Fuels – Baseline Study Project. Activity II-1:
Plastic Waste Analysis and Characterization Study-A. Cebu City, Philippines”
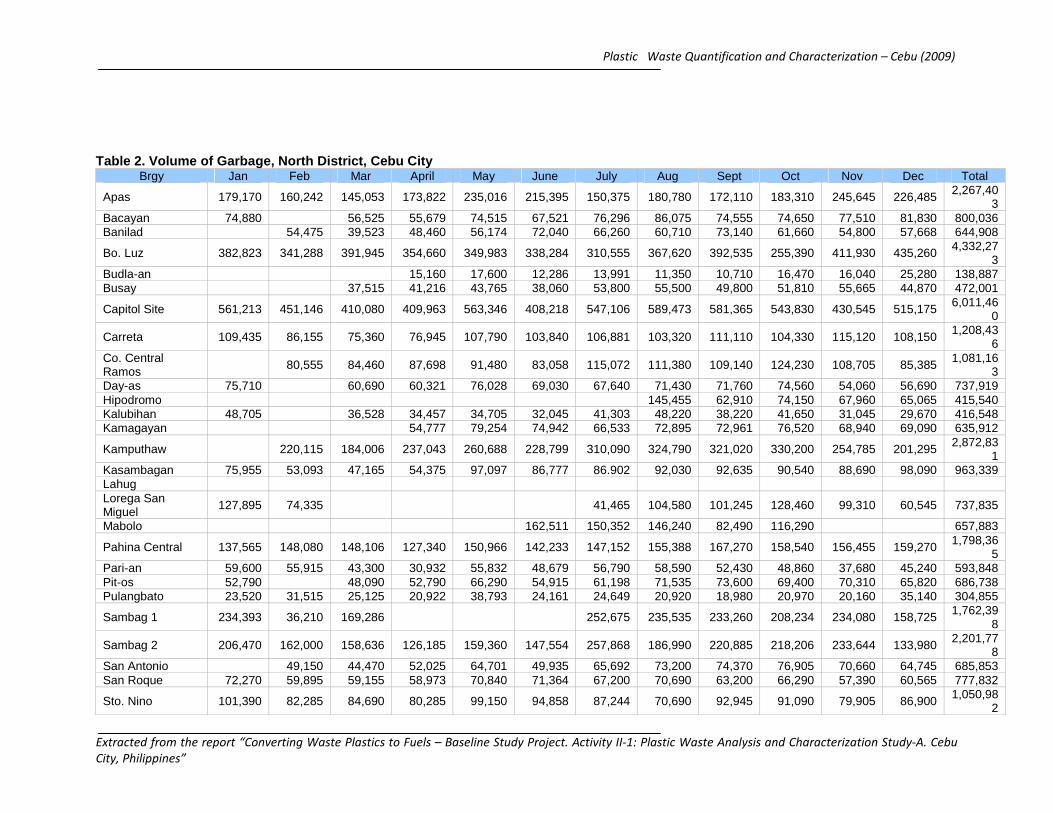
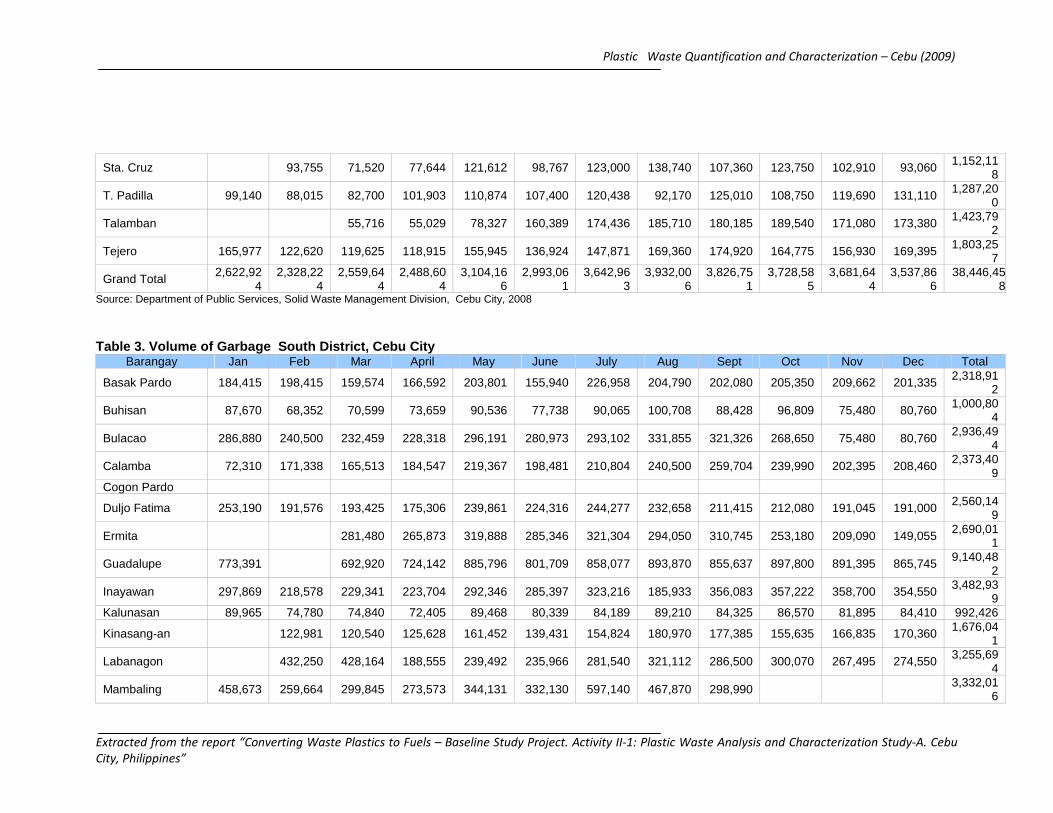
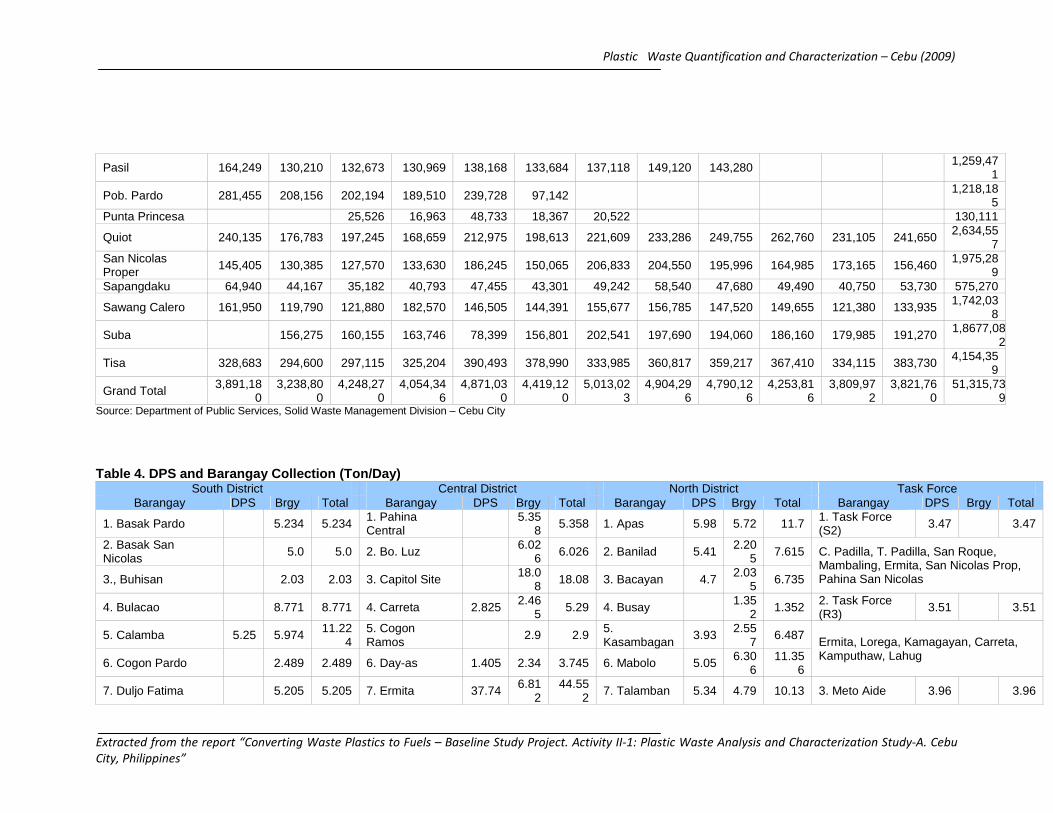
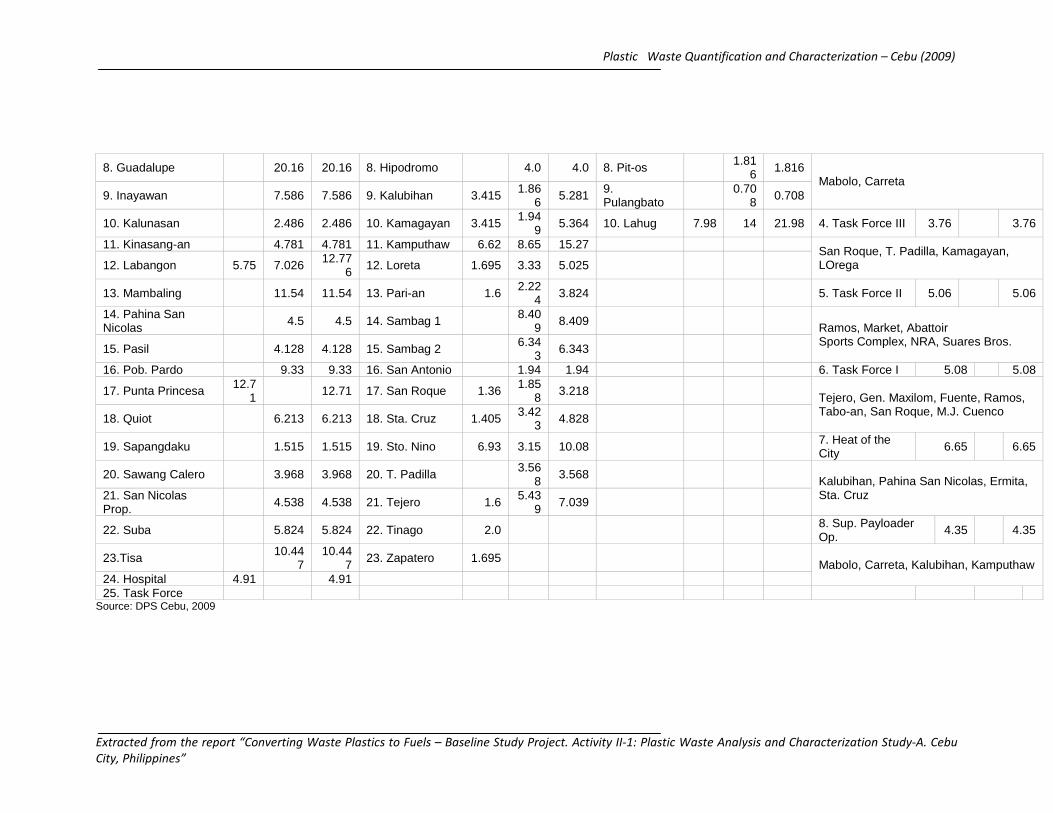
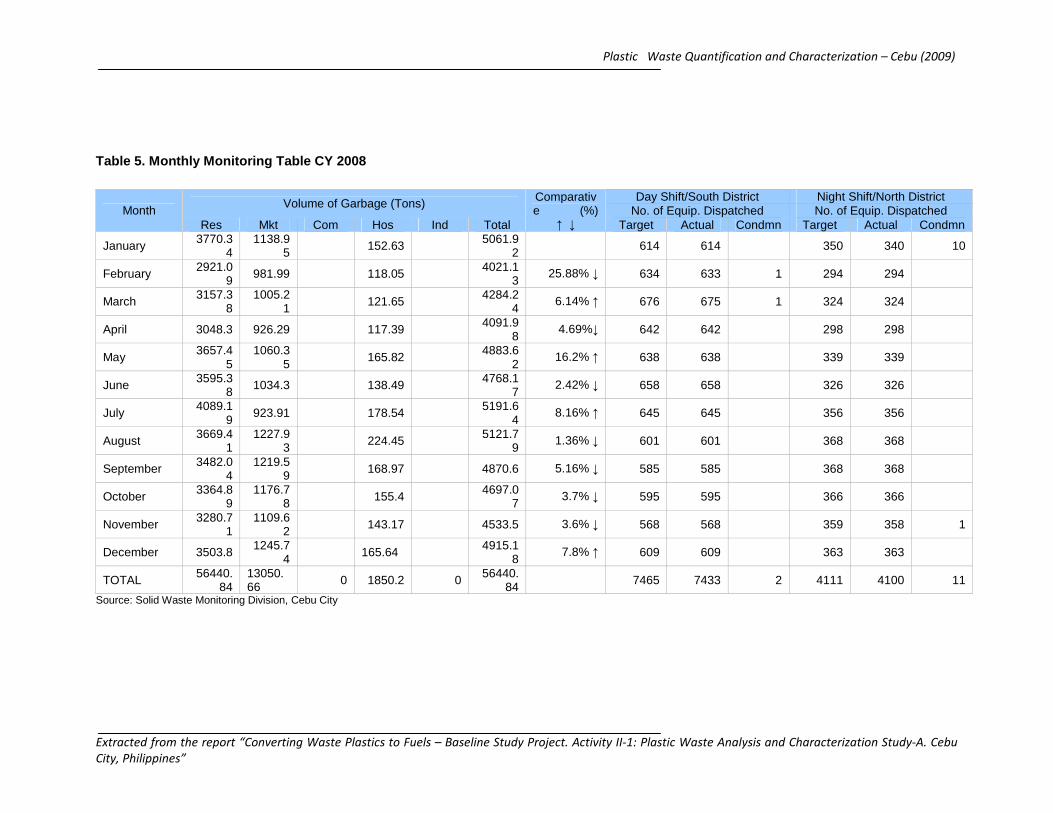
Based on RA 9003, LGUs are the lead implementing agency for SWM programs. The LGUs operate under the National Solid Waste Management Framework that clearly defines the Philippine 3R strategy as: Avoid, Reduce, Reuse, Recycle, Treat, and Dispose. Local policies, programs and projects in managing solid waste revolve around this strategy. Although RA 9003 requires the mainstreaming of waste recycling and recovery, these are mainly taken up by the informal sector. For instance, only 6% of solid waste was recycled in Metro Manila in 1997 which increased to only 25% in 2007. As of the second quarter of 2008, only 2,361 Materials Recovery Facilities (MRF) are established serving 2,634 barangays nationwide, based on the NSWMC database. This is only .05% of the 42,000 barangays nationwide that should have established their own facility. As provided by the law, all open dumpsites and controlled disposal facilities should have been closed by February 16, 2004 and February 16, 2006, respectively. Currently, more than 1,000 open dumpsites and controlled disposal facilities are still operating. Conversion of these disposal sites to sanitary landfills encounters sitting and financing difficulties. 12 City Solid Waste Monitoring In the North and South District of Cebu City the quantity of waste generation per barangays was monitored by the Solid Waste Monitoring Division of Cebu City on a monthly basis, as indicated on Tables 2 and 3, respectively. Blanks indicate that no data was submitted by the barangays to the DPS at the given period. Because of this, the totals given: 38,446,458 tons for the North District and 51,315,739 for the South District do not completely reflect waste generation in the two areas. Table 4 indicates that most barangays have their own waste collection trucks and that only a few are being served by DPS collection. The table also shows that the DPS has some Task Force trips for some common areas serving commercial establishments, markets and major thoroughfares. For 2008, the monthly comparative waste generation (Table 5) shows 25% reduction in February (4,021.13) from January (5,061.92). It gained 6.14% by March and decreased again by almost 5% in April. This monthly up-down fluctuation continued until an increase in July. August to November shows continued decline in waste generation and an increase of 7.8% in December. Table 5 also shows no data of commercial and industrial sectors, as both sectors have their own waste management collection and disposal. The sectors also do not report their own solid waste monitoring to the concerned city offices.
11 Aguinaldo, E. 2008, “National and Local Initiatives on Solid Waste Management and Implementation of 3Rs in the Philippines”, Environment and Livable Cities 08, Manila, Philippines. 12 Ibid.
Plastic Waste Quantification and Characterization – Cebu (2009)
Extracted from the report “Converting Waste Plastics to Fuels – Baseline Study Project. Activity II-1: Plastic Waste Analysis and Characterization Study-A. Cebu
City, Philippines”
Table 2. Volume of Garbage, North District, Cebu City Brgy Jan Feb Mar April May June July Aug Sept Oct Nov Dec Total
Apas 179,170 160,242 145,053 173,822 235,016 215,395 150,375 180,780 172,110 183,310 245,645 226,485 2,267,403
Bacayan 74,880 56,525 55,679 74,515 67,521 76,296 86,075 74,555 74,650 77,510 81,830 800,036 Banilad 54,475 39,523 48,460 56,174 72,040 66,260 60,710 73,140 61,660 54,800 57,668 644,908
Bo. Luz 382,823 341,288 391,945 354,660 349,983 338,284 310,555 367,620 392,535 255,390 411,930 435,260 4,332,273
Budla-an 15,160 17,600 12,286 13,991 11,350 10,710 16,470 16,040 25,280 138,887 Busay 37,515 41,216 43,765 38,060 53,800 55,500 49,800 51,810 55,665 44,870 472,001
Capitol Site 561,213 451,146 410,080 409,963 563,346 408,218 547,106 589,473 581,365 543,830 430,545 515,175 6,011,460
Carreta 109,435 86,155 75,360 76,945 107,790 103,840 106,881 103,320 111,110 104,330 115,120 108,150 1,208,436
Co. Central Ramos 80,555 84,460 87,698 91,480 83,058 115,072 111,380 109,140 124,230 108,705 85,385 1,081,16
3 Day-as 75,710 60,690 60,321 76,028 69,030 67,640 71,430 71,760 74,560 54,060 56,690 737,919 Hipodromo 145,455 62,910 74,150 67,960 65,065 415,540 Kalubihan 48,705 36,528 34,457 34,705 32,045 41,303 48,220 38,220 41,650 31,045 29,670 416,548 Kamagayan 54,777 79,254 74,942 66,533 72,895 72,961 76,520 68,940 69,090 635,912
Kamputhaw 220,115 184,006 237,043 260,688 228,799 310,090 324,790 321,020 330,200 254,785 201,295 2,872,831
Kasambagan 75,955 53,093 47,165 54,375 97,097 86,777 86.902 92,030 92,635 90,540 88,690 98,090 963,339 Lahug Lorega San Miguel 127,895 74,335 41,465 104,580 101,245 128,460 99,310 60,545 737,835
Mabolo 162,511 150,352 146,240 82,490 116,290 657,883
Pahina Central 137,565 148,080 148,106 127,340 150,966 142,233 147,152 155,388 167,270 158,540 156,455 159,270 1,798,365
Pari-an 59,600 55,915 43,300 30,932 55,832 48,679 56,790 58,590 52,430 48,860 37,680 45,240 593,848 Pit-os 52,790 48,090 52,790 66,290 54,915 61,198 71,535 73,600 69,400 70,310 65,820 686,738 Pulangbato 23,520 31,515 25,125 20,922 38,793 24,161 24,649 20,920 18,980 20,970 20,160 35,140 304,855
Sambag 1 234,393 36,210 169,286 252,675 235,535 233,260 208,234 234,080 158,725 1,762,398
Sambag 2 206,470 162,000 158,636 126,185 159,360 147,554 257,868 186,990 220,885 218,206 233,644 133,980 2,201,778
San Antonio 49,150 44,470 52,025 64,701 49,935 65,692 73,200 74,370 76,905 70,660 64,745 685,853 San Roque 72,270 59,895 59,155 58,973 70,840 71,364 67,200 70,690 63,200 66,290 57,390 60,565 777,832
Sto. Nino 101,390 82,285 84,690 80,285 99,150 94,858 87,244 70,690 92,945 91,090 79,905 86,900 1,050,982
Plastic Waste Quantification and Characterization – Cebu (2009)
Extracted from the report “Converting Waste Plastics to Fuels – Baseline Study Project. Activity II-1: Plastic Waste Analysis and Characterization Study-A. Cebu
City, Philippines”
Sta. Cruz 93,755 71,520 77,644 121,612 98,767 123,000 138,740 107,360 123,750 102,910 93,060 1,152,118
T. Padilla 99,140 88,015 82,700 101,903 110,874 107,400 120,438 92,170 125,010 108,750 119,690 131,110 1,287,200
Talamban 55,716 55,029 78,327 160,389 174,436 185,710 180,185 189,540 171,080 173,380 1,423,792
Tejero 165,977 122,620 119,625 118,915 155,945 136,924 147,871 169,360 174,920 164,775 156,930 169,395 1,803,257
Grand Total 2,622,924
2,328,224
2,559,644
2,488,604
3,104,166
2,993,061
3,642,963
3,932,006
3,826,751
3,728,585
3,681,644
3,537,866
38,446,458
Source: Department of Public Services, Solid Waste Management Division, Cebu City, 2008
Table 3. Volume of Garbage South District, Cebu City
Barangay Jan Feb Mar April May June July Aug Sept Oct Nov Dec Total
Basak Pardo 184,415 198,415 159,574 166,592 203,801 155,940 226,958 204,790 202,080 205,350 209,662 201,335 2,318,912
Buhisan 87,670 68,352 70,599 73,659 90,536 77,738 90,065 100,708 88,428 96,809 75,480 80,760 1,000,804
Bulacao 286,880 240,500 232,459 228,318 296,191 280,973 293,102 331,855 321,326 268,650 75,480 80,760 2,936,494
Calamba 72,310 171,338 165,513 184,547 219,367 198,481 210,804 240,500 259,704 239,990 202,395 208,460 2,373,409
Cogon Pardo
Duljo Fatima 253,190 191,576 193,425 175,306 239,861 224,316 244,277 232,658 211,415 212,080 191,045 191,000 2,560,149
Ermita 281,480 265,873 319,888 285,346 321,304 294,050 310,745 253,180 209,090 149,055 2,690,011
Guadalupe 773,391 692,920 724,142 885,796 801,709 858,077 893,870 855,637 897,800 891,395 865,745 9,140,482
Inayawan 297,869 218,578 229,341 223,704 292,346 285,397 323,216 185,933 356,083 357,222 358,700 354,550 3,482,939
Kalunasan 89,965 74,780 74,840 72,405 89,468 80,339 84,189 89,210 84,325 86,570 81,895 84,410 992,426
Kinasang-an 122,981 120,540 125,628 161,452 139,431 154,824 180,970 177,385 155,635 166,835 170,360 1,676,041
Labanagon 432,250 428,164 188,555 239,492 235,966 281,540 321,112 286,500 300,070 267,495 274,550 3,255,694
Mambaling 458,673 259,664 299,845 273,573 344,131 332,130 597,140 467,870 298,990 3,332,016
Plastic Waste Quantification and Characterization – Cebu (2009)
Extracted from the report “Converting Waste Plastics to Fuels – Baseline Study Project. Activity II-1: Plastic Waste Analysis and Characterization Study-A. Cebu
City, Philippines”
Pasil 164,249 130,210 132,673 130,969 138,168 133,684 137,118 149,120 143,280 1,259,471
Pob. Pardo 281,455 208,156 202,194 189,510 239,728 97,142 1,218,185
Punta Princesa 25,526 16,963 48,733 18,367 20,522 130,111
Quiot 240,135 176,783 197,245 168,659 212,975 198,613 221,609 233,286 249,755 262,760 231,105 241,650 2,634,557
San Nicolas Proper 145,405 130,385 127,570 133,630 186,245 150,065 206,833 204,550 195,996 164,985 173,165 156,460 1,975,28
9 Sapangdaku 64,940 44,167 35,182 40,793 47,455 43,301 49,242 58,540 47,680 49,490 40,750 53,730 575,270
Sawang Calero 161,950 119,790 121,880 182,570 146,505 144,391 155,677 156,785 147,520 149,655 121,380 133,935 1,742,038
Suba 156,275 160,155 163,746 78,399 156,801 202,541 197,690 194,060 186,160 179,985 191,270 1,8677,082
Tisa 328,683 294,600 297,115 325,204 390,493 378,990 333,985 360,817 359,217 367,410 334,115 383,730 4,154,359
Grand Total 3,891,180
3,238,800
4,248,270
4,054,346
4,871,030
4,419,120
5,013,023
4,904,296
4,790,126
4,253,816
3,809,972
3,821,760
51,315,739
Source: Department of Public Services, Solid Waste Management Division – Cebu City
Table 4. DPS and Barangay Collection (Ton/Day)
South District Central District North District Task Force Barangay DPS Brgy Total Barangay DPS Brgy Total Barangay DPS Brgy Total Barangay DPS Brgy Total
1. Basak Pardo 5.234 5.234 1. Pahina Central 5.35
8 5.358 1. Apas 5.98 5.72 11.7 1. Task Force (S2) 3.47 3.47
2. Basak San Nicolas 5.0 5.0 2. Bo. Luz 6.02
6 6.026 2. Banilad 5.41 2.205 7.615
3., Buhisan 2.03 2.03 3. Capitol Site 18.08 18.08 3. Bacayan 4.7 2.03
5 6.735
C. Padilla, T. Padilla, San Roque, Mambaling, Ermita, San Nicolas Prop, Pahina San Nicolas
4. Bulacao 8.771 8.771 4. Carreta 2.825 2.465 5.29 4. Busay 1.35
2 1.352 2. Task Force (R3) 3.51 3.51
5. Calamba 5.25 5.974 11.224
5. Cogon Ramos
2.9 2.9 5. Kasambagan
3.93 2.557
6.487
6. Cogon Pardo 2.489 2.489 6. Day-as 1.405 2.34 3.745 6. Mabolo 5.05 6.306
11.356
Ermita, Lorega, Kamagayan, Carreta, Kamputhaw, Lahug
7. Duljo Fatima 5.205 5.205 7. Ermita 37.74 6.812
44.552
7. Talamban 5.34 4.79 10.13 3. Meto Aide 3.96 3.96
Plastic Waste Quantification and Characterization – Cebu (2009)
Extracted from the report “Converting Waste Plastics to Fuels – Baseline Study Project. Activity II-1: Plastic Waste Analysis and Characterization Study-A. Cebu
City, Philippines”
8. Guadalupe 20.16 20.16 8. Hipodromo 4.0 4.0 8. Pit-os 1.816 1.816
9. Inayawan 7.586 7.586 9. Kalubihan 3.415 1.866 5.281 9.
Pulangbato 0.708 0.708
Mabolo, Carreta
10. Kalunasan 2.486 2.486 10. Kamagayan 3.415 1.949 5.364 10. Lahug 7.98 14 21.98 4. Task Force III 3.76 3.76
11. Kinasang-an 4.781 4.781 11. Kamputhaw 6.62 8.65 15.27
12. Labangon 5.75 7.026 12.776 12. Loreta 1.695 3.33 5.025
San Roque, T. Padilla, Kamagayan, LOrega
13. Mambaling 11.54 11.54 13. Pari-an 1.6 2.224 3.824 5. Task Force II 5.06 5.06
14. Pahina San Nicolas 4.5 4.5 14. Sambag 1 8.40
9 8.409
15. Pasil 4.128 4.128 15. Sambag 2 6.343 6.343
Ramos, Market, Abattoir Sports Complex, NRA, Suares Bros.
16. Pob. Pardo 9.33 9.33 16. San Antonio 1.94 1.94 6. Task Force I 5.08 5.08
17. Punta Princesa 12.71 12.71 17. San Roque 1.36 1.85
8 3.218
18. Quiot 6.213 6.213 18. Sta. Cruz 1.405 3.423 4.828
Tejero, Gen. Maxilom, Fuente, Ramos, Tabo-an, San Roque, M.J. Cuenco
19. Sapangdaku 1.515 1.515 19. Sto. Nino 6.93 3.15 10.08 7. Heat of the City 6.65 6.65
20. Sawang Calero 3.968 3.968 20. T. Padilla 3.568
3.568
21. San Nicolas Prop. 4.538 4.538 21. Tejero 1.6 5.43
9 7.039
Kalubihan, Pahina San Nicolas, Ermita, Sta. Cruz
22. Suba 5.824 5.824 22. Tinago 2.0 8. Sup. Payloader Op.
4.35 4.35
23.Tisa 10.447
10.447 23. Zapatero 1.695
24. Hospital 4.91 4.91 Mabolo, Carreta, Kalubihan, Kamputhaw
25. Task Force Source: DPS Cebu, 2009
Plastic Waste Quantification and Characterization – Cebu (2009)
Extracted from the report “Converting Waste Plastics to Fuels – Baseline Study Project. Activity II-1: Plastic Waste Analysis and Characterization Study-A. Cebu
City, Philippines”
Table 5. Monthly Monitoring Table CY 2008
Source: Solid Waste Monitoring Division, Cebu City
Day Shift/South District Night Shift/North District Volume of Garbage (Tons) No. of Equip. Dispatched No. of Equip. Dispatched Month
Res Mkt Com Hos Ind Total
Comparative (%)
↑ ↓ Target Actual Condmn Target Actual Condmn
January 3770.34
1138.95 152.63 5061.9
2 614 614 350 340 10
February 2921.09 981.99 118.05 4021.1
3 25.88% ↓ 634 633 1 294 294
March 3157.38
1005.21 121.65 4284.2
4 6.14% ↑ 676 675 1 324 324
April 3048.3 926.29 117.39 4091.98
4.69%↓ 642 642 298 298
May 3657.45
1060.35
165.82 4883.62
16.2% ↑ 638 638 339 339
June 3595.38 1034.3 138.49 4768.1
7 2.42% ↓ 658 658 326 326
July 4089.19
923.91 178.54 5191.64
8.16% ↑ 645 645 356 356
August 3669.41
1227.93 224.45 5121.7
9 1.36% ↓ 601 601 368 368
September 3482.04
1219.59 168.97 4870.6 5.16% ↓ 585 585 368 368
October 3364.89
1176.78 155.4 4697.0
7 3.7% ↓ 595 595 366 366
November 3280.71
1109.62 143.17 4533.5 3.6% ↓ 568 568 359 358 1
December 3503.8 1245.74 165.64 4915.1
8 7.8% ↑ 609 609 363 363
TOTAL 56440.84
13050.66 0 1850.2 0 56440.
84 7465 7433 2 4111 4100 11
Plastic Waste Quantification and Characterization – Cebu (2009)
Extracted from the report “Converting Waste Plastics to Fuels – Baseline Study Project. Activity II-1:
Plastic Waste Analysis and Characterization Study-A. Cebu City, Philippines”
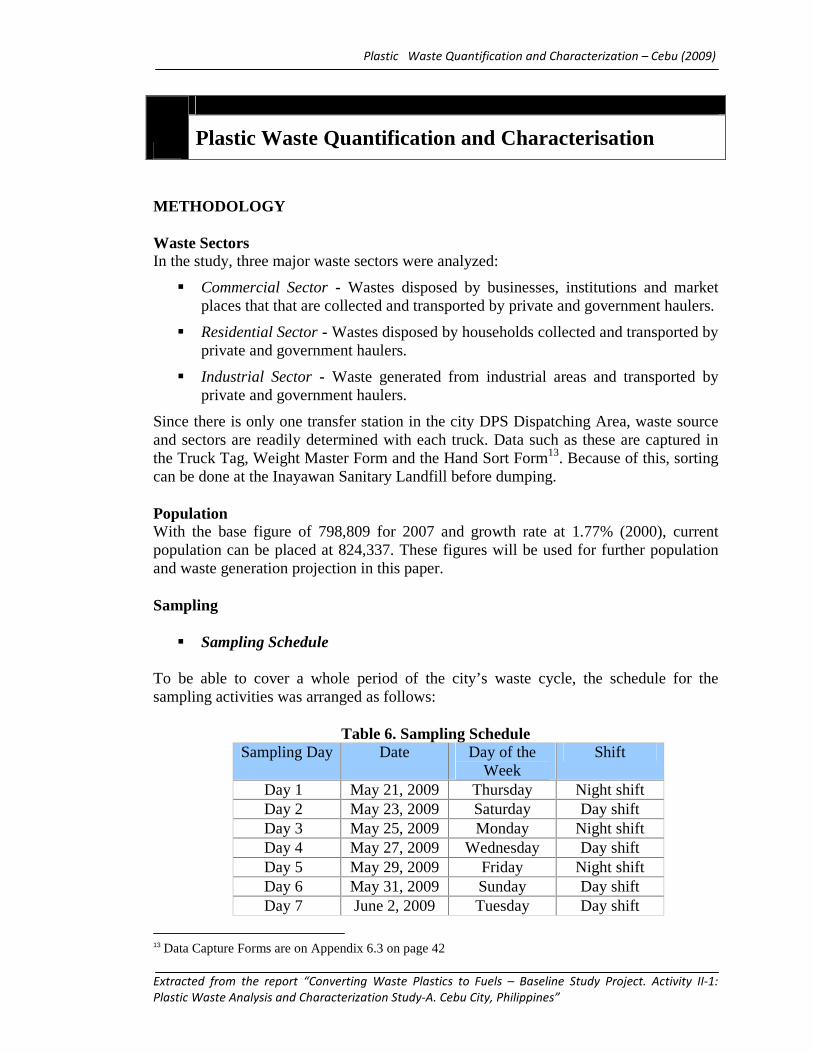
METHODOLOGY Waste Sectors In the study, three major waste sectors were analyzed:
� Commercial Sector - Wastes disposed by businesses, institutions and market places that that are collected and transported by private and government haulers.
� Residential Sector - Wastes disposed by households collected and transported by private and government haulers.
� Industrial Sector - Waste generated from industrial areas and transported by private and government haulers.
Since there is only one transfer station in the city DPS Dispatching Area, waste source and sectors are readily determined with each truck. Data such as these are captured in the Truck Tag, Weight Master Form and the Hand Sort Form13. Because of this, sorting can be done at the Inayawan Sanitary Landfill before dumping. Population With the base figure of 798,809 for 2007 and growth rate at 1.77% (2000), current population can be placed at 824,337. These figures will be used for further population and waste generation projection in this paper. Sampling
� Sampling Schedule
To be able to cover a whole period of the city’s waste cycle, the schedule for the sampling activities was arranged as follows:
Table 6. Sampling Schedule Sampling Day Date Day of the
Week Shift
Day 1 May 21, 2009 Thursday Night shift Day 2 May 23, 2009 Saturday Day shift Day 3 May 25, 2009 Monday Night shift Day 4 May 27, 2009 Wednesday Day shift Day 5 May 29, 2009 Friday Night shift Day 6 May 31, 2009 Sunday Day shift Day 7 June 2, 2009 Tuesday Day shift
13 Data Capture Forms are on Appendix 6.3 on page 42
Plastic Waste Quantification and Characterisation
Plastic Waste Quantification and Characterization – Cebu (2009)
Extracted from the report “Converting Waste Plastics to Fuels – Baseline Study Project. Activity II-1:
Plastic Waste Analysis and Characterization Study-A. Cebu City, Philippines”
Each of the seven days represents a day of the week to complete a week-long cycle. Alternating shifts for sorting activities were schedule within the sampling period. The intervening days were intended to allow drying of washed materials for the moisture content analysis. During those times, the sorting area is free of other wastes to ensure the integrity of the samples.
� Collection of Samples
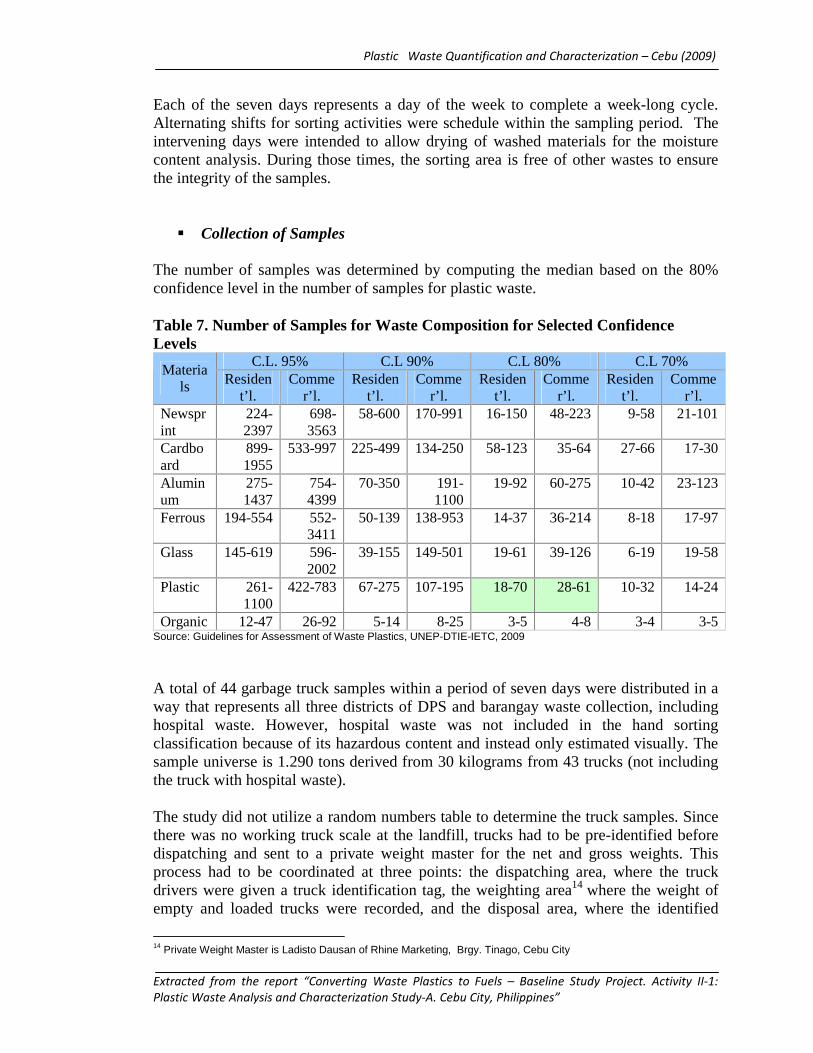
The number of samples was determined by computing the median based on the 80% confidence level in the number of samples for plastic waste. Table 7. Number of Samples for Waste Composition for Selected Confidence Levels
C.L. 95% C.L 90% C.L 80% C.L 70% Materia
ls Resident’l.
Commer’l.
Resident’l.
Commer’l.
Resident’l.
Commer’l.
Resident’l.
Commer’l.
Newsprint
224-2397
698-3563
58-600 170-991 16-150 48-223 9-58 21-101
Cardboard
899-1955
533-997 225-499 134-250 58-123 35-64 27-66 17-30
Aluminum
275-1437
754-4399
70-350 191-1100
19-92 60-275 10-42 23-123
Ferrous 194-554 552-3411
50-139 138-953 14-37 36-214 8-18 17-97
Glass 145-619 596-2002
39-155 149-501 19-61 39-126 6-19 19-58
Plastic 261-1100
422-783 67-275 107-195 18-70 28-61 10-32 14-24
Organic 12-47 26-92 5-14 8-25 3-5 4-8 3-4 3-5 Source: Guidelines for Assessment of Waste Plastics, UNEP-DTIE-IETC, 2009
A total of 44 garbage truck samples within a period of seven days were distributed in a way that represents all three districts of DPS and barangay waste collection, including hospital waste. However, hospital waste was not included in the hand sorting classification because of its hazardous content and instead only estimated visually. The sample universe is 1.290 tons derived from 30 kilograms from 43 trucks (not including the truck with hospital waste). The study did not utilize a random numbers table to determine the truck samples. Since there was no working truck scale at the landfill, trucks had to be pre-identified before dispatching and sent to a private weight master for the net and gross weights. This process had to be coordinated at three points: the dispatching area, where the truck drivers were given a truck identification tag, the weighting area14 where the weight of empty and loaded trucks were recorded, and the disposal area, where the identified
14 Private Weight Master is Ladisto Dausan of Rhine Marketing, Brgy. Tinago, Cebu City
Plastic Waste Quantification and Characterization – Cebu (2009)
Extracted from the report “Converting Waste Plastics to Fuels – Baseline Study Project. Activity II-1:
Plastic Waste Analysis and Characterization Study-A. Cebu City, Philippines”
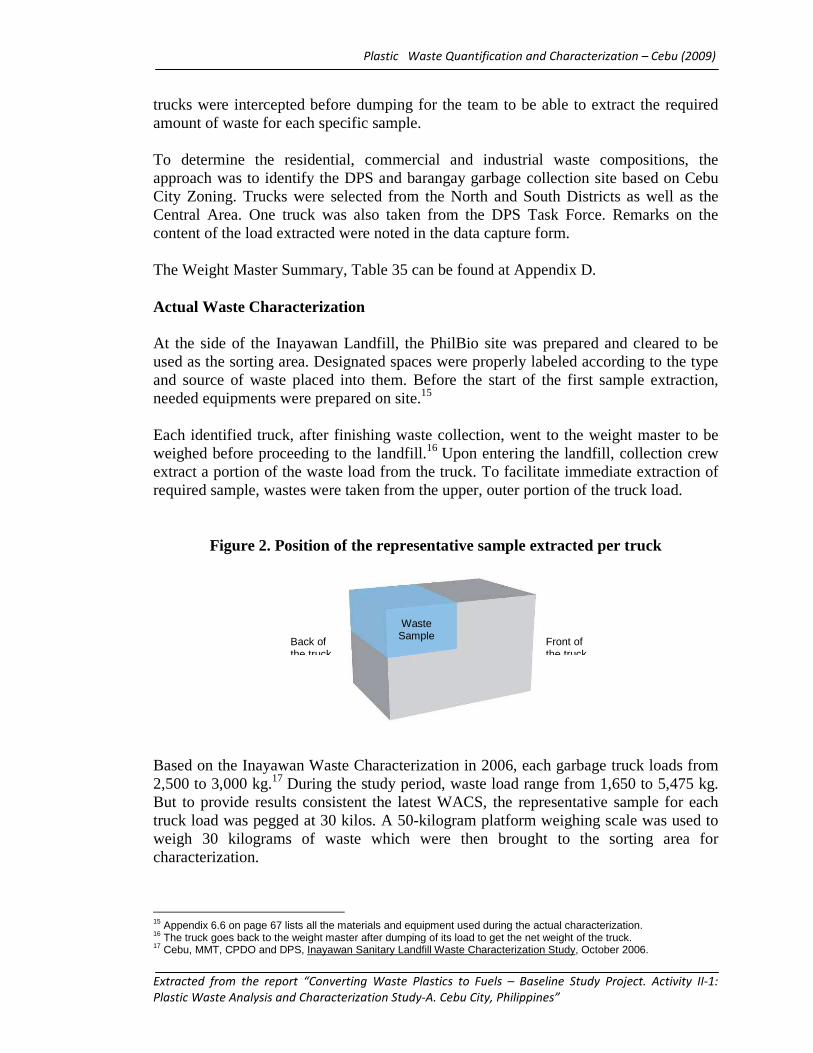
trucks were intercepted before dumping for the team to be able to extract the required amount of waste for each specific sample. To determine the residential, commercial and industrial waste compositions, the approach was to identify the DPS and barangay garbage collection site based on Cebu City Zoning. Trucks were selected from the North and South Districts as well as the Central Area. One truck was also taken from the DPS Task Force. Remarks on the content of the load extracted were noted in the data capture form. The Weight Master Summary, Table 35 can be found at Appendix D. Actual Waste Characterization At the side of the Inayawan Landfill, the PhilBio site was prepared and cleared to be used as the sorting area. Designated spaces were properly labeled according to the type and source of waste placed into them. Before the start of the first sample extraction, needed equipments were prepared on site.15 Each identified truck, after finishing waste collection, went to the weight master to be weighed before proceeding to the landfill.16 Upon entering the landfill, collection crew extract a portion of the waste load from the truck. To facilitate immediate extraction of required sample, wastes were taken from the upper, outer portion of the truck load.
Figure 2. Position of the representative sample extracted per truck Based on the Inayawan Waste Characterization in 2006, each garbage truck loads from 2,500 to 3,000 kg.17 During the study period, waste load range from 1,650 to 5,475 kg. But to provide results consistent the latest WACS, the representative sample for each truck load was pegged at 30 kilos. A 50-kilogram platform weighing scale was used to weigh 30 kilograms of waste which were then brought to the sorting area for characterization.
15 Appendix 6.6 on page 67 lists all the materials and equipment used during the actual characterization. 16 The truck goes back to the weight master after dumping of its load to get the net weight of the truck. 17 Cebu, MMT, CPDO and DPS, Inayawan Sanitary Landfill Waste Characterization Study, October 2006.
AFront of the truck
Back of the truck
Waste Sample
Plastic Waste Quantification and Characterization – Cebu (2009)
Extracted from the report “Converting Waste Plastics to Fuels – Baseline Study Project. Activity II-1:
Plastic Waste Analysis and Characterization Study-A. Cebu City, Philippines”
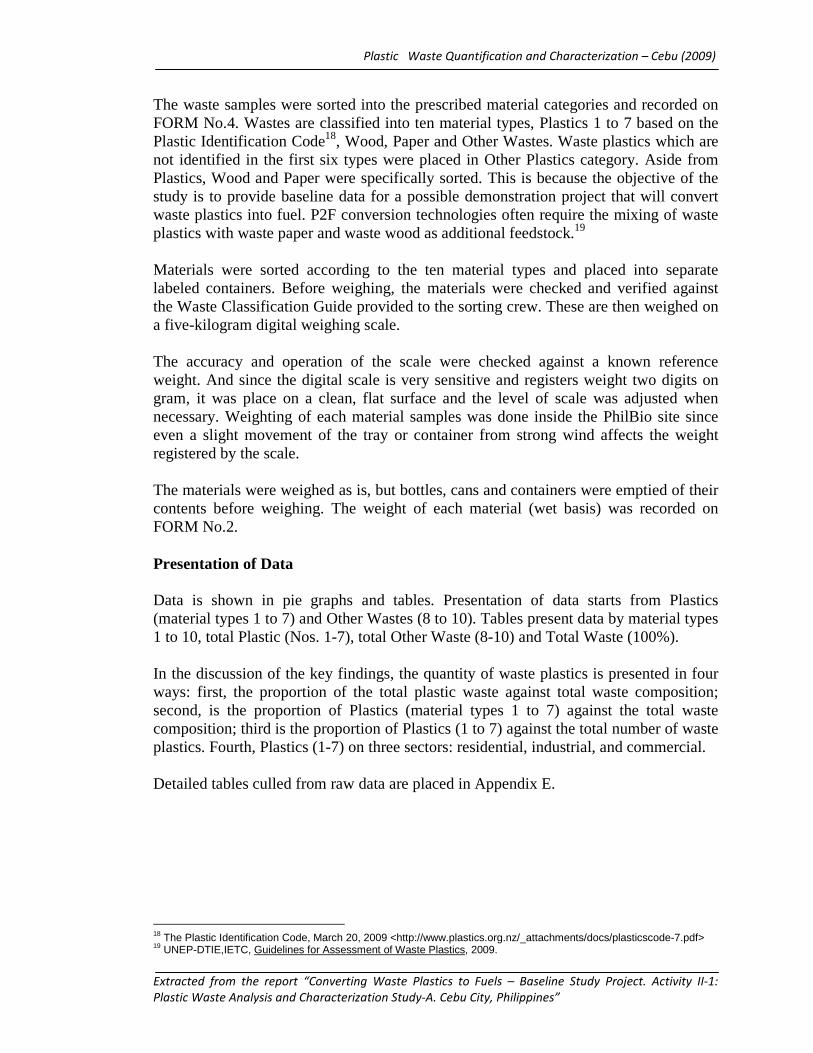
The waste samples were sorted into the prescribed material categories and recorded on FORM No.4. Wastes are classified into ten material types, Plastics 1 to 7 based on the Plastic Identification Code18, Wood, Paper and Other Wastes. Waste plastics which are not identified in the first six types were placed in Other Plastics category. Aside from Plastics, Wood and Paper were specifically sorted. This is because the objective of the study is to provide baseline data for a possible demonstration project that will convert waste plastics into fuel. P2F conversion technologies often require the mixing of waste plastics with waste paper and waste wood as additional feedstock.19 Materials were sorted according to the ten material types and placed into separate labeled containers. Before weighing, the materials were checked and verified against the Waste Classification Guide provided to the sorting crew. These are then weighed on a five-kilogram digital weighing scale. The accuracy and operation of the scale were checked against a known reference weight. And since the digital scale is very sensitive and registers weight two digits on gram, it was place on a clean, flat surface and the level of scale was adjusted when necessary. Weighting of each material samples was done inside the PhilBio site since even a slight movement of the tray or container from strong wind affects the weight registered by the scale. The materials were weighed as is, but bottles, cans and containers were emptied of their contents before weighing. The weight of each material (wet basis) was recorded on FORM No.2. Presentation of Data Data is shown in pie graphs and tables. Presentation of data starts from Plastics (material types 1 to 7) and Other Wastes (8 to 10). Tables present data by material types 1 to 10, total Plastic (Nos. 1-7), total Other Waste (8-10) and Total Waste (100%). In the discussion of the key findings, the quantity of waste plastics is presented in four ways: first, the proportion of the total plastic waste against total waste composition; second, is the proportion of Plastics (material types 1 to 7) against the total waste composition; third is the proportion of Plastics (1 to 7) against the total number of waste plastics. Fourth, Plastics (1-7) on three sectors: residential, industrial, and commercial. Detailed tables culled from raw data are placed in Appendix E.
18 The Plastic Identification Code, March 20, 2009 <http://www.plastics.org.nz/_attachments/docs/plasticscode-7.pdf> 19 UNEP-DTIE,IETC, Guidelines for Assessment of Waste Plastics, 2009.
Plastic Waste Quantification and Characterization – Cebu (2009)
Extracted from the report “Converting Waste Plastics to Fuels – Baseline Study Project. Activity II-1:
Plastic Waste Analysis and Characterization Study-A. Cebu City, Philippines”
FINDINGS
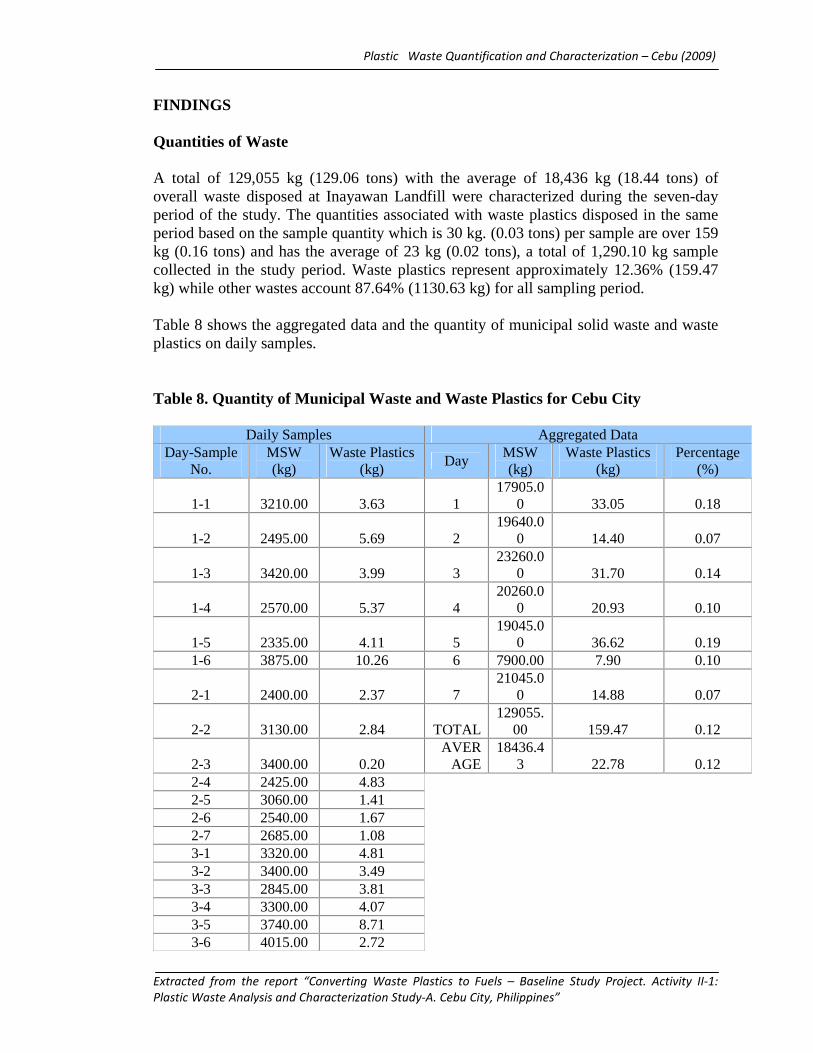
Quantities of Waste A total of 129,055 kg (129.06 tons) with the average of 18,436 kg (18.44 tons) of overall waste disposed at Inayawan Landfill were characterized during the seven-day period of the study. The quantities associated with waste plastics disposed in the same period based on the sample quantity which is 30 kg. (0.03 tons) per sample are over 159 kg (0.16 tons) and has the average of 23 kg (0.02 tons), a total of 1,290.10 kg sample collected in the study period. Waste plastics represent approximately 12.36% (159.47 kg) while other wastes account 87.64% (1130.63 kg) for all sampling period. Table 8 shows the aggregated data and the quantity of municipal solid waste and waste plastics on daily samples. Table 8. Quantity of Municipal Waste and Waste Plastics for Cebu City
Daily Samples Aggregated Data Day-Sample
No. MSW (kg)
Waste Plastics (kg)
Day MSW (kg)
Waste Plastics (kg)
Percentage (%)
1-1 3210.00 3.63 1 17905.0
0 33.05 0.18
1-2 2495.00 5.69 2 19640.0
0 14.40 0.07
1-3 3420.00 3.99 3 23260.0
0 31.70 0.14
1-4 2570.00 5.37 4 20260.0
0 20.93 0.10
1-5 2335.00 4.11 5 19045.0
0 36.62 0.19 1-6 3875.00 10.26 6 7900.00 7.90 0.10
2-1 2400.00 2.37 7 21045.0
0 14.88 0.07
2-2 3130.00 2.84 TOTAL 129055.
00 159.47 0.12
2-3 3400.00 0.20 AVER
AGE 18436.4
3 22.78 0.12 2-4 2425.00 4.83 2-5 3060.00 1.41 2-6 2540.00 1.67 2-7 2685.00 1.08 3-1 3320.00 4.81 3-2 3400.00 3.49 3-3 2845.00 3.81 3-4 3300.00 4.07 3-5 3740.00 8.71 3-6 4015.00 2.72
Plastic Waste Quantification and Characterization – Cebu (2009)
Extracted from the report “Converting Waste Plastics to Fuels – Baseline Study Project. Activity II-1:
Plastic Waste Analysis and Characterization Study-A. Cebu City, Philippines”
3-7 2640.00 4.10 4-1 4320.00 3.29 4-2 2840.00 3.73 4-3 3450.00 3.00 4-4 3750.00 3.73 4-5 2285.00 4.00 4-6 3615.00 3.18 5-1 1650.00 2.04 5-2 2010.00 2.62 5-3 3100.00 5.14 5-4 2165.00 3.69 5-5 3395.00 11.26 5-6 2765.00 4.15 5-7 3960.00 7.71 6-1 3700.00 4.50 6-2 2150.00 0.61 6-3 2050.00 2.79 7-1 5475.00 3.98 7-2 2150.00 0.90 7-3 2225.00 1.11 7-4 4045.00 2.64 7-5 2310.00 3.46 7-6 1985.00 1.54 7-7 2855.00 1.26
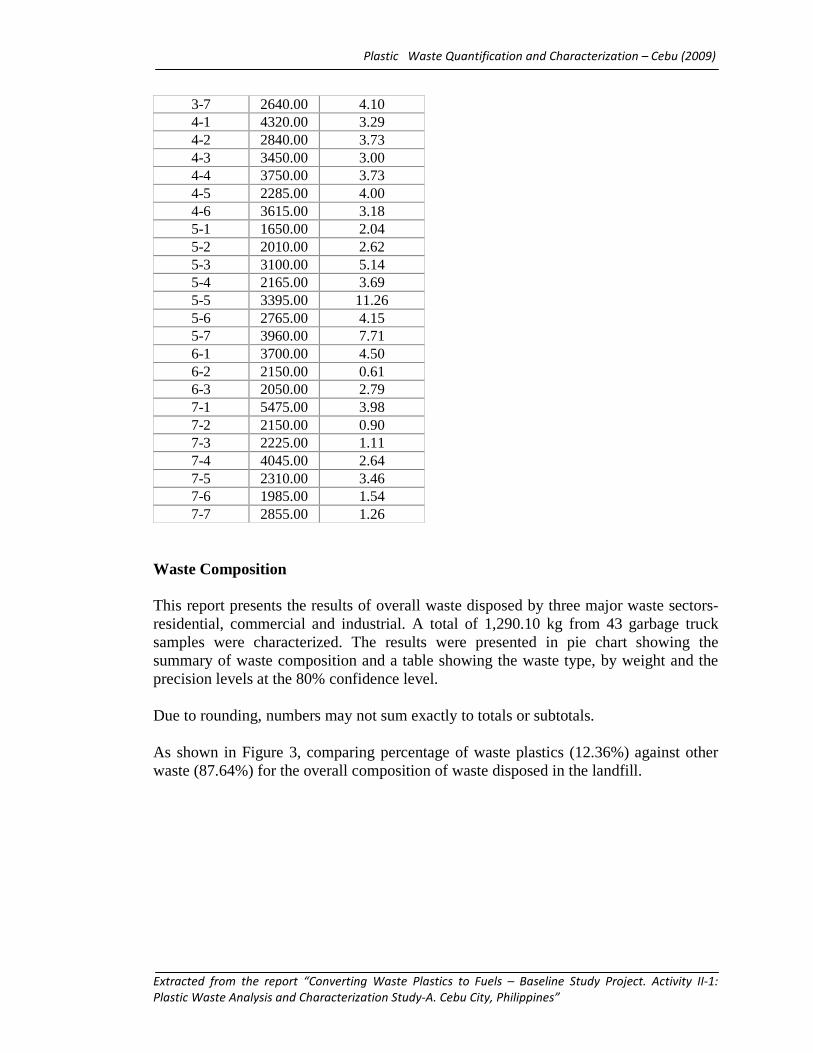
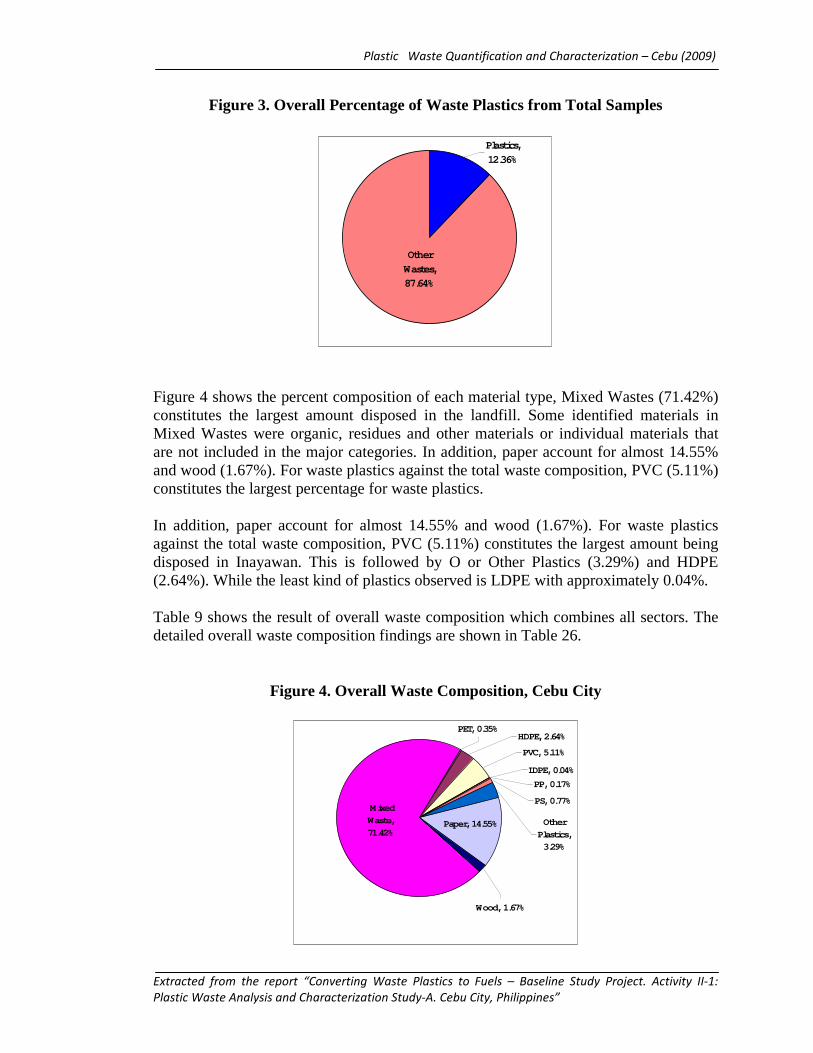
Waste Composition This report presents the results of overall waste disposed by three major waste sectors- residential, commercial and industrial. A total of 1,290.10 kg from 43 garbage truck samples were characterized. The results were presented in pie chart showing the summary of waste composition and a table showing the waste type, by weight and the precision levels at the 80% confidence level. Due to rounding, numbers may not sum exactly to totals or subtotals. As shown in Figure 3, comparing percentage of waste plastics (12.36%) against other waste (87.64%) for the overall composition of waste disposed in the landfill.
Plastic Waste Quantification and Characterization – Cebu (2009)
Extracted from the report “Converting Waste Plastics to Fuels – Baseline Study Project. Activity II-1:
Plastic Waste Analysis and Characterization Study-A. Cebu City, Philippines”
Figure 3. Overall Percentage of Waste Plastics from Total Samples
Other Wastes, 87.64%
Plastics, 12.36%
Figure 4 shows the percent composition of each material type, Mixed Wastes (71.42%) constitutes the largest amount disposed in the landfill. Some identified materials in Mixed Wastes were organic, residues and other materials or individual materials that are not included in the major categories. In addition, paper account for almost 14.55% and wood (1.67%). For waste plastics against the total waste composition, PVC (5.11%) constitutes the largest percentage for waste plastics. In addition, paper account for almost 14.55% and wood (1.67%). For waste plastics against the total waste composition, PVC (5.11%) constitutes the largest amount being disposed in Inayawan. This is followed by O or Other Plastics (3.29%) and HDPE (2.64%). While the least kind of plastics observed is LDPE with approximately 0.04%. Table 9 shows the result of overall waste composition which combines all sectors. The detailed overall waste composition findings are shown in Table 26.
Figure 4. Overall Waste Composition, Cebu City
PET, 0.35%HDPE, 2.64%
PVC, 5.11%
PP, 0.17%
LDPE, 0.04%
PS, 0.77%
Other
Plastics, 3.29%
Paper, 14.55%
Wood, 1.67%
Mixed
Waste,
71.42%
Plastic Waste Quantification and Characterization – Cebu (2009)
Extracted from the report “Converting Waste Plastics to Fuels – Baseline Study Project. Activity II-1:
Plastic Waste Analysis and Characterization Study-A. Cebu City, Philippines”
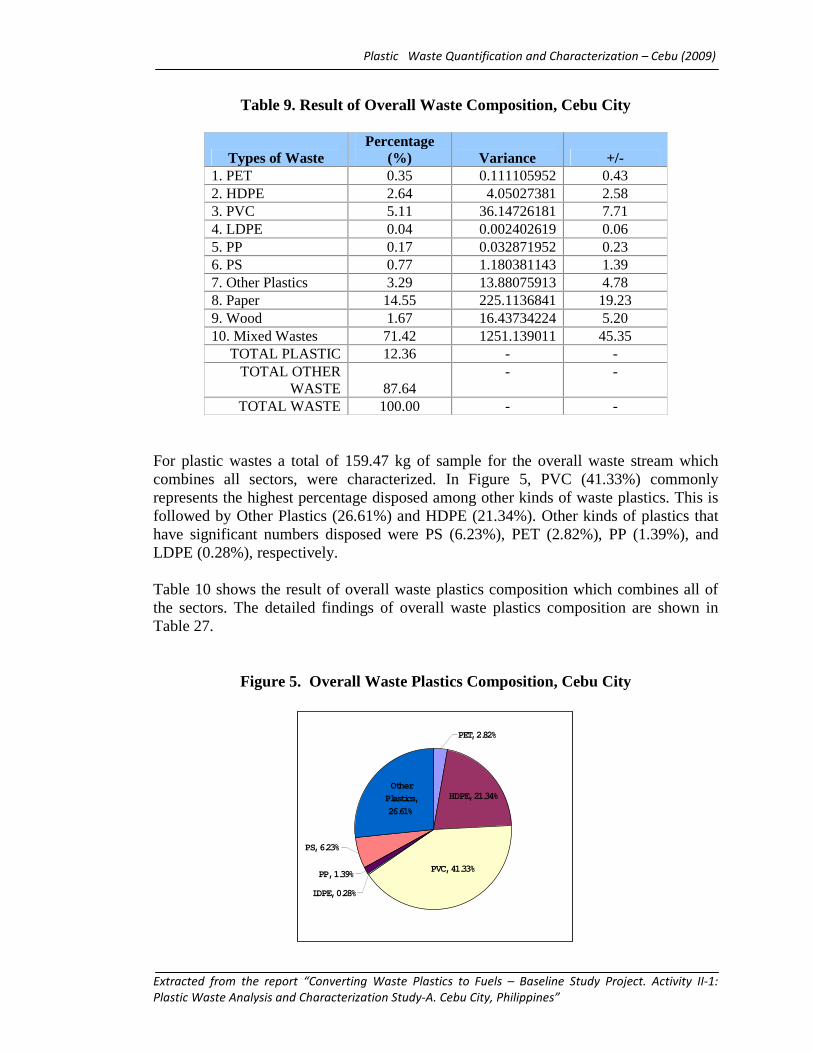
Table 9. Result of Overall Waste Composition, Cebu City
Types of Waste Percentage
(%) Variance +/- 1. PET 0.35 0.111105952 0.43 2. HDPE 2.64 4.05027381 2.58 3. PVC 5.11 36.14726181 7.71 4. LDPE 0.04 0.002402619 0.06 5. PP 0.17 0.032871952 0.23 6. PS 0.77 1.180381143 1.39 7. Other Plastics 3.29 13.88075913 4.78 8. Paper 14.55 225.1136841 19.23 9. Wood 1.67 16.43734224 5.20 10. Mixed Wastes 71.42 1251.139011 45.35
TOTAL PLASTIC 12.36 - - TOTAL OTHER
WASTE 87.64 - -
TOTAL WASTE 100.00 - - For plastic wastes a total of 159.47 kg of sample for the overall waste stream which combines all sectors, were characterized. In Figure 5, PVC (41.33%) commonly represents the highest percentage disposed among other kinds of waste plastics. This is followed by Other Plastics (26.61%) and HDPE (21.34%). Other kinds of plastics that have significant numbers disposed were PS (6.23%), PET (2.82%), PP (1.39%), and LDPE (0.28%), respectively. Table 10 shows the result of overall waste plastics composition which combines all of the sectors. The detailed findings of overall waste plastics composition are shown in Table 27.
Figure 5. Overall Waste Plastics Composition, Cebu City
PP, 1.39%
LDPE, 0.28%
PS, 6.23%
PET, 2.82%
Other Plastics,
26.61%
HDPE, 21.34%
PVC, 41.33%
Plastic Waste Quantification and Characterization – Cebu (2009)
Extracted from the report “Converting Waste Plastics to Fuels – Baseline Study Project. Activity II-1:
Plastic Waste Analysis and Characterization Study-A. Cebu City, Philippines”
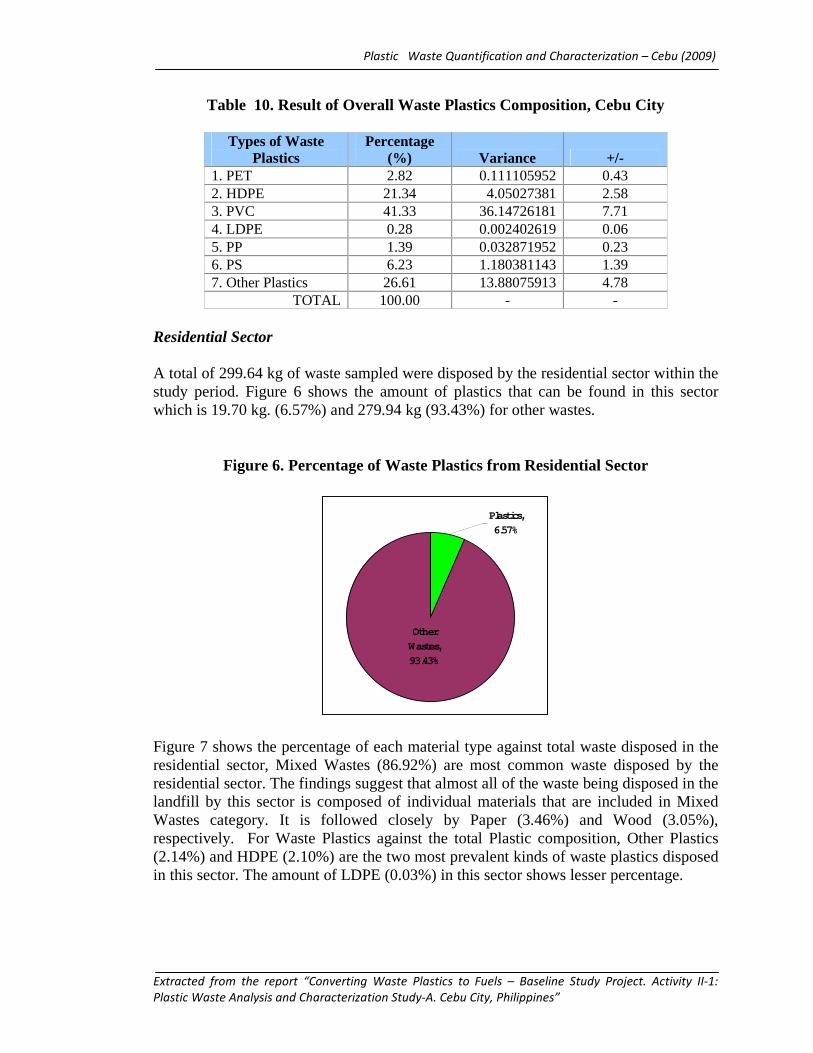
Table 10. Result of Overall Waste Plastics Composition, Cebu City
Types of Waste Plastics
Percentage (%) Variance +/-
1. PET 2.82 0.111105952 0.43 2. HDPE 21.34 4.05027381 2.58 3. PVC 41.33 36.14726181 7.71 4. LDPE 0.28 0.002402619 0.06 5. PP 1.39 0.032871952 0.23 6. PS 6.23 1.180381143 1.39 7. Other Plastics 26.61 13.88075913 4.78
TOTAL 100.00 - -
Residential Sector A total of 299.64 kg of waste sampled were disposed by the residential sector within the study period. Figure 6 shows the amount of plastics that can be found in this sector which is 19.70 kg. (6.57%) and 279.94 kg (93.43%) for other wastes.
Figure 6. Percentage of Waste Plastics from Residential Sector
Plastics, 6.57%
Other Wastes, 93.43%
Figure 7 shows the percentage of each material type against total waste disposed in the residential sector, Mixed Wastes (86.92%) are most common waste disposed by the residential sector. The findings suggest that almost all of the waste being disposed in the landfill by this sector is composed of individual materials that are included in Mixed Wastes category. It is followed closely by Paper (3.46%) and Wood (3.05%), respectively. For Waste Plastics against the total Plastic composition, Other Plastics (2.14%) and HDPE (2.10%) are the two most prevalent kinds of waste plastics disposed in this sector. The amount of LDPE (0.03%) in this sector shows lesser percentage.
Plastic Waste Quantification and Characterization – Cebu (2009)
Extracted from the report “Converting Waste Plastics to Fuels – Baseline Study Project. Activity II-1:
Plastic Waste Analysis and Characterization Study-A. Cebu City, Philippines”
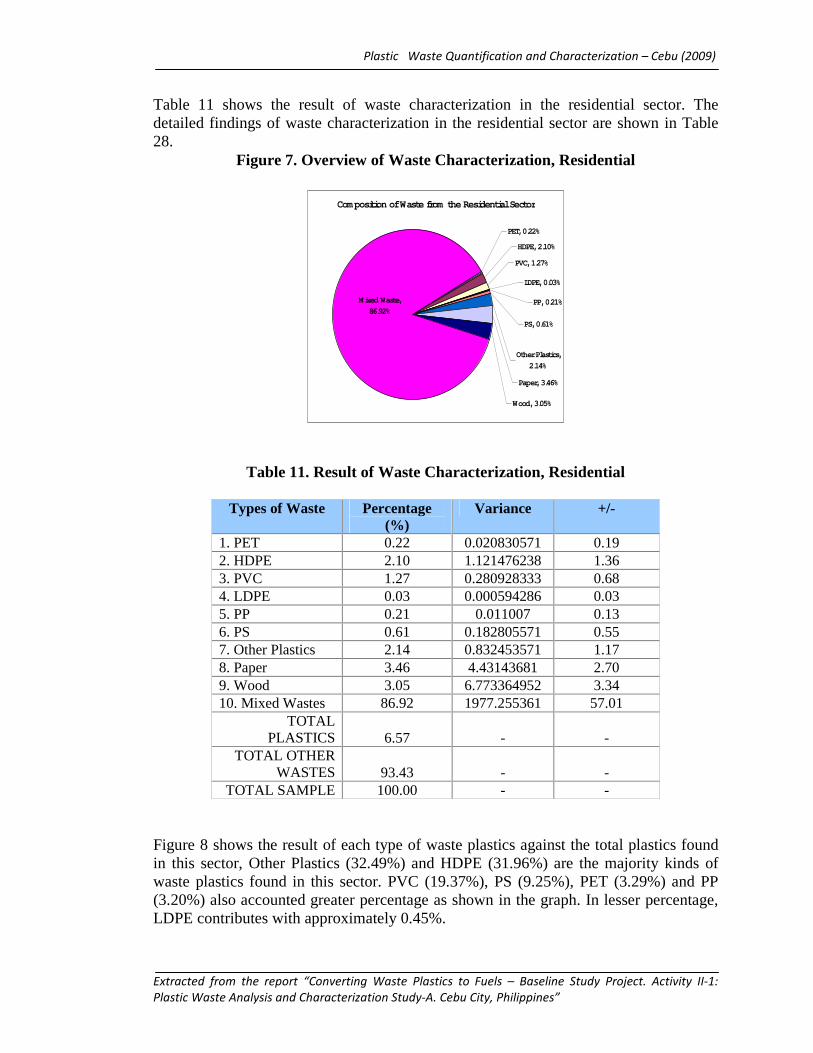
Table 11 shows the result of waste characterization in the residential sector. The detailed findings of waste characterization in the residential sector are shown in Table 28.
Figure 7. Overview of Waste Characterization, Residential
Composition of Waste from the Residential Sector
Mixed Waste,
86.92%
Wood, 3.05%
Paper, 3.46%
Other Plastics,
2.14%
PS, 0.61%
PP, 0.21%
LDPE, 0.03%
PET, 0.22%
HDPE, 2.10%
PVC, 1.27%
Table 11. Result of Waste Characterization, Residential
Types of Waste Percentage (%)
Variance +/-
1. PET 0.22 0.020830571 0.19 2. HDPE 2.10 1.121476238 1.36 3. PVC 1.27 0.280928333 0.68 4. LDPE 0.03 0.000594286 0.03 5. PP 0.21 0.011007 0.13 6. PS 0.61 0.182805571 0.55 7. Other Plastics 2.14 0.832453571 1.17 8. Paper 3.46 4.43143681 2.70 9. Wood 3.05 6.773364952 3.34 10. Mixed Wastes 86.92 1977.255361 57.01
TOTAL PLASTICS 6.57 - -
TOTAL OTHER WASTES 93.43 - -
TOTAL SAMPLE 100.00 - - Figure 8 shows the result of each type of waste plastics against the total plastics found in this sector, Other Plastics (32.49%) and HDPE (31.96%) are the majority kinds of waste plastics found in this sector. PVC (19.37%), PS (9.25%), PET (3.29%) and PP (3.20%) also accounted greater percentage as shown in the graph. In lesser percentage, LDPE contributes with approximately 0.45%.
Plastic Waste Quantification and Characterization – Cebu (2009)
Extracted from the report “Converting Waste Plastics to Fuels – Baseline Study Project. Activity II-1:
Plastic Waste Analysis and Characterization Study-A. Cebu City, Philippines”
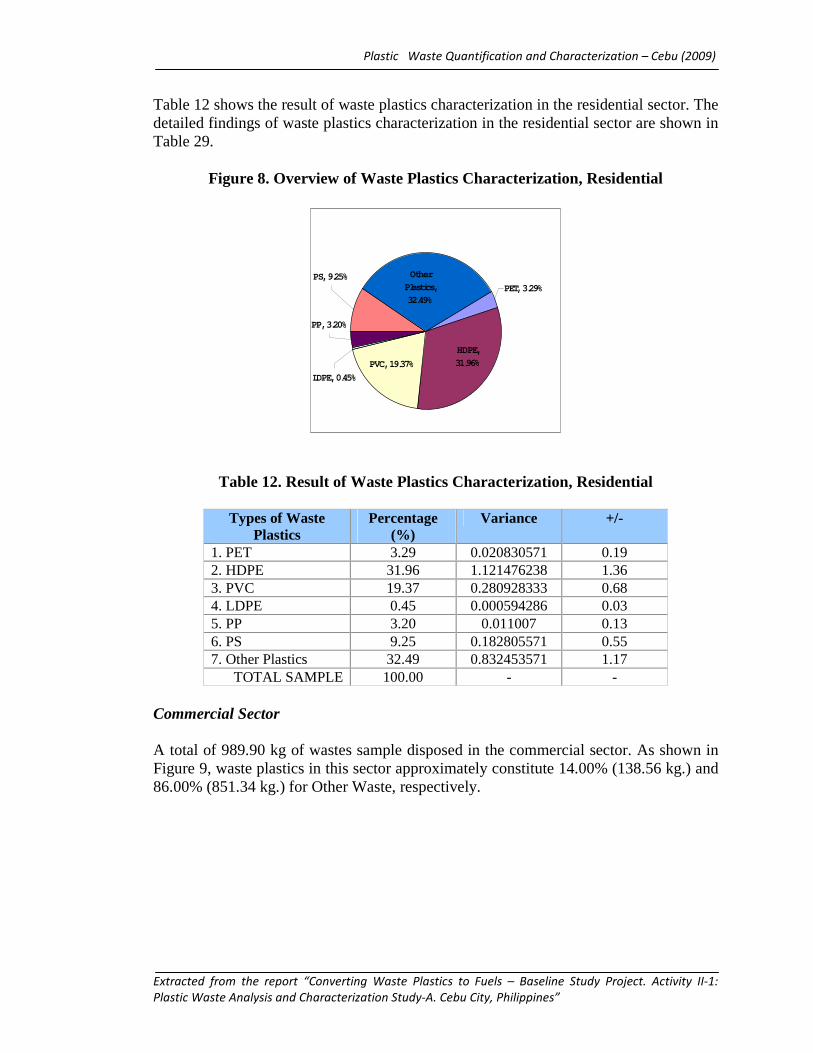
Table 12 shows the result of waste plastics characterization in the residential sector. The detailed findings of waste plastics characterization in the residential sector are shown in Table 29.
Figure 8. Overview of Waste Plastics Characterization, Residential
PS, 9.25%
PP, 3.20%
LDPE, 0.45%
PVC, 19.37%
HDPE, 31.96%
PET, 3.29%
Other Plastics, 32.49%
Table 12. Result of Waste Plastics Characterization, Residential
Types of Waste Plastics
Percentage (%)
Variance +/-
1. PET 3.29 0.020830571 0.19 2. HDPE 31.96 1.121476238 1.36 3. PVC 19.37 0.280928333 0.68 4. LDPE 0.45 0.000594286 0.03 5. PP 3.20 0.011007 0.13 6. PS 9.25 0.182805571 0.55 7. Other Plastics 32.49 0.832453571 1.17
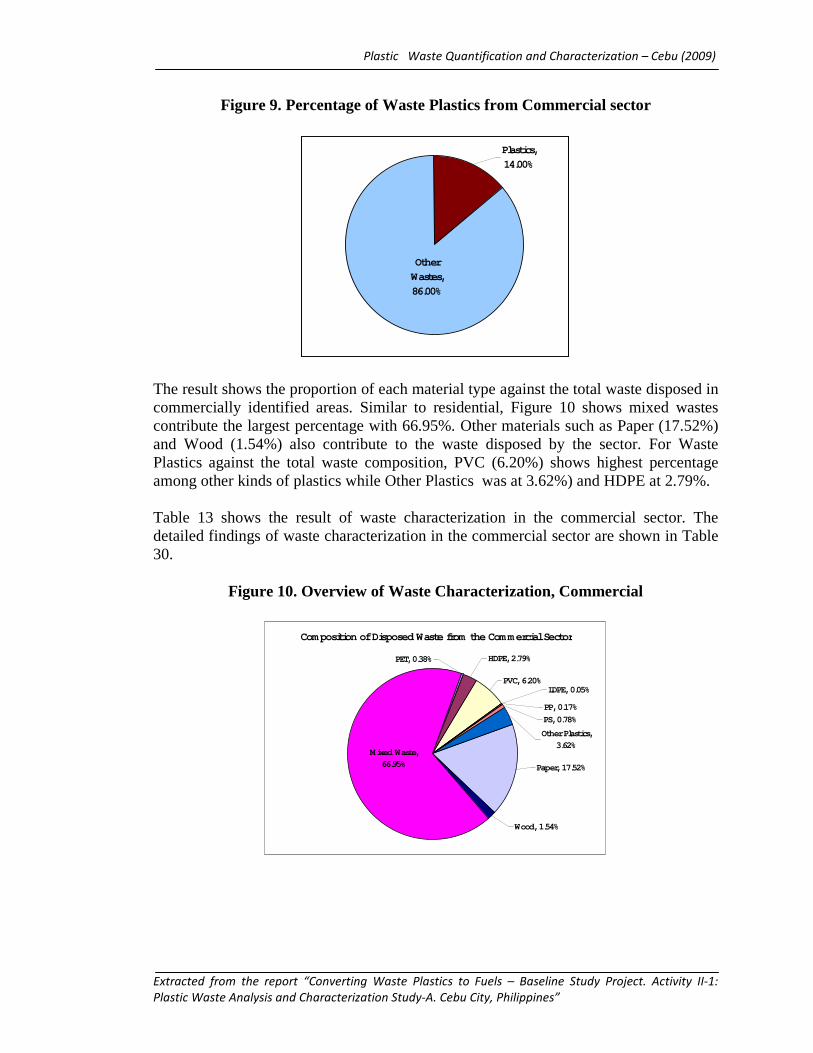
TOTAL SAMPLE 100.00 - - Commercial Sector A total of 989.90 kg of wastes sample disposed in the commercial sector. As shown in Figure 9, waste plastics in this sector approximately constitute 14.00% (138.56 kg.) and 86.00% (851.34 kg.) for Other Waste, respectively.
Plastic Waste Quantification and Characterization – Cebu (2009)
Extracted from the report “Converting Waste Plastics to Fuels – Baseline Study Project. Activity II-1:
Plastic Waste Analysis and Characterization Study-A. Cebu City, Philippines”
Figure 9. Percentage of Waste Plastics from Commercial sector
Plastics, 14.00%
Other Wastes, 86.00%
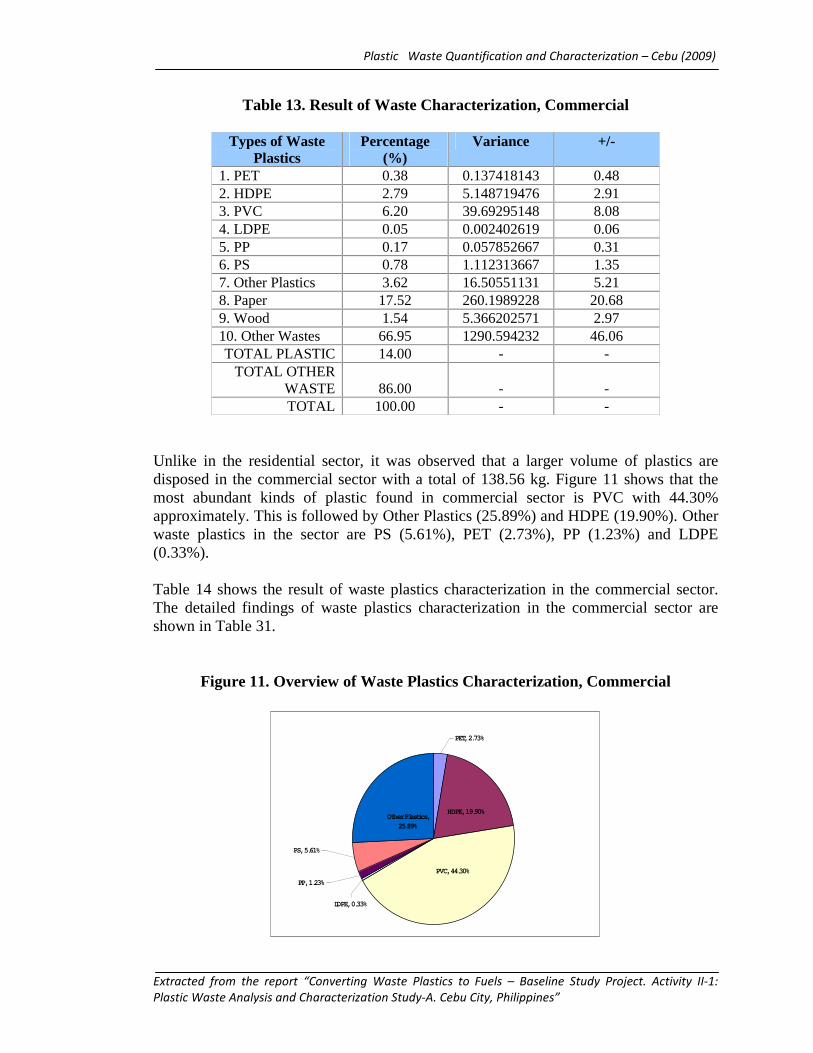
The result shows the proportion of each material type against the total waste disposed in commercially identified areas. Similar to residential, Figure 10 shows mixed wastes contribute the largest percentage with 66.95%. Other materials such as Paper (17.52%) and Wood (1.54%) also contribute to the waste disposed by the sector. For Waste Plastics against the total waste composition, PVC (6.20%) shows highest percentage among other kinds of plastics while Other Plastics was at 3.62%) and HDPE at 2.79%. Table 13 shows the result of waste characterization in the commercial sector. The detailed findings of waste characterization in the commercial sector are shown in Table 30.
Figure 10. Overview of Waste Characterization, Commercial
Composition of Disposed Waste from the Commercial Sector
Mixed Waste, 66.95%
Wood, 1.54%
Paper, 17.52%
Other Plastics, 3.62%
PS, 0.78%
PP, 0.17%
LDPE, 0.05%PVC, 6.20%
HDPE, 2.79%PET, 0.38%
Plastic Waste Quantification and Characterization – Cebu (2009)
Extracted from the report “Converting Waste Plastics to Fuels – Baseline Study Project. Activity II-1:
Plastic Waste Analysis and Characterization Study-A. Cebu City, Philippines”
Table 13. Result of Waste Characterization, Commercial
Types of Waste Plastics
Percentage (%)
Variance +/-
1. PET 0.38 0.137418143 0.48 2. HDPE 2.79 5.148719476 2.91 3. PVC 6.20 39.69295148 8.08 4. LDPE 0.05 0.002402619 0.06 5. PP 0.17 0.057852667 0.31 6. PS 0.78 1.112313667 1.35 7. Other Plastics 3.62 16.50551131 5.21 8. Paper 17.52 260.1989228 20.68 9. Wood 1.54 5.366202571 2.97 10. Other Wastes 66.95 1290.594232 46.06 TOTAL PLASTIC 14.00 - -
TOTAL OTHER WASTE 86.00 - - TOTAL 100.00 - -
Unlike in the residential sector, it was observed that a larger volume of plastics are disposed in the commercial sector with a total of 138.56 kg. Figure 11 shows that the most abundant kinds of plastic found in commercial sector is PVC with 44.30% approximately. This is followed by Other Plastics (25.89%) and HDPE (19.90%). Other waste plastics in the sector are PS (5.61%), PET (2.73%), PP (1.23%) and LDPE (0.33%). Table 14 shows the result of waste plastics characterization in the commercial sector. The detailed findings of waste plastics characterization in the commercial sector are shown in Table 31.
Figure 11. Overview of Waste Plastics Characterization, Commercial
HDPE, 19.90%
PVC, 44.30%
Other Plastics, 25.89%
PET, 2.73%
PS, 5.61%
PP, 1.23%
LDPE, 0.33%
Plastic Waste Quantification and Characterization – Cebu (2009)
Extracted from the report “Converting Waste Plastics to Fuels – Baseline Study Project. Activity II-1:
Plastic Waste Analysis and Characterization Study-A. Cebu City, Philippines”
Table 14. Result of Waste Plastics Characterization, Commercial
Types of Waste Plastics
Percentage (%)
Variance +/-
1. PET 2.73 0.137418143 0.48 2. HDPE 19.90 5.148719476 2.91 3. PVC 44.30 39.69295148 8.08 4. LDPE 0.33 0.002402619 0.06 5. PP 1.23 0.057852667 0.31 6. PS 5.61 1.112313667 1.35 7. Other Plastics 25.89 16.50551131 5.21 TOTAL SAMPLE 100.00 - -
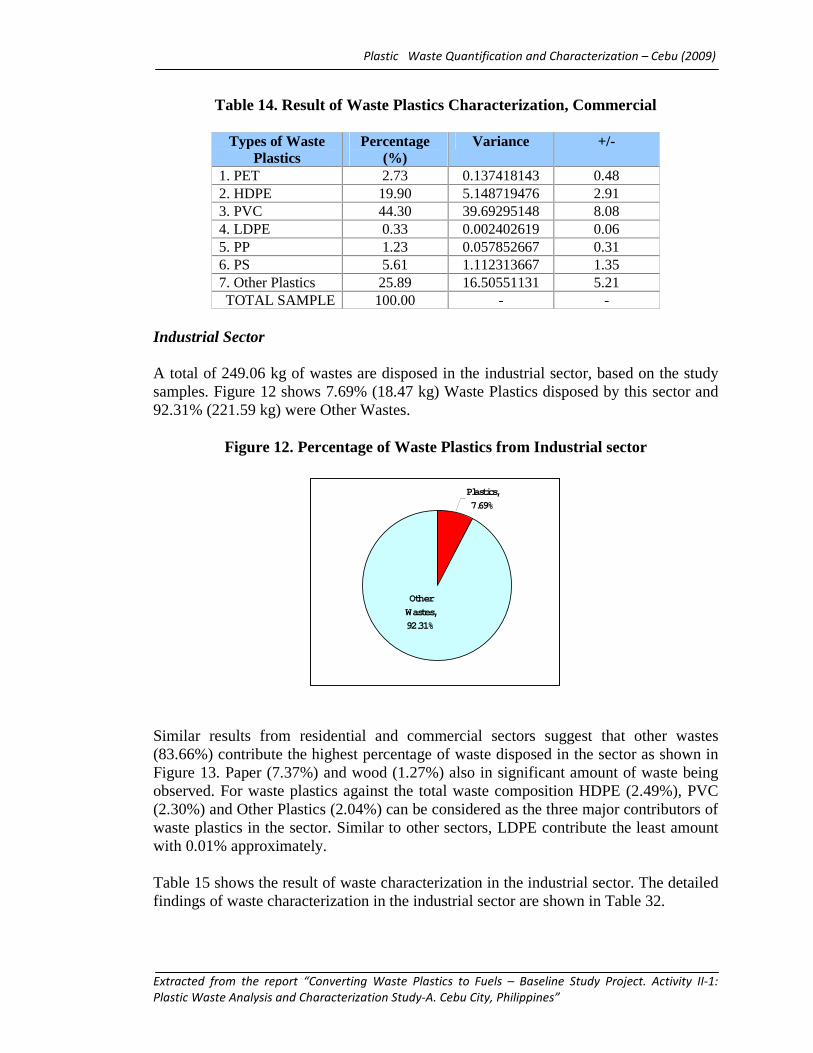
Industrial Sector A total of 249.06 kg of wastes are disposed in the industrial sector, based on the study samples. Figure 12 shows 7.69% (18.47 kg) Waste Plastics disposed by this sector and 92.31% (221.59 kg) were Other Wastes.
Figure 12. Percentage of Waste Plastics from Industrial sector
Plastics,
7.69%
Other
Wastes, 92.31%
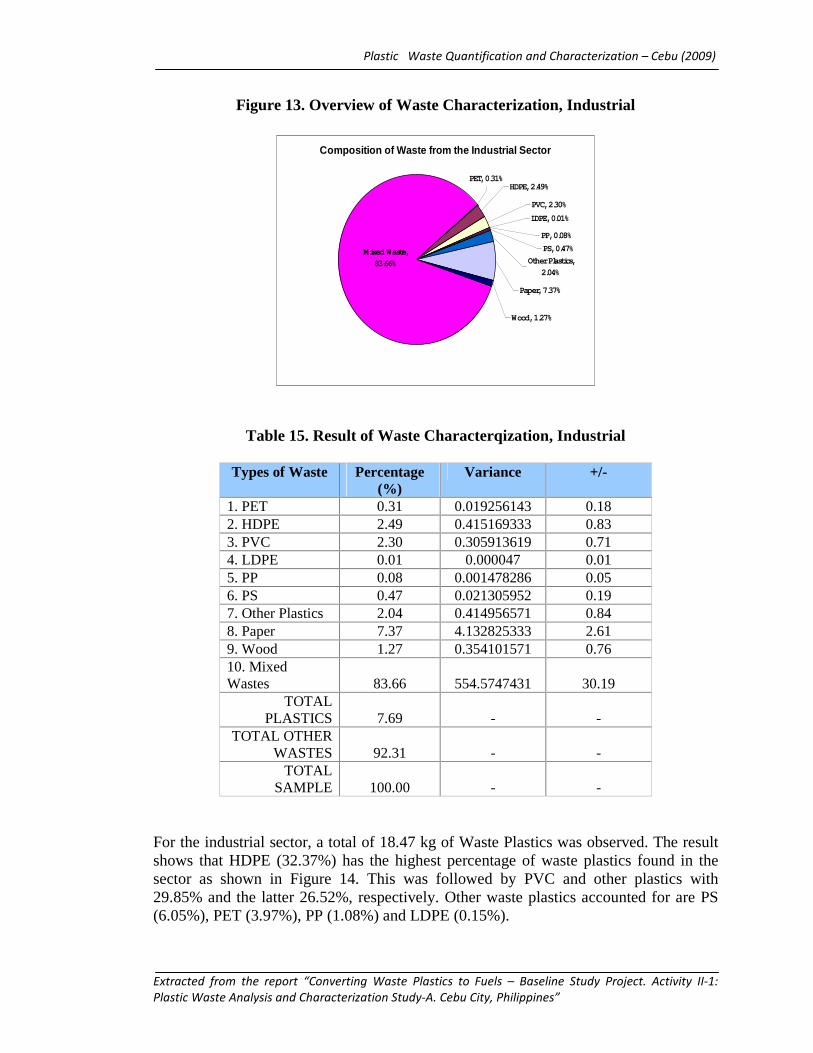
Similar results from residential and commercial sectors suggest that other wastes (83.66%) contribute the highest percentage of waste disposed in the sector as shown in Figure 13. Paper (7.37%) and wood (1.27%) also in significant amount of waste being observed. For waste plastics against the total waste composition HDPE (2.49%), PVC (2.30%) and Other Plastics (2.04%) can be considered as the three major contributors of waste plastics in the sector. Similar to other sectors, LDPE contribute the least amount with 0.01% approximately. Table 15 shows the result of waste characterization in the industrial sector. The detailed findings of waste characterization in the industrial sector are shown in Table 32.
Plastic Waste Quantification and Characterization – Cebu (2009)
Extracted from the report “Converting Waste Plastics to Fuels – Baseline Study Project. Activity II-1:
Plastic Waste Analysis and Characterization Study-A. Cebu City, Philippines”
Figure 13. Overview of Waste Characterization, Industrial
Composition of Waste from the Industrial Sector
Mixed Waste, 83.66%
Wood, 1.27%
Paper, 7.37%
Other Plastics, 2.04%
PS, 0.47%
PP, 0.08%
LDPE, 0.01%
PVC, 2.30%
PET, 0.31%HDPE, 2.49%
Table 15. Result of Waste Characterqization, Industrial
Types of Waste Percentage (%)
Variance +/-
1. PET 0.31 0.019256143 0.18 2. HDPE 2.49 0.415169333 0.83 3. PVC 2.30 0.305913619 0.71 4. LDPE 0.01 0.000047 0.01 5. PP 0.08 0.001478286 0.05 6. PS 0.47 0.021305952 0.19 7. Other Plastics 2.04 0.414956571 0.84 8. Paper 7.37 4.132825333 2.61 9. Wood 1.27 0.354101571 0.76 10. Mixed Wastes 83.66 554.5747431 30.19
TOTAL PLASTICS 7.69 - -
TOTAL OTHER WASTES 92.31 - -
TOTAL SAMPLE 100.00 - -
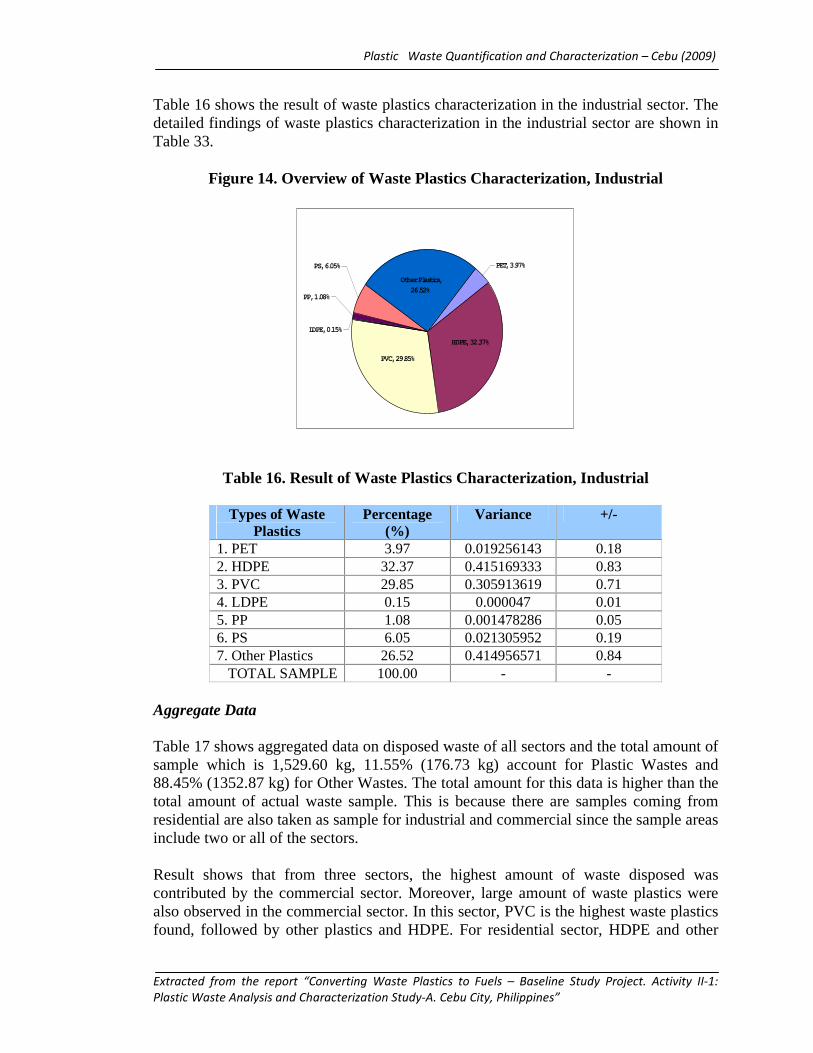
For the industrial sector, a total of 18.47 kg of Waste Plastics was observed. The result shows that HDPE (32.37%) has the highest percentage of waste plastics found in the sector as shown in Figure 14. This was followed by PVC and other plastics with 29.85% and the latter 26.52%, respectively. Other waste plastics accounted for are PS (6.05%), PET (3.97%), PP (1.08%) and LDPE (0.15%).
Plastic Waste Quantification and Characterization – Cebu (2009)
Extracted from the report “Converting Waste Plastics to Fuels – Baseline Study Project. Activity II-1:
Plastic Waste Analysis and Characterization Study-A. Cebu City, Philippines”
Table 16 shows the result of waste plastics characterization in the industrial sector. The detailed findings of waste plastics characterization in the industrial sector are shown in Table 33.
Figure 14. Overview of Waste Plastics Characterization, Industrial
PS, 6.05%
PP, 1.08%
LDPE, 0.15%
PET, 3.97%
PVC, 29.85%
HDPE, 32.37%
Other Plastics,
26.52%
Table 16. Result of Waste Plastics Characterization, Industrial
Types of Waste Plastics
Percentage (%)
Variance +/-
1. PET 3.97 0.019256143 0.18 2. HDPE 32.37 0.415169333 0.83 3. PVC 29.85 0.305913619 0.71 4. LDPE 0.15 0.000047 0.01 5. PP 1.08 0.001478286 0.05 6. PS 6.05 0.021305952 0.19 7. Other Plastics 26.52 0.414956571 0.84
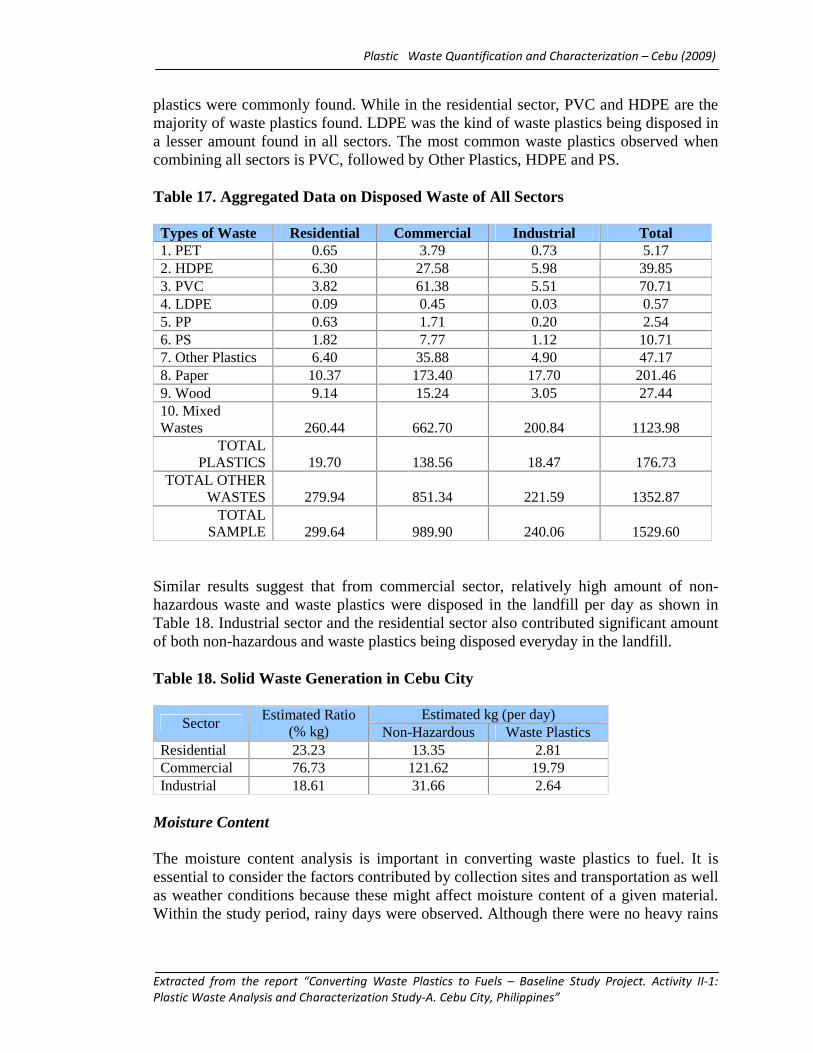
TOTAL SAMPLE 100.00 - - Aggregate Data Table 17 shows aggregated data on disposed waste of all sectors and the total amount of sample which is 1,529.60 kg, 11.55% (176.73 kg) account for Plastic Wastes and 88.45% (1352.87 kg) for Other Wastes. The total amount for this data is higher than the total amount of actual waste sample. This is because there are samples coming from residential are also taken as sample for industrial and commercial since the sample areas include two or all of the sectors. Result shows that from three sectors, the highest amount of waste disposed was contributed by the commercial sector. Moreover, large amount of waste plastics were also observed in the commercial sector. In this sector, PVC is the highest waste plastics found, followed by other plastics and HDPE. For residential sector, HDPE and other
Plastic Waste Quantification and Characterization – Cebu (2009)
Extracted from the report “Converting Waste Plastics to Fuels – Baseline Study Project. Activity II-1:
Plastic Waste Analysis and Characterization Study-A. Cebu City, Philippines”
plastics were commonly found. While in the residential sector, PVC and HDPE are the majority of waste plastics found. LDPE was the kind of waste plastics being disposed in a lesser amount found in all sectors. The most common waste plastics observed when combining all sectors is PVC, followed by Other Plastics, HDPE and PS. Table 17. Aggregated Data on Disposed Waste of All Sectors Types of Waste Residential Commercial Industrial Total 1. PET 0.65 3.79 0.73 5.17 2. HDPE 6.30 27.58 5.98 39.85 3. PVC 3.82 61.38 5.51 70.71 4. LDPE 0.09 0.45 0.03 0.57 5. PP 0.63 1.71 0.20 2.54 6. PS 1.82 7.77 1.12 10.71 7. Other Plastics 6.40 35.88 4.90 47.17 8. Paper 10.37 173.40 17.70 201.46 9. Wood 9.14 15.24 3.05 27.44 10. Mixed Wastes 260.44 662.70 200.84 1123.98
TOTAL PLASTICS 19.70 138.56 18.47 176.73
TOTAL OTHER WASTES 279.94 851.34 221.59 1352.87
TOTAL SAMPLE 299.64 989.90 240.06 1529.60
Similar results suggest that from commercial sector, relatively high amount of non- hazardous waste and waste plastics were disposed in the landfill per day as shown in Table 18. Industrial sector and the residential sector also contributed significant amount of both non-hazardous and waste plastics being disposed everyday in the landfill. Table 18. Solid Waste Generation in Cebu City
Estimated kg (per day) Sector
Estimated Ratio (% kg) Non-Hazardous Waste Plastics
Residential 23.23 13.35 2.81 Commercial 76.73 121.62 19.79 Industrial 18.61 31.66 2.64
Moisture Content The moisture content analysis is important in converting waste plastics to fuel. It is essential to consider the factors contributed by collection sites and transportation as well as weather conditions because these might affect moisture content of a given material. Within the study period, rainy days were observed. Although there were no heavy rains
Plastic Waste Quantification and Characterization – Cebu (2009)
Extracted from the report “Converting Waste Plastics to Fuels – Baseline Study Project. Activity II-1:
Plastic Waste Analysis and Characterization Study-A. Cebu City, Philippines”
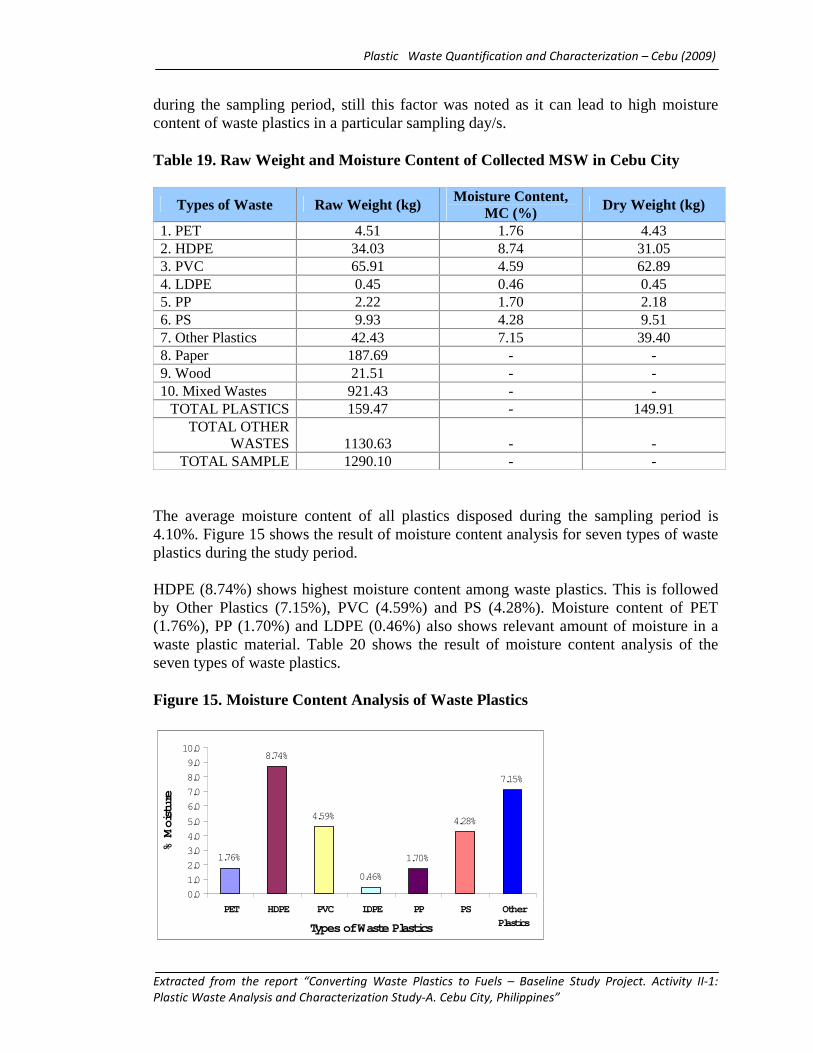
during the sampling period, still this factor was noted as it can lead to high moisture content of waste plastics in a particular sampling day/s. Table 19. Raw Weight and Moisture Content of Collected MSW in Cebu City
Types of Waste Raw Weight (kg) Moisture Content, MC (%) Dry Weight (kg)
1. PET 4.51 1.76 4.43 2. HDPE 34.03 8.74 31.05 3. PVC 65.91 4.59 62.89 4. LDPE 0.45 0.46 0.45 5. PP 2.22 1.70 2.18 6. PS 9.93 4.28 9.51 7. Other Plastics 42.43 7.15 39.40 8. Paper 187.69 - - 9. Wood 21.51 - - 10. Mixed Wastes 921.43 - -
TOTAL PLASTICS 159.47 - 149.91 TOTAL OTHER
WASTES 1130.63 - - TOTAL SAMPLE 1290.10 - -
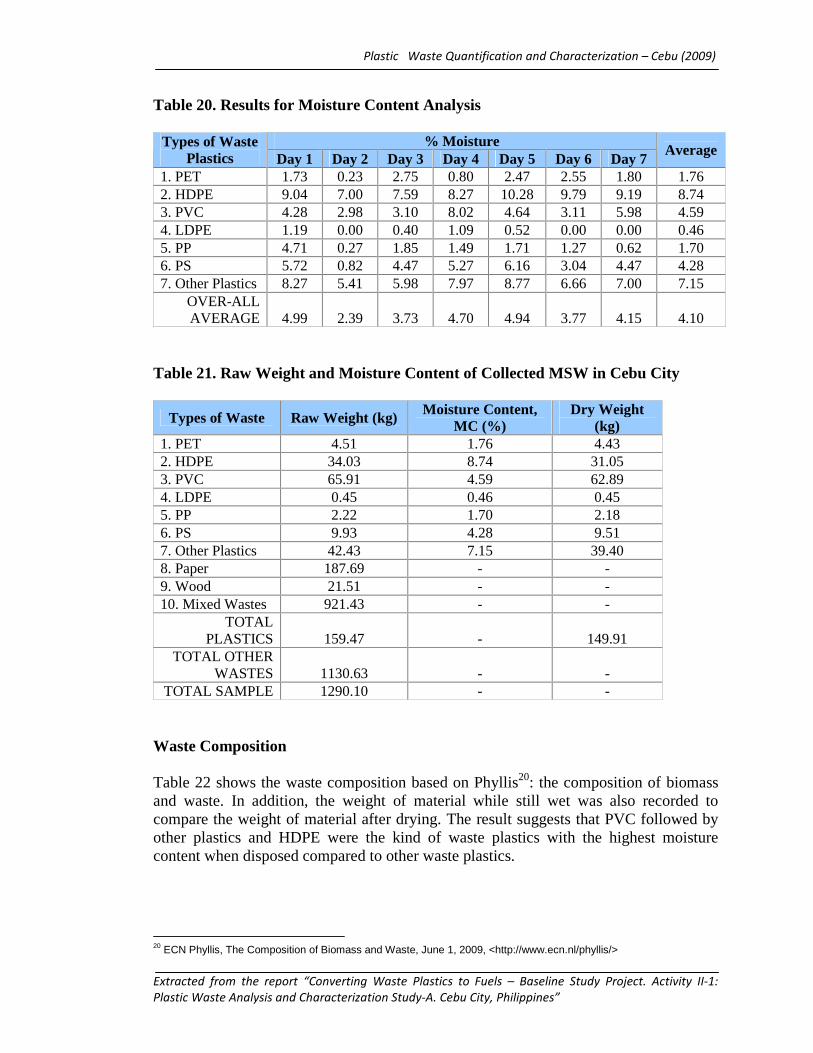
The average moisture content of all plastics disposed during the sampling period is 4.10%. Figure 15 shows the result of moisture content analysis for seven types of waste plastics during the study period. HDPE (8.74%) shows highest moisture content among waste plastics. This is followed by Other Plastics (7.15%), PVC (4.59%) and PS (4.28%). Moisture content of PET (1.76%), PP (1.70%) and LDPE (0.46%) also shows relevant amount of moisture in a waste plastic material. Table 20 shows the result of moisture content analysis of the seven types of waste plastics. Figure 15. Moisture Content Analysis of Waste Plastics
1.76%
8.74%
4.59%
0.46%
1.70%
4.28%
7.15%
0.0
1.0
2.0
3.0
4.0
5.0
6.0
7.0
8.0
9.0
10.0
PET HDPE PVC LDPE PP PS OtherPlasticsTypes of Waste Plastics
% Moisture
Plastic Waste Quantification and Characterization – Cebu (2009)
Extracted from the report “Converting Waste Plastics to Fuels – Baseline Study Project. Activity II-1:
Plastic Waste Analysis and Characterization Study-A. Cebu City, Philippines”
Table 20. Results for Moisture Content Analysis
% Moisture Types of Waste Plastics Day 1 Day 2 Day 3 Day 4 Day 5 Day 6 Day 7
Average
1. PET 1.73 0.23 2.75 0.80 2.47 2.55 1.80 1.76 2. HDPE 9.04 7.00 7.59 8.27 10.28 9.79 9.19 8.74 3. PVC 4.28 2.98 3.10 8.02 4.64 3.11 5.98 4.59 4. LDPE 1.19 0.00 0.40 1.09 0.52 0.00 0.00 0.46 5. PP 4.71 0.27 1.85 1.49 1.71 1.27 0.62 1.70 6. PS 5.72 0.82 4.47 5.27 6.16 3.04 4.47 4.28 7. Other Plastics 8.27 5.41 5.98 7.97 8.77 6.66 7.00 7.15
OVER-ALL AVERAGE 4.99 2.39 3.73 4.70 4.94 3.77 4.15 4.10
Table 21. Raw Weight and Moisture Content of Collected MSW in Cebu City
Types of Waste Raw Weight (kg) Moisture Content, MC (%)
Dry Weight (kg)
1. PET 4.51 1.76 4.43 2. HDPE 34.03 8.74 31.05 3. PVC 65.91 4.59 62.89 4. LDPE 0.45 0.46 0.45 5. PP 2.22 1.70 2.18 6. PS 9.93 4.28 9.51 7. Other Plastics 42.43 7.15 39.40 8. Paper 187.69 - - 9. Wood 21.51 - - 10. Mixed Wastes 921.43 - -
TOTAL PLASTICS 159.47 - 149.91
TOTAL OTHER WASTES 1130.63 - -
TOTAL SAMPLE 1290.10 - -
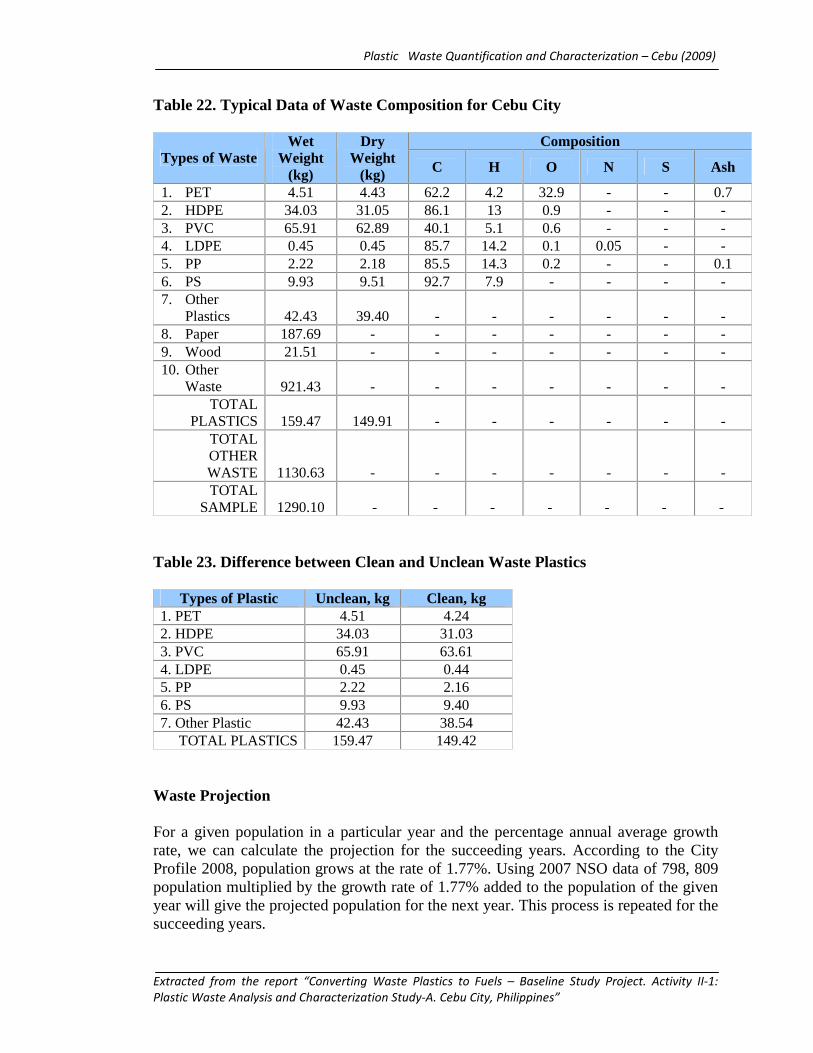
Waste Composition Table 22 shows the waste composition based on Phyllis20: the composition of biomass and waste. In addition, the weight of material while still wet was also recorded to compare the weight of material after drying. The result suggests that PVC followed by other plastics and HDPE were the kind of waste plastics with the highest moisture content when disposed compared to other waste plastics.
20 ECN Phyllis, The Composition of Biomass and Waste, June 1, 2009, <http://www.ecn.nl/phyllis/>
Plastic Waste Quantification and Characterization – Cebu (2009)
Extracted from the report “Converting Waste Plastics to Fuels – Baseline Study Project. Activity II-1:
Plastic Waste Analysis and Characterization Study-A. Cebu City, Philippines”
Table 22. Typical Data of Waste Composition for Cebu City
Composition Types of Waste
Wet Weight
(kg)
Dry Weight
(kg) C H O N S Ash
1. PET 4.51 4.43 62.2 4.2 32.9 - - 0.7 2. HDPE 34.03 31.05 86.1 13 0.9 - - - 3. PVC 65.91 62.89 40.1 5.1 0.6 - - - 4. LDPE 0.45 0.45 85.7 14.2 0.1 0.05 - - 5. PP 2.22 2.18 85.5 14.3 0.2 - - 0.1 6. PS 9.93 9.51 92.7 7.9 - - - - 7. Other
Plastics 42.43 39.40 - - - - - - 8. Paper 187.69 - - - - - - - 9. Wood 21.51 - - - - - - - 10. Other
Waste 921.43 - - - - - - - TOTAL
PLASTICS 159.47 149.91 - - - - - - TOTAL OTHER WASTE 1130.63 - - - - - - - TOTAL
SAMPLE 1290.10 - - - - - - - Table 23. Difference between Clean and Unclean Waste Plastics
Types of Plastic Unclean, kg Clean, kg 1. PET 4.51 4.24 2. HDPE 34.03 31.03 3. PVC 65.91 63.61 4. LDPE 0.45 0.44 5. PP 2.22 2.16 6. PS 9.93 9.40 7. Other Plastic 42.43 38.54
TOTAL PLASTICS 159.47 149.42 Waste Projection For a given population in a particular year and the percentage annual average growth rate, we can calculate the projection for the succeeding years. According to the City Profile 2008, population grows at the rate of 1.77%. Using 2007 NSO data of 798, 809 population multiplied by the growth rate of 1.77% added to the population of the given year will give the projected population for the next year. This process is repeated for the succeeding years.
Plastic Waste Quantification and Characterization – Cebu (2009)
Extracted from the report “Converting Waste Plastics to Fuels – Baseline Study Project. Activity II-1:
Plastic Waste Analysis and Characterization Study-A. Cebu City, Philippines”
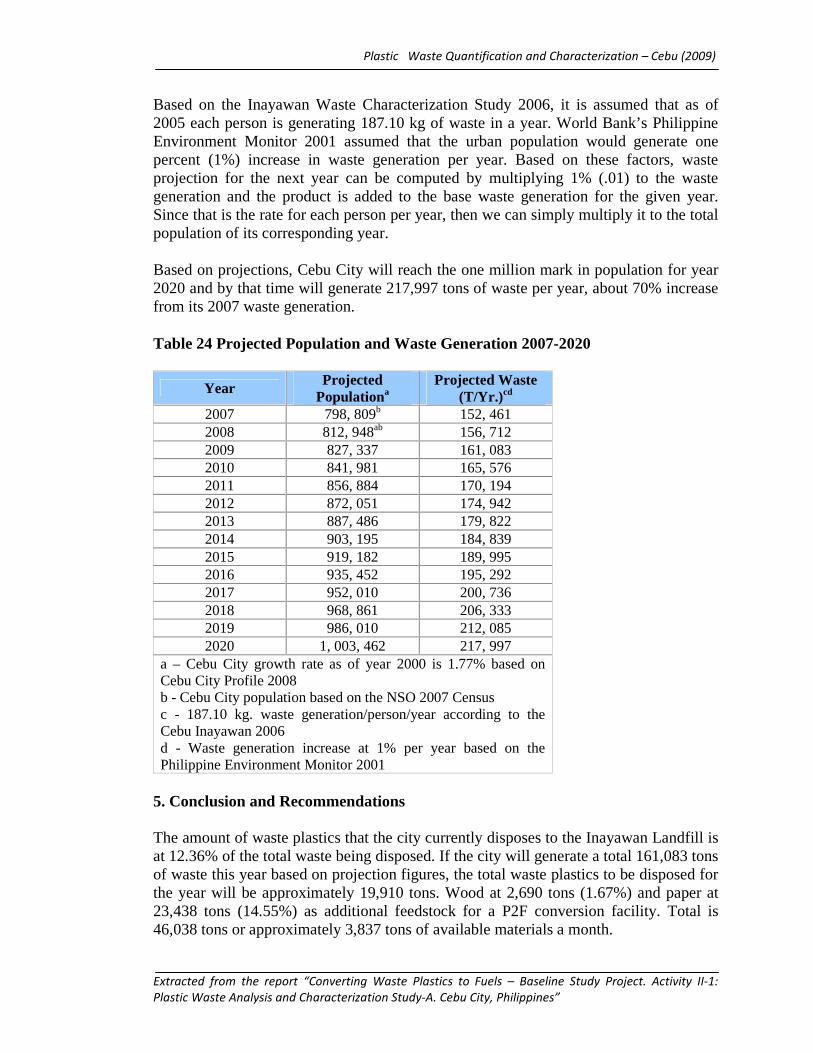
Based on the Inayawan Waste Characterization Study 2006, it is assumed that as of 2005 each person is generating 187.10 kg of waste in a year. World Bank’s Philippine Environment Monitor 2001 assumed that the urban population would generate one percent (1%) increase in waste generation per year. Based on these factors, waste projection for the next year can be computed by multiplying 1% (.01) to the waste generation and the product is added to the base waste generation for the given year. Since that is the rate for each person per year, then we can simply multiply it to the total population of its corresponding year. Based on projections, Cebu City will reach the one million mark in population for year 2020 and by that time will generate 217,997 tons of waste per year, about 70% increase from its 2007 waste generation. Table 24 Projected Population and Waste Generation 2007-2020
5. Conclusion and Recommendations The amount of waste plastics that the city currently disposes to the Inayawan Landfill is at 12.36% of the total waste being disposed. If the city will generate a total 161,083 tons of waste this year based on projection figures, the total waste plastics to be disposed for the year will be approximately 19,910 tons. Wood at 2,690 tons (1.67%) and paper at 23,438 tons (14.55%) as additional feedstock for a P2F conversion facility. Total is 46,038 tons or approximately 3,837 tons of available materials a month.
Year Projected Populationa
Projected Waste (T/Yr.)cd
2007 798, 809b 152, 461
2008 812, 948ab 156, 712 2009 827, 337 161, 083 2010 841, 981 165, 576 2011 856, 884 170, 194 2012 872, 051 174, 942 2013 887, 486 179, 822 2014 903, 195 184, 839 2015 919, 182 189, 995 2016 935, 452 195, 292 2017 952, 010 200, 736 2018 968, 861 206, 333 2019 986, 010 212, 085 2020 1, 003, 462 217, 997
a – Cebu City growth rate as of year 2000 is 1.77% based on Cebu City Profile 2008 b - Cebu City population based on the NSO 2007 Census c - 187.10 kg. waste generation/person/year according to the Cebu Inayawan 2006 d - Waste generation increase at 1% per year based on the Philippine Environment Monitor 2001
Plastic Waste Quantification and Characterization – Cebu (2009)
Extracted from the report “Converting Waste Plastics to Fuels – Baseline Study Project. Activity II-1:
Plastic Waste Analysis and Characterization Study-A. Cebu City, Philippines”
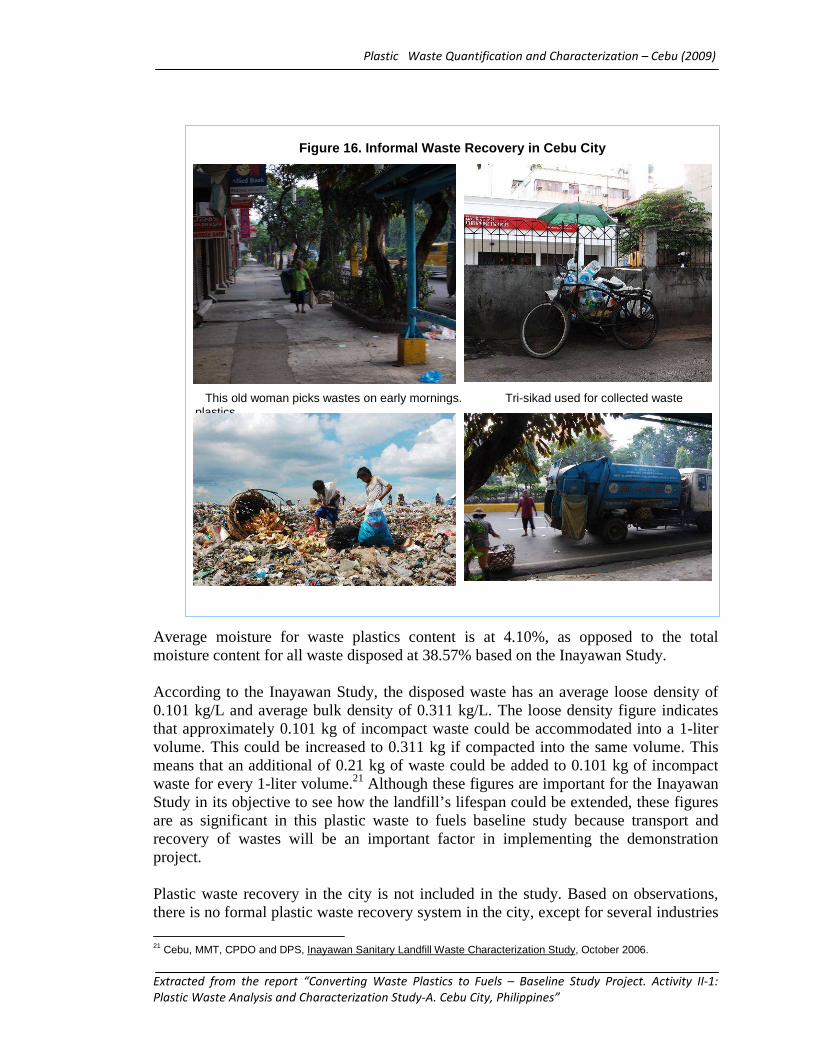
Average moisture for waste plastics content is at 4.10%, as opposed to the total moisture content for all waste disposed at 38.57% based on the Inayawan Study. According to the Inayawan Study, the disposed waste has an average loose density of 0.101 kg/L and average bulk density of 0.311 kg/L. The loose density figure indicates that approximately 0.101 kg of incompact waste could be accommodated into a 1-liter volume. This could be increased to 0.311 kg if compacted into the same volume. This means that an additional of 0.21 kg of waste could be added to 0.101 kg of incompact waste for every 1-liter volume.21 Although these figures are important for the Inayawan Study in its objective to see how the landfill’s lifespan could be extended, these figures are as significant in this plastic waste to fuels baseline study because transport and recovery of wastes will be an important factor in implementing the demonstration project. Plastic waste recovery in the city is not included in the study. Based on observations, there is no formal plastic waste recovery system in the city, except for several industries
21 Cebu, MMT, CPDO and DPS, Inayawan Sanitary Landfill Waste Characterization Study, October 2006.
Figure 16. Informal Waste Recovery in Cebu City
This old woman picks wastes on early mornings. Tri-sikad used for collected waste plastics.
Plastic Waste Quantification and Characterization – Cebu (2009)
Extracted from the report “Converting Waste Plastics to Fuels – Baseline Study Project. Activity II-1:
Plastic Waste Analysis and Characterization Study-A. Cebu City, Philippines”
and commercial establishments that manage their own waste. Informally, however, there are several levels of recovery (Figure 16). This includes segregation at source where recyclables are either bought by individual buyers, picked up by scavengers from along the streets or at the disposal site, and the practice of waste collection crew to separate materials they can sell. For a detailed discussion on these practices, please see Activity II-2 Report on Plastic Wastes Management Systems and Practices for Cebu City. A further study focusing on waste recovery and diversion systems would further shed light on how much waste plastics the city generates in different sectors. This study should also include markets for plastics and costs of different plastic waste materials. As for the City, a stricter enforcement of solid waste management laws and local ordinances is needed so that recyclable waste plastics, as well as other materials, will be diverted to environment-friendly projects such as a P2F facility.
Plastic Waste Quantification and Characterization – Cebu (2009)
Extracted from the report “Converting Waste Plastics to Fuels – Baseline Study Project. Activity II-1: Plastic Waste Analysis and Characterization Study-A. Cebu
City, Philippines”
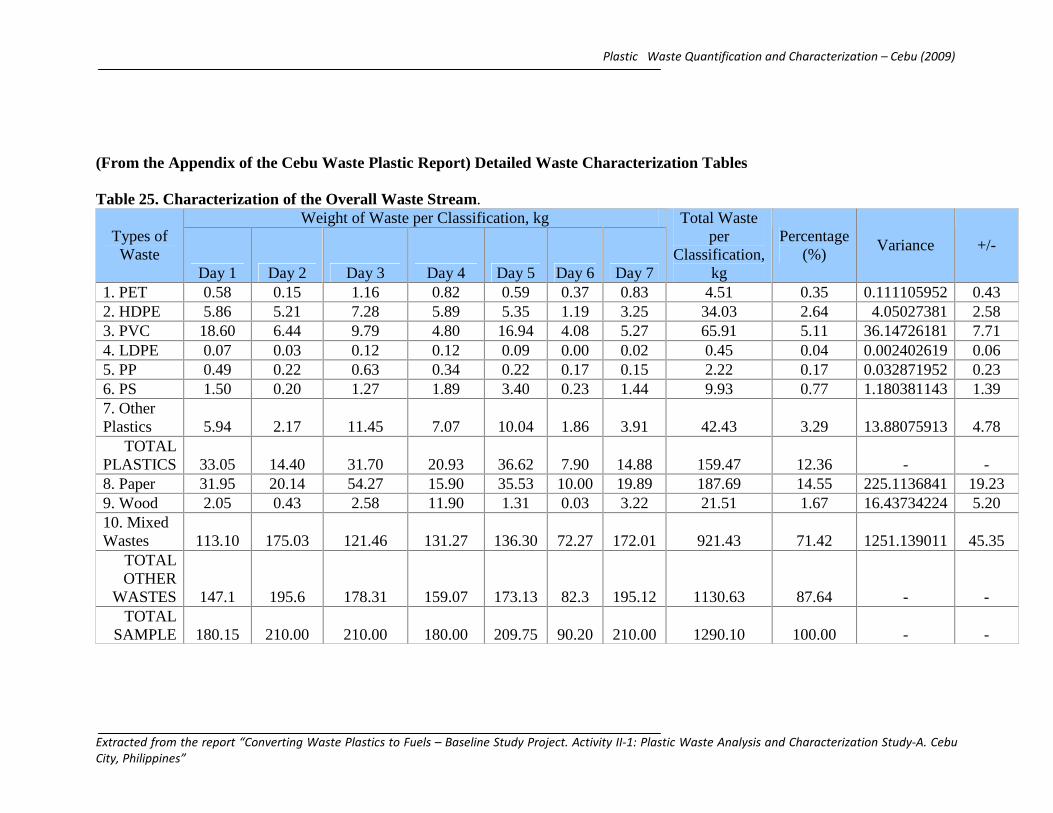
(From the Appendix of the Cebu Waste Plastic Report) Detailed Waste Characterization Tables Table 25. Characterization of the Overall Waste Stream.
Weight of Waste per Classification, kg Types of Waste
Day 1 Day 2 Day 3 Day 4 Day 5 Day 6 Day 7
Total Waste per
Classification, kg
Percentage (%)
Variance +/-
1. PET 0.58 0.15 1.16 0.82 0.59 0.37 0.83 4.51 0.35 0.111105952 0.43 2. HDPE 5.86 5.21 7.28 5.89 5.35 1.19 3.25 34.03 2.64 4.05027381 2.58 3. PVC 18.60 6.44 9.79 4.80 16.94 4.08 5.27 65.91 5.11 36.14726181 7.71 4. LDPE 0.07 0.03 0.12 0.12 0.09 0.00 0.02 0.45 0.04 0.002402619 0.06 5. PP 0.49 0.22 0.63 0.34 0.22 0.17 0.15 2.22 0.17 0.032871952 0.23 6. PS 1.50 0.20 1.27 1.89 3.40 0.23 1.44 9.93 0.77 1.180381143 1.39 7. Other Plastics 5.94 2.17 11.45 7.07 10.04 1.86 3.91 42.43 3.29 13.88075913 4.78
TOTAL PLASTICS 33.05 14.40 31.70 20.93 36.62 7.90 14.88 159.47 12.36 - - 8. Paper 31.95 20.14 54.27 15.90 35.53 10.00 19.89 187.69 14.55 225.1136841 19.23 9. Wood 2.05 0.43 2.58 11.90 1.31 0.03 3.22 21.51 1.67 16.43734224 5.20 10. Mixed Wastes 113.10 175.03 121.46 131.27 136.30 72.27 172.01 921.43 71.42 1251.139011 45.35
TOTAL OTHER
WASTES 147.1 195.6 178.31 159.07 173.13 82.3 195.12 1130.63 87.64 - - TOTAL
SAMPLE 180.15 210.00 210.00 180.00 209.75 90.20 210.00 1290.10 100.00 - -
Plastic Waste Quantification and Characterization – Cebu (2009)
Extracted from the report “Converting Waste Plastics to Fuels – Baseline Study Project. Activity II-1: Plastic Waste Analysis and Characterization Study-A. Cebu
City, Philippines”
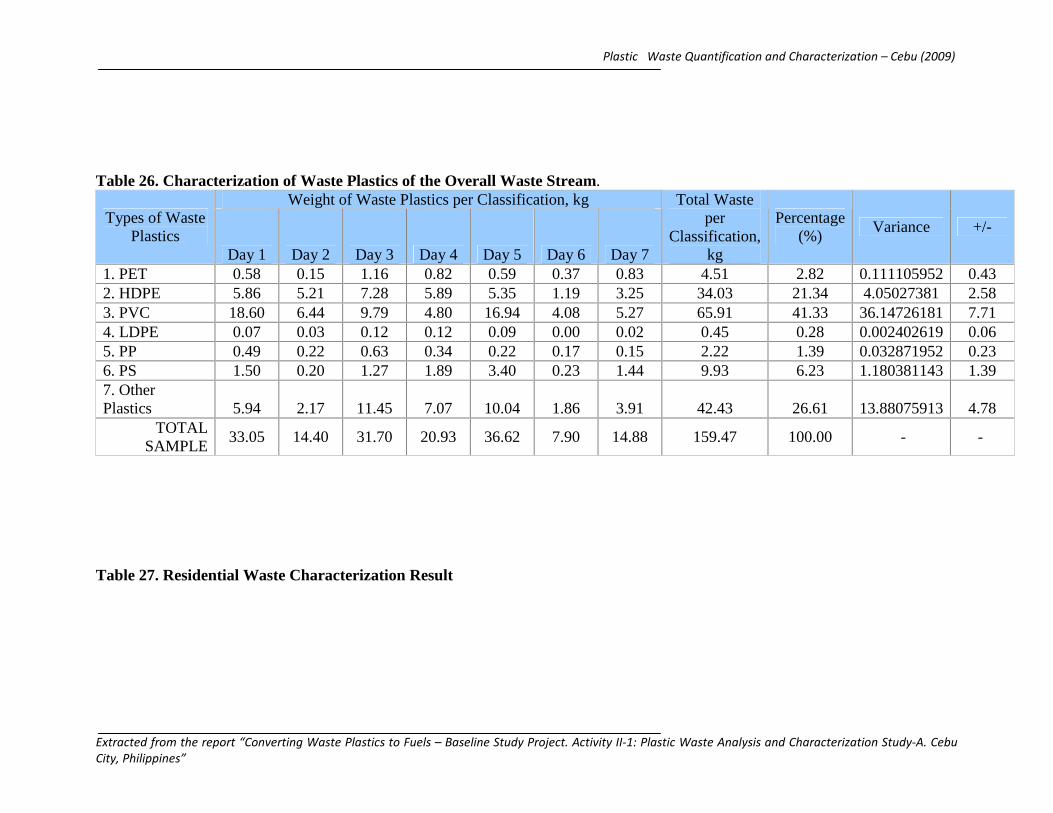
Table 26. Characterization of Waste Plastics of the Overall Waste Stream.
Weight of Waste Plastics per Classification, kg Types of Waste
Plastics Day 1 Day 2 Day 3 Day 4 Day 5 Day 6 Day 7
Total Waste per
Classification, kg
Percentage (%)
Variance +/-
1. PET 0.58 0.15 1.16 0.82 0.59 0.37 0.83 4.51 2.82 0.111105952 0.43 2. HDPE 5.86 5.21 7.28 5.89 5.35 1.19 3.25 34.03 21.34 4.05027381 2.58 3. PVC 18.60 6.44 9.79 4.80 16.94 4.08 5.27 65.91 41.33 36.14726181 7.71 4. LDPE 0.07 0.03 0.12 0.12 0.09 0.00 0.02 0.45 0.28 0.002402619 0.06 5. PP 0.49 0.22 0.63 0.34 0.22 0.17 0.15 2.22 1.39 0.032871952 0.23 6. PS 1.50 0.20 1.27 1.89 3.40 0.23 1.44 9.93 6.23 1.180381143 1.39 7. Other Plastics 5.94 2.17 11.45 7.07 10.04 1.86 3.91 42.43 26.61 13.88075913 4.78
TOTAL SAMPLE
33.05 14.40 31.70 20.93 36.62 7.90 14.88 159.47 100.00 - -
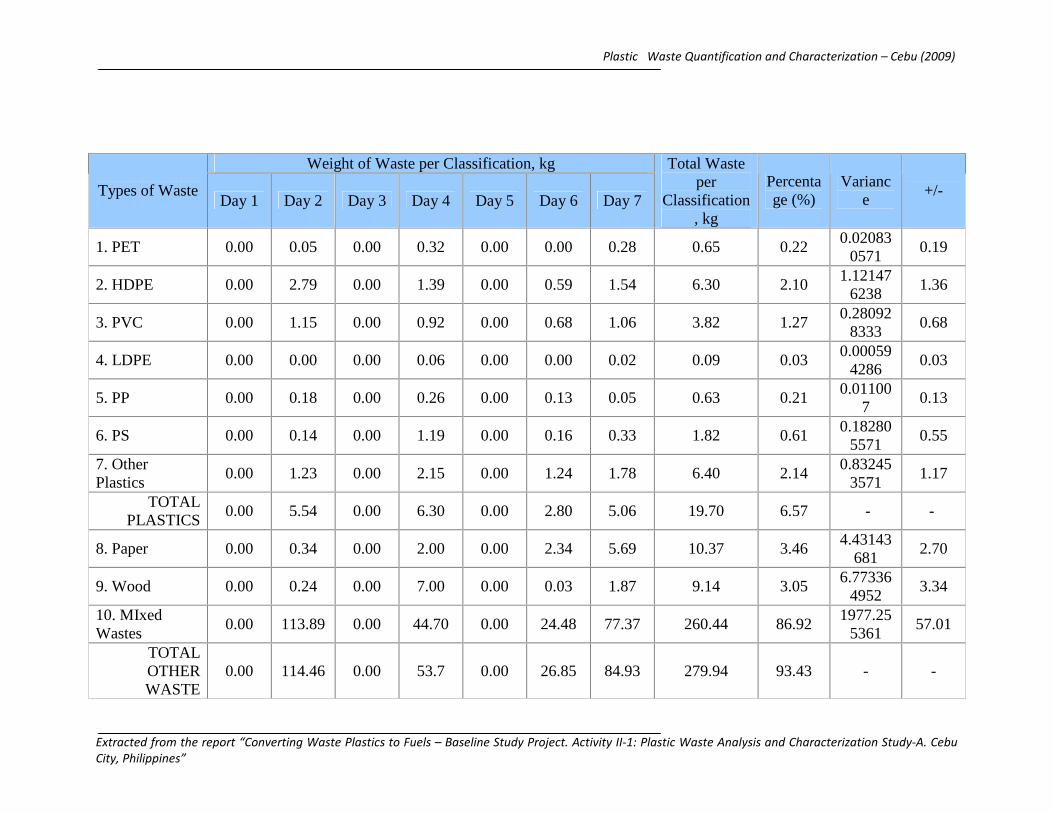
Table 27. Residential Waste Characterization Result
Plastic Waste Quantification and Characterization – Cebu (2009)
Extracted from the report “Converting Waste Plastics to Fuels – Baseline Study Project. Activity II-1: Plastic Waste Analysis and Characterization Study-A. Cebu
City, Philippines”
Weight of Waste per Classification, kg
Types of Waste Day 1 Day 2 Day 3 Day 4 Day 5 Day 6 Day 7
Total Waste per
Classification, kg
Percentage (%)
Variance
+/-
1. PET 0.00 0.05 0.00 0.32 0.00 0.00 0.28 0.65 0.22 0.02083
0571 0.19
2. HDPE 0.00 2.79 0.00 1.39 0.00 0.59 1.54 6.30 2.10 1.12147
6238 1.36
3. PVC 0.00 1.15 0.00 0.92 0.00 0.68 1.06 3.82 1.27 0.28092
8333 0.68
4. LDPE 0.00 0.00 0.00 0.06 0.00 0.00 0.02 0.09 0.03 0.00059
4286 0.03
5. PP 0.00 0.18 0.00 0.26 0.00 0.13 0.05 0.63 0.21 0.01100
7 0.13
6. PS 0.00 0.14 0.00 1.19 0.00 0.16 0.33 1.82 0.61 0.18280
5571 0.55
7. Other Plastics
0.00 1.23 0.00 2.15 0.00 1.24 1.78 6.40 2.14 0.83245
3571 1.17
TOTAL PLASTICS
0.00 5.54 0.00 6.30 0.00 2.80 5.06 19.70 6.57 - -
8. Paper 0.00 0.34 0.00 2.00 0.00 2.34 5.69 10.37 3.46 4.43143
681 2.70
9. Wood 0.00 0.24 0.00 7.00 0.00 0.03 1.87 9.14 3.05 6.77336
4952 3.34
10. MIxed Wastes
0.00 113.89 0.00 44.70 0.00 24.48 77.37 260.44 86.92 1977.25
5361 57.01
TOTAL OTHER WASTE
0.00 114.46 0.00 53.7 0.00 26.85 84.93 279.94 93.43 - -
Plastic Waste Quantification and Characterization – Cebu (2009)
Extracted from the report “Converting Waste Plastics to Fuels – Baseline Study Project. Activity II-1: Plastic Waste Analysis and Characterization Study-A. Cebu
City, Philippines”
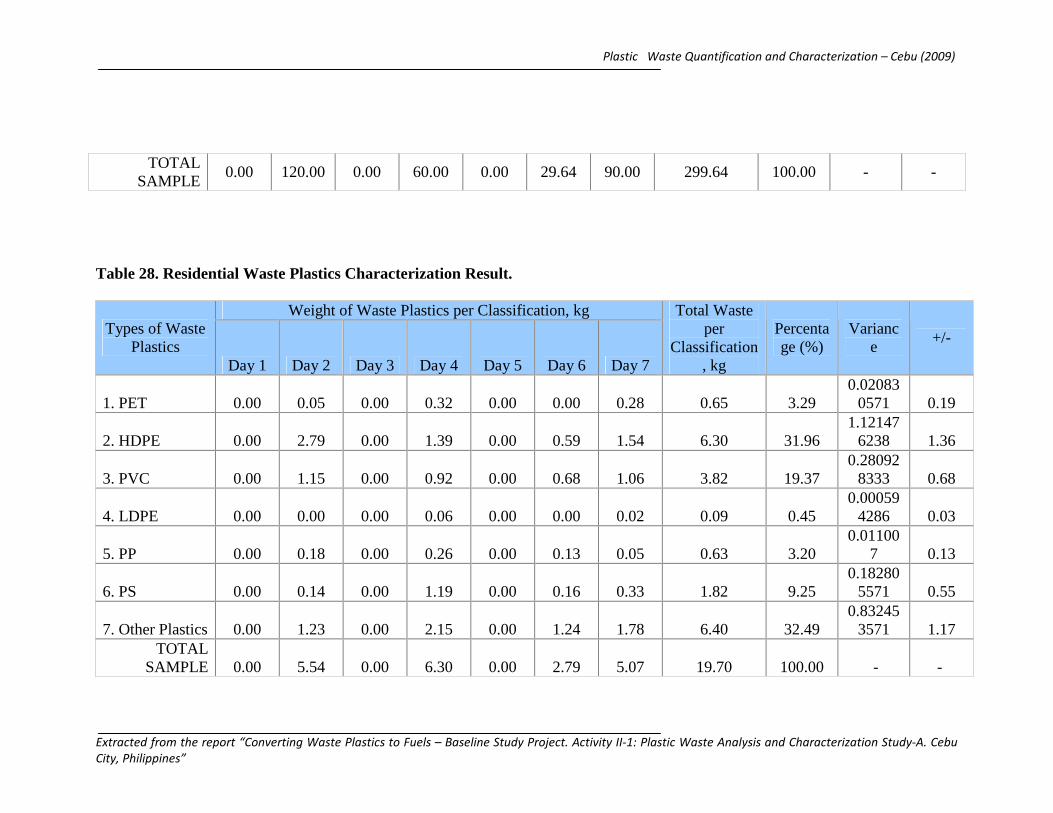
Table 28. Residential Waste Plastics Characterization Result.
Weight of Waste Plastics per Classification, kg Types of Waste
Plastics Day 1 Day 2 Day 3 Day 4 Day 5 Day 6 Day 7
Total Waste per
Classification, kg
Percentage (%)
Variance
+/-
1. PET 0.00 0.05 0.00 0.32 0.00 0.00 0.28 0.65 3.29 0.02083
0571 0.19
2. HDPE 0.00 2.79 0.00 1.39 0.00 0.59 1.54 6.30 31.96 1.12147
6238 1.36
3. PVC 0.00 1.15 0.00 0.92 0.00 0.68 1.06 3.82 19.37 0.28092
8333 0.68
4. LDPE 0.00 0.00 0.00 0.06 0.00 0.00 0.02 0.09 0.45 0.00059
4286 0.03
5. PP 0.00 0.18 0.00 0.26 0.00 0.13 0.05 0.63 3.20 0.01100
7 0.13
6. PS 0.00 0.14 0.00 1.19 0.00 0.16 0.33 1.82 9.25 0.18280
5571 0.55
7. Other Plastics 0.00 1.23 0.00 2.15 0.00 1.24 1.78 6.40 32.49 0.83245
3571 1.17 TOTAL
SAMPLE 0.00 5.54 0.00 6.30 0.00 2.79 5.07 19.70 100.00 - -
TOTAL SAMPLE
0.00 120.00 0.00 60.00 0.00 29.64 90.00 299.64 100.00 - -
Plastic Waste Quantification and Characterization – Cebu (2009)
Extracted from the report “Converting Waste Plastics to Fuels – Baseline Study Project. Activity II-1: Plastic Waste Analysis and Characterization Study-A. Cebu
City, Philippines”
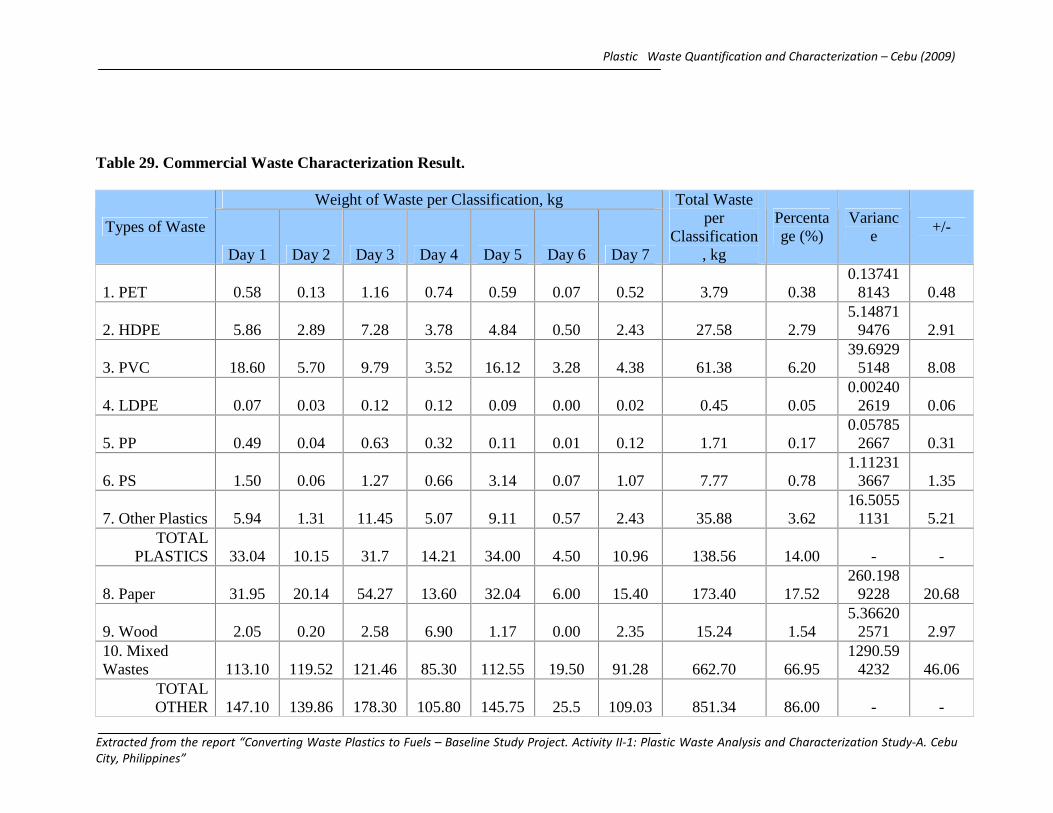
Table 29. Commercial Waste Characterization Result.
Weight of Waste per Classification, kg
Types of Waste
Day 1 Day 2 Day 3 Day 4 Day 5 Day 6 Day 7
Total Waste per
Classification, kg
Percentage (%)
Variance
+/-
1. PET 0.58 0.13 1.16 0.74 0.59 0.07 0.52 3.79 0.38 0.13741
8143 0.48
2. HDPE 5.86 2.89 7.28 3.78 4.84 0.50 2.43 27.58 2.79 5.14871
9476 2.91
3. PVC 18.60 5.70 9.79 3.52 16.12 3.28 4.38 61.38 6.20 39.6929
5148 8.08
4. LDPE 0.07 0.03 0.12 0.12 0.09 0.00 0.02 0.45 0.05 0.00240
2619 0.06
5. PP 0.49 0.04 0.63 0.32 0.11 0.01 0.12 1.71 0.17 0.05785
2667 0.31
6. PS 1.50 0.06 1.27 0.66 3.14 0.07 1.07 7.77 0.78 1.11231
3667 1.35
7. Other Plastics 5.94 1.31 11.45 5.07 9.11 0.57 2.43 35.88 3.62 16.5055
1131 5.21 TOTAL
PLASTICS 33.04 10.15 31.7 14.21 34.00 4.50 10.96 138.56 14.00 - -
8. Paper 31.95 20.14 54.27 13.60 32.04 6.00 15.40 173.40 17.52 260.198
9228 20.68
9. Wood 2.05 0.20 2.58 6.90 1.17 0.00 2.35 15.24 1.54 5.36620
2571 2.97 10. Mixed Wastes 113.10 119.52 121.46 85.30 112.55 19.50 91.28 662.70 66.95
1290.594232 46.06
TOTAL OTHER 147.10 139.86 178.30 105.80 145.75 25.5 109.03 851.34 86.00 - -
Plastic Waste Quantification and Characterization – Cebu (2009)
Extracted from the report “Converting Waste Plastics to Fuels – Baseline Study Project. Activity II-1: Plastic Waste Analysis and Characterization Study-A. Cebu
City, Philippines”
WASTES TOTAL
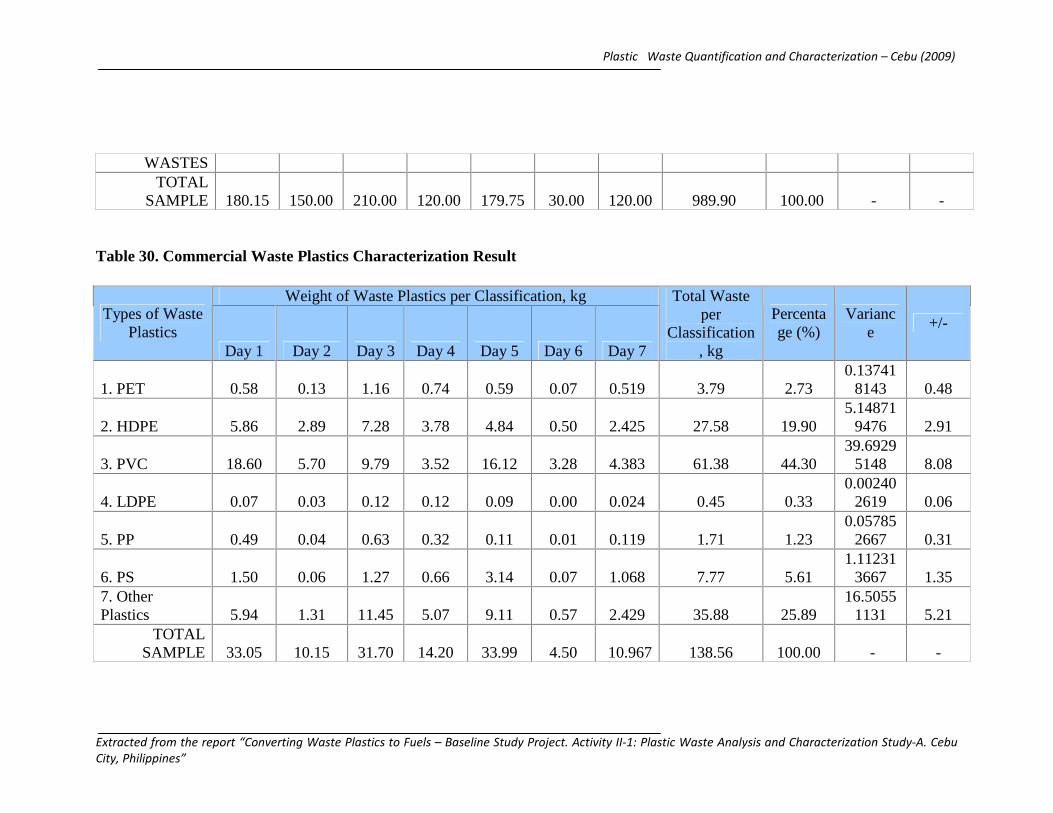
SAMPLE 180.15 150.00 210.00 120.00 179.75 30.00 120.00 989.90 100.00 - - Table 30. Commercial Waste Plastics Characterization Result
Weight of Waste Plastics per Classification, kg Types of Waste
Plastics Day 1 Day 2 Day 3 Day 4 Day 5 Day 6 Day 7
Total Waste per
Classification, kg
Percentage (%)
Variance
+/-
1. PET 0.58 0.13 1.16 0.74 0.59 0.07 0.519 3.79 2.73 0.13741
8143 0.48
2. HDPE 5.86 2.89 7.28 3.78 4.84 0.50 2.425 27.58 19.90 5.14871
9476 2.91
3. PVC 18.60 5.70 9.79 3.52 16.12 3.28 4.383 61.38 44.30 39.6929
5148 8.08
4. LDPE 0.07 0.03 0.12 0.12 0.09 0.00 0.024 0.45 0.33 0.00240
2619 0.06
5. PP 0.49 0.04 0.63 0.32 0.11 0.01 0.119 1.71 1.23 0.05785
2667 0.31
6. PS 1.50 0.06 1.27 0.66 3.14 0.07 1.068 7.77 5.61 1.11231
3667 1.35 7. Other Plastics 5.94 1.31 11.45 5.07 9.11 0.57 2.429 35.88 25.89
16.50551131 5.21
TOTAL SAMPLE 33.05 10.15 31.70 14.20 33.99 4.50 10.967 138.56 100.00 - -
Plastic Waste Quantification and Characterization – Cebu (2009)
Extracted from the report “Converting Waste Plastics to Fuels – Baseline Study Project. Activity II-1: Plastic Waste Analysis and Characterization Study-A. Cebu
City, Philippines”
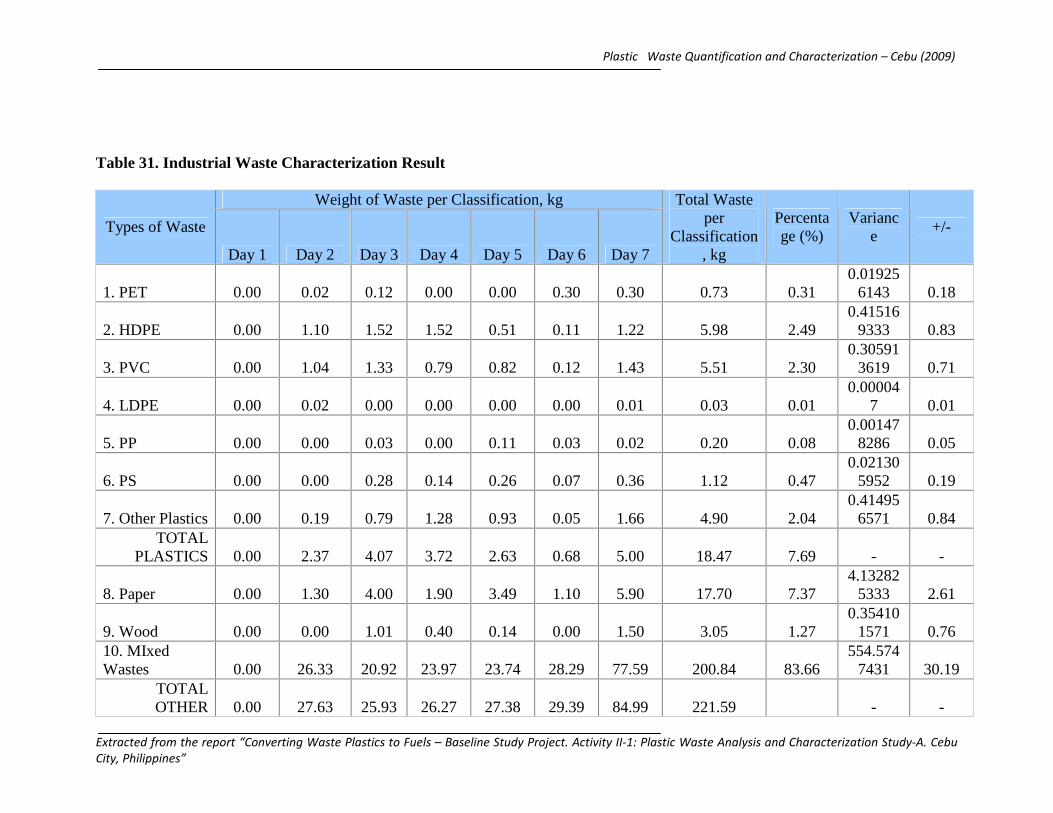
Table 31. Industrial Waste Characterization Result
Weight of Waste per Classification, kg
Types of Waste
Day 1 Day 2 Day 3 Day 4 Day 5 Day 6 Day 7
Total Waste per
Classification, kg
Percentage (%)
Variance
+/-
1. PET 0.00 0.02 0.12 0.00 0.00 0.30 0.30 0.73 0.31 0.01925
6143 0.18
2. HDPE 0.00 1.10 1.52 1.52 0.51 0.11 1.22 5.98 2.49 0.41516
9333 0.83
3. PVC 0.00 1.04 1.33 0.79 0.82 0.12 1.43 5.51 2.30 0.30591
3619 0.71
4. LDPE 0.00 0.02 0.00 0.00 0.00 0.00 0.01 0.03 0.01 0.00004
7 0.01
5. PP 0.00 0.00 0.03 0.00 0.11 0.03 0.02 0.20 0.08 0.00147
8286 0.05
6. PS 0.00 0.00 0.28 0.14 0.26 0.07 0.36 1.12 0.47 0.02130
5952 0.19
7. Other Plastics 0.00 0.19 0.79 1.28 0.93 0.05 1.66 4.90 2.04 0.41495
6571 0.84 TOTAL
PLASTICS 0.00 2.37 4.07 3.72 2.63 0.68 5.00 18.47 7.69 - -
8. Paper 0.00 1.30 4.00 1.90 3.49 1.10 5.90 17.70 7.37 4.13282
5333 2.61
9. Wood 0.00 0.00 1.01 0.40 0.14 0.00 1.50 3.05 1.27 0.35410
1571 0.76 10. MIxed Wastes 0.00 26.33 20.92 23.97 23.74 28.29 77.59 200.84 83.66
554.5747431 30.19
TOTAL OTHER 0.00 27.63 25.93 26.27 27.38 29.39 84.99 221.59 - -
Plastic Waste Quantification and Characterization – Cebu (2009)
Extracted from the report “Converting Waste Plastics to Fuels – Baseline Study Project. Activity II-1: Plastic Waste Analysis and Characterization Study-A. Cebu
City, Philippines”
WASTES TOTAL
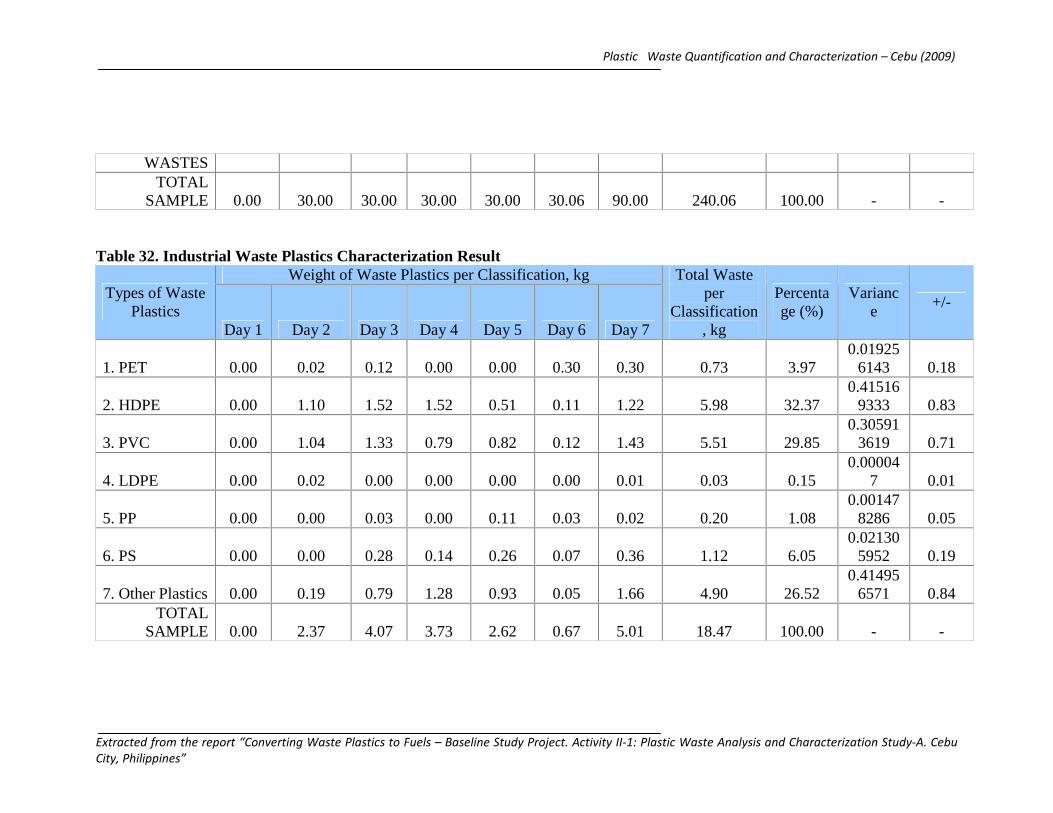
SAMPLE 0.00 30.00 30.00 30.00 30.00 30.06 90.00 240.06 100.00 - - Table 32. Industrial Waste Plastics Characterization Result
Weight of Waste Plastics per Classification, kg Types of Waste
Plastics Day 1 Day 2 Day 3 Day 4 Day 5 Day 6 Day 7
Total Waste per
Classification, kg
Percentage (%)
Variance
+/-
1. PET 0.00 0.02 0.12 0.00 0.00 0.30 0.30 0.73 3.97 0.01925
6143 0.18
2. HDPE 0.00 1.10 1.52 1.52 0.51 0.11 1.22 5.98 32.37 0.41516
9333 0.83
3. PVC 0.00 1.04 1.33 0.79 0.82 0.12 1.43 5.51 29.85 0.30591
3619 0.71
4. LDPE 0.00 0.02 0.00 0.00 0.00 0.00 0.01 0.03 0.15 0.00004
7 0.01
5. PP 0.00 0.00 0.03 0.00 0.11 0.03 0.02 0.20 1.08 0.00147
8286 0.05
6. PS 0.00 0.00 0.28 0.14 0.26 0.07 0.36 1.12 6.05 0.02130
5952 0.19
7. Other Plastics 0.00 0.19 0.79 1.28 0.93 0.05 1.66 4.90 26.52 0.41495
6571 0.84 TOTAL
SAMPLE 0.00 2.37 4.07 3.73 2.62 0.67 5.01 18.47 100.00 - -
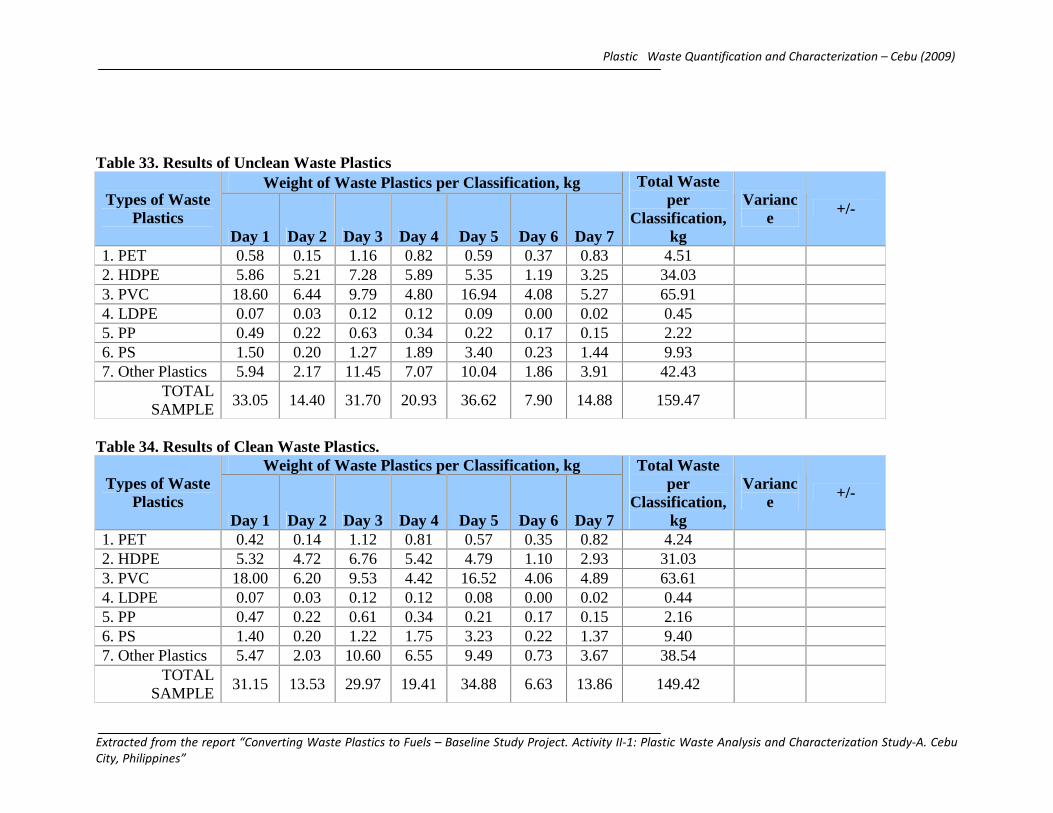
Plastic Waste Quantification and Characterization – Cebu (2009)
Extracted from the report “Converting Waste Plastics to Fuels – Baseline Study Project. Activity II-1: Plastic Waste Analysis and Characterization Study-A. Cebu
City, Philippines”
Table 33. Results of Unclean Waste Plastics Weight of Waste Plastics per Classification, kg
Types of Waste Plastics
Day 1 Day 2 Day 3 Day 4 Day 5 Day 6 Day 7
Total Waste per
Classification, kg
Variance
+/-
1. PET 0.58 0.15 1.16 0.82 0.59 0.37 0.83 4.51 2. HDPE 5.86 5.21 7.28 5.89 5.35 1.19 3.25 34.03 3. PVC 18.60 6.44 9.79 4.80 16.94 4.08 5.27 65.91 4. LDPE 0.07 0.03 0.12 0.12 0.09 0.00 0.02 0.45 5. PP 0.49 0.22 0.63 0.34 0.22 0.17 0.15 2.22 6. PS 1.50 0.20 1.27 1.89 3.40 0.23 1.44 9.93 7. Other Plastics 5.94 2.17 11.45 7.07 10.04 1.86 3.91 42.43
TOTAL SAMPLE
33.05 14.40 31.70 20.93 36.62 7.90 14.88 159.47
Table 34. Results of Clean Waste Plastics.
Weight of Waste Plastics per Classification, kg Types of Waste
Plastics Day 1 Day 2 Day 3 Day 4 Day 5 Day 6 Day 7
Total Waste per
Classification, kg
Variance
+/-
1. PET 0.42 0.14 1.12 0.81 0.57 0.35 0.82 4.24 2. HDPE 5.32 4.72 6.76 5.42 4.79 1.10 2.93 31.03 3. PVC 18.00 6.20 9.53 4.42 16.52 4.06 4.89 63.61 4. LDPE 0.07 0.03 0.12 0.12 0.08 0.00 0.02 0.44 5. PP 0.47 0.22 0.61 0.34 0.21 0.17 0.15 2.16 6. PS 1.40 0.20 1.22 1.75 3.23 0.22 1.37 9.40 7. Other Plastics 5.47 2.03 10.60 6.55 9.49 0.73 3.67 38.54
TOTAL SAMPLE
31.15 13.53 29.97 19.41 34.88 6.63 13.86 149.42
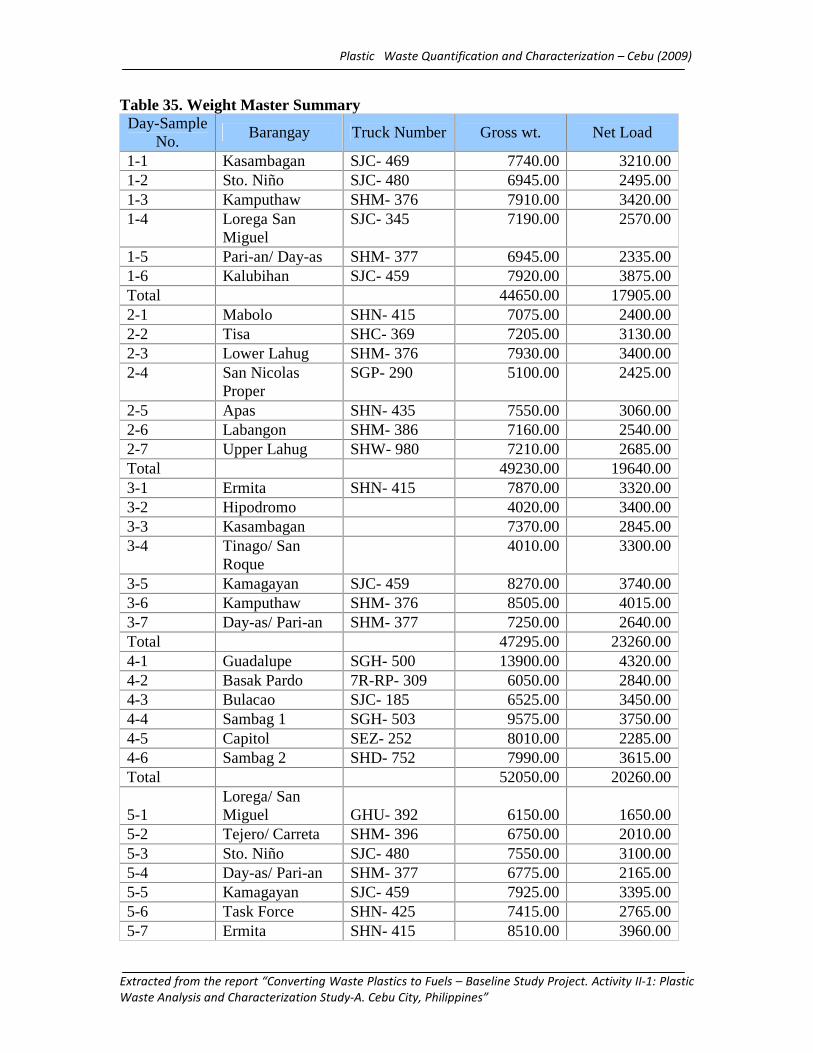
Plastic Waste Quantification and Characterization – Cebu (2009)
Extracted from the report “Converting Waste Plastics to Fuels – Baseline Study Project. Activity II-1: Plastic
Waste Analysis and Characterization Study-A. Cebu City, Philippines”
Table 35. Weight Master Summary Day-Sample
No. Barangay Truck Number Gross wt. Net Load
1-1 Kasambagan SJC- 469 7740.00 3210.00 1-2 Sto. Niño SJC- 480 6945.00 2495.00 1-3 Kamputhaw SHM- 376 7910.00 3420.00 1-4 Lorega San
Miguel SJC- 345 7190.00 2570.00
1-5 Pari-an/ Day-as SHM- 377 6945.00 2335.00 1-6 Kalubihan SJC- 459 7920.00 3875.00 Total 44650.00 17905.00 2-1 Mabolo SHN- 415 7075.00 2400.00 2-2 Tisa SHC- 369 7205.00 3130.00 2-3 Lower Lahug SHM- 376 7930.00 3400.00 2-4 San Nicolas
Proper SGP- 290 5100.00 2425.00
2-5 Apas SHN- 435 7550.00 3060.00 2-6 Labangon SHM- 386 7160.00 2540.00 2-7 Upper Lahug SHW- 980 7210.00 2685.00 Total 49230.00 19640.00 3-1 Ermita SHN- 415 7870.00 3320.00 3-2 Hipodromo 4020.00 3400.00 3-3 Kasambagan 7370.00 2845.00 3-4 Tinago/ San
Roque 4010.00 3300.00
3-5 Kamagayan SJC- 459 8270.00 3740.00 3-6 Kamputhaw SHM- 376 8505.00 4015.00 3-7 Day-as/ Pari-an SHM- 377 7250.00 2640.00 Total 47295.00 23260.00 4-1 Guadalupe SGH- 500 13900.00 4320.00 4-2 Basak Pardo 7R-RP- 309 6050.00 2840.00 4-3 Bulacao SJC- 185 6525.00 3450.00 4-4 Sambag 1 SGH- 503 9575.00 3750.00 4-5 Capitol SEZ- 252 8010.00 2285.00 4-6 Sambag 2 SHD- 752 7990.00 3615.00 Total 52050.00 20260.00
5-1 Lorega/ San Miguel GHU- 392 6150.00 1650.00
5-2 Tejero/ Carreta SHM- 396 6750.00 2010.00 5-3 Sto. Niño SJC- 480 7550.00 3100.00 5-4 Day-as/ Pari-an SHM- 377 6775.00 2165.00 5-5 Kamagayan SJC- 459 7925.00 3395.00 5-6 Task Force SHN- 425 7415.00 2765.00 5-7 Ermita SHN- 415 8510.00 3960.00
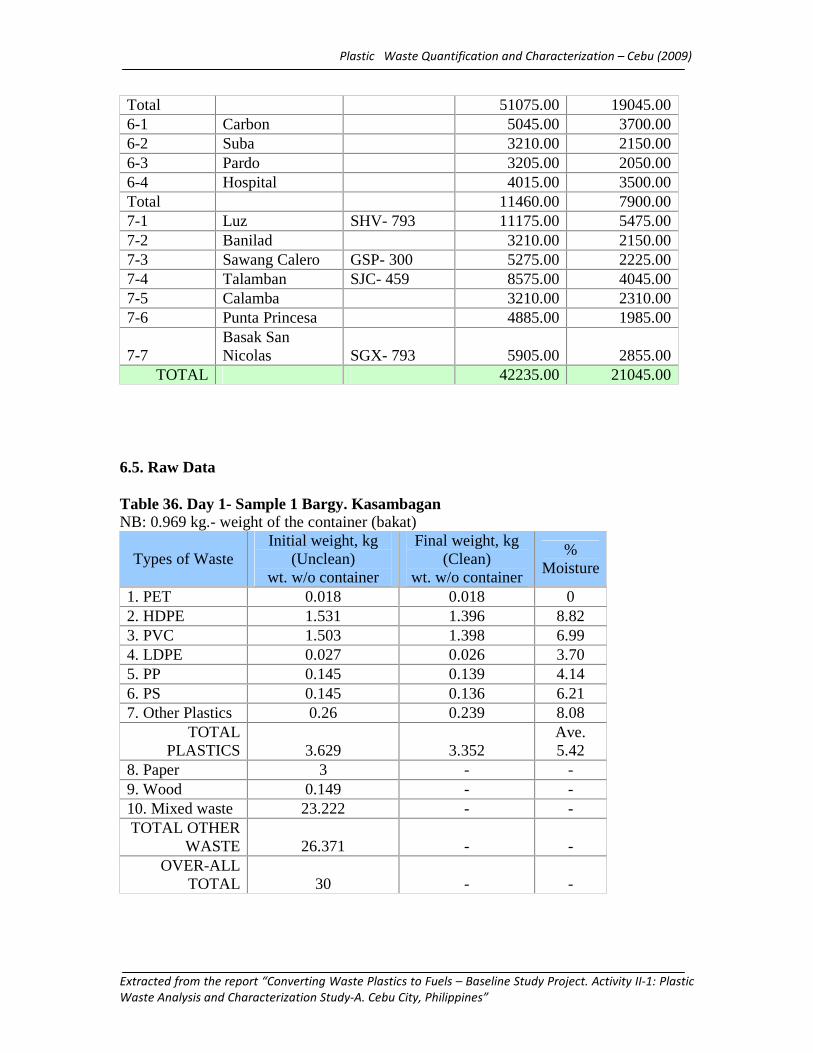
Plastic Waste Quantification and Characterization – Cebu (2009)
Extracted from the report “Converting Waste Plastics to Fuels – Baseline Study Project. Activity II-1: Plastic
Waste Analysis and Characterization Study-A. Cebu City, Philippines”
Total 51075.00 19045.00 6-1 Carbon 5045.00 3700.00 6-2 Suba 3210.00 2150.00 6-3 Pardo 3205.00 2050.00 6-4 Hospital 4015.00 3500.00 Total 11460.00 7900.00 7-1 Luz SHV- 793 11175.00 5475.00 7-2 Banilad 3210.00 2150.00 7-3 Sawang Calero GSP- 300 5275.00 2225.00 7-4 Talamban SJC- 459 8575.00 4045.00 7-5 Calamba 3210.00 2310.00 7-6 Punta Princesa 4885.00 1985.00
7-7 Basak San Nicolas SGX- 793 5905.00 2855.00
TOTAL 42235.00 21045.00 6.5. Raw Data Table 36. Day 1- Sample 1 Bargy. Kasambagan NB: 0.969 kg.- weight of the container (bakat)
Types of Waste Initial weight, kg
(Unclean) wt. w/o container
Final weight, kg (Clean)
wt. w/o container
% Moisture
1. PET 0.018 0.018 0 2. HDPE 1.531 1.396 8.82 3. PVC 1.503 1.398 6.99 4. LDPE 0.027 0.026 3.70 5. PP 0.145 0.139 4.14 6. PS 0.145 0.136 6.21 7. Other Plastics 0.26 0.239 8.08
TOTAL PLASTICS 3.629 3.352
Ave. 5.42
8. Paper 3 - - 9. Wood 0.149 - - 10. Mixed waste 23.222 - - TOTAL OTHER
WASTE 26.371 - - OVER-ALL
TOTAL 30 - -
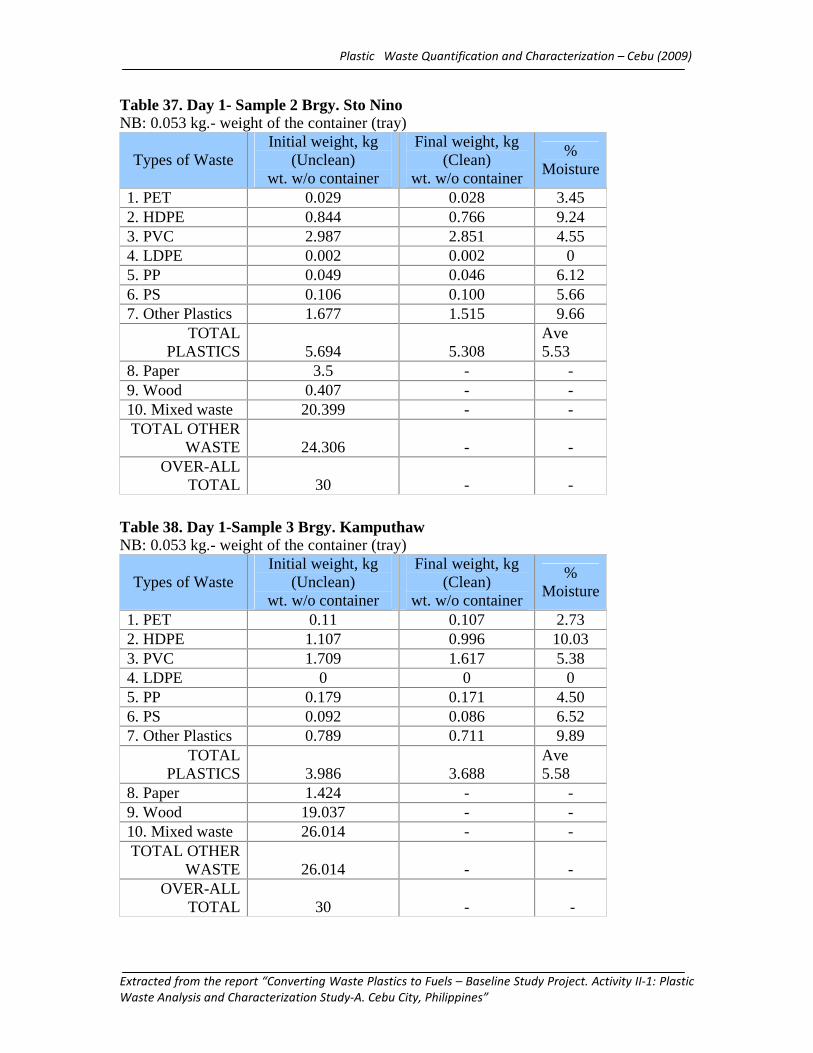
Plastic Waste Quantification and Characterization – Cebu (2009)
Extracted from the report “Converting Waste Plastics to Fuels – Baseline Study Project. Activity II-1: Plastic
Waste Analysis and Characterization Study-A. Cebu City, Philippines”
Table 37. Day 1- Sample 2 Brgy. Sto Nino NB: 0.053 kg.- weight of the container (tray)
Table 38. Day 1-Sample 3 Brgy. Kamputhaw NB: 0.053 kg.- weight of the container (tray)
Types of Waste Initial weight, kg
(Unclean) wt. w/o container
Final weight, kg (Clean)
wt. w/o container
% Moisture
1. PET 0.029 0.028 3.45 2. HDPE 0.844 0.766 9.24 3. PVC 2.987 2.851 4.55 4. LDPE 0.002 0.002 0 5. PP 0.049 0.046 6.12 6. PS 0.106 0.100 5.66 7. Other Plastics 1.677 1.515 9.66
TOTAL PLASTICS 5.694 5.308
Ave 5.53
8. Paper 3.5 - - 9. Wood 0.407 - - 10. Mixed waste 20.399 - - TOTAL OTHER
WASTE 24.306 - - OVER-ALL
TOTAL 30 - -
Types of Waste Initial weight, kg
(Unclean) wt. w/o container
Final weight, kg (Clean)
wt. w/o container
% Moisture
1. PET 0.11 0.107 2.73 2. HDPE 1.107 0.996 10.03 3. PVC 1.709 1.617 5.38 4. LDPE 0 0 0 5. PP 0.179 0.171 4.50 6. PS 0.092 0.086 6.52 7. Other Plastics 0.789 0.711 9.89
TOTAL PLASTICS 3.986 3.688
Ave 5.58
8. Paper 1.424 - - 9. Wood 19.037 - - 10. Mixed waste 26.014 - - TOTAL OTHER
WASTE 26.014 - - OVER-ALL
TOTAL 30 - -
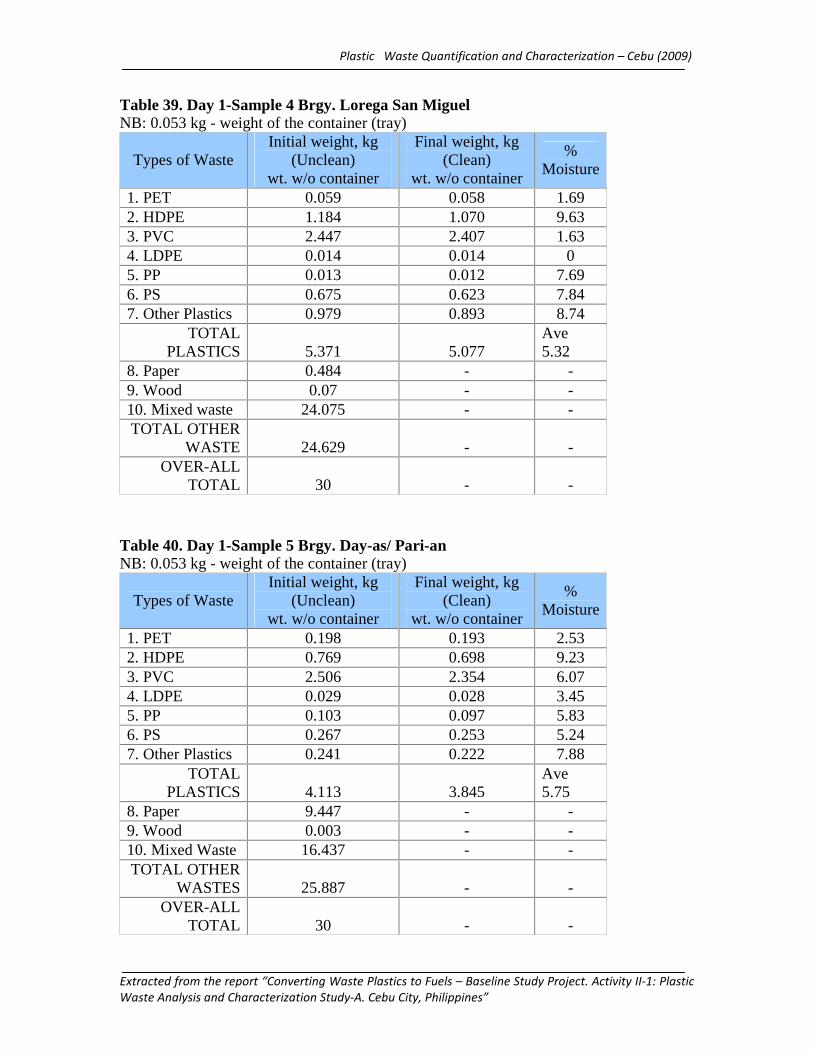
Plastic Waste Quantification and Characterization – Cebu (2009)
Extracted from the report “Converting Waste Plastics to Fuels – Baseline Study Project. Activity II-1: Plastic
Waste Analysis and Characterization Study-A. Cebu City, Philippines”
Table 39. Day 1-Sample 4 Brgy. Lorega San Miguel NB: 0.053 kg - weight of the container (tray)
Table 40. Day 1-Sample 5 Brgy. Day-as/ Pari-an NB: 0.053 kg - weight of the container (tray)
Types of Waste Initial weight, kg
(Unclean) wt. w/o container
Final weight, kg (Clean)
wt. w/o container
% Moisture
1. PET 0.059 0.058 1.69 2. HDPE 1.184 1.070 9.63 3. PVC 2.447 2.407 1.63 4. LDPE 0.014 0.014 0 5. PP 0.013 0.012 7.69 6. PS 0.675 0.623 7.84 7. Other Plastics 0.979 0.893 8.74
TOTAL PLASTICS 5.371 5.077
Ave 5.32
8. Paper 0.484 - - 9. Wood 0.07 - - 10. Mixed waste 24.075 - - TOTAL OTHER
WASTE 24.629 - - OVER-ALL
TOTAL 30 - -
Types of Waste Initial weight, kg
(Unclean) wt. w/o container
Final weight, kg (Clean)
wt. w/o container
% Moisture
1. PET 0.198 0.193 2.53 2. HDPE 0.769 0.698 9.23 3. PVC 2.506 2.354 6.07 4. LDPE 0.029 0.028 3.45 5. PP 0.103 0.097 5.83 6. PS 0.267 0.253 5.24 7. Other Plastics 0.241 0.222 7.88
TOTAL PLASTICS 4.113 3.845
Ave 5.75
8. Paper 9.447 - - 9. Wood 0.003 - - 10. Mixed Waste 16.437 - - TOTAL OTHER
WASTES 25.887 - - OVER-ALL
TOTAL 30 - -
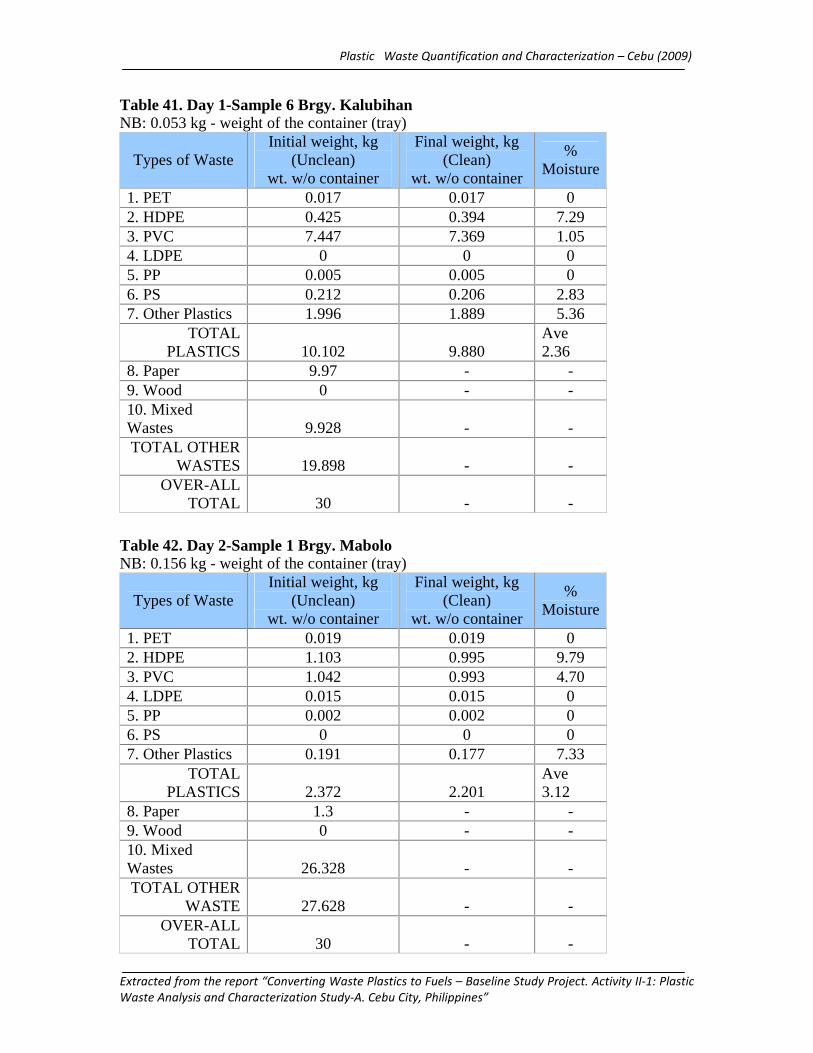
Plastic Waste Quantification and Characterization – Cebu (2009)
Extracted from the report “Converting Waste Plastics to Fuels – Baseline Study Project. Activity II-1: Plastic
Waste Analysis and Characterization Study-A. Cebu City, Philippines”
Table 41. Day 1-Sample 6 Brgy. Kalubihan NB: 0.053 kg - weight of the container (tray)
Table 42. Day 2-Sample 1 Brgy. Mabolo NB: 0.156 kg - weight of the container (tray)
Types of Waste Initial weight, kg
(Unclean) wt. w/o container
Final weight, kg (Clean)
wt. w/o container
% Moisture
1. PET 0.017 0.017 0 2. HDPE 0.425 0.394 7.29 3. PVC 7.447 7.369 1.05 4. LDPE 0 0 0 5. PP 0.005 0.005 0 6. PS 0.212 0.206 2.83 7. Other Plastics 1.996 1.889 5.36
TOTAL PLASTICS 10.102 9.880
Ave 2.36
8. Paper 9.97 - - 9. Wood 0 - - 10. Mixed Wastes 9.928 - - TOTAL OTHER
WASTES 19.898 - - OVER-ALL
TOTAL 30 - -
Types of Waste Initial weight, kg
(Unclean) wt. w/o container
Final weight, kg (Clean)
wt. w/o container
% Moisture
1. PET 0.019 0.019 0 2. HDPE 1.103 0.995 9.79 3. PVC 1.042 0.993 4.70 4. LDPE 0.015 0.015 0 5. PP 0.002 0.002 0 6. PS 0 0 0 7. Other Plastics 0.191 0.177 7.33
TOTAL PLASTICS 2.372 2.201
Ave 3.12
8. Paper 1.3 - - 9. Wood 0 - - 10. Mixed Wastes 26.328 - - TOTAL OTHER
WASTE 27.628 - - OVER-ALL
TOTAL 30 - -

Plastic Waste Quantification and Characterization – Cebu (2009)
Extracted from the report “Converting Waste Plastics to Fuels – Baseline Study Project. Activity II-1: Plastic
Waste Analysis and Characterization Study-A. Cebu City, Philippines”
Table 43. Day 2-Sample 2 Brgy. Tisa NB: 0.021 kg - weight of the container (plastic bag)
Table 44. Day 2-Sample 3 Brgy. Lower Lahug NB: 0.156 kg - weight of the container (tray)
Types of Waste Initial weight, kg
(Unclean) wt. w/o container
Final weight, kg (Clean)
wt. w/o container
% Moisture
1. PET 0.018 0.018 0 2. HDPE 1.919 1.716 10.58 3. PVC 0.235 0.230 2.13 4. LDPE 0 0 0 5. PP 0.107 0.105 1.87 6. PS 0.088 0.088 0 7. Other Plastics 0.476 0.438 7.98
TOTAL PLASTICS 2.843 2.595
Ave 3.22
8. Paper 0.001 - - 9. Wood 0.045 - - 10. Mixed Wastes 27.111 - - TOTAL OTHER
WASTE 27.157 - - OVER-ALL
TOTAL 30 - -
Types of Waste Initial weight, kg
(Unclean) wt. w/o container
Final weight, kg (Clean)
wt. w/o container
% Moisture
1. PET 0.027 0.027 0 2. HDPE 0.021 0.021 0 3. PVC 0 0 0 4. LDPE 0 0 0 5. PP 0.003 0.003 0 6. PS 0 0 0 7. Other Plastics 0.152 0.150 1.32
TOTAL PLASTIC 0.203 0.201
Ave 0.19
8. Paper 0.085 - - 9. Wood 0.006 - - 10. Mixed Wastes 29.706 - - TOTAL OTHER
WASTE 29.797 - - OVER-ALL
TOTAL 30 - -
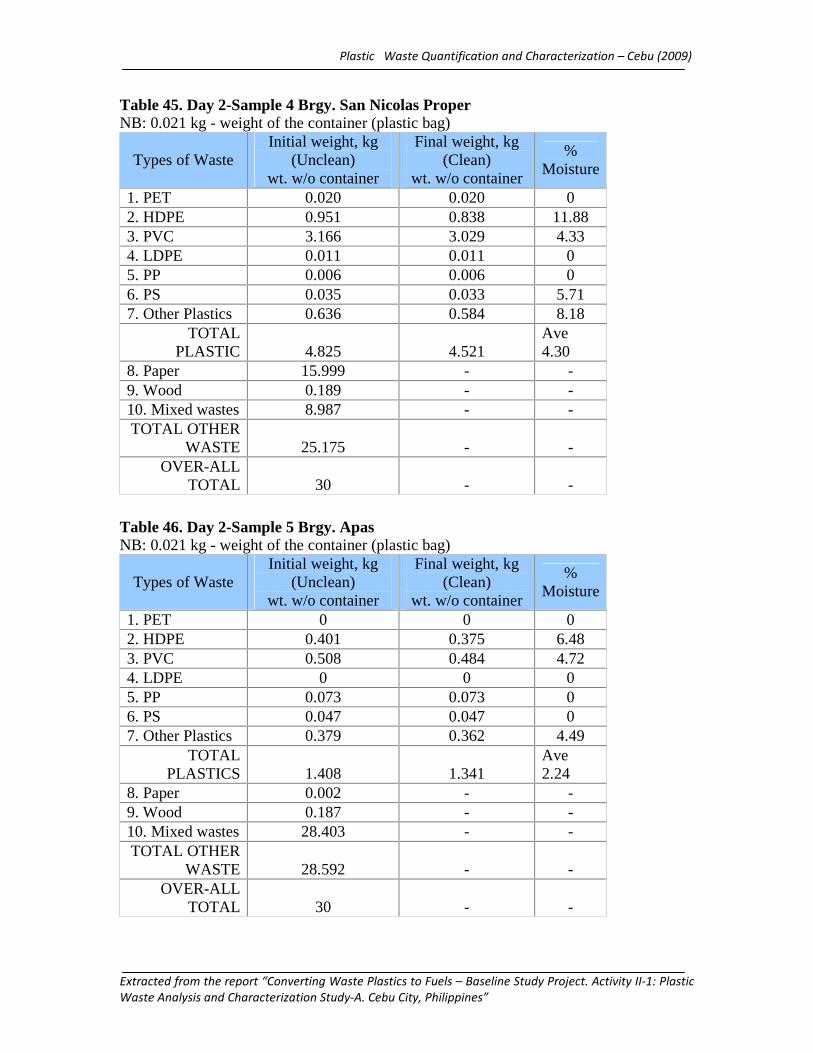
Plastic Waste Quantification and Characterization – Cebu (2009)
Extracted from the report “Converting Waste Plastics to Fuels – Baseline Study Project. Activity II-1: Plastic
Waste Analysis and Characterization Study-A. Cebu City, Philippines”
Table 45. Day 2-Sample 4 Brgy. San Nicolas Proper NB: 0.021 kg - weight of the container (plastic bag)
Table 46. Day 2-Sample 5 Brgy. Apas NB: 0.021 kg - weight of the container (plastic bag)
Types of Waste Initial weight, kg
(Unclean) wt. w/o container
Final weight, kg (Clean)
wt. w/o container
% Moisture
1. PET 0.020 0.020 0 2. HDPE 0.951 0.838 11.88 3. PVC 3.166 3.029 4.33 4. LDPE 0.011 0.011 0 5. PP 0.006 0.006 0 6. PS 0.035 0.033 5.71 7. Other Plastics 0.636 0.584 8.18
TOTAL PLASTIC 4.825 4.521
Ave 4.30
8. Paper 15.999 - - 9. Wood 0.189 - - 10. Mixed wastes 8.987 - - TOTAL OTHER
WASTE 25.175 - - OVER-ALL
TOTAL 30 - -
Types of Waste Initial weight, kg
(Unclean) wt. w/o container
Final weight, kg (Clean)
wt. w/o container
% Moisture
1. PET 0 0 0 2. HDPE 0.401 0.375 6.48 3. PVC 0.508 0.484 4.72 4. LDPE 0 0 0 5. PP 0.073 0.073 0 6. PS 0.047 0.047 0 7. Other Plastics 0.379 0.362 4.49
TOTAL PLASTICS 1.408 1.341
Ave 2.24
8. Paper 0.002 - - 9. Wood 0.187 - - 10. Mixed wastes 28.403 - - TOTAL OTHER
WASTE 28.592 - - OVER-ALL
TOTAL 30 - -
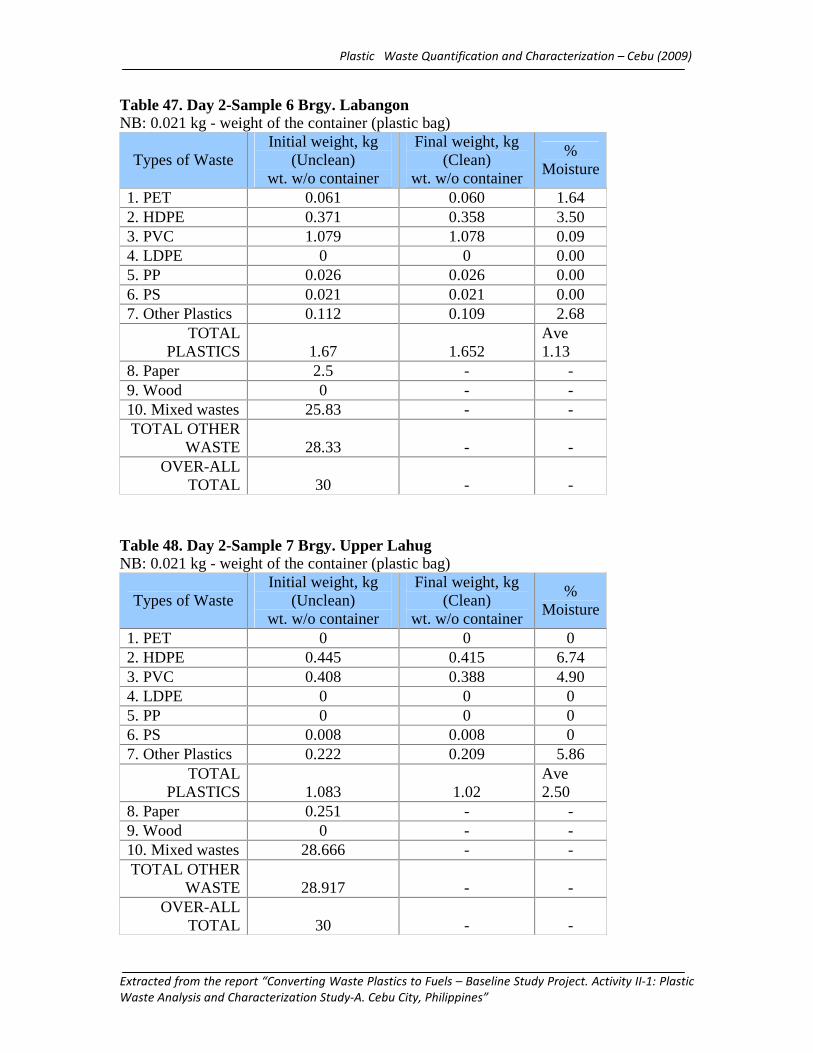
Plastic Waste Quantification and Characterization – Cebu (2009)
Extracted from the report “Converting Waste Plastics to Fuels – Baseline Study Project. Activity II-1: Plastic
Waste Analysis and Characterization Study-A. Cebu City, Philippines”
Table 47. Day 2-Sample 6 Brgy. Labangon NB: 0.021 kg - weight of the container (plastic bag)
Table 48. Day 2-Sample 7 Brgy. Upper Lahug NB: 0.021 kg - weight of the container (plastic bag)
Types of Waste Initial weight, kg
(Unclean) wt. w/o container
Final weight, kg (Clean)
wt. w/o container
% Moisture
1. PET 0.061 0.060 1.64 2. HDPE 0.371 0.358 3.50 3. PVC 1.079 1.078 0.09 4. LDPE 0 0 0.00 5. PP 0.026 0.026 0.00 6. PS 0.021 0.021 0.00 7. Other Plastics 0.112 0.109 2.68
TOTAL PLASTICS 1.67 1.652
Ave 1.13
8. Paper 2.5 - - 9. Wood 0 - - 10. Mixed wastes 25.83 - - TOTAL OTHER
WASTE 28.33 - - OVER-ALL
TOTAL 30 - -
Types of Waste Initial weight, kg
(Unclean) wt. w/o container
Final weight, kg (Clean)
wt. w/o container
% Moisture
1. PET 0 0 0 2. HDPE 0.445 0.415 6.74 3. PVC 0.408 0.388 4.90 4. LDPE 0 0 0 5. PP 0 0 0 6. PS 0.008 0.008 0 7. Other Plastics 0.222 0.209 5.86
TOTAL PLASTICS 1.083 1.02
Ave 2.50
8. Paper 0.251 - - 9. Wood 0 - - 10. Mixed wastes 28.666 - - TOTAL OTHER
WASTE 28.917 - - OVER-ALL
TOTAL 30 - -
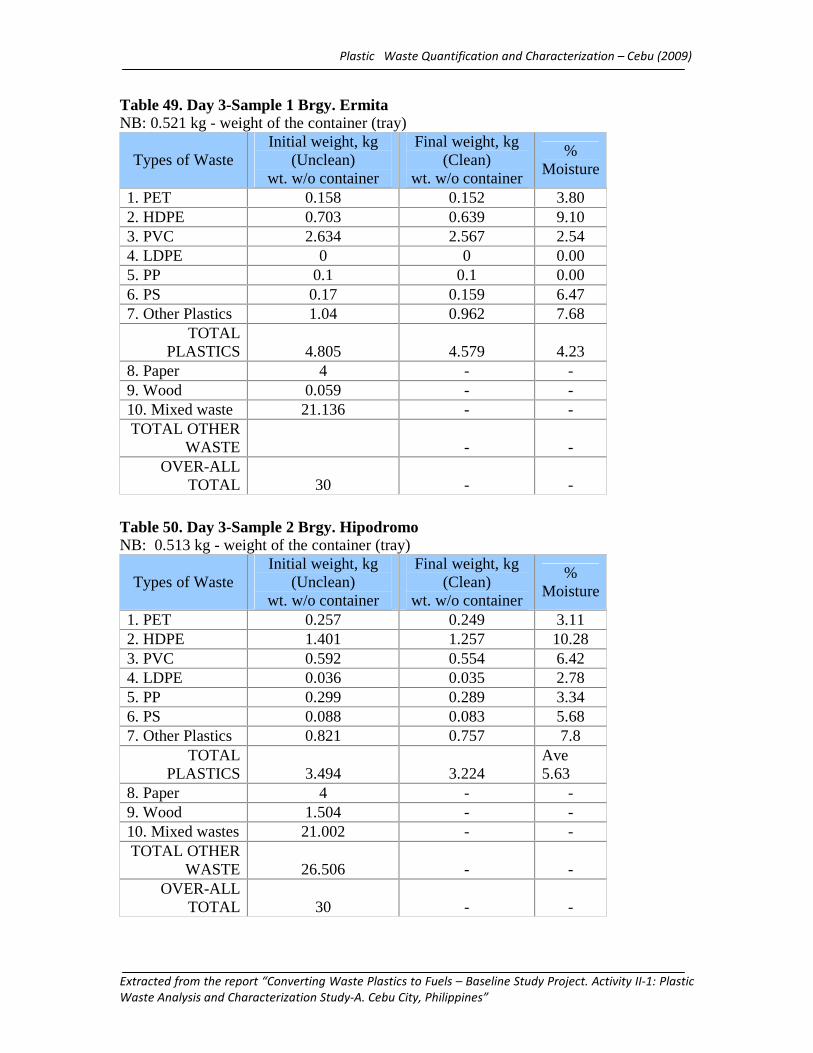
Plastic Waste Quantification and Characterization – Cebu (2009)
Extracted from the report “Converting Waste Plastics to Fuels – Baseline Study Project. Activity II-1: Plastic
Waste Analysis and Characterization Study-A. Cebu City, Philippines”
Table 49. Day 3-Sample 1 Brgy. Ermita NB: 0.521 kg - weight of the container (tray)
Table 50. Day 3-Sample 2 Brgy. Hipodromo NB: 0.513 kg - weight of the container (tray)
Types of Waste Initial weight, kg
(Unclean) wt. w/o container
Final weight, kg (Clean)
wt. w/o container
% Moisture
1. PET 0.158 0.152 3.80 2. HDPE 0.703 0.639 9.10 3. PVC 2.634 2.567 2.54 4. LDPE 0 0 0.00 5. PP 0.1 0.1 0.00 6. PS 0.17 0.159 6.47 7. Other Plastics 1.04 0.962 7.68
TOTAL PLASTICS 4.805 4.579 4.23
8. Paper 4 - - 9. Wood 0.059 - - 10. Mixed waste 21.136 - - TOTAL OTHER
WASTE - - OVER-ALL
TOTAL 30 - -
Types of Waste Initial weight, kg
(Unclean) wt. w/o container
Final weight, kg (Clean)
wt. w/o container
% Moisture
1. PET 0.257 0.249 3.11 2. HDPE 1.401 1.257 10.28 3. PVC 0.592 0.554 6.42 4. LDPE 0.036 0.035 2.78 5. PP 0.299 0.289 3.34 6. PS 0.088 0.083 5.68 7. Other Plastics 0.821 0.757 7.8
TOTAL PLASTICS 3.494 3.224
Ave 5.63
8. Paper 4 - - 9. Wood 1.504 - - 10. Mixed wastes 21.002 - - TOTAL OTHER
WASTE 26.506 - - OVER-ALL
TOTAL 30 - -
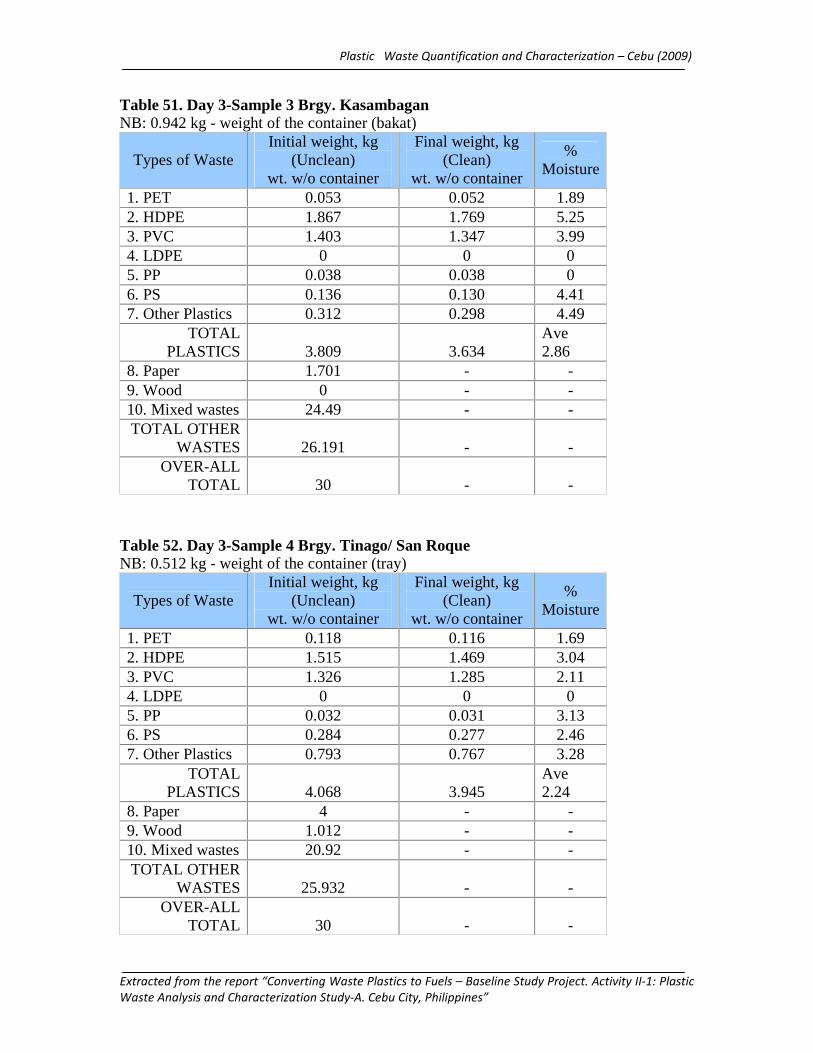
Plastic Waste Quantification and Characterization – Cebu (2009)
Extracted from the report “Converting Waste Plastics to Fuels – Baseline Study Project. Activity II-1: Plastic
Waste Analysis and Characterization Study-A. Cebu City, Philippines”
Table 51. Day 3-Sample 3 Brgy. Kasambagan NB: 0.942 kg - weight of the container (bakat)
Table 52. Day 3-Sample 4 Brgy. Tinago/ San Roque NB: 0.512 kg - weight of the container (tray)
Types of Waste Initial weight, kg
(Unclean) wt. w/o container
Final weight, kg (Clean)
wt. w/o container
% Moisture
1. PET 0.053 0.052 1.89 2. HDPE 1.867 1.769 5.25 3. PVC 1.403 1.347 3.99 4. LDPE 0 0 0 5. PP 0.038 0.038 0 6. PS 0.136 0.130 4.41 7. Other Plastics 0.312 0.298 4.49
TOTAL PLASTICS 3.809 3.634
Ave 2.86
8. Paper 1.701 - - 9. Wood 0 - - 10. Mixed wastes 24.49 - - TOTAL OTHER
WASTES 26.191 - - OVER-ALL
TOTAL 30 - -
Types of Waste Initial weight, kg
(Unclean) wt. w/o container
Final weight, kg (Clean)
wt. w/o container
% Moisture
1. PET 0.118 0.116 1.69 2. HDPE 1.515 1.469 3.04 3. PVC 1.326 1.285 2.11 4. LDPE 0 0 0 5. PP 0.032 0.031 3.13 6. PS 0.284 0.277 2.46 7. Other Plastics 0.793 0.767 3.28
TOTAL PLASTICS 4.068 3.945
Ave 2.24
8. Paper 4 - - 9. Wood 1.012 - - 10. Mixed wastes 20.92 - - TOTAL OTHER
WASTES 25.932 - - OVER-ALL
TOTAL 30 - -

Plastic Waste Quantification and Characterization – Cebu (2009)
Extracted from the report “Converting Waste Plastics to Fuels – Baseline Study Project. Activity II-1: Plastic
Waste Analysis and Characterization Study-A. Cebu City, Philippines”
Table 53. Day 3-Sample 5 Brgy. Kamagayan NB: 0.518 kg - weight of the container (tray)
Table 54. Day 3-Sample 6 Brgy. Kamputhaw NB: 0.566 kg. - weight of the container (tray)
Types of Waste Initial weight, kg
(Unclean) wt. w/o container
Final weight, kg (Clean)
wt. w/o container
% Moisture
1. PET 0.121 0.119 1.65 2. HDPE 0.392 0.359 8.42 3. PVC 0.009 0.009 0 4. LDPE 0 0 0 5. PP 0.008 0.008 0 6. PS 0.208 0.196 5.77 7. Other Plastics 7.970 7.337 7.94
TOTAL PLASTICS 8.708 8.028
Ave 3.40
8. Paper 14.392 - - 9. Wood 0 - - 10. Mixed wasteS 6.9 - - TOTAL OTHER
WASTES 21.292 - - OVER-ALL
TOTAL 30 - -
Types of Waste Initial weight, kg
(Unclean) wt. w/o container
Final weight, kg (Clean)
wt. w/o container
% Moisture
1. PET 0.376 0.359 4.52 2. HDPE 0.785 0.692 11.85 3. PVC 0.824 0.769 6.67 4. LDPE 0.035 0.035 0 5. PP 0.079 0.075 5.06 6. PS 0.33 0.32 3.03 7. Other Plastics 0.286 0.267 6.64
TOTAL PLASTICS 2.715 2.517
Ave 5.40
8. Paper 20.38 - - 9. Wood 0 - - 10. Mixed wasteS 6.905 - - TOTAL OTHER
WASTES 27.285 - - OVER-ALL
TOTAL 30 - -
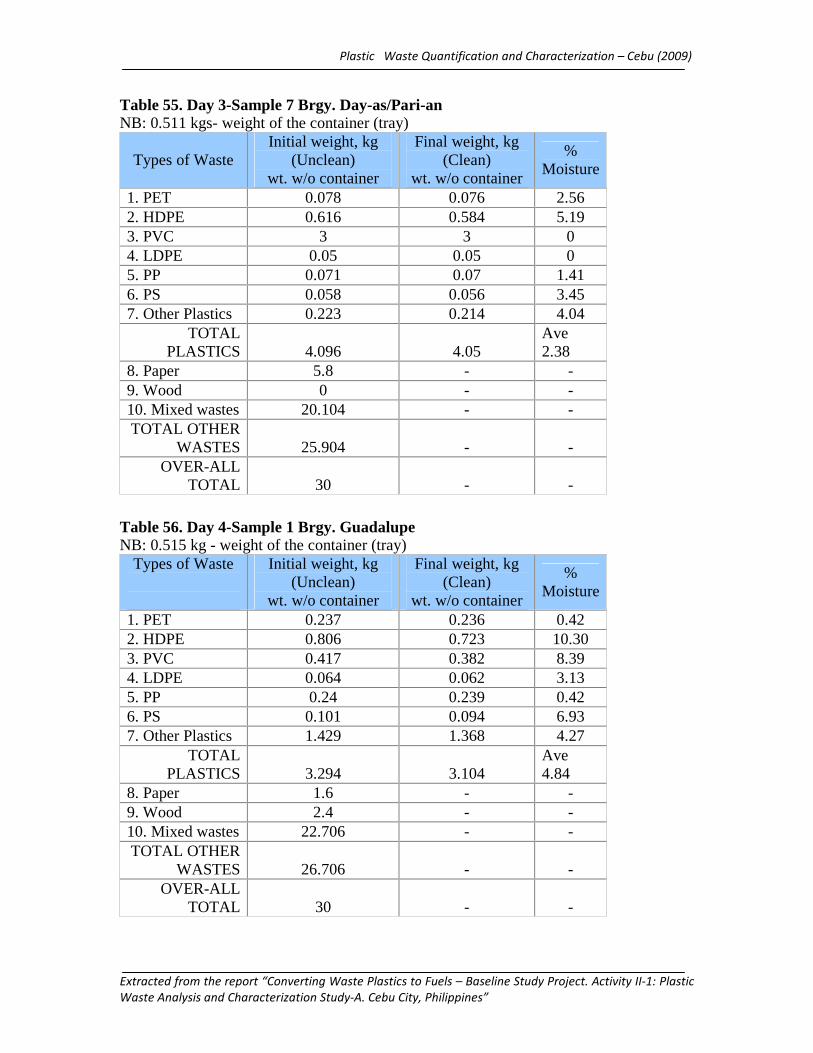
Plastic Waste Quantification and Characterization – Cebu (2009)
Extracted from the report “Converting Waste Plastics to Fuels – Baseline Study Project. Activity II-1: Plastic
Waste Analysis and Characterization Study-A. Cebu City, Philippines”
Table 55. Day 3-Sample 7 Brgy. Day-as/Pari-an NB: 0.511 kgs- weight of the container (tray)
Table 56. Day 4-Sample 1 Brgy. Guadalupe NB: 0.515 kg - weight of the container (tray)
Types of Waste Initial weight, kg
(Unclean) wt. w/o container
Final weight, kg (Clean)
wt. w/o container
% Moisture
1. PET 0.078 0.076 2.56 2. HDPE 0.616 0.584 5.19 3. PVC 3 3 0 4. LDPE 0.05 0.05 0 5. PP 0.071 0.07 1.41 6. PS 0.058 0.056 3.45 7. Other Plastics 0.223 0.214 4.04
TOTAL PLASTICS 4.096 4.05
Ave 2.38
8. Paper 5.8 - - 9. Wood 0 - - 10. Mixed wastes 20.104 - - TOTAL OTHER
WASTES 25.904 - - OVER-ALL
TOTAL 30 - -
Types of Waste
Initial weight, kg (Unclean)
wt. w/o container
Final weight, kg (Clean)
wt. w/o container
% Moisture
1. PET 0.237 0.236 0.42 2. HDPE 0.806 0.723 10.30 3. PVC 0.417 0.382 8.39 4. LDPE 0.064 0.062 3.13 5. PP 0.24 0.239 0.42 6. PS 0.101 0.094 6.93 7. Other Plastics 1.429 1.368 4.27
TOTAL PLASTICS 3.294 3.104
Ave 4.84
8. Paper 1.6 - - 9. Wood 2.4 - - 10. Mixed wastes 22.706 - - TOTAL OTHER
WASTES 26.706 - - OVER-ALL
TOTAL 30 - -
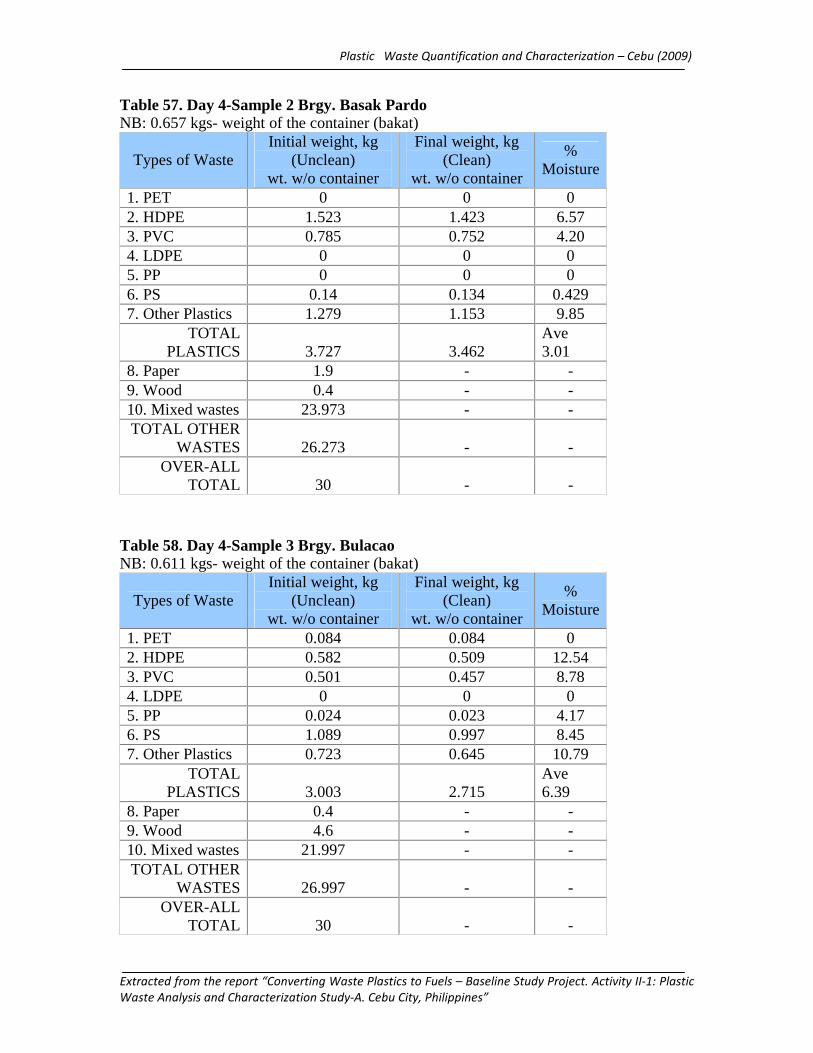
Plastic Waste Quantification and Characterization – Cebu (2009)
Extracted from the report “Converting Waste Plastics to Fuels – Baseline Study Project. Activity II-1: Plastic
Waste Analysis and Characterization Study-A. Cebu City, Philippines”
Table 57. Day 4-Sample 2 Brgy. Basak Pardo NB: 0.657 kgs- weight of the container (bakat)
Table 58. Day 4-Sample 3 Brgy. Bulacao NB: 0.611 kgs- weight of the container (bakat)
Types of Waste Initial weight, kg
(Unclean) wt. w/o container
Final weight, kg (Clean)
wt. w/o container
% Moisture
1. PET 0 0 0 2. HDPE 1.523 1.423 6.57 3. PVC 0.785 0.752 4.20 4. LDPE 0 0 0 5. PP 0 0 0 6. PS 0.14 0.134 0.429 7. Other Plastics 1.279 1.153 9.85
TOTAL PLASTICS 3.727 3.462
Ave 3.01
8. Paper 1.9 - - 9. Wood 0.4 - - 10. Mixed wastes 23.973 - - TOTAL OTHER
WASTES 26.273 - - OVER-ALL
TOTAL 30 - -
Types of Waste Initial weight, kg
(Unclean) wt. w/o container
Final weight, kg (Clean)
wt. w/o container
% Moisture
1. PET 0.084 0.084 0 2. HDPE 0.582 0.509 12.54 3. PVC 0.501 0.457 8.78 4. LDPE 0 0 0 5. PP 0.024 0.023 4.17 6. PS 1.089 0.997 8.45 7. Other Plastics 0.723 0.645 10.79
TOTAL PLASTICS 3.003 2.715
Ave 6.39
8. Paper 0.4 - - 9. Wood 4.6 - - 10. Mixed wastes 21.997 - - TOTAL OTHER
WASTES 26.997 - - OVER-ALL
TOTAL 30 - -
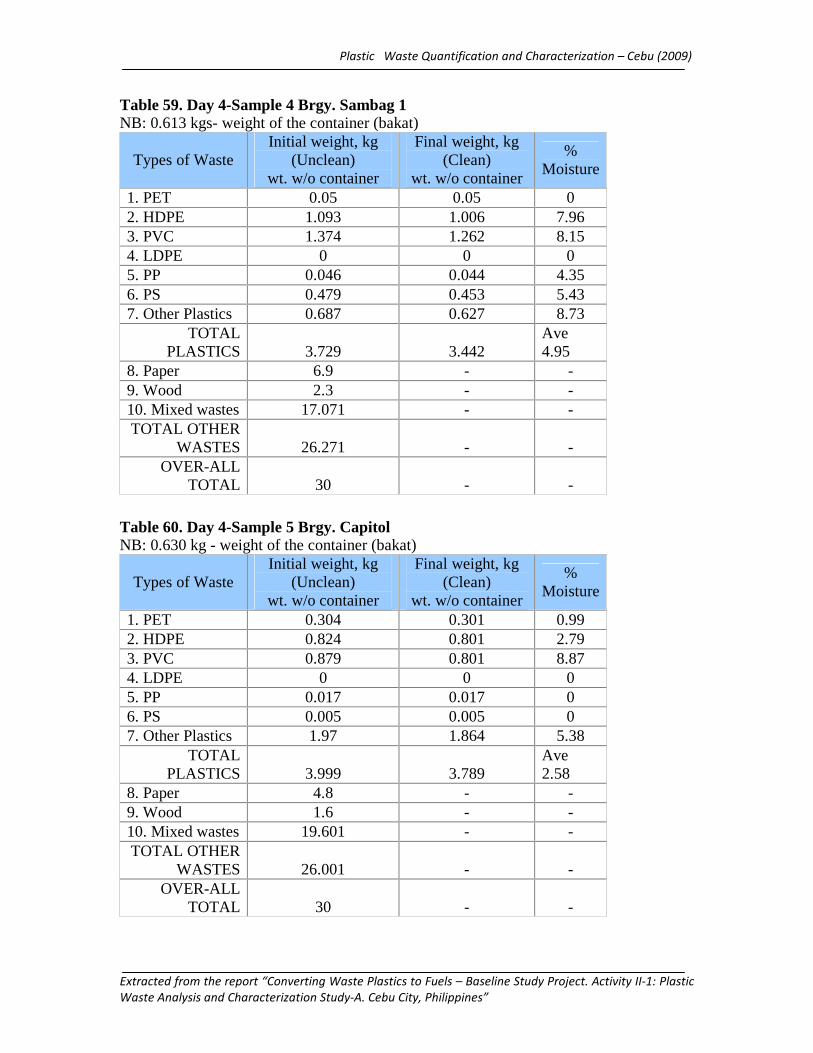
Plastic Waste Quantification and Characterization – Cebu (2009)
Extracted from the report “Converting Waste Plastics to Fuels – Baseline Study Project. Activity II-1: Plastic
Waste Analysis and Characterization Study-A. Cebu City, Philippines”
Table 59. Day 4-Sample 4 Brgy. Sambag 1 NB: 0.613 kgs- weight of the container (bakat)
Table 60. Day 4-Sample 5 Brgy. Capitol NB: 0.630 kg - weight of the container (bakat)
Types of Waste Initial weight, kg
(Unclean) wt. w/o container
Final weight, kg (Clean)
wt. w/o container
% Moisture
1. PET 0.05 0.05 0 2. HDPE 1.093 1.006 7.96 3. PVC 1.374 1.262 8.15 4. LDPE 0 0 0 5. PP 0.046 0.044 4.35 6. PS 0.479 0.453 5.43 7. Other Plastics 0.687 0.627 8.73
TOTAL PLASTICS 3.729 3.442
Ave 4.95
8. Paper 6.9 - - 9. Wood 2.3 - - 10. Mixed wastes 17.071 - - TOTAL OTHER
WASTES 26.271 - - OVER-ALL
TOTAL 30 - -
Types of Waste Initial weight, kg
(Unclean) wt. w/o container
Final weight, kg (Clean)
wt. w/o container
% Moisture
1. PET 0.304 0.301 0.99 2. HDPE 0.824 0.801 2.79 3. PVC 0.879 0.801 8.87 4. LDPE 0 0 0 5. PP 0.017 0.017 0 6. PS 0.005 0.005 0 7. Other Plastics 1.97 1.864 5.38
TOTAL PLASTICS 3.999 3.789
Ave 2.58
8. Paper 4.8 - - 9. Wood 1.6 - - 10. Mixed wastes 19.601 - - TOTAL OTHER
WASTES 26.001 - - OVER-ALL
TOTAL 30 - -
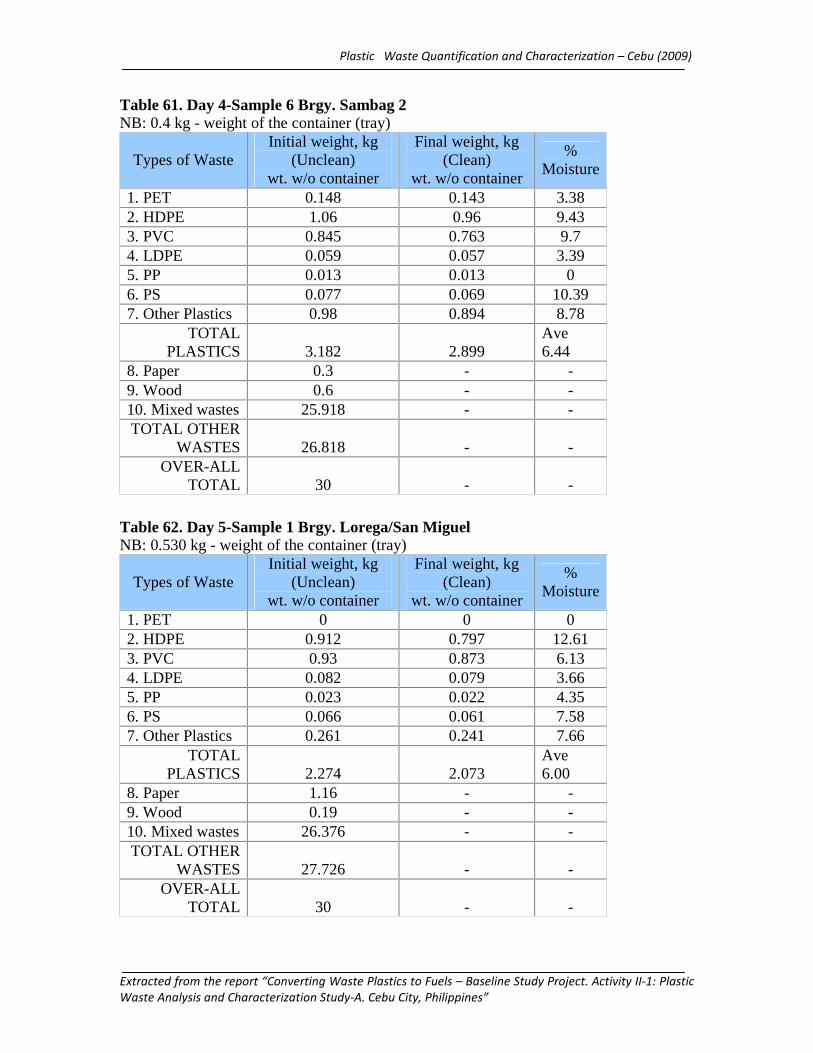
Plastic Waste Quantification and Characterization – Cebu (2009)
Extracted from the report “Converting Waste Plastics to Fuels – Baseline Study Project. Activity II-1: Plastic
Waste Analysis and Characterization Study-A. Cebu City, Philippines”
Table 61. Day 4-Sample 6 Brgy. Sambag 2 NB: 0.4 kg - weight of the container (tray)
Table 62. Day 5-Sample 1 Brgy. Lorega/San Miguel NB: 0.530 kg - weight of the container (tray)
Types of Waste Initial weight, kg
(Unclean) wt. w/o container
Final weight, kg (Clean)
wt. w/o container
% Moisture
1. PET 0.148 0.143 3.38 2. HDPE 1.06 0.96 9.43 3. PVC 0.845 0.763 9.7 4. LDPE 0.059 0.057 3.39 5. PP 0.013 0.013 0 6. PS 0.077 0.069 10.39 7. Other Plastics 0.98 0.894 8.78
TOTAL PLASTICS 3.182 2.899
Ave 6.44
8. Paper 0.3 - - 9. Wood 0.6 - - 10. Mixed wastes 25.918 - - TOTAL OTHER
WASTES 26.818 - - OVER-ALL
TOTAL 30 - -
Types of Waste Initial weight, kg
(Unclean) wt. w/o container
Final weight, kg (Clean)
wt. w/o container
% Moisture
1. PET 0 0 0 2. HDPE 0.912 0.797 12.61 3. PVC 0.93 0.873 6.13 4. LDPE 0.082 0.079 3.66 5. PP 0.023 0.022 4.35 6. PS 0.066 0.061 7.58 7. Other Plastics 0.261 0.241 7.66
TOTAL PLASTICS 2.274 2.073
Ave 6.00
8. Paper 1.16 - - 9. Wood 0.19 - - 10. Mixed wastes 26.376 - - TOTAL OTHER
WASTES 27.726 - - OVER-ALL
TOTAL 30 - -

Plastic Waste Quantification and Characterization – Cebu (2009)
Extracted from the report “Converting Waste Plastics to Fuels – Baseline Study Project. Activity II-1: Plastic
Waste Analysis and Characterization Study-A. Cebu City, Philippines”
Table 63. Day 5-Sample 2 Brgy. Tejero/Carreta NB: 0.530 kg - weight of the container (tray)
Table 64. Day 5-Sample 3 Brgy. Sto Nino NB: 0.530 kg - weight of the container (tray)
Types of Waste Initial weight, kg
(Unclean) wt. w/o container
Final weight, kg (Clean)
wt. w/o container
% Moisture
1. PET 0 0 0 2. HDPE 0.505 0.454 10.10 3. PVC 0.815 0.742 8.96 4. LDPE 0 0 0 5. PP 0.109 0.104 4.59 6. PS 0.264 0.243 7.95 7. Other Plastics 0.928 0.847 8.73
TOTAL PLASTICS 2.621 2.39
Ave 5.76
8. Paper 3.494 - - 9. Wood 0.141 - - 10. Mixed wastes 23.744 - - TOTAL OTHER
WASTES 27.379 - - OVER-ALL
TOTAL 30 - -
Types of Waste Initial weight, kg
(Unclean) wt. w/o container
Final weight, kg (Clean)
wt. w/o container
% Moisture
1. PET 0.1 0.1 0 2. HDPE 0.714 0.653 8.54 3. PVC 1.66 1.54 7.23 4. LDPE 0 0 0 5. PP 0.007 0.007 0 6. PS 1.538 1.473 4.23 7. Other Plastics 1.12 1.064 5
TOTAL PLASTICS 5.139 4.837
Ave 3.57
8. Paper 2.477 - - 9. Wood 0.944 - - 10. Mixed wastes 21.44 - - TOTAL OTHER
WASTES 24.861 - - OVER-ALL
TOTAL 30 - -
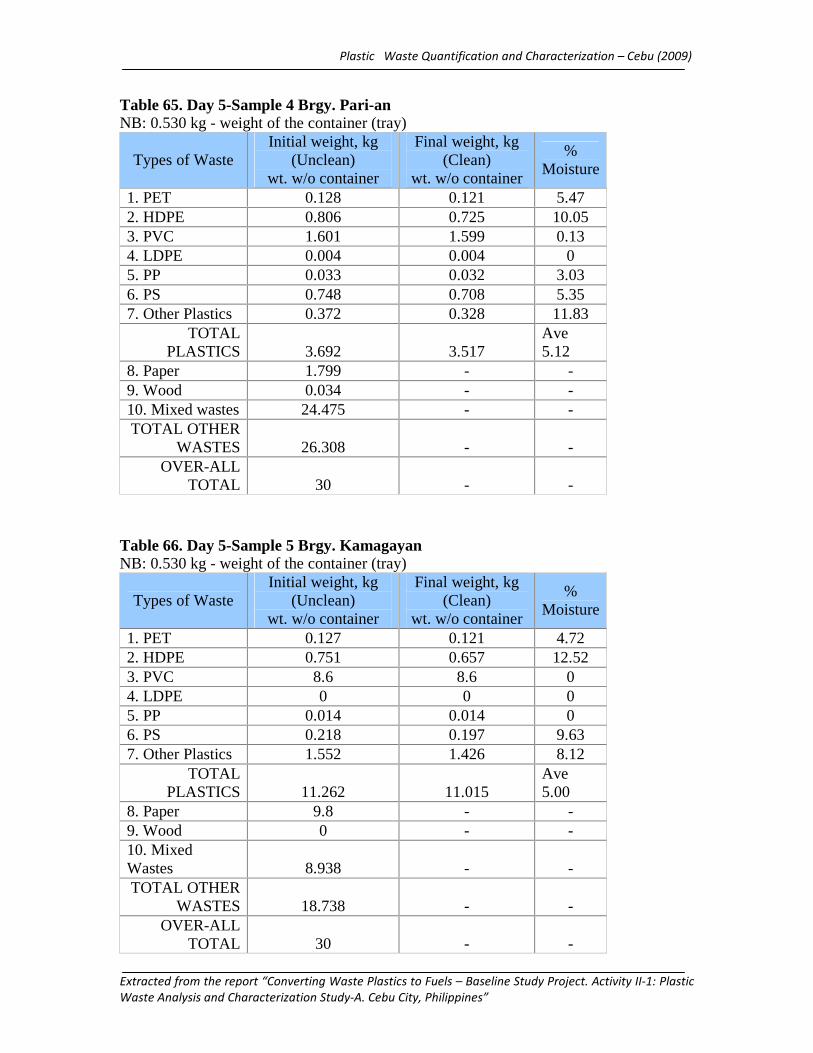
Plastic Waste Quantification and Characterization – Cebu (2009)
Extracted from the report “Converting Waste Plastics to Fuels – Baseline Study Project. Activity II-1: Plastic
Waste Analysis and Characterization Study-A. Cebu City, Philippines”
Table 65. Day 5-Sample 4 Brgy. Pari-an NB: 0.530 kg - weight of the container (tray)
Table 66. Day 5-Sample 5 Brgy. Kamagayan NB: 0.530 kg - weight of the container (tray)
Types of Waste Initial weight, kg
(Unclean) wt. w/o container
Final weight, kg (Clean)
wt. w/o container
% Moisture
1. PET 0.128 0.121 5.47 2. HDPE 0.806 0.725 10.05 3. PVC 1.601 1.599 0.13 4. LDPE 0.004 0.004 0 5. PP 0.033 0.032 3.03 6. PS 0.748 0.708 5.35 7. Other Plastics 0.372 0.328 11.83
TOTAL PLASTICS 3.692 3.517
Ave 5.12
8. Paper 1.799 - - 9. Wood 0.034 - - 10. Mixed wastes 24.475 - - TOTAL OTHER
WASTES 26.308 - - OVER-ALL
TOTAL 30 - -
Types of Waste Initial weight, kg
(Unclean) wt. w/o container
Final weight, kg (Clean)
wt. w/o container
% Moisture
1. PET 0.127 0.121 4.72 2. HDPE 0.751 0.657 12.52 3. PVC 8.6 8.6 0 4. LDPE 0 0 0 5. PP 0.014 0.014 0 6. PS 0.218 0.197 9.63 7. Other Plastics 1.552 1.426 8.12
TOTAL PLASTICS 11.262 11.015
Ave 5.00
8. Paper 9.8 - - 9. Wood 0 - - 10. Mixed Wastes 8.938 - - TOTAL OTHER
WASTES 18.738 - - OVER-ALL
TOTAL 30 - -

Plastic Waste Quantification and Characterization – Cebu (2009)
Extracted from the report “Converting Waste Plastics to Fuels – Baseline Study Project. Activity II-1: Plastic
Waste Analysis and Characterization Study-A. Cebu City, Philippines”
Table 67. Day 5-Sample 6 Task Force NB: 0.530 kg - weight of the container (tray)
Table 68. Day 5-Sample 7 Brgy. Ermita NB: Note: 0.530 kg - weight of the container (tray)
Types of Waste Initial weight, kg
(Unclean) wt. w/o container
Final weight, kg (Clean)
wt. w/o container
% Moisture
1. PET 0.093 0.089 4.30 2. HDPE 1.152 1.034 10.24 3. PVC 1.538 1.459 5.14 4. LDPE 0 0 0 5. PP 0.009 0.009 0 6. PS 0.495 0.472 4.65 7. Other Plastics 0.864 0.75 13.19
TOTAL PLASTICS 4.151 3.813
Ave 5.36
8. Paper 3.8 - - 9. Wood 0 - - 10. Mixed Wastes 22.049 - - TOTAL OTHER
WASTES 25.849 - - OVER-ALL
TOTAL 30 - -
Types of Waste Initial weight, kg
(Unclean) wt. w/o container
Final weight, kg (Clean)
wt. w/o container
% Moisture
1. PET 0.143 0.139 2.80 2. HDPE 0.505 0.465 7.92 3. PVC 1.794 1.706 4.91 4. LDPE 0 0 0 5. PP 0.02 0.02 0 6. PS 0.081 0.078 3.70 7. Other Plastics 5.183 4.829 6.83
TOTAL PLASTICS 7.726 7.237
Ave 3.74
8. Paper 13 - - 9. Wood 0 - - 10. Mixed Wastes 9.274 - - TOTAL OTHER
WASTES 22.274 - - OVER-ALL
TOTAL 30 - -
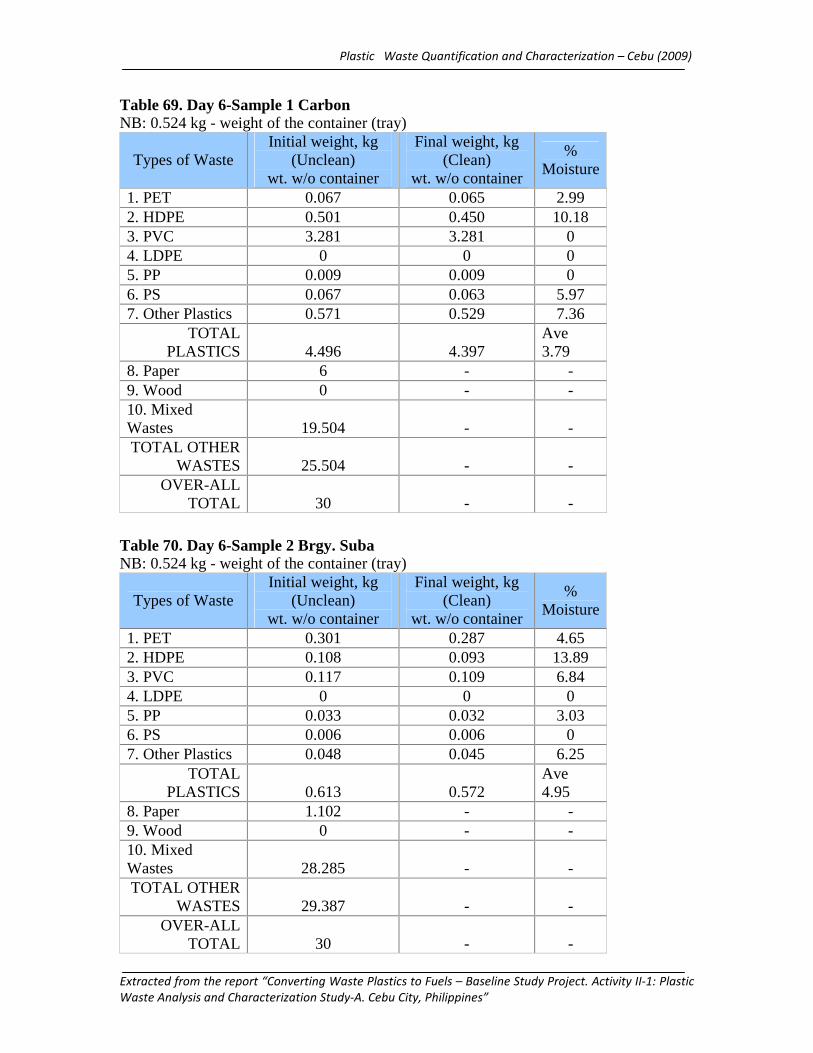
Plastic Waste Quantification and Characterization – Cebu (2009)
Extracted from the report “Converting Waste Plastics to Fuels – Baseline Study Project. Activity II-1: Plastic
Waste Analysis and Characterization Study-A. Cebu City, Philippines”
Table 69. Day 6-Sample 1 Carbon NB: 0.524 kg - weight of the container (tray)
Table 70. Day 6-Sample 2 Brgy. Suba NB: 0.524 kg - weight of the container (tray)
Types of Waste Initial weight, kg
(Unclean) wt. w/o container
Final weight, kg (Clean)
wt. w/o container
% Moisture
1. PET 0.067 0.065 2.99 2. HDPE 0.501 0.450 10.18 3. PVC 3.281 3.281 0 4. LDPE 0 0 0 5. PP 0.009 0.009 0 6. PS 0.067 0.063 5.97 7. Other Plastics 0.571 0.529 7.36
TOTAL PLASTICS 4.496 4.397
Ave 3.79
8. Paper 6 - - 9. Wood 0 - - 10. Mixed Wastes 19.504 - - TOTAL OTHER
WASTES 25.504 - - OVER-ALL
TOTAL 30 - -
Types of Waste Initial weight, kg
(Unclean) wt. w/o container
Final weight, kg (Clean)
wt. w/o container
% Moisture
1. PET 0.301 0.287 4.65 2. HDPE 0.108 0.093 13.89 3. PVC 0.117 0.109 6.84 4. LDPE 0 0 0 5. PP 0.033 0.032 3.03 6. PS 0.006 0.006 0 7. Other Plastics 0.048 0.045 6.25
TOTAL PLASTICS 0.613 0.572
Ave 4.95
8. Paper 1.102 - - 9. Wood 0 - - 10. Mixed Wastes 28.285 - - TOTAL OTHER
WASTES 29.387 - - OVER-ALL
TOTAL 30 - -
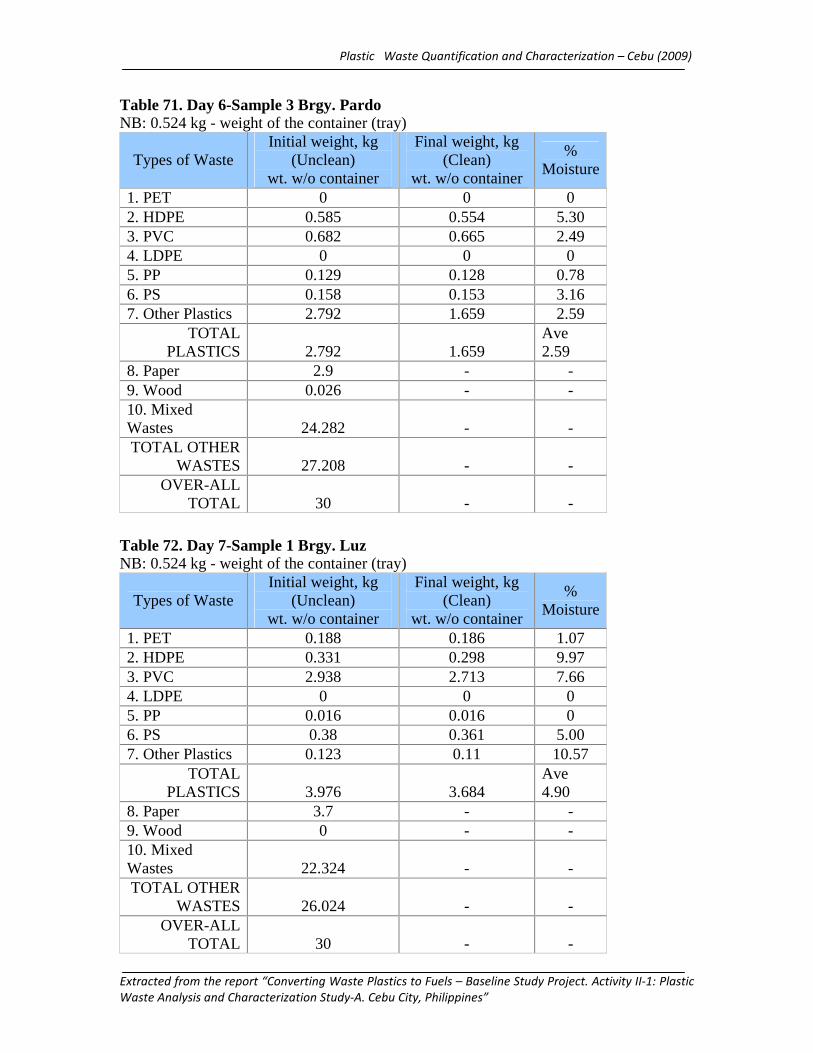
Plastic Waste Quantification and Characterization – Cebu (2009)
Extracted from the report “Converting Waste Plastics to Fuels – Baseline Study Project. Activity II-1: Plastic
Waste Analysis and Characterization Study-A. Cebu City, Philippines”
Table 71. Day 6-Sample 3 Brgy. Pardo NB: 0.524 kg - weight of the container (tray)
Table 72. Day 7-Sample 1 Brgy. Luz NB: 0.524 kg - weight of the container (tray)
Types of Waste Initial weight, kg
(Unclean) wt. w/o container
Final weight, kg (Clean)
wt. w/o container
% Moisture
1. PET 0 0 0 2. HDPE 0.585 0.554 5.30 3. PVC 0.682 0.665 2.49 4. LDPE 0 0 0 5. PP 0.129 0.128 0.78 6. PS 0.158 0.153 3.16 7. Other Plastics 2.792 1.659 2.59
TOTAL PLASTICS 2.792 1.659
Ave 2.59
8. Paper 2.9 - - 9. Wood 0.026 - - 10. Mixed Wastes 24.282 - - TOTAL OTHER
WASTES 27.208 - - OVER-ALL
TOTAL 30 - -
Types of Waste Initial weight, kg
(Unclean) wt. w/o container
Final weight, kg (Clean)
wt. w/o container
% Moisture
1. PET 0.188 0.186 1.07 2. HDPE 0.331 0.298 9.97 3. PVC 2.938 2.713 7.66 4. LDPE 0 0 0 5. PP 0.016 0.016 0 6. PS 0.38 0.361 5.00 7. Other Plastics 0.123 0.11 10.57
TOTAL PLASTICS 3.976 3.684
Ave 4.90
8. Paper 3.7 - - 9. Wood 0 - - 10. Mixed Wastes 22.324 - - TOTAL OTHER
WASTES 26.024 - - OVER-ALL
TOTAL 30 - -

Plastic Waste Quantification and Characterization – Cebu (2009)
Extracted from the report “Converting Waste Plastics to Fuels – Baseline Study Project. Activity II-1: Plastic
Waste Analysis and Characterization Study-A. Cebu City, Philippines”
Table 73. Day 7-Sample 2 Brgy. Banilad NB: 0.524 kg - weight of the container (tray)
Table 74. Day 7-Sample 3 Brgy. Sawang Calero NB: 0.524 kg - weight of the container (tray)
Types of Waste Initial weight, kg
(Unclean) wt. w/o container
Final weight, kg (Clean)
wt. w/o container
% Moisture
1. PET 0.161 0.156 3.11 2. HDPE 0.352 0.312 11.36 3. PVC 0.054 0.046 7.41 4. LDPE 0.011 0.011 0 5. PP 0.023 0.022 4.35 6. PS 0.17 0.159 6.47 7. Other Plastics 0.126 0.12 4.76
TOTAL PLASTICS 0.897 0.826
Ave 5.35
8. Paper 0.5 - - 9. Wood 0.067 - - 10. Mixed Wastes 28.536 - - TOTAL OTHER
WASTES 29.103 - - OVER-ALL
TOTAL 30 - -
Types of Waste Initial weight, kg
(Unclean) wt. w/o container
Final weight, kg (Clean)
wt. w/o container
% Moisture
1. PET 0.078 0.078 0 2. HDPE 0.259 0.235 9.27 3. PVC 0.385 0.353 8.31 4. LDPE 0 0 0 5. PP 0.012 0.012 0 6. PS 0.136 0.132 2.94 7. Other Plastics 0.236 0.209 11.44
TOTAL PLASTICS 1.106 1.019
Ave 4.57
8. Paper 1.9 - - 9. Wood 0.282 - - 10. Mixed Wastes 26.712 - - TOTAL OTHER
WASTES 28.894 - - OVER-ALL
TOTAL 30 - -
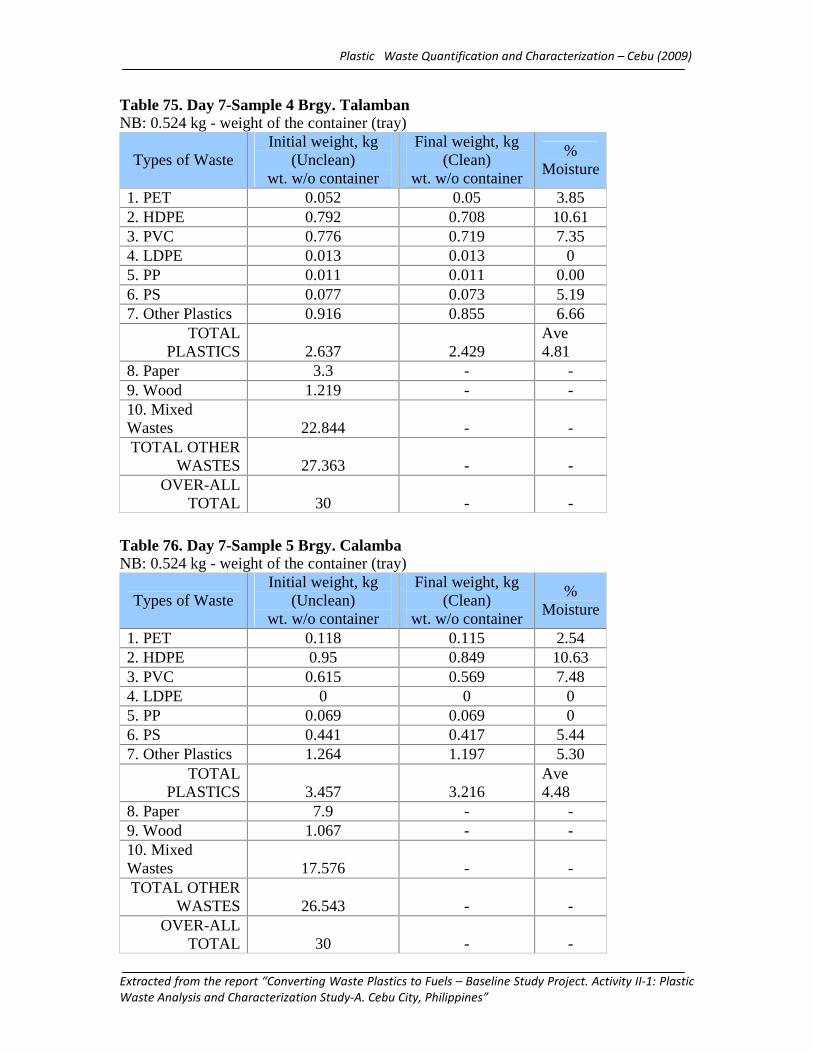
Plastic Waste Quantification and Characterization – Cebu (2009)
Extracted from the report “Converting Waste Plastics to Fuels – Baseline Study Project. Activity II-1: Plastic
Waste Analysis and Characterization Study-A. Cebu City, Philippines”
Table 75. Day 7-Sample 4 Brgy. Talamban NB: 0.524 kg - weight of the container (tray)
Table 76. Day 7-Sample 5 Brgy. Calamba NB: 0.524 kg - weight of the container (tray)
Types of Waste Initial weight, kg
(Unclean) wt. w/o container
Final weight, kg (Clean)
wt. w/o container
% Moisture
1. PET 0.052 0.05 3.85 2. HDPE 0.792 0.708 10.61 3. PVC 0.776 0.719 7.35 4. LDPE 0.013 0.013 0 5. PP 0.011 0.011 0.00 6. PS 0.077 0.073 5.19 7. Other Plastics 0.916 0.855 6.66
TOTAL PLASTICS 2.637 2.429
Ave 4.81
8. Paper 3.3 - - 9. Wood 1.219 - - 10. Mixed Wastes 22.844 - - TOTAL OTHER
WASTES 27.363 - - OVER-ALL
TOTAL 30 - -
Types of Waste Initial weight, kg
(Unclean) wt. w/o container
Final weight, kg (Clean)
wt. w/o container
% Moisture
1. PET 0.118 0.115 2.54 2. HDPE 0.95 0.849 10.63 3. PVC 0.615 0.569 7.48 4. LDPE 0 0 0 5. PP 0.069 0.069 0 6. PS 0.441 0.417 5.44 7. Other Plastics 1.264 1.197 5.30
TOTAL PLASTICS 3.457 3.216
Ave 4.48
8. Paper 7.9 - - 9. Wood 1.067 - - 10. Mixed Wastes 17.576 - - TOTAL OTHER
WASTES 26.543 - - OVER-ALL
TOTAL 30 - -
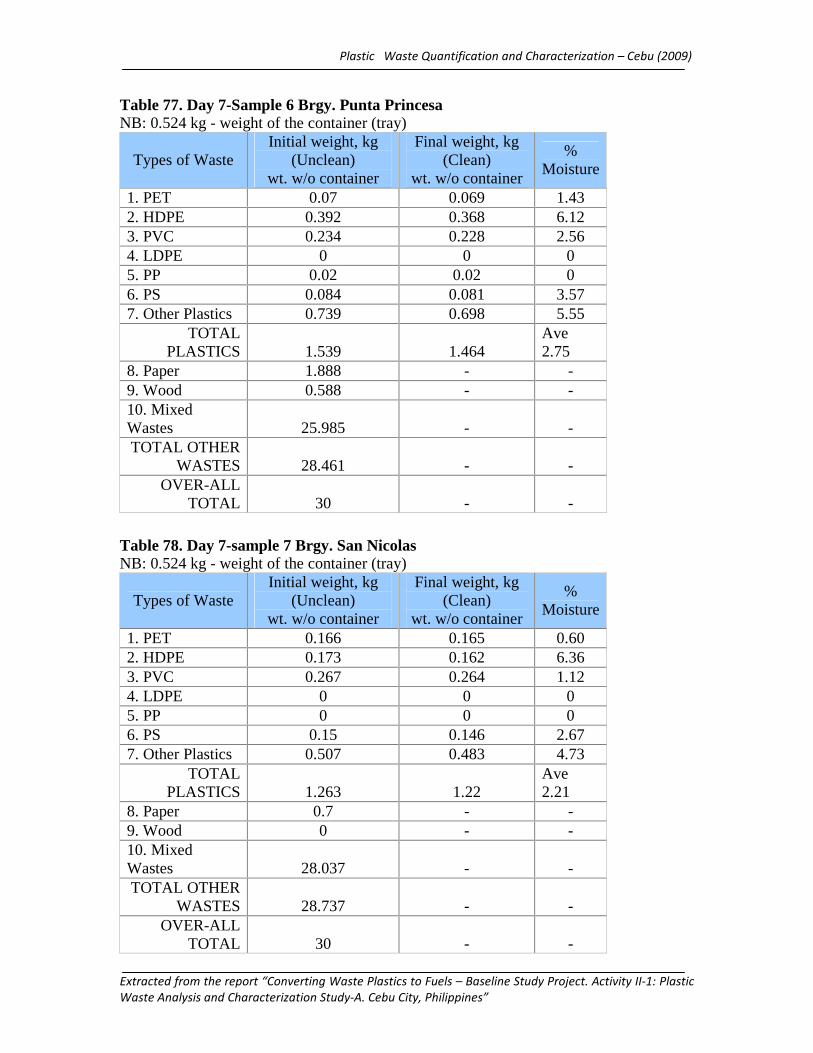
Plastic Waste Quantification and Characterization – Cebu (2009)
Extracted from the report “Converting Waste Plastics to Fuels – Baseline Study Project. Activity II-1: Plastic
Waste Analysis and Characterization Study-A. Cebu City, Philippines”
Table 77. Day 7-Sample 6 Brgy. Punta Princesa NB: 0.524 kg - weight of the container (tray)
Table 78. Day 7-sample 7 Brgy. San Nicolas NB: 0.524 kg - weight of the container (tray)
Types of Waste Initial weight, kg
(Unclean) wt. w/o container
Final weight, kg (Clean)
wt. w/o container
% Moisture
1. PET 0.07 0.069 1.43 2. HDPE 0.392 0.368 6.12 3. PVC 0.234 0.228 2.56 4. LDPE 0 0 0 5. PP 0.02 0.02 0 6. PS 0.084 0.081 3.57 7. Other Plastics 0.739 0.698 5.55
TOTAL PLASTICS 1.539 1.464
Ave 2.75
8. Paper 1.888 - - 9. Wood 0.588 - - 10. Mixed Wastes 25.985 - - TOTAL OTHER
WASTES 28.461 - - OVER-ALL
TOTAL 30 - -
Types of Waste Initial weight, kg
(Unclean) wt. w/o container
Final weight, kg (Clean)
wt. w/o container
% Moisture
1. PET 0.166 0.165 0.60 2. HDPE 0.173 0.162 6.36 3. PVC 0.267 0.264 1.12 4. LDPE 0 0 0 5. PP 0 0 0 6. PS 0.15 0.146 2.67 7. Other Plastics 0.507 0.483 4.73
TOTAL PLASTICS 1.263 1.22
Ave 2.21
8. Paper 0.7 - - 9. Wood 0 - - 10. Mixed Wastes 28.037 - - TOTAL OTHER
WASTES 28.737 - - OVER-ALL
TOTAL 30 - -
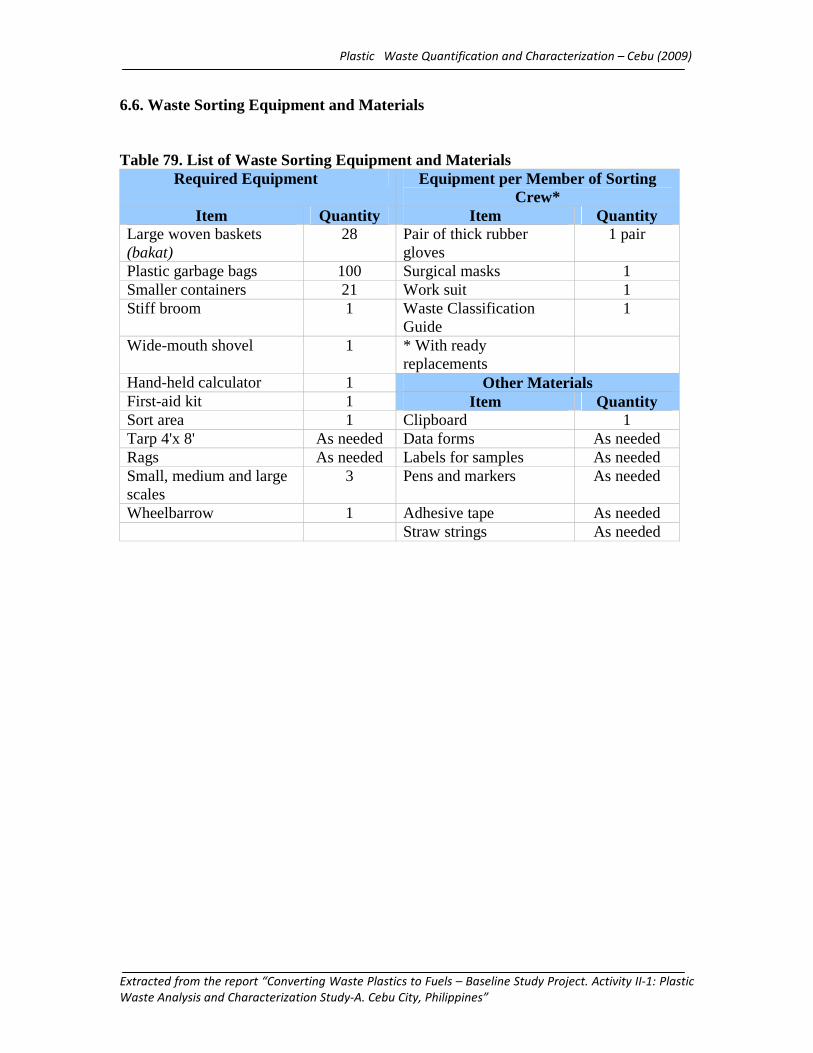
Plastic Waste Quantification and Characterization – Cebu (2009)
Extracted from the report “Converting Waste Plastics to Fuels – Baseline Study Project. Activity II-1: Plastic
Waste Analysis and Characterization Study-A. Cebu City, Philippines”
6.6. Waste Sorting Equipment and Materials Table 79. List of Waste Sorting Equipment and Materials
Required Equipment Equipment per Member of Sorting Crew*
Item Quantity Item Quantity Large woven baskets (bakat)
28 Pair of thick rubber gloves
1 pair
Plastic garbage bags 100 Surgical masks 1 Smaller containers 21 Work suit 1 Stiff broom 1 Waste Classification
Guide 1
Wide-mouth shovel 1 * With ready replacements
Hand-held calculator 1 Other Materials First-aid kit 1 Item Quantity Sort area 1 Clipboard 1 Tarp 4'x 8' As needed Data forms As needed Rags As needed Labels for samples As needed Small, medium and large scales
3 Pens and markers As needed
Wheelbarrow 1 Adhesive tape As needed Straw strings As needed


![[Cebu English] Trường Anh ngữ IMS, TP Cebu, Philippines](https://img.pdfslide.net/doc/110x75/5876cfbf1a28ab1d238b4641/cebu-english-truong-anh-ngu-ims-tp-cebu-philippines.jpg)