Embed Size (px)
Citation preview

_________________________________ *Copyright © 2004, Society of Actuaries
Note: The chart(s) referred to in the text can be found at the end of the manuscript.
2003 VALUATION ACTUARY SYMPOSIUM September 11–12, 2003 San Diego, California
Session 20PD Introduction to Embedded Value
Moderator: MATTHEW CLARK Panelists: LANCE BERTHIAUME MATTHEW CLARK CRAIG REYNOLDS Summary: Long a standard measurement tool in insurance companies overseas, embedded value reporting is becoming common in the United States and Canada. Embedded value concepts are also important in merger and acquisition work. Topics covered include (1) general overview of embedded value, (2) components of embedded value, (3) setting assumptions and (4) practical applications. At the conclusion, attendees have an understanding of embedded value: what it is, how it is calculated and how it is used by insurance companies. MR. MATTHEW CLARK: My name is Matt Clark. I'm from Ernst & Young. We have Craig Reynolds from Milliman USA and Lance Berthiaume from Skandia. MR. CRAIG REYNOLDS: I'm going to be talking mostly about embedded value, just a basic broad overview and introductory concepts. It's targeted to be an introductory session on embedded value. From what I understand, tomorrow there will be another session with some more advanced concepts. Then one of the other speakers will be talking about the role for the analysis of change, which is one of the most interesting parts of it. Then we'll focus a little bit more with the third speaker on some of the practical issues and applications that come up. I work for Milliman in Seattle, where I've been for about 13 or 14 years now. In that capacity I've helped a number of companies in the United States and Asia do some of their embedded value work. It hasn't been a primary area of my practice, but it is one of the things that I've been doing. There are four main areas that I'm going to cover. First, what is embedded value? Second, how is it being used in the United States and domestically? I'll talk a little bit about the approach to doing it, the source of some of the assumptions and some of the key things that people look at on the results.
Introduction to Embedded Value 2 First, let's talk about what it is at a broad level. I like to think of it as a measure of the value of the company. There are really two key components to embedded value. The first we refer to as the value of business in-force (VBIF). There are all kind of different acronyms floating around, but VBIF is the most typical one. This is basically the present value of distributable statutory earnings. Those statutory earnings are adjusted for the cost of capital. The second piece would be the adjusted net worth, which is in broad terms the surplus of the company adjusted for some mark-to-market adjustments. Times being what they are, most of you have probably worked for a company at one time or another, or you've bought a company or been bought by another company. At least a great number of you probably have. In that context you've probably seen the term actuarial appraisal value floating around. From the description that I've just thrown out, embedded value starts to sound an awful lot like actuarial appraisal value. Therefore, the first thing we want to see is a contrast with that. What really makes embedded value different from appraisal value? The first big thing is that typically we don't look at a value of new business. Appraisal values, particularly on interest-sensitive lots of business, will often involve some sort of stochastic multiscenario testing. Embedded values often, but not always, do not involve such stochastic analysis. Usually there's a lower discount rate assumption used in embedded values. Again, that can vary from company to company. We'll talk a little bit later about where the discovery might come from. There is perhaps a different philosophy as to expense allocation and assumptions. In particular, when we start looking at embedded value, one thing that tends to be pretty important is companies tend to adopt fairly stable assumptions from period to period as they update embedded value calculations. When assumptions are changed, there's typically a process for isolating the effect of those changes, as we'll talk about a little bit later. When it's done at most of the companies that I deal with, embedded value is done at least annually, but often quarterly. The quarterly calculations tend to be a little more approximate in some cases. Let's talk a little bit more about some of the components of embedded value. For the VBIF, we're essentially looking at the present value of distributed profits, including the release of the required capital and interest on that required capital. The second would be the surplus of the company or the free surplus of the company. One thing that is a little bit different from the typical statutory presentation on an appraisal value is that we're used to thinking about the appraisal value being reduced for the investment of the initial surplus. The way embedded values are typically included, the release of the initial surplus is included as part of the embedded value rather than part of the adjusted net worth. The last thing typically going on is the mark to market on the asset backing free surplus. How do we use embedded value? In the United States the answer is not very much. Most of the companies in the United States that I'm familiar with that use it are doing it because they are owned by European parents. In the parent companies it's

Introduction to Embedded Value 3 a much more common thing to do in the United Kingdom and continental Europe. There are a few companies in the United States that I'm aware of that are using embedded value as a basis for driving management compensation. Personally I think that's an idea that makes a lot of sense. There are some reasons why I feel a straight unadjusted embedded value is perhaps not an appropriate means in isolation for driving management compensation. As an example, if you were to make a large investment in building a new distribution system, that's going to drain down your surplus, but at the time it does nothing to increase embedded value until those sales start occurring. Perhaps it might be appropriate to adjust the value for 5 or 10 years or something of projected new sales. However, that can make the process a little more subjective. As I mentioned, embedded value is very common in Europe. Milliman UK has done a survey of embedded value activity in the United Kingdom and commented that basically all the U.K. companies are doing embedded value in one way, shape or form. Again, as I mentioned, typically the U.S. companies are mostly the European subsidiaries. We're also starting to see this in some of our clients in Asia; some of them are doing embedded values as well. Again in some cases, that's because they are owned by European parent companies. This is largely a European-driven exercise. From an assumption perspective, as I've noted earlier, the assumptions tend to be relatively static. In some of the companies that I work with, they change almost not at all from period to period. In others, they are a little bit more dynamic. Again, there's very little to be gained from what I'll call gaming the assumptions in an attempt to boost embedded value. The process is intended to be, if properly carried out, pretty transparent in the sense that once you've reported an embedded value and are trying to analyze the change into the next year, one of the key things to be looked at is the breakdown of embedded value change. You try to isolate the effect of each of the assumption changes typically. Although you may think you can make this up and look like a genius by changing your mortality of your lapse assumption, it's going to be disclosed. They are in black and white, and it doesn't really give you a lot to gain. Unlike a lot of the other exercises we work with, such as statutory and to a lesser extent GAAP and certainly tax, there's very little guidance on what your assumptions should be in an embedded value exercise. Prudent best estimate is a term that you sometimes see floating around. Generally speaking, it's some version of a best estimate assumption of what you really think is going to happen. Perhaps you err slightly on the conservative side, but no deliberate pads are typically involved. You're not going to find, at least that I'm aware of, any laws or standards or anything anywhere that really tells you what those assumptions should be, or what the basis should be.

Introduction to Embedded Value 4 Because of this, it becomes a little bit difficult to compare embedded value from company to company. You really have to know something about the basis for the assumption selections within the companies before you can say anything intelligent about the embedded value comparison between the two. One nice thing about doing embedded value is, if you ever reached the point where you need to put a company that has been doing embedded value calculations on the market, embedded values are certainly a great starting point for developing an actuarial appraisal value. The mechanics are essentially all there, other than the new sales. The key things you have to think about are whether the assumptions really are appropriate and what you'd want to use for an appraisal calculation. One of the big drivers of embedded value calculations is the realization that we're not just looking at earnings, but at the present value of distributable earnings. Typically those distributable earnings are looked at over a fairly long time frame. Perhaps 30 years or so seems to be about the most typical in the companies that I've been dealing with. Over that long a time frame, certainly you have to look at the discount rate as being a key driver of what the value is going to be. Typically we think of the discount rate as being a spread over a medium-term treasury rate. Most of the companies that I've been dealing with are using spreads in the range of 1–4 percent. When you deal with the big multinational companies, it's not uncommon for the multinational parent to define spreads that are country specific. A risk spread is going to be different for a U.K. company versus a U.S. company versus a Thai company or that of some other less developed economy. I find it interesting to look at those spreads and wonder what the basis is for the selection of them, but that's not something I've been involved in myself. One advantage or disadvantage of this fairly rigid approach is setting the spread. It removes what would otherwise be an easy management throttle to drive the embedded value up or down. Again, because of the change-in-assumption documentation that goes on, there is relatively little advantage to doing that anyway. The other interesting thing to note is that when we look at Asian companies that are doing embedded value, it's relatively common there to see nonlevel discount rates and nonlevel earnings rates, and sometimes they'll project increases in earned rates going into the future relative to today. For those of you in the U.S. market, that seems like a very strange thing to do. You're not used to projecting increases in earned rates. As actuaries, our natural tendency is to be conservative and project decreases in rates going forward. When you're in an environment where a Treasury rate might be 10 basis points, decreases in its rates are pretty hard to project. On the other hand, assuming that they remain level at 10 basis points forever also seems a little bit unrealistic. Therefore, the increases are not all that hard to at least begin to rationalize. One of the interesting things we deal with is the issue of deciding what defines distributed profits, if we want to deal with distributed profits. In almost all cases,
Introduction to Embedded Value 5 embedded values are driven by statutory earnings. First, there is whatever local statutory might be, since that really is the driver of how much money you can take out of the company. However, it's not just the pure statutory earnings; we want to take levels of required capital into account. That requires some thought about what really is required capital in the United States. In dealing with some of the parents of multinationals we've been dealing with, we have to educate them sometimes a little bit that in some sense, plan-level risk-based capital might be the only true required capital that the company has to hold. This is because you don't have to take management action in any legal or regulatory sense until you reach that point. However, from a practical perspective, from a rating agency perspective or anything else, we have to hold considerably more than that in the United States. Therefore, most of the companies that I've been dealing with here domestically will hold capital at two to two and a half times that level. There are a couple of the things that we need to think about when dealing with embedded value. Generally speaking, you want to work pretty hard to make sure you're picking up all the components that are out there. People are used to statutory models in which, for a cash-flow testing model or something else, we really just try to pick up all of the material blocks of business that are out there and certain miscellaneous liabilities, and miscellaneous pieces of the company can get ignored. In a true embedded value exercise, you like to pick up everything that's there if you can and not leave in some sense any money on the table. The first and most obvious one is to make sure, to the extent that you can, that there are no nonmodel lines of business. If something is out there, find a way to estimate its value, through a traditional actuarial model, or through just applying a multiplier to represent annuity factors applied to statutory earnings for that block of business. That's the technique that's used fairly often to the extent that you can isolate the earnings impact of those blocks currently. Sometimes they're miscellaneous liabilities that are not really associated with any block of business like an Exhibit 11 claim liability. That's a liability that just sits there, and in a stable company it doesn't tend to grow, and it doesn't tend to decrease. While it's there, it's generating the assets associated with that, which are generating investment income. Therefore, we want to think about investment income on those liabilities as being essentially in perpetuity out into the future on which we want to take a value. We also have to think about overhead to a certain extent and make sure that the expenses we're using in our model are appropriately taking that into account. Although there's probably some room for judgment in variation in practice here, a lot of companies want to make sure that their embedded value fully reflects all of their expenses except for those that are associated with new business production, which are not explicitly part of the model. Therefore, if you're doing that, you have to make sure you've got some fully allocated expenses, or have a separate line item for an offset for the value or cost of overhead expenses.

Introduction to Embedded Value 6 We'll get into mark-to-market issues. There are a couple of interesting issues there to think about. One is that, generally speaking, you're going to have an explicit asset model in your embedded value calculation, meaning you won't tend to just have a 7 percent earned rate projected out into the future. You're actually going to model your bonds and mortgages and whatever other assets that you have. To the extent that you're doing that and you're capturing the appropriate statutory income that would arise from those and the market book differences, there's no need for any sort of mark-to-market asset adjustment on the assets that are backing your liabilities or capital. The mark-to-market affect will be appropriately reflected in the earnings that emerge out of your projection system. However, you need to take that mark to market into account on your free surplus, just as you might when doing an actuarial appraisal analysis or anything like that. A piece that's easy to forget is that some of your assets may be in market already from a statutory accounting perspective, but haven't been taxed on a basis consistent with that. Common stock is an example. Typically it can be carried at market on a statutory statement, but the tax basis is different from that. Therefore, you want to adjust for the tax that you would incur if you attempted to realize that. If we start thinking about what we look at when your embedded value spits out, there are a couple of key pieces that we look at in comparison to prior years and things. One, of course, is what's the level of embedded value itself? If it's the first time a company has ever done embedded value, or they haven't had a recent appraisal, it's always an interesting number to see. What's the value of our company when we put it all together? In renewal years certainly we want to look at the change in embedded value. In particular, as we will be talking about with one of the other speakers later, and generally speaking, we want to be adding value to the company at a rate in excess of the hurdle rate or the discount rate. Therefore, you'd like to see your embedded value increasing at a fairly rapid rate if you can. Toward that end, one thing you might just look at is the change in embedded value divided by the prior value: in fact, an increase rate. The next thing is, of course, the most interesting one, that the sources have changed. I won't get into that, but that's where all the fun math and the fun analysis and the fun actuarial work go. This says, okay, last year the answer was $2 billion and this year it's $2.2 billion. Why? Where did the money come from? To a certain extent, that can be part of reporting on any reporting basis you have, for example, statutory, GAAP, etc., where you try to analyze the sources of earnings in effect. Embedded value, though, is really more important and more common than any other exercise or any other reporting basis. The last category is the value added by new business. By that I don't mean new business truly in the future. If we're doing embedded value as of year-end 2003, we'd really like to know almost more than anything else whether we added value from the business we added between year-end 2002 and year-end 2003. All companies like to think they're selling business that's profitable. However, if you

Introduction to Embedded Value 7 realize you might be doing an embedded value discount rate at 9 or 10 percent and using fully allocated expenses, it's not that unusual to see at least a given line of business that may actually act to decrease embedded value by adding that business. This is not a good thing to have to report to your board or to your management. The last thing I'll talk about is something I mentioned a little bit earlier. It is very dangerous to compare embedded value across multiple companies, because of the differences and assumptions and sources thereof and discount rates. In particular, companies are not always going to publish in footnotes or anywhere else any sort of details on the sources of change of embedded value and what the drivers are. Without full access to that information, it's potentially quite misleading to compare the values and the changing values across the various companies. With that I will yield to our next speaker, and then we'll have some questions at the end, unless anybody has any burning questions at the moment. MR. CLARK: Craig gave us a quick example or discussion on what embedded value is, how it's calculated, some of the components and so forth. I'm going to talk about the movement of embedded value as you move from period 1 to period 2. What are the changes? How do we quantify and associate those changes with the different variance components? The first question you might have is why are we spending time on the movement in embedded value? I think, and I think many others think, that the movement in embedded value is often more important than the embedded value calculation itself. As Craig indicated, it is very difficult to compare embedded value across companies. Between hurdle rates, products, assumptions and so forth, the differences can be quite diverse. Within a company it's important to look at the change in value over the year. The movement in embedded value will help you explain and understand the source of these changes. It will also provide valuable information for management as they move forward. As Craig touched on, is new business adding value or removing value, given the hurdle rates? Also, it should let you know what's causing those differences; is it something that management has control over? In other words, are the factors economic? One might say that the journey is more important then the destination here. How do we get from the beginning of the year to the end of the year? Let's go over some of the moving parts between the beginning embedded value and the ending embedded value. As we already discussed, the new business is one of the components of the movement. There are also cash flows that come in or out of the lines of business in the form of dividends and/or capital infusion from the corporate division. How do you go about calculating the movement on embedded value? There are a lot of different ways and schools of thought here, but I think there are some

Introduction to Embedded Value 8 concepts that are pretty universal, and that's what we're going to touch on. What I will discuss here might be different from what you've seen or heard. That very well might be the case, but I think if you follow this, you get a pretty good understanding on how the process should be employed. First, you have a beginning-of-the-year model, so at time 0 you had a model that produced an embedded value for this year. You want to take that model and understand where the embedded value would have been had there been no new business, no change in experience and no change in assumptions. It's a good place to start, and it is kind of your expected at the beginning of the year. You'll have to do some analysis to understand which variables are most important or most material during the year. For instance, on annuities, obviously interest rates are more important than lapses in the last three years. However, maybe next year lapses will be most important, so one of the first things we'll have to do is perform explicit runs. Sometimes this can be done intellectually. More times than not, you'll want to do a run to understand which pieces or which variances are causing the biggest change in your embedded value. Introduce those one at a time. The idea here is to move from your expected beginning-of-the-year embedded value to the current embedded value. We'll call all of these “true-up” pieces. As you can tell, that's going to potentially require numerous runs, different runs for each line of business. It's also going to require you to determine which variables are the most material and put them in order. What's going to happen is the interaction of those variables as you introduce them, which will give you the synergy, whether positive or negative. It's not an additive process. That's why you want to introduce them in a systematic way. Similar to the unlocking or the truing-up for actual experience, you also have changes to future assumptions. In a very similar manner, you're going to want to introduce those as well. There are really two steps here, a true-up and an unlocking, which are not very different from a GAAP process on the U.S. side. Finally, you're going to want to reconcile these to your ending embedded value. Now, starting with the beginning embedded value model and going down to the current period value, in truth, more times than not you're going to start by creating your new embedded value modeling, you're going to bring your true-up, you're going to create a new model for the end of the year, and then you're going to go back and reconcile those differences. I think to look at it in this systematic way will prove to be fruitful. What are some of the sources in the movement in embedded value? What causes it to change from the beginning of the year to the end of the year? We've already talked about some of these. First, we have the value of new business, the amount of new business—have you sold some, a lot, a little?—and the cost of acquiring that business, and then the assumptions underlying that value of new business. They

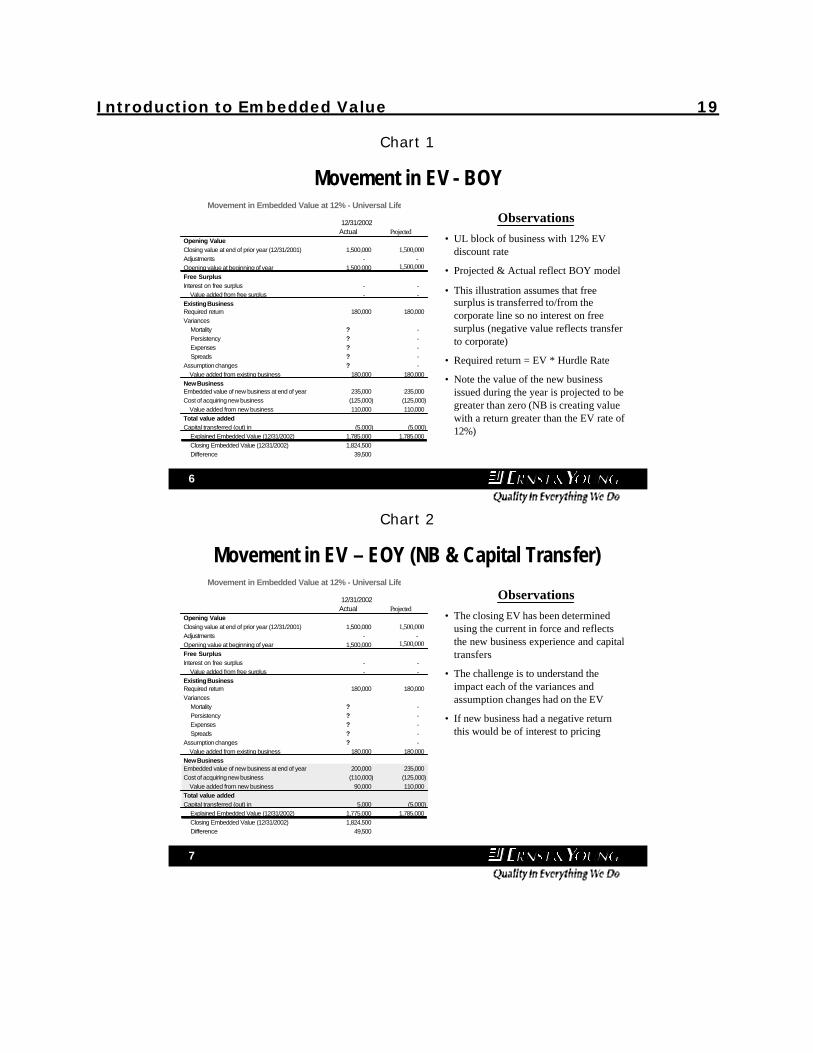
Introduction to Embedded Value 9 may have changed or they'll have an impact, the largest of which would usually be the hurdle rate. How does that compare with the pricing or expected profits? We've spoken quickly on the true-up and unlocking aspects. Another thing I'd like to mention is the discount rate. You can imagine that, if you move from a 10 percent discount rate to an 8 percent discount rate, you have a significant change in embedded value. In fact, in some companies these changes happen more frequently than not. Some schools of thought say that the discount rate should be more stagnant. However, it's important to understand that when that rate changes, it's usually the leading driver of the change in embedded value in that year. Finally, we have capital transfers, cost of capital, and then the adjusted net worth, which will have a difference between your earned rate and the hurdle rate. We'll go through the brief example. In Chart 1 I've chosen a universal life product with a discount rate of 12 percent. At the beginning of the analysis, I've got my actual and projected, and projected was the beginning-of-the-year projected embedded value. I've got some question marks on my variances: I don't know what they are right now. I'm pretty certain there will be some in each of those categories. At the bottom you'll notice the $1.8 million as well as the difference of $39,500. Those reference the amounts that were derived given the new end-of-the-year model. Again, usually you go through the process of truing-up, introducing your assumptions and calculating your end-of-year embedded value before doing the reconciliation. That's what we have here. I'd like to hit a few points before we move on. First, I'm not holding any free surplus in this line of business. I keep it all in the corporate, so there's no interest on free surplus or free surplus play here. There is a capital transfer in and out. I projected there will be a $5,000 transfer out of embedded value during the year, up to the corporate, so that will be a release of surplus, if you will. Toward the middle you'll see the required return. The $180,000 would reflect the beginning of your embedded value times your hurdle rate of 12 percent. It's not always that clean, but for our illustration we'll keep it clean. Our new business is projected to create value, $110,000 in this case. It has been priced and executed in excess of our hurdle rates of 12 percent. In Chart 2 the first thing I've taken a look at is the change in new business and the transfers. As things have changed through the year, it happened that a $5,000 increase or infusion of cash was required from the corporate line. The reasons could be numerous. They could be reserves, environmental or many different reasons. The new business was not quite as we had expected or projected for the year. You see that the amount of new business has gone down as well as the acquisition cost. Net, we had a $20,000 difference from what we were expecting the embedded value at the end of the year to be. If that new business had actually been negative, that obviously would be a source of concern. It's not unusual to see that happen in certain cases. It's usually a good

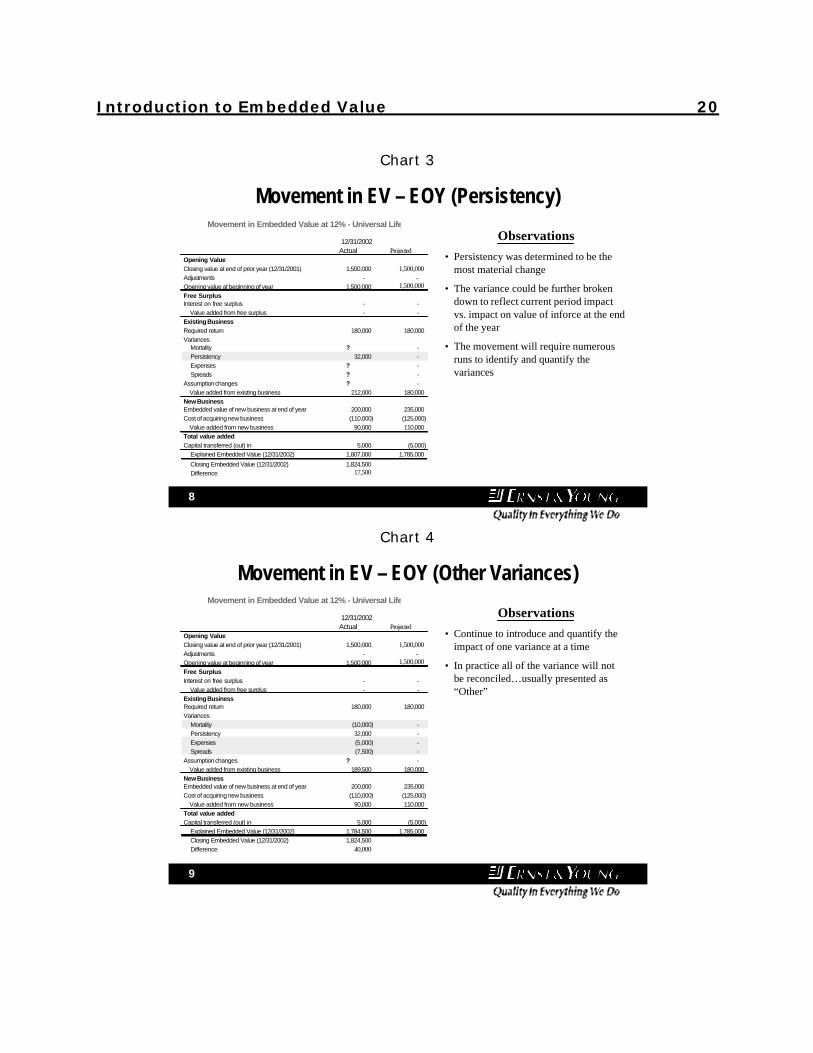
Introduction to Embedded Value 10 indication that pricing and management need to have a talk and understand what the source is. It might sound trivial, but it is a very important thing to note. One of the first things that most people will take a look at it is, Did new business add value? As said before, the first thing you want to do is start ordering your assumptions. In Chart 3 I decided that persistency would be the most material assumption here. How did I choose that? I just chose at random only for this one, but you would have done your analysis and understood that persistency is the most material change for me, so I'll introduce that. By making my run I understand that by introducing that true-up impact, there was a $32,000 increase in embedded value. Some people care to take this change and break it down even further. What was the change on this year's cash flows versus future cash flows? Again, it's the present value impact of that change on the persistency. You can break it down even further between current year and future year cash flow differences. As I keep reiterating, the number of runs that will be required to do this is quite sizable. It's important to keep your runs in order, your thoughts in order, and be very systematic about this. It can get to be quite onerous as you move through it. Also, it is important to capture those changes and understand them as you go through. They've introduced only one variable here, the persistency, so that's easy. As we move on, we'll introduce the rest of the variables. I've just thrown them all in in total to see how the interaction between them happens. If you run them all individually and you've seen dollar amounts—for example, mortality was a $15,000 decrease, before I added it in with persistency—you'd want to understand how those two interacted. There's a lot of material and analysis that can be performed here and often is. The movement in embedded value, which I probably didn't state already, probably takes the majority of your time in creating your embedded value. It doesn't take long to introduce your true-up and to massage or tweak or whatever you call it your changing of assumptions. Usually it isn't too difficult to do, but explaining it takes a lot of time. You're going to be spending a lot of time. It's not going to be an afternoon exercise; this will take a couple of weeks potentially of runs, analysis and discussions. To move forward, in Chart 4 we've gone ahead and introduced the rest of the variances. We do it one at a time, and we've reconciled them. In a real world it would be nice to have them all reconciled as I'm going to have down to zero. Very often companies will have another column, the cookie jar, if you will. There are different schools of thought here. You typically don't want to have a material other; it's not good not to have explained your differences. Don't be surprised if you do, in fact, have a little bit of business or a little bit of change yet to be explained. Last, you'll introduce your assumption changes, shown in Chart 5. Invariably you're going to have different changes through the year, and you can split those out as I

Introduction to Embedded Value 11 did for variances. In the interest of time we'll lump those together. You'll systematically go through those as well. You'll also want to make sure that they reflect your best estimate. There are no pads. It's very similar, I often think, to setting GAAP assumptions. You want to keep your best estimate assumptions in there and make those changes. In summary, I think I've hit the first point pretty well. It's going to require a lot of different numerous runs and a lot of time to perform the movement in embedded value. This is really where the value is for the company. Where did we create value? Where did we use lose value? What actions did we take that were a positive? What actions occurring since then that were beyond our control cause a change in our embedded value? Just because it goes up doesn't mean that management added value. Often you'll see embedded value go up because of economic conditions, but once you strip that out you'll see a decrease in embedded value due to persistency and other actions that management has control over. That's the idea between the economic and noneconomic. Last but not least, often there are sensitivities that are run, and often in embedded value reports you'll include some sensitivities and some of the key assumptions to show where the embedded value differences could lie. You can go one step further, and we've been doing this with a lot of our clients at Ernst & Young by introducing stochastic embedded value. Obviously in the last few years, as the economy has moved, and in particular if you looked at variable annuities, the amount of embedded value or income at risk is often of interest to management. They know where their embedded value is; they really want to look forward. What could it be? What's the chance of it going up versus down? What are the thresholds? Do I have a chance of going down 40 percent in my embedded value in a year? It sounds like a lot, but I'm sure it happened to a lot of companies that are having invariable annuities in the past three or four years. Then they are taking actions to mitigate unwanted risk exposures. Therefore, the movement in embedded value could be not only historical, but also prospective, if you introduce those types of analytics. MR. LANCE BERTHIAUME: I guess I should start my presentation with a little background about myself. I've been with American Skandia for about three years. I'm responsible for embedded value, statutory and GAAP. Prior to that I worked with Tillinghast–Towers Perrin in Hartford, Connecticut, where I did get exposure to embedded value and appraisal values. For those who don't know American Skandia, we're predominately a long-line company invariable annuity business. As of May 1, we are a part of Prudential. We were owned prior to that by European Carrier. Embedded value was a primary focus for us. My focus here is going to be on Skandia's experience. Every company's experience is going to be slightly different. The framework I put this in is what we did and what we saw at Skandia, and I'm going to focus on the actual mechanical process of producing numbers. There are tons of issues around implementation. It can take, one, two or three years, depending on the size and the complexity of the company.

Introduction to Embedded Value 12 I wasn't around for the implementation. Skandia has been doing embedded value for more than 10 years. I didn't feel knowledgeable enough to talk about their experiences from an implementation standpoint. The other thing I want to emphasize is that the right answer is going to be a factor, in my mind, of three things. How frequently are you doing this? What's the complexity? How important is it? We were doing it quarterly, it was our primary reporting basis, we de-emphasized U.S. GAAP and emphasized embedded value, and we're a monoline company. Therefore, complexity for us was much easier than for a multiline company that's 130 years old. What I would like to discuss with you today is going to be on the practical aspects. Here are some of the practical considerations. From setting up the model, I break this down into three pieces. In the model office these are creating the cells, doing the calculations and then doing the reporting. We at Skandia needed the model office to be automated; it was a necessity for us. Depending on the quarter we were looking at, we had to have numbers out in two or three weeks. It necessitated our being very automated and very streamlined. That may be different for other companies, but that was our approach. As far as granularity and run times, I think you'll know when you have the right answer. This is when you can get the results out quickly, but you also can explain the results. When you can do that and do it in a timely manner, you probably know that you've got about the right level of granularity in your models. As far as calculation engines, I'm not going to say that one system is better than another, homegrown versus vendor. That's going to be a company decision. I think it's been my experience, not only with Skandia but with other companies, that it's hard to find one system that's going to do it all. I'll give two examples for Skandia. We're a variable annuity company, so guaranteed minimum death benefits were an issue for us. We did that analysis outside of our main engine: we did it stochastically in a homegrown system. The other thing was deferred tax assets and liabilities: we did that outside of our model. We built a complex tax algorithm within our main engine, and that's appropriate. The end result is important. That's really what you're trying to get to. The last thing is the results in the summary. I would say here it is a tremendous amount of data, and you've got to have the ability to do things logically, a lot of runs, and have the ability to report it. We spent a lot of time when I first got there improving on that and being able to do several runs. I do mean several. In a particular quarter you could be doing 80, 90 or 100 runs to do the analysis. You've got to have the ability to bring that together in a very quick way, because if you're doing it in two or three weeks, and you get a week into it and all of a sudden your model offices are wrong, you've got to quickly turn over the model office and then quickly get out the results again. That just doesn't lend itself to a manual process.

Introduction to Embedded Value 13 The last thing I would emphasize more than anything is that sometimes simplicity is the best answer. I was mentioning the deferred tax assets and the deferred tax liabilities. Probably three years ago they weren't a very big item as part of our embedded value. During the last couple of years with the equity markets down, net operating losses became a big deferred tax asset for us. We got into an appraisal situation a year ago, and said, “Maybe for an appraisal value we need to get a lot more complex,” and we actually built a very complex tax algorithm, and at the end of the day the result wasn't that sensitive. You must understand what the key drivers are and how sophisticated you need to be. Sometimes the answer is rules of thumb and spreadsheets. Don't be scared of that. There's nothing wrong with that. It's the end result that matters. I think sometimes as actuaries we get caught up in the beauty of the model and not the end result. In my world there were really two types of assumptions: your traditional actuarial assumptions and your economic assumptions. I think these were touched on before by Matt. I guess I'll take the economic side. For us, our parent dictated our economic assumption. It was a spread over Treasuries, and it was a cookbook formula. We actually did change it every quarter, but we kept our discount rate and our fund growth rate on our funds consistent. It was very cookbook, with not much for me or my staff or Skandia to do. We spent all of our time on the assumption side. Our approach was to take a long-term perspective for most of the time, and do it as a team approach. I mean, there was no right answer. We used accountants and actuaries to get this job done. I think one of the more important assumptions for us was expenses. I'll break it into two categories. First is start-up: start-up can be handled in a couple of different ways. You can ignore start-up cost in that particular line of business, or you can just ignore the line altogether. For example, we're primarily a variable annuity company, but we're trying to start a variable lifeline. It never got the critical mass, and we just ignore it. There are a couple of ways of handling that. More important is how to handle and fix overhead expenses. For us at Skandia, that was a critical issue because the company was built 15 years ago from scratch. They built an expense model that was very sales driven. All the expenses were drivers off sales. Some people may chuckle or laugh at that, but that was probably the right approach for a growth company, a start-up company, because it focused everybody in the company on one thing, building a company. The issue for us was how to switch from being a start-up company to a mature company. I think we waited too long. Those are some of the issues that you'll struggle with. As far as frequency, the economics we change quarterly. The other assumptions we tend to try to change only annually, unless in midyear we feel like an assumption was really going one direction or the other. I don't think there's a right answer here. You're just going to be balancing, getting stable results and being able to explain them as reflecting a long-term trend. The other thing is what somebody mentioned about changing assumptions. It is very transparent. One of the issues we had probably was in the first year I was there; it wasn't a very good year from

Introduction to Embedded Value 14 the embedded value standpoint. All the parent did was change the discount rate by 25 basis points. Obviously a 25 basis point reduction increases embedded value. We spent a disproportionate amount of our time explaining that to analysts. The answer we got back is you're cooking the books. It's more of a judgment call. You should understand that when you change assumptions, there should be a reason for it, and you got to be careful that it's not going to come across as you trying to manage the results. There are other issues, timing issues. Again, this is going to depend on the frequency of you doing this. If you're doing this annually, the timing issues are probably a lot less. For us, quarterly timing issues were a big issue. We had to have very good relationships with our accountants and a very good access to our general ledger. That helped with all our income statement side. Adjusted net worth for a long time was an issue for us. The accountants were driving this process of defining what our adjusted net worth was, and it took us some time to get the kinks out of that. It tends to be the last thing you do on your balance sheet once you get your income statement. The accountants focus on the balance sheet. I would say the other thing that can be a big deal is if you have large deferred tax assets and liabilities. You have to get your tax department in the loop, and there might be some tax departments that aren't used to a tight financial reporting deadline. There can be some issues around those things. I guarantee you, every quarter there will be something that changes the critical path and becomes an issue that you have to address. I think Craig mentioned this as far as market value versus book value. The reason I bring it up here is you need that consistency between what you're doing in your VBIF or prospectively versus what you're doing in your adjusted net worth. Both are going to be on book, or both are going to be on market. The best example I can give of that is, about a year into taking over embedded value, I realized that our target surplus was being held at book value, but we were using market yields to project net investment income. That's a disconnect. You can't have that. We should have been using a book yield and grading it to a new money assumption. I think you have to be careful that when you're doing mark to market and book value that you have consistency between what's going on in your projection going forward and what you're doing in your surplus segments. Let's discuss robust and timely experience studies. I think you're going to have a greater need for this. Often in companies, it's something you do every two or three years. Some things we did quarterly; some things we did semiannually. You need to identify trends quickly, because now you're doing present value of future profits, assumptions become very sensitive, and your results become very sensitive. I think our approach with accountants and actuaries worked well, but the one thing I caution, and I hope I don't insult any accountants, is that accountants are used to there being an exact answer. It's not true that there is an exact answer. I can only tell you one thing about every one of my assumptions: they're going to be wrong. The idea is to understand the trend and set the trend right.

Introduction to Embedded Value 15 The other thing I caution about is you have to do this ahead of time. When we're doing embedded value every three months, in January, April, July and October, I can't be dealing with setting assumptions. Those assumptions have to be done ahead of time. I caution you on that, because it's hard to manage a production cycle and set assumptions at the same time. Probably the more interesting part is the movement analysis. I think we've covered this, but I want to present some of the Skandia results. I have altered some of the numbers just because of their proprietary nature, but I want to give you the sense of how we did the movement analysis. I'm going to make an even stronger statement about movement analysis. If all you ever do is embedded value, don't do it. You have to do the movement analysis. That's where all your time is spent. Once I felt my models were in good shape, I handed it over to actuarial students, and I spent 70–90 percent of my time on this one area. That's all we did. All our senior people did was to decide how can we explain our results to our parent and to the marketplace? It's very time consuming. When you add up all your time, it's easily well over half your time for all your staff. I think it's two numbers, and the two numbers are very large numbers. They are meaningless without explaining why it went from X to Y. Going from X to Y is fine, but explaining why it went there is much more important, as far as the approach on how you do the changes, how you do your movement analysis. Essentially I don't know if there's a right way. There are two general approaches. The approach that we took was the cumulative approach. What I mean by that is to identify all the changes and do one change on top of the other, such as change of lapse or change of mortality. The other approach is to do distinct runs. I change my lapse and change—nothing else. Change my mortality and change nothing else. The problem with this approach is you're left with a correlation term or an interaction of all your assumptions. In the second type you're left with having to allocate some remaining term, or in the cumulative approach you're left with making a decision on the order you do it in, and it's a judgment call. As you say, you tend to know which assumptions and which items are the key drivers of your results. For us, it was equity returns. Somebody said it changes from year to year; for a variable annuity company it doesn't change from year to year. The primary change for us is always equity returns. Then the other assumptions may change concerning which one was important, depending on the year. Next I'm going to go into the fiscal actual physical movement analysis. This is illustrated in Chart 6. What I'm presenting here is essentially what Skandia would report publicly. This is our version, the American Skandia version, with the numbers obviously altered slightly. Again, the format is maybe a little different than what you saw before, but again, this is Skandia's approach. One thing I would say is what Matt mentioned, the idea that his numbers were all one number. We tend to

Introduction to Embedded Value 16 break our point out into two pieces. It was the VBIF, or what's happened prospectively in your models, and our adjusted net worth, or your surplus, or your statutory results. We tend to analyze them that way and look at them that way. The first area I'd like to talk about is the value of new business. You will spend a lot of time here. In my opinion it might be one of the best measures of senior management. It's probably the thing they have the best control over. Are you putting business on the books that's valuable? You will spend a lot of time here. Personally during the last couple of years it's given me a lot of battle scars. We've had periods when it was negative. Trying to explain to the parent and to the outside community why you're putting business on the books that's negative is tough. Our issue was we grew very fast, and during the last three years our sales dropped dramatically, and we had a lot of infrastructure we couldn't support. That was our issue. How do you deal with that? How do you right size your organization? The split here is the value of new business and the value at the point of sale. Then we looked at it, and it was based on best-estimate assumptions or pricing assumptions. Then we look at external acquisition cost, which for us would have been commissions. Internal would have been all the other acquisition costs. We looked at how those would deviate with how we priced our products. As you can see, there were two main reasons that we had a very low business contribution. We needed to right size our organization, we couldn't do it fast enough, and we had a tremendous amount of sales promotions on the books to try to get sales to pick up. You will spend a lot of time, and it's a lot of value. I think the next area is pretty simple. Line 6 is just a net of investment income on shareholders' equity. The planned return is just the unwind of the discount rate. Last year you assumed that you're going to earn 9 percent, and you need to unwind that. That's all that's happening here. Chart 7 shows the more important sections, what Matt called the true-up and the unlocking. The true-up is essentially a year ago or last period: I assumed X, now my actual results are Y, and this is what you're trying to explain here. I have adjusted the numbers, but we're talking about not having a very big "Other." I've collapsed a lot of things here, because some of the information we had was proprietary. "Other" for us really isn't that big. The only explanation I'll give there is the vast majority of line 11 for us was that we were restating a reserve item to be on a parent's local statutory. They had a different standard than we did. All we're doing is moving something, so really line 11 was not that large. The idea is that your actual results were different. Obviously in your statutory result, which is the adjusted net worth, you have some movement, and you're trying to analyze it by the categories. Obviously when actual doesn't equal expected, that's going to affect your prospective experience. We have a lot more detail than this, and so will you. This is a standard format that was dictated by a parent, but you will go into a lot more detail. In our analysis we

Introduction to Embedded Value 17 probably had 30 or 40 lines here trying to explain all the things that were different from our expectations. The next section is just your unlocking or your true-up of your assumptions. For example, the number in line 13 isn't exactly this. This is where I'm coming back to that we quite didn't do our expenses right. We finally realized that you can't associate all your fix and your overhead with your new business. We were just lucky enough that we had some other unique riders in our business that were having a very positive experience, so that we felt like we could unlock the assumptions, and they kind of offset each other. It was just coincidence. That's lines 13 and 17. Line 14 for us is, Don't make mistakes. I highlight experience studies here. Some of that mortality is because we had a different perspective on what our mortality is going to be, but most of it was that we found an error in our mortality experience studies. It's very important that you understand your studies, you believe in them, and you don't have bigger issues, because if you make a mistake on your assumption, the whole present value of that is going to come back when you have to true that up and correct that. It makes for a difficult discussion. Chart 8 shows the next area, what I call financial effects. I don't think it's been mentioned much. The one thing you need to do is to identify those things that management can control and those things they can't control. We define financial effects as anything that has to do with equity returns, anything to do with fund performance. We isolate them. Basically we explain to the marketplace that these are the things that are out of our control, and we split it into two things. One is financial experience, what the equity markets do, and then for us it was fund return and discount rate, which was that cookbook economic assumption. They pretty much offset each other for the most part from period to period. Again, this is the part that's uncontrollable. That's deemed to be out of the control of management. Whatever designs or things you use in embedded value, I think it's important to differentiate between those things that management can control and not control. There is no surprise here for the variable annuity company. When the market is down, the asset base revenue is down. "Other" for us, for the most part, is the increase in our claim cost for our guaranteed minimum death benefit riders. There's no surprise here; when equity markets are down, there are pretty substantial results. I will say embedded value is extremely volatile, a lot more volatile than statutory and a lot more volatile than GAAP. That's one thing you'll have to get used to. The numbers are large. Most variable annuity companies were dealing with deferred acquisition cost, unlocking and all the volatility that went with that. In 2002 we dealt with that issue the prior year because of our embedded value results. That's really what's going on. In conclusion, we're just trying to get back to what we call our operating results. This is shown in Chart 9. I apologize for not mentioning this before: all the analysis

Introduction to Embedded Value 18 I'm showing you is pretax. Again, that was a Skandia convention. We did all of our analysis pretax, and I can only guess why that was. Our parent historically has not paid a lot of federal income tax in Skandia, so I think their whole focus was pretax and not after tax. The important line here to understand is Financing. We're a high-leveraged company, so we had a lot of debt. That's line 31. Line 29 for us is pretty simple. A year ago you were projecting a certain statutory result, that's the $94,795, so that would show up in your statutory results. Obviously you need to release that and your VBIF. It nets to zero, but that's important there. I think a lot of these uses have been identified. I'm going to try to focus on the ones we ourselves really tend to focus on. For us, validating pricing results is probably primary, and we did a lot of this. Are we really pricing business the way we should be pricing it? This was a validation. We use embedded value to validate when our pricing area was doing what we projected it should. It's further down on the chart, but I would say management compensation: we must have used three, four or five different compensation plans for different levels of employees, all driven off embedded value. Those are the things you can use. We identify the key drivers. There are many uses for it. You've got good solid models. You can use it for a variety of things. Finally, we have benefits. Embedded value will make the actuary's life easier. For the first time in your life, you'll have pricing actuaries and financial actuaries working together. The answer is the same. The pricing actuaries look at distributable earnings. Now you'll be looking at distributable earnings. It makes your life easier. My experience with Skandia is that everybody believed in embedded value. It didn't matter if it was marketing, sales or customer service; everybody had at least some appreciation for embedded value. It made teamwork easier and made decisions easier. We didn't make any decisions without looking at the embedded value. It didn't matter what reinsurance deal we were looking at or what broker/dealer arrangement we were looking at. We asked what the impact on embedded value was. We made no decisions without understanding what it was going to do to our economic picture. I think it just makes your life easier when you say to the chief operating or the chief financial officer, "Here's the impact on embedded value." Your job is done for the most part. I would say that 89 percent of the time we wouldn't say, "Well, we need to do this anyway." We let embedded value drive our process.
Introduction to Embedded Value 19
Chart 1
6
Movement in EV - BOY
Observations• UL block of business with 12% EV
discount rate
• Projected & Actual reflect BOY model
• This illustration assumes that free surplus is transferred to/from the corporate line so no interest on free surplus (negative value reflects transfer to corporate)
• Required return = EV * Hurdle Rate
• Note the value of the new business issued during the year is projected to be greater than zero (NB is creating value with a return greater than the EV rate of 12%)
12/31/2002Actual Projected
Opening ValueClosing value at end of prior year (12/31/2001) 1,500,000 1,500,000 Adjustments - - Opening value at beginning of year 1,500,000 1,500,000 Free SurplusInterest on free surplus - - Value added from free surplus - - Existing BusinessRequired return 180,000 180,000 Variances Mortality ? - Persistency ? - Expenses ? - Spreads ? - Assumption changes ? - Value added from existing business 180,000 180,000 New BusinessEmbedded value of new business at end of year 235,000 235,000 Cost of acquiring new business (125,000) (125,000) Value added from new business 110,000 110,000 Total value addedCapital transferred (out) in (5,000) (5,000) Explained Embedded Value (12/31/2002) 1,785,000 1,785,000 Closing Embedded Value (12/31/2002) 1,824,500 Difference 39,500
Movement in Embedded Value at 12% - Universal Life
Chart 2
7
Movement in EV – EOY (NB & Capital Transfer)
Observations• The closing EV has been determined
using the current in force and reflects the new business experience and capital transfers
• The challenge is to understand the impact each of the variances and assumption changes had on the EV
• If new business had a negative return this would be of interest to pricing
12/31/2002Actual Projected
Opening ValueClosing value at end of prior year (12/31/2001) 1,500,000 1,500,000 Adjustments - - Opening value at beginning of year 1,500,000 1,500,000 Free SurplusInterest on free surplus - - Value added from free surplus - - Existing BusinessRequired return 180,000 180,000 Variances Mortality ? - Persistency ? - Expenses ? - Spreads ? - Assumption changes ? - Value added from existing business 180,000 180,000 New BusinessEmbedded value of new business at end of year 200,000 235,000 Cost of acquiring new business (110,000) (125,000) Value added from new business 90,000 110,000 Total value addedCapital transferred (out) in 5,000 (5,000) Explained Embedded Value (12/31/2002) 1,775,000 1,785,000 Closing Embedded Value (12/31/2002) 1,824,500 Difference 49,500
Movement in Embedded Value at 12% - Universal Life
Introduction to Embedded Value 20
Chart 3
8
Movement in EV – EOY (Persistency)
Observations• Persistency was determined to be the
most material change
• The variance could be further broken down to reflect current period impact vs. impact on value of inforce at the end of the year
• The movement will require numerous runs to identify and quantify the variances
12/31/2002Actual Projected
Opening ValueClosing value at end of prior year (12/31/2001) 1,500,000 1,500,000 Adjustments - - Opening value at beginning of year 1,500,000 1,500,000 Free SurplusInterest on free surplus - - Value added from free surplus - - Existing BusinessRequired return 180,000 180,000 Variances Mortality ? - Persistency 32,000 - Expenses ? - Spreads ? - Assumption changes ? - Value added from existing business 212,000 180,000 New BusinessEmbedded value of new business at end of year 200,000 235,000 Cost of acquiring new business (110,000) (125,000) Value added from new business 90,000 110,000 Total value addedCapital transferred (out) in 5,000 (5,000) Explained Embedded Value (12/31/2002) 1,807,000 1,785,000
Closing Embedded Value (12/31/2002) 1,824,500 Difference 17,500
Movement in Embedded Value at 12% - Universal Life
Chart 4
9
Movement in EV – EOY (Other Variances)
Observations• Continue to introduce and quantify the
impact of one variance at a time
• In practice all of the variance will not be reconciled…usually presented as “Other”
12/31/2002Actual Projected
Opening ValueClosing value at end of prior year (12/31/2001) 1,500,000 1,500,000 Adjustments - - Opening value at beginning of year 1,500,000 1,500,000 Free SurplusInterest on free surplus - - Value added from free surplus - - Existing BusinessRequired return 180,000 180,000 Variances Mortality (10,000) - Persistency 32,000 - Expenses (5,000) - Spreads (7,500) - Assumption changes ? - Value added from existing business 189,500 180,000 New BusinessEmbedded value of new business at end of year 200,000 235,000 Cost of acquiring new business (110,000) (125,000) Value added from new business 90,000 110,000 Total value addedCapital transferred (out) in 5,000 (5,000) Explained Embedded Value (12/31/2002) 1,784,500 1,785,000 Closing Embedded Value (12/31/2002) 1,824,500 Difference 40,000
Movement in Embedded Value at 12% - Universal Life

Introduction to Embedded Value 21
Chart 5
10
Movement in EV – EOY (Assumption Changes)
Observations• The assumption changes are presented
as a single line item for convenience
• Proceed with assumption changes consistent with variances
• Assumptions should reflect “best estimate”
12/31/2002Actual Projected
Opening ValueClosing value at end of prior year (12/31/2001) 1,500,000 1,500,000 Adjustments - - Opening value at beginning of year 1,500,000 1,500,000 Free SurplusInterest on free surplus - - Value added from free surplus - - Existing BusinessRequired return 180,000 180,000 Variances Mortality (10,000) - Persistency 32,000 - Expenses (5,000) - Spreads (7,500) - Assumption changes 40,000 - Value added from existing business 229,500 180,000 New BusinessEmbedded value of new business at end of year 200,000 235,000 Cost of acquiring new business (110,000) (125,000) Value added from new business 90,000 110,000 Total value addedCapital transferred (out) in 5,000 (5,000) Explained Embedded Value (12/31/2002) 1,824,500 1,785,000 Closing Embedded Value (12/31/2002) 1,824,500 Difference -
Movement in Embedded Value at 12% - Universal Life
Chart 6
10
Movement Analysis Details (000)Variable Annuity Block
VBIF ANW Total
1 Value New Business at point of sale 50,808 - 50,808 2 Impact Internal acquisition expenses - (23,170) (23,170) 3 Impact External acquisition expenses - (22,806) (22,806) 4 Present Value of New Business for the Year (VNB) 50,808 (45,976) 4,832
5 Planned return 100,041 - 100,041 6 Return Shareholder Equity - 12,740 12,740
7 Return on value of contracts in-force previous year 100,041 12,740 112,781

Introduction to Embedded Value 22
Chart 7
11
Movement Analysis Details (000)- continuedVariable Annuity Block
VBIF ANW Total
8 Maintenance Expenses experience - 1,464 1,464 9 Surrender Experience (26,762) (7,837) (34,599)
10 Reserve Movements experience 19,751 (20,113) (362) 11 Other non-financial experience (161,544) 201,910 40,366
1 2 Outcome compared with operative assumptions (true-up) (168,555) 175,424 6,869
13 Maintenance Expenses assumptions (102,137) - (102,137) 14 Mortality Expenses assumptions (92,905) - (92,905) 15 Surrender assumptions (6,086) - (6,086) 16 Reserve movements In-force assumptions - - - 17 Other non-financial assumption 104,359 - 104,359
1 8 Change in operative assumptions (unlocking) (96,769) - (96,769)
Chart 8
12
Movement Analysis Details (000)- continued Variable Annuity Block
VBIF ANW Total
19 Reserve Movements 264,738 (278,701) (13,964) 20 Asset based Revenues (360,264) (47,146) (407,410) 21 Asset based Costs 50,066 7,609 57,675 22 Other (74,341) (2,761) (77,102) 23 Financial experience effects (119,802) (320,999) (440,801)
24 Fund Return (57,538) - (57,538) 25 Discount rate 41,526 - 41,526 26 Financial assumptions changes (16,012) - (16,012)
2 7 Financial Effects (135,814) (320,999) (456,813)

Introduction to Embedded Value 23
Chart 9
13
Movement Analysis Details (000)- continued Variable Annuity Block
VBIF ANW Total
28 Total Value Added (250,289) (178,812) (429,101)
29 Expected Return (94,795) 94,795 -
30 Operating Result Pre-Tax pre-financing (345,084) (84,018) (429,101)
31 Financing - (74,402) (74,402)
32 Operating Result Pre-Tax post financing (250,289) (253,214) (503,503)