Embed Size (px)
Citation preview
Introduction to European Investment
Fund Supporting Technology driven SMEs through early-stage
equity investment
Tbilisi, Georgia, September 2016
1
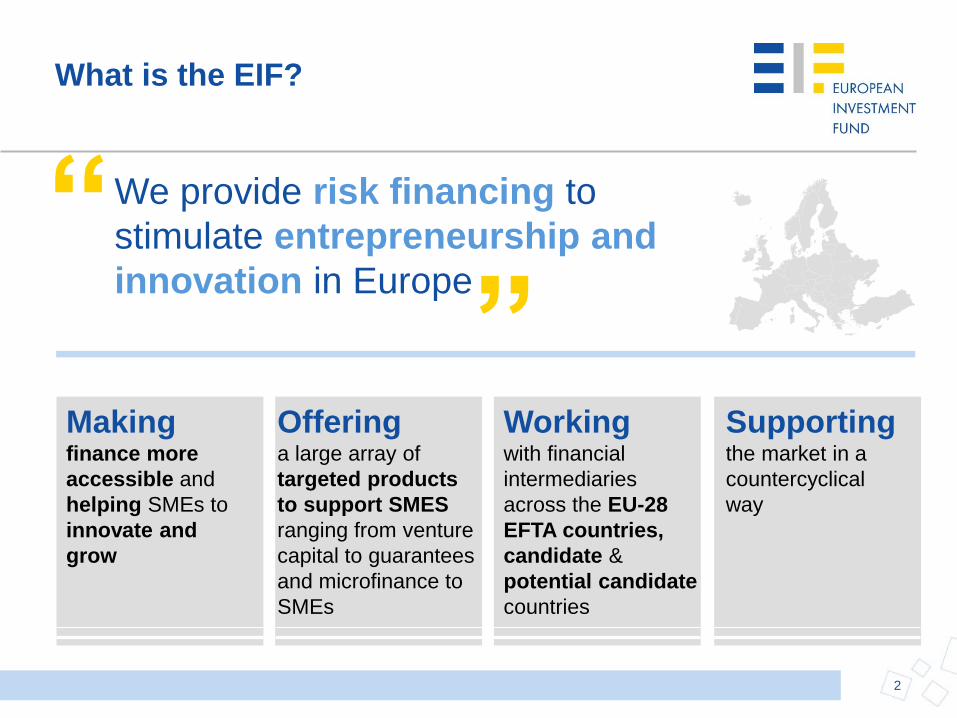
What is the EIF?
2
We provide risk financing to
stimulate entrepreneurship and
innovation in Europe
“ ”
Working with financial
intermediaries
across the EU-28
EFTA countries,
candidate &
potential candidate
countries
Making finance more
accessible and
helping SMEs to
innovate and
grow
Offering a large array of
targeted products
to support SMES
ranging from venture
capital to guarantees
and microfinance to
SMEs
Supporting the market in a
countercyclical
way
3
“
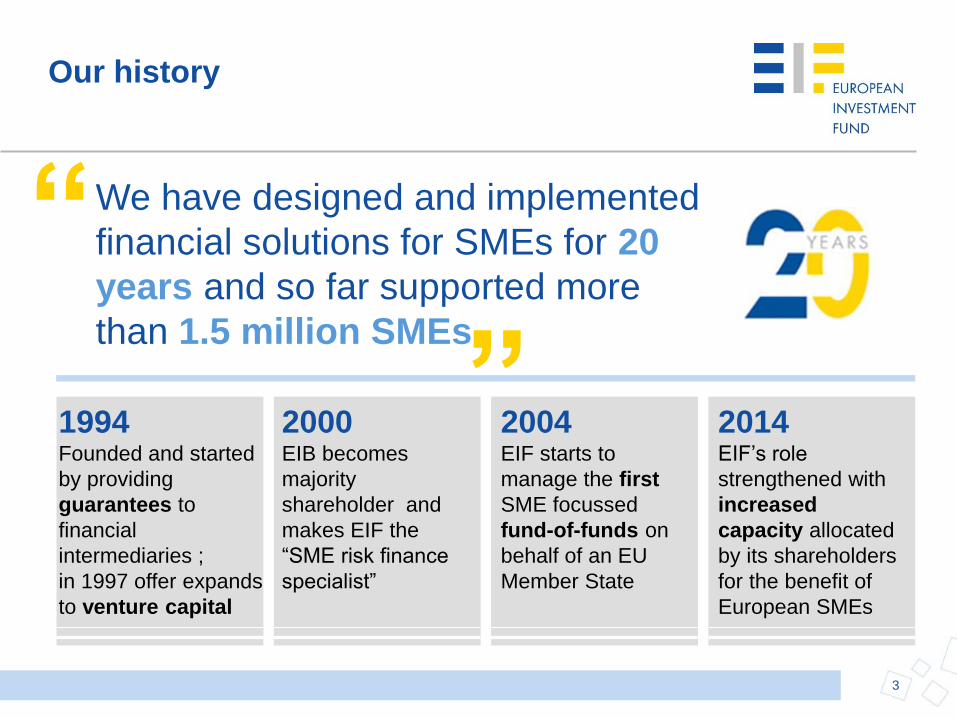
2000 EIB becomes
majority
shareholder and
makes EIF the
“SME risk finance
specialist”
2004 EIF starts to
manage the first
SME focussed
fund-of-funds on
behalf of an EU
Member State
2014 EIF’s role
strengthened with
increased
capacity allocated
by its shareholders
for the benefit of
European SMEs
1994 Founded and started
by providing
guarantees to
financial
intermediaries ;
in 1997 offer expands
to venture capital
”
We have designed and implemented
financial solutions for SMEs for 20
years and so far supported more
than 1.5 million SMEs
Our history
”
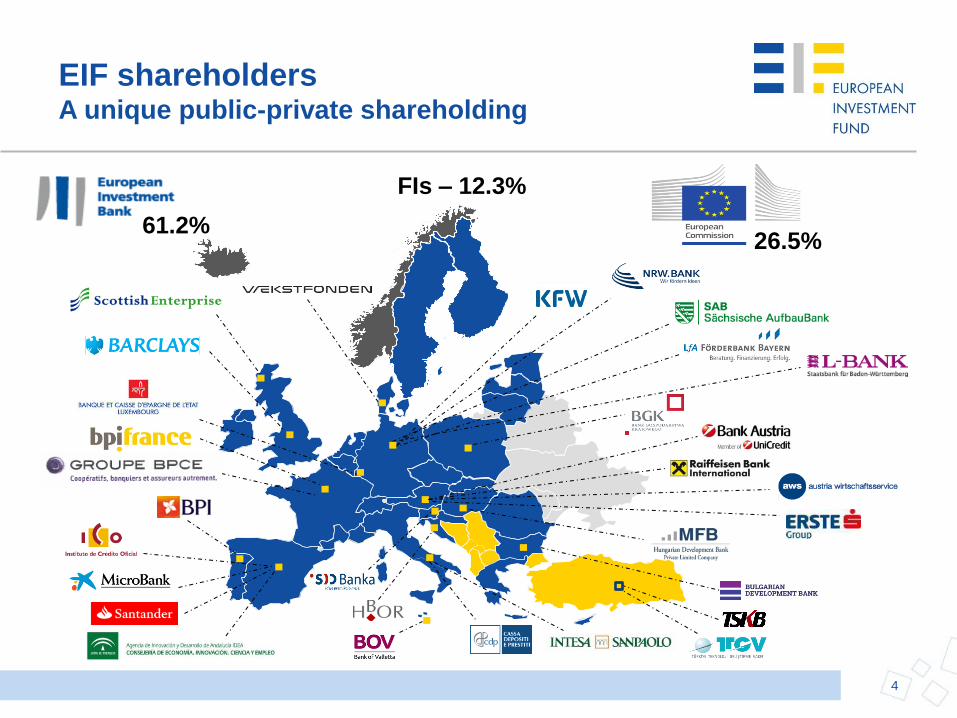
26.5%
4
61.2%
FIs – 12.3%
EIF shareholders A unique public-private shareholding
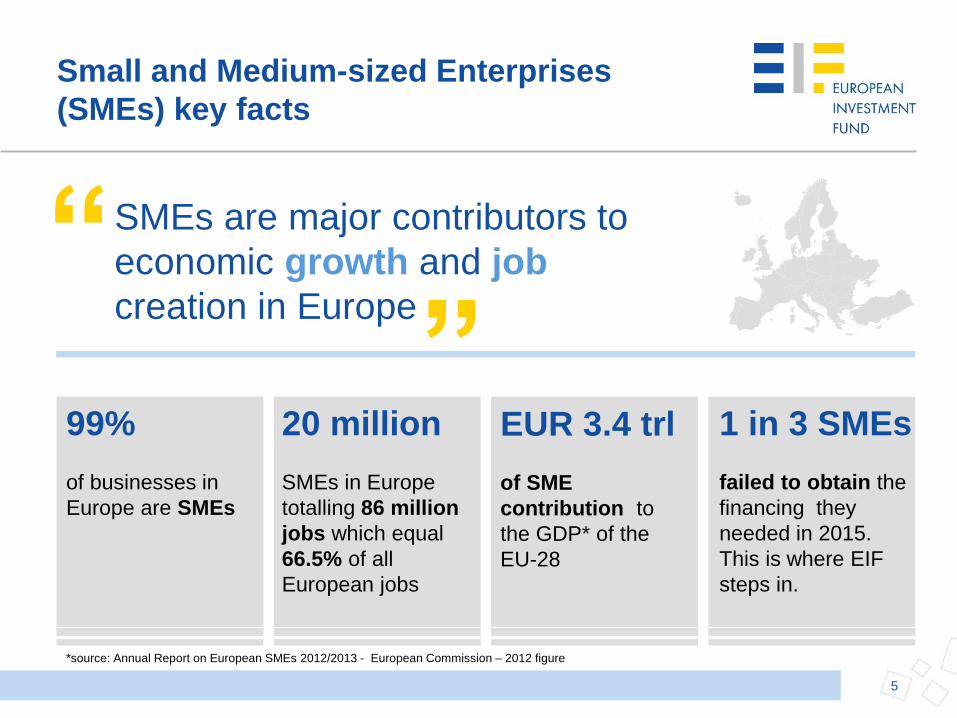
Small and Medium-sized Enterprises
(SMEs) key facts
5
SMEs are major contributors to
economic growth and job
creation in Europe “
” 20 million
SMEs in Europe
totalling 86 million
jobs which equal
66.5% of all
European jobs
EUR 3.4 trl
of SME
contribution to
the GDP* of the
EU-28
99%
of businesses in
Europe are SMEs
1 in 3 SMEs
failed to obtain the
financing they
needed in 2015.
This is where EIF
steps in.
*source: Annual Report on European SMEs 2012/2013 - European Commission – 2012 figure
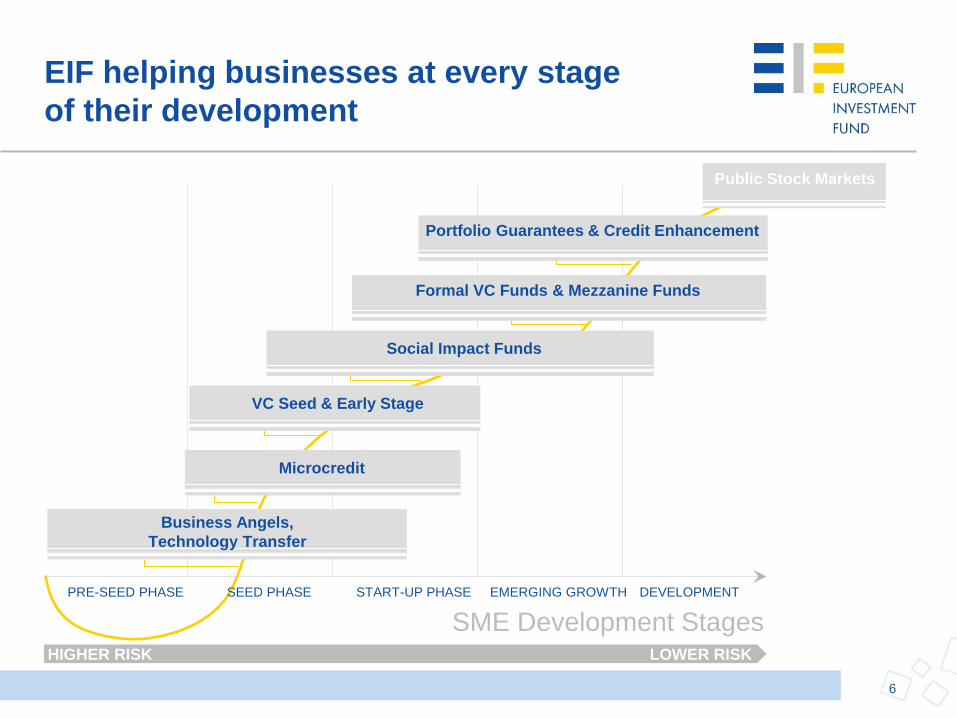
SME Development Stages
DEVELOPMENT
HIGHER RISK LOWER RISK
Public Stock Markets
Business Angels,
Technology Transfer
Microcredit
VC Seed & Early Stage
Portfolio Guarantees & Credit Enhancement
Formal VC Funds & Mezzanine Funds
PRE-SEED PHASE SEED PHASE START-UP PHASE EMERGING GROWTH
Social Impact Funds
EIF helping businesses at every stage
of their development
6
7
EIF Model
8
European Private Equity &
Venture Capital Market
Considerations
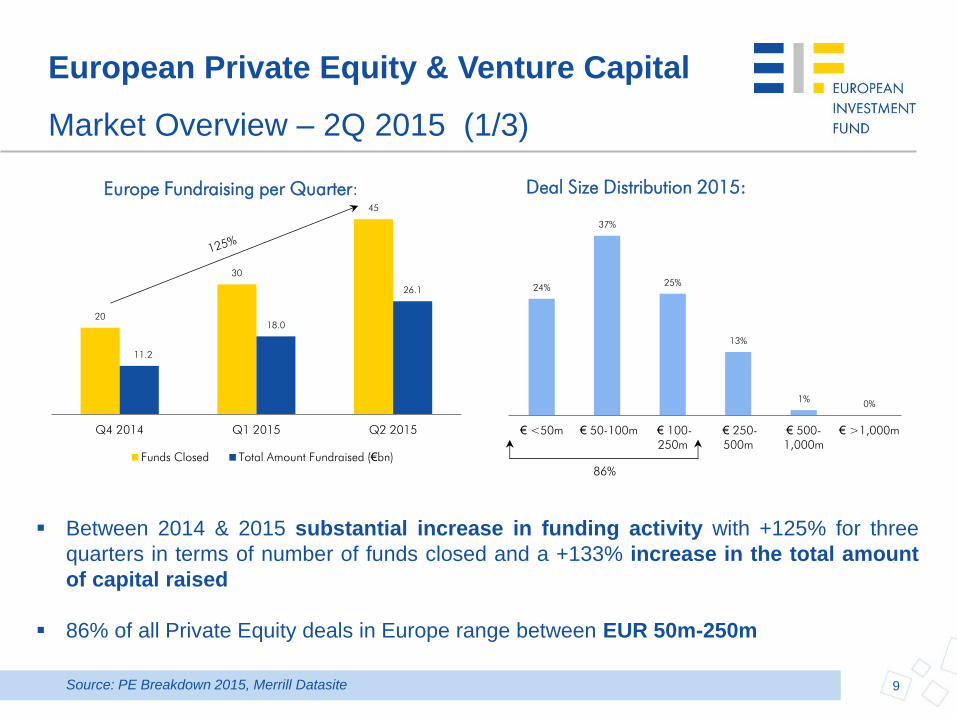
European Private Equity & Venture Capital
Market Overview – 2Q 2015 (1/3)
Between 2014 & 2015 substantial increase in funding activity with +125% for three
quarters in terms of number of funds closed and a +133% increase in the total amount
of capital raised
86% of all Private Equity deals in Europe range between EUR 50m-250m
20
30
45
11.2
18.0
26.1
Q4 2014 Q1 2015 Q2 2015
Funds Closed Total Amount Fundraised (€bn)
Europe Fundraising per Quarter: Deal Size Distribution 2015:
24%
37%
25%
13%
1% 0%
€ <50m € 50-100m € 100-
250m
€ 250-
500m
€ 500-
1,000m
€ >1,000m
86%
9 Source: PE Breakdown 2015, Merrill Datasite
European Private Equity & Venture Capital
Market Overview – 2Q 2015 (2/3)
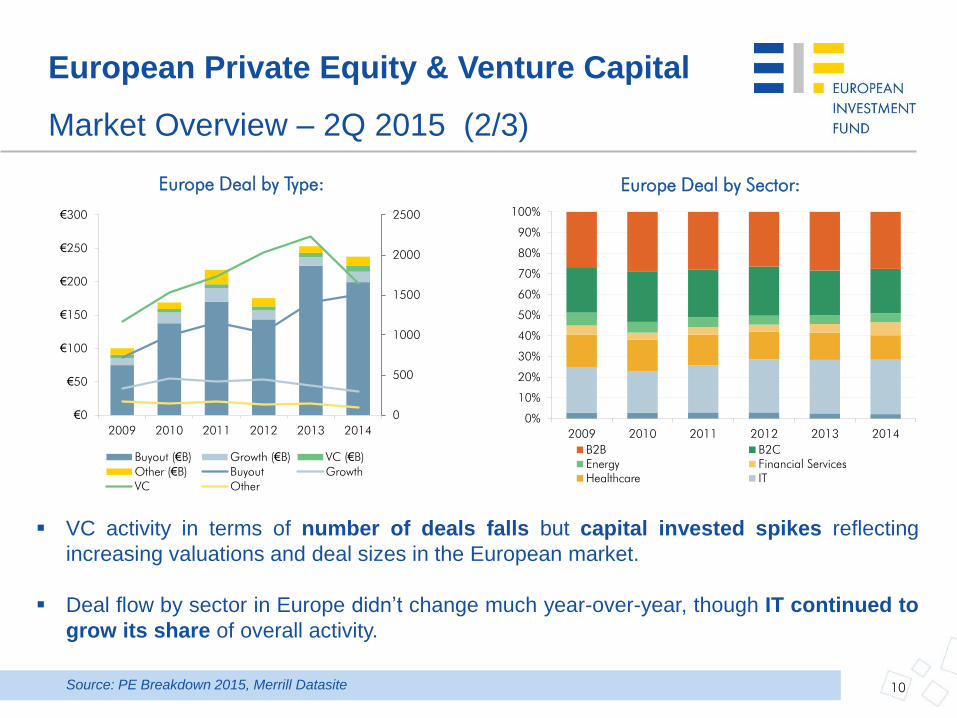
Europe Deal by Type:
0
500
1000
1500
2000
2500
€0
€50
€100
€150
€200
€250
€300
2009 2010 2011 2012 2013 2014
Buyout (€B) Growth (€B) VC (€B)
Other (€B) Buyout Growth
VC Other
0%
10%
20%
30%
40%
50%
60%
70%
80%
90%
100%
2009 2010 2011 2012 2013 2014
B2B B2C
Energy Financial Services
Healthcare IT
Europe Deal by Sector:
10
VC activity in terms of number of deals falls but capital invested spikes reflecting
increasing valuations and deal sizes in the European market.
Deal flow by sector in Europe didn’t change much year-over-year, though IT continued to
grow its share of overall activity.
Source: PE Breakdown 2015, Merrill Datasite
European Private Equity & Venture Capital
Market Overview – 2Q 2015 (3/3) € 22.6
€ 51.3
€ 91.6
€ 73.0
€ 103.3
€ 133.7
395
672
844
788
1,078
968
0
200
400
600
800
1,000
1,200
€ 0
€ 20
€ 40
€ 60
€ 80
€ 100
€ 120
€ 140
€ 160
2009 2010 2011 2012 2013 2014
Capital Exited (€B) # of Exits
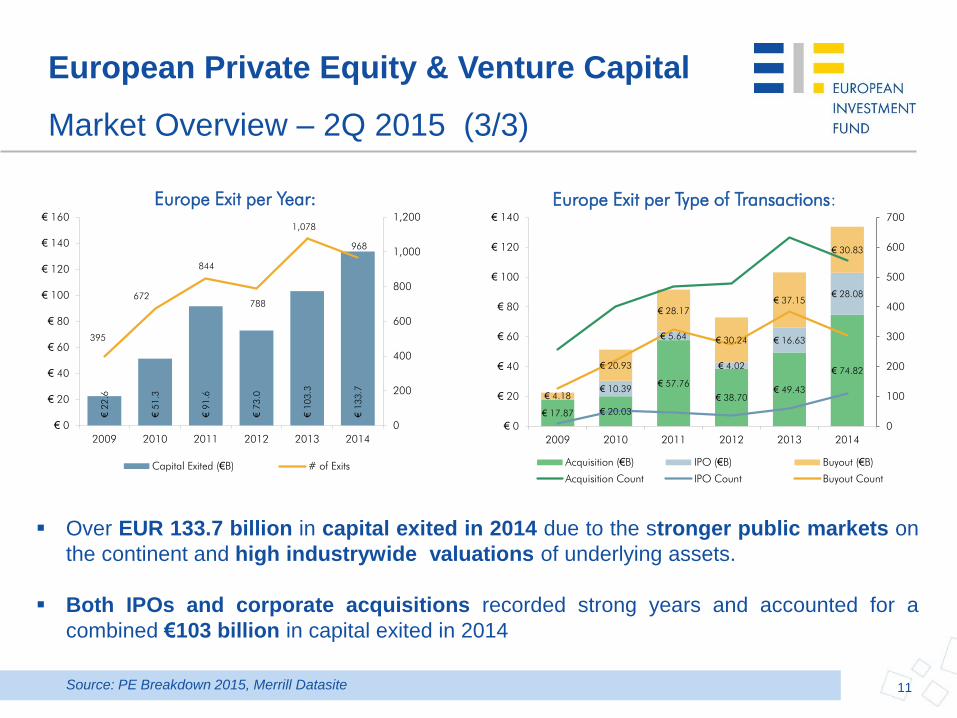
Europe Exit per Year:
€ 17.87 € 20.03
€ 57.76
€ 38.70
€ 49.43
€ 74.82
€ 10.39
€ 5.64
€ 4.02
€ 16.63
€ 28.08
€ 4.18
€ 20.93
€ 28.17
€ 30.24
€ 37.15
€ 30.83
0
100
200
300
400
500
600
700
€ 0
€ 20
€ 40
€ 60
€ 80
€ 100
€ 120
€ 140
2009 2010 2011 2012 2013 2014
Acquisition (€B) IPO (€B) Buyout (€B)
Acquisition Count IPO Count Buyout Count
Europe Exit per Type of Transactions:
Over EUR 133.7 billion in capital exited in 2014 due to the stronger public markets on
the continent and high industrywide valuations of underlying assets.
Both IPOs and corporate acquisitions recorded strong years and accounted for a
combined €103 billion in capital exited in 2014
11 Source: PE Breakdown 2015, Merrill Datasite
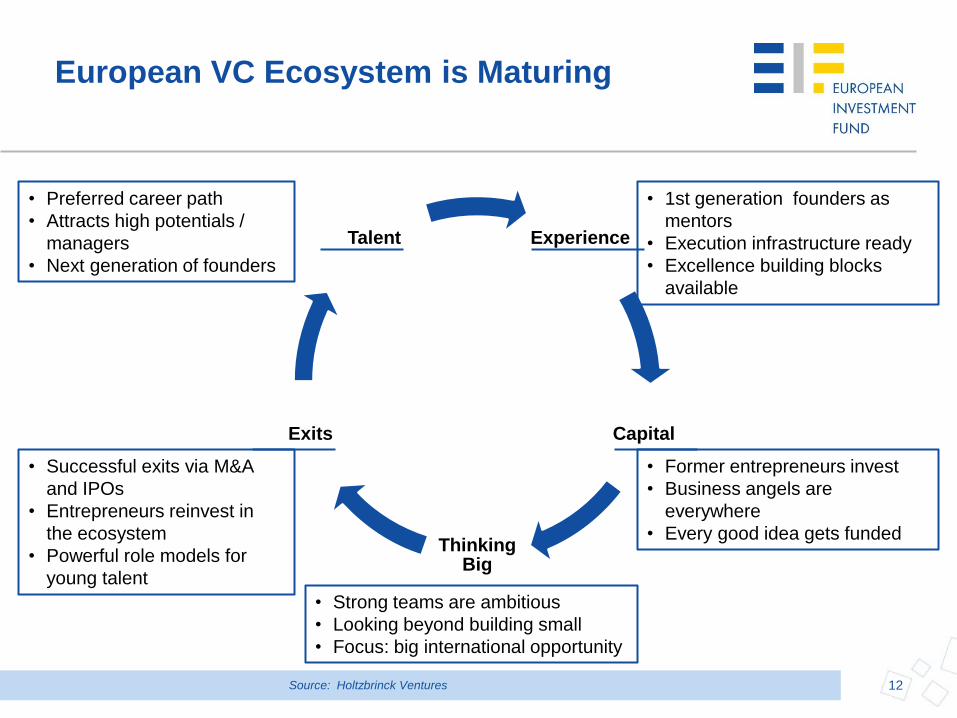
European VC Ecosystem is Maturing
12 Source: Holtzbrinck Ventures
Experience
Capital
Thinking Big
Exits
Talent
• Preferred career path
• Attracts high potentials /
managers
• Next generation of founders
• Successful exits via M&A
and IPOs
• Entrepreneurs reinvest in
the ecosystem
• Powerful role models for
young talent
• 1st generation founders as
mentors
• Execution infrastructure ready
• Excellence building blocks
available
• Former entrepreneurs invest
• Business angels are
everywhere
• Every good idea gets funded
• Strong teams are ambitious
• Looking beyond building small
• Focus: big international opportunity
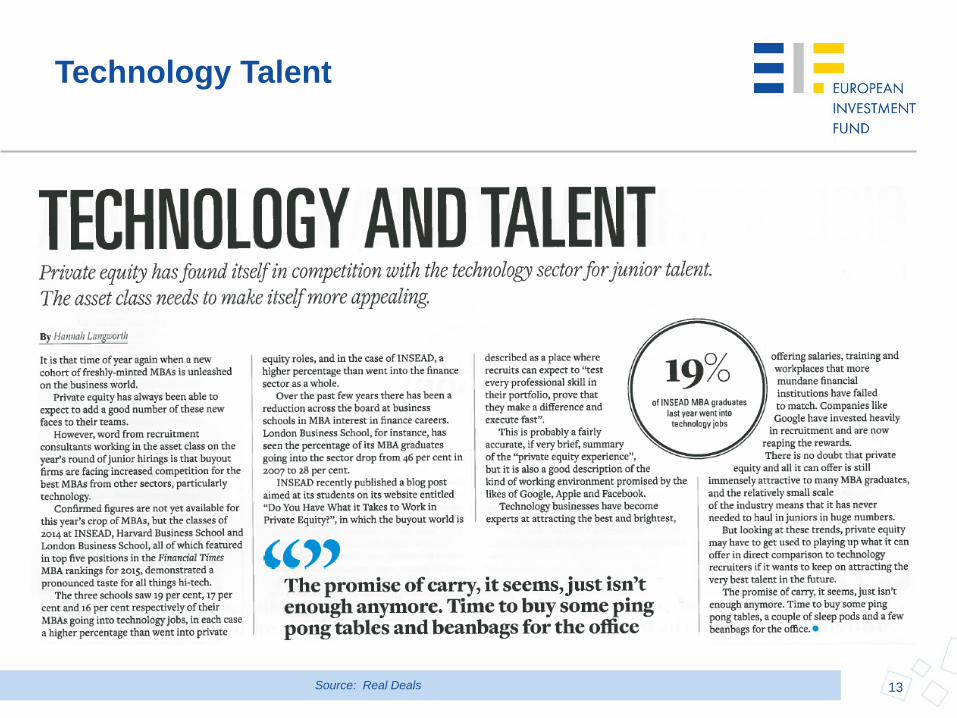
Technology Talent
13 Source: Real Deals
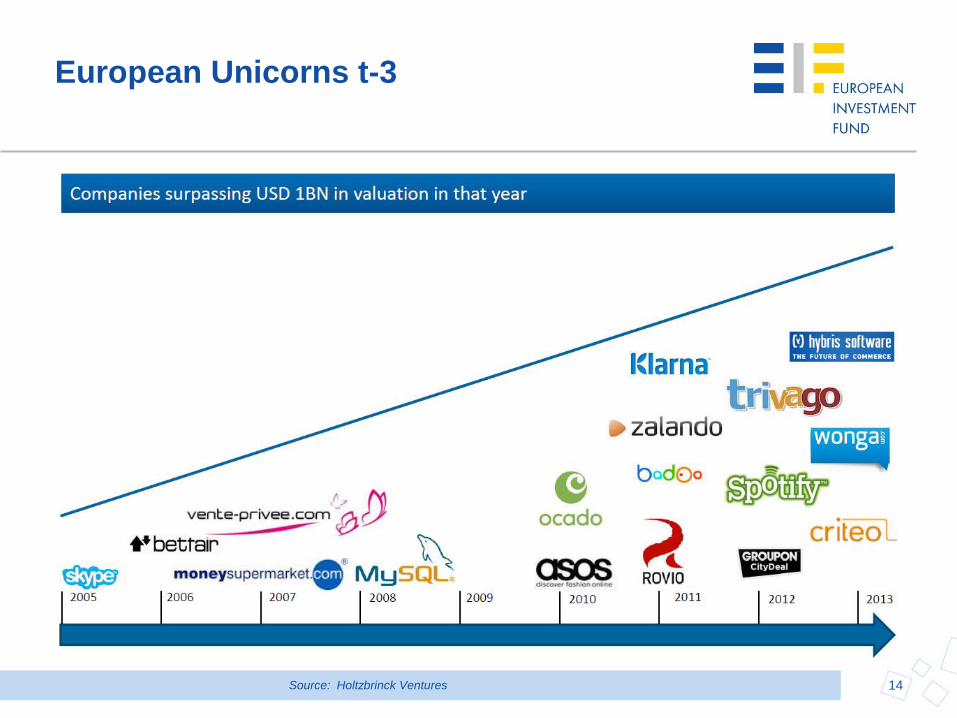
European Unicorns t-3
14 Source: Holtzbrinck Ventures
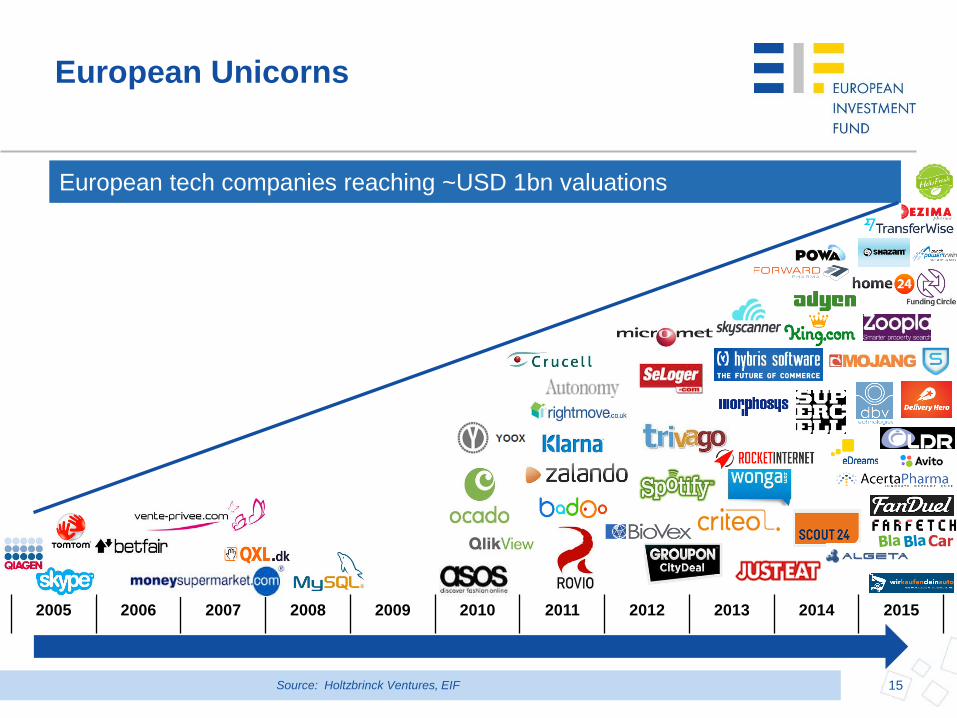
European Unicorns
Source: Holtzbrinck Ventures, EIF 15
European tech companies surpassing ~USD 1bn valuations
European tech companies reaching ~USD 1bn valuations
2005 2006 2007 2008 2009 2010 2011 2012 2013 2014 2015
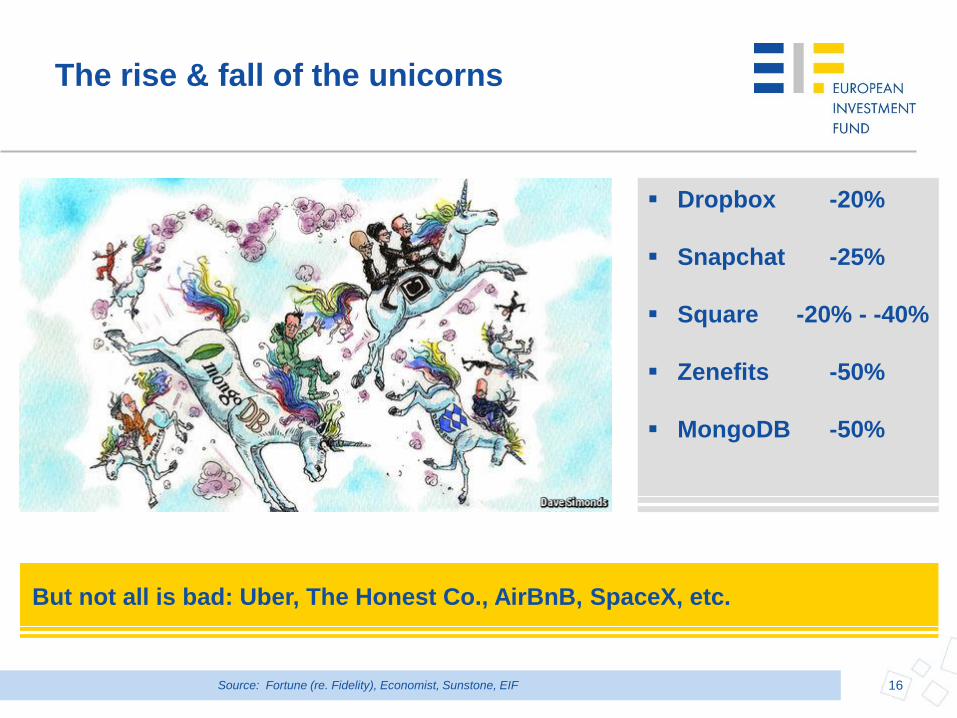
The rise & fall of the unicorns
16
Dropbox -20%
Snapchat -25%
Square -20% - -40%
Zenefits -50%
MongoDB -50%
But not all is bad: Uber, The Honest Co., AirBnB, SpaceX, etc.
Source: Fortune (re. Fidelity), Economist, Sunstone, EIF
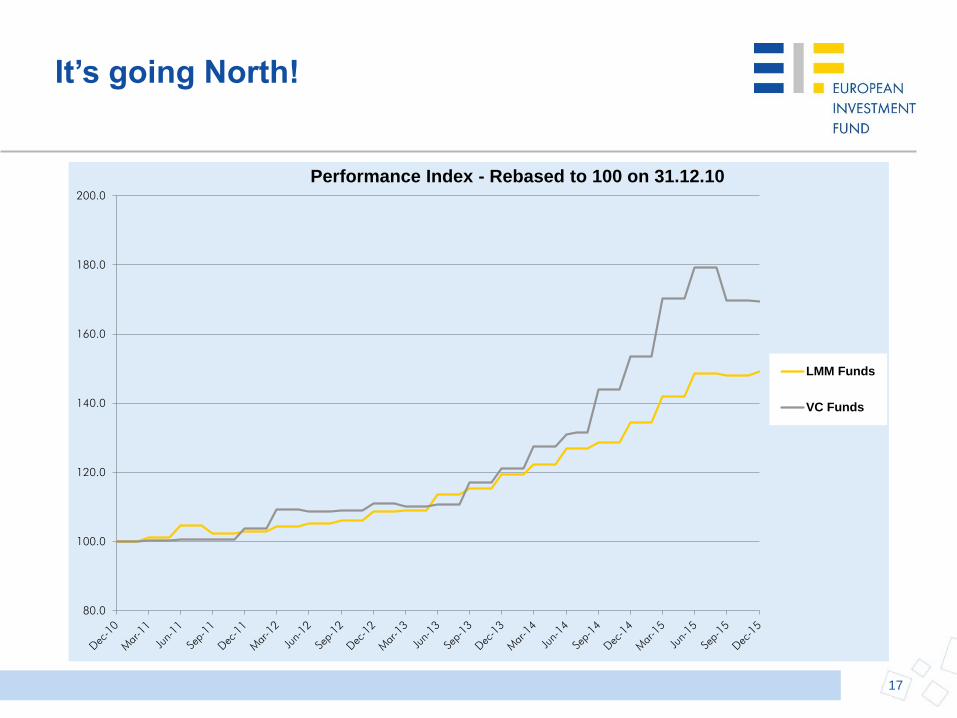
It’s going North!
17
80.0
100.0
120.0
140.0
160.0
180.0
200.0
Performance Index - Rebased to 100 on 31.12.10
LMM Funds
VC Funds
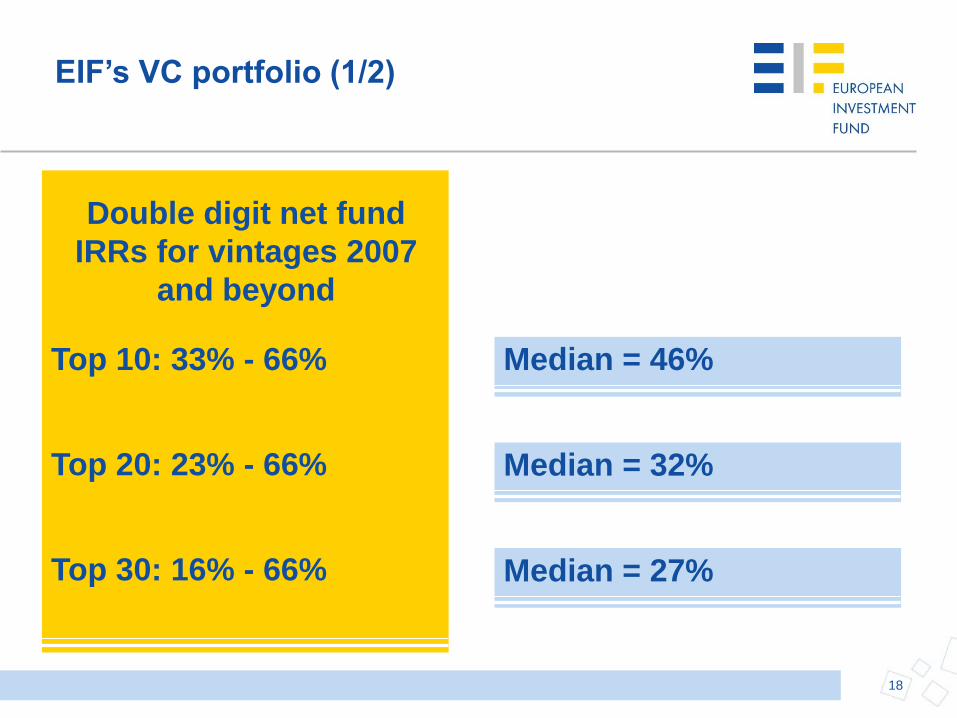
18
Median = 46%
EIF’s VC portfolio (1/2)
Double digit net fund
IRRs for vintages 2007
and beyond
Top 10: 33% - 66%
Top 20: 23% - 66%
Top 30: 16% - 66%
Median = 32%
Median = 27%
19
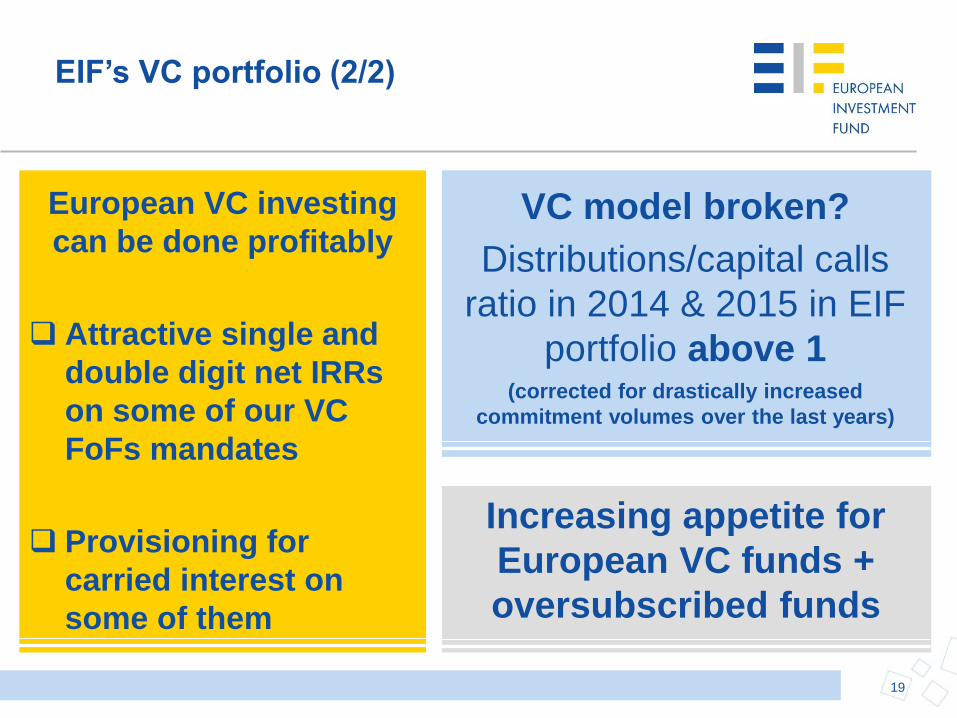
VC model broken?
Distributions/capital calls
ratio in 2014 & 2015 in EIF
portfolio above 1 (corrected for drastically increased
commitment volumes over the last years)
Increasing appetite for
European VC funds +
oversubscribed funds
EIF’s VC portfolio (2/2)
European VC investing
can be done profitably
Attractive single and
double digit net IRRs
on some of our VC
FoFs mandates
Provisioning for
carried interest on
some of them
20
Equity Investment Organisation
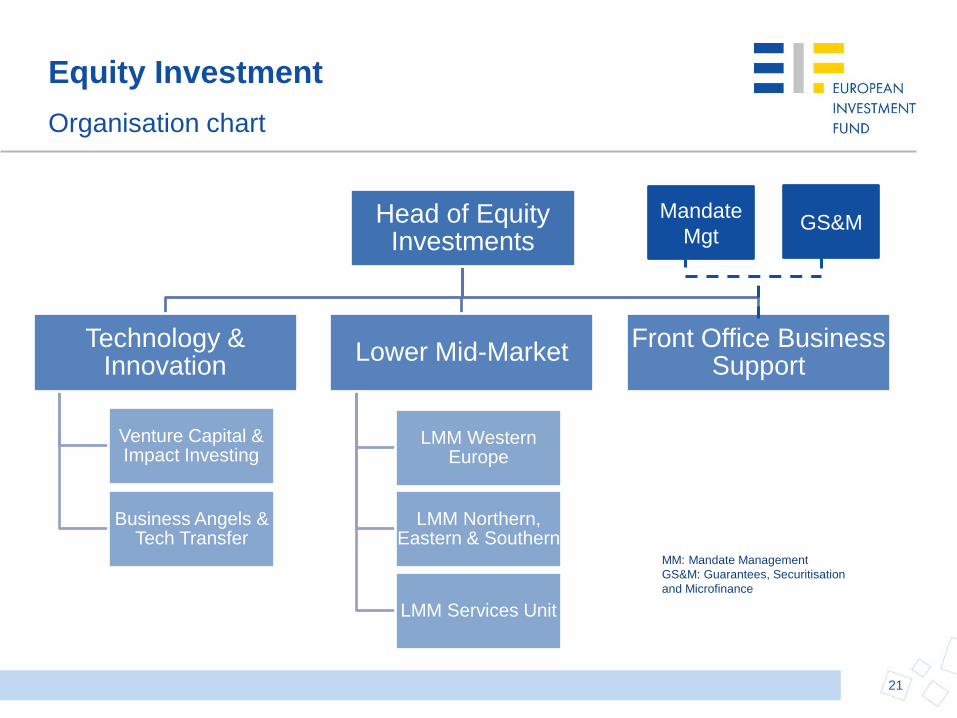
21
Head of Equity Investments
Technology & Innovation
Venture Capital & Impact Investing
Business Angels & Tech Transfer
Lower Mid-Market
LMM Western Europe
LMM Northern, Eastern & Southern
LMM Services Unit
Front Office Business Support
MM: Mandate Management
GS&M: Guarantees, Securitisation
and Microfinance
Mandate
Mgt GS&M
Equity Investment
Organisation chart
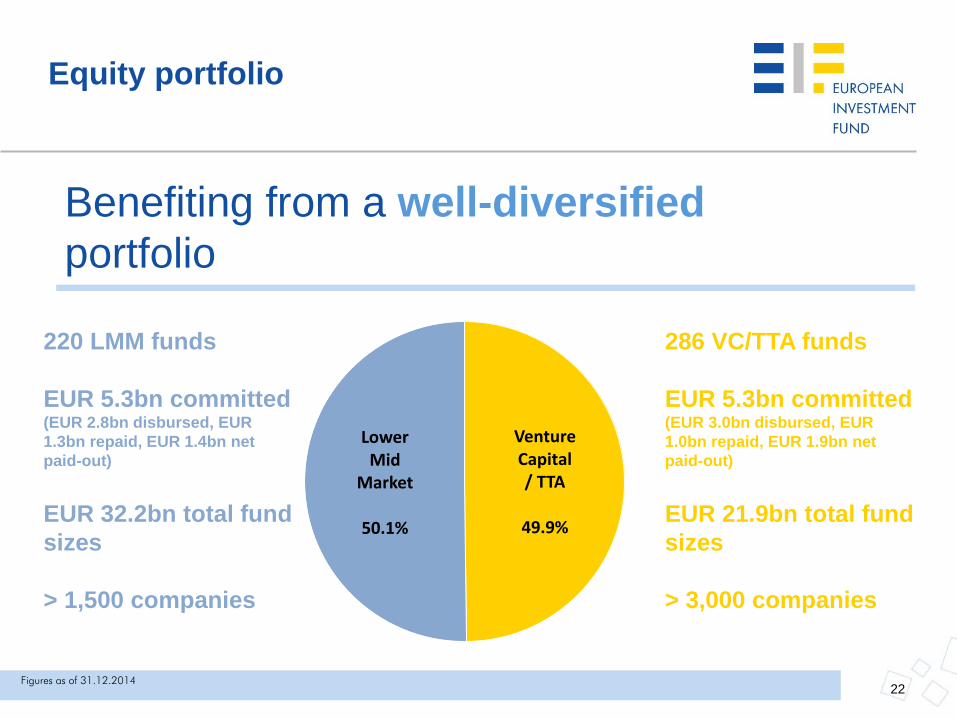
Benefiting from a well-diversified
portfolio
220 LMM funds
EUR 5.3bn committed (EUR 2.8bn disbursed, EUR
1.3bn repaid, EUR 1.4bn net
paid-out)
EUR 32.2bn total fund
sizes
> 1,500 companies
286 VC/TTA funds
EUR 5.3bn committed (EUR 3.0bn disbursed, EUR
1.0bn repaid, EUR 1.9bn net
paid-out)
EUR 21.9bn total fund
sizes
> 3,000 companies
Venture Capital / TTA
49.9%
Lower Mid
Market
50.1%
Figures as of 31.12.2014
Equity portfolio
22
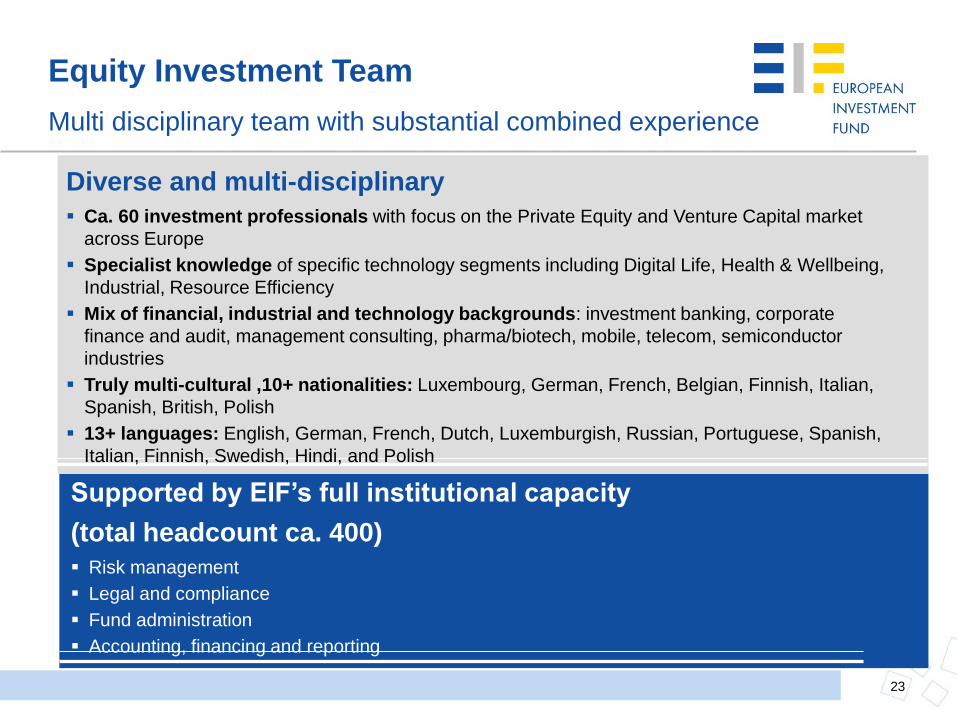
Diverse and multi-disciplinary
Ca. 60 investment professionals with focus on the Private Equity and Venture Capital market
across Europe
Specialist knowledge of specific technology segments including Digital Life, Health & Wellbeing,
Industrial, Resource Efficiency
Mix of financial, industrial and technology backgrounds: investment banking, corporate
finance and audit, management consulting, pharma/biotech, mobile, telecom, semiconductor
industries
Truly multi-cultural ,10+ nationalities: Luxembourg, German, French, Belgian, Finnish, Italian,
Spanish, British, Polish
13+ languages: English, German, French, Dutch, Luxemburgish, Russian, Portuguese, Spanish,
Italian, Finnish, Swedish, Hindi, and Polish
Supported by EIF’s full institutional capacity
(total headcount ca. 400)
Risk management
Legal and compliance
Fund administration
Accounting, financing and reporting
Equity Investment Team
Multi disciplinary team with substantial combined experience
23
24
Investment Process

EIF’s Investment Process
25
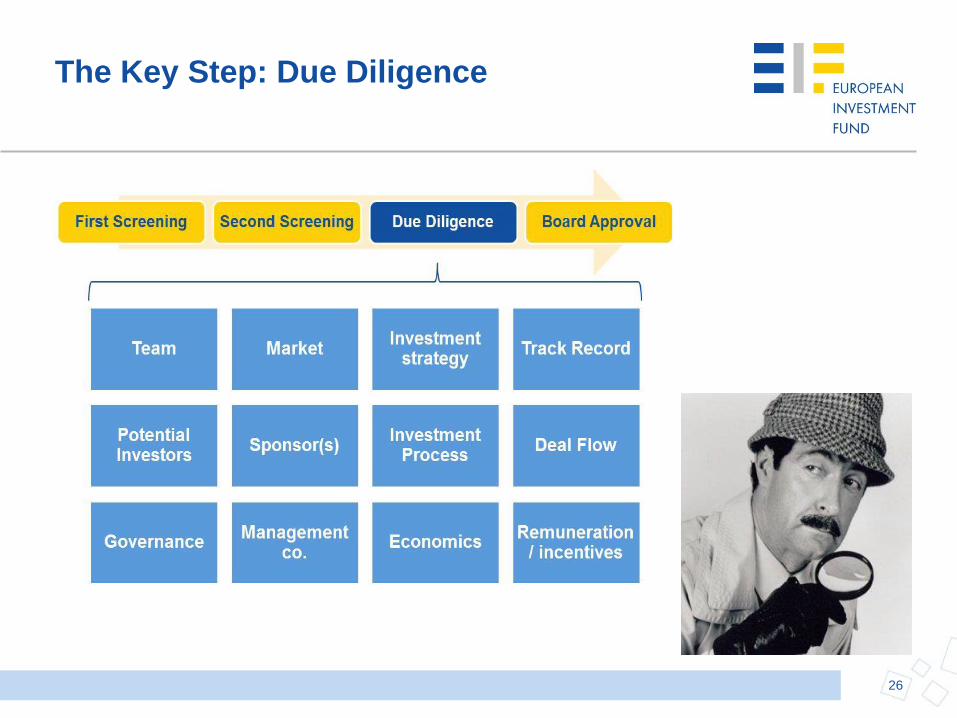
The Key Step: Due Diligence
26
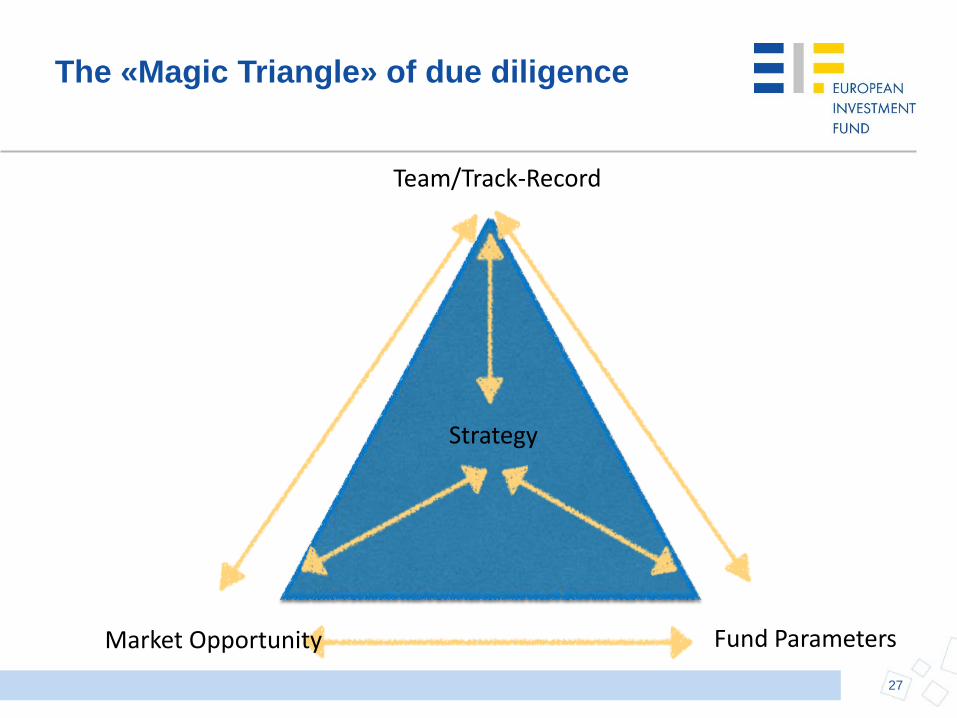
The «Magic Triangle» of due diligence
Strategy
Team/Track-Record
Market Opportunity Fund Parameters
27
1. Strategy
The Strategy
• What:
– Focus of investment program
– Drivers of value creation
• How:
– Team’s past experience and skillset
– Compare with other market players
– Market opportunity and competition
– Deal-flow analysis
– Sustainability
– Fit with policy objectives
– …
28
2. Track Record
• What:
– Assessment of past performance
• How:
– Relevance
– Attribution to the team
– Prospects of current portfolio
– Value creation
– Crisis Management
– Benchmarking against peers
– …
29
3. Team
• What:
– Assessment of team potential
• How:
– Background of team members
– Complementarity / completeness of skillset
– Stability / Turnover
– Alignment of Interests and incentives
– Succession issues
– Reputation
– …
30
4. The Market
• What:
– Analysis of market opportunity
• How:
– Macro-economic trends
– Regulatory environment
– Market deal-flow
– Competition
– Ranking
– …
31
5. Fund Terms and Conditions
• What:
– Structuring
– Economic terms
– Investor protection
• How:
– Legal negotiations!
32
Contact
33
Nitan Pathak
Institutional Business Development
European Investment Fund
37B avenue J.F. Kennedy
L-2968 Luxembourg
www.eif.org