Embed Size (px)
Citation preview
Introduction to Individualized Quality Control Plan (IQCP) The
New QC Policy from CMS
Jane L. Smith MS MT(ASCP) SI, DLM Scientific Affairs [email protected]
October 2013
Disclaimers
• I work for Alere
• Alere produces testing devices for use at POC
• Working with customers is my passion!
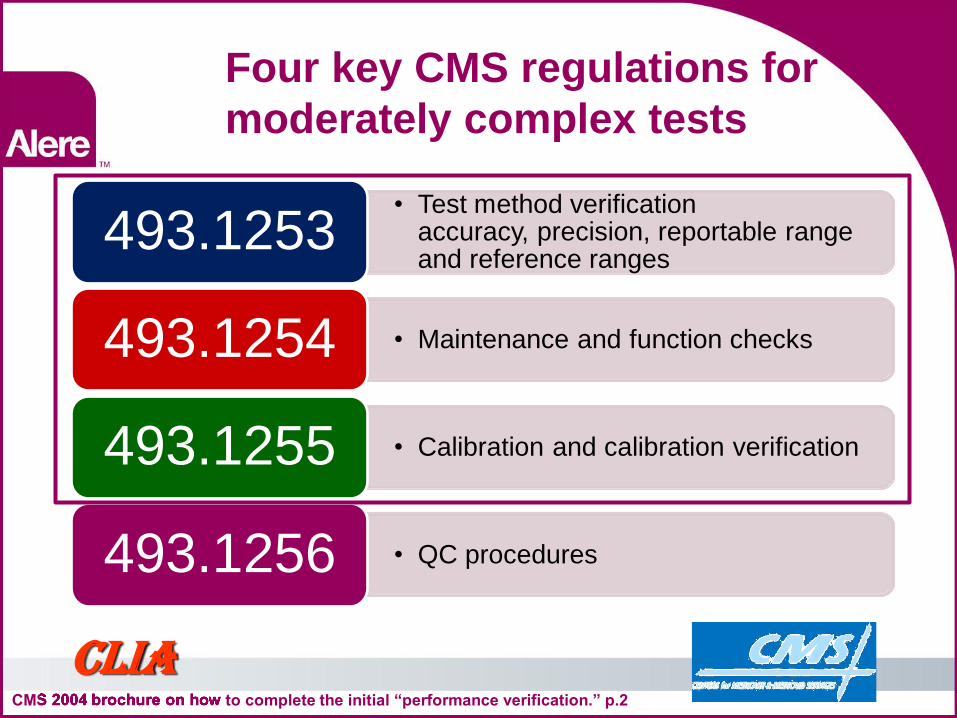
Four key CMS regulations for moderately complex tests
CMS 2004 brochure on how to complete the initial “performance verification.” p.2 CMS 2004 brochure on how to complete the initial “performance verification.” p.2 CMS 2004 brochure on how to complete the initial “performance verification.” p.2 CMS 2004 brochure on how to complete the initial “performance verification.” p.2
CLIA
• Test method verification accuracy, precision, reportable range and reference ranges
493.1253
• Maintenance and function checks 493.1254
• Calibration and calibration verification 493.1255
• QC procedures 493.1256
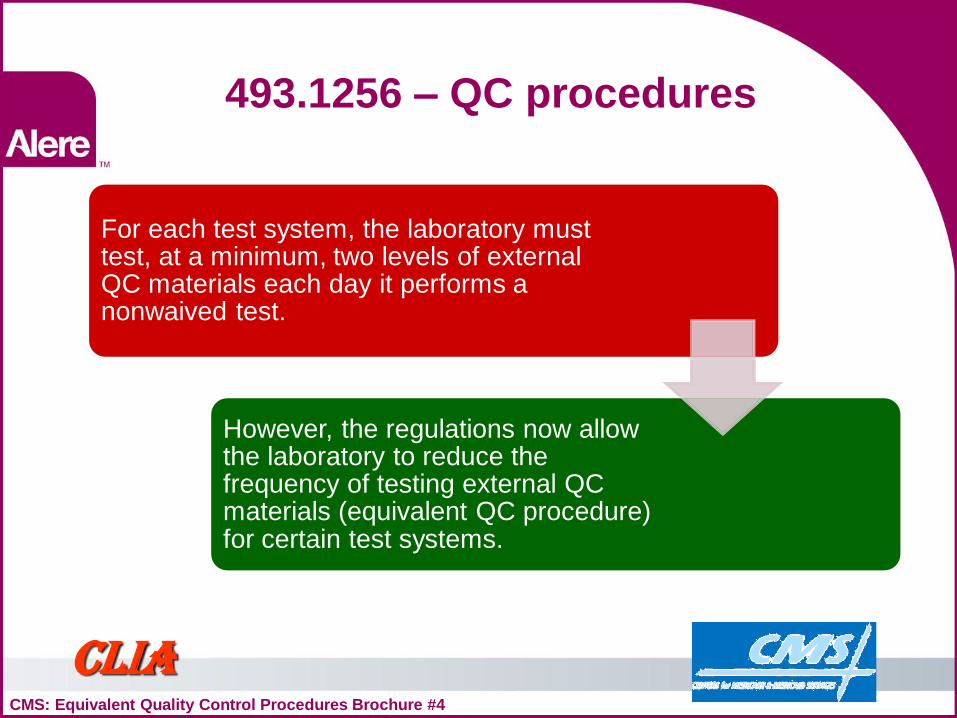
493.1256 – QC procedures
CLIA CMS: Equivalent Quality Control Procedures Brochure #4
For each test system, the laboratory musttest, at a minimum, two levels of external QC materials each day it performs a nonwaived test.
However, the regulations now allow the laboratory to reduce the frequency of testing external QC materials (equivalent QC procedure) for certain test systems.
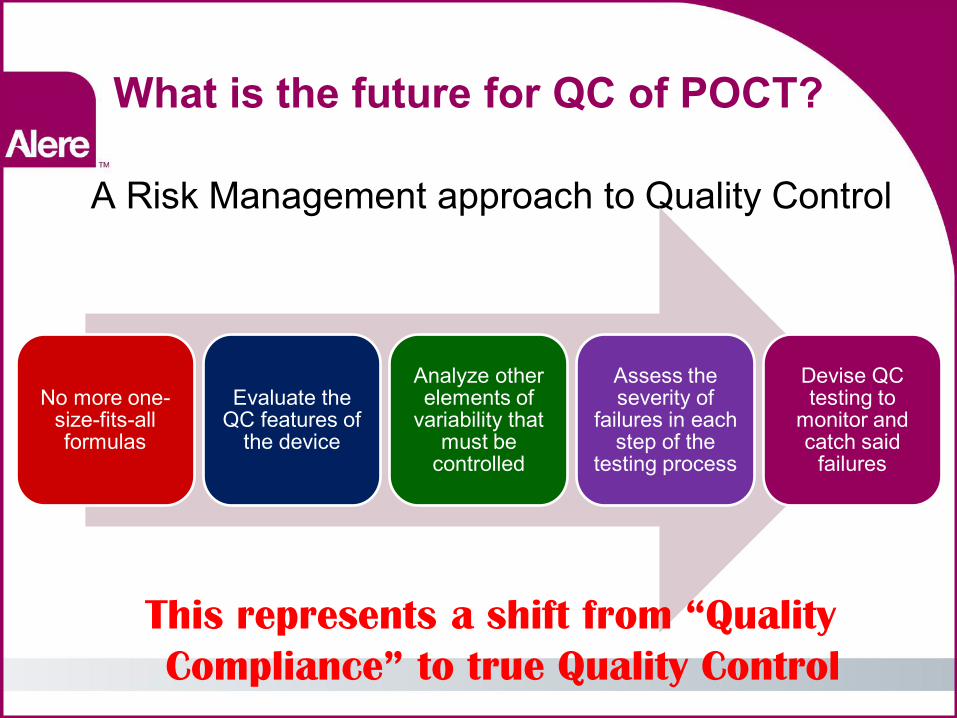
What is the future for QC of POCT?
A Risk Management approach to Quality Control
No more one-size-fits-all formulas
Evaluate the QC features of
the device
Analyze other elements of
variability that must be
controlled
Assess the severity of
failures in each step of the
testing process
Devise QC testing to
monitor and catch said
failures
This represents a shift from “Quality
Compliance” to true Quality Control
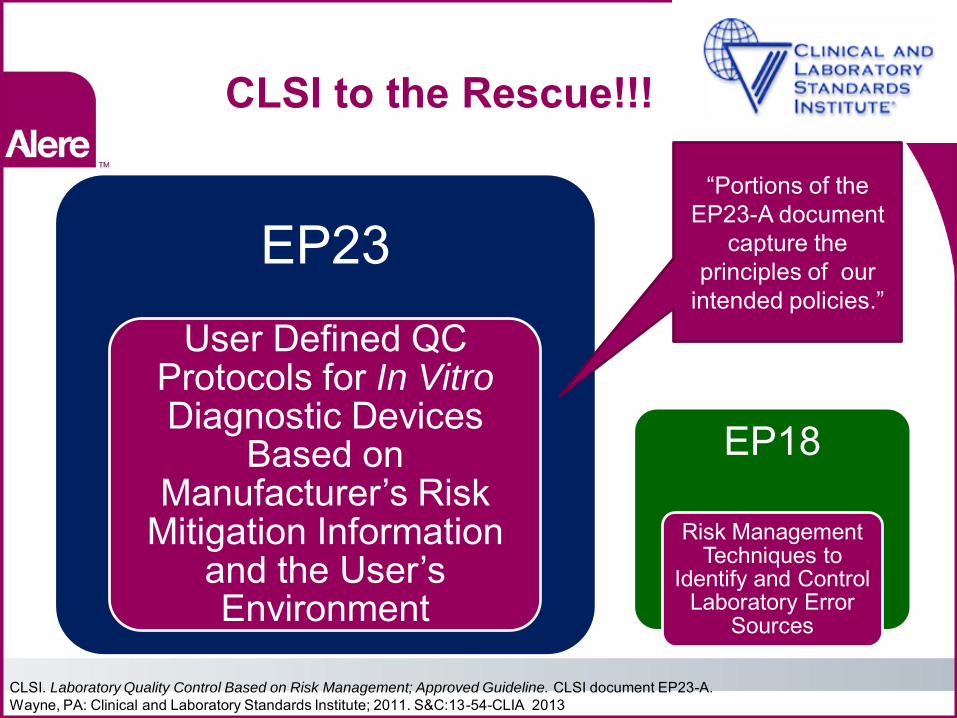
CLSI to the Rescue!!!
EP23 User Defined QC
Protocols for In Vitro Diagnostic Devices
Based on Manufacturer’s Risk
Mitigation Information and the User’s Environment
EP18
Risk Management Techniques to
Identify and Control Laboratory Error
Sources
CLSI. Laboratory Quality Control Based on Risk Management; Approved Guideline. CLSI document EP23-A. Wayne, PA: Clinical and Laboratory Standards Institute; 2011. S&C:13-54-CLIA 2013
“Portions of the EP23-A document
capture the principles of our
intended policies.”
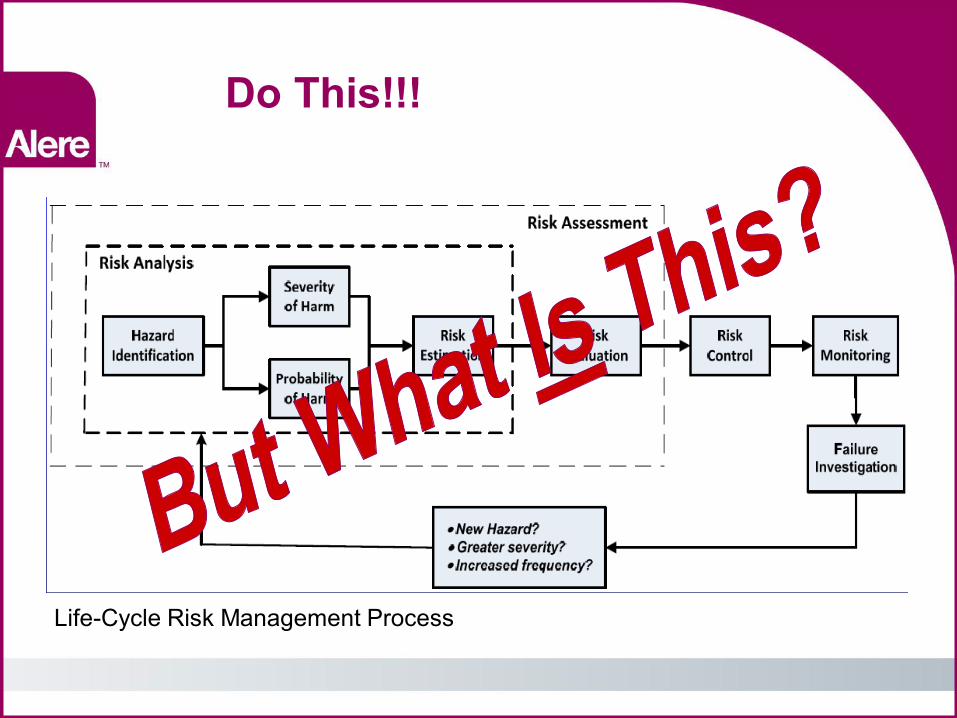
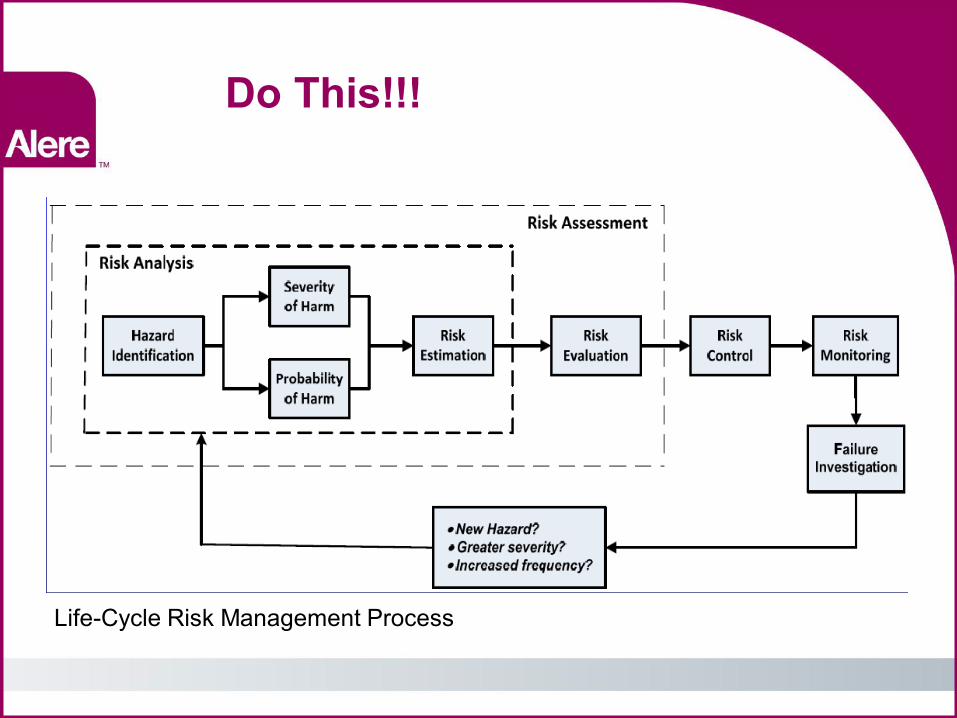
Do This!!!
Life-Cycle Risk Management Process
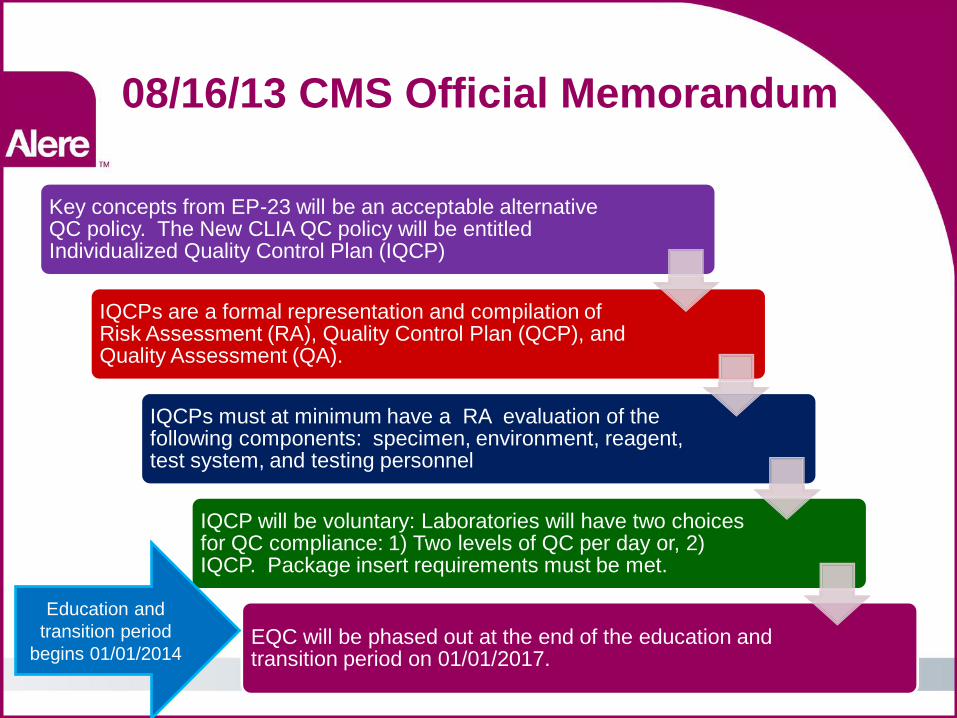
08/16/13 CMS Official Memorandum
Key concepts from EP-23 will be an acceptable alternative QC policy. The New CLIA QC policy will be entitled Individualized Quality Control Plan (IQCP)
IQCPs are a formal representation and compilation of Risk Assessment (RA), Quality Control Plan (QCP), and Quality Assessment (QA).
IQCPs must at minimum have a RA evaluation of the following components: specimen, environment, reagent, test system, and testing personnel
IQCP will be voluntary: Laboratories will have two choices for QC compliance: 1) Two levels of QC per day or, 2) IQCP. Package insert requirements must be met.
EQC will be phased out at the end of the education and transition period on 01/01/2017.
Education and transition period
begins 01/01/2014
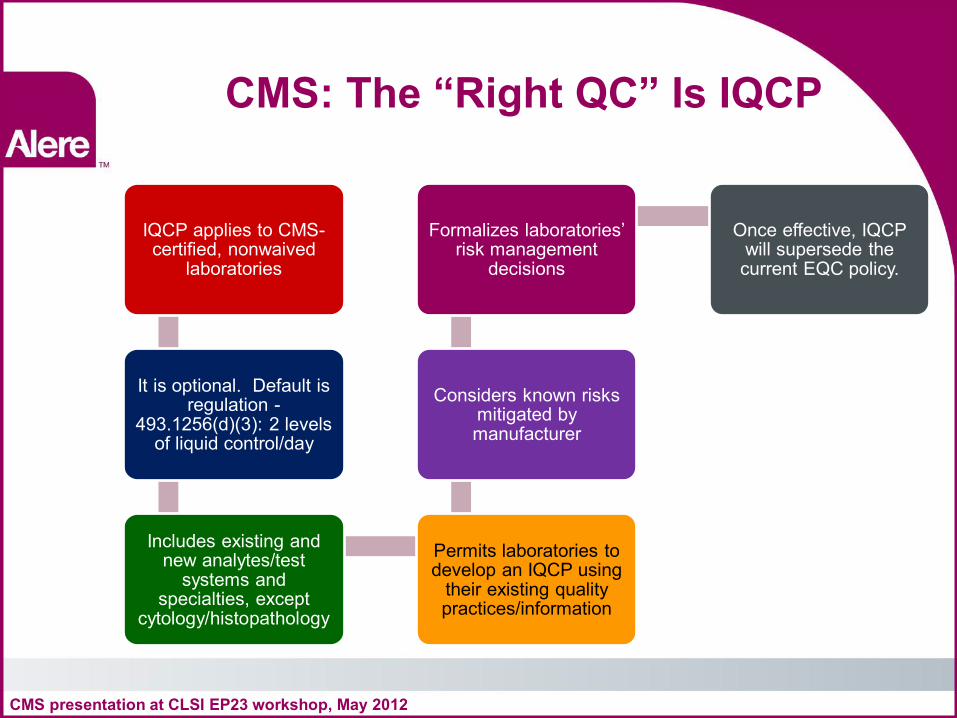
CMS: The “Right QC” Is IQCP
IQCP applies to CMS-certified, nonwaived
laboratories
It is optional. Default is regulation -
493.1256(d)(3): 2 levels of liquid control/day
Includes existing and new analytes/test
systems and specialties, except
cytology/histopathology
Permits laboratories to develop an IQCP using
their existing quality practices/information
Considers known risks mitigated by manufacturer
Formalizes laboratories’ risk management
decisions
Once effective, IQCP will supersede the current EQC policy.
CMS presentation at CLSI EP23 workshop, May 2012
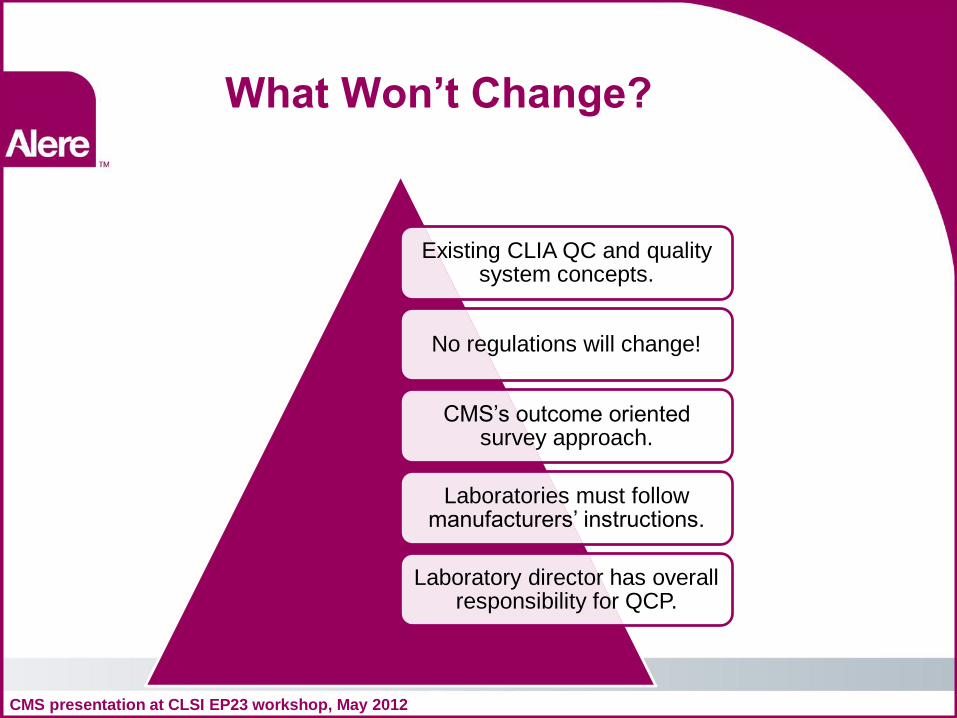
What Won’t Change?
Existing CLIA QC and quality system concepts.
No regulations will change!
CMS’s outcome oriented survey approach.
Laboratories must follow manufacturers’ instructions.
Laboratory director has overall responsibility for QCP.
CMS presentation at CLSI EP23 workshop, May 2012
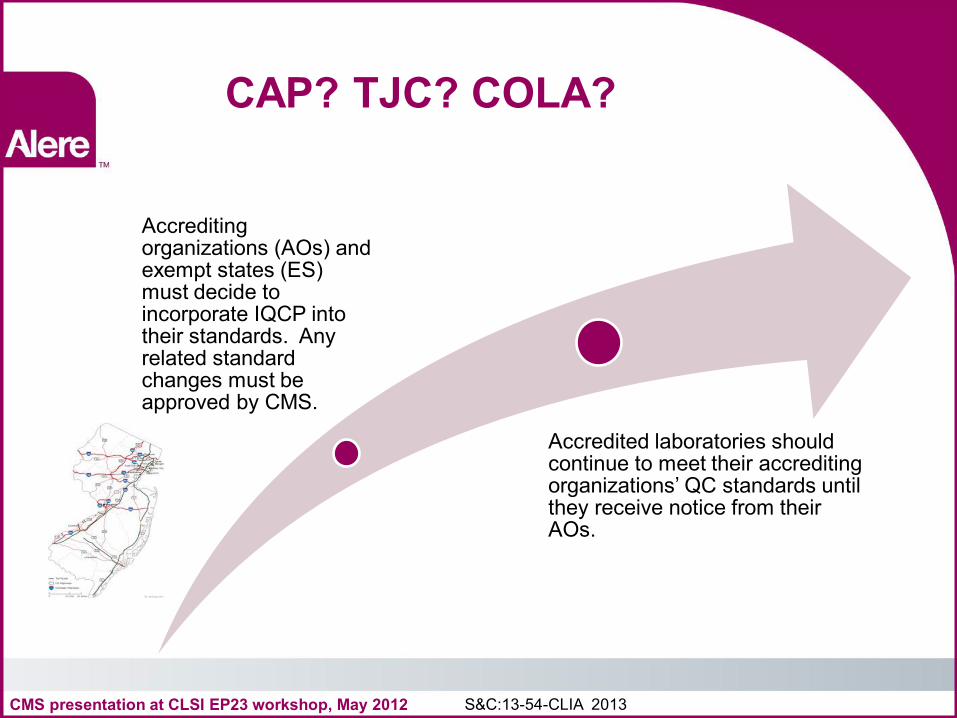
CAP? TJC? COLA?
Accrediting organizations (AOs) and exempt states (ES) must decide to incorporate IQCP into their standards. Any related standard changes must be approved by CMS.
Accredited laboratories should continue to meet their accrediting organizations’ QC standards until they receive notice from their AOs.
CMS presentation at CLSI EP23 workshop, May 2012 S&C:13-54-CLIA 2013
Where to Obtain Information
• CMS/CLIA Website: http://www.cms.hhs.gov/clia/ • CMS CLIA Central Office: 410.786.3531 • IQCP Link: [email protected] • EP23 Workbook
CMS presentation at CLSI EP23 workshop, May 2012
Risk Management approach to QC
First understand the
difference between hazard
and risk
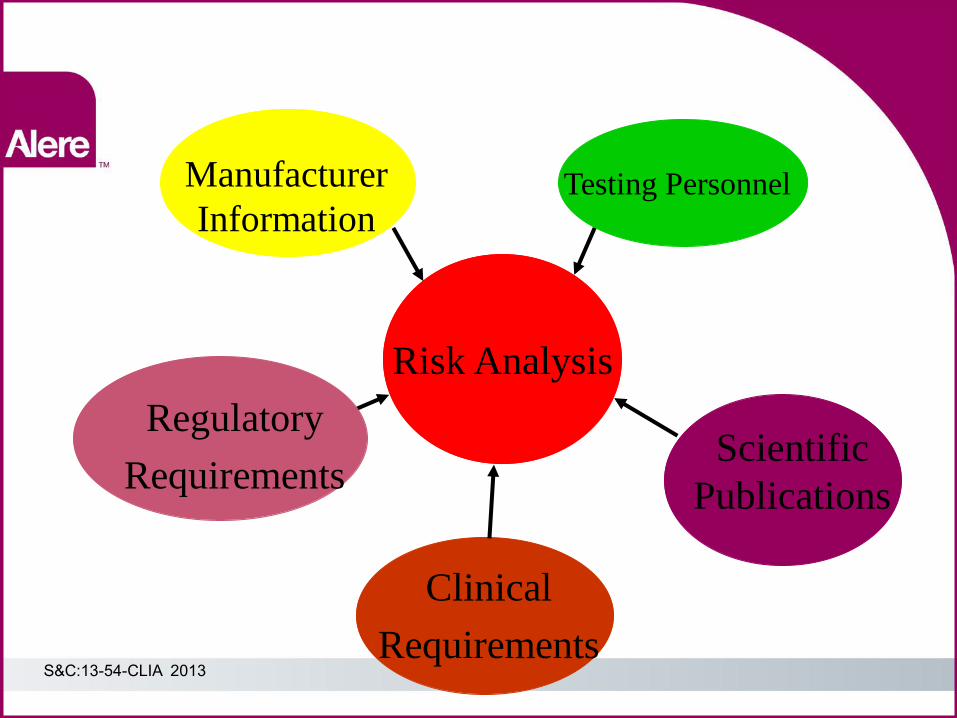
Manufacturer
Information Testing Personnel
Clinical
Requirements
Scientific
Publications
Risk Analysis
Regulatory
Requirements
S&C:13-54-CLIA 2013
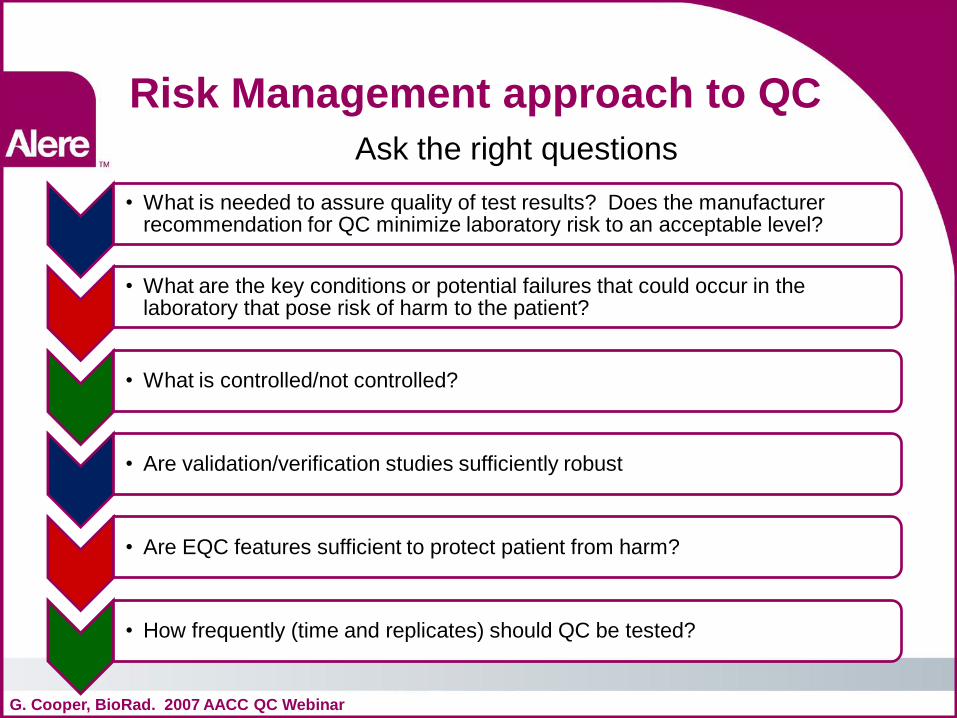
Risk Management approach to QC Ask the right questions
G. Cooper, BioRad. 2007 AACC QC Webinar
• What is needed to assure quality of test results? Does the manufacturer recommendation for QC minimize laboratory risk to an acceptable level?
• What are the key conditions or potential failures that could occur in the laboratory that pose risk of harm to the patient?
• What is controlled/not controlled?
• Are validation/verification studies sufficiently robust
• Are EQC features sufficient to protect patient from harm?
• How frequently (time and replicates) should QC be tested?
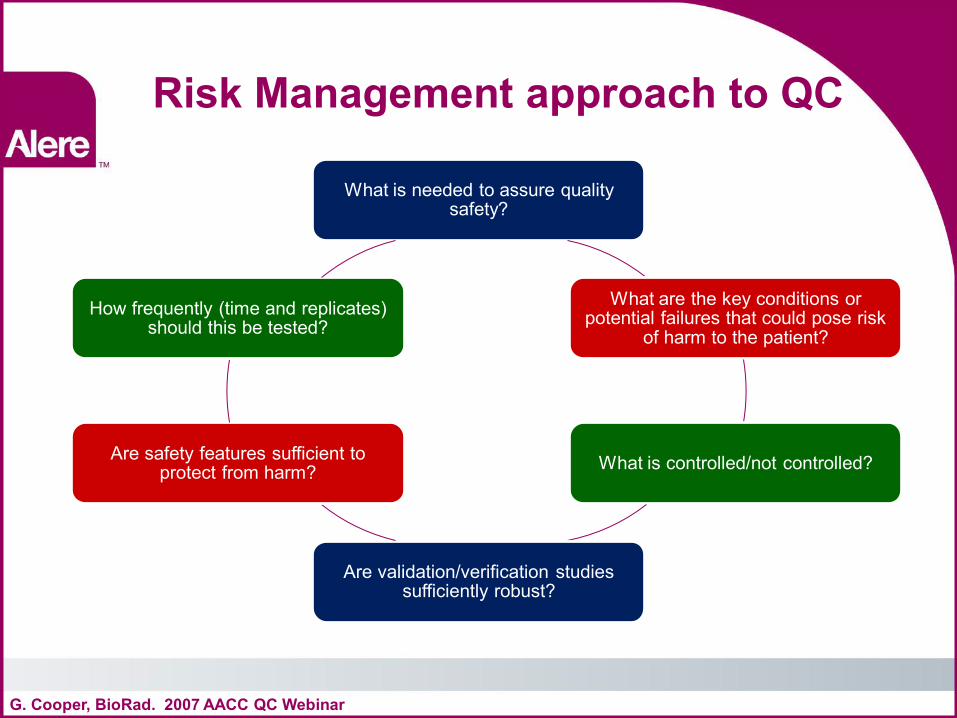
Risk Management approach to QC
What is needed to assure quality safety?
What are the key conditions or potential failures that could pose risk
of harm to the patient?
What is controlled/not controlled?
Are validation/verification studies sufficiently robust?
Are safety features sufficient to protect from harm?
How frequently (time and replicates) should this be tested?
G. Cooper, BioRad. 2007 AACC QC Webinar
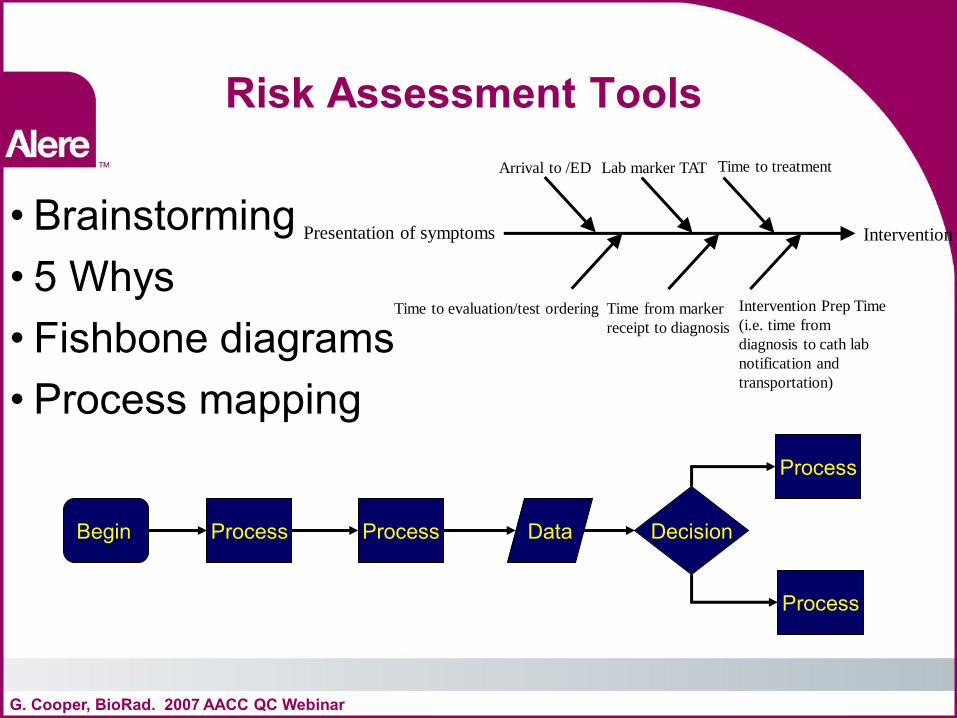
Risk Assessment Tools
• Brainstorming • 5 Whys • Fishbone diagrams • Process mapping
G. Cooper, BioRad. 2007 AACC QC Webinar
Begin Decision Process Process Data
Process
Process
Presentation of symptoms Intervention
Arrival to /ED
Time to evaluation/test ordering
Lab marker TAT
Time from marker
receipt to diagnosis
Time to treatment
Intervention Prep Time
(i.e. time from
diagnosis to cath lab
notification and
transportation)
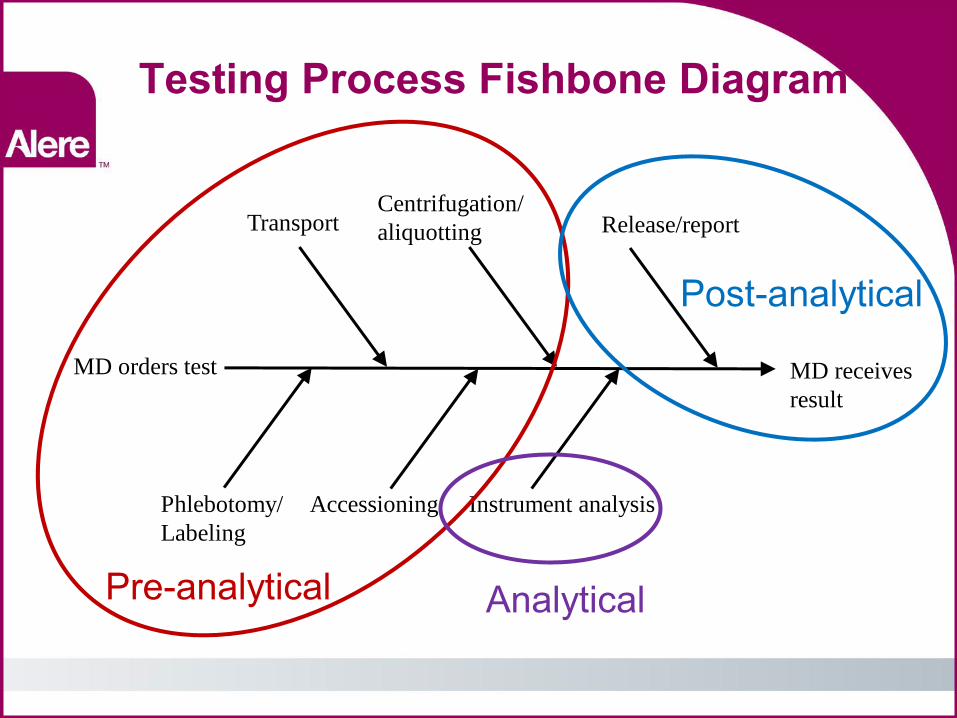
Testing Process Fishbone Diagram
MD receives
result
MD orders test
Phlebotomy/
Labeling
Transport
Accessioning
Centrifugation/
aliquotting
Instrument analysis
Release/report
Pre-analytical
Post-analytical
Analytical

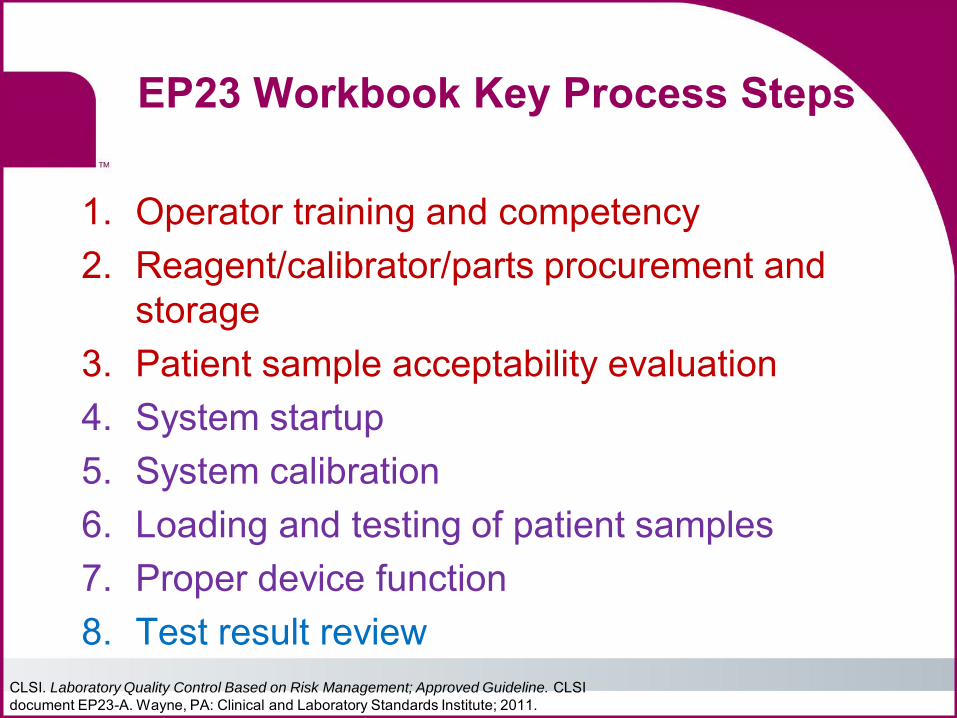
EP23 Workbook Key Process Steps
1. Operator training and competency 2. Reagent/calibrator/parts procurement and
storage 3. Patient sample acceptability evaluation 4. System startup 5. System calibration 6. Loading and testing of patient samples 7. Proper device function 8. Test result review
CLSI. Laboratory Quality Control Based on Risk Management; Approved Guideline. CLSI document EP23-A. Wayne, PA: Clinical and Laboratory Standards Institute; 2011.
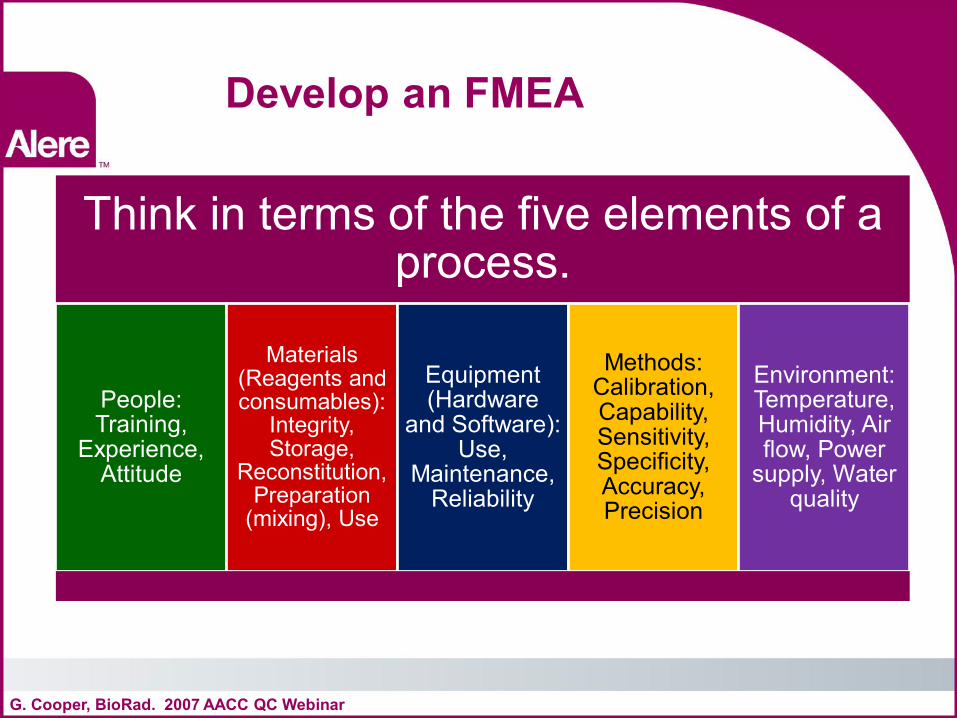
Develop an FMEA
G. Cooper, BioRad. 2007 AACC QC Webinar
Think in terms of the five elements of a process.
People: Training,
Experience, Attitude
Materials (Reagents and consumables):
Integrity, Storage,
Reconstitution, Preparation
(mixing), Use
Equipment (Hardware
and Software): Use,
Maintenance, Reliability
Methods: Calibration, Capability, Sensitivity, Specificity, Accuracy, Precision
Environment: Temperature, Humidity, Air flow, Power
supply, Water quality
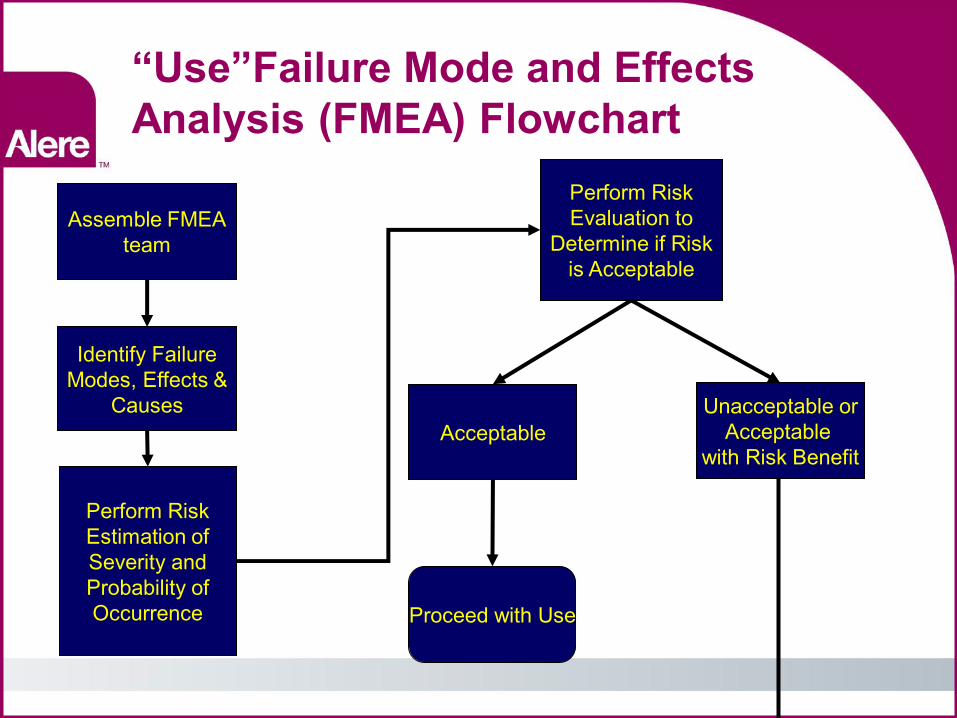
“Use”Failure Mode and Effects Analysis (FMEA) Flowchart
Assemble FMEA team
Identify Failure Modes, Effects &
Causes
Perform Risk Estimation of Severity and Probability of Occurrence
Perform Risk Evaluation to
Determine if Risk is Acceptable
Acceptable Unacceptable or
Acceptable with Risk Benefit
Proceed with Use
23
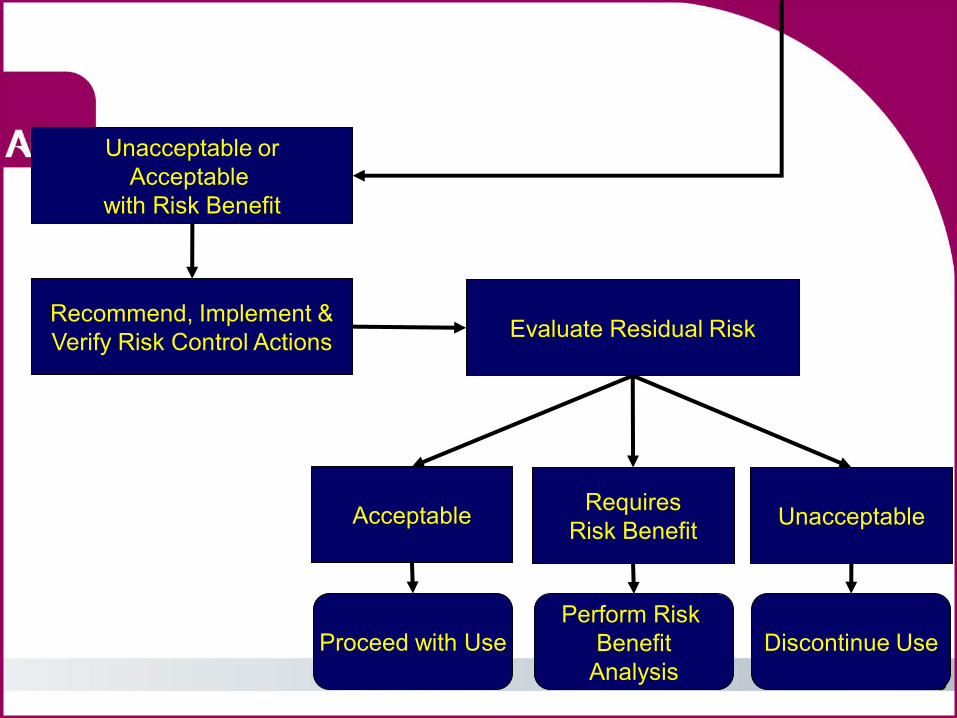
Unacceptable or Acceptable
with Risk Benefit
Recommend, Implement & Verify Risk Control Actions Evaluate Residual Risk
Acceptable Requires Risk Benefit Unacceptable
Proceed with Use Discontinue Use Perform Risk
Benefit Analysis
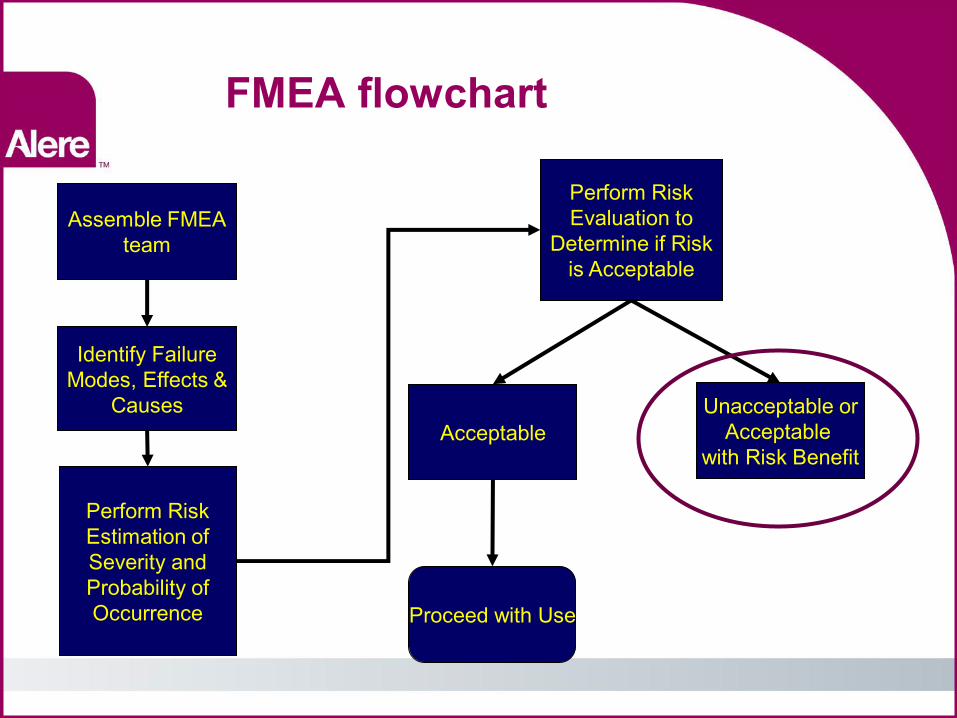
FMEA flowchart
Assemble FMEA team
Identify Failure Modes, Effects &
Causes
Perform Risk Estimation of Severity and Probability of Occurrence
Perform Risk Evaluation to
Determine if Risk is Acceptable
Acceptable Unacceptable or
Acceptable with Risk Benefit
Proceed with Use
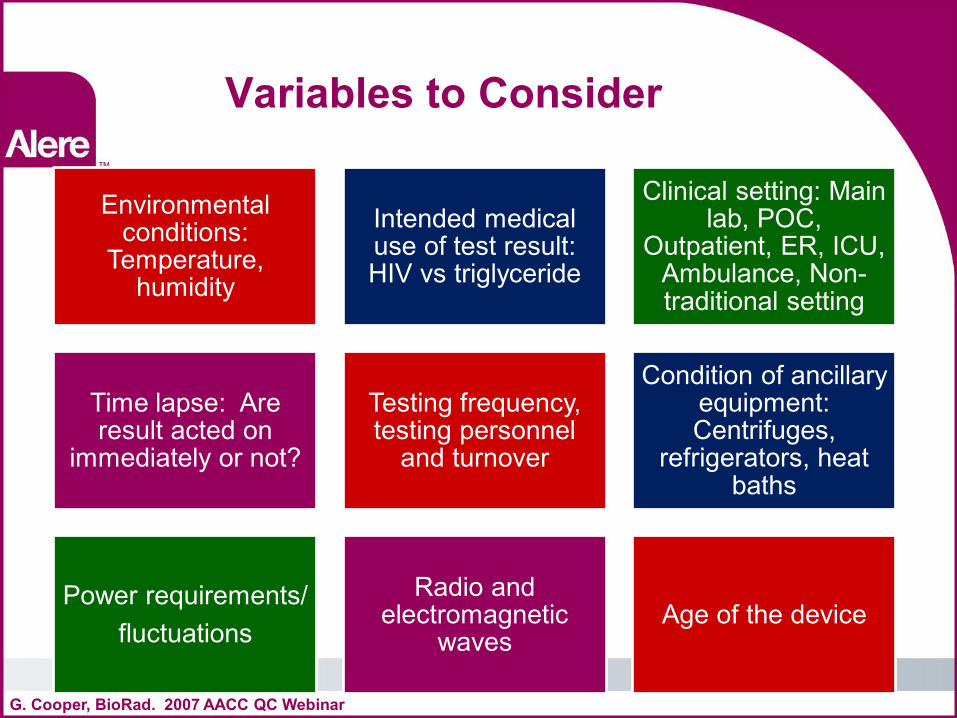
Variables to Consider
G. Cooper, BioRad. 2007 AACC QC Webinar
Environmental conditions:
Temperature, humidity
Intended medical use of test result: HIV vs triglyceride
Clinical setting: Main lab, POC,
Outpatient, ER, ICU, Ambulance, Non-traditional setting
Time lapse: Are result acted on
immediately or not?
Testing frequency, testing personnel
and turnover
Condition of ancillary equipment: Centrifuges,
refrigerators, heat baths
Power requirements/ fluctuations
Radio and electromagnetic
waves Age of the device
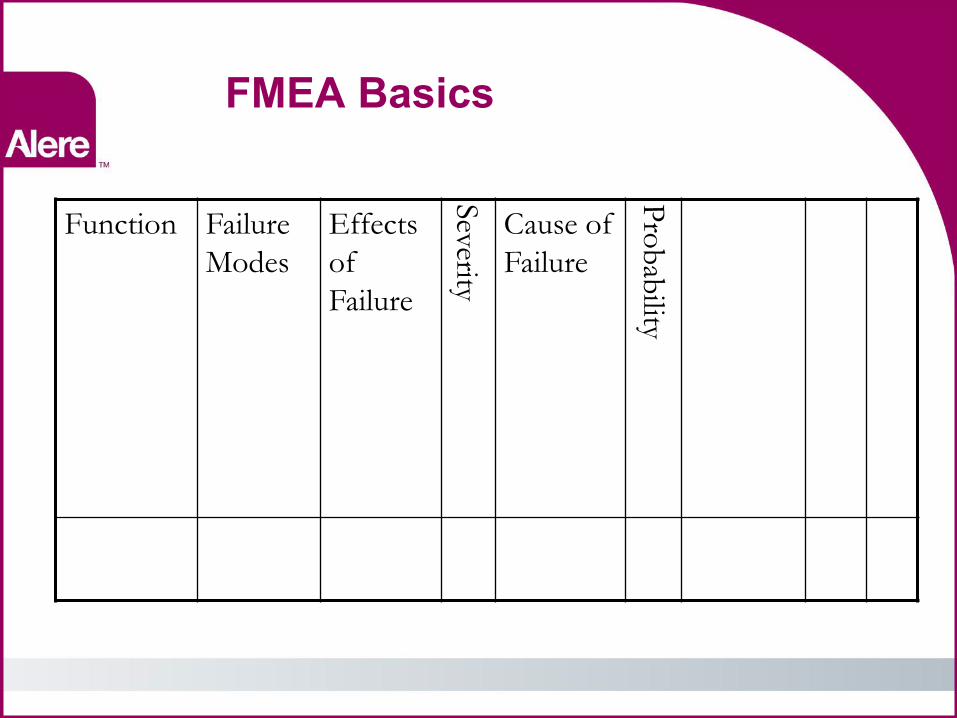
FMEA Basics
Function Failure
Modes
Effects
of
Failure
Severity
Cause of
Failure
Pro
bab
ility
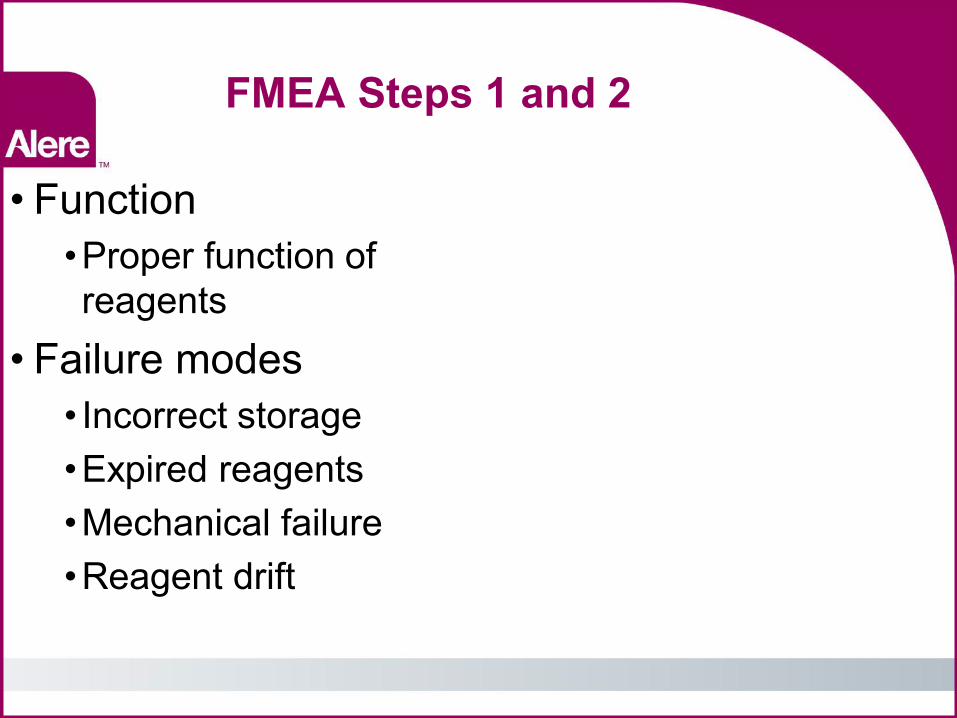
FMEA Steps 1 and 2
• Function •Proper function of reagents
• Failure modes • Incorrect storage •Expired reagents •Mechanical failure •Reagent drift
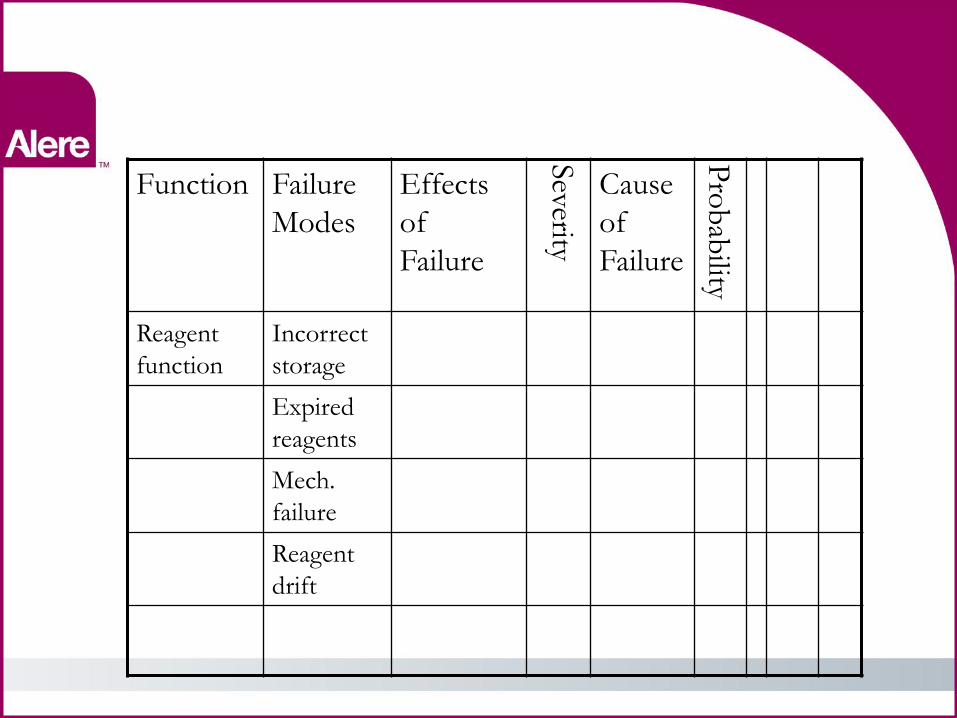
Function Failure
Modes
Effects
of
Failure
Severity
Cause
of
Failure P
rob
ability
Reagent
function
Incorrect
storage
Expired
reagents
Mech.
failure
Reagent
drift
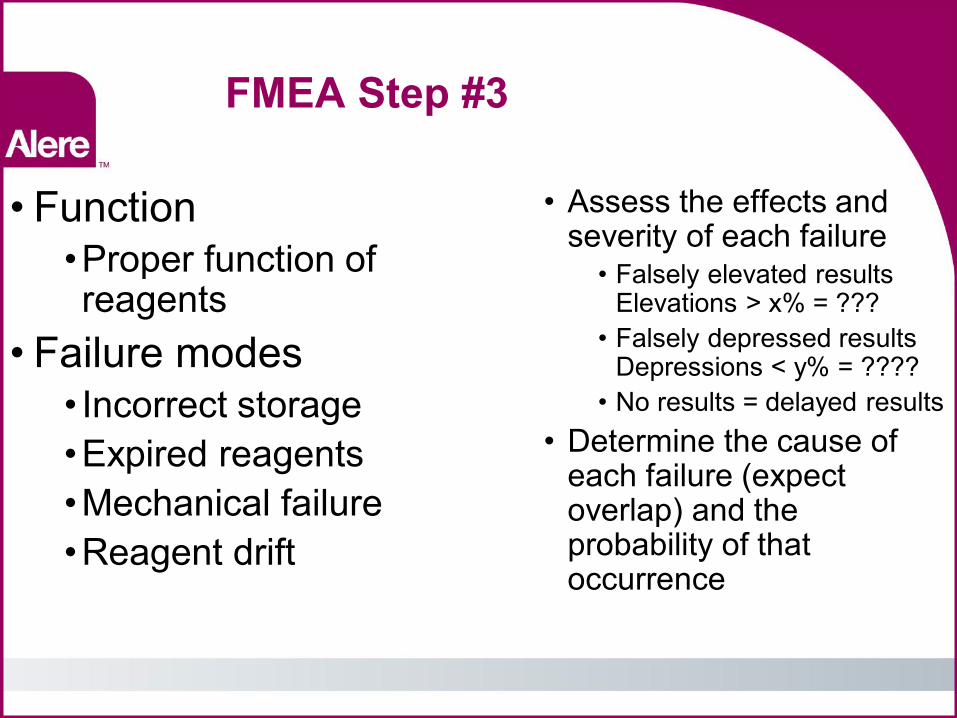
FMEA Step #3
• Function •Proper function of reagents
• Failure modes • Incorrect storage •Expired reagents •Mechanical failure •Reagent drift
• Assess the effects and severity of each failure
• Falsely elevated results Elevations > x% = ???
• Falsely depressed results Depressions < y% = ????
• No results = delayed results • Determine the cause of
each failure (expect overlap) and the probability of that occurrence
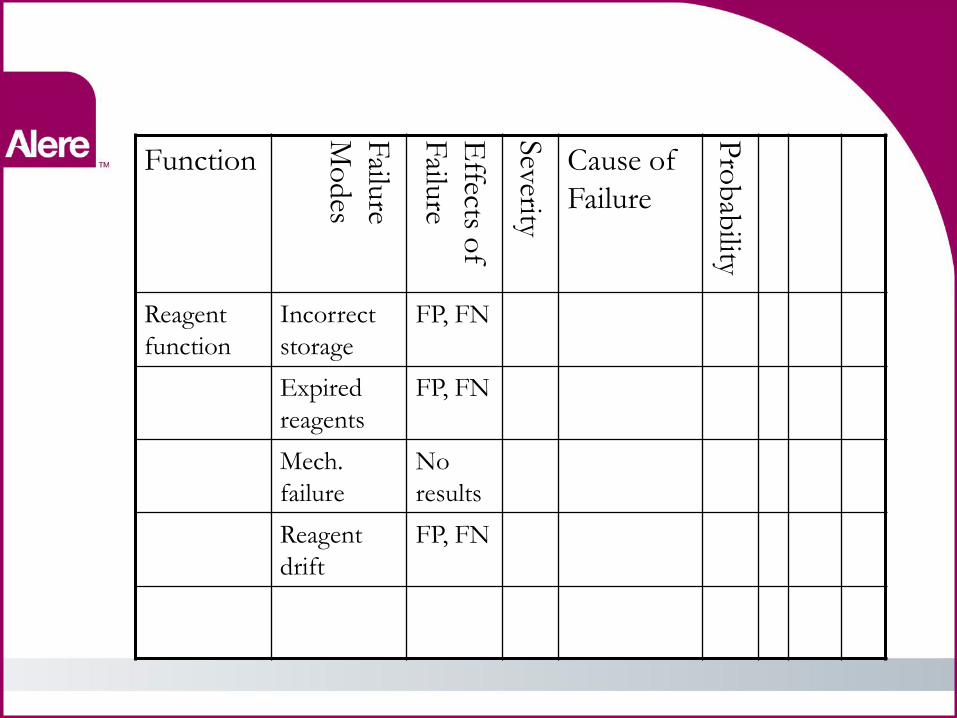
Function
Failu
re
Mo
des
Effects o
f
Failu
re
Severity
Cause of
Failure P
rob
ability
Reagent
function
Incorrect
storage
FP, FN
Expired
reagents
FP, FN
Mech.
failure
No
results
Reagent
drift
FP, FN
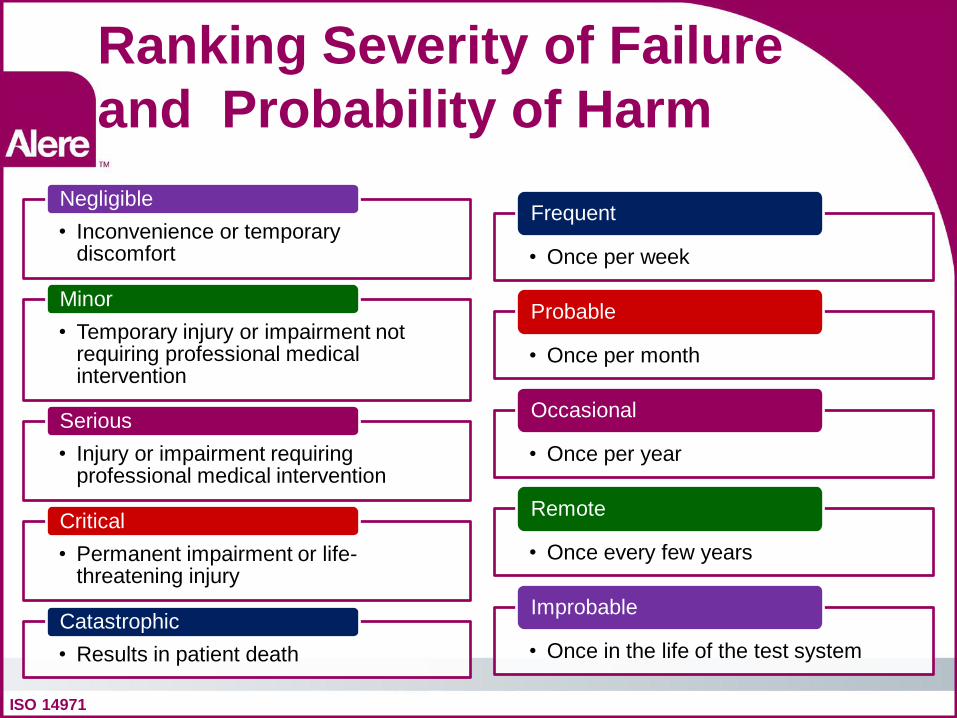
Ranking Severity of Failure and Probability of Harm
ISO 14971
• Inconvenience or temporary discomfort
Negligible
• Temporary injury or impairment not requiring professional medical intervention
Minor
• Injury or impairment requiring professional medical intervention
Serious
• Permanent impairment or life-threatening injury
Critical
• Results in patient death Catastrophic
• Once per week
Frequent
• Once per month
Probable
• Once per year
Occasional
• Once every few years
Remote
• Once in the life of the test system
Improbable
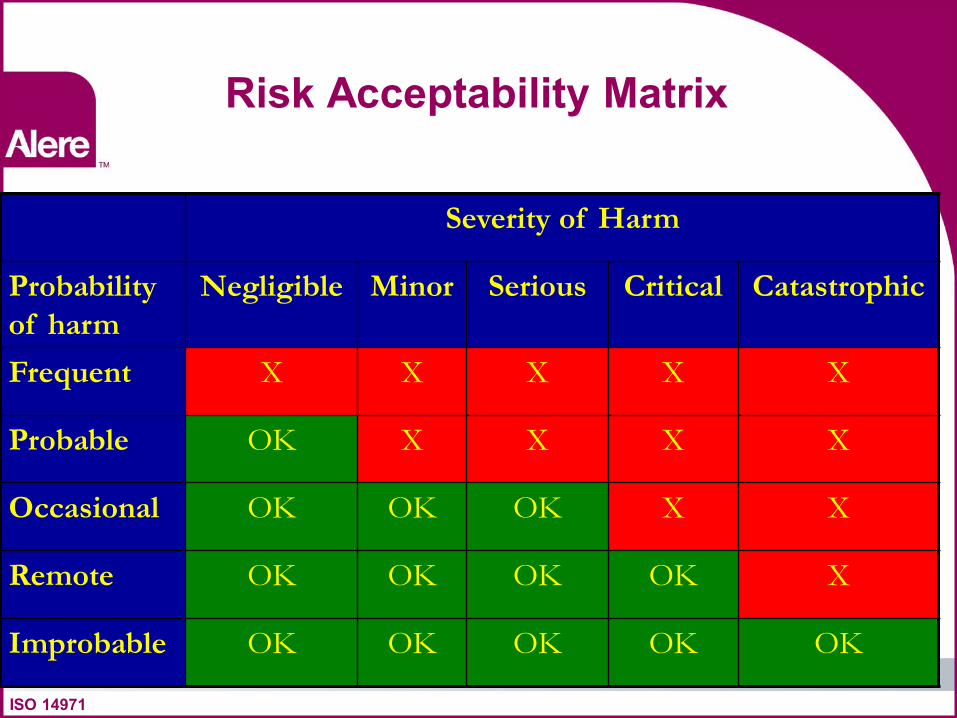
Risk Acceptability Matrix
Severity of Harm
Probability
of harm
Negligible Minor Serious Critical Catastrophic
Frequent X X X X X
Probable OK X X X X
Occasional OK OK OK X X
Remote OK OK OK OK X
Improbable OK OK OK OK OK
ISO 14971
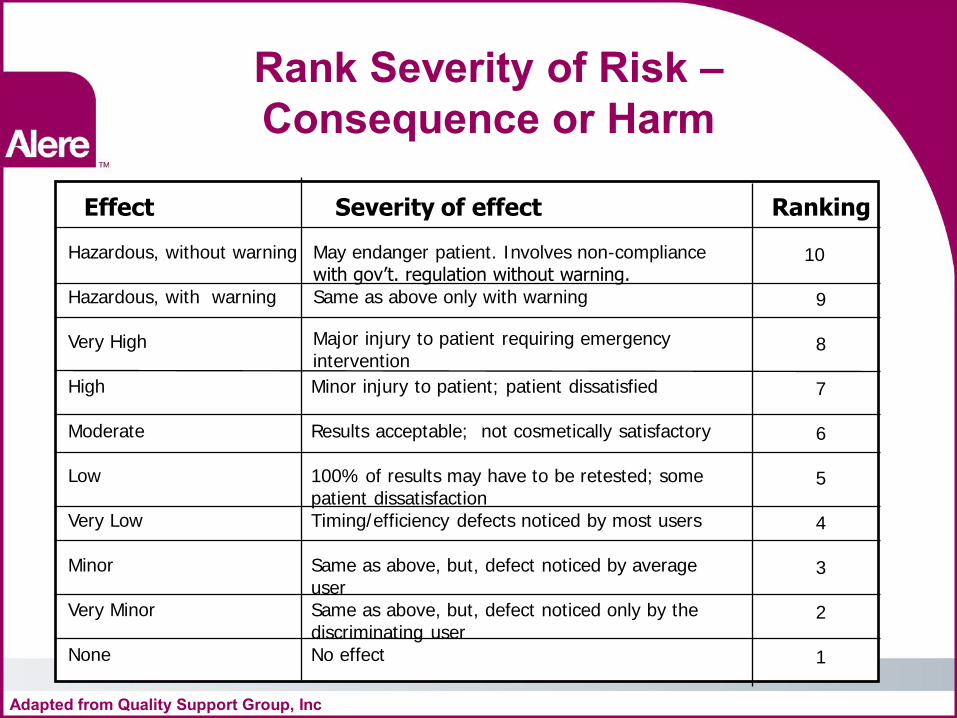
Rank Severity of Risk – Consequence or Harm
Effect Severity of effect Ranking
Hazardous, without warning Hazardous, with warning Very High High Moderate Low Very Low Minor Very Minor None
May endanger patient. Involves non-compliance with gov’t. regulation without warning. Same as above only with warning
Major injury to patient requiring emergency intervention
Minor injury to patient; patient dissatisfied Results acceptable; not cosmetically satisfactory 100% of results may have to be retested; some patient dissatisfaction Timing/efficiency defects noticed by most users Same as above, but, defect noticed by average user Same as above, but, defect noticed only by the discriminating user No effect
10 9 8 7 6 5 4 3 2 1
Adapted from Quality Support Group, Inc
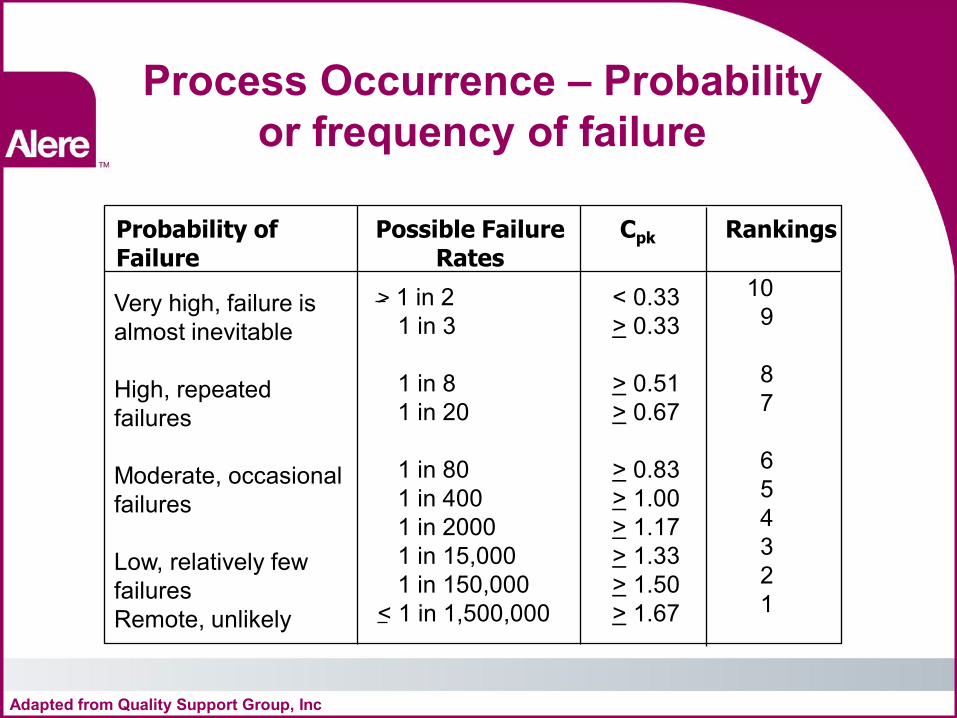
Process Occurrence – Probability or frequency of failure
Probability of Possible Failure Cpk Rankings Failure Rates
Very high, failure is almost inevitable High, repeated failures Moderate, occasional failures Low, relatively few failures Remote, unlikely
> 1 in 2 1 in 3 1 in 8 1 in 20 1 in 80 1 in 400 1 in 2000 1 in 15,000 1 in 150,000 < 1 in 1,500,000
< 0.33 > 0.33 > 0.51 > 0.67 > 0.83 > 1.00 > 1.17 > 1.33 > 1.50 > 1.67
10 9 8 7 6 5 4 3 2 1
Adapted from Quality Support Group, Inc
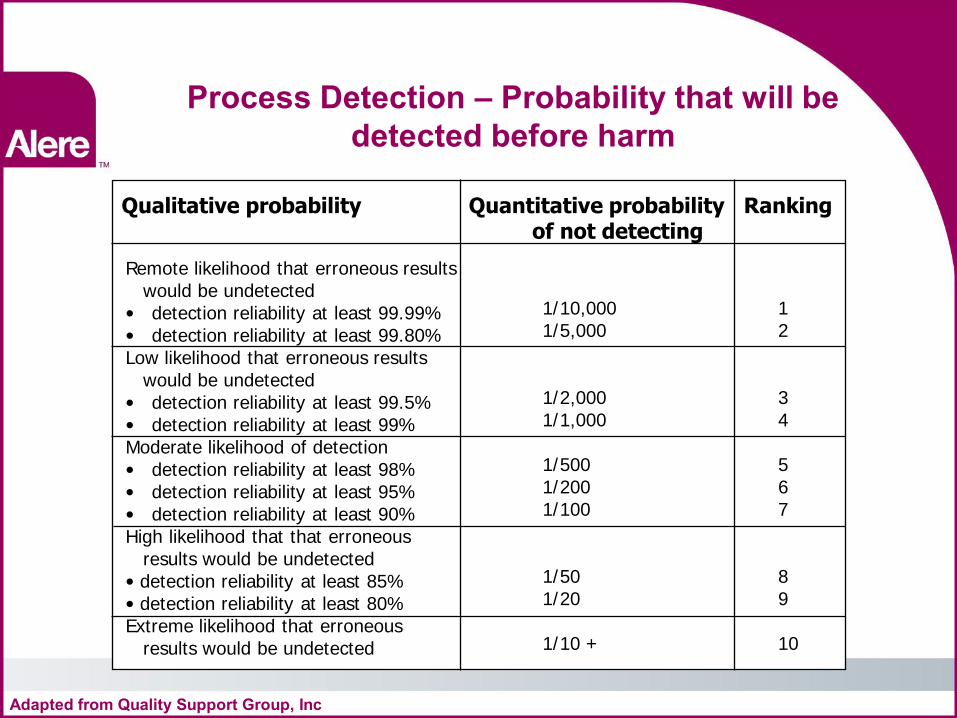
Process Detection – Probability that will be detected before harm
Qualitative probability Quantitative probability Ranking of not detecting
Remote likelihood that erroneous results would be undetected • detection reliability at least 99.99% • detection reliability at least 99.80% Low likelihood that erroneous results would be undetected • detection reliability at least 99.5% • detection reliability at least 99% Moderate likelihood of detection • detection reliability at least 98% • detection reliability at least 95% • detection reliability at least 90% High likelihood that that erroneous results would be undetected • detection reliability at least 85% • detection reliability at least 80% Extreme likelihood that erroneous results would be undetected
1/10,000 1/5,000 1/2,000 1/1,000 1/500 1/200 1/100 1/50 1/20 1/10 +
1 2 3 4 5 6 7 8 9 10
Adapted from Quality Support Group, Inc
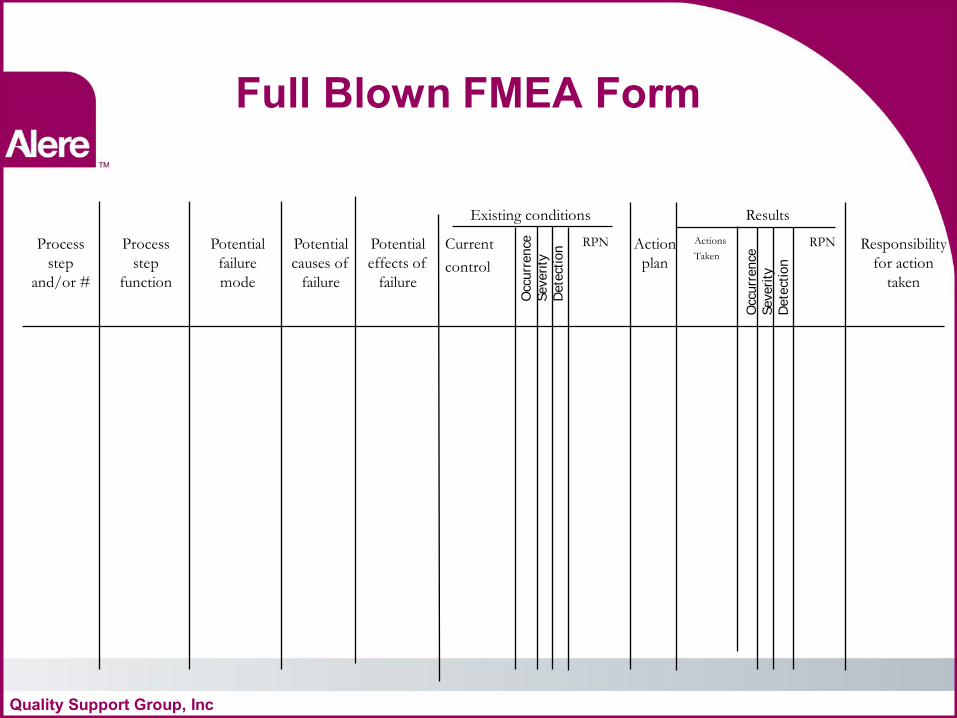
Full Blown FMEA Form
Existing conditions Results
Process
step
and/or #
Process
step
function
Potential
failure
mode
Potential
causes of
failure
Potential
effects of
failure
Current
control
RPN Action
plan
Actions
Taken
RPN Responsibility
for action
taken
Occ
urr
ence
Severity
D
ete
ctio
n
Occ
urr
ence
Severity
D
ete
ctio
n
Quality Support Group, Inc
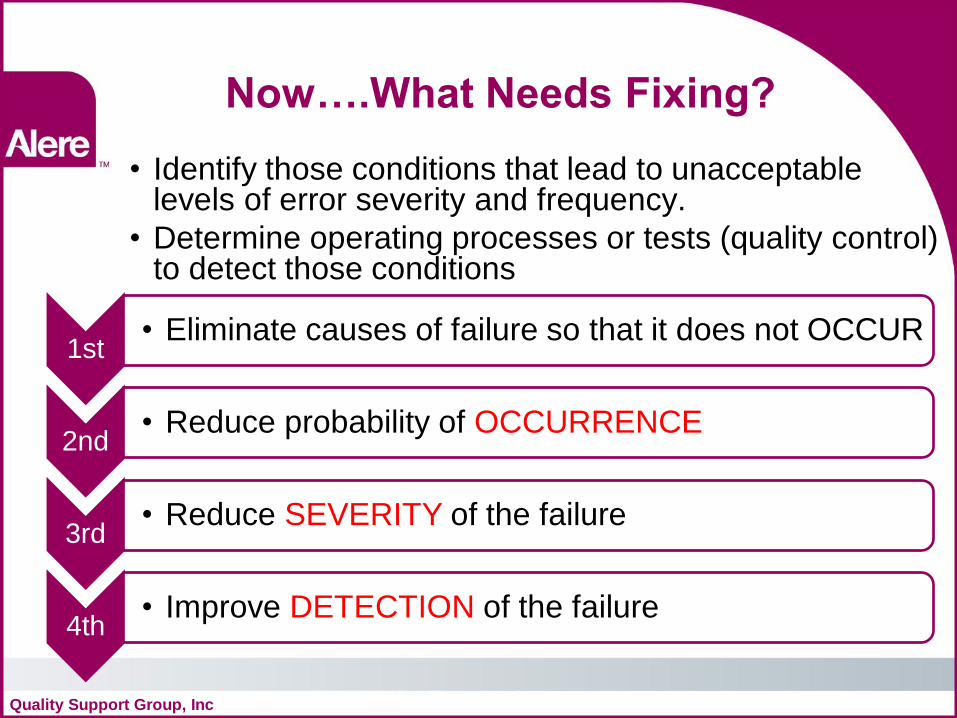
Now….What Needs Fixing? • Identify those conditions that lead to unacceptable
levels of error severity and frequency. • Determine operating processes or tests (quality control)
to detect those conditions
Quality Support Group, Inc
1st • Eliminate causes of failure so that it does not OCCUR
2nd • Reduce probability of OCCURRENCE
3rd • Reduce SEVERITY of the failure
4th • Improve DETECTION of the failure
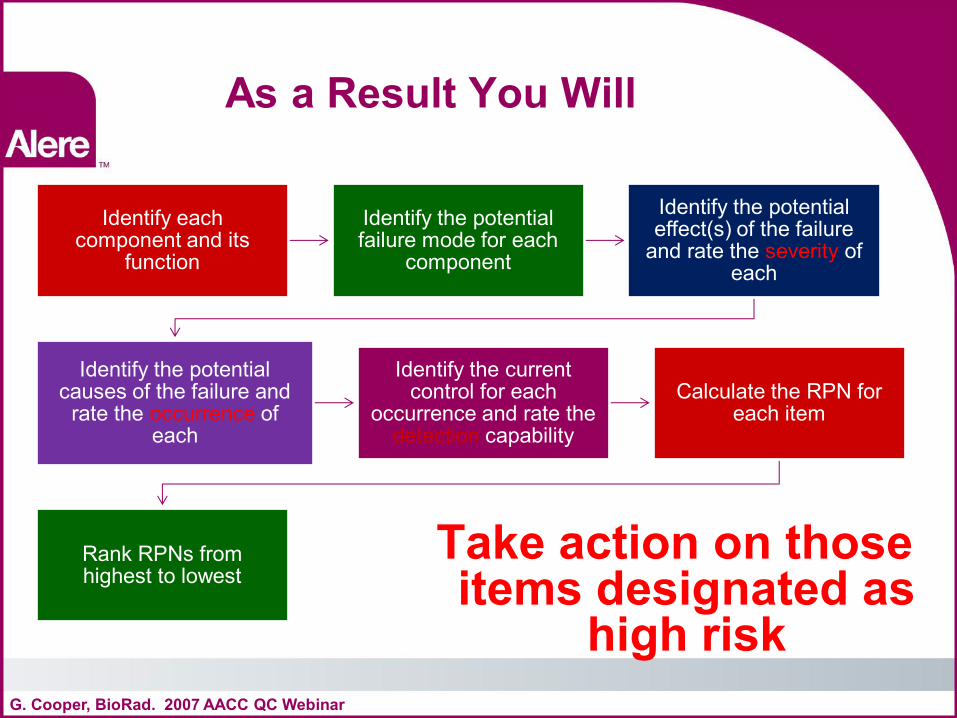
As a Result You Will
Take action on those items designated as
high risk G. Cooper, BioRad. 2007 AACC QC Webinar
Identify each component and its
function
Identify the potential failure mode for each
component
Identify the potential effect(s) of the failure
and rate the severity of each
Identify the potential causes of the failure and
rate the occurrence of each
Identify the current control for each
occurrence and rate the detection capability
Calculate the RPN for each item
Rank RPNs from highest to lowest
Do This!!!
Life-Cycle Risk Management Process
Other Resources
• ISO (www.iso.org) ISO 9000:2005 Quality Management systems-Fundamentals and vocabulary ISO 14971:2007 Medical Devices-Application of risk management to medical devices
But how are you supposed to understand all the instrument features that could mitigate risk?
J Westard, Westard QC, Inc and G. Cooper, BioRad. 2007 AACC QC Webinar
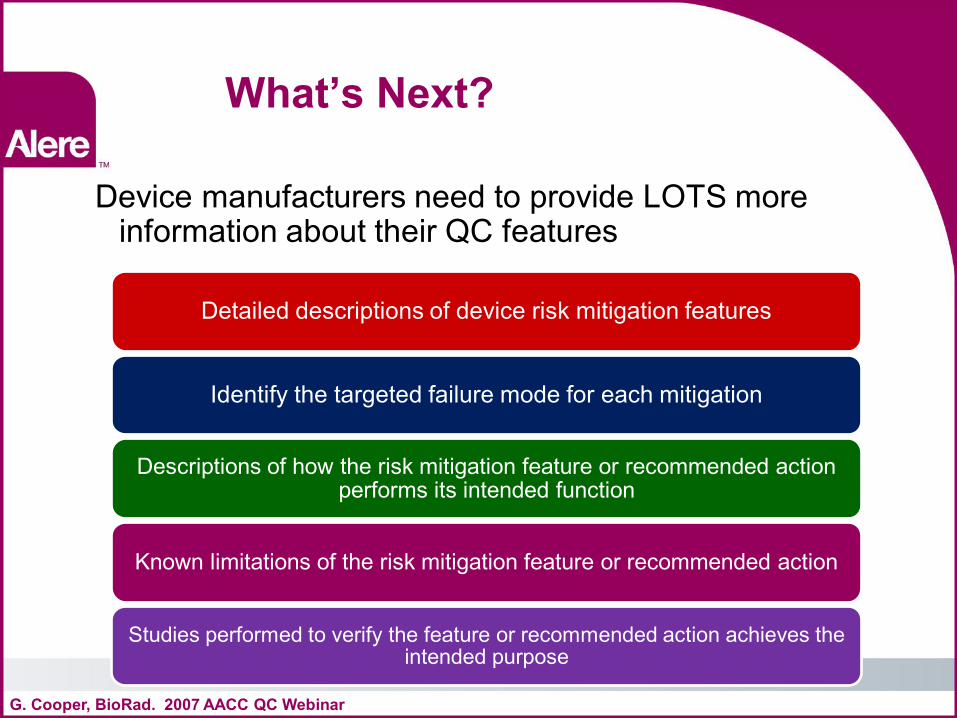
What’s Next?
Device manufacturers need to provide LOTS more information about their QC features
G. Cooper, BioRad. 2007 AACC QC Webinar
Detailed descriptions of device risk mitigation features
Identify the targeted failure mode for each mitigation
Descriptions of how the risk mitigation feature or recommended action performs its intended function
Known limitations of the risk mitigation feature or recommended action
Studies performed to verify the feature or recommended action achieves the intended purpose
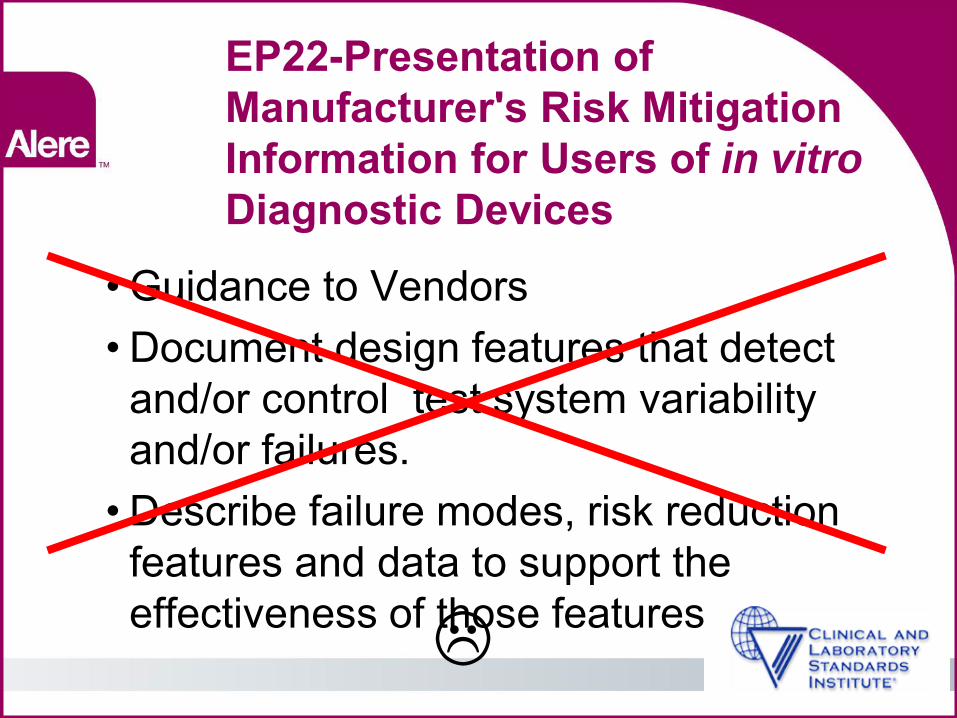
• Guidance to Vendors • Document design features that detect
and/or control test system variability and/or failures.
• Describe failure modes, risk reduction features and data to support the effectiveness of those features.
EP22-Presentation of Manufacturer's Risk Mitigation Information for Users of in vitro Diagnostic Devices
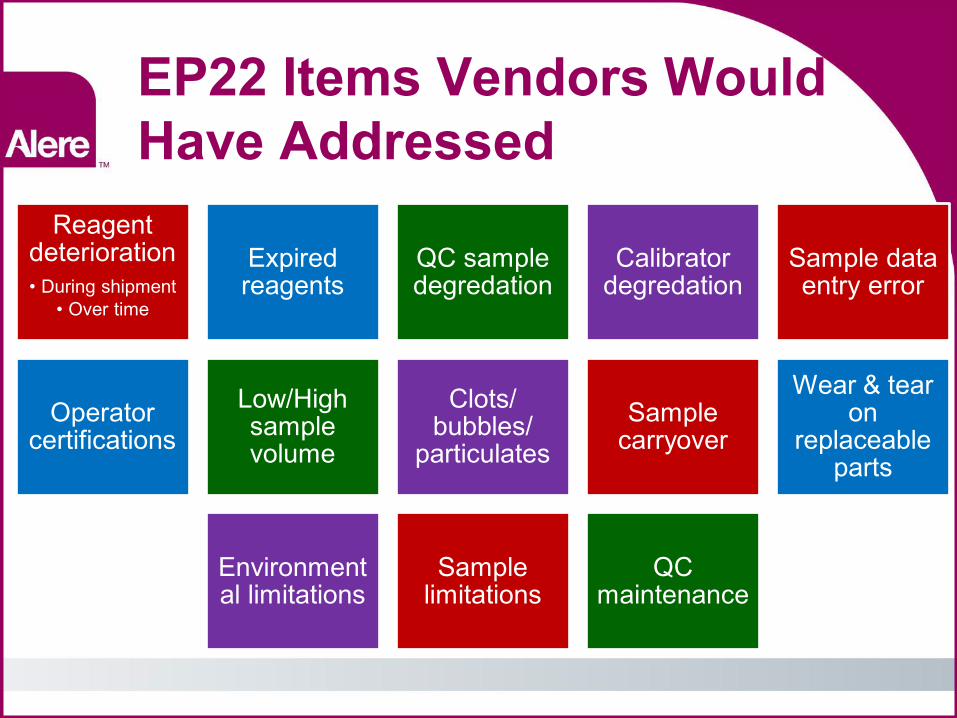
EP22 Items Vendors Would Have Addressed
Reagent deterioration • During shipment
• Over time
Expired reagents
QC sample degredation
Calibrator degredation
Sample data entry error
Operator certifications
Low/High sample volume
Clots/ bubbles/
particulates Sample
carryover
Wear & tear on
replaceable parts
Environmental limitations
Sample limitations
QC maintenance
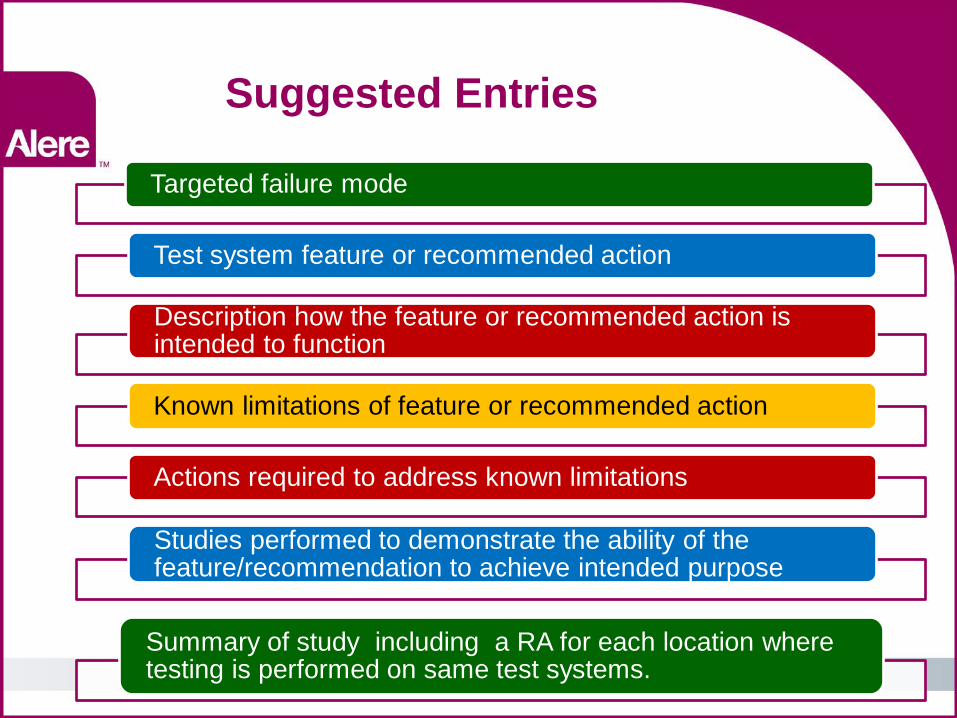
Suggested Entries
Targeted failure mode
Test system feature or recommended action
Description how the feature or recommended action is intended to function
Known limitations of feature or recommended action
Actions required to address known limitations
Studies performed to demonstrate the ability of the feature/recommendation to achieve intended purpose
Summary of study including a RA for each location where testing is performed on same test systems.
But What Will IQCPs Really Look Like?