Embed Size (px)
Citation preview
molecules
Review
Introduction to Infrared and Raman-BasedBiomedical Molecular Imaging and Comparison withOther Modalities
Carlos F. G. C. Geraldes 1,2,3
1 Department of Life Sciences, Faculty of Science and Technology, University of Coimbra, Calçada Martim deFreitas, 3000-393 Coimbra, Portugal; [email protected]; Tel.: +351-96-766-1211
2 Chemistry Center, Rua Larga, University of Coimbra, 3004-535 Coimbra, Portugal3 CIBIT-Coimbra Institute for Biomedical Imaging and Translational Research, Azinhaga de Santa Comba,
3000-548 Coimbra, Portugal
Academic Editors: Rui Fausto and Gulce Ogruc IldizReceived: 13 October 2020; Accepted: 22 November 2020; Published: 26 November 2020
�����������������
Abstract: Molecular imaging has rapidly developed to answer the need of image contrast in medicaldiagnostic imaging to go beyond morphological information to include functional differences inimaged tissues at the cellular and molecular levels. Vibrational (infrared (IR) and Raman) imaginghas rapidly emerged among the molecular imaging modalities available, due to its label-freecombination of high spatial resolution with chemical specificity. This article presents the physicalbasis of vibrational spectroscopy and imaging, followed by illustration of their preclinical in vitroapplications in body fluids and cells, ex vivo tissues and in vivo small animals and ending with a briefdiscussion of their clinical translation. After comparing the advantages and disadvantages of IR/Ramanimaging with the other main modalities, such as magnetic resonance imaging (MRI), computedtomography (CT), positron emission tomography/single-photon emission-computed tomography(PET/SPECT), ultrasound (US) and photoacoustic imaging (PAI), the design of multimodal probescombining vibrational imaging with other modalities is discussed, illustrated by some preclinicalproof-of-concept examples.
Keywords: bio-imaging; vibrational spectroscopy; infrared; Raman; multimodal imaging
1. Introduction
Scientific and technological advances in the last decades have led to the development of aseries of novel noninvasive biomedical imaging modalities, including X-ray computed tomography(CT), magnetic resonance imaging (MRI), positron emission tomography (PET), single-photonemission-computed tomography (SPECT), ultrasound (US), photoacoustic imaging (PAI), opticalimaging (OI) and infrared (IR)/Raman imaging. The need of medical imaging to generate imagecontrast beyond that provided by morphological differences alone led to the development of the fieldof molecular imaging, whose objective is to image molecules and biomolecular processes of medicalinterest within living patients in a noninvasive manner and, in real time, enable the representation ofan image as a function of the chemical identity [1]. This is in sharp contrast to conventional methodsfor obtaining chemical information from preserved tissue samples, such as histology. The moleculesused may be natural molecules or synthetic probe molecules injected into a patient. Usually a contrastagent (e.g., a microbubble, a nanoparticle (NP), a metal ion complex or a radioactive isotope) is injectedinto a patient’s bloodstream, and an imaging modality (e.g., US, MRI, CT or PET) is used to follow itsdistribution in the body. This allows a quantitative in vivo characterization of biological processes atthe molecular and cellular levels by localizing and measuring specific molecular targets or biochemical
Molecules 2020, 25, 5547; doi:10.3390/molecules25235547 www.mdpi.com/journal/molecules
Molecules 2020, 25, 5547 2 of 23
pathways that are associated with the anomalies at the basis of a given pathology. These molecularbiomarkers are identified by their specific interactions with the targeted imaging molecular probethat accumulates at the disease site and produces a signal that can be detected and quantitated bythe appropriate imaging modality [2]. These agents are traditionally small molecules containing animaging reporter providing the signal to be detected, connected to a molecular targeting vector (organicmolecule, peptide, protein, oligonucleotide, antibody, etc.). However, progress in nanotechnology haveled to the development of a huge variety of precisely engineered nanoparticle-based targeted probesfor in vivo imaging with optimized properties, including multimodality detection and theragnosticapplications [3,4]. However, their slow accumulation in the disease site and excretion potentiate theirtoxicity, which can limit their competition with small-molecule agents [5].
Recently, molecular imaging techniques based on IR and Raman spectroscopies have rapidlyemerged within the biomedical area for disease diagnostics, combining the high spatial resolutionof optical microscopy with vibrational spectroscopies to provide chemical specificity based on theinteraction of radiation with molecular vibrations within the tissues to produce specific spectralsignatures [6–16]. In this article, we briefly present (a) the physical basis and technical features ofvibrational (IR and Raman) spectroscopy and imaging, (b) some selected biomedical applicationsof IR/Raman imaging and (c) a comparison of the advantages and disadvantages of IR/Ramanimaging relative to the other main imaging modalities, complemented by examples of applications ofmultimodality probes involving vibrational imaging techniques.
2. Introduction to Vibrational Spectroscopy and Imaging
Vibrational spectroscopy, which includes the infrared and Raman techniques, probes theintramolecular vibrations of molecular bonds during irradiation with light. It has many chemical,physical and biological applications, amongst which is the label-free, nondestructive analysis of cellsand tissues searching for spectral signatures or spectral biomarker characteristic of the molecules presentin the sample under study, which reflects their total biochemical composition. Both Fourier-transforminfrared (FTIR) and Raman spectrometers can be coupled to optical microscopes. The recentimprovements in instrumentation and the design of advanced multivariate data analysis techniquesenabled the imaging of cells and tissues [6–16].
2.1. Physical Basis of IR and Raman Spectroscopy
When a sample is irradiated with light, it can be absorbed, transmitted, reflected or transflected (acombination of transmission and reflectance). Infrared spectroscopy can be defined as the study ofthe absorption properties of materials arising from changes of their molecular vibrational motionsupon interaction with an IR source. During the light–molecule interaction, the electric field of theIR wave causes certain chemical bonds to enter a higher vibrational state due to the transfer of aquantum of energy when the energy of the incident radiation is the same as the energy differencebetween the two vibrational states involved (Figure 1). Only the chemical bonds with an electricdipole moment that changes due to the atomic displacements associated with the vibrations areIR-active. The corresponding transitions result in a spectrum with peaks/bands that can be interpretedqualitatively (peak position) and quantitatively (peak intensity/area, relative intensity), which is amolecular fingerprint characteristic of the composition of the material under analysis.
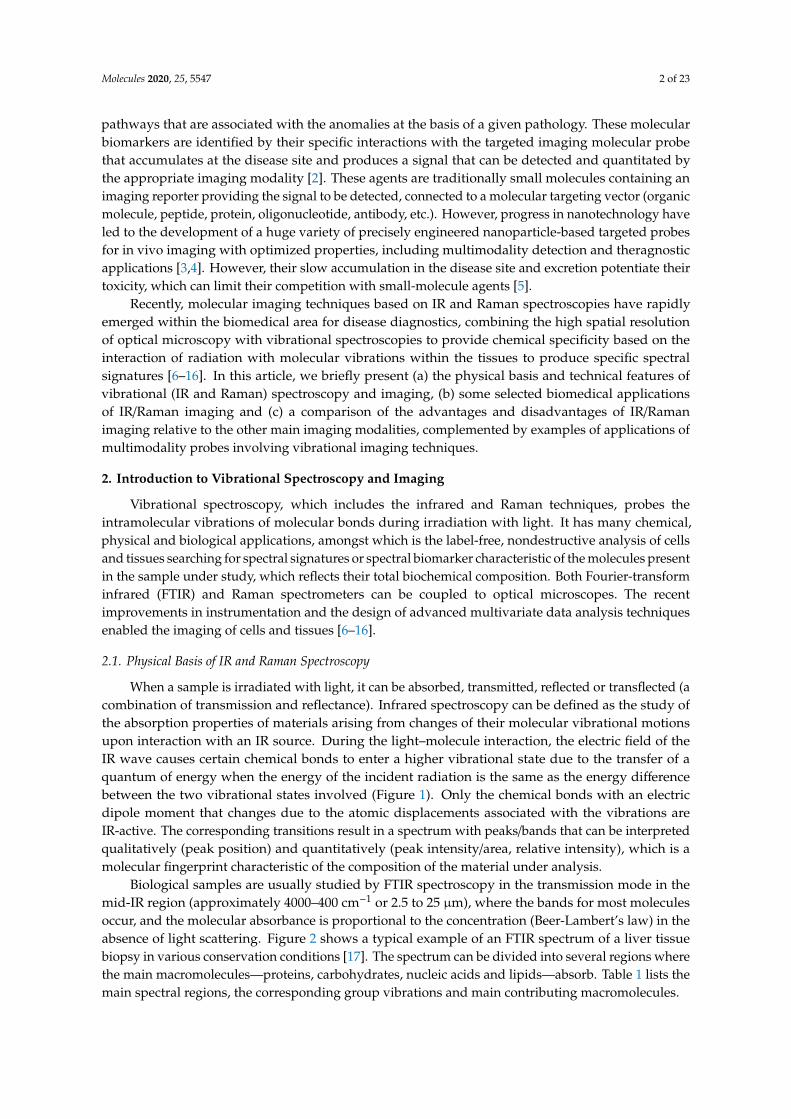
Biological samples are usually studied by FTIR spectroscopy in the transmission mode in themid-IR region (approximately 4000–400 cm−1 or 2.5 to 25 µm), where the bands for most moleculesoccur, and the molecular absorbance is proportional to the concentration (Beer-Lambert’s law) in theabsence of light scattering. Figure 2 shows a typical example of an FTIR spectrum of a liver tissuebiopsy in various conservation conditions [17]. The spectrum can be divided into several regions wherethe main macromolecules—proteins, carbohydrates, nucleic acids and lipids—absorb. Table 1 lists themain spectral regions, the corresponding group vibrations and main contributing macromolecules.

Molecules 2020, 25, 5547 3 of 23Molecules 2020, 25, x 3 of 22
Figure 1. Jablonski energy diagram showing the transitions involved during infrared absorption, Rayleigh, Raman Stokes, anti-Stokes and Resonance Raman scattering. The vibrational states (Vn) of a molecule in the ground electronic state (S0) can be probed either by directly measuring the absolute frequency (IR absorption) or the relative frequency or Raman shift (Stokes and anti-Stokes) of the allowed transitions. Resonance Raman also involves the vibrational states (V’n) of the excited electronic state (S1). Hν0 = incident laser energy, hνvib = vibrational energy, ∆ν = Raman shift and νvib = vibrational frequencies.
Figure 2. Average Fourier-transform infrared (FTIR) spectra from the liver tissue: hydrated tissue attenuated total reflectance (ATR) spectrum (blue), formalin fixed transmission spectrum (black), desiccator dried transmission spectrum (pink) and ethanol dehydrated transmission spectrum (green): (a) 3040–2800 cm−1 region and (b) 1800–950 cm−1 region. Reproduced from reference [17].
Despite its advantages, such as molecular specificity, FTIR spectroscopy suffers from some shortcomings that severely limit its application to biological samples—mainly, sensitivity issues and difficulties in the study of aqueous solutions. Sensitivity can be low—in particular, in thin samples such as monolayers—as a result of the Beer–Lambert’s law. This fundamental limitation can be
Figure 1. Jablonski energy diagram showing the transitions involved during infrared absorption,Rayleigh, Raman Stokes, anti-Stokes and Resonance Raman scattering. The vibrational states (Vn) of amolecule in the ground electronic state (S0) can be probed either by directly measuring the absolutefrequency (IR absorption) or the relative frequency or Raman shift (Stokes and anti-Stokes) of theallowed transitions. Resonance Raman also involves the vibrational states (V’n) of the excited electronicstate (S1). Hν0 = incident laser energy, hνvib = vibrational energy, ∆ν = Raman shift and νvib =
vibrational frequencies.
Molecules 2020, 25, x 3 of 22
Figure 1. Jablonski energy diagram showing the transitions involved during infrared absorption, Rayleigh, Raman Stokes, anti-Stokes and Resonance Raman scattering. The vibrational states (Vn) of a molecule in the ground electronic state (S0) can be probed either by directly measuring the absolute frequency (IR absorption) or the relative frequency or Raman shift (Stokes and anti-Stokes) of the allowed transitions. Resonance Raman also involves the vibrational states (V’n) of the excited electronic state (S1). Hν0 = incident laser energy, hνvib = vibrational energy, ∆ν = Raman shift and νvib = vibrational frequencies.
Figure 2. Average Fourier-transform infrared (FTIR) spectra from the liver tissue: hydrated tissue attenuated total reflectance (ATR) spectrum (blue), formalin fixed transmission spectrum (black), desiccator dried transmission spectrum (pink) and ethanol dehydrated transmission spectrum (green): (a) 3040–2800 cm−1 region and (b) 1800–950 cm−1 region. Reproduced from reference [17].
Despite its advantages, such as molecular specificity, FTIR spectroscopy suffers from some shortcomings that severely limit its application to biological samples—mainly, sensitivity issues and difficulties in the study of aqueous solutions. Sensitivity can be low—in particular, in thin samples such as monolayers—as a result of the Beer–Lambert’s law. This fundamental limitation can be
Figure 2. Average Fourier-transform infrared (FTIR) spectra from the liver tissue: hydrated tissueattenuated total reflectance (ATR) spectrum (blue), formalin fixed transmission spectrum (black),desiccator dried transmission spectrum (pink) and ethanol dehydrated transmission spectrum (green):(a) 3040–2800 cm−1 region and (b) 1800–950 cm−1 region. Reproduced from reference [17].
Despite its advantages, such as molecular specificity, FTIR spectroscopy suffers from someshortcomings that severely limit its application to biological samples—mainly, sensitivity issues anddifficulties in the study of aqueous solutions. Sensitivity can be low—in particular, in thin samples suchas monolayers—as a result of the Beer–Lambert’s law. This fundamental limitation can be overcomeby strong signal amplification based on the plasmonic resonances present in nanoscale metallicparticles [18], resulting in the phenomena of surface-enhanced infrared absorption (SEIRA) [19,20],using plasmonic chip-based technology to enable the in-situ monitoring of proteins and nanoparticleinteractions in aqueous media at high sensitivity and in real time [21]. The other disadvantage of FTIR
Molecules 2020, 25, 5547 4 of 23
is that the absorption of water in the mid-IR region is very intense, as its OH-bending absorption ismuch stronger than any signal from the protein samples. This problem can be overcome partially bydehydrating the samples or, in the solution, by subtracting the water signal, limiting the path lengthsto <10 µm and using relatively high protein concentrations (>20 mg·mL−1) to obtain appropriatesignal-to-noise ratios (S/R). Alternatively, attenuated total reflectance (ATR) sampling is a promisingtechnique for the analysis of aqueous biological samples. In this technique, an IR beam is focused at aset angle onto a crystal with a high refractive index, producing an evanescent standing wave resultingfrom internal reflections when it propagates through it. This wave reaches beyond the outer surfaceof the crystal and then into the sample by a few microns (0.5–5 µm), which is held in contact with it.The wave is either altered or attenuated in the parts of the spectrum where the sample absorbs energyand is guided back to the original IR beam, which leaves via the other side of the crystal and goes intothe spectrometer’s detector, generating an IR spectrum. However, the appropriate use of this techniquerequires control of the contact between the ATR crystal and the sample, the beam penetration depthand distortion due to high refractive indices [15,22].
Table 1. Main Fourier-transform infrared (FTIR) spectral regions and group vibrations present in thebiological macromolecules.
Spectral Region, λ (cm−1) Group Vibrations Main Contributing Macromolecules
3600–3050 OH stretch carbohydrates
3050–2800 CH, CH2, CH3 stretch fatty acids, proteins
3100–2550 SH, NH stretch proteins
1800–1700 C=O stretch lipid esters
1700–1500 Amide I/II proteins
1443–1391 CH2, CH3 bending fatty acids, proteins, nucleic acids
1340–1155 Amide III, CH2 wagging collagen
1240–1080 Phosphate stretch nucleic acids, phospholipids
1200–900 C-O, C-C stretch glycogen, carbohydrates
1450–600 Carbon skeleton fingerprint all
800–100 CCO deformation all
The spontaneous Raman effect, discovered nearly 90 years ago [23], consists of a two-photoninelastic scattering process following the interaction of a monochromatic radiation (e.g., laser source)with a sample. An incident photon, in the ultraviolet (UV), visible (VIS) or near-IR (NIR) spectralregions, induces, through its electric field, a change in polarizability, described as a deformation ofthe electron cloud of a molecule relative to its vibrational motion, which leads to an induced dipolemoment, a partial positive/negative charge across a molecular bond existing in a virtual state (Figure 1).A photon is immediately emitted from the molecular bond, which returns to a ground state. Duringthis interaction, both elastic and inelastic scattering processes take place. Most photons are emitted atthe same frequency (energy) as the incident photon, corresponding to Rayleigh or elastic scattering.Raman scattering occurs when the photons are emitted at a frequency (energy) different from thatof the incident photons. When the photons transfer energy to the molecules as vibrational energy,the energy (frequency) loss of the scattered photons corresponds to the vibrational energy levels of themolecules, which is known as Raman–Stokes scattering. When the incident photons receive energyfrom the vibrating molecules, their frequency (energy) increases, described as Raman anti-Stokesscattering. Figure 1 shows the transitions involved in these three processes. In spontaneous Raman,the Stokes scattering is generally used due to its higher sensitivity.
The very different mechanisms of the Raman and IR vibrational techniques endow them with somesimilarities and quite different characteristics, which are summarized here: (a) IR absorption results
Molecules 2020, 25, 5547 5 of 23
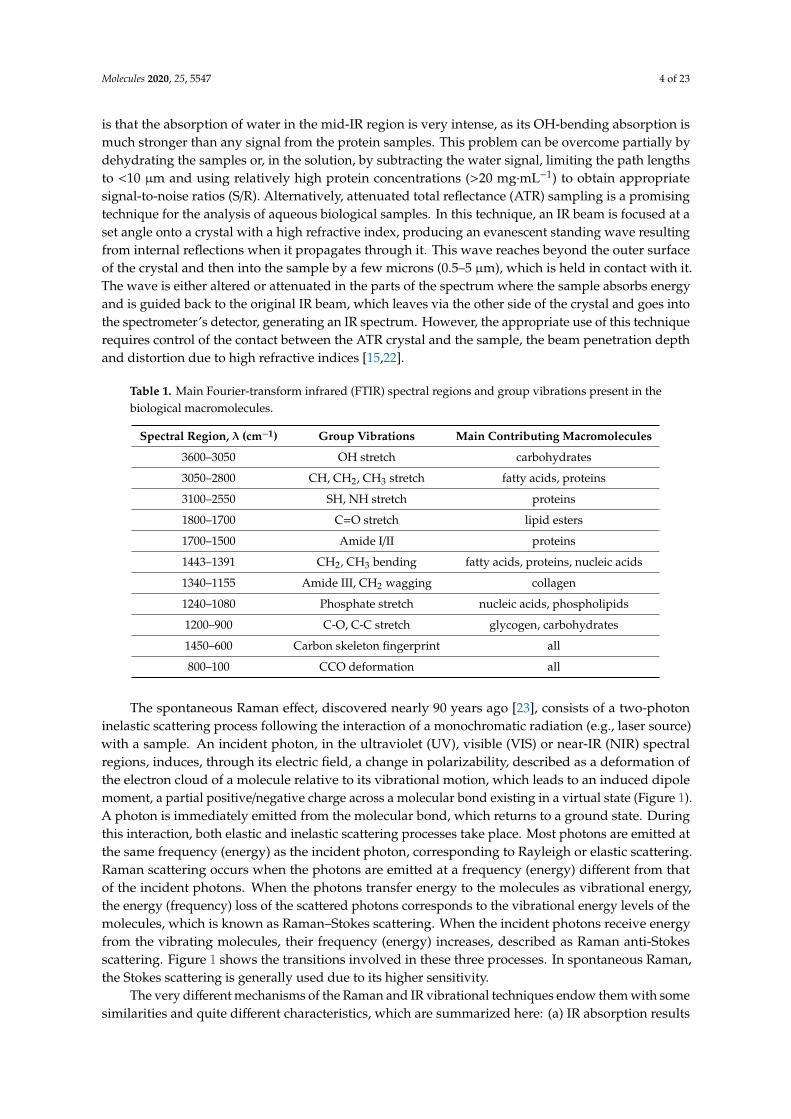
from changes in the dipole moment as the bonds vibrate, causing asymmetric and polar moleculesto show strong IR spectra compared to more symmetric nonpolar molecules. Thus, most organicmolecules show IR spectra with many overlapping bands, such as in FTIR spectra of cells or tissues.In contrast, Raman activity depends on changes in the polarizability tensor caused by molecular bondvibrations, and in general, only symmetric modes and nonpolar oscillating nuclei give strong Ramanspectra. (b) Unlike FTIR, Raman spectroscopy does not suffer from water interference, as water is avery weak scatterer. Therefore, Raman measurements can be made directly from biofluids (Figure 3)and in vivo. (c) In both techniques, the bands occur at the same frequency for the correspondingactive vibration modes, covering the range up to 4000 cm−1. (d) The Raman efficiency is quite lowcompared with FTIR, unless resonance or surface-enhanced Raman scattering processes are used.In fact, the spontaneous Raman signal is intrinsically quite weak because only one in ~107 photonsundergoes inelastic scattering, leading to Raman cross-sections (∼10−29–10−30 cm2) that are much lowerthan the usual absorption cross-sections of fluorophores (∼10−15–10−16 cm2). Therefore, the acquisitiontimes of Raman spectra can be quite long. (e) Unlike in FTIR, the Raman spectra of biological samplescollected with a visible laser can be dominated by a very broad fluorescence background, which needsto be removed mathematically to allow the observation of the sharp Raman peaks. [2,6,11].
Molecules 2020, 25, x 5 of 22
The very different mechanisms of the Raman and IR vibrational techniques endow them with some similarities and quite different characteristics, which are summarized here: (a) IR absorption results from changes in the dipole moment as the bonds vibrate, causing asymmetric and polar molecules to show strong IR spectra compared to more symmetric nonpolar molecules. Thus, most organic molecules show IR spectra with many overlapping bands, such as in FTIR spectra of cells or tissues. In contrast, Raman activity depends on changes in the polarizability tensor caused by molecular bond vibrations, and in general, only symmetric modes and nonpolar oscillating nuclei give strong Raman spectra. (b) Unlike FTIR, Raman spectroscopy does not suffer from water interference, as water is a very weak scatterer. Therefore, Raman measurements can be made directly from biofluids (Figure 3) and in vivo. (c) In both techniques, the bands occur at the same frequency for the corresponding active vibration modes, covering the range up to 4000 cm−1. (d) The Raman efficiency is quite low compared with FTIR, unless resonance or surface-enhanced Raman scattering processes are used. In fact, the spontaneous Raman signal is intrinsically quite weak because only one in ~107 photons undergoes inelastic scattering, leading to Raman cross-sections (∼10−29–10−30 cm2) that are much lower than the usual absorption cross-sections of fluorophores (∼10−15–10−16 cm2). Therefore, the acquisition times of Raman spectra can be quite long. (e) Unlike in FTIR, the Raman spectra of biological samples collected with a visible laser can be dominated by a very broad fluorescence background, which needs to be removed mathematically to allow the observation of the sharp Raman peaks. [2,6,11].
Figure 3. Raman spectra of human semen (A), canine semen (B), vaginal fluid (C), saliva (D), sweat (E) and blood (F). Reproduced from reference [24].
The detection sensitivity of the spontaneous Raman signal can be increased, and the background fluorescence can be avoided using different Raman methods, which are based on several physical phenomena. The Raman signal enhancing mechanisms can be discussed by considering the factors that determine the intensity of the Stokes–Raman scattered light, IStokes, given in Equation (1): 𝐼 𝐼 (𝜔 𝜔 , ) 𝛼 (1)
where I0 is the incident light intensity, 𝜔 is the excitation frequency, 𝜔 , is the vibrational frequency of the normal mode and α is the polarizability, which determines the response of the molecular electron cloud to the electric field E0 of the incident laser light. The Raman scattering intensity can be increased at shorter wavelengths due to its fourth power proportionality to the frequency of the incident laser light, but this is limited in biological samples due to the phototoxicity
Figure 3. Raman spectra of human semen (A), canine semen (B), vaginal fluid (C), saliva (D), sweat (E)and blood (F). Reproduced from reference [24].
The detection sensitivity of the spontaneous Raman signal can be increased, and the backgroundfluorescence can be avoided using different Raman methods, which are based on several physicalphenomena. The Raman signal enhancing mechanisms can be discussed by considering the factorsthat determine the intensity of the Stokes–Raman scattered light, IStokes, given in Equation (1):
IStokes ∝ I0(ω0 − ω0,q
)4| α |2 (1)
where I0 is the incident light intensity, ω0 is the excitation frequency, ω0,q is the vibrational frequencyof the normal mode and α is the polarizability, which determines the response of the molecular electroncloud to the electric field E0 of the incident laser light. The Raman scattering intensity can be increasedat shorter wavelengths due to its fourth power proportionality to the frequency of the incident laserlight, but this is limited in biological samples due to the phototoxicity and degradation effects of UVlight. Equation (1) also shows that the Stokes–Raman intensity can be enhanced by increasing either α

Molecules 2020, 25, 5547 6 of 23
or I0. These two quantities are used in the two most common enhancement techniques, ResonanceRaman Scattering (RRS) and Surface-Enhanced Raman Scattering (SERS) [6,11,25]. In RRS (Figure 1),the incident photons of the laser used to excite the Raman spectrum are chosen to have an energyclose to that of an intense electronic absorption band of a chromophore, which increases α and leadsto an enhancement of the Raman scattering, so that some of the band intensities are increased by afactor of 103–105. RRS can selectively enhance certain chemical species by tuning the laser to certainwavelengths, such as aromatic amino acids at 227 nm or nucleic acids at 244 nm [26]. The SERS effect,first observed in 1973 [27], requires that an analyte is adsorbed or is in close proximity to a noblemetal substrate, which is usually a roughened electrode, a functionalized metal nanosurface or acolloidal solution. The enhancement factor can be as high as 1010–1011, allowing the detection of singlemolecules [28]. The mechanism of SERS is explained by the electromagnetic theory, which proposesthat the excitation of localized surface plasmons by the incident light increases the local electric field(E) provided by the surface, as well as the scattering intensity (I~|E|2), which is the maximum when theplasmon frequency is in resonance with the radiation. The scattering is provided only by the plasmonoscillations that are perpendicular to the surface. Alternatively, the chemical theory proposes the SERSeffect through the formation of charge-transfer complexes from the metal surface to the adsorbingspecies, which also explains the RRS process. In fact, SERS can be combined with a chromophore inSurface-Enhanced Resonance Raman spectroscopy (SERRS) [29]. SERS has found many applicationsin chemistry and biology [30] and, recently, in biomedical research through the use of Ag and Aunanoparticle colloids as SERS substrates, which provide reproducible spectra from protein-free bloodserum and plasma [31].
All the Raman scattering approaches discussed until now are known as spontaneous Ramanprocesses, because the different vibrations of each molecule are excited independently, and theirmode-to-mode phase relation is random. The resulting spectra are a superposition of the vibrationsof all molecules that are excited by an interaction with the light source. Besides these, nonlinearRaman spectroscopic methods, based on the excitation of coherent molecular vibrations, have beendeveloped. They can significantly enhance weak Raman signals and, thus, have been applied tothe biomedical field. The two most common techniques are Stimulated Raman Scattering (SRS) andCoherent Anti-Stokes Raman Scattering (CARS) [12,16,32].
Controlling the sampling depth and location of the spectral information obtained in Ramanspectroscopy allowed the subsurface analysis of biological tissues and other media with high turbidity,which opened the way to new biomedical applications. The most important methods in this area areSpatially Offset Raman Spectroscopy (SORS) and Transmission Raman Spectroscopy (TRS). SORS isbased on the spatial separation of the Raman collection zone from the laser illumination zone on thesurface of the sample. This approach suppresses the Raman and fluorescence contributions from thesample surface present in conventional Raman methods, allowing a deeper probing of the media thatscatter light diffusely. TRS is a special case of SORS, where the laser beam and the Raman collection zoneare completely separated by being on the opposite sides of sample. These techniques have been used,for instance, in the in vivo analysis of breast cancer. The sensitivity in through-tissue measurementscan be increased using a combination of SORS with nano-tagged SERS particles (SESORS), allowingnoninvasive measurements at depths of up to 45–50 mm in biological tissues [13].
In conclusion, IR and Raman spectroscopies are complementary, as they produce differentfingerprints of the molecules present in a biological sample, depending on whether their bonds areRaman or IR-active, as certain vibrations that are allowed in Raman may be forbidden in IR and viceversa. A description of the fundamentals and applications of IR and Raman spectroscopy can be foundelsewhere [33,34].
2.2. Basic Principles of IR and Raman Imaging
Vibrational (FTIR and Raman) micro-spectroscopy, or spectroscopic imaging, combines vibrationalspectroscopy and light microscopy to visualize complex biomedical samples, such as cells and tissues,

Molecules 2020, 25, 5547 7 of 23
at the micron and the submicron levels. These techniques belong to the chemical imaging family,where the image contrast of the tissue or cell results from the chemical identity of the sample and notjust from its morphology.
FTIR micro-spectroscopy combines the high spatial resolution of microscopy with IR spectroscopyto provide spatially resolved IR spectra. Since IR is not transmitted by glass, all the instrumentationoptics, including the microscope objectives, are mirror-based. Nearly all measurements use aninterferometer, where the observed time-dependent signal (interferogram) is converted to the spectraldomain by a Fourier transform, carried out automatically using the instrument control software.IR sources can be (a) thermal, with low fluxes, which limit the obtainable signal-to-noise ratio (S/N),(b) synchrotron sources, which are 100–1000 times brighter, giving better S/N while maintaining highresolutions and (c) quantum-cascade lasers (QCLs), with a brightness up to three orders of magnitudehigher than that a synchrotron, depending on the wavelength. IR detectors can be single-point, lineararray (LA) or two-dimensional (2D) focal Plane Array (FPA) multi-channel detectors made of mercurycadmium telluride (MCT). Transmission, transflection or attenuated total reflection (ATR) detectionmodes can be used.
To obtain laterally resolved 2D IR spectra requires detection of the radiation on a specific region ofa sample. This can be achieved in two different optical configurations: mapping techniques, in whichthe restriction of the radiation arriving at the sample plane is done with an aperture, and imagingtechniques, where radiation segmentation at the detection plane uses FPA detectors. In the FTIRmapping approach, a grid on the sample area of interest is defined, and IR spectra are acquiredsequentially from each grid point using a single-element detector and a motorized sample stage.The lateral resolution depends on the size of the aperture and the pixel size. Achieving a highlateral resolution near the diffraction limit of IR radiation requires small apertures (≤10 × 10 µm2),which severely restricts the IR flux that reaches the detector, leading to long acquisition times or lowS/N when using a thermal source. When using small apertures, the sensitivity can be improved usingIR synchrotron radiation. In the imaging approach, the entire field of view is illuminated (wide-fieldillumination) and imaged, without the need for scanning, on an array of IR-sensitive FPA detectors.Each individual detector in the array simultaneously collects data from a specific sample region withinthe field of view without using apertures. IR spectral images with an FPA can be generated by scanningthe delay of a FTIR interferogram or by scanning the QCL laser wavelength. Wide-field scanningof a sample is possible in seconds, providing tens of thousands of spectra. The lateral resolution isdetermined by the magnification of the optical system and the size of the detector elements, reachingvalues close to the diffraction limit [14,15,35].
The diffraction limit for spatial resolution is often described using the Rayleigh criterion, where thespatial resolution r is given by Equation (2):
r =1.22 λ2 NA
(2)
where λ is the wavelength of the exciting light, NA is the numerical aperture of the objective andNA = n sin θ, where n is the refractive index of the medium between the objective and the sample,and θ is the acceptance angle of the objective [14]. Under ideal conditions, the maximum achievablespatial resolution is approximately 1/λ (Abbe’s diffraction limit), which, for the fingerprint region,corresponds with a spatial resolution of between 2.5–5 µm. A transmission mode IR microscope usinga FPA detector operates with a spatial resolution of 5 to 6 µm to ensure a sufficient S/N. This valueis lower than the diffraction limit, which lowers the image quality. The diffraction limit at a givenwavelength should decrease by increasing the NA, which can be obtained by increasing the θ or n.The latter methodology was developed by Kazarian using ATR imaging and a crystal having a highrefractive index. The application of this technique to biomedical samples gave a four-fold improvementin spatial resolution [22].
Molecules 2020, 25, 5547 8 of 23
The array of spectral data obtained by these methods can be used to obtain label-free chemicalimages or maps, showing the spatial distribution of specific biomolecules in a sample, either by plottingthe change in the absorbance of a specific spectral band along the imaged area or by using a chemometricanalysis to group the spectra into clusters that belong to the different chemical compositions in thesample [36]. Data can be obtained from a variety of samples, such as fixed or dried cells, tissuebiopsies or live cells. The different FTIR imaging approaches used depend upon the type of biomedicalapplication, the size of the sample and the matrix that surrounds it and the concentration of themolecule to be analyzed.
Raman imaging combines Raman spectroscopy coupled to a microscope with a motorized samplestage, a Notch filter for Rayleigh scattering suppression, a solid-state laser source and a monochromatorfor the analysis of the scattered light and charge-coupled device (CCD) camera. The incident light isfocused on the biological sample through an objective lens with a high numerical aperture (NA) toprovide the resolution corresponding to the diffraction limit. The diffraction limits for the lateral andaxial spatial resolution, δlat and δax, are given by Equation (3):
δlat =0.61 λ
NAδax =
2 λn
(NA)2 (3)
where λ and NA were defined above, and n is the refractive index.Three different spontaneous Raman imaging methodologies were developed: (i) point mapping
and (ii) line mapping as the serial imaging approaches and (iii) direct or wide-field Raman imaging asa parallel imaging approach. In point mapping, a Raman spectrum is acquired at each spatial locationin a confocal configuration to generate a hyperspectral data cube, whereas in-line mapping a Ramanspectrum is obtained for each row of the CCD detector, corresponding to a spatial location along thelength of the laser line. In wide-field imaging, the whole sample field of view is illuminated with alaser light and analyzed in parallel. Discrete light frequencies are analyzed as a function of time byemploying a wide-aperture optical filter. For the in vivo data acquisition, Raman systems are coupledto fiber-optical probes, e.g., in fiber array spectral translation (FAST) [7,8,12,16,35].
Comparing spontaneous Raman with FTIR imaging, the former can use visible laser light,which allows to obtain a lateral resolution <0.5 µm. This spatial resolution is similar to that of confocalfluorescence microscopy and is better than that of FTIR, which is around 2–10 µm, depending onthe wavelength. As water has negligible Raman scattering, the technique is much more suitablefor the analysis of living cells than FTIR, as long as the laser light power is minimized to avoid celldamage. However, FTIR imaging using a FPA can study larger areas of cells or tissues in a morereasonable time than Raman imaging, where usually only small areas can be analyzed (20 µm × 20 µm).Due to its low sensitivity, only a poor S/N ratio is usually obtained, especially for nonchromophoricasymmetric molecules. This leads to longer acquisition times, especially for thin (<1 µm) biologicalsamples. Finally, although both FTIR and Raman are considered to be nondestructive, Raman imaginguses intense VIS, UV and NIR laser excitation sources, which can lead to localized thermal heatingand photodecomposition.
The low sensitivity of spontaneous Raman techniques has led to recent advances in nonlinearRaman microscopic methodologies, such as CARS and SRS microscopy, as well as SORS imaging,which discriminates against surface layer-generated fluorescence emission. Other techniques are basedon the surface plasmon enhancement of the electric field intensity of the excitation beam, either usingAu/Ag NPs in SERS imaging or using an Au/Ag-coated metallic tip, e.g., a metallized atomic forcemicroscopy (AFM) tip, in tip-enhanced Raman spectroscopy (TERS) imaging. TERS achieves a 107-foldamplification in the Raman signal, with sensitivity down to the single-molecule level. Its spatialresolution, approximately of the size of the tip apex (typically 20–30 nm), is by far better than Abbe’sdiffraction limit of λ/2 [7,8,12,16,35].

Molecules 2020, 25, 5547 9 of 23
3. Overview of Biomedical Applications of Vibrational Imaging
In this section, a brief overview is presented of biomedical applications of IR/Raman spectroscopyand imaging, from in vitro body fluids and cells through ex vivo tissues and organs to in vivo preclinicalanimal studies. The large body of reported studies can be found in exhaustive review articles [10,16,37].
3.1. In Vitro Studies
In vitro studies of body fluids, such as blood, plasma, bile, cerebrospinal fluid (CSF) and amnioticfluid, have been performed using IR and Raman spectroscopy and the multivariate data analysis.With such metabolic fingerprinting (metabolomics) studies, molecular biomarkers of cancer andother pathologies, such as diabetes and arthritis, could be defined [6,9,11]. The presence of water inthe samples is not a problem for the Raman analysis but is strongly limiting in the normal mid-IRregion due to strong water bands at 3400 and 1640 cm−1. This can be avoided by using near infrared(NIR) spectroscopy, which is based on molecular overtone and combination vibrations [6]. As thesetransitions are forbidden, the molar absorptivity in the near-IR region is quite small. One advantage isthat NIR can penetrate much deeper into a biological sample than mid-IR light.
3.2. Ex Vivo Cells and Tissues Studies
IR and Raman spectroscopy have also been used extensively in living cell studies for metabolicfingerprinting using the multivariate data analysis in the diagnosis of diseases such as leukemia, cervical,prostate and other types of cancers [6] and for studying drug–cell interactions in pharmaceuticalapplications [38,39]. These spectroscopies were also used in biomedical studies of different kindsof ex vivo tissues and biopsies [35] from many types of cancers [6], including breast cancer [8],to neurological conditions such as multiple sclerosis [40]. Likewise, IR and Raman imaging have foundmany biomedical applications through the analysis of ex vivo tissues and biopsies at the subcellularlevel, such as in spectral histopathology (SHP), which can be compared with gold standard histology(using hematoxylin and eosin (H&E)-stained tissues) [8,14–16,36] and drug diffusion into ex vivotissues [15,16].
The main challenges of FTIR imaging of living cells and ex vivo tissues are the backgroundscattering, the limited spatial resolution, the relatively low limit of detection and the strong backgroundabsorbance from water (70%). Eukaryotic cell sizes and tissue features are typically between 10–100 µmand cell organelles between 1–10 µm. As the wavelengths used in IR spectroscopy (2.5–25-µm rangein the mid-IR region) are very similar to the size of biological cells, they can cause intense Miescattering (in contrast to Rayleigh scattering for particles smaller than the wavelength of scatteringlight), which results in an undulating baseline of IR spectra of biological samples. Additionally, a verydistorted line shape is obtained due a sharp decrease in absorption at 1700 cm−1 (the “dispersionartefact”). These combined effects lead to variations in the relative peak intensity, which is particularlyimportant for the amide I and amide II bands, as they are commonly used to quantitate proteins andidentify their secondary structures. Mie scattering also results in shifts in the observed frequency ofspectral bands. All these spectral artefacts can be reduced or corrected by algorithms. Most live cellstudies use transmission FTIR imaging with a synchrotron source, which provides diffraction-limitedspatial resolution images with high S/N spectra. Therefore, the spatial analysis of living cells is limitedto the measurement of differences between the cytoplasm and nucleus regions and investigation ofdrug uptake into cells [14].
As discussed in the previous section, spontaneous Raman imaging of cells and tissues hasnegligible water interference, somewhat better spatial resolution and a smaller field of view than FTIRimaging. However, its main limitation is a low sensitivity, which can be overcome by nonlinear Ramantechniques (CARS and SRS microscopy), surface plasmon-based techniques, such as SERS and TERSimaging, and Resonance Raman (RR) imaging. The first techniques have been applied to a variety ofpathological tissues, such as brain cancer and breast cancer. For tissues containing high concentrations

Molecules 2020, 25, 5547 10 of 23
of natural fluorophores, such as carotenoids and hemoglobin, normal, RR imaging has been used,while UV light-excited RR (UVRR) has been used to detect RNA/DNA [9,12,16].
3.3. In Vivo Small Animal Studies
Strategies for in vivo small animal Raman imaging have also been described. One approach usedSERS Raman-active nanostars and nanospheres and single-wall carbon nanotubes (SWNT) to performdeep-tissue Raman imaging in small animals [12,41]. Pharmacokinetics, multiplexing and in vivotumor targeting of NPs were demonstrated [12]. For example, SERRS nanostars were used in thecolon cancer imaging of mice, with the delineation of tumor margins both at the primary tumor sitesand metastasis during image-guided surgery [42]. Alternatively, fiberoptics Raman probes have beenused in small animal imaging [9]. The potential of this technique for the in vivo diagnosis of braintumors was demonstrated by obtaining Raman spectral maps over small areas (3.6 mm × 3.2 mm),which allowed the label-free diagnosis of induced metastatic brain tumors in mice with an accuracy of~250 µm [43].
4. Comparison of IR and Raman with Other Molecular Imaging Techniques and the Use ofMultimodality Probes
4.1. Comparison of the Main Molecular Imaging Techniques
The physical basis and the contrast mechanisms operating in IR/Raman imaging techniques werediscussed in Section 2. In order to compare them with the other main imaging modalities currentlyused in preclinical research and in clinical practice, a brief overview of those modalities is presentedhere. However, due to the complexity of the underlying physical principles of each imaging modality,an in-depth approach to each of them is beyond the scope of this review. Table 2 summarizes the maincharacteristics of the imaging modalities, showing their advantages and limitations [2,3,44,45].
MRI is based on the principles of nuclear magnetic resonance (NMR), whereby tomographicimages are obtained after protons absorb the energy of radio frequency (RF) pulses when placedin an external magnetic field; the resultant evolving macroscopic spin polarization induces a RFsignal in a tuned radio frequency coil and thereby is detected while magnetic field gradients localizethe polarization in space. Image contrast can be obtained mainly on the basis of the differences inspin–lattice (T1) and spin–spin (T2) relaxation times of the water and lipid protons present in varioustissues and organs, although the differences in water proton densities, diffusion constants and flowcharacteristics can also be explored [46]. The outstanding diagnostic capabilities of MRI result mainlyfrom the high spatial resolution of the images produced noninvasively and without the use of ionizingradiation. MRI provides images with great soft tissue contrast, allowing the detailed visualization oforgans and tissues, with rich anatomical and physiological information. However, in vivo molecularinformation is more difficult to obtain by MRI due to its poor sensitivity. Other important constraints ofthis technique are high costs and long examination times. The capacity of MRI to distinguish small areasof diseased tissues from healthy ones can be enhanced with the use of contrast agents. These molecules,metal complexes or nanoparticles affect the intensity of the MRI signal by shortening either the T1
or T2 relaxation times of the water protons around them. They are divided into paramagnetic (T1 orpositive) agents, such as highly stable Gd3+ or Mn2+ complexes with polyaminocarboxylate chelators,and superparamagnetic (T2 or negative) agents, such as small superparamagnetic iron oxide NPs(SPIONs) or ultrasmall superparamagnetic iron oxide NPs (USPIONs) [47–49].
X-ray computed tomography (CT) was introduced to clinical practice in 1972 and became one ofthe most frequently used imaging techniques. A CT image is obtained using an X-ray beam source andthe corresponding signal acquisitions taken from different angles, which are processed to reconstruct3D images. When an X-ray beam travels across the body, its interaction with the tissues causes someof it to be absorbed or scattered, and the transmitted beam intensity is attenuated. This selectiveattenuation by the tissues increases with the linear attenuation coefficient (µ), the density (ρ) and the
Molecules 2020, 25, 5547 11 of 23
thickness of the materials present in the tissues they cross and, also, depends on the X-ray energy(E) [50]. CT images provide great anatomical information, being more sensitive to denser tissuesor bones than to soft tissues. Bones appear white on an X-ray image because absorption is greaterin bone, containing materials with atoms of a high atomic number (Z), than in soft tissue (effectiveZ~7.5). The contrast in soft tissues can be improved using contrast agents made of high Z materials,such as barium (Z = 56) sulfate suspensions, iodinated compounds (iodine has Z = 53) or gold (Au,Z = 79) NPs. The main advantages of CT are their relatively short scan times and low costs, and thus,high availability in hospitals and clinics, and good resolution. However, its main limitation is theoverexposure to potentially harmful ionizing radiation and low sensitivity [51–53].
PET and SPECT are highly sensitive diagnostic imaging techniques used in clinical nuclearmedicine, providing the visualization of biological processes at the molecular and cellular levels,which allow to image pathophysiological processes and to monitor the therapeutic effects in vivo.Both modalities require the injection of molecules labeled with radioisotopes that decay by the emissionof β+ particles (positrons) or γ-rays, respectively. These radiopharmaceuticals are administrated intracer quantities and are then distributed, metabolized and excreted from the body, depending ontheir physiological function. During the decay process, the β+ or γ particles are detected to producean image. The radionuclide imaging agents should have half-lives (t1/2) that match the half-life ofthe tracer molecule used in each application. In PET, the positron-emitting radionuclides (e.g., 11C,18F, 68Ga and 89Zr), with relatively short half-lives, are visualized and quantified in living subjectsthrough the detection of the annihilation products of the emitted positron with an electron fromthe surrounding tissue, with the simultaneous production of two 511-keV γ-rays that are emitted inopposite directions to one another. Detectors on opposite sides of the patient, being part of a circulararray surrounding him, detect simultaneously a large number of these pairs of γ-rays (coincidentevents), which can be used to reconstruct a PET image that contains quantitative information aboutthe distribution of radioactivity within the tissue. The radioisotopes used in SPECT imaging (e.g.,99mTc and 111In) decay directly into γ-rays, with generally lower energies and longer half-lives thanthose used in PET. After the emission from the radionuclide, the single photons travel through thetissues and are detected by a circular array of gamma cameras to obtain the images. Although the highsensitivity of these techniques is a very important asset in their clinical applications, the anatomicalinformation provided by the images obtained is limited by their low spatial resolution. Besides this,the other main drawbacks of the nuclear medicine imaging techniques are the exposure to ionizingradiation, the high costs and, often, the use of short imaging times due to the short half-lives of theradioisotopes [53–55].
Optical imaging (OI) is a noninvasive imaging technique that uses nonionizing radiation, such asvisible, ultraviolet and infrared light, to obtain the molecular and physiological information of cells,tissues, organs or whole bodies, playing an important role in the preclinical research and medicaldiagnosis [56]. It includes several techniques, such as fluorescence and bioluminescence imaging,optical coherence tomography (OCT) and endoscopy. In fluorescence imaging, the light emitted byexcited exogenous probes is detected in a spatially resolved manner by a camera. OI is simple to operate,safe, cost-effective and sensitive, providing real-time imaging, subcellular resolution using nM-probeconcentrations and the use of multiple probes with different properties, which allows multichanneldetection. The main disadvantages are the poor tissue penetration depth, due to strong light absorption,background signal due to light scattering and autofluorescence, affecting the image-optical contrastand low photostability of some organic dye probes. These features hinder the clinical translationof some of these techniques [57–59]. However, fluorescent probes are used for image-guided tumorsurgery, while near-infrared (NIR) fluorescent organic fluorophores and luminescent NPs, such as NIRquantum dots and lanthanide-doped upconversion NPs (UCNPs), are being developed to improvetissue penetration [57–63]. With such a variety of optical probes available, many studies of cellularprocesses using fluorescence confocal microscopy and imaging have been carried out. Fluorescenceimaging was also used for in vivo small animal whole-body tissue studies, mostly based on the planar

Molecules 2020, 25, 5547 12 of 23
detection of fluorescent light, using epi-illumination or the transillumination techniques. Fluorescencemolecular tomography (FMT), which maps the 3D distribution of the probe noninvasively, overcomesthe limitations of the above techniques to provide quantitative information on probe distribution.This results from the nonlinear dependence of the measured signal intensity on the depth of the probelocation [64].
In ultrasound (US) imaging, pulses of ultrasound waves are produced and emitted by an ultrasonictransducer, which are transmitted through the body and interact with organ boundaries and complextissue structures, producing echoes due to reflection or scattering, which are received by the sametransducer. Theses echoes are processed digitally to reconstruct an image, representing in a grayscale the two-dimensional cross-section of the body with a contrast that reflects the distance, size anddensity of each tissue structure originating the echoes. Three-dimensional US images can also beobtained by moving the transducer over the surface of the body under study. US can be acquired in theDoppler mode, in which the changes in the pitch and phase of the sound waves are used to obtain thevelocity and direction of movements inside the body, such as blood flow in the heart and vasculature.The contrast in US images is due to the differences in the acoustic impedance (echogenicity) of theimaged tissues. A spatial resolution of ∼0.2–1 mm is obtained for the typical sound wave frequencies(above 1 MHz) applied in clinical use for ultrasound waves generation and detection [65,66]. US is oneof the most widely used modalities for imaging soft tissues, providing the diagnosis and staging ofmany pathologies. It is safe (noninvasive and nonionizing), accessible and relatively cheap, with highspatial resolution and excellent temporal resolution, which can be used for real-time diagnostics,as well as for therapeutic purposes (High-Intensity Focused Ultrasound—HIFU). However, its mainlimitations are the limited tissue penetration, whose depth decreases when the spatial resolutionincreases, high background noise and, sometimes, insufficient acoustic contrast between the tissueconstituents. These limitations lead to the development of exogenous acoustic ultrasound contrastagents (USCAs) with high echogenicity [67–69]. One example is gas-filled microbubbles (∼1–4-µmdiameters), which, upon intravenous injection, are retained in the vascular space [68]. Several othertypes of nanometric USCAs have been developed [66,68].
Photoacoustic imaging (PAI) is based on the photoacoustic effect first described in 1881 byAlexander G. Bell, which consists of the generation of sound waves after light absorption within amedia. When an ultra-short pulsed laser irradiates a tissue, light absorption by an endogenous orexogenous tissue chromophore generates heat that is released to the immediate environment, causingits rapid thermoelastic expansion and contraction and leading to a high-amplitude, broadband acousticwave. These ultrasound waves can be detected using standard US transducers, and photoacousticimages can be reconstructed from them [70]. Therefore, PAI has high optical contrast at the higherspatial resolution and depths (up to 7 cm) that are typical of US. It also has many molecular imagingapplications, based on the molecular structure dependence of the optical absorption of the chromophoresused. The PAI contrast depends on the difference of the photoacoustic signal intensity of the tissues,which is proportional to the optical-to-acoustic conversion efficiency of the media. This is determinedby the number of photons absorbed by the chromophore and the ability of the tissue to convert it toheat that generates the acoustic wave [70]. PAI can use endogenous contrast agents present in tissues,such as hemoglobin, melanin and lipids, as well as exogenous dyes or metal-based NPs with goodoptical or magnetic properties, such as gold NPs, semiconducting quantum dots, carbon nanomaterialsor magnetic iron oxide NPs [66,70]. Small blood vessels can be imaged using hemoglobin as a PAIprobe [71]. The dependence of the PAI signal on the wavelength of the laser used can be exploitedto obtain functional information by photoacoustic microscopy, such as blood oxygenation levels andthe presence of atherosclerotic plaques in vessels [72], or in applications of multispectral optoacoustictomography (MSOT) [73].

Molecules 2020, 25, 5547 13 of 23
Table 2. Comparison of the features of IR/Raman imaging with those of the other main modalities usedin research and clinics. These features depend on the experimental configuration [2,66]. PET:Positron Emission Tomography, SPECT: Single-Photon Emission-Computed Tomography, SERS:Surface-Enhanced Raman Scattering, SORS: Spatially Offset Raman Spectroscopy and NIRF: NearInfrared Fluorescence.
Imaging Modality Spatial Resolution TemporalResolution Penetration Depth Sensitivity
IR 2.5–6 µm s/min 10 µm–1 mm 10−4–10−5 M
Raman 0.5–1 µm20–100 nm (SERS) s/min
200–300 µm20–100 µm (SERS)
~1 mm (SORS)
10−6–10−7 M10−12–10−15 M
(SERS)
MRI 25–100 µm (preclinical)~1 mm (clinical) s/h unlimited 10−3–10−5 M
Luminescence 2 to 3 mm1–10 µm (NIRF) s/min <2 cm 10−9–10−12 M
Intravitalmicroscopy 100–300 nm ms/s ~1 mm 10−15–10−17 M
Resonance energytransfer 2 to 3 mm s <2 cm 10−6–10−10 M
Optical coherencetomography (OTC) 1 µm s ~2 to 3 mm 10−10–10−11 M
Photoacousticimaging (PAI/PAT)
5 µm–1 mm(depth-dependent) s/min <6 cm 10−9–10−11 M
Ultrasoundimaging (US)
10–100 µm(at ~mm depth);
1 to 2 cm(at ~cm depth)
s/min 1 cm 10−6–10−9 M
γ-imaging 1–10 mm min unlimited 10−10–10−11 M
PET <1 mm (preclinical),~5 mm (clinical) s/min unlimited 10−11–10−12 M
SPECT 0.5–2 mm (preclinical),8–10 mm (clinical) min unlimited 10−10–10−11 M
Computedtomography (CT)
25–200 µm (preclinical),0.5–1 mm (clinical) s/min unlimited 10−3 M
Raman imaging is label-free, nondestructive and with a very high and rich chemical specificity.This is in contrast to other optical techniques, such as phase-contrast microscopy and confocalfluorescence, which either rely on labeling or tissue physical properties, such as refractive indicesor autofluorescence, and they also have broader, less-resolved bands. It uses low energy light,which usually does not cause sample photobleaching or ionization, making it particularly suitable forthe analysis of biological samples and live cells. However, due to its low sensitivity, in vivo Ramanimaging is challenging unless certain metallic NPs (e.g., Ag, Au and Cu) are used to amplify the signalin deep tissues. The SERS (and variants, such as SESORS) technique amplifies the Raman signal by afactor of ~1010, enabling detection of the nanoparticles up to a 1–5-cm tissue depth at fM concentrations.The high sensitivity of SERS, the lack of toxicity of its imaging NPs and its multiplexing capabilitiesmake it a promising modality for future clinical applications. However, the still-limited penetrationdepth and difficulties with imaging large fields of view and in implementing tomography limitwhole-body deep tissue imaging with SERS-based techniques. Thus, the most promising future clinicalapplications of SERS imaging will be those avoiding deep tissue penetration, such as endoscopy [2,66].
The basic characteristics of the main imaging modalities summarized in Table 2, and the consequenttechnical limitations, clearly highlight their advantages and disadvantages [2,66]. Spatial resolutionincreases from PET/SPECT, through MRI, CT, US and OI, to PAI, OTC, IR and Raman. On the other
Molecules 2020, 25, 5547 14 of 23
hand, the sensitivity is extremely high in SERS–Raman and PET/SPECT, high in OI and PAI, medium inUS and MRI and low in CT. MRI has the lowest temporal resolution (scan time), but this is compensatedby an unlimited penetration depth, like CT and PET/SPECT. This property is below 1 mm for IR andRaman (except with SORS) and the mm–cm range for US, PAI and OI. The image contrast of soft tissuesis optimal in IR and Raman and is better for MRI, PET, SPECT and PAI than for CT and US. Additionallyimportant are the possibility of multiplexing in OI, PAI and SERS-Raman; quantitative imaging inSPECT; whole-body imaging in PET/SPECT, MRI and CT and real-time imaging of US, IR and Raman.Other important characteristics dictate the current clinical use of the different modalities. US, MRI, OIand PAI have good safety profiles, which are poorer for CT and PET/SPECT, due to the use of ionizingradiation. US, OI and PAI are easier to use than CT, MRI and PET/SPECT. The throughput capacityis high for PAI; medium for US and OI and low for CT, MRI and PET/SPECT, while the cost is veryhigh for PET and MRI; high for CT and SPECT and low for US, OI and PAI. Consequently, US, CT,MRI and PET/SPECT are currently used clinically, while OI, PAI, IR and SERS–Raman have emergingclinical utility.
The intrinsic characteristics of the main imaging modalities (Table 2) also have strong implicationsin limiting preclinical molecular imaging and clinical practice [2,3,66]. For instance, the high spatialresolution of MRI is often not enough to allow the in vivo imaging of biomarkers, due to the lowintrinsic MRI sensitivity. In fact, The MRI CAs only produce a detectable image contrast enhancementat a relatively high local concentration (about 10 µM), which can saturate the targeted cell receptors.This is because such local concentrations are considerably higher than the typical cellular concentrationof a particular receptor, which is in the nM–µM range per cell volume (corresponding to 105 receptorsper cell). The problems related to the low intrinsic sensitivity of MRI can be addressed by usingtargeted NPs capable of delivering a high payload of magnetic centers concentrated in a small volume.The high sensitivities of radionuclear (PET/SPECT) and optical imaging modalities (10−10–10−12 M)and of SERS–Raman (10−12–10−15 M) are much better-suited to address this problem.
These and other examples illustrate the frequent difficulty to obtain accurate and reliableinformation of pathological sites using a single imaging modality. This issue was addressed throughthe design of NPs containing reporters capable of multimodality detection. In these NPs, imagingmodalities with high sensitivity (such as PET and OI) are usually combined with others providing highspatial resolution (MRI, CT, etc.), such as in NPs for PET/CT or PET/MRI. The limited tissue penetrationof OI, PAI or SERS–Raman probes can be compensated by their conjugation with MRI/US/PET probesin a single NP. However, the different sensitivities of the modalities combined in one NP should becompensated by using the appropriate relative concentrations of their active probe centers in thecombined nanoplatforms.
Recently, a large variety of NPs has been developed as probes for multimodalimaging [2,3,44,66,74,75]. Combined hybrid images of CT/MRI with PET or SPECT can complementanatomical and molecular/functional information, enabling the noninvasive and quantitativeassessment of drug-targeting mechanisms and efficiency [76]. Another important aspect is therecent development of virtually all hybrid preclinical and clinical imaging systems, such as SPECT/CT,PET/CT and PET/MRI scanners, allowing simultaneous (rather than sequential) whole-body imaging.This multimodality approach provided integrated theragnostic platforms [4] that could be used inpreoperative diagnosis and intraoperative NIR-I/II fluorescence-guided surgery, as well as postoperativemonitoring [77].
4.2. Applications of Multimodality Probes Involving Vibrational Imaging Techniques
The diagnostic performance of Raman imaging was improved using different approaches [16].One of them was to develop dual-mode instruments and techniques to combine the biochemicalspecificity of Raman spectroscopy and imaging with the sensitivity and rapid screening capability ofother label-free high-resolution optical imaging techniques, such as phase contrast microscopy [78],autofluorescence [79,80] and optical coherence tomography (OCT) [81,82] of cells and pathologic
Molecules 2020, 25, 5547 15 of 23
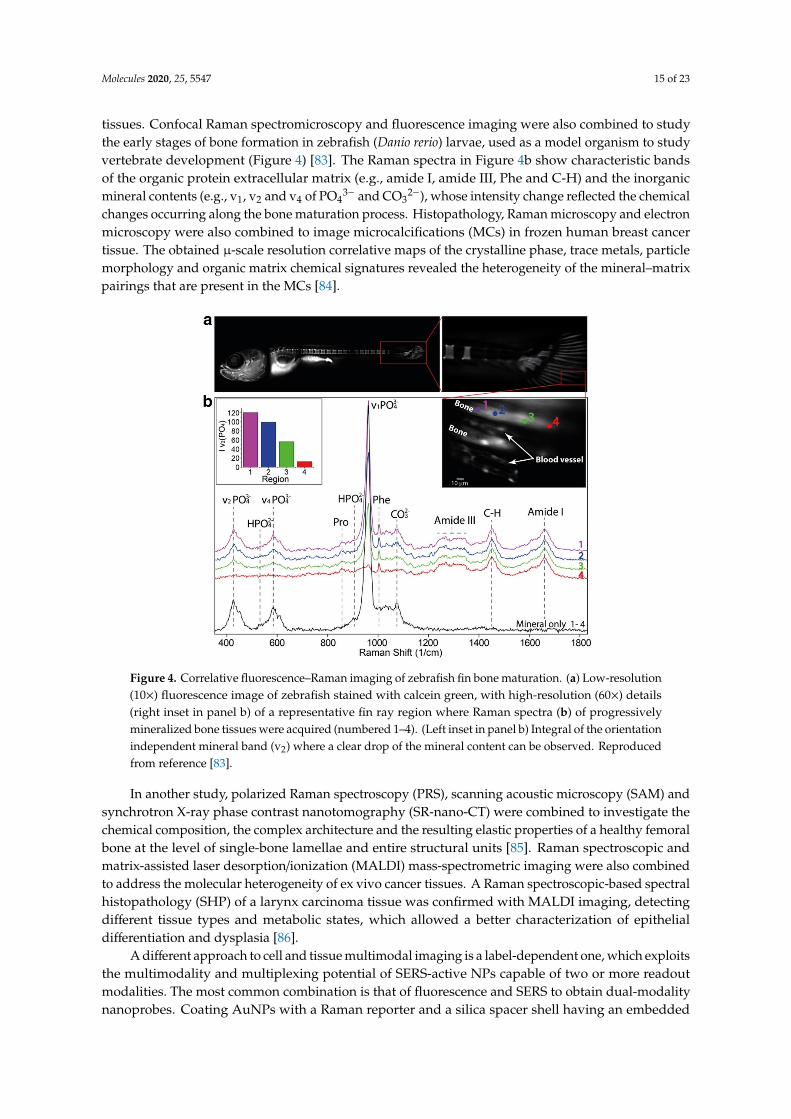
tissues. Confocal Raman spectromicroscopy and fluorescence imaging were also combined to studythe early stages of bone formation in zebrafish (Danio rerio) larvae, used as a model organism to studyvertebrate development (Figure 4) [83]. The Raman spectra in Figure 4b show characteristic bandsof the organic protein extracellular matrix (e.g., amide I, amide III, Phe and C-H) and the inorganicmineral contents (e.g., v1, v2 and v4 of PO4
3− and CO32−), whose intensity change reflected the chemical
changes occurring along the bone maturation process. Histopathology, Raman microscopy and electronmicroscopy were also combined to image microcalcifications (MCs) in frozen human breast cancertissue. The obtained µ-scale resolution correlative maps of the crystalline phase, trace metals, particlemorphology and organic matrix chemical signatures revealed the heterogeneity of the mineral–matrixpairings that are present in the MCs [84].Molecules 2020, 25, x 15 of 22
Figure 4. Correlative fluorescence–Raman imaging of zebrafish fin bone maturation. (a) Low-resolution (10×) fluorescence image of zebrafish stained with calcein green, with high-resolution (60×) details (right inset in panel b) of a representative fin ray region where Raman spectra (b) of progressively mineralized bone tissues were acquired (numbered 1–4). (Left inset in panel b) Integral of the orientation independent mineral band (v2) where a clear drop of the mineral content can be observed. Reproduced from reference [83].
In another study, polarized Raman spectroscopy (PRS), scanning acoustic microscopy (SAM) and synchrotron X-ray phase contrast nanotomography (SR-nano-CT) were combined to investigate the chemical composition, the complex architecture and the resulting elastic properties of a healthy femoral bone at the level of single-bone lamellae and entire structural units [85]. Raman spectroscopic and matrix-assisted laser desorption/ionization (MALDI) mass-spectrometric imaging were also combined to address the molecular heterogeneity of ex vivo cancer tissues. A Raman spectroscopic-based spectral histopathology (SHP) of a larynx carcinoma tissue was confirmed with MALDI imaging, detecting different tissue types and metabolic states, which allowed a better characterization of epithelial differentiation and dysplasia [86].
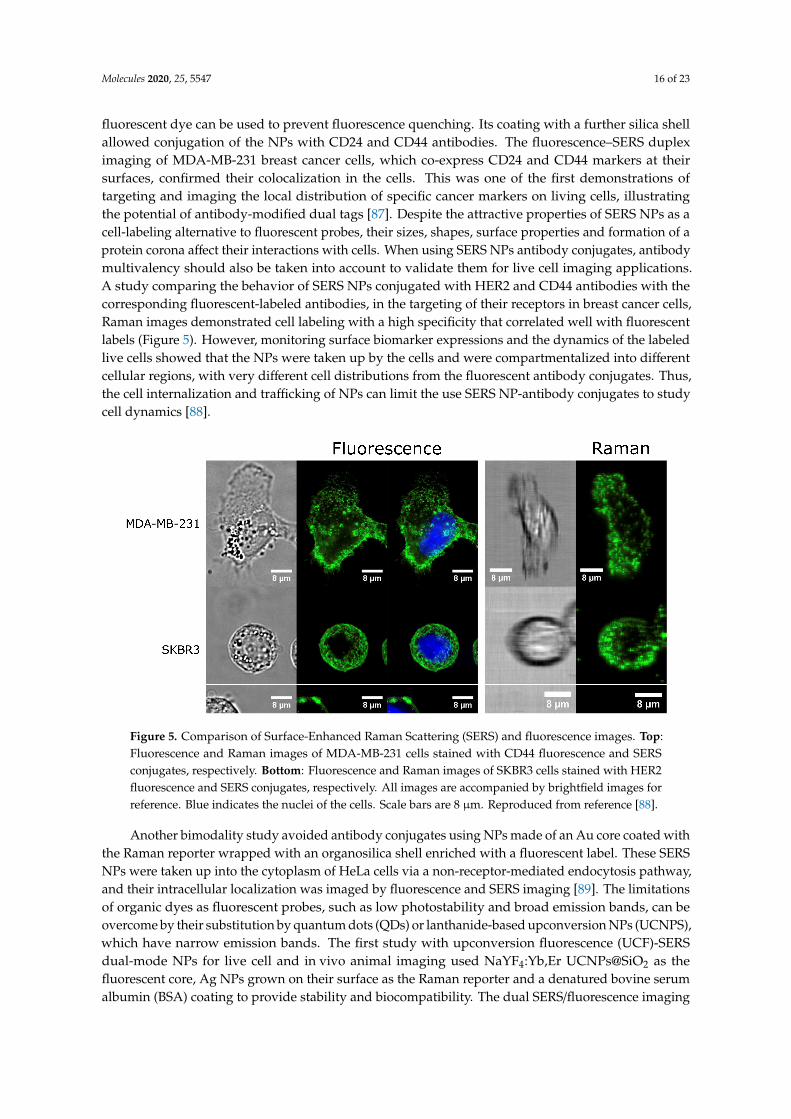
A different approach to cell and tissue multimodal imaging is a label-dependent one, which exploits the multimodality and multiplexing potential of SERS-active NPs capable of two or more readout modalities. The most common combination is that of fluorescence and SERS to obtain dual-modality nanoprobes. Coating AuNPs with a Raman reporter and a silica spacer shell having an embedded fluorescent dye can be used to prevent fluorescence quenching. Its coating with a further silica shell allowed conjugation of the NPs with CD24 and CD44 antibodies. The fluorescence–SERS duplex imaging of MDA-MB-231 breast cancer cells, which co-express CD24 and CD44 markers at their surfaces, confirmed their colocalization in the cells. This was one of the first demonstrations of targeting and imaging the local distribution of specific cancer markers on living cells, illustrating the potential of antibody-modified dual tags [87]. Despite the attractive properties of SERS NPs as a cell-labeling alternative to fluorescent probes, their sizes, shapes, surface properties and formation of a protein corona affect their interactions with cells. When using SERS NPs antibody conjugates, antibody multivalency should also be taken into account to validate them for live cell imaging applications. A study comparing the behavior of SERS NPs conjugated with HER2 and CD44 antibodies with the corresponding fluorescent-labeled antibodies, in the targeting of their receptors in breast cancer cells, Raman images demonstrated cell labeling with a high specificity that correlated well with fluorescent labels (Figure 5). However, monitoring surface biomarker expressions and the
Figure 4. Correlative fluorescence–Raman imaging of zebrafish fin bone maturation. (a) Low-resolution(10×) fluorescence image of zebrafish stained with calcein green, with high-resolution (60×) details(right inset in panel b) of a representative fin ray region where Raman spectra (b) of progressivelymineralized bone tissues were acquired (numbered 1–4). (Left inset in panel b) Integral of the orientationindependent mineral band (v2) where a clear drop of the mineral content can be observed. Reproducedfrom reference [83].
In another study, polarized Raman spectroscopy (PRS), scanning acoustic microscopy (SAM) andsynchrotron X-ray phase contrast nanotomography (SR-nano-CT) were combined to investigate thechemical composition, the complex architecture and the resulting elastic properties of a healthy femoralbone at the level of single-bone lamellae and entire structural units [85]. Raman spectroscopic andmatrix-assisted laser desorption/ionization (MALDI) mass-spectrometric imaging were also combinedto address the molecular heterogeneity of ex vivo cancer tissues. A Raman spectroscopic-based spectralhistopathology (SHP) of a larynx carcinoma tissue was confirmed with MALDI imaging, detectingdifferent tissue types and metabolic states, which allowed a better characterization of epithelialdifferentiation and dysplasia [86].
A different approach to cell and tissue multimodal imaging is a label-dependent one, which exploitsthe multimodality and multiplexing potential of SERS-active NPs capable of two or more readoutmodalities. The most common combination is that of fluorescence and SERS to obtain dual-modalitynanoprobes. Coating AuNPs with a Raman reporter and a silica spacer shell having an embedded
Molecules 2020, 25, 5547 16 of 23
fluorescent dye can be used to prevent fluorescence quenching. Its coating with a further silica shellallowed conjugation of the NPs with CD24 and CD44 antibodies. The fluorescence–SERS dupleximaging of MDA-MB-231 breast cancer cells, which co-express CD24 and CD44 markers at theirsurfaces, confirmed their colocalization in the cells. This was one of the first demonstrations oftargeting and imaging the local distribution of specific cancer markers on living cells, illustratingthe potential of antibody-modified dual tags [87]. Despite the attractive properties of SERS NPs as acell-labeling alternative to fluorescent probes, their sizes, shapes, surface properties and formation of aprotein corona affect their interactions with cells. When using SERS NPs antibody conjugates, antibodymultivalency should also be taken into account to validate them for live cell imaging applications.A study comparing the behavior of SERS NPs conjugated with HER2 and CD44 antibodies with thecorresponding fluorescent-labeled antibodies, in the targeting of their receptors in breast cancer cells,Raman images demonstrated cell labeling with a high specificity that correlated well with fluorescentlabels (Figure 5). However, monitoring surface biomarker expressions and the dynamics of the labeledlive cells showed that the NPs were taken up by the cells and were compartmentalized into differentcellular regions, with very different cell distributions from the fluorescent antibody conjugates. Thus,the cell internalization and trafficking of NPs can limit the use SERS NP-antibody conjugates to studycell dynamics [88].
Molecules 2020, 25, x 16 of 22
dynamics of the labeled live cells showed that the NPs were taken up by the cells and were compartmentalized into different cellular regions, with very different cell distributions from the fluorescent antibody conjugates. Thus, the cell internalization and trafficking of NPs can limit the use SERS NP-antibody conjugates to study cell dynamics [88].
Figure 5. Comparison of Surface-Enhanced Raman Scattering (SERS) and fluorescence images. Top: Fluorescence and Raman images of MDA-MB-231 cells stained with CD44 fluorescence and SERS conjugates, respectively. Bottom: Fluorescence and Raman images of SKBR3 cells stained with HER2 fluorescence and SERS conjugates, respectively. All images are accompanied by brightfield images for reference. Blue indicates the nuclei of the cells. Scale bars are 8 μm. Reproduced from reference [88].
Another bimodality study avoided antibody conjugates using NPs made of an Au core coated with the Raman reporter wrapped with an organosilica shell enriched with a fluorescent label. These SERS NPs were taken up into the cytoplasm of HeLa cells via a non-receptor-mediated endocytosis pathway, and their intracellular localization was imaged by fluorescence and SERS imaging [89]. The limitations of organic dyes as fluorescent probes, such as low photostability and broad emission bands, can be overcome by their substitution by quantum dots (QDs) or lanthanide-based upconversion NPs (UCNPS), which have narrow emission bands. The first study with upconversion fluorescence (UCF)-SERS dual-mode NPs for live cell and in vivo animal imaging used NaYF4:Yb,Er UCNPs@SiO2 as the fluorescent core, Ag NPs grown on their surface as the Raman reporter and a denatured bovine serum albumin (BSA) coating to provide stability and biocompatibility. The dual SERS/fluorescence imaging capabilities of the NPs were successfully evaluated in vitro with MCF-7 cells in vivo with mice using NIR laser excitation [90].
All the examples described above used fluorescence and SERS to localize the tags using the same information. A further development was to combine SERS tags with complementary functionalities and modalities to obtain information that is not achieved by SERS. An example of this was the use of magnetic SERS NPs for combined SERS/fluorescence imaging. Fe3O4 cores were first encapsulated into an inner layer of silica and then coated with a second layer of Au nanoshell (Fe3O4@SiO2@Au). Adjustment of the Au shell thickness can tune the surface plasmon resonance (SPR) of the Fe3O4@SiO2@Au NPs from the visible to the NIR region. After this, the NPs were covered with a third layer of Raman reporters to provide a SERS signal and coated again with an outer layer of fluorescent dye-doped silica. This onion-like multimodal nanoplatform could be taken up by Hela cells, with an enhanced uptake in the presence of a magnetic field. Fluorescence and SERS signals could be observed separately by exciting the NPs at different wavelengths, such as 515 nm and 633 nm, as proven by both fluorescence and SERS imaging [91]. A trimodality imaging nanoprobe (SERS, MRI
Figure 5. Comparison of Surface-Enhanced Raman Scattering (SERS) and fluorescence images. Top:Fluorescence and Raman images of MDA-MB-231 cells stained with CD44 fluorescence and SERSconjugates, respectively. Bottom: Fluorescence and Raman images of SKBR3 cells stained with HER2fluorescence and SERS conjugates, respectively. All images are accompanied by brightfield images forreference. Blue indicates the nuclei of the cells. Scale bars are 8 µm. Reproduced from reference [88].
Another bimodality study avoided antibody conjugates using NPs made of an Au core coated withthe Raman reporter wrapped with an organosilica shell enriched with a fluorescent label. These SERSNPs were taken up into the cytoplasm of HeLa cells via a non-receptor-mediated endocytosis pathway,and their intracellular localization was imaged by fluorescence and SERS imaging [89]. The limitationsof organic dyes as fluorescent probes, such as low photostability and broad emission bands, can beovercome by their substitution by quantum dots (QDs) or lanthanide-based upconversion NPs (UCNPS),which have narrow emission bands. The first study with upconversion fluorescence (UCF)-SERSdual-mode NPs for live cell and in vivo animal imaging used NaYF4:Yb,Er UCNPs@SiO2 as thefluorescent core, Ag NPs grown on their surface as the Raman reporter and a denatured bovine serumalbumin (BSA) coating to provide stability and biocompatibility. The dual SERS/fluorescence imaging
Molecules 2020, 25, 5547 17 of 23
capabilities of the NPs were successfully evaluated in vitro with MCF-7 cells in vivo with mice usingNIR laser excitation [90].
All the examples described above used fluorescence and SERS to localize the tags using the sameinformation. A further development was to combine SERS tags with complementary functionalities andmodalities to obtain information that is not achieved by SERS. An example of this was the use of magneticSERS NPs for combined SERS/fluorescence imaging. Fe3O4 cores were first encapsulated into an innerlayer of silica and then coated with a second layer of Au nanoshell (Fe3O4@SiO2@Au). Adjustmentof the Au shell thickness can tune the surface plasmon resonance (SPR) of the Fe3O4@SiO2@Au NPsfrom the visible to the NIR region. After this, the NPs were covered with a third layer of Ramanreporters to provide a SERS signal and coated again with an outer layer of fluorescent dye-doped silica.This onion-like multimodal nanoplatform could be taken up by Hela cells, with an enhanced uptakein the presence of a magnetic field. Fluorescence and SERS signals could be observed separately byexciting the NPs at different wavelengths, such as 515 nm and 633 nm, as proven by both fluorescenceand SERS imaging [91]. A trimodality imaging nanoprobe (SERS, MRI and PAI) containing an Aucore surrounded by a thin Raman active layer protected by a silica coating, which was functionalizedwith Gd(DOTA) (DOTA = 1,4,7,10-tetraazacyclododecane-1,4,7,10-tetraacetic acid), demonstrated itspotential for more accurate brain tumor imaging and resection in living mice. MRI allowed preoperativedetection and surgical planning. PAI, with its relatively high resolution and deep tissue penetration,could guide intraoperative tumor resection. The ultra-high sensitivity and spatial resolution of Ramanimaging was then used to remove residual microscopic tumors. Finally, the examination with a Ramanprobe ex vivo and a histological correlation validated that Raman imaging was accurately delineatingthe brain tumor margins [92]. A limiting example, exploiting the multimodality and multiplexingpotential of SERS NPs, was the development of theragnostic NPs active in five modalities: namely,SERS, MRI, CT, two-photon luminescence (TPL) and photothermal therapy (PTT). Au nanostars werecovered with a Raman reporter for SERS, PTT and CT detection, then coated with PEG and a silica shell,which was conjugated with Gd(DOTA) as the MRI contrast agent. The potential of the nanoplatformfor preoperative tumor scanning (MRI and CT), intraoperative tumor detection (SERS and TPL) andPTT as a postoperative treatment was demonstrated using BT549 cancer cells [93]. Besides the previousexample, the theragnostic potential of SERS NPs was further explored, e.g., for SERS-monitoredintracellular redox-triggered drug delivery [94] and cancer PTT [95].
4.3. Clinical Applications
The applications of vibrational spectroscopy and imaging that can be translatable to clinicalmedicine have been recently reviewed and are summarized and classified in three areas [96,97]. The firstone is Raman spectroscopy for intraoperative and in vivo diagnostics, such as the use of in vivo Ramanfiber probes; deep Raman spectroscopy using TRS and SORS techniques to study tissues like skin andbone; endoscopic diagnostics of pathologies of hollow organs in the gastrointestinal (GI) tract (larynx,esophagus, stomach and colon) or in lungs (bronchoscopy) based on fiber optics Raman probes [16];intraoperative Raman spectroscopy to provide the surgeon with a real-time measure of a tumor marginanalysis or of metastatic lesions in image-guided surgery of, e.g., skin [81], breast [80] or colon [82]cancers or in brain-conserving cancer surgery [98]. Despite the many promising positive results, most ofthe studies are too statistically limited in the number of patients studied to take into account thevariances in the population of interest, as well as the inter- and intra-observer differences. The secondarea of application is Raman spectroscopy and imaging for ex vivo samples, e.g., of infectious diseases,detecting pathogens in urine, blood and other body fluids, often using SERS, to design assays suitablefor point-of-care applications. However, such onsite routine applications require the developmentof completely automated protocols for sample preparation and analysis using hand-held Ramanequipment. Finally, point-of-care applications of FTIR spectroscopy and imaging, coupled with themultivariate data analysis, of biofluids, single cells and pathological (e.g., cancer) tissue sections (exvivo spectroscopic histopathology) have seen many technological advances. However, the translation

Molecules 2020, 25, 5547 18 of 23
of the technology to the clinic must be driven by clinicians and pathologists. Issues like differencesin tissue densities and processing artifacts can lead to erroneous results. Data analysis of the spectraand images of chemically diverse biological samples and the interpretations of the results are alsochallenging. The instrumental requirements for suitable clinic use, preprocessing data strategies andstatistical analyses in clinical spectroscopy and data sharing protocols have been discussed [97].
Multimodal imaging can have a role in the development of all these three areas of application.For example, an integrated optical technique based on autofluorescence imaging and Raman scatteringwas used to analyze basal mammary ductal carcinoma and skin cell carcinoma, leading to a fasterdiagnoses than by histopathology and IR or Raman imaging alone [80,81]. A clinical instrument wasalso developed to combine Raman spectroscopy and OCT for the morphological and biochemicalcharacterizations of skin cancer [81]. Another example is the combination of data from IR and Ramanspectroscopy and the imaging of biological samples with other chemical imaging techniques, such asX-ray fluorescence (XRF), mass spectrometry imaging (MSI) and laser ablation inductively coupledplasma mass spectrometry (LA-ICP-MS). As the cell information provided by each technique is different,such as on the metallome, proteome, lipidome and metabolome, the combination of different modalitiesimproves the definition of the cell phenotype [96].
5. Conclusions and Future Prospects
The various techniques that are available based on vibrational (FTIR and Raman) spectroscopyand imaging have found many and varied preclinical biomedical applications for the label-free,noninvasive in vitro studies of body fluids and cells, ex vivo tissues and biopsies and in vivo animals.Some of these are translatable to clinical medicine, depending on the development of instruments,strategies for data preprocessing, statistical analysis and sharing protocols adapted to the clinicalenvironment [96,97]. This process can benefit from the design of new instruments, techniques andmultimodal approaches to chemical probes. Raman tweezers able to obtain Raman spectra of opticallytrapped biological cells are being used in the acquisition of Raman images [99]. A very recent andpromising technique is micro-photoacoustic infrared spectroscopy (microPAS), allowing photoacoustic(PA) IR spectroscopy measurements of small samples using conventional FTIR spectrometers, providingmicroscopic images with spatial resolutions in the 20–100-µm range [100]. In relation to chemicalprobes, the super-resolution imaging of SERS tag hot spots provides spatial resolutions on the order of1–10 nm [101]. The multiplexing capabilities of SERS tags can be used in many imaging applications,such as sensing of the cellular environment, multifunctional imaging and theragnostic platforms [102].The combination of various imaging modalities using the same SERS-based nanoplatform has oftenincluded modalities, such as fluorescence imaging or PAI, with similar characteristics—high sensitivityand spatial resolution, limited tissue penetration and a small field of view. The limitations of SERS-basedRaman imaging can be best compensated by adding functionalities active in complementary modalities,such as MRI/CT/US. Thus, the careful selection of different functionalities on a single SERS-basedplatform can facilitate progress towards specialized and personal medical procedures.
Funding: This research was funded by the Foundation of Science and Technology Chemistry (FCT), Portugal,through the Coimbra Chemistry Centre, grant numbers UID/QUI/00313/2019 and POCI-01-0145-FEDER-027996.
Conflicts of Interest: The author declares no conflict of interest.
References
1. Weissleder, R.; Mahmood, I. Molecular Imaging. Radiology 2001, 219, 316–333. [CrossRef]2. Smith, B.R.; Gambhir, S.S. Nanomaterials for in vivo imaging. Chem. Rev. 2017, 117, 901–986. [CrossRef]
[PubMed]3. Lee, D.-E.; Koo, H.; Sun, I.-C.; Ryu, J.H.; Kim, K.Y.; Kwon, I.C. Multifunctional nanoparticles for multimodal
imaging and theragnosis. Chem. Soc. Rev. 2012, 41, 2656–2672. [CrossRef] [PubMed]
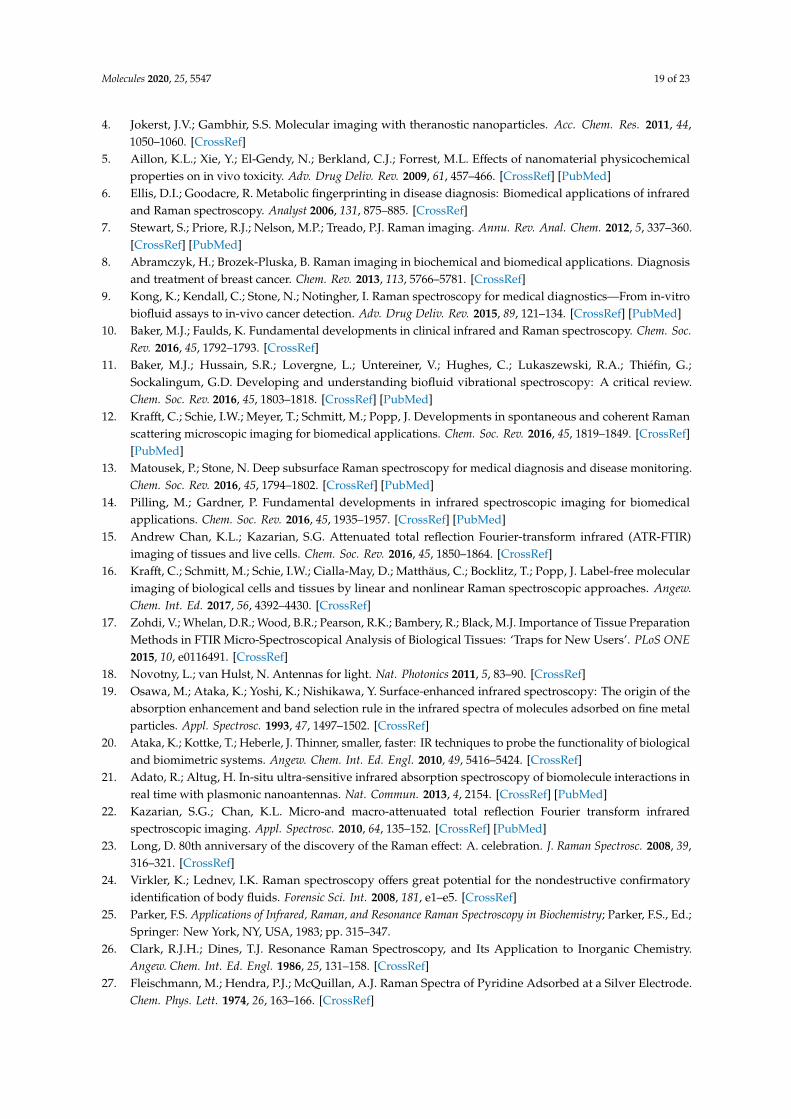
Molecules 2020, 25, 5547 19 of 23
4. Jokerst, J.V.; Gambhir, S.S. Molecular imaging with theranostic nanoparticles. Acc. Chem. Res. 2011, 44,1050–1060. [CrossRef]
5. Aillon, K.L.; Xie, Y.; El-Gendy, N.; Berkland, C.J.; Forrest, M.L. Effects of nanomaterial physicochemicalproperties on in vivo toxicity. Adv. Drug Deliv. Rev. 2009, 61, 457–466. [CrossRef] [PubMed]
6. Ellis, D.I.; Goodacre, R. Metabolic fingerprinting in disease diagnosis: Biomedical applications of infraredand Raman spectroscopy. Analyst 2006, 131, 875–885. [CrossRef]
7. Stewart, S.; Priore, R.J.; Nelson, M.P.; Treado, P.J. Raman imaging. Annu. Rev. Anal. Chem. 2012, 5, 337–360.[CrossRef] [PubMed]
8. Abramczyk, H.; Brozek-Pluska, B. Raman imaging in biochemical and biomedical applications. Diagnosisand treatment of breast cancer. Chem. Rev. 2013, 113, 5766–5781. [CrossRef]
9. Kong, K.; Kendall, C.; Stone, N.; Notingher, I. Raman spectroscopy for medical diagnostics—From in-vitrobiofluid assays to in-vivo cancer detection. Adv. Drug Deliv. Rev. 2015, 89, 121–134. [CrossRef] [PubMed]
10. Baker, M.J.; Faulds, K. Fundamental developments in clinical infrared and Raman spectroscopy. Chem. Soc.Rev. 2016, 45, 1792–1793. [CrossRef]
11. Baker, M.J.; Hussain, S.R.; Lovergne, L.; Untereiner, V.; Hughes, C.; Lukaszewski, R.A.; Thiéfin, G.;Sockalingum, G.D. Developing and understanding biofluid vibrational spectroscopy: A critical review.Chem. Soc. Rev. 2016, 45, 1803–1818. [CrossRef] [PubMed]
12. Krafft, C.; Schie, I.W.; Meyer, T.; Schmitt, M.; Popp, J. Developments in spontaneous and coherent Ramanscattering microscopic imaging for biomedical applications. Chem. Soc. Rev. 2016, 45, 1819–1849. [CrossRef][PubMed]
13. Matousek, P.; Stone, N. Deep subsurface Raman spectroscopy for medical diagnosis and disease monitoring.Chem. Soc. Rev. 2016, 45, 1794–1802. [CrossRef] [PubMed]
14. Pilling, M.; Gardner, P. Fundamental developments in infrared spectroscopic imaging for biomedicalapplications. Chem. Soc. Rev. 2016, 45, 1935–1957. [CrossRef] [PubMed]
15. Andrew Chan, K.L.; Kazarian, S.G. Attenuated total reflection Fourier-transform infrared (ATR-FTIR)imaging of tissues and live cells. Chem. Soc. Rev. 2016, 45, 1850–1864. [CrossRef]
16. Krafft, C.; Schmitt, M.; Schie, I.W.; Cialla-May, D.; Matthäus, C.; Bocklitz, T.; Popp, J. Label-free molecularimaging of biological cells and tissues by linear and nonlinear Raman spectroscopic approaches. Angew.Chem. Int. Ed. 2017, 56, 4392–4430. [CrossRef]
17. Zohdi, V.; Whelan, D.R.; Wood, B.R.; Pearson, R.K.; Bambery, R.; Black, M.J. Importance of Tissue PreparationMethods in FTIR Micro-Spectroscopical Analysis of Biological Tissues: ‘Traps for New Users’. PLoS ONE2015, 10, e0116491. [CrossRef]
18. Novotny, L.; van Hulst, N. Antennas for light. Nat. Photonics 2011, 5, 83–90. [CrossRef]19. Osawa, M.; Ataka, K.; Yoshi, K.; Nishikawa, Y. Surface-enhanced infrared spectroscopy: The origin of the
absorption enhancement and band selection rule in the infrared spectra of molecules adsorbed on fine metalparticles. Appl. Spectrosc. 1993, 47, 1497–1502. [CrossRef]
20. Ataka, K.; Kottke, T.; Heberle, J. Thinner, smaller, faster: IR techniques to probe the functionality of biologicaland biomimetric systems. Angew. Chem. Int. Ed. Engl. 2010, 49, 5416–5424. [CrossRef]
21. Adato, R.; Altug, H. In-situ ultra-sensitive infrared absorption spectroscopy of biomolecule interactions inreal time with plasmonic nanoantennas. Nat. Commun. 2013, 4, 2154. [CrossRef] [PubMed]
22. Kazarian, S.G.; Chan, K.L. Micro-and macro-attenuated total reflection Fourier transform infraredspectroscopic imaging. Appl. Spectrosc. 2010, 64, 135–152. [CrossRef] [PubMed]
23. Long, D. 80th anniversary of the discovery of the Raman effect: A. celebration. J. Raman Spectrosc. 2008, 39,316–321. [CrossRef]
24. Virkler, K.; Lednev, I.K. Raman spectroscopy offers great potential for the nondestructive confirmatoryidentification of body fluids. Forensic Sci. Int. 2008, 181, e1–e5. [CrossRef]
25. Parker, F.S. Applications of Infrared, Raman, and Resonance Raman Spectroscopy in Biochemistry; Parker, F.S., Ed.;Springer: New York, NY, USA, 1983; pp. 315–347.
26. Clark, R.J.H.; Dines, T.J. Resonance Raman Spectroscopy, and Its Application to Inorganic Chemistry.Angew. Chem. Int. Ed. Engl. 1986, 25, 131–158. [CrossRef]
27. Fleischmann, M.; Hendra, P.J.; McQuillan, A.J. Raman Spectra of Pyridine Adsorbed at a Silver Electrode.Chem. Phys. Lett. 1974, 26, 163–166. [CrossRef]
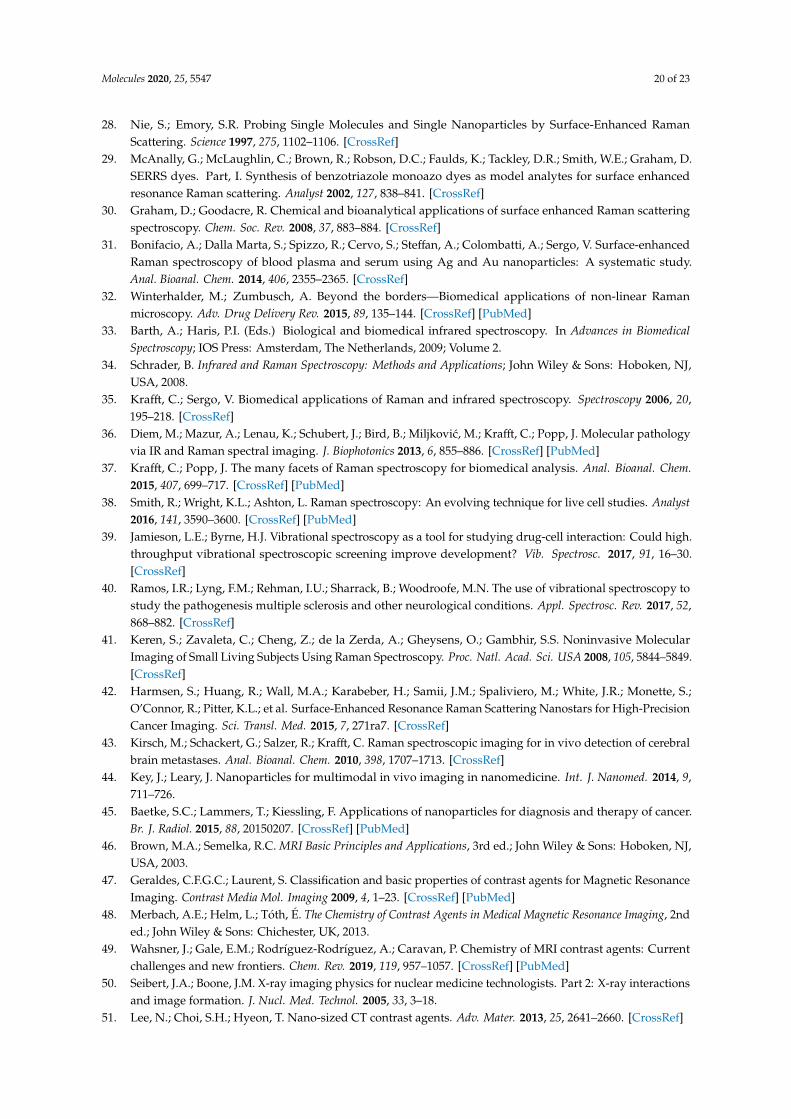
Molecules 2020, 25, 5547 20 of 23
28. Nie, S.; Emory, S.R. Probing Single Molecules and Single Nanoparticles by Surface-Enhanced RamanScattering. Science 1997, 275, 1102–1106. [CrossRef]
29. McAnally, G.; McLaughlin, C.; Brown, R.; Robson, D.C.; Faulds, K.; Tackley, D.R.; Smith, W.E.; Graham, D.SERRS dyes. Part, I. Synthesis of benzotriazole monoazo dyes as model analytes for surface enhancedresonance Raman scattering. Analyst 2002, 127, 838–841. [CrossRef]
30. Graham, D.; Goodacre, R. Chemical and bioanalytical applications of surface enhanced Raman scatteringspectroscopy. Chem. Soc. Rev. 2008, 37, 883–884. [CrossRef]
31. Bonifacio, A.; Dalla Marta, S.; Spizzo, R.; Cervo, S.; Steffan, A.; Colombatti, A.; Sergo, V. Surface-enhancedRaman spectroscopy of blood plasma and serum using Ag and Au nanoparticles: A systematic study.Anal. Bioanal. Chem. 2014, 406, 2355–2365. [CrossRef]
32. Winterhalder, M.; Zumbusch, A. Beyond the borders—Biomedical applications of non-linear Ramanmicroscopy. Adv. Drug Delivery Rev. 2015, 89, 135–144. [CrossRef] [PubMed]
33. Barth, A.; Haris, P.I. (Eds.) Biological and biomedical infrared spectroscopy. In Advances in BiomedicalSpectroscopy; IOS Press: Amsterdam, The Netherlands, 2009; Volume 2.
34. Schrader, B. Infrared and Raman Spectroscopy: Methods and Applications; John Wiley & Sons: Hoboken, NJ,USA, 2008.
35. Krafft, C.; Sergo, V. Biomedical applications of Raman and infrared spectroscopy. Spectroscopy 2006, 20,195–218. [CrossRef]
36. Diem, M.; Mazur, A.; Lenau, K.; Schubert, J.; Bird, B.; Miljkovic, M.; Krafft, C.; Popp, J. Molecular pathologyvia IR and Raman spectral imaging. J. Biophotonics 2013, 6, 855–886. [CrossRef] [PubMed]
37. Krafft, C.; Popp, J. The many facets of Raman spectroscopy for biomedical analysis. Anal. Bioanal. Chem.2015, 407, 699–717. [CrossRef] [PubMed]
38. Smith, R.; Wright, K.L.; Ashton, L. Raman spectroscopy: An evolving technique for live cell studies. Analyst2016, 141, 3590–3600. [CrossRef] [PubMed]
39. Jamieson, L.E.; Byrne, H.J. Vibrational spectroscopy as a tool for studying drug-cell interaction: Could high.throughput vibrational spectroscopic screening improve development? Vib. Spectrosc. 2017, 91, 16–30.[CrossRef]
40. Ramos, I.R.; Lyng, F.M.; Rehman, I.U.; Sharrack, B.; Woodroofe, M.N. The use of vibrational spectroscopy tostudy the pathogenesis multiple sclerosis and other neurological conditions. Appl. Spectrosc. Rev. 2017, 52,868–882. [CrossRef]
41. Keren, S.; Zavaleta, C.; Cheng, Z.; de la Zerda, A.; Gheysens, O.; Gambhir, S.S. Noninvasive MolecularImaging of Small Living Subjects Using Raman Spectroscopy. Proc. Natl. Acad. Sci. USA 2008, 105, 5844–5849.[CrossRef]
42. Harmsen, S.; Huang, R.; Wall, M.A.; Karabeber, H.; Samii, J.M.; Spaliviero, M.; White, J.R.; Monette, S.;O’Connor, R.; Pitter, K.L.; et al. Surface-Enhanced Resonance Raman Scattering Nanostars for High-PrecisionCancer Imaging. Sci. Transl. Med. 2015, 7, 271ra7. [CrossRef]
43. Kirsch, M.; Schackert, G.; Salzer, R.; Krafft, C. Raman spectroscopic imaging for in vivo detection of cerebralbrain metastases. Anal. Bioanal. Chem. 2010, 398, 1707–1713. [CrossRef]
44. Key, J.; Leary, J. Nanoparticles for multimodal in vivo imaging in nanomedicine. Int. J. Nanomed. 2014, 9,711–726.
45. Baetke, S.C.; Lammers, T.; Kiessling, F. Applications of nanoparticles for diagnosis and therapy of cancer.Br. J. Radiol. 2015, 88, 20150207. [CrossRef] [PubMed]
46. Brown, M.A.; Semelka, R.C. MRI Basic Principles and Applications, 3rd ed.; John Wiley & Sons: Hoboken, NJ,USA, 2003.
47. Geraldes, C.F.G.C.; Laurent, S. Classification and basic properties of contrast agents for Magnetic ResonanceImaging. Contrast Media Mol. Imaging 2009, 4, 1–23. [CrossRef] [PubMed]
48. Merbach, A.E.; Helm, L.; Tóth, É. The Chemistry of Contrast Agents in Medical Magnetic Resonance Imaging, 2nded.; John Wiley & Sons: Chichester, UK, 2013.
49. Wahsner, J.; Gale, E.M.; Rodríguez-Rodríguez, A.; Caravan, P. Chemistry of MRI contrast agents: Currentchallenges and new frontiers. Chem. Rev. 2019, 119, 957–1057. [CrossRef] [PubMed]
50. Seibert, J.A.; Boone, J.M. X-ray imaging physics for nuclear medicine technologists. Part 2: X-ray interactionsand image formation. J. Nucl. Med. Technol. 2005, 33, 3–18.
51. Lee, N.; Choi, S.H.; Hyeon, T. Nano-sized CT contrast agents. Adv. Mater. 2013, 25, 2641–2660. [CrossRef]
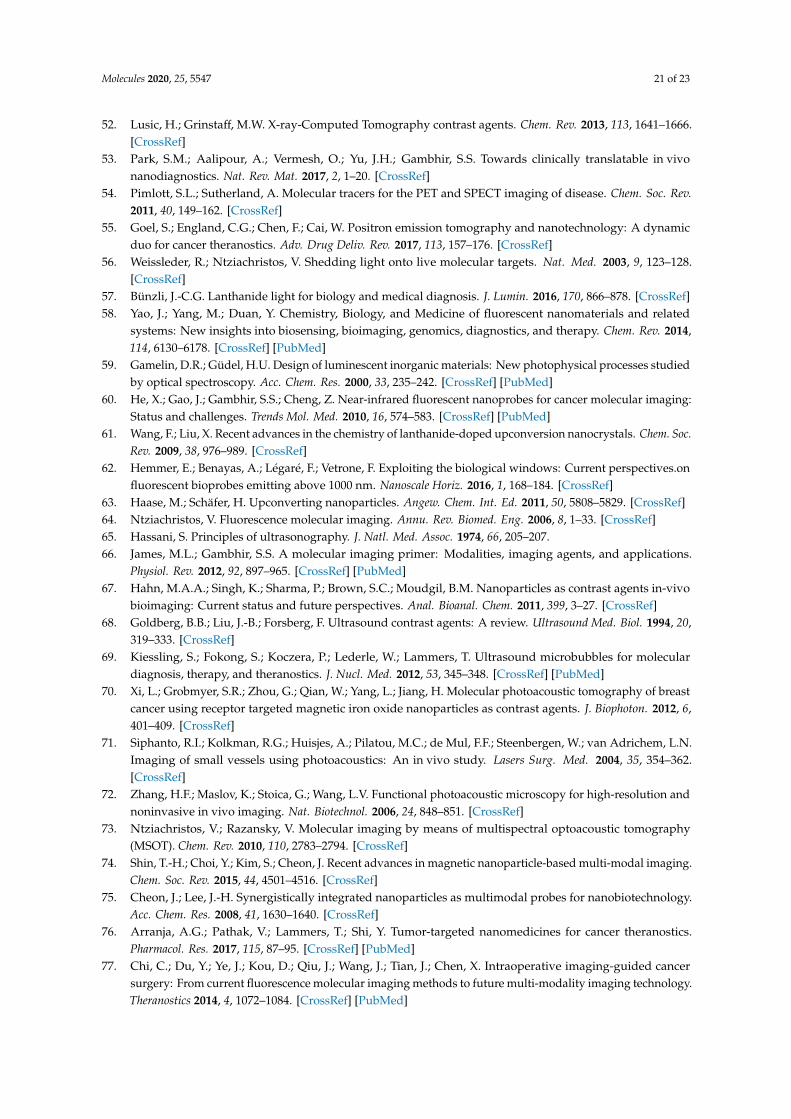
Molecules 2020, 25, 5547 21 of 23
52. Lusic, H.; Grinstaff, M.W. X-ray-Computed Tomography contrast agents. Chem. Rev. 2013, 113, 1641–1666.[CrossRef]
53. Park, S.M.; Aalipour, A.; Vermesh, O.; Yu, J.H.; Gambhir, S.S. Towards clinically translatable in vivonanodiagnostics. Nat. Rev. Mat. 2017, 2, 1–20. [CrossRef]
54. Pimlott, S.L.; Sutherland, A. Molecular tracers for the PET and SPECT imaging of disease. Chem. Soc. Rev.2011, 40, 149–162. [CrossRef]
55. Goel, S.; England, C.G.; Chen, F.; Cai, W. Positron emission tomography and nanotechnology: A dynamicduo for cancer theranostics. Adv. Drug Deliv. Rev. 2017, 113, 157–176. [CrossRef]
56. Weissleder, R.; Ntziachristos, V. Shedding light onto live molecular targets. Nat. Med. 2003, 9, 123–128.[CrossRef]
57. Bünzli, J.-C.G. Lanthanide light for biology and medical diagnosis. J. Lumin. 2016, 170, 866–878. [CrossRef]58. Yao, J.; Yang, M.; Duan, Y. Chemistry, Biology, and Medicine of fluorescent nanomaterials and related
systems: New insights into biosensing, bioimaging, genomics, diagnostics, and therapy. Chem. Rev. 2014,114, 6130–6178. [CrossRef] [PubMed]
59. Gamelin, D.R.; Güdel, H.U. Design of luminescent inorganic materials: New photophysical processes studiedby optical spectroscopy. Acc. Chem. Res. 2000, 33, 235–242. [CrossRef] [PubMed]
60. He, X.; Gao, J.; Gambhir, S.S.; Cheng, Z. Near-infrared fluorescent nanoprobes for cancer molecular imaging:Status and challenges. Trends Mol. Med. 2010, 16, 574–583. [CrossRef] [PubMed]
61. Wang, F.; Liu, X. Recent advances in the chemistry of lanthanide-doped upconversion nanocrystals. Chem. Soc.Rev. 2009, 38, 976–989. [CrossRef]
62. Hemmer, E.; Benayas, A.; Légaré, F.; Vetrone, F. Exploiting the biological windows: Current perspectives.onfluorescent bioprobes emitting above 1000 nm. Nanoscale Horiz. 2016, 1, 168–184. [CrossRef]
63. Haase, M.; Schäfer, H. Upconverting nanoparticles. Angew. Chem. Int. Ed. 2011, 50, 5808–5829. [CrossRef]64. Ntziachristos, V. Fluorescence molecular imaging. Annu. Rev. Biomed. Eng. 2006, 8, 1–33. [CrossRef]65. Hassani, S. Principles of ultrasonography. J. Natl. Med. Assoc. 1974, 66, 205–207.66. James, M.L.; Gambhir, S.S. A molecular imaging primer: Modalities, imaging agents, and applications.
Physiol. Rev. 2012, 92, 897–965. [CrossRef] [PubMed]67. Hahn, M.A.A.; Singh, K.; Sharma, P.; Brown, S.C.; Moudgil, B.M. Nanoparticles as contrast agents in-vivo
bioimaging: Current status and future perspectives. Anal. Bioanal. Chem. 2011, 399, 3–27. [CrossRef]68. Goldberg, B.B.; Liu, J.-B.; Forsberg, F. Ultrasound contrast agents: A review. Ultrasound Med. Biol. 1994, 20,
319–333. [CrossRef]69. Kiessling, S.; Fokong, S.; Koczera, P.; Lederle, W.; Lammers, T. Ultrasound microbubbles for molecular
diagnosis, therapy, and theranostics. J. Nucl. Med. 2012, 53, 345–348. [CrossRef] [PubMed]70. Xi, L.; Grobmyer, S.R.; Zhou, G.; Qian, W.; Yang, L.; Jiang, H. Molecular photoacoustic tomography of breast
cancer using receptor targeted magnetic iron oxide nanoparticles as contrast agents. J. Biophoton. 2012, 6,401–409. [CrossRef]
71. Siphanto, R.I.; Kolkman, R.G.; Huisjes, A.; Pilatou, M.C.; de Mul, F.F.; Steenbergen, W.; van Adrichem, L.N.Imaging of small vessels using photoacoustics: An in vivo study. Lasers Surg. Med. 2004, 35, 354–362.[CrossRef]
72. Zhang, H.F.; Maslov, K.; Stoica, G.; Wang, L.V. Functional photoacoustic microscopy for high-resolution andnoninvasive in vivo imaging. Nat. Biotechnol. 2006, 24, 848–851. [CrossRef]
73. Ntziachristos, V.; Razansky, V. Molecular imaging by means of multispectral optoacoustic tomography(MSOT). Chem. Rev. 2010, 110, 2783–2794. [CrossRef]
74. Shin, T.-H.; Choi, Y.; Kim, S.; Cheon, J. Recent advances in magnetic nanoparticle-based multi-modal imaging.Chem. Soc. Rev. 2015, 44, 4501–4516. [CrossRef]
75. Cheon, J.; Lee, J.-H. Synergistically integrated nanoparticles as multimodal probes for nanobiotechnology.Acc. Chem. Res. 2008, 41, 1630–1640. [CrossRef]
76. Arranja, A.G.; Pathak, V.; Lammers, T.; Shi, Y. Tumor-targeted nanomedicines for cancer theranostics.Pharmacol. Res. 2017, 115, 87–95. [CrossRef] [PubMed]
77. Chi, C.; Du, Y.; Ye, J.; Kou, D.; Qiu, J.; Wang, J.; Tian, J.; Chen, X. Intraoperative imaging-guided cancersurgery: From current fluorescence molecular imaging methods to future multi-modality imaging technology.Theranostics 2014, 4, 1072–1084. [CrossRef] [PubMed]
Molecules 2020, 25, 5547 22 of 23
78. Pavillon, N.; Hobro, A.J.; Smith, N.I. Cell Optical Density and Molecular Composition Revealed bySimultaneous Multimodal Label-Free Imaging. Biophys. J. 2013, 105, 1123–1132. [CrossRef] [PubMed]
79. Kong, K.; Rowlands, C.J.; Varma, S.; Perkins, W.; Leach, I.H.; Koloydenko, A.A.; Williams, H.C.; Notingher, I.Diagnosis of tumors during tissue-conserving surgery with integrated autofluorescence and Raman scatteringmicroscopy. Proc. Natl. Acad. Sci. USA 2013, 110, 15189–15194. [CrossRef] [PubMed]
80. Kong, K.; Zaabar, F.; Rakha, E.; Ellis, I.; Koloydenko, A.; Notingher, I. Towards intra-operative diagnosis oftumours during breast conserving surgery by selective-sampling Raman micro-spectroscopy. Phys. Med.Biol. 2014, 59, 6141–6152. [CrossRef] [PubMed]
81. Patil, C.A.; Kirshnamoorthi, H.; Ellis, D.L.; van Leeuwen, T.G.; Mahadevan-Jansen, A. A clinical instrumentfor combined Raman spectroscopy-optical coherence tomography of skin cancers. Lasers Surg. Med. 2011, 43,143–151. [CrossRef] [PubMed]
82. Ashok, P.C.; Praveen, B.B.; Bellini, N.; Riches, A.; Dholakia, K.; Herrington, C.S. Multi-modal approach usingRaman spectroscopy and optical coherence tomography for the discrimination of colonic adenocarcinomafrom normal colon. Biomed. Opt. Express 2013, 4, 2179–2186. [CrossRef]
83. Bennet, M.; Akiva, A.; Faivre, D.; Malkinson, G.; Yaniv, K.; Abdelilah-Seyfried, S.; Fratzl, P.; Masic, A.Simultaneous Raman microspectroscopy and fluorescence imaging of bone mineralization in living zebrafishlarvae. Biophys. J. 2014, 106, L17–L19. [CrossRef]
84. Kunitake, J.A.M.R.; Choi, S.; Nguyen, K.X.; Lee, M.M.; He, F.; Sudilovsky, D.; Morris, P.G.; Jochelson, M.S.;Hudis, C.A.; Muller, D.A.; et al. Correlative imaging reveals physiochemical heterogeneity ofmicrocalcifications in human breast carcinomas. J. Struct. Biol. 2018, 202, 25–34. [CrossRef]
85. Schrof, S.; Varga, P.; Hesse, B.; Schöne, M.; Schütz, R.; Masic, A.; Raum, K. Multimodal correlative investigationof the interplaying microarchitecture, chemical composition and mechanical properties of human corticalbone tissue reveals predominant role of fibrillar organization in determining microelastic tissue properties.Acta Biomater. 2016, 44, 51–64. [CrossRef]
86. Bocklitz, T.; Braeutigam, K.; Urbanek, A.; Hoffmann, F.; von Eggeling, F.; Ernst, G.; Schmitt, M.; Schubert, U.;Guntinas-Lichius, O.; Popp, J. Novel workflow for combining Raman spectroscopy and MALDI-MSI fortissue-based studies. Anal. Bioanal. Chem. 2015, 407, 7865–7873. [CrossRef] [PubMed]
87. Lee, S.; Chon, H.; Yoon, S.-Y.; Lee, E.K.; Chang, S.-I.; Lim, D.W.; Choo, J. Fabrication of SERS-fluorescence dualmodal nanoprobes and application to multiplex cancer cell imaging. Nanoscale 2012, 4, 124–129. [CrossRef][PubMed]
88. Navas-Moreno, M.; Mehrpouyan, M.; Chernenko, T.; Candas, D.; Fan, M.; Li, J.J.; Yan, M.; Chan, J.W.Nanoparticles for live cell microscopy: A surface-enhanced Raman scattering perspective. Sci. Rep. 2017,7, 4471. [CrossRef]
89. Cui, Y.; Zheng, X.-S.; Ren, B.; Wang, R.; Zhang, J.; Xia, N.-S.; Tian, Z.-Q. Au@organosilica multifunctionalnanoparticles for multimodal imaging. Chem. Sci. 2011, 2, 1463–1469. [CrossRef]
90. Niu, X.; Chen, H.; Wang, Y.; Wang, W.; Sun, X.; Chen, L. Upconversion Fluorescence-SERS Dual-Mode Tagsfor Cellular and in Vivo Imaging. ACS Appl. Mater. Interfaces 2014, 6, 5152–5160. [CrossRef] [PubMed]
91. Chen, H.; Wang, Z.; Ma, X.; Zong, S.; Cui, Y. Magnetically controllable dual-mode nanoprobes for cellimaging with an onion-liked structure. Talanta 2013, 116, 978–984. [CrossRef]
92. Kircher, M.F.; de la Zerda, A.; Jokerst, J.V.; Zavaleta, C.L.; Kempen, P.J.; Mittra, E.; Pitter, K.; Huang, R.M.;Campos, C.; Habte, F.; et al. A brain tumor molecular imaging strategy using a new triple-modalityMRI-photoacoustic-Raman nanoparticle. Nat. Med. 2012, 18, 829–834. [CrossRef]
93. Liu, Y.; Chang, Z.; Yuan, H.; Fales, A.M.; Vo-Dinh, T. Quintuple-modality (SERS-MRI-CT-TPL-PTT) plasmonicnanoprobe for theranostics. Nanoscale 2013, 5, 12126–12131. [CrossRef]
94. Zong, S.; Wang, Z.; Chen, H.; Yang, J.; Cui, Y. Surface Enhanced Raman Scattering Traceable and GlutathioneResponsive Nanocarrier for Intracellular Drug Delivery. Anal. Chem. 2013, 85, 2223–2230. [CrossRef]
95. Liu, Z.; Ye, B.; Jin, M.; Chen, H.; Zhong, H.; Wang, X.; Guo, Z. Dye-free near-infrared surface-enhancedRaman scattering nanoprobes for bioimaging and high-performance photothermal cancer therapy. Nanoscale2015, 7, 6754–6761. [CrossRef]
96. Pahlow, S.; Weber, K.; Popp, J.; Wood, B.R.; Kochan, K.; Rüther, A.; Perez-Guaita, D.; Heraud, P.; Stone, N.;Dudgeon, A.; et al. Application of Vibrational Spectroscopy and Imaging to Point-of-Care Medicine:A Review. Appl. Spectrosc. 2018, 72, 52–84. [PubMed]
Molecules 2020, 25, 5547 23 of 23
97. Baker, M.J.; Byrne, H.J.; Chalmers, J.; Gardner, P.; Goodacre, R.; Henderson, A.; Kazarian, S.G.; Martin, F.L.;Moger, J.; Stone, N.; et al. Clinical applications of infrared and Raman spectroscopy: State of play and futurechallenges. Analyst 2018, 143, 1735–1757. [CrossRef]
98. Santos, I.P.; Barroso, E.M.; Schut, T.C.B.; Caspers, P.J.; van Lanschot, C.G.; Choi, D.H.; Van Der Kamp, M.F.;Smits, R.W.; Van Doorn, R.; Verdijk, R.M.; et al. Raman Spectroscopy for Cancer Detection and CancerSurgery Guidance: Translation to the Clinics. Analyst 2017, 142, 3025–3047. [CrossRef] [PubMed]
99. Redding, B.; Schwab, M.J.; Pan, Y. Raman Spectroscopy of Optically Trapped Single Biological Micro-Particles.Sensors 2015, 15, 19021–19046. [CrossRef] [PubMed]
100. Michaelian, K.H.; Frogley, M.D.; Kelley, C.S.; Pedersen, T.; May, T.E.; Quaroni, L.; Cinque, G.Micro-photoacoustic infrared spectroscopy. Infrared Phys. Technol. 2018, 93, 240–246. [CrossRef]
101. Willets, K.A. Super-resolution imaging of SERS hot spots. Chem. Soc. Rev. 2014, 43, 3854–3864. [CrossRef]102. Cialla-May, D.; Zheng, X.-S.; Weber, K.; Popp, J. Recent progress in surface-enhanced Raman spectroscopy for
biological and biomedical applications: From cells to clinics. Chem. Soc. Rev. 2017, 46, 3945–3961. [CrossRef][PubMed]
Publisher’s Note: MDPI stays neutral with regard to jurisdictional claims in published maps and institutionalaffiliations.
© 2020 by the author. Licensee MDPI, Basel, Switzerland. This article is an open accessarticle distributed under the terms and conditions of the Creative Commons Attribution(CC BY) license (http://creativecommons.org/licenses/by/4.0/).