Embed Size (px)
Citation preview
Introduction to Infrared SpectrometryIntroduction to Infrared Spectrometry
Chap 16Chap 16
Quantum Mechanical Treatment of VibrationsQuantum Mechanical Treatment of Vibrations
• Required to include quantized nature of E
• From solving the wave equations of QM:
1) v(for2
1 v
... 2, 1, 0,v
molecule diatomic for22
1v
khhE
khE
resvib
vib
Selection rule for vib. transitions

Quantum Mechanical Treatment of VibrationsQuantum Mechanical Treatment of Vibrations
Interatomic distance, r →
hvres1) v(for
2
kh
hE resvib
2
21
krE
• Plot of potential energy:
• where level spacings:
• All vib levels spacedequally for HO only

Anharmonic Oscillator (AHO)Anharmonic Oscillator (AHO)
Problems with Harmonic Oscillator (HO) ModelProblems with Harmonic Oscillator (HO) Model
• Real vib levels coalesce as v levels increaseReal vib levels coalesce as v levels increase
• Does not allow for dissociation of bond
• Repulsion is steeper at small r
• Appears as if atoms can pass througheach other during vibrational amplitude
Solution:

Anharmonic Oscillator (AHO)Anharmonic Oscillator (AHO)
Fig. 16-3

Anharmonic Oscillator (AHO)Anharmonic Oscillator (AHO)
Three consequences:
(1) Harmonic at low v levels
(2) ΔE becomes smaller at high v levels
(3) Selections rule fails: Δv = ±1 and ±2...
• referred to as overtones

Vibrational ModesVibrational Modes
Approach:
• Each atom in a molecule can be located
with three coordinates (degrees of freedom)
• A molecule with N atoms then has 3N DOF
• Translational motion defined by center-of-
mass coordinates (COM)

Linear Molecules
• 3 DOF to define translation
• 2 DOF to define rotation
• 3N – 5 ≡ number of vibrational modes
Nonlinear Molecules
• 3 DOF to define translation
• 3 DOF to define rotation
• 3N – 6 ≡ number of vibrational modes

Examples
N2
CO2
H2O
CH3-C(O)-CH3

Vibrations of COVibrations of CO22
No dipole change Dipole change
}Dipole change
667 cm667 cm-1-1
2350 cm2350 cm-1-1
1388 cm1388 cm-1-1
Fig 16-10Fig 16-10
Doubly degenerate
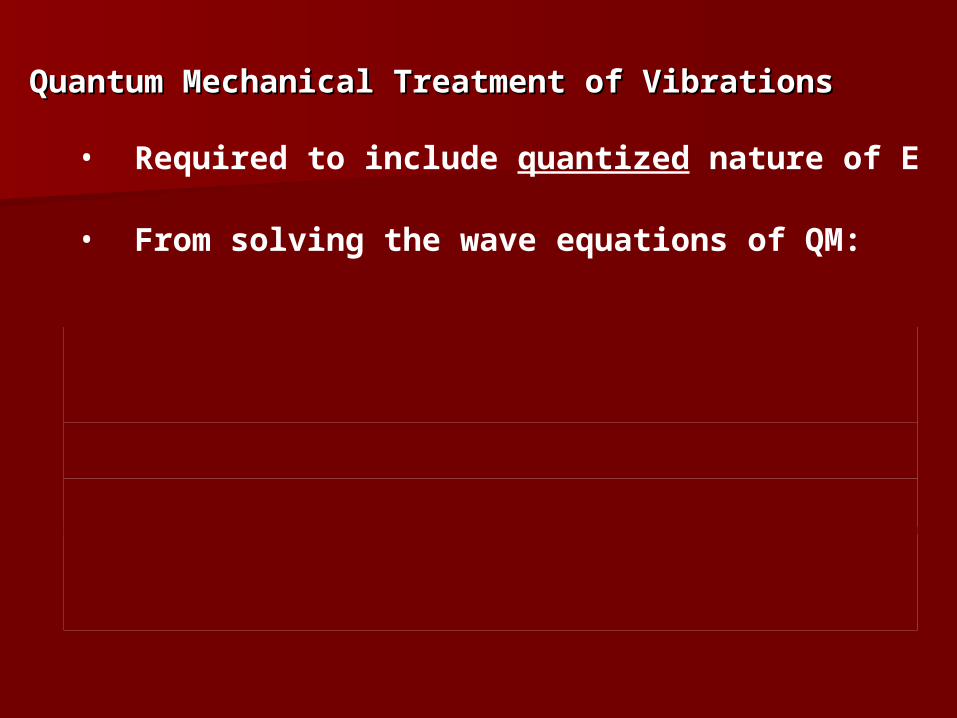
Vibrations of HVibrations of H22OO
1595 cm1595 cm-1-1
3657 cm3657 cm-1-1
3766 cm3766 cm-1-1

IR Sources and TransducersIR Sources and Transducers
Sources
(1200 – 2200 K)(1200 – 2200 K)

Spectral emission from a Nernst glower at ~ 2200 K Spectral emission from a Nernst glower at ~ 2200 K
Fig 16-16Fig 16-16

IR Sources and TransducersIR Sources and Transducers
Sources
(1200 – 2200 K)(1200 – 2200 K)
Transducers
• IR beam 10-7 - 10-9 W, ΔT at transducer mK-µK

IR InstrumentationIR InstrumentationDispersive Grating IR Instruments:
Fig 16-11Fig 16-11

IR InstrumentationIR Instrumentation
Dispersive Grating IR Instruments:
Similar to UV-Vis spectrophotometer BUT sample after source and before
monochromator in IR Sample after monochromator in UV-
Vis - less incident light Grating 10-500 blazes per mm Single beam and double beam (DB in
time and space) DB eliminates atmospheric gas
interference

Fig. 16-9
Single- and Double-Beam Spectra
of the Atmosphere

Fourier Transform IR Instruments:
FTIR has largely displaced dispersive IRs
A multiplex instrument (e.g., diode array)
Beam is split and pathlength is varied to produce interference patterns
Signal converted from frequencydomain to time domain
Fourier transform then converts “clean”signal back to frequency domain
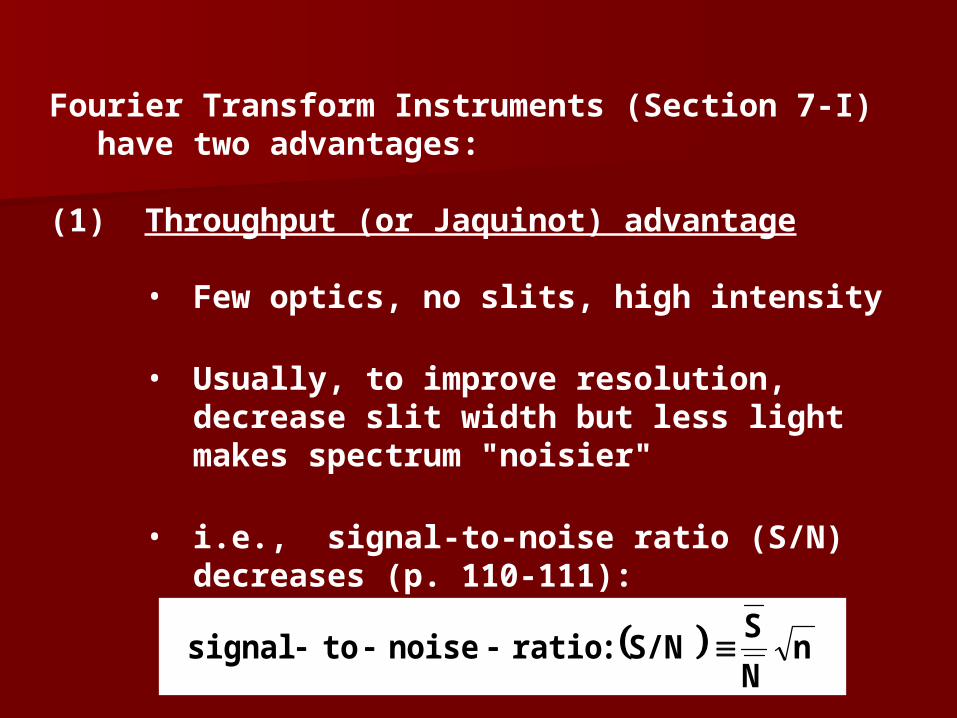
Fourier Transform Instruments (Section 7-I) have two advantages:
(1) Throughput (or Jaquinot) advantage
• Few optics, no slits, high intensity
• Usually, to improve resolution, decrease slit width but less light makes spectrum "noisier"
• i.e., signal-to-noise ratio (S/N) decreases (p. 110-111):
nN
SS/N:rationoisetosignal
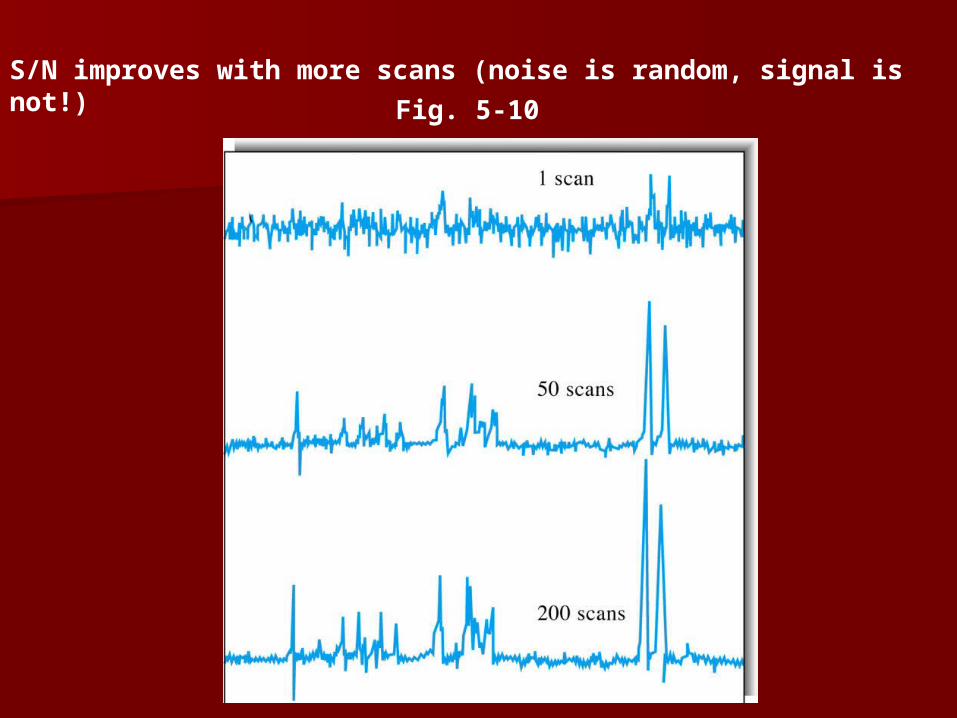
S/N improves with more scans (noise is random, signal is not!)
Fig. 5-10

(2) Multiplex (or Fellget) advantage
• Simultaneously measure entire spectrum
Components of Fourier TransformComponents of Fourier TransformInstrumentsInstruments
• Based on Michelson Interferometer
• Converts frequencyfrequency signal to timetime signal
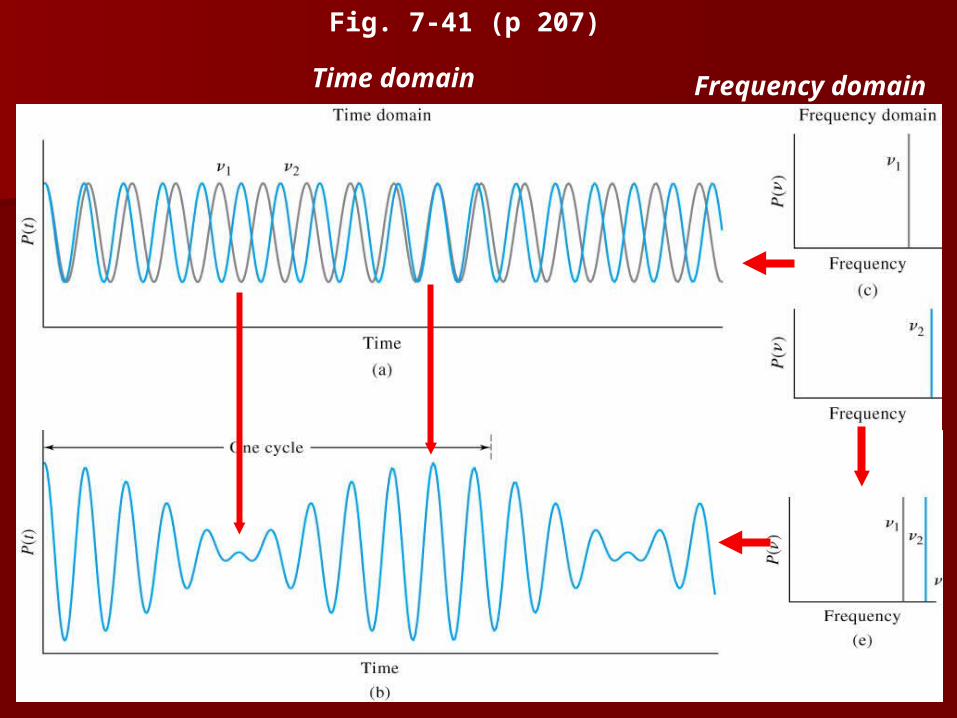
Fig. 7-41 (p 207)
Frequency domainTime domain

Fig. 7-42 (p 207)
Time Domain Signal of a Source Made UpTime Domain Signal of a Source Made Upof Many Wavelengthsof Many Wavelengths
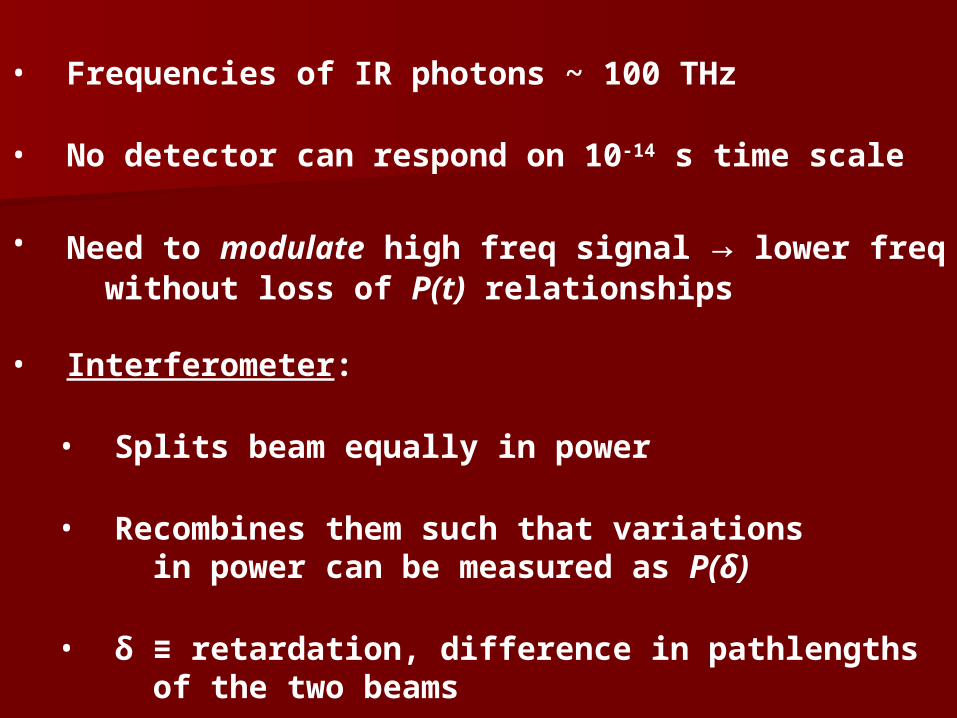
• Frequencies of IR photons ~ 100 THz
• No detector can respond on 10-14 s time scale
• Need to modulate high freq signal → lower freqwithout loss of P(t) relationships
• Interferometer:
• Splits beam equally in power
• Recombines them such that variationsin power can be measured as P(δ)
• δ ≡ retardation, difference in pathlengthsof the two beams

SingleFrequencySource
Michelson InterferometerMichelson InterferometerFig. 7-43 (p 208)
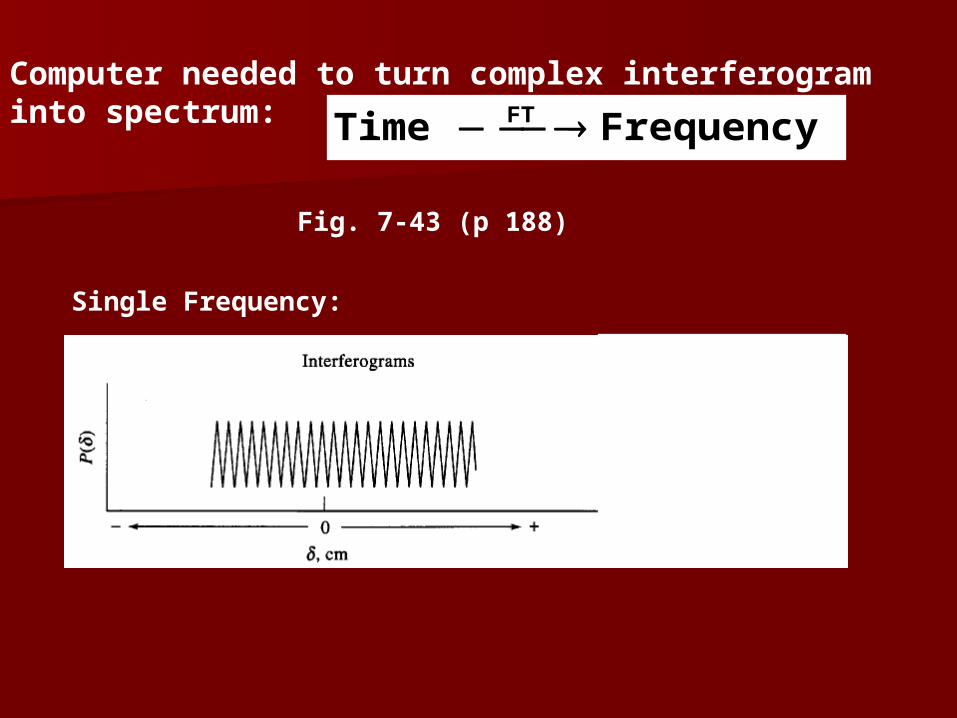
Computer needed to turn complex interferogram into spectrum: FrequencyTime FT
Single Frequency:
Fig. 7-43 (p 188)

Two Frequencies:
Many Frequencies:
• High S/N ratios - high throughput
• Rapid (<10 s)
• Reproducible
• High resolution (<0.1 cm-1)
• Inexpensive (relatively!)
Advantages to FT InstrumentsAdvantages to FT Instruments