Embed Size (px)
Citation preview
Introduction to Linkage Analysis
March 2002
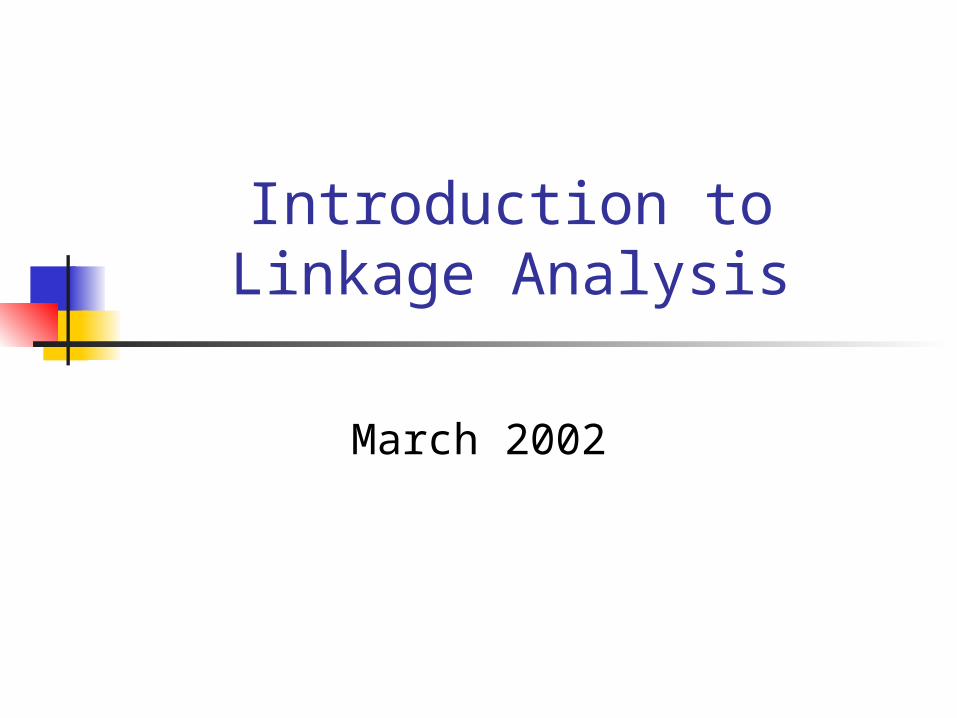
3 Stages of Genetic Mapping Are there genes influencing this
trait? Epidemiological studies
Where are those genes? Linkage analysis
What are those genes? Association analysis
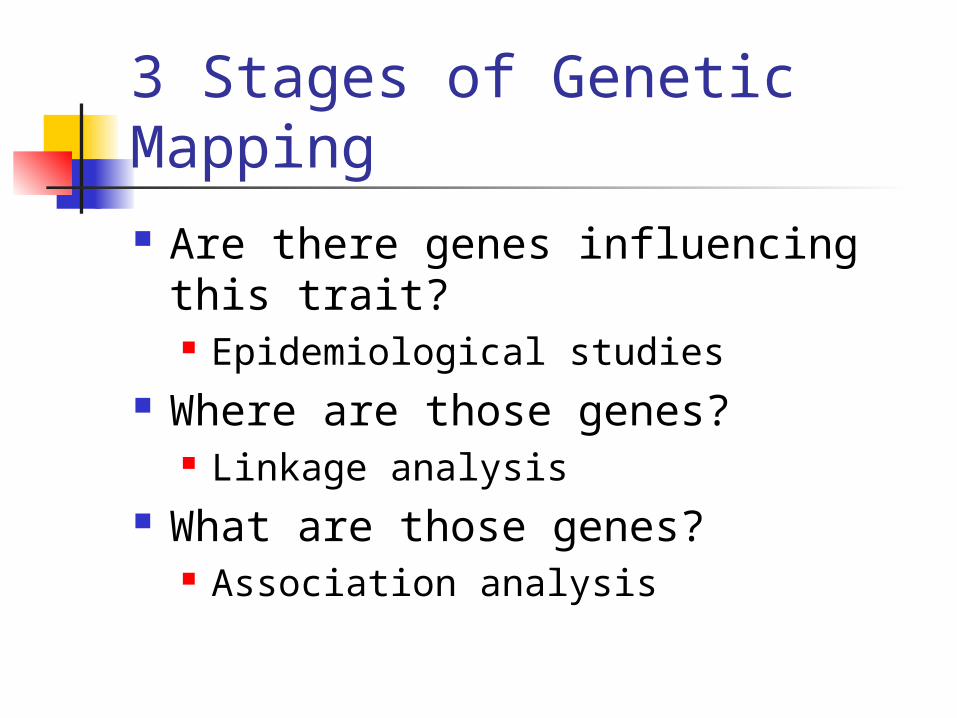
Where are those genes?
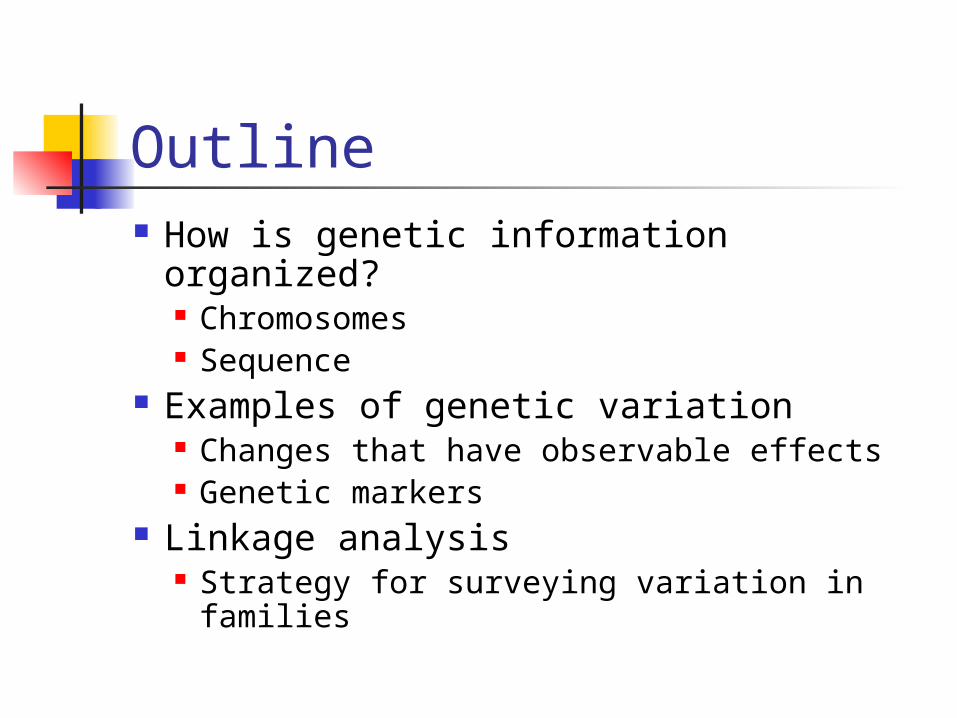
Outline How is genetic information organized?
Chromosomes Sequence
Examples of genetic variation Changes that have observable effects Genetic markers
Linkage analysis Strategy for surveying variation in
families
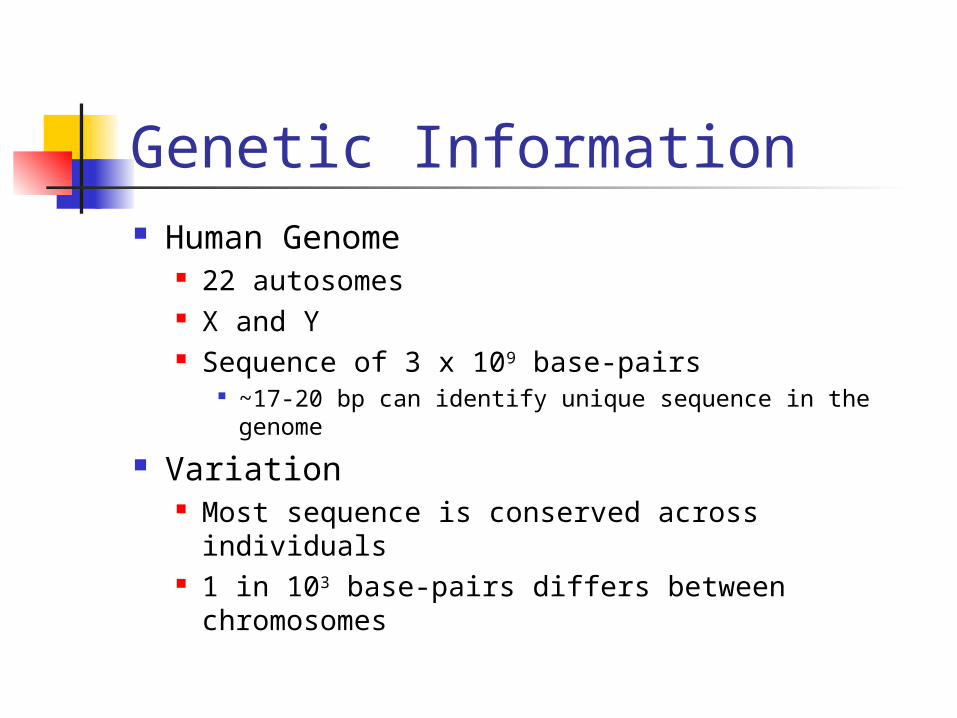
Genetic Information Human Genome
22 autosomes X and Y Sequence of 3 x 10⁹ base-pairs
~17-20 bp can identify unique sequence in the genome
Variation Most sequence is conserved across individuals 1 in 103 base-pairs differs between
chromosomes

DNA Polymer of 4 bases
Purines (A) – Adenine (G) – Guanine
Pyrimidines (C) – Cytosine (T) – Thymine
Double Helix Complementary Strands Hydrogen Bonds
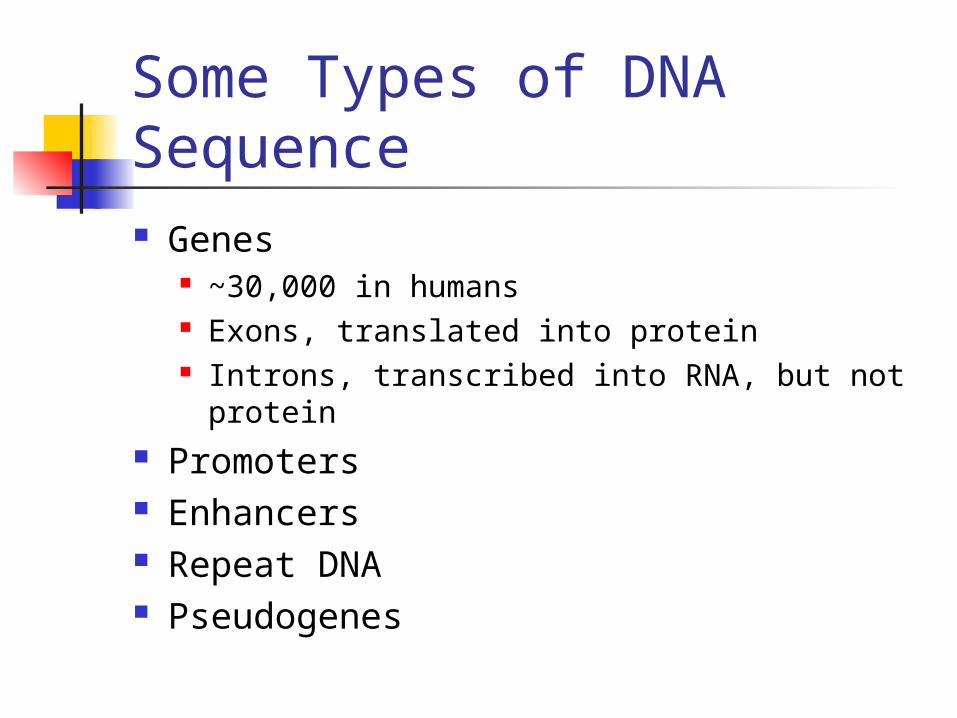
Some Types of DNA Sequence Genes
~30,000 in humans Exons, translated into protein Introns, transcribed into RNA, but not
protein Promoters Enhancers Repeat DNA Pseudogenes
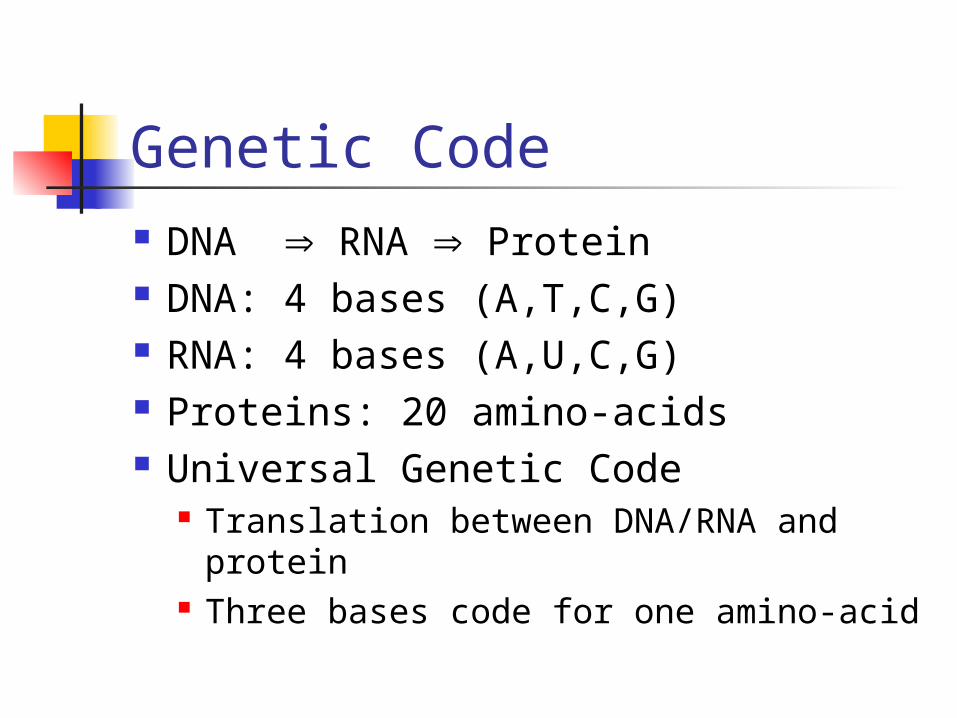
Genetic Code DNA RNA Protein DNA: 4 bases (A,T,C,G) RNA: 4 bases (A,U,C,G) Proteins: 20 amino-acids Universal Genetic Code
Translation between DNA/RNA and protein
Three bases code for one amino-acid
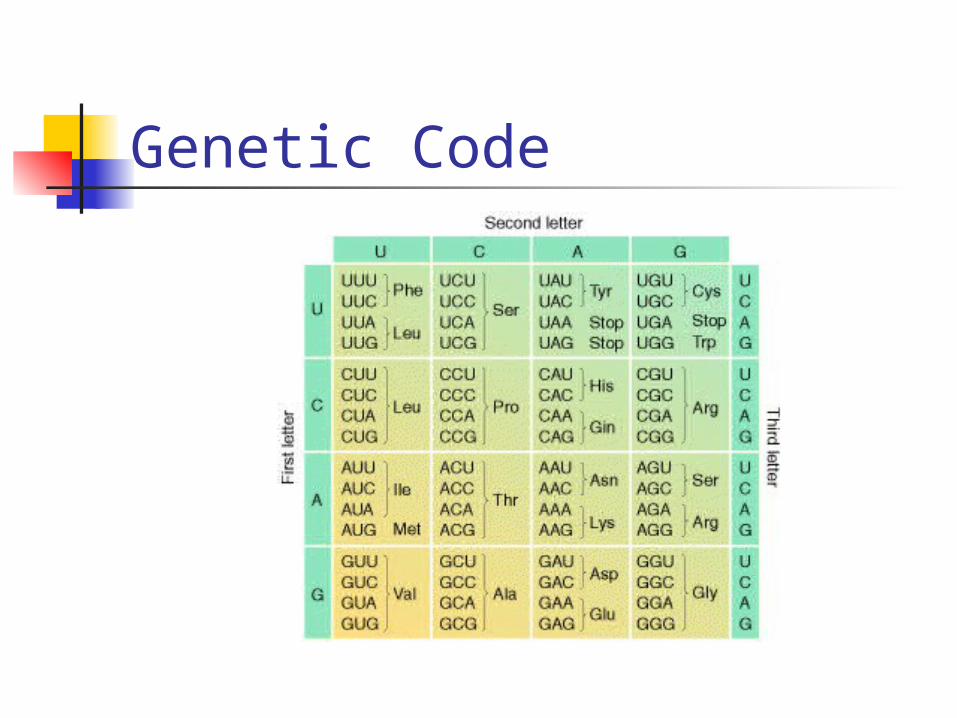
Genetic Code
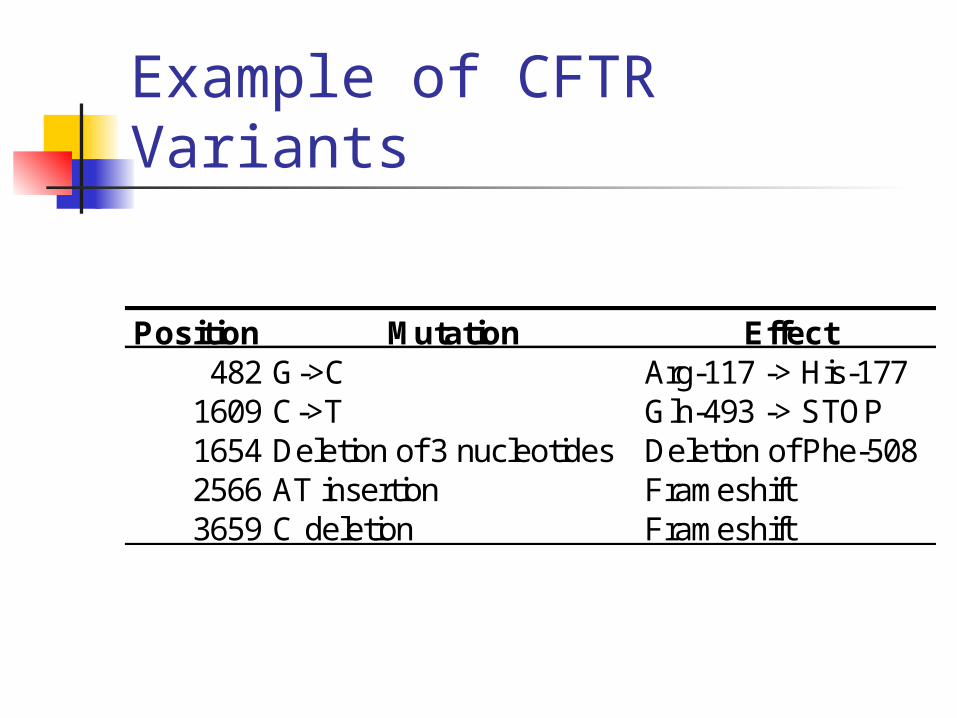
Example of CFTR Variants
Position Mutation Effect482 G->C Arg-117 -> His-177
1609 C->T Gln-493 -> STOP1654 Deletion of 3 nucleotides Deletion of Phe-5082566 AT insertion Frameshift3659 C deletion Frameshift
Phenotype vs. Genotype Genotype
Underlying genetic constitution Phenotype
Observed manifestation of a genotype
Different changes within CFTR all lead to cystic fibrosis phenotype
Common types of DNA variants
Tandem repeats Microsatellites Single nucleotide polymorphisms Insertions Deletions
Repeat Length Polymorphisms Variable Number Tandem Repeats
VNTRs Typical repeat units of 10 – 100s bp E.g.: ~110 bp repeat in IL1RN gene
Microsatellites Simple repeat sequences
Most popular are 2, 3 or 4 bp E.g.: ACACACAC … D naming scheme (e.g., D2S160)
Microsatellites Most popular markers for linkage
analysis Large number of alleles (10 is
common) Can distinguish and track individual
chromosomes in families Relatively abundant
~15,000 mapped loci
SNPs Single Nucleotide Polymorphisms Change one nucleotide
Insert Delete Replace it with a different nucleotide
Many have no phenotypic effect Some can disrupt or affect gene
function
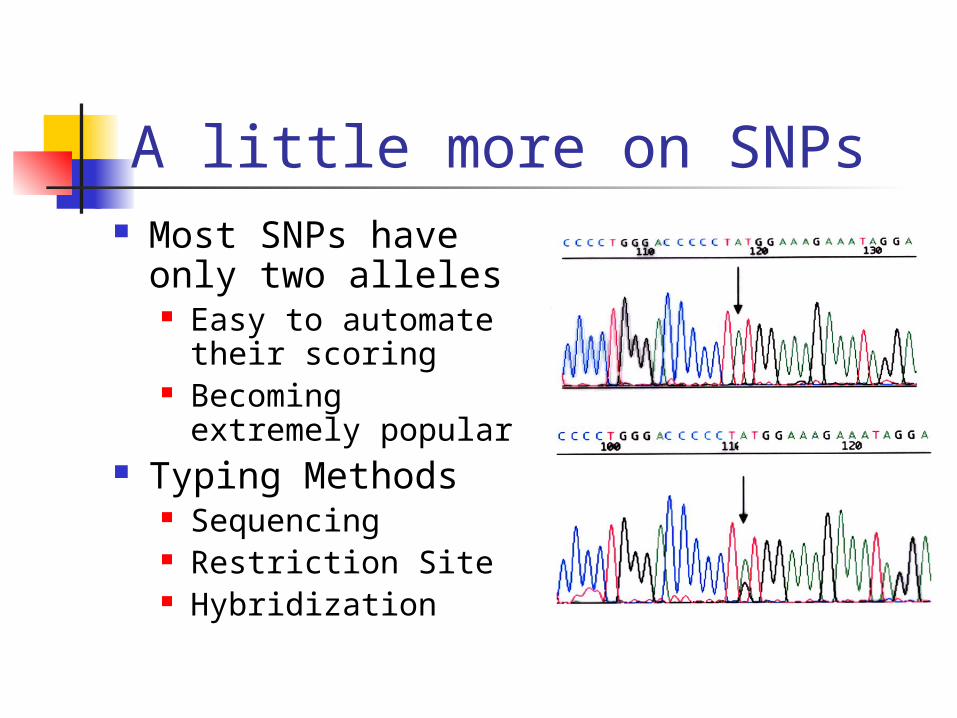
A little more on SNPs Most SNPs have
only two alleles Easy to automate
their scoring Becoming
extremely popular Typing Methods
Sequencing Restriction Site Hybridization

Classifying Genotypes Each individual carries two alleles
If there are n alternative alleles … … there will be n (n + 1) / 2 possible
genotypes 3 possible genotypes for SNPs, typically more
for microsatellites and VNTRs Homozygotes
The two alleles are the same Heterozygotes
The two alleles are different
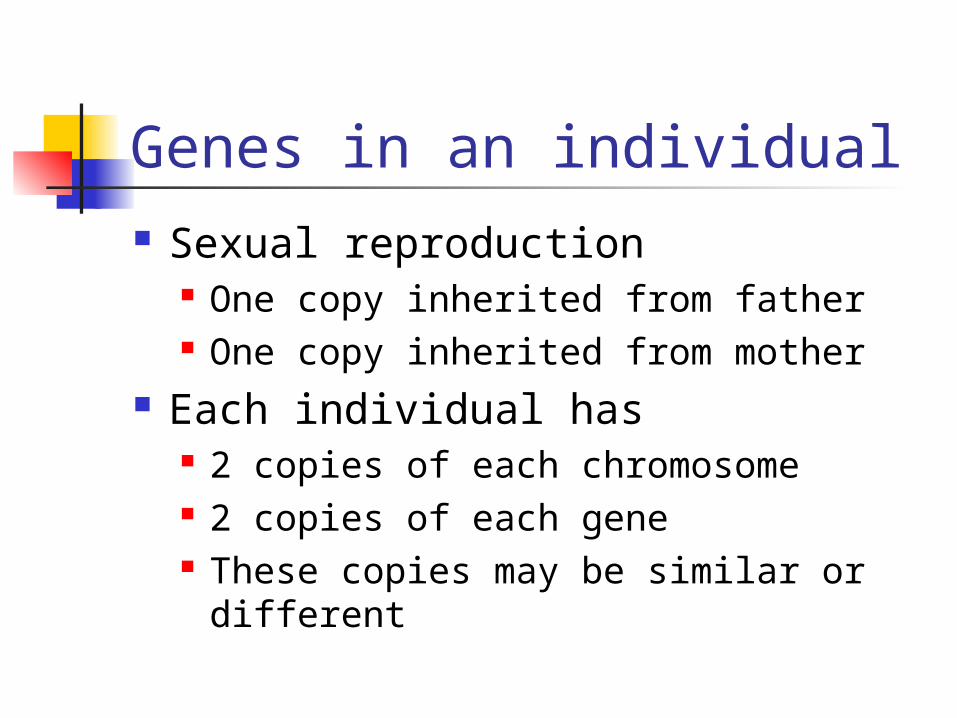
Genes in an individual Sexual reproduction
One copy inherited from father One copy inherited from mother
Each individual has 2 copies of each chromosome 2 copies of each gene These copies may be similar or
different
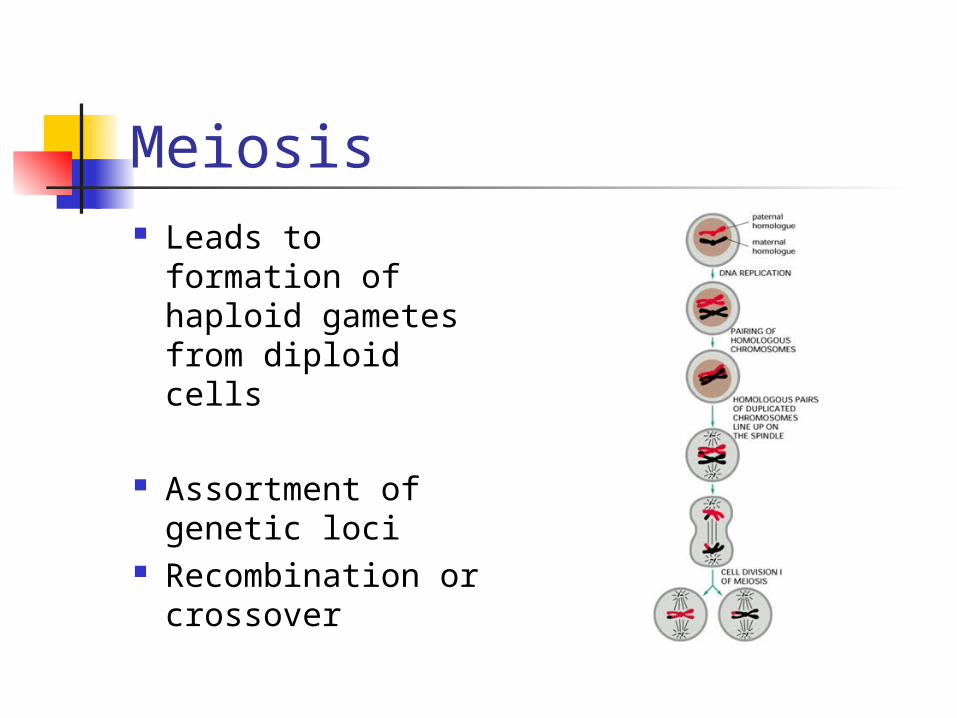
Meiosis Leads to
formation of haploid gametes from diploid cells
Assortment of genetic loci
Recombination or crossover
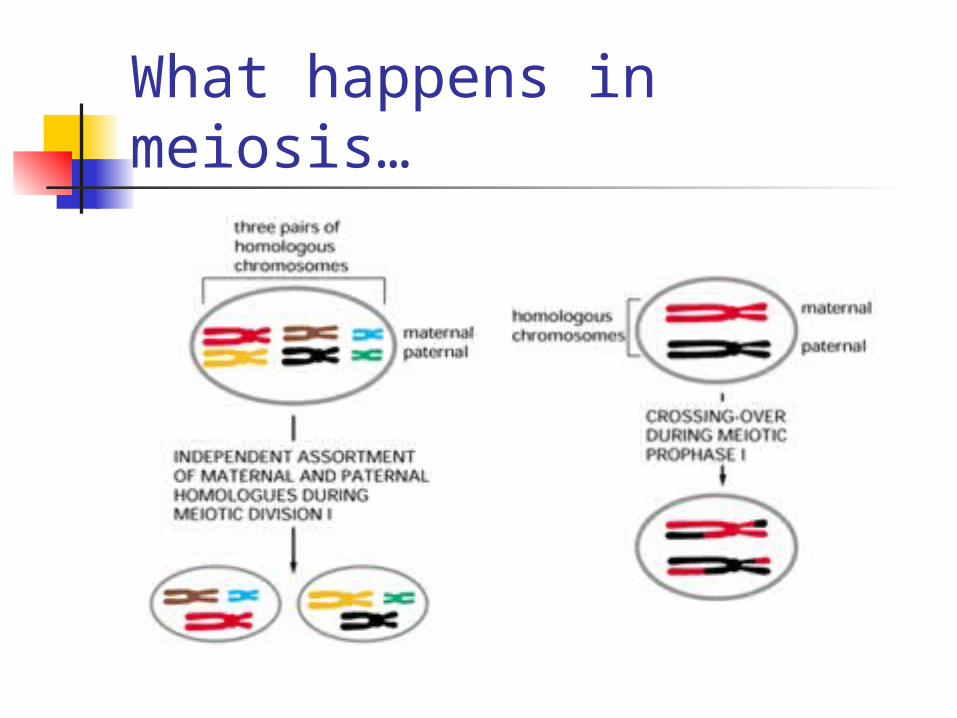
What happens in meiosis…
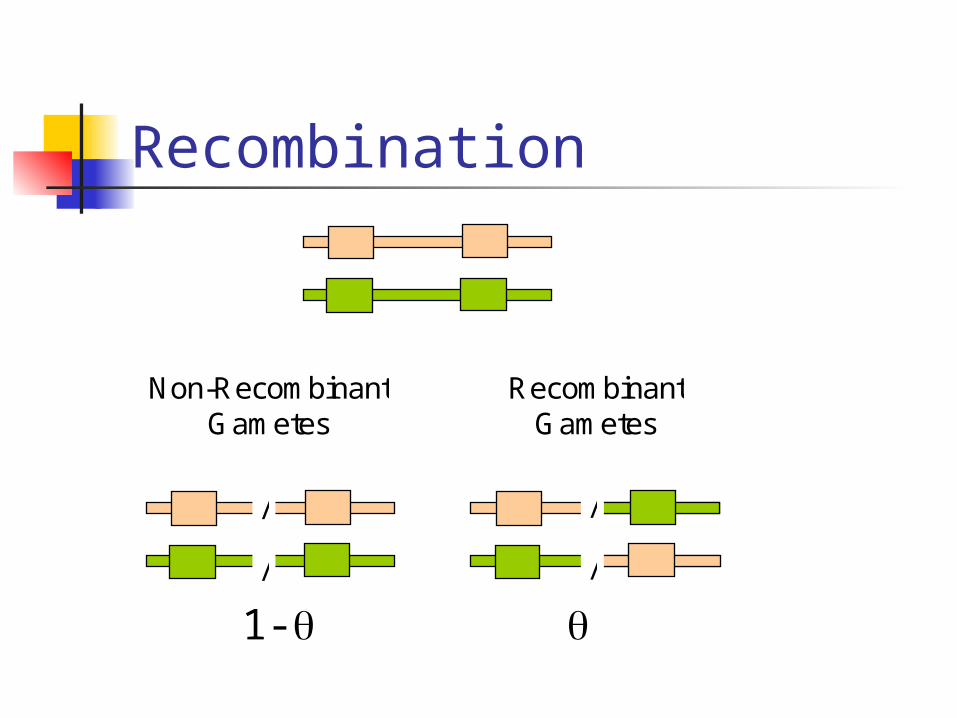
Recombination
Non-RecombinantGametes
RecombinantGametes
/
/
/
/
1-

Recombination Actual
No. of recombinants between two locations
An average of one per Morgan Observed
Usually, only odd / even number of crossovers between two locations can be established
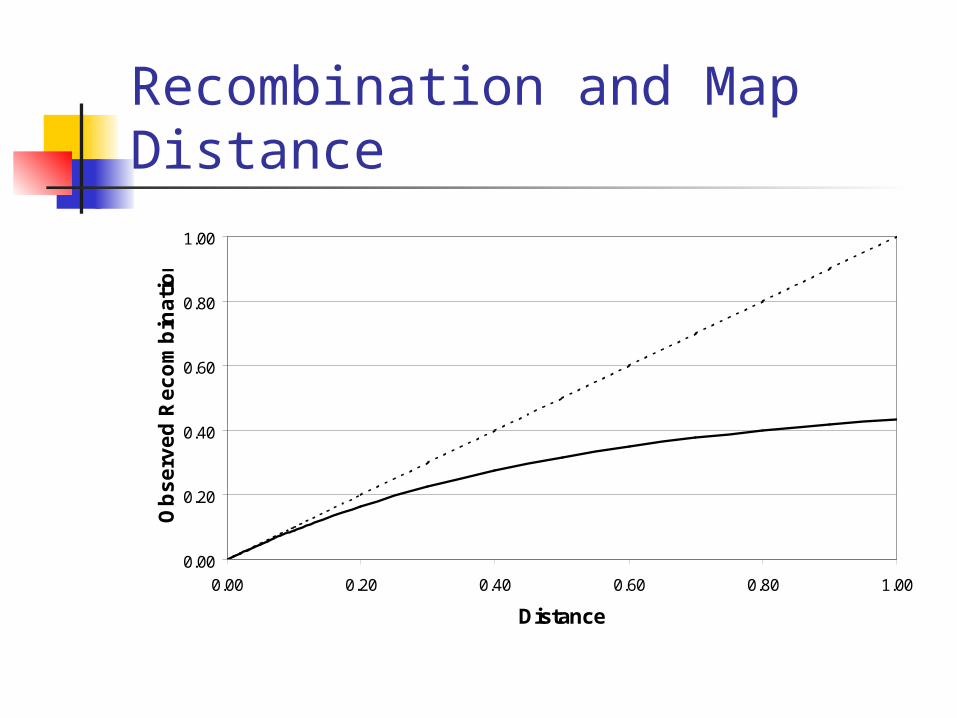
Recombination and Map Distance
0.00
0.20
0.40
0.60
0.80
1.00
0.00 0.20 0.40 0.60 0.80 1.00
Distance
Ob
se
rve
d R
ec
om
bin
ati
on
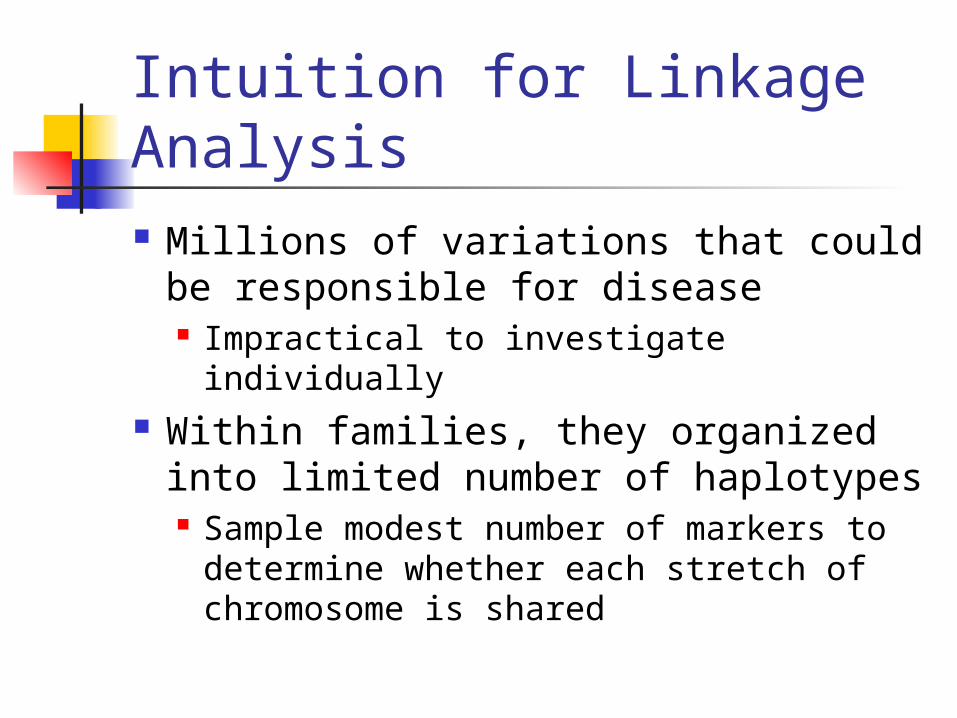
Intuition for Linkage Analysis Millions of variations that could be
responsible for disease Impractical to investigate individually
Within families, they organized into limited number of haplotypes Sample modest number of markers to
determine whether each stretch of chromosome is shared
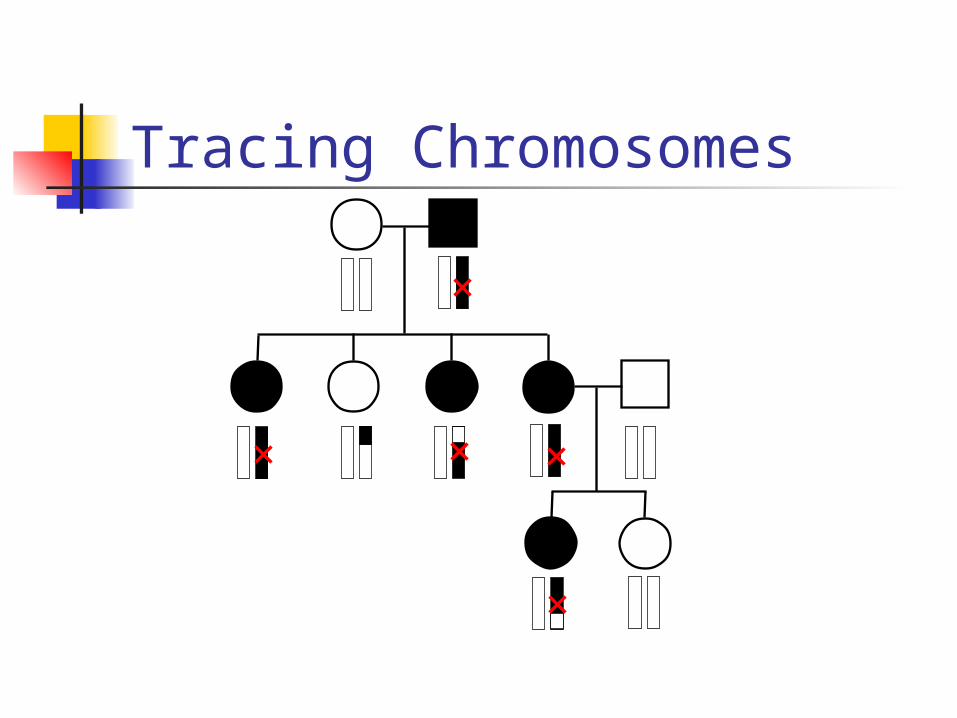
Tracing Chromosomes
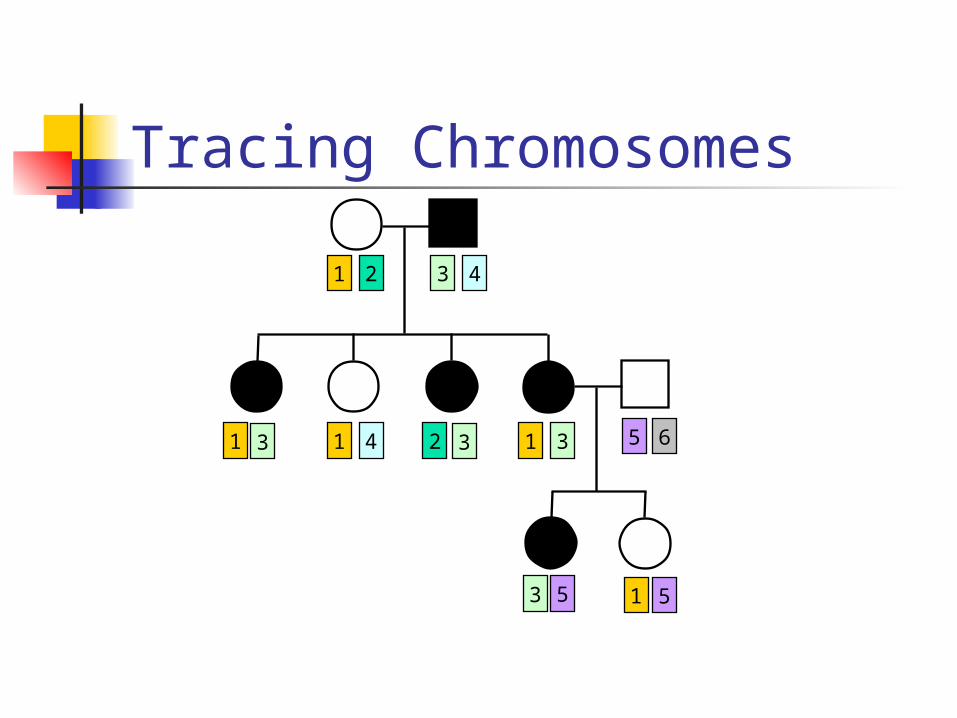
Tracing Chromosomes
1 1 2 1
31 2 4
43 3 3 5 6
5 53 1
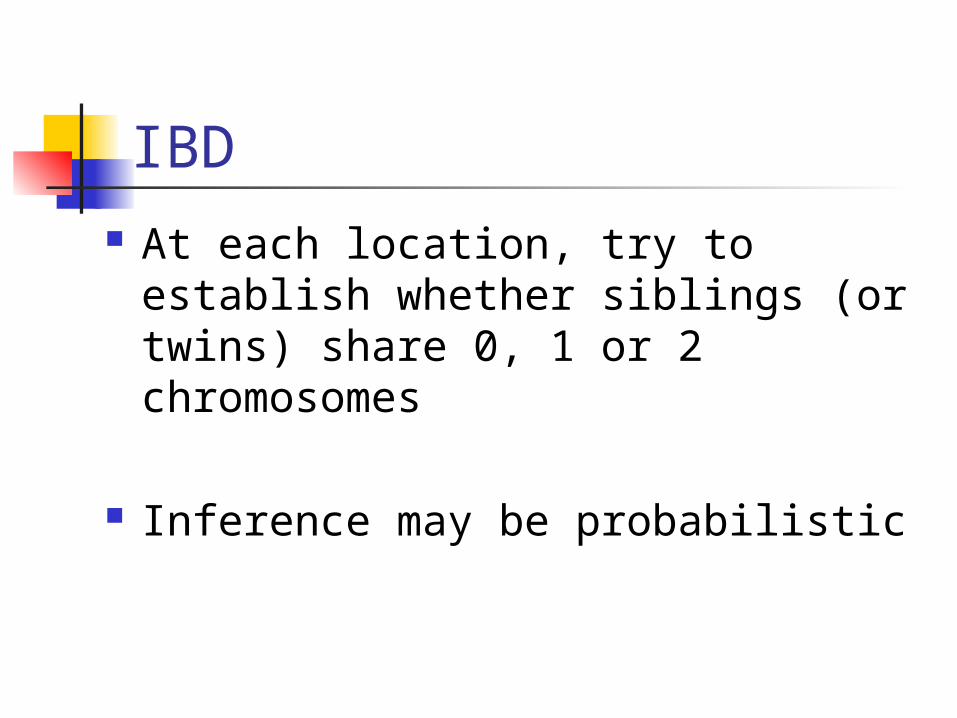
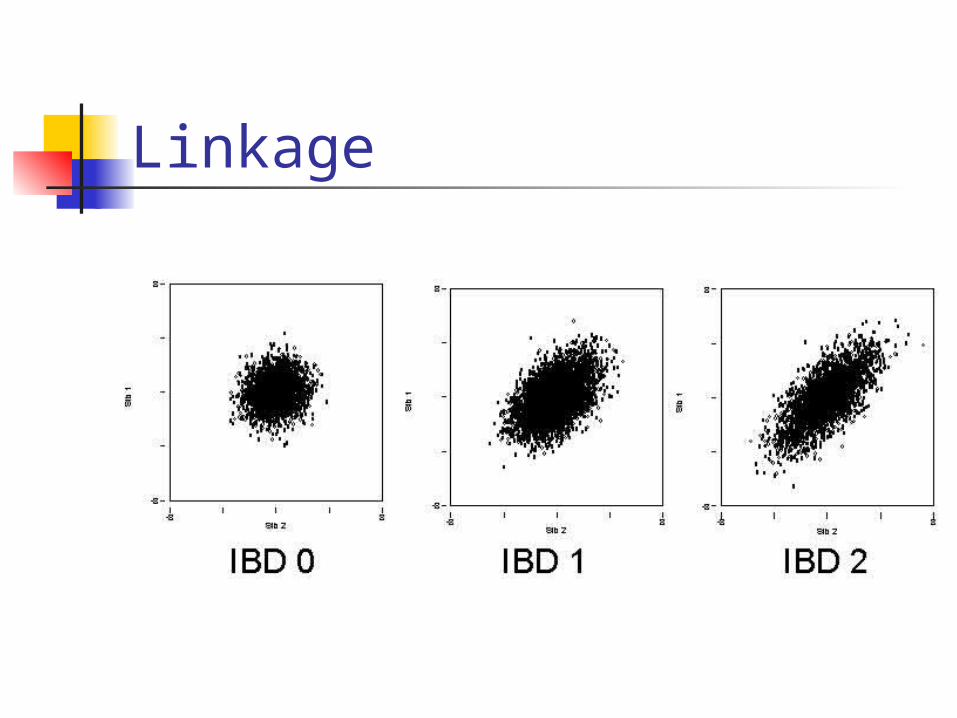
IBD At each location, try to establish
whether siblings (or twins) share 0, 1 or 2 chromosomes
Inference may be probabilistic
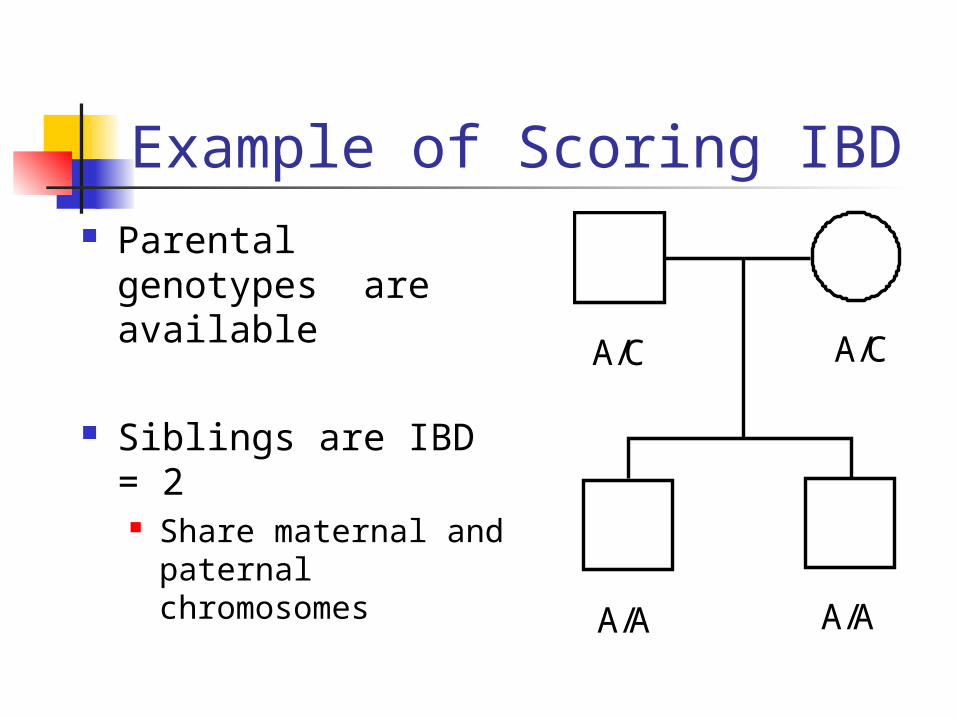
Example of Scoring IBD Parental genotypes
are available
Siblings are IBD = 2 Share maternal and
paternal chromosomes
A/C A/C
A/A A/A
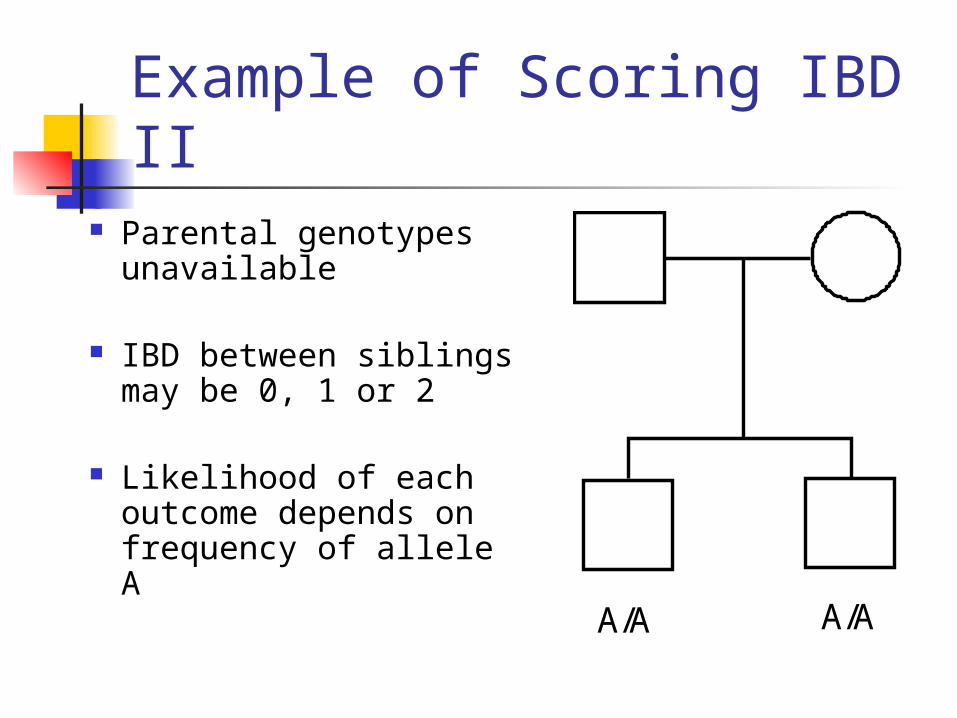
Example of Scoring IBD II Parental genotypes
unavailable
IBD between siblings may be 0, 1 or 2
Likelihood of each outcome depends on frequency of allele A A/A A/A

Example of IBD scoring III Looking at multiple
consecutive markers helps infer IBD Especially without
parental genotypes
IBD = 2 may be quite likely
A/AC/GA/TG/G
A/AC/GA/TG/G
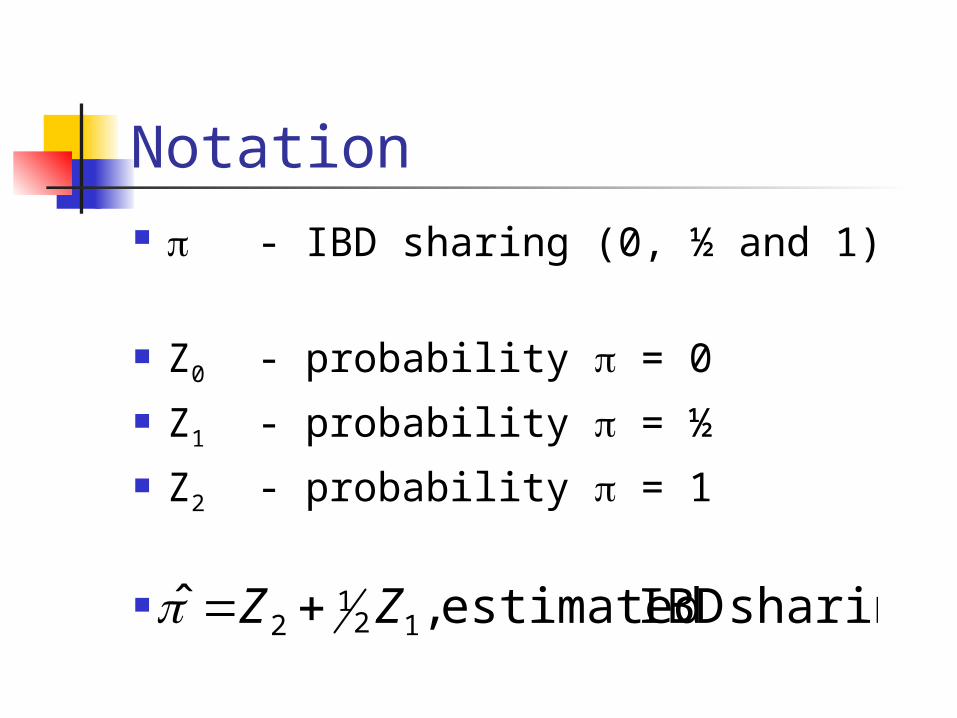
Notation - IBD sharing (0, ½ and 1)
Z0 - probability = 0 Z1 - probability = ½ Z2 - probability = 1
sharing IBD estimated ,ˆ 121
2 ZZ

Typical IBD information
Pair Chr. Pos (cM) z0 z1 z2 pi-hat5378-5479 3 10 0.00 0.01 0.99 0.9955378-5479 3 20 0.00 0.01 0.99 0.9955378-5479 3 30 0.00 0.50 0.50 0.7505378-5479 3 40 0.00 1.00 0.00 0.5005378-5479 3 50 0.01 0.98 0.01 0.500
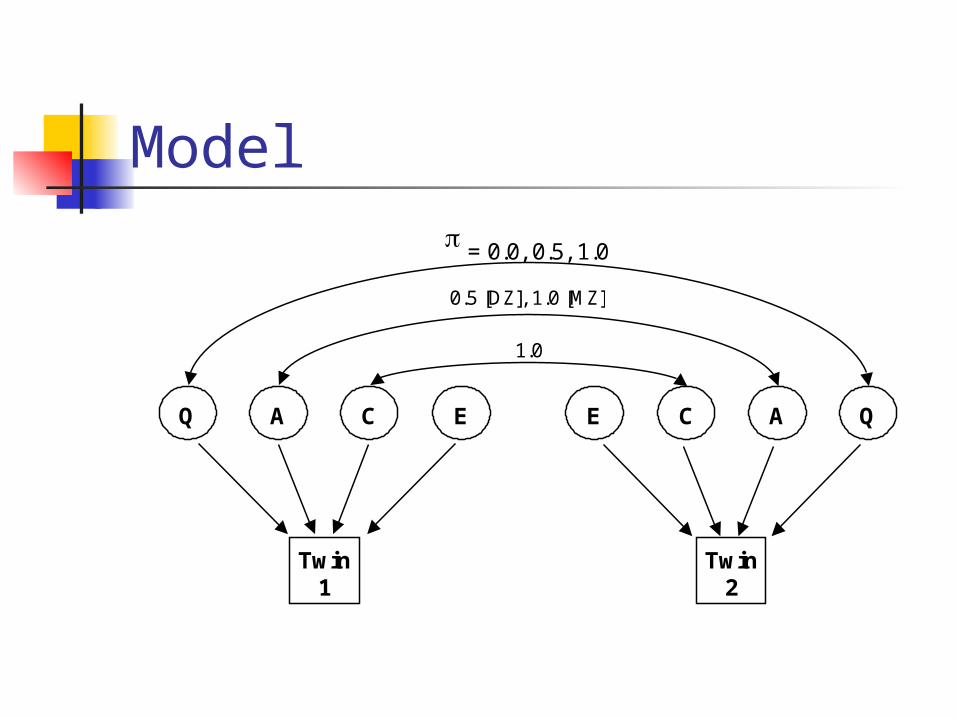
Model
Twin1
Q A C E
Twin2
QACE
= 0.0, 0.5, 1.0
0.5 [DZ], 1.0 [MZ]
1.0

No Linkage
Linkage

Hypothesis Test evidence for linked genetic
effect
Fit two models Full model (Q,A,C,E) Restricted model (A,C,E)
Maximum likelihood test Compare likelihoods using ²
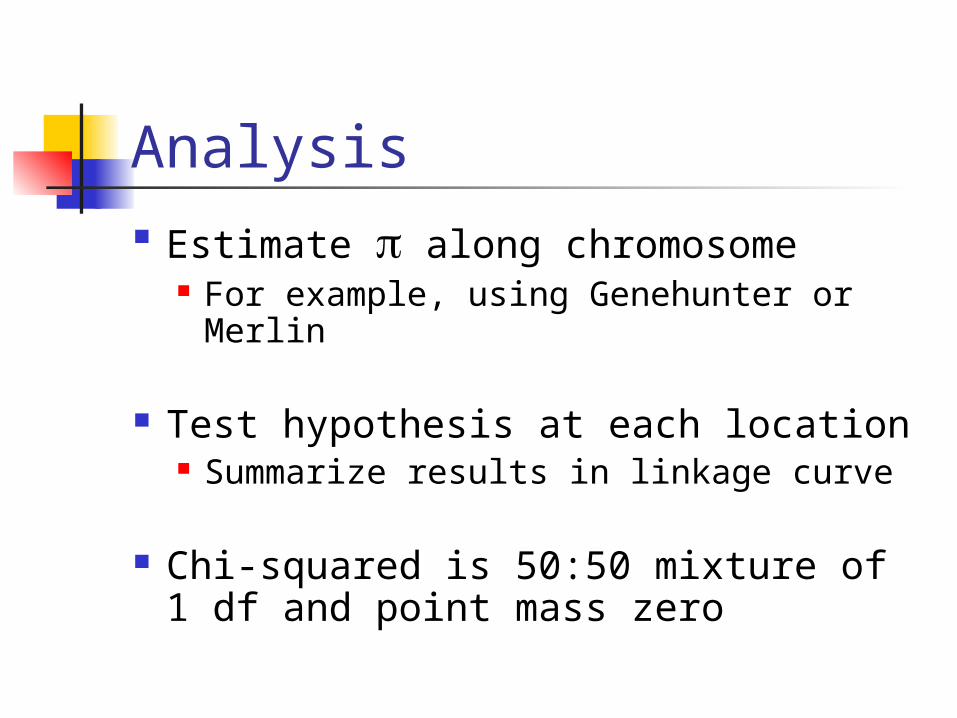
Analysis Estimate along chromosome
For example, using Genehunter or Merlin
Test hypothesis at each location Summarize results in linkage curve
Chi-squared is 50:50 mixture of 1 df and point mass zero
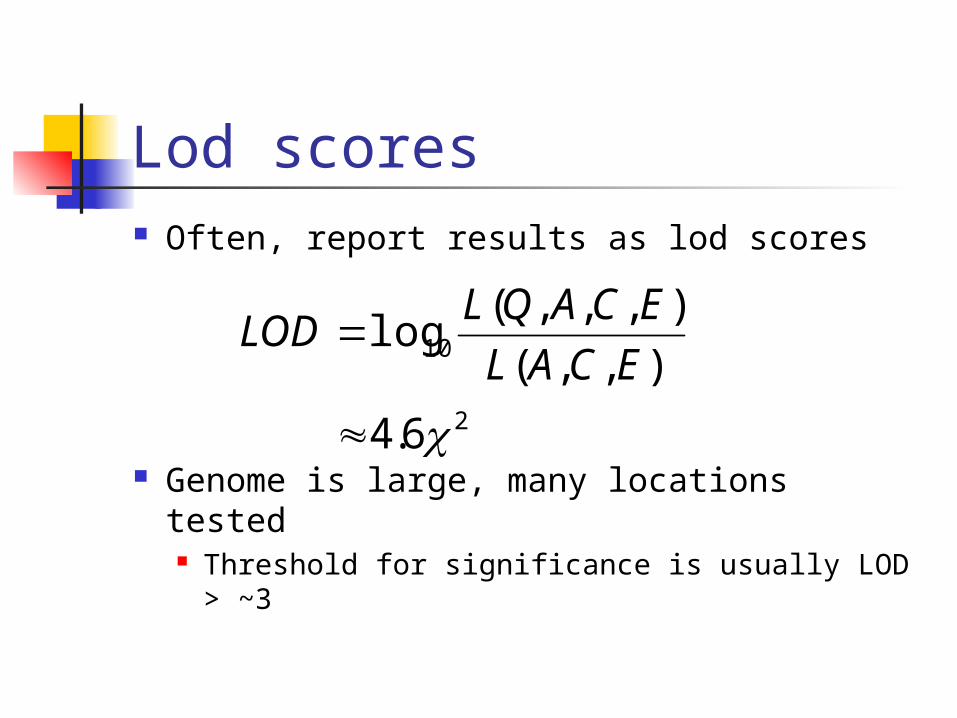
Lod scores Often, report results as lod scores
Genome is large, many locations tested Threshold for significance is usually LOD >
~3
2
10
6.4
),,(
),,,(log
ECAL
ECAQLLOD
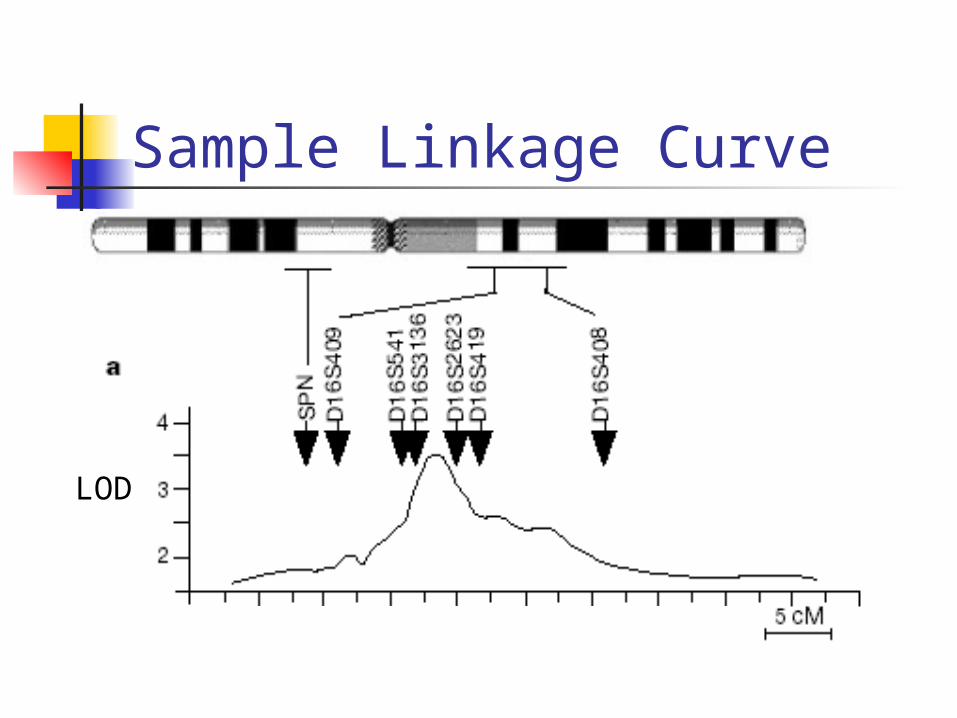
Sample Linkage Curve
LOD