Embed Size (px)
Citation preview

1
Name: _________ANSWER KEY____________________________________ Date:_____________________
Living Environment 2018 In order to successfully conduct investigations in Living Environment, we need to develop proficiency in certain laboratory skills. In our first Unit and throughout the school year, we will perform each of the laboratory skills listed below. We will check off each one of these skills as we learn and practice them.
□ Follow safety rules in the laboratory
□ Select and use correct instruments
□ Use graduated cylinders to measure volume
□ Use metric ruler to measure length
□ Use thermometer to measure temperature
□ Use electronic balance to measure mass
□ Design and carry out a controlled, scientific experiment based on biological processes
□ State an appropriate hypothesis
□ Differentiate between independent and dependent variables
□ Identify the control group and/or controlled variables
□ Collect, organize, and analyze data, using a computer and/or other laboratory equipment
□ Organize data through the use of data tables and graphs
□ Analyze results from observations/expressed data
□ Formulate an appropriate conclusion from the results of an experiment
□ Recognize assumptions, limitations, and improvement of the experiment
Introduction to Living Environment & Scientific Methods
2
Notes on the Characteristics of Living Things
1. Biology is the study of ____LIFE_______________.
How can we tell the difference between something that is living and something that is non living? All living things have several characteristics in common. 2. The characteristics of a living organism are:
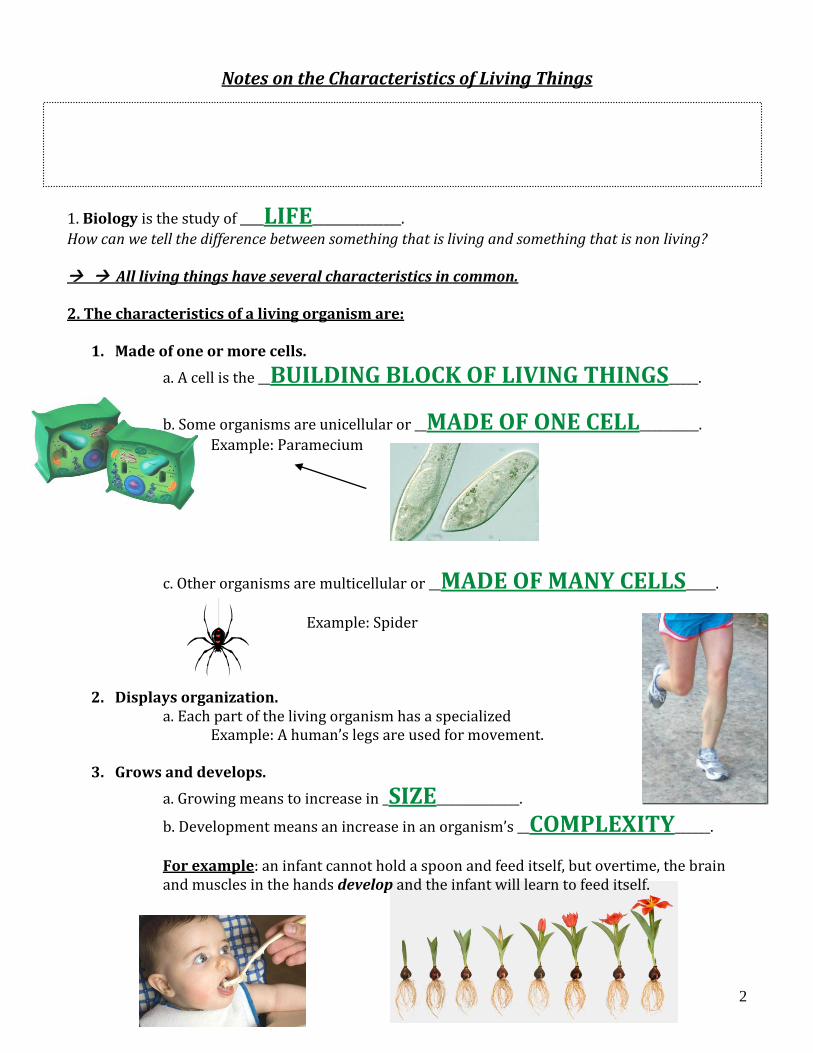
1. Made of one or more cells.
a. A cell is the __BUILDING BLOCK OF LIVING THINGS_____.
b. Some organisms are unicellular or __MADE OF ONE CELL__________.
Example: Paramecium
c. Other organisms are multicellular or __MADE OF MANY CELLS_____.
Example: Spider
2. Displays organization. a. Each part of the living organism has a specialized function.
Example: A human’s legs are used for movement.
3. Grows and develops.
a. Growing means to increase in _SIZE______________.
b. Development means an increase in an organism’s __COMPLEXITY______.
For example: an infant cannot hold a spoon and feed itself, but overtime, the brain and muscles in the hands develop and the infant will learn to feed itself.

3
4. Reproduces.
a. To reproduce means to produce __OFFSPRING______.
An individual does not need to reproduce, but some species have to have offspring.
5. Responds to stimuli.
a. Internal and external stimuli (__SIGNALS FROM ENVIRONMENT____)
that cause the organism to respond (react).
Example: A hawk feels hungry (an internal stimuli), and hunts (response to stimuli) for field mice. The field mice responds by running away.
6. Requires energy. a. Organisms must eat.
b. Autotrophs: _MAKE OWN FOOD__________
Ex: ________________________________________________
c. Heterotrophs: ___HAVE TO EAT FOOD___
Ex: You and me
7. Maintains homeostasis- to maintain a steady or stable environment. Maintain balance in a system
HOMEOSTASIS comes from two LATIN root words:
HOMEO = ___SAME______________________STASIS = _____STATE____________________________
a. Internal conditions must stay _BALANCED___. Ex: A human sweats to stop their body temperature from rising too high.
8. Evolves overtime. As an organism reproduces, it passes on traits. Organisms with traits that help the organism survive in its environment will thrive, reproduce and pass along this trait. Organisms without the favorable trait will die.
4
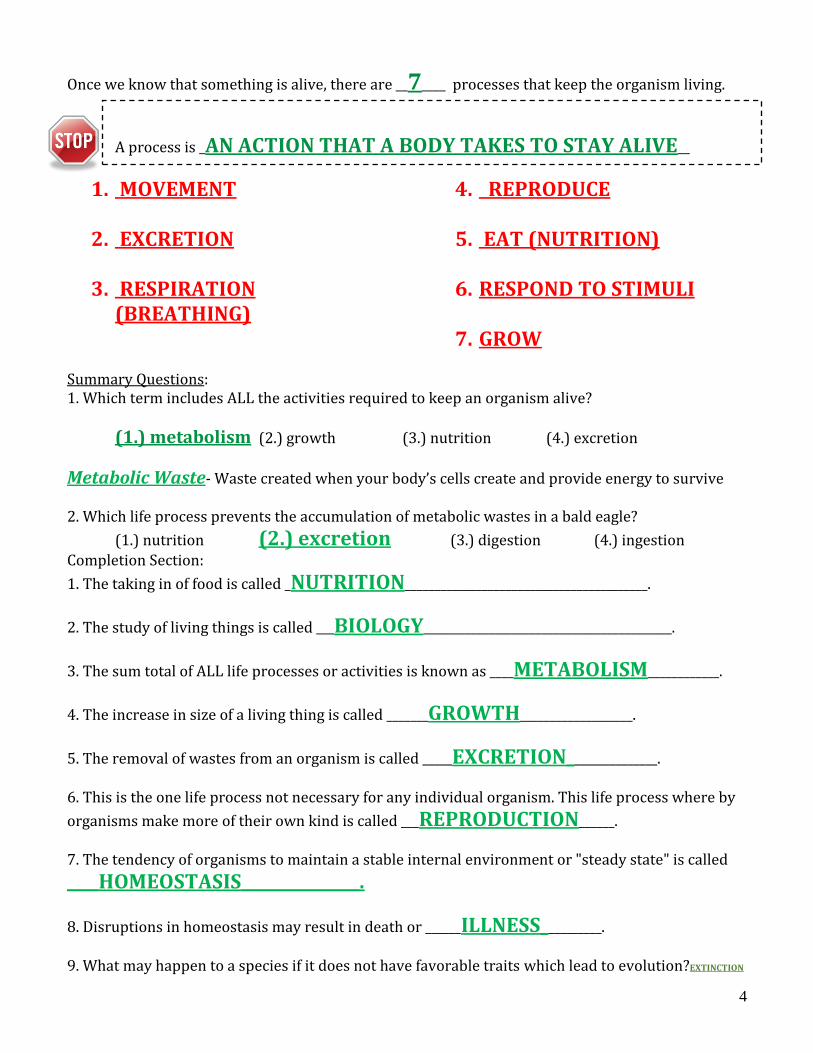
Once we know that something is alive, there are __7____ processes that keep the organism living.
A process is _AN ACTION THAT A BODY TAKES TO STAY ALIVE__
1. MOVEMENT 2. EXCRETION 3. RESPIRATION
(BREATHING)
4. REPRODUCE 5. EAT (NUTRITION)
6. RESPOND TO STIMULI 7. GROW
Summary Questions: 1. Which term includes ALL the activities required to keep an organism alive?
(1.) metabolism (2.) growth (3.) nutrition (4.) excretion
Metabolic Waste- Waste created when your body’s cells create and provide energy to survive
2. Which life process prevents the accumulation of metabolic wastes in a bald eagle?
(1.) nutrition (2.) excretion (3.) digestion (4.) ingestion
Completion Section:
1. The taking in of food is called _NUTRITION_________________________________________.
2. The study of living things is called ___BIOLOGY__________________________________________.
3. The sum total of ALL life processes or activities is known as ____METABOLISM____________.
4. The increase in size of a living thing is called _______GROWTH___________________.
5. The removal of wastes from an organism is called _____EXCRETION_______________. 6. This is the one life process not necessary for any individual organism. This life process where by
organisms make more of their own kind is called ___REPRODUCTION______. 7. The tendency of organisms to maintain a stable internal environment or "steady state" is called
____HOMEOSTASIS_______________.
8. Disruptions in homeostasis may result in death or ______ILLNESS__________. 9. What may happen to a species if it does not have favorable traits which lead to evolution?EXTINCTION

5
Notes on Graphing Unit Question: Why do humans create models? Content Question: Is a picture really worth a thousand words? AOI: Human Ingenuity
Why do we use graphs and tables? Use page 20 in the textbook (Analyze the Data) to find the
answer, then check with your partner’s response:
Reading or interpreting a graph is typically much easier than creating a graph from scratch, so we will start there…. Two key skills when reading line graphs are below:
1. Interpolation is determined by reading a value on your line in-between the points you graphed. 2. Extrapolation is to predict a value that is not on your line (beyond your line) based on the graphed data.
There are many different factors you must consider when you construct and read a graph. Below you will find some graphs (some are from the lab that you worked on in class). Use the graphs to answer the questions that follow. 1. The independent variable for an experiment is always placed on the x axis of a graph. Identify the independent variable on this
graph. TIME 2. The dependent variable for an experiment is always placed on the y axis of a graph. Identify the dependent variable on this
graph. BLOOD GLUCOSE CONCENTRATION 3. Based on the trend shown in the graph, what is the blood glucose concentration at a
time of 6 hours? 120 mg/dL 4. Based on the trend shown in the graph, what is the blood glucose concentration at a time of 23 hours?
110 mg/dL

6
5. Identify the independent variable on this graph.
___YEAR___________________________ 6. Based on the trend shown in the graph, what is the pH
level in 1987? ___6.3__________ 7. Based on the trend shown in the graph, what is the pH
level in 1993? ___5.5__________ 8. What are the numbers on the x-axis doing?
_INCREASING__________________ 9. What are the numbers on the y-axis doing?
__DECREASING_________________ 10. State the relationship between the variables on this graph:
As Year (x) _INCREASES__, pH level (y)
___DECREASES______.
11. What type of relationship is this? ____INDIRECT______
8. If the trend continues as shown in the data, what would be the total number of bubbles released at 20°
C at 30 minutes? __60 BUBBLES_____
9. Identify the dependent variable on
this graph. __# OF BUBBLES_____
10. State the relationship between time and the total number
of bubbles released. __AS TIME INCREASES TOTAL NUMBER OF BUBBLES INCREASE.
11. What type of relationship is this?
___DIRECT________
DIRECT
7
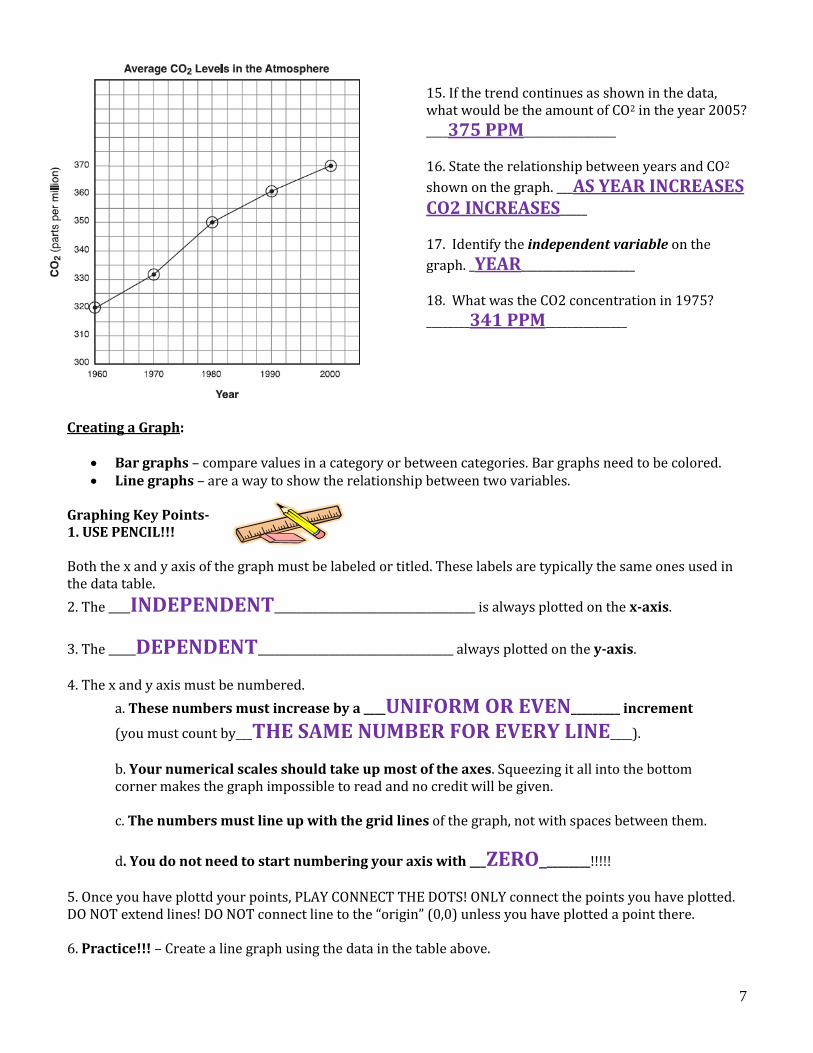
15. If the trend continues as shown in the data, what would be the amount of CO2 in the year 2005?
____375 PPM_________________ 16. State the relationship between years and CO2
shown on the graph. ___AS YEAR INCREASES CO2 INCREASES_____ 17. Identify the independent variable on the
graph. _YEAR_____________________ 18. What was the CO2 concentration in 1975?
________341 PPM_______________
Creating a Graph:
Bar graphs – compare values in a category or between categories. Bar graphs need to be colored. Line graphs – are a way to show the relationship between two variables.
Graphing Key Points- 1. USE PENCIL!!! Both the x and y axis of the graph must be labeled or titled. These labels are typically the same ones used in the data table.
2. The ____INDEPENDENT_____________________________________ is always plotted on the x-axis.
3. The _____DEPENDENT____________________________________ always plotted on the y-axis.
4. The x and y axis must be numbered.
a. These numbers must increase by a ____UNIFORM OR EVEN_________ increment
(you must count by___THE SAME NUMBER FOR EVERY LINE____).
b. Your numerical scales should take up most of the axes. Squeezing it all into the bottom corner makes the graph impossible to read and no credit will be given. c. The numbers must line up with the grid lines of the graph, not with spaces between them.
d. You do not need to start numbering your axis with ___ZERO_________!!!!!
5. Once you have plottd your points, PLAY CONNECT THE DOTS! ONLY connect the points you have plotted. DO NOT extend lines! DO NOT connect line to the “origin” (0,0) unless you have plotted a point there. 6. Practice!!! – Create a line graph using the data in the table above.

8
Data Tables:
Data tables are used to ___ORGANIZE______ data which will be plotted in a graph.
- First column in the table is for the ______INDEPENDENT______ variable.
- Second column is for the ______DEPENDENT_____ variable.
- Each column should be titled, and include ______UNITS_____ of measurement.
- Data in the table must be arranged in ascending or descending order.
Ascending Order or Descending Order
9
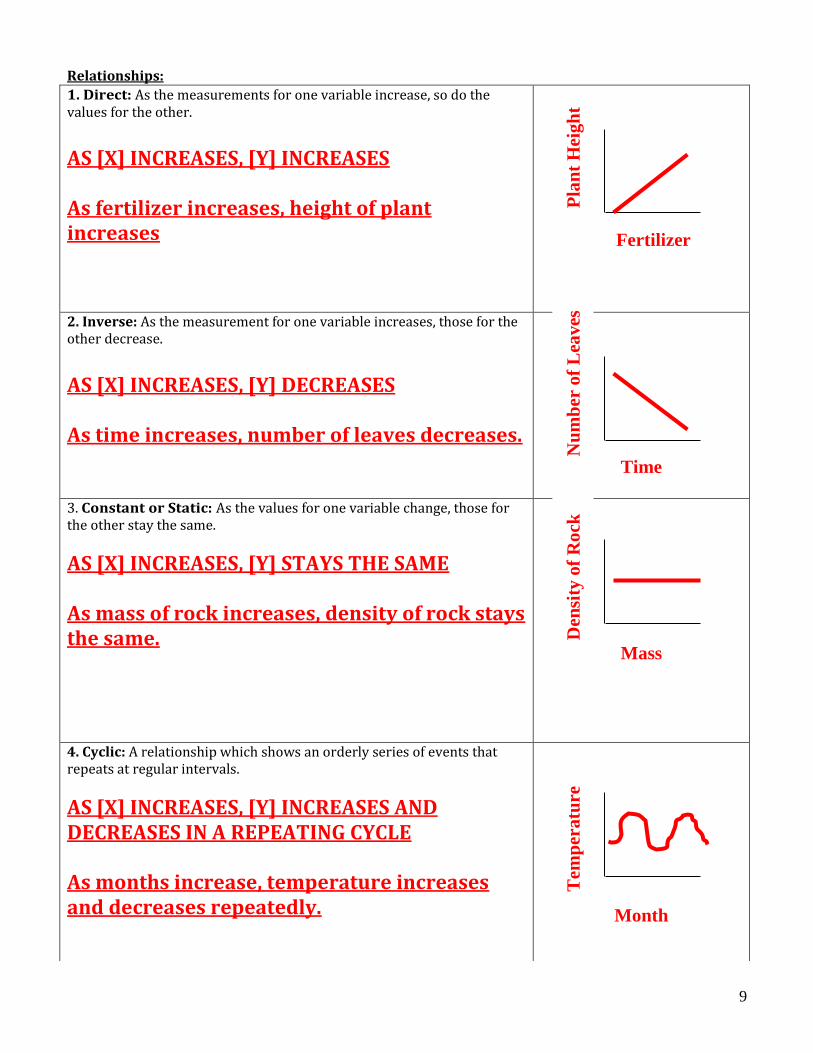
Relationships:
1. Direct: As the measurements for one variable increase, so do the values for the other.
AS [X] INCREASES, [Y] INCREASES As fertilizer increases, height of plant increases
Fertilizer
2. Inverse: As the measurement for one variable increases, those for the other decrease.
AS [X] INCREASES, [Y] DECREASES As time increases, number of leaves decreases.
Time
3. Constant or Static: As the values for one variable change, those for the other stay the same.
AS [X] INCREASES, [Y] STAYS THE SAME As mass of rock increases, density of rock stays the same.
Mass
4. Cyclic: A relationship which shows an orderly series of events that repeats at regular intervals.
AS [X] INCREASES, [Y] INCREASES AND DECREASES IN A REPEATING CYCLE As months increase, temperature increases and decreases repeatedly.
Month
Pla
nt
Hei
gh
t N
um
ber
of
Lea
ves
D
ensi
ty o
f R
ock
T
emp
eratu
re

10
Name: ______________________________________________________ Date: ____________________
Lab Investigation
Introduction:
Instruments and tools are used to extend our observations in order to make them more accurate. They are
also used to aid us in scientific investigation and experimentation. With your partner, identify and write
the name of each instrument below, then discuss what each is used for.
1. graduated cylinder
Measure volume of
liquids
2. microscope
Observe objects
too small to see
3. thermometer
measure temperature
of air/liquid
4. scale
Measure mass
5. magnifying glass
Observe small objects
6.mortar and pestle
Crush/grind
7. test tube with
holder/clamp
hold and heat small amounts
of liquid
8. beaker and Erlenmeyer
flask
Store/ mix
liquids,
measure volume
9. hot plate
heat
10. ruler
Measure length
11. pipette/ eye dropper
Transfer small amounts or
liquid
12. tweezer/ forceps
Pick up small objects
Word Bank: Beakers/Flasks, Pipette, Microscope, Ruler, Scale, Forceps/Tweezers, Graduated cylinder,
Magnifying lens, Test tube, Thermometer, Hot plate, Mortar/Pestle

11
Matching - Match the instrument with two letters- type of measurement and the proper unit.
Instrument
1. Ruler _B____ E_____
A) Mass
B) Length
2. Graduated Cylinder _D____ _F____
C) Temperature
D) Volume
3. Digital Scale A_____ __H___
E) cm, m
F) L, mL
4. Thermometer _C____ __G___
G) °C , °F
H) g
Key Points in Measuring
1. The METRIC SYSTEM (SI) is preferred in science because it is the official system of
measurement in most countries worldwide. It is also easy to convert between units because each
prefix corresponds to a multiple or division of ten.
2. Length is measured with instruments like _RULERS____. Typical metric units of length
values are METERS (m) , CENTIMETERS (cm) , KILOMETERS (km).
3. Volume is typically measured with tools such as __GRADUATED CYLINDER____.
Units of volume are LITER( l), MILLILITER (mL), CUBIC
CENTIMETERS (cm3).
4. Temperature is measured with a ___THERMOMETER___________.
Some key Celsius temperatures and their equal values in the Fahrenheit scale are below.
a. 0° C = 32° F (the ______________________________________ point of water)
b. 37° C = 98.6° F (the ____________________________________ temperature)
c. 100° C = 212° F (the ___________________________________ point of water at sea
level)
5. Mass is typically measured using _BALANCE______. Units for mass are
___GRAM (g), KILOGRAM (kg).
6. METRIC CONVERSIONS:
a. How many mm are in a cm? __10___How many cm are in a m? ___100____
b. 1 cm = ___10______mm To convert from cm to mm you have to multiply by 10
c. 100cm = __1______m To convert from cm to m you have to __divide by 100_
12
Directions: Using the tools provided to you, measure the following objects in the classroom. All
measurements must be expressed (written) the nearest tenth, unless otherwise noted.
1. Length of black lab desk:
_________________ cm
2. Length of one floor tile:
_________________ cm
3. Length of science textbook:
_________________ cm
Width of science textbook:
_________________ cm
Thickness of science textbook
________________ cm
4. Height of black lab desk:
_________________ cm
5. Volume of red liquid:
_________________ mL
6. Volume of blue liquid:
_________________ mL
7. Mass of the metal bar:
_________________ g
8. Mass of the fossil sample:
_________________ g
9. Volume of the sample: (use the water
displacement method) __________mL or
cm3
10. Temperature of yellow liquid:
_________________ °C
11. Temperature of green liquid:
_________________ °C
12. Temperature of air:
_________________ °C
13. The time right now:
______hr_____min_____sec
14. Mass of the sand alone: (using the “zero”
function on the balance) ___________________g
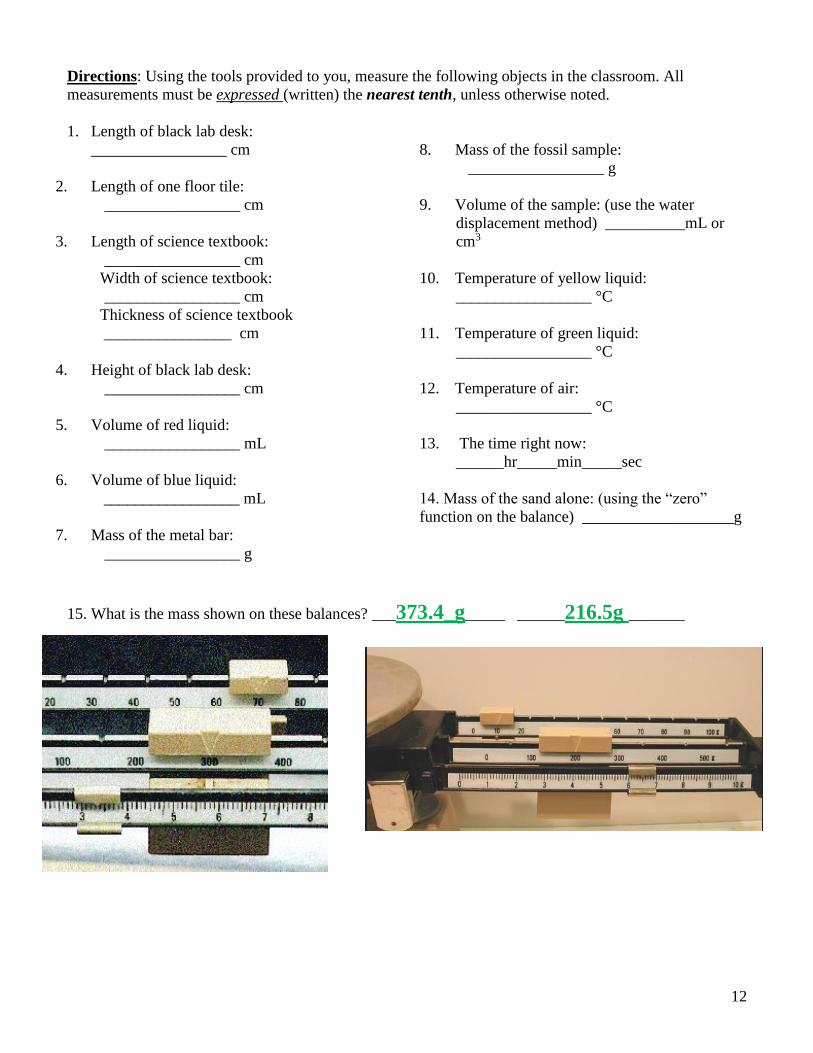
15. What is the mass shown on these balances? ___373.4_g_____ ______216.5g _______
13
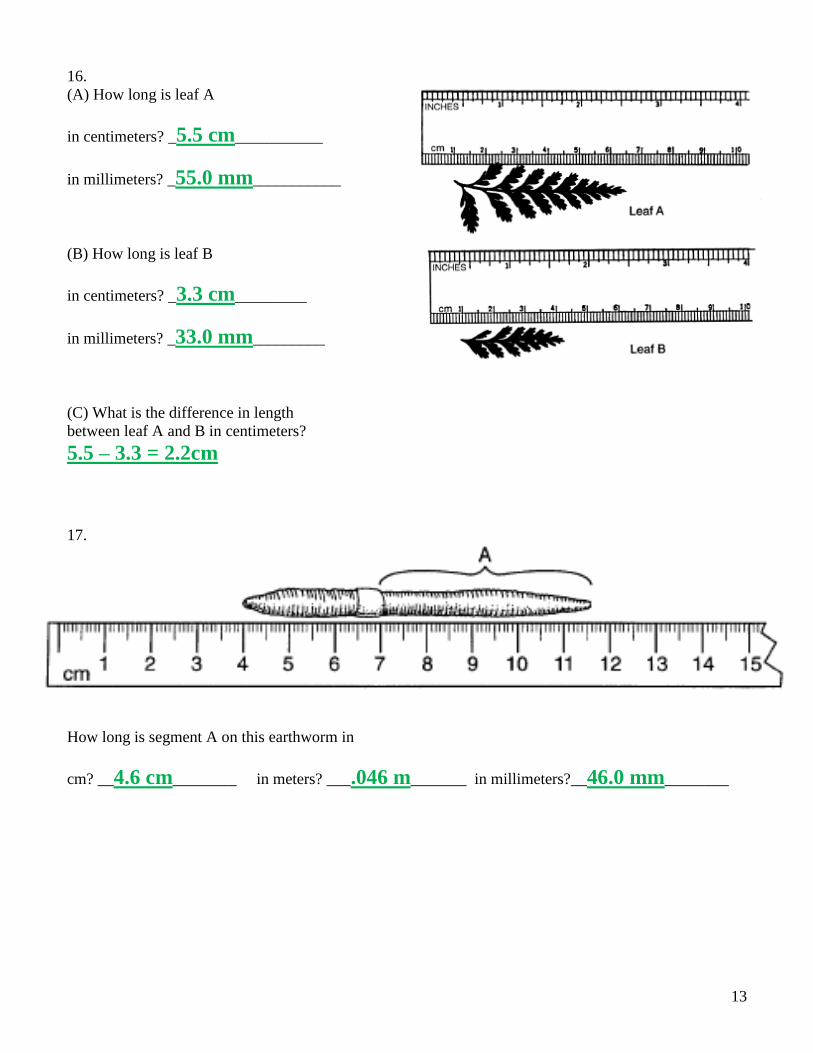
16.
(A) How long is leaf A
in centimeters? _5.5 cm___________
in millimeters? _55.0 mm___________
(B) How long is leaf B
in centimeters? _3.3 cm_________
in millimeters? _33.0 mm_________
(C) What is the difference in length
between leaf A and B in centimeters?
5.5 – 3.3 = 2.2cm
17.
How long is segment A on this earthworm in
cm? __4.6 cm________ in meters? ___.046 m_______ in millimeters?__46.0 mm________

14
Label the scale next to each graduated cylinder
18. State the volume of each liquid:
(1) 12.0 mL
(2) 16.0 mL
(3) 14.0 mL
(4) 14.0 mL
19. A) Write out a method to determine the volume of the rock.
- Fill a graduated cylinder with water and record the initial
volume.
- Place rock in graduated cylinder and observe the water rise.
- Record the volume after rock is placed in.
- Subtract the starting volume from the final volume to find the
volume of the rock.
B) What is the volume of the rock?
270.0 – 200.0 = 70.0 mL
**Bonus- what is this method called?
Water Displacement
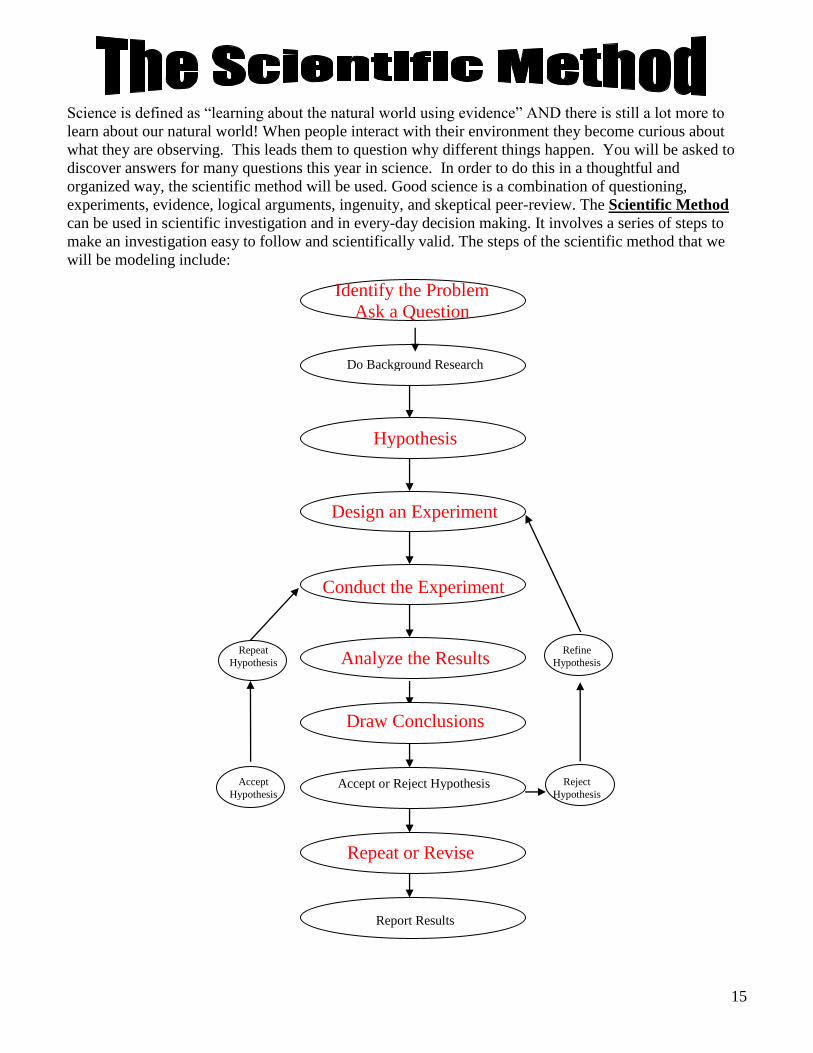
15
Science is defined as “learning about the natural world using evidence” AND there is still a lot more to
learn about our natural world! When people interact with their environment they become curious about
what they are observing. This leads them to question why different things happen. You will be asked to
discover answers for many questions this year in science. In order to do this in a thoughtful and
organized way, the scientific method will be used. Good science is a combination of questioning,
experiments, evidence, logical arguments, ingenuity, and skeptical peer-review. The Scientific Method
can be used in scientific investigation and in every-day decision making. It involves a series of steps to
make an investigation easy to follow and scientifically valid. The steps of the scientific method that we
will be modeling include:
Do Background Research
Repeat
Hypothesis
Accept
Hypothesis
Reject
Hypothesis
Refine
Hypothesis
Accept or Reject Hypothesis
Report Results
Identify the Problem
Ask a Question
Hypothesis
Conduct the Experiment
Analyze the Results
Design an Experiment
Draw Conclusions
Repeat or Revise

16
Observation: Data collected using the 5 senses and tools (equipment)
Measurements are observations
Inference: A conclusion or prediction based on observations and past
experiences
Discussion Questions: 1. Did the blind men make appropriate
inferences? Explain.
2. How might the blind men improve their inferences?
3. One of the characteristics of science is that scientists communicate their ideas,
observation, results, and inferences with each other. Why is this a good idea?
17
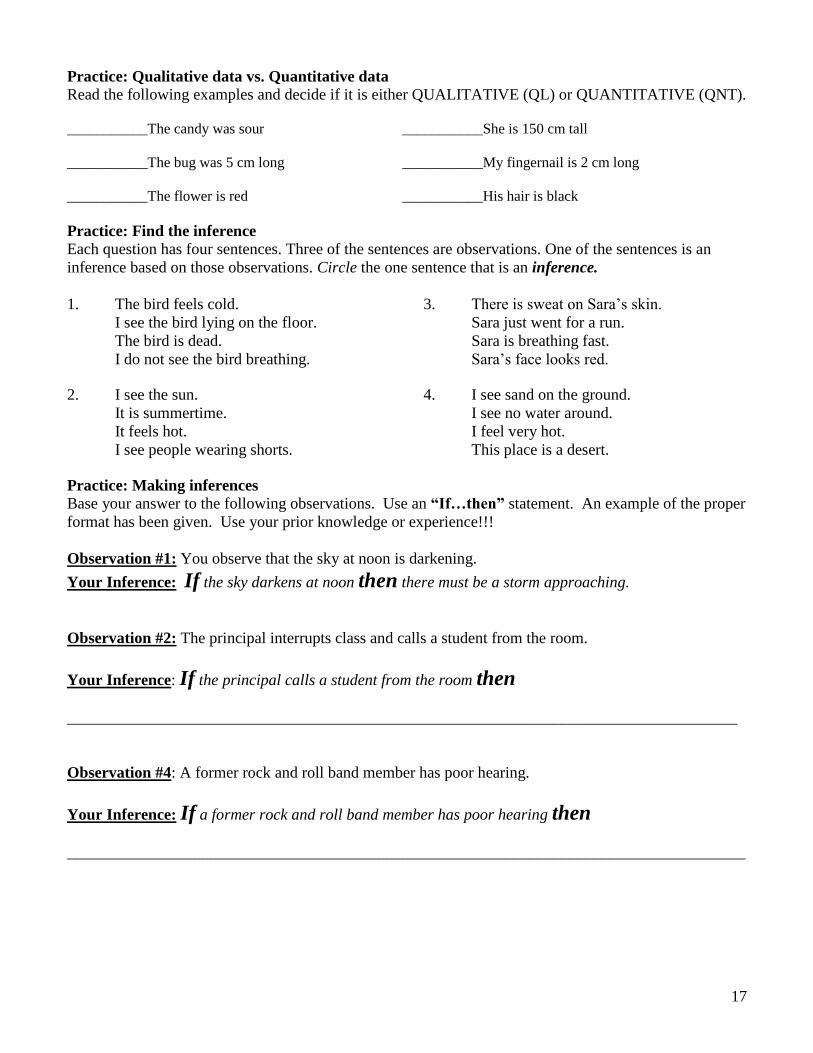
Practice: Qualitative data vs. Quantitative data
Read the following examples and decide if it is either QUALITATIVE (QL) or QUANTITATIVE (QNT).
___________The candy was sour ___________She is 150 cm tall
___________The bug was 5 cm long ___________My fingernail is 2 cm long
___________The flower is red ___________His hair is black
Practice: Find the inference
Each question has four sentences. Three of the sentences are observations. One of the sentences is an
inference based on those observations. Circle the one sentence that is an inference.
1. The bird feels cold.
I see the bird lying on the floor.
The bird is dead.
I do not see the bird breathing.
3. There is sweat on Sara’s skin.
Sara just went for a run.
Sara is breathing fast.
Sara’s face looks red.
2. I see the sun.
It is summertime.
It feels hot.
I see people wearing shorts.
4. I see sand on the ground.
I see no water around.
I feel very hot.
This place is a desert.
Practice: Making inferences Base your answer to the following observations. Use an “If…then” statement. An example of the proper
format has been given. Use your prior knowledge or experience!!!
Observation #1: You observe that the sky at noon is darkening.
Your Inference: If the sky darkens at noon then there must be a storm approaching.
Observation #2: The principal interrupts class and calls a student from the room.
Your Inference: If the principal calls a student from the room then
____________________________________________________________________________________
Observation #4: A former rock and roll band member has poor hearing.
Your Inference: If a former rock and roll band member has poor hearing then
_____________________________________________________________________________________
18
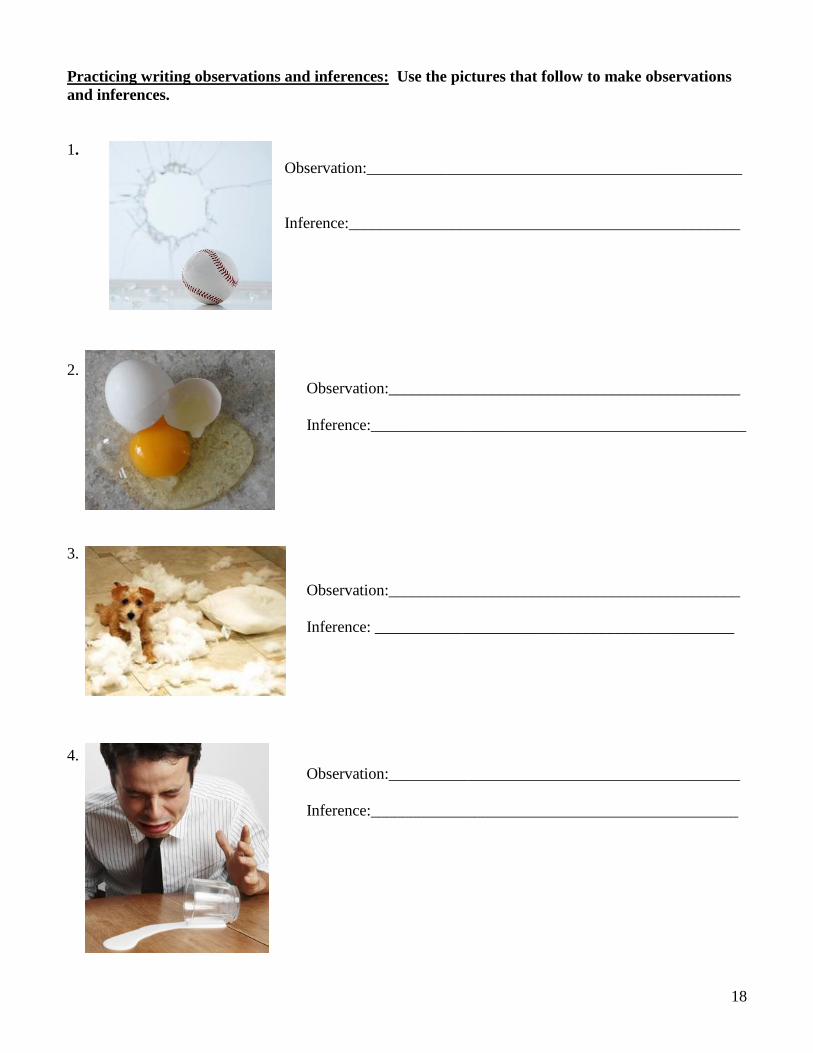
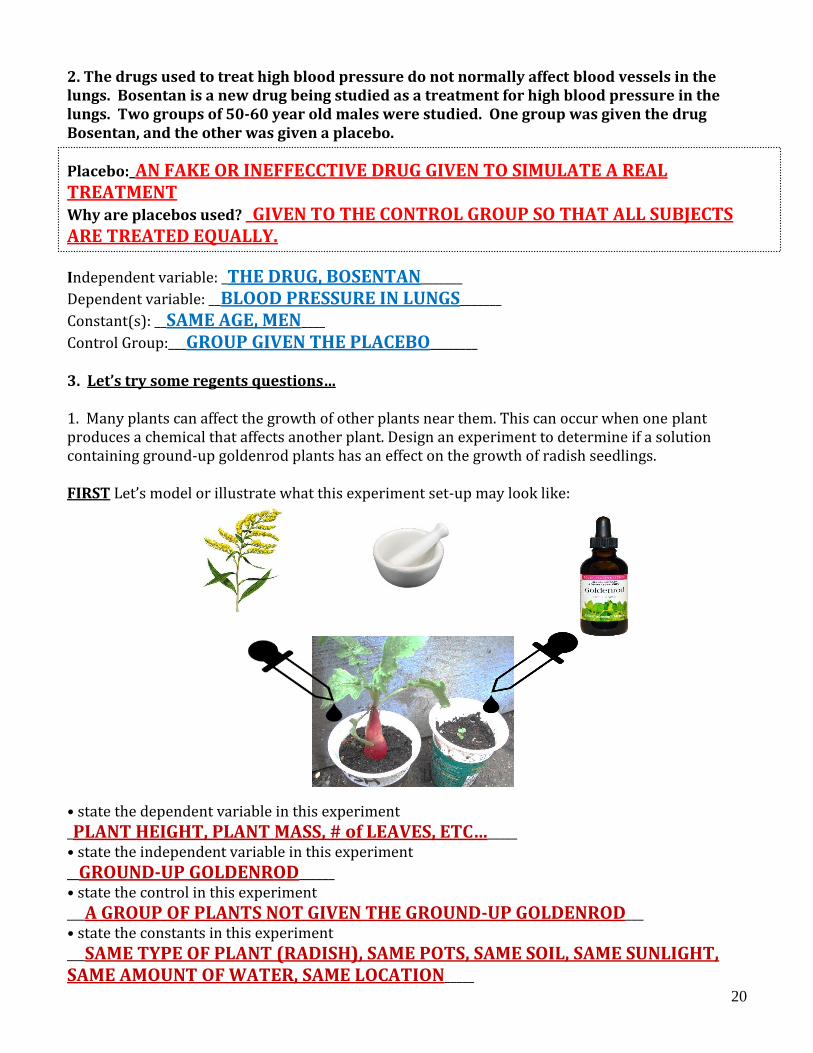
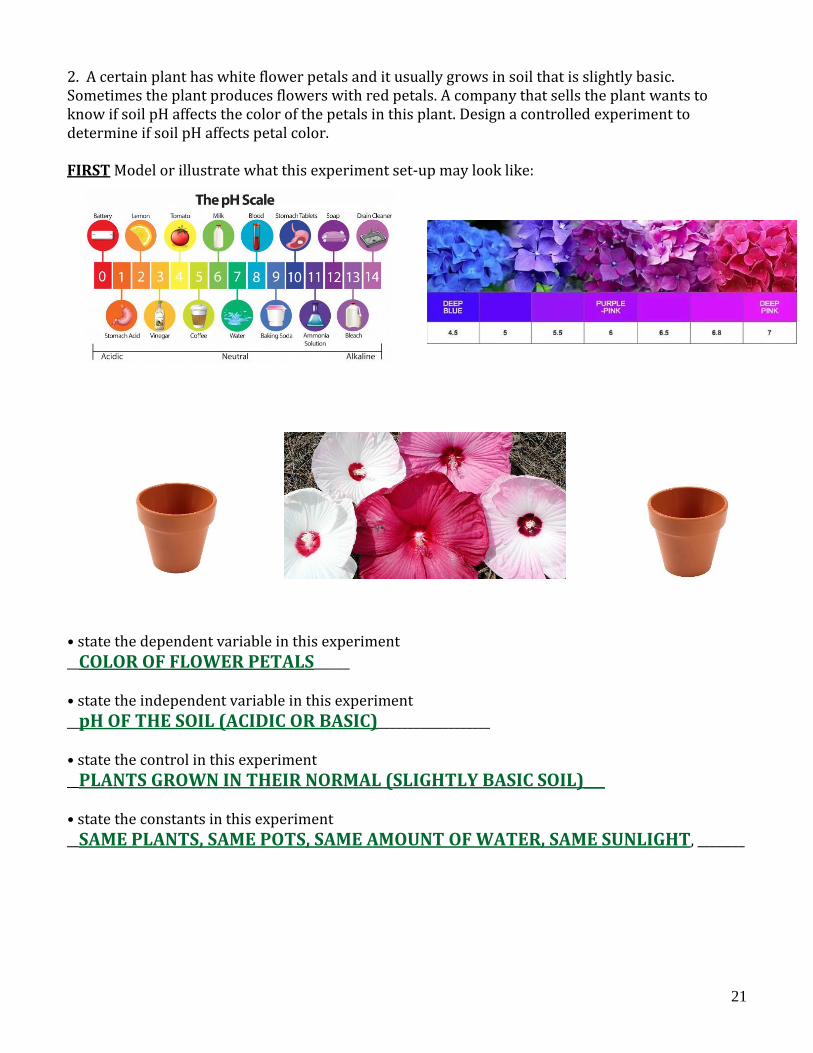
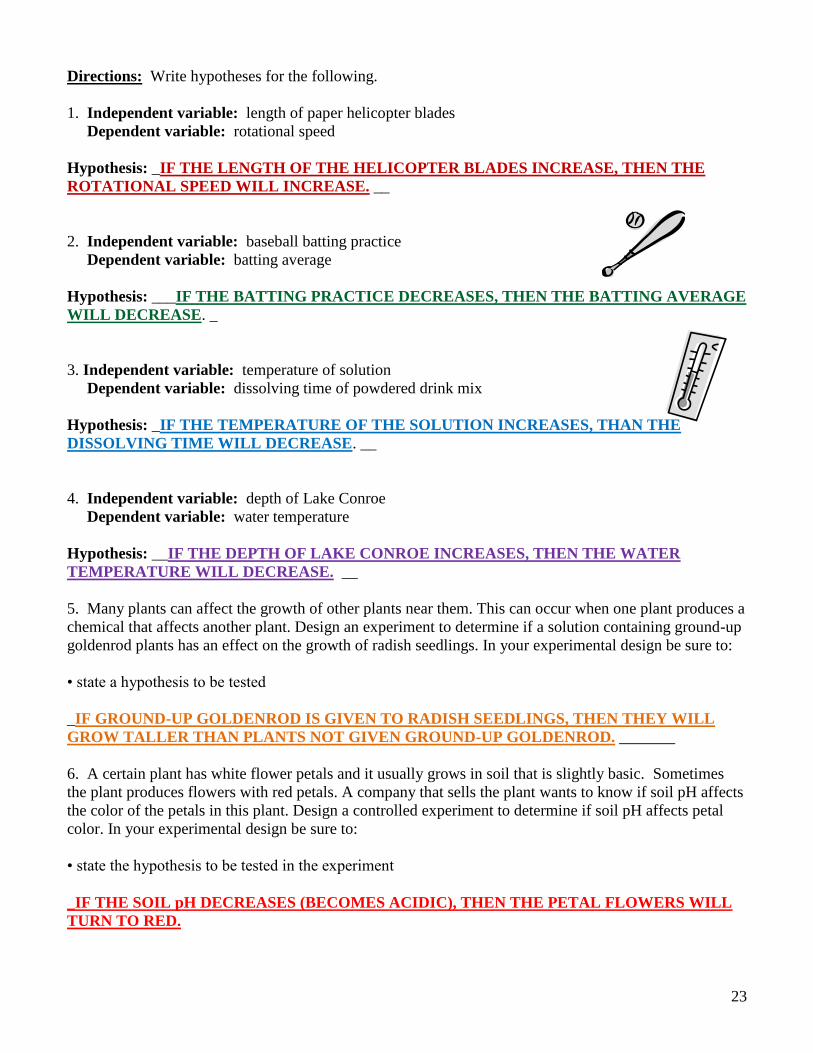
Practicing writing observations and inferences: Use the pictures that follow to make observations
and inferences.
1.
Observation:_______________________________________________
Inference:_________________________________________________
2.
Observation:____________________________________________
Inference:_______________________________________________
3.
Observation:____________________________________________
Inference: _____________________________________________
4.
Observation:____________________________________________
Inference:______________________________________________

19
Notes on Independent and Dependent Variables, Constants, and Controls
A. In a scientific investigation there are __3___ kinds of variables.
1. Independent Variable (_MANIPULATED_ variable):
Intentionally, purposely _CHANGED BY THE SCIENTIST___in an experiment.
2. Dependent Variable ( _RESPONDING variable): Condition that might be affected after the change in the independent variable. What is being measured, or counted, or timed.
Dependent Variable is the ___DATA___ collected during the experiment.
3. Constants:
A factor/condition that is __NOT CHANGED___ or is kept the ___SAME__ for every set up in the experiment.
B. Control Group v. Experimental Group
1. Control Group: The group that experiences __NORMAL, UNCHANGED___conditions.
2. Experimental Group: The group that experiences the _CHANGE or TREATMENT__ in the Independent Variable
Consider the following example: A student wanted to test how the mass of a paper airplane affected the distance it would fly. Paper clips were added before each test flight. As each paper clip was added, the plane was tested to determine how far it would fly.
The mass of the plane (number of paper clips added) was the __INDEPENDENT__ variable.
The distance flown was the __DEPENDENT___ variable. (DATA COLLECTED!!)
The same piece of paper was used for the plane for each trial. This is a __CONSTANT___ in the experiment. For each experiment below, specify the independent and dependent variables, 1-2 constant(s) and the control group. 1. Three groups of 8th grade students added calcium chloride to water to see if it increased the temperature of the water. Each group added a different amount of scoops of calcium chloride. The temperature of the water was tested after two minutes. Each group started with 75 ml of room temperature water.
Independent variable: __AMOUNT OF CALCIUM CHLORIDE____
Dependent variable: _____TEMPERATURE OF WATER____
Constant(s): __75 mL OF WATER, ROOM TEMP WATER, SAME CHEMICAL______
Control Group:___A GROUP WITH ZERO SCOOPS, OR THE INITIAL TEMPERATURE OF THE WATER__
20
2. The drugs used to treat high blood pressure do not normally affect blood vessels in the lungs. Bosentan is a new drug being studied as a treatment for high blood pressure in the lungs. Two groups of 50-60 year old males were studied. One group was given the drug Bosentan, and the other was given a placebo.
Placebo:_AN FAKE OR INEFFECCTIVE DRUG GIVEN TO SIMULATE A REAL TREATMENT
Why are placebos used? _GIVEN TO THE CONTROL GROUP SO THAT ALL SUBJECTS ARE TREATED EQUALLY.
Independent variable: _THE DRUG, BOSENTAN_______
Dependent variable: __BLOOD PRESSURE IN LUNGS_______
Constant(s): __SAME AGE, MEN____
Control Group:___GROUP GIVEN THE PLACEBO________ 3. Let’s try some regents questions… 1. Many plants can affect the growth of other plants near them. This can occur when one plant produces a chemical that affects another plant. Design an experiment to determine if a solution containing ground-up goldenrod plants has an effect on the growth of radish seedlings. FIRST Let’s model or illustrate what this experiment set-up may look like:
• state the dependent variable in this experiment
_PLANT HEIGHT, PLANT MASS, # of LEAVES, ETC…_____ • state the independent variable in this experiment
__GROUND-UP GOLDENROD______ • state the control in this experiment
___A GROUP OF PLANTS NOT GIVEN THE GROUND-UP GOLDENROD___ • state the constants in this experiment
___SAME TYPE OF PLANT (RADISH), SAME POTS, SAME SOIL, SAME SUNLIGHT, SAME AMOUNT OF WATER, SAME LOCATION_____
21
2. A certain plant has white flower petals and it usually grows in soil that is slightly basic. Sometimes the plant produces flowers with red petals. A company that sells the plant wants to know if soil pH affects the color of the petals in this plant. Design a controlled experiment to determine if soil pH affects petal color. FIRST Model or illustrate what this experiment set-up may look like:
• state the dependent variable in this experiment
__COLOR OF FLOWER PETALS______ • state the independent variable in this experiment
__pH OF THE SOIL (ACIDIC OR BASIC)___________________ • state the control in this experiment
__PLANTS GROWN IN THEIR NORMAL (SLIGHTLY BASIC SOIL)___ • state the constants in this experiment
__SAME PLANTS, SAME POTS, SAME AMOUNT OF WATER, SAME SUNLIGHT, ________

22
Notes on Hypothesizing You have learned that variables are important not only in science experiments but also in making
predictions.
Predicting is the process of using observations or data along with other kinds of knowledge to forecast
future events or relationships.
A hypothesis is a special kind of prediction that forecasts how one variable will affect a second variable.
These variables are the independent variable, which is changed intentionally by the investigator, and the
dependent variable, which is observed or measured to determine if or how much it is affected.
Hypotheses are logical explanations that can be tested. Where else have we seen the definition “logical
explanation”? _________________________________________________________________________
Here is an example of a hypothesis…
If the temperature of sea water increases, then the amount of salt that will dissolve in that water increases.
Independent variable: _TEMPERATURE OF SEA WATER_______________________
Dependent variable: ____AMOUNT OF SALT THAT CAN DISSOLVE____________
Notice that the sample hypothesis is expressed as an “If…, then…” sentence. This form, while not
always necessary, is a helpful way to learn to write a hypothesis.
Example One
Some students want to find out if Gatorade is better for an athlete compared to normal water.
What measure would we look for in the athlete to determine if Gatorade is “better”?
_____________________________________________________________________________________
This is your (circle one)
Independent Variable Dependent Variable
Now, let’s write a Hypothesis for this problem using the format given in the box:
If the [independent variable] increases or decreases or changes in SOME way, then the [dependent
variable] will increase, decrease or remain the same.
If ___________________________________________________________________________________
then _________________________________________________________________________________
Steps for Writing a Good Hypothesis
Identify variables in a given event or relationship.
Identify a pair of variables that might be logically related.
Identify the independent and dependent variables
Write the hypothesis using the following format
23
Directions: Write hypotheses for the following.
1. Independent variable: length of paper helicopter blades
Dependent variable: rotational speed
Hypothesis: _IF THE LENGTH OF THE HELICOPTER BLADES INCREASE, THEN THE
ROTATIONAL SPEED WILL INCREASE. __
2. Independent variable: baseball batting practice
Dependent variable: batting average
Hypothesis: ___IF THE BATTING PRACTICE DECREASES, THEN THE BATTING AVERAGE
WILL DECREASE. _
3. Independent variable: temperature of solution
Dependent variable: dissolving time of powdered drink mix
Hypothesis: _IF THE TEMPERATURE OF THE SOLUTION INCREASES, THAN THE
DISSOLVING TIME WILL DECREASE. __
4. Independent variable: depth of Lake Conroe
Dependent variable: water temperature
Hypothesis: __IF THE DEPTH OF LAKE CONROE INCREASES, THEN THE WATER
TEMPERATURE WILL DECREASE. __
5. Many plants can affect the growth of other plants near them. This can occur when one plant produces a
chemical that affects another plant. Design an experiment to determine if a solution containing ground-up
goldenrod plants has an effect on the growth of radish seedlings. In your experimental design be sure to:
• state a hypothesis to be tested
_IF GROUND-UP GOLDENROD IS GIVEN TO RADISH SEEDLINGS, THEN THEY WILL
GROW TALLER THAN PLANTS NOT GIVEN GROUND-UP GOLDENROD. _______
6. A certain plant has white flower petals and it usually grows in soil that is slightly basic. Sometimes
the plant produces flowers with red petals. A company that sells the plant wants to know if soil pH affects
the color of the petals in this plant. Design a controlled experiment to determine if soil pH affects petal
color. In your experimental design be sure to:
• state the hypothesis to be tested in the experiment
_IF THE SOIL pH DECREASES (BECOMES ACIDIC), THEN THE PETAL FLOWERS WILL
TURN TO RED.
24
Notes on Scientific Method Unit Question: Why do humans create models? Content Question: Is there a method to the madness? AOI: Human Ingenuity
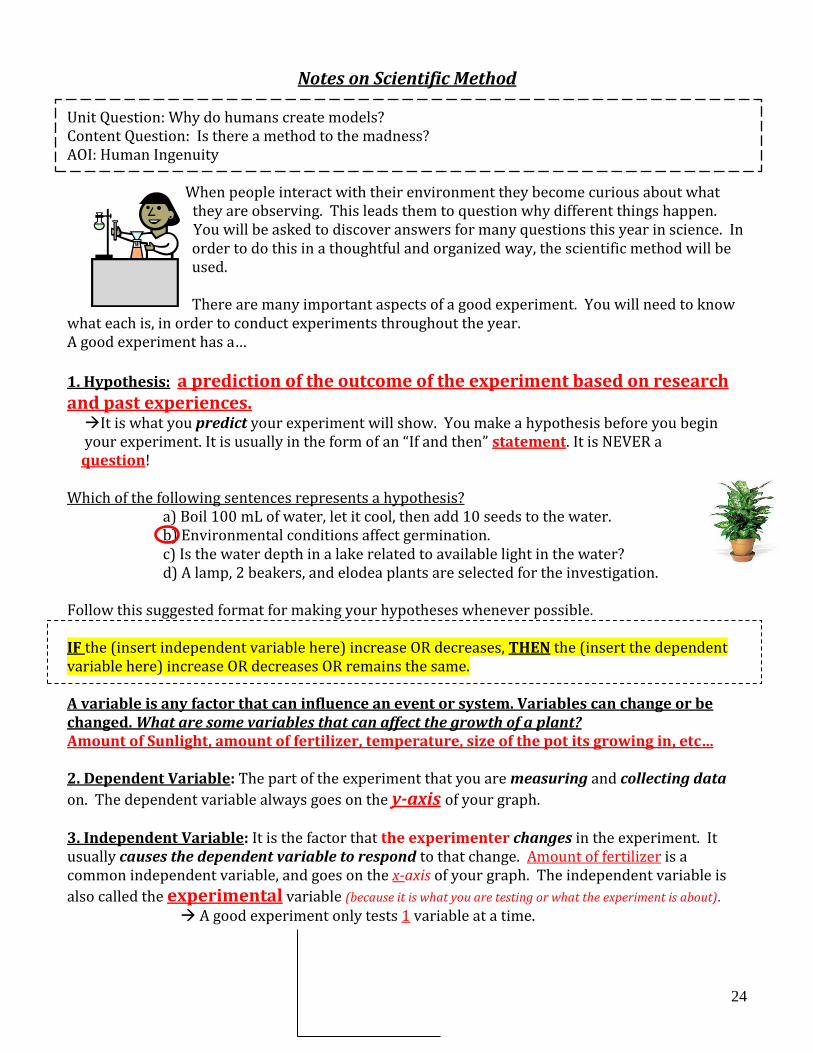
When people interact with their environment they become curious about what they are observing. This leads them to question why different things happen. You will be asked to discover answers for many questions this year in science. In order to do this in a thoughtful and organized way, the scientific method will be used. There are many important aspects of a good experiment. You will need to know
what each is, in order to conduct experiments throughout the year. A good experiment has a…
1. Hypothesis: a prediction of the outcome of the experiment based on research and past experiences. It is what you predict your experiment will show. You make a hypothesis before you begin your experiment. It is usually in the form of an “If and then” statement. It is NEVER a question! Which of the following sentences represents a hypothesis?
a) Boil 100 mL of water, let it cool, then add 10 seeds to the water. b) Environmental conditions affect germination. c) Is the water depth in a lake related to available light in the water? d) A lamp, 2 beakers, and elodea plants are selected for the investigation.
Follow this suggested format for making your hypotheses whenever possible. IF the (insert independent variable here) increase OR decreases, THEN the (insert the dependent variable here) increase OR decreases OR remains the same. A variable is any factor that can influence an event or system. Variables can change or be changed. What are some variables that can affect the growth of a plant? Amount of Sunlight, amount of fertilizer, temperature, size of the pot its growing in, etc… 2. Dependent Variable: The part of the experiment that you are measuring and collecting data
on. The dependent variable always goes on the y-axis of your graph. 3. Independent Variable: It is the factor that the experimenter changes in the experiment. It usually causes the dependent variable to respond to that change. Amount of fertilizer is a common independent variable, and goes on the x-axis of your graph. The independent variable is
also called the experimental variable (because it is what you are testing or what the experiment is about). A good experiment only tests 1 variable at a time.
25
4. Control (Group): The setup or group in the experiment that does not include the variable that you are testing. The control is exposed to the same conditions as the experimental group except for the variable being tested. This setup is what you will compare your results from your experiment to. It is the standard or normal in an experiment. The control if very often thought of as the normal conditions for your test subjects. 5. Constants: The factors or conditions that are kept the same in your experiment. You can have many constants in an experiment. 6. Now let’s practice! For the following experiment, specify the independent and dependent variables and the constant(s)
Students of different ages were given the same puzzle to assemble. The puzzle assembly time was measured.
Independent variable: ages of the students Dependent variable: time to complete the puzzle________________ Constants: type of puzzle, amount of pieces in the puzzle____________________________
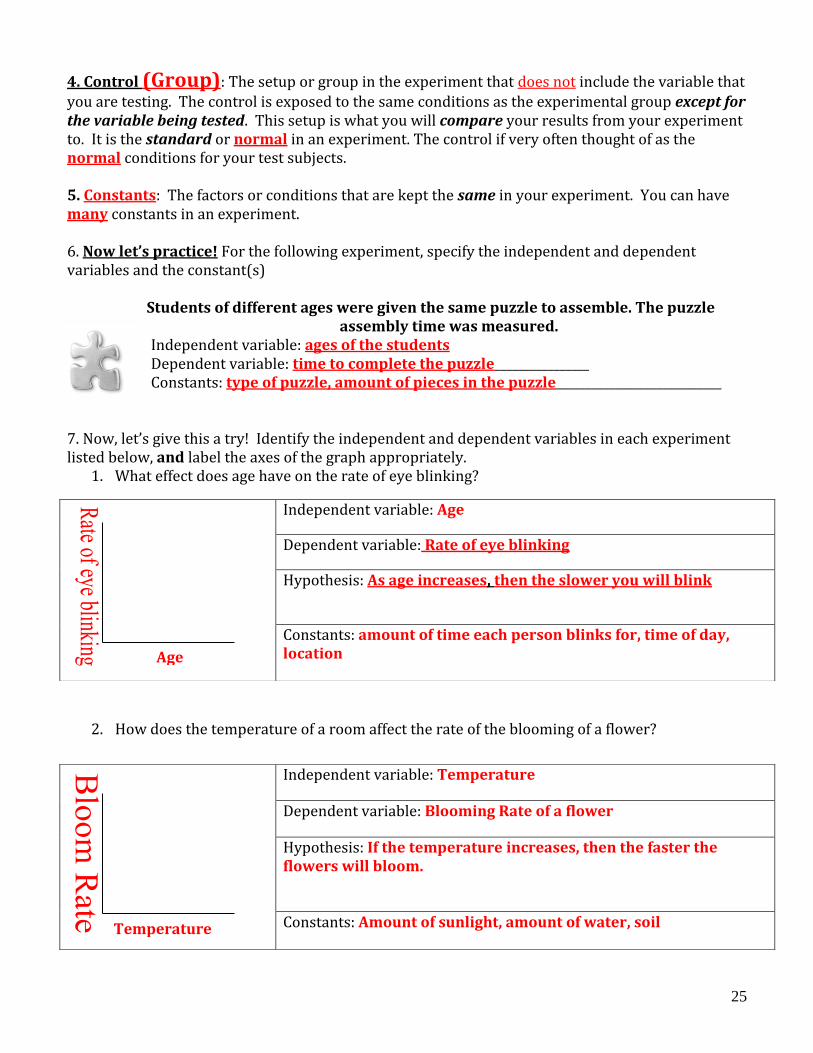
7. Now, let’s give this a try! Identify the independent and dependent variables in each experiment listed below, and label the axes of the graph appropriately.
1. What effect does age have on the rate of eye blinking?
2. How does the temperature of a room affect the rate of the blooming of a flower?
Independent variable: Age
Dependent variable: Rate of eye blinking
Hypothesis: As age increases, then the slower you will blink
Constants: amount of time each person blinks for, time of day, location
Independent variable: Temperature
Dependent variable: Blooming Rate of a flower
Hypothesis: If the temperature increases, then the faster the flowers will bloom.
Constants: Amount of sunlight, amount of water, soil
Age
Temperature
26
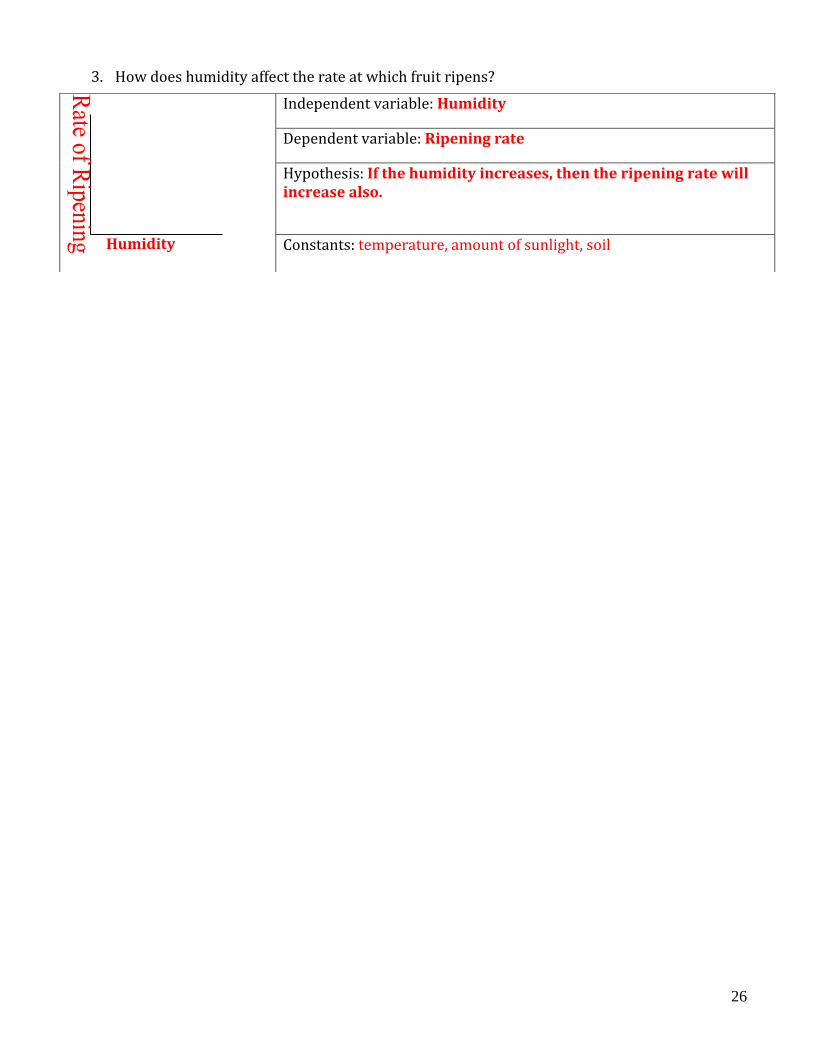
3. How does humidity affect the rate at which fruit ripens?
Independent variable: Humidity
Dependent variable: Ripening rate
Hypothesis: If the humidity increases, then the ripening rate will increase also.
Constants: temperature, amount of sunlight, soil
Humidity

27
Notes on What Makes a Good Experiment Unit Question: Why do humans create models? Content Question: What makes an experiment valid? AOI: Human Ingenuity We have already discussed the many factors that are important parts of a good experiment. They are:
A testable hypothesis (written as an If, and Then statement) An experiment group An independent variable (***Only One!) A control group Constants
But there are other important factors to consider when developing an experimental design.
1. Sample Size: how many subjects you are testing your variable on. It is the number of organisms you are using in your experiment.
A good experiment has a __LARGE__ sample size. A large sample size increases the
__VALIDITY___ of your experiment and conclusions. Validity is how accurate or true your conclusions are. If you have a large sample size, then the estimations, predictions or inferences that can be made from your data are more accurate! Also, there are sometimes factors outside of your control that may harm the organisms you are
testing. These might be: ___DISEASE, BAD GROWING SEASON, PREDATORS, ETC…__________ If you are only testing two plants and one dies, will your results be very accurate or valid?
_NO!!!_ 2. Ignore small differences in data
There is always some error in the data we collect. This is due to _HUMAN ERROR, FAULTY EQUIMENT_____
If your data shows a very slight difference, then often you should treat it as if there is _NO DIFFERENCE___, or that your results from all setups are the __SAME__.

28
3. No Bias: no prejudice, and having the ability to be fair. If you are bias,
you are not open-minded. Having bias _DECREASES___ the validity of your experiment. 4. Repeatable by peers: An experiment’s procedure should be written in a way that others can
re-perform it. This is done to make sure there are no _ERRORS___ in data, conclusions, and format or to check for bias.
5. Variety of tests subjects
Populations have variety therefore your test subjects should mimic (_COPY_) that variety, so
your results are more ___ACCURATE____. This _INCREASES_ the validity of your experiment.
However, sometimes an experiment is purposefully done on one specific type of organism, or one specific gender or age group!
6. More than one trial
Repetition of your experiment helps _INCREASE__the validity. This is because there is always
some amount of error in our observations. The ____MORE_ trials you do, the _LESS___chance you have of repeating a mistake. Therefore your data becomes more reliable.
7. Ethical: __WHAT SOCIETY THINKS IS “RIGHT” & “WRONG”___ An unethical experiment is usual one that is controversial. Some controversial topics related to
the living environment include: Cloning, mixing genetic material between species, GMO’s, etc 8. Conclusions must be supported by data A scientist can not draw conclusions based on data that does not exist. If they did, this would
_DECREASE___ the validity of the experiment. Now let’s try and see if we can find the errors in the experiments shown below. During a laboratory activity, a group of students obtained the data shown below.
1. Which procedure would increase the validity of the conclusions drawn from the results of this experiment? (1) increasing the number of times the activity is repeated (2) changing the temperature in the room (3) decreasing the number of students participating in the activity (4) eliminating the rest period before the resting pulse rate is taken
2. Complete the table by finding the Group Average for Pulse Rate at Rest.

29
3. In the United States, there has been relatively little experimentation involving the insertion of genes from other species into human DNA. One reason for the lack of these experiments is that (1) the subunits of human DNA are different from the DNA subunits of other species (2) there are many ethical questions to be answered before inserting foreign genes into human DNA (3) inserting foreign DNA into human DNA would require using techniques completely different from those used to insert foreign DNA into the DNA of other mammals (4) human DNA always promotes human survival, so there is no need to alter it 4. A student hypothesized that the pulse rate in humans would increase 1 hour after eating a meal. Pulse rates were obtained from nine classmates 1 hour after eating lunch. The data in beats per minute were recorded as: 60, 64, 56, 68, 72, 76, 72, 80, and 68. State one error in this experiment. __THEY DID NOT TAKE A RESTING PULSE RATE (PULSE RATE BEFORE EATING), NOT ENOUGH STUDENTS, NO CONTROL GROUP. ____ 5. Students were asked to determine if they could squeeze a clothespin more times in a minute after resting than after exercising. An experiment that accurately tests this question should include all of the following except (1) a hypothesis on which to base the design of the experiment (2) a large number of students (3) two sets of clothespins, one that is easy to open and one that is more difficult to open (4) a control group and an experimental group with equal numbers of students of approximately the same age 6. A science researcher is reviewing another scientist’s experiment and conclusion. The reviewer would most likely consider the experiment invalid if (1) the sample size produced a great deal of data (2) other individuals are able to duplicate the results (3) it contains conclusions not explained by the evidence given (4) the hypothesis was not supported by the data obtained 7. A student performed an experiment to determine if treating 500 tomato plants with an auxin (a plant growth hormone) will make them grow faster. The results are shown in the table below
Explain why the student can not draw a valid conclusion from these results. __NO CONTROL GROUP TO COMPARE____ 8. Reasons for conducting peer review include all of the following except (1) analyzing the experimental design (2) pointing out possible bias (3) identifying an illogical conclusion (4) changing data to support the hypothesis
9. Researchers performing a well-designed experiment should base their conclusions on (1) the hypothesis of the experiment (2) data from repeated trials of the experiment (3) a small sample size to insure a reliable outcome of the experiment (4) results predicted before performing the experiment
30
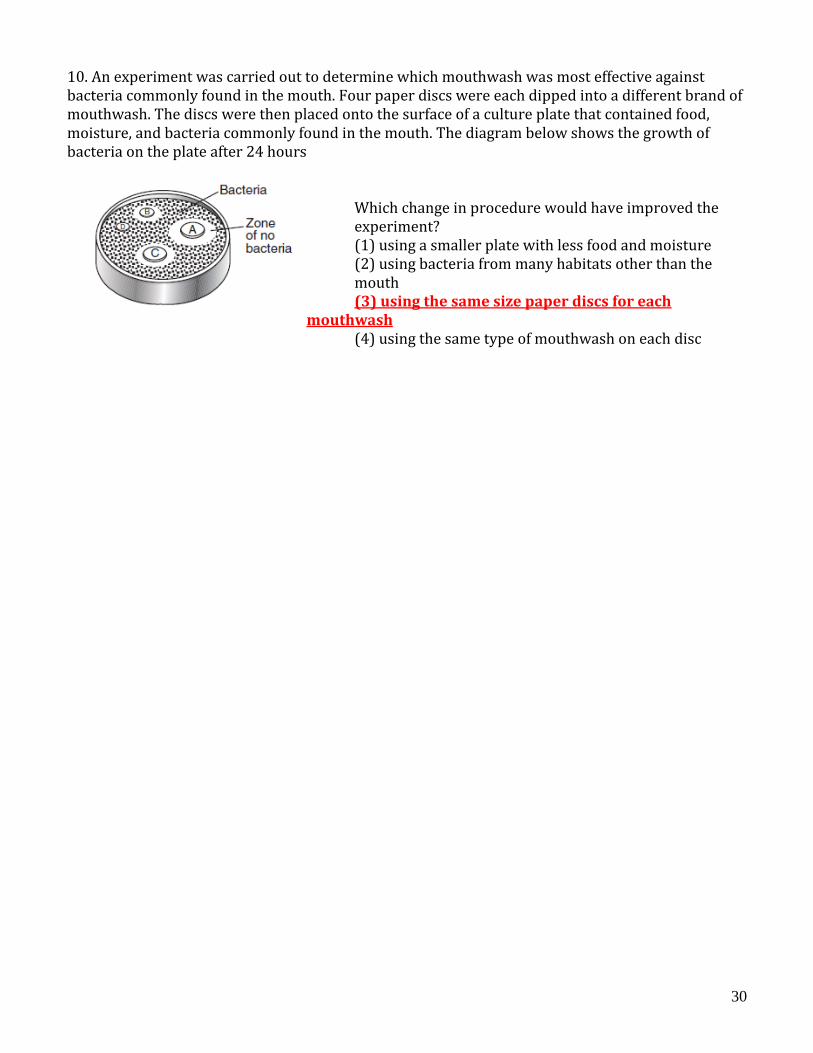
10. An experiment was carried out to determine which mouthwash was most effective against bacteria commonly found in the mouth. Four paper discs were each dipped into a different brand of mouthwash. The discs were then placed onto the surface of a culture plate that contained food, moisture, and bacteria commonly found in the mouth. The diagram below shows the growth of bacteria on the plate after 24 hours
Which change in procedure would have improved the experiment? (1) using a smaller plate with less food and moisture (2) using bacteria from many habitats other than the mouth (3) using the same size paper discs for each
mouthwash (4) using the same type of mouthwash on each disc
31
Name: _____________________________________ Date: ________________________
Homework/Classwork
Homework: Scientific Method
Directions: Answer the questions below based on your knowledge of the Living Environment. Record all answers in the space provided.
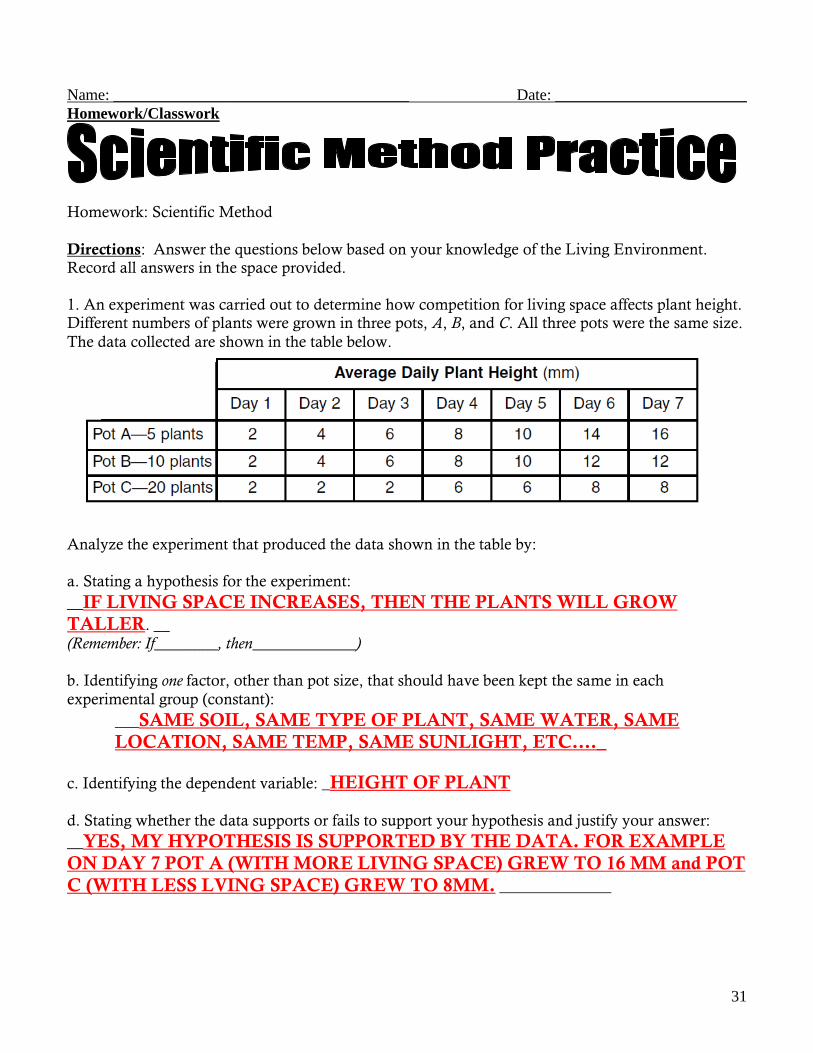
1. An experiment was carried out to determine how competition for living space affects plant height. Different numbers of plants were grown in three pots, A, B, and C. All three pots were the same size.
The data collected are shown in the table below.
Analyze the experiment that produced the data shown in the table by:
a. Stating a hypothesis for the experiment:
__IF LIVING SPACE INCREASES, THEN THE PLANTS WILL GROW
TALLER. __
(Remember: If________, then_____________)
b. Identifying one factor, other than pot size, that should have been kept the same in each
experimental group (constant):
___SAME SOIL, SAME TYPE OF PLANT, SAME WATER, SAME
LOCATION, SAME TEMP, SAME SUNLIGHT, ETC…._
c. Identifying the dependent variable: _HEIGHT OF PLANT
d. Stating whether the data supports or fails to support your hypothesis and justify your answer:
__YES, MY HYPOTHESIS IS SUPPORTED BY THE DATA. FOR EXAMPLE
ON DAY 7 POT A (WITH MORE LIVING SPACE) GREW TO 16 MM and POT
C (WITH LESS LVING SPACE) GREW TO 8MM. ______________

32
2. A scientist wants to determine the best conditions for hatching brine shrimp eggs. In a laboratory, brine shrimp hatch at room temperature in glass containers of salt water. The concentration of salt in
the water is known to affect how many brine shrimp eggs will hatch. Design an experiment to determine which of three saltwater concentrations (2%, 4%, or 6%) is best for hatching brine shrimp
eggs. In your experimental design, be sure to:
a. State how many containers to use in the experiment, and describe what would be added to each container in addition to the eggs:
___4 CONTAINERS: 2%, 4%, 6% SALTWATER SOLUTIONS AND ONE WITH 0%
SALTWATER AS A CONTROL GROUP. __________
b. State two factors that must be kept constant in all the containers:
___TEMPERATURE OF WATER (ROOM TEMPERATURE), SAME # OF EGGS, __
c. State what data must be collected during this experiment: ___NUMBER OF EGGS THAT
HATCH_
d. State one way to organize the data so that they will be easy to analyze: __USE A DATA TABLE
THAT LOOKS LIKE THE ONE BELOW _________________________
e. Describe a result that would indicate the best salt solution for hatching brine shrimp eggs: ___THE
SOLUTION THA HAS THE MOST EGGS HATCHING WOULD BE THE SOLUTION
THAT IS BEST.

33
Scientific Method Practice Homework
3. The diagram below illustrates the result of growing a garlic bulb in a cup of distilled water over five days.
Design an experiment consisting of a control and three different experimental groups to test the prediction, “Garlic grows better as the salt concentration of the solution in which it is grown
increases.” In your answer, be sure to:
• describe the control to be used in the experiment [1]
• describe the difference between the three experimental groups [1]
• state one type of measurement that should be made to determine if the prediction is accurate
[1]
• describe one example of experimental results that would support the prediction [1]
___THE GARLIC BULB GROWING IN A CUP OF DISTILLED
or NORMAL
WATER____________________________________________________________________
___THE CUPS WILL HAVE DIFFERENT CONCENTRATIONS
OF SALT WATER. FOR EXAMPLE 2%, 4%, AND 6%__
__HEIGHT OF THE LEAF______________________________
___THE HIGHEST CONCENTRATION OF SALTWATER (6%)
WILL GROW THE TALLEST.________
34
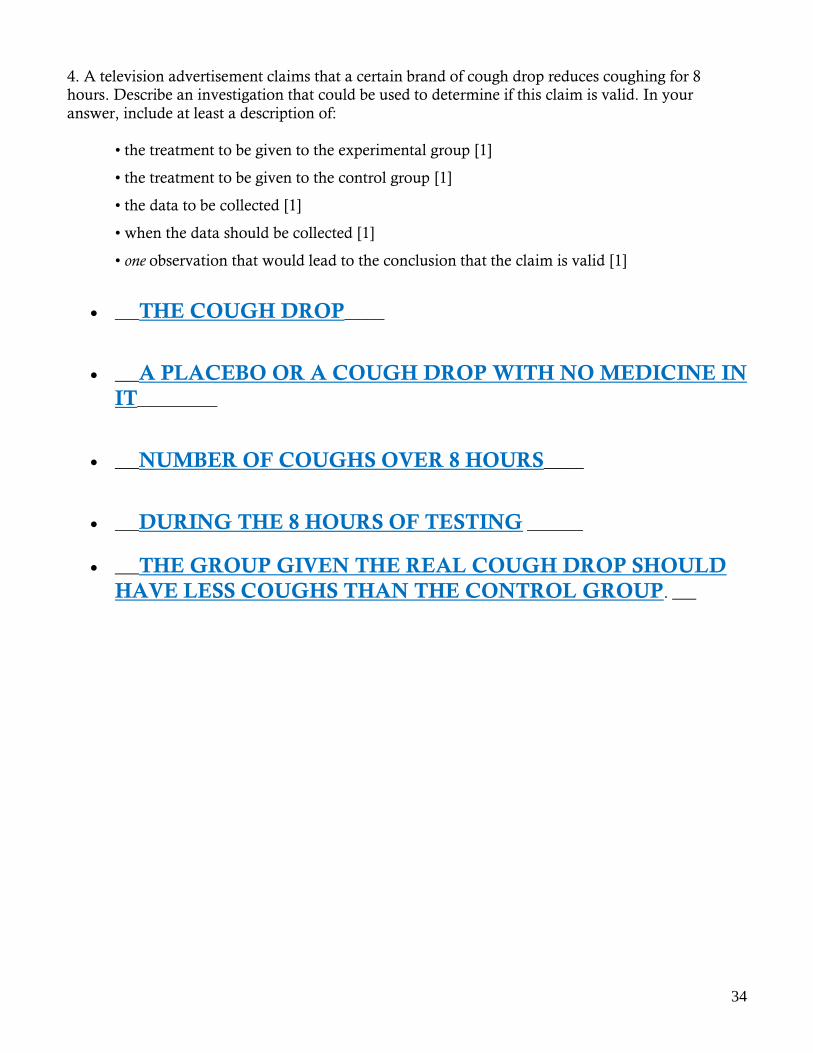
4. A television advertisement claims that a certain brand of cough drop reduces coughing for 8 hours. Describe an investigation that could be used to determine if this claim is valid. In your
answer, include at least a description of:
• the treatment to be given to the experimental group [1]
• the treatment to be given to the control group [1]
• the data to be collected [1]
• when the data should be collected [1]
• one observation that would lead to the conclusion that the claim is valid [1]
___THE COUGH DROP_____
___A PLACEBO OR A COUGH DROP WITH NO MEDICINE IN
IT__________
___NUMBER OF COUGHS OVER 8 HOURS_____
___DURING THE 8 HOURS OF TESTING _______
___THE GROUP GIVEN THE REAL COUGH DROP SHOULD
HAVE LESS COUGHS THAN THE CONTROL GROUP. ___

35
5. Which statement about the use of independent variables in controlled experiments is correct? (1) A different independent variable must be used each time an experiment is repeated.
(2) The independent variables must involve time.
(3) Only one independent variable is used for each experiment. (4) The independent variables state the problem being tested.
6. The development of an experimental research plan should not include a
(1) list of safety precautions for the experiment
(2) list of equipment needed for conducting the experiment (3) procedure for the use of technologies needed for the experiment
(4) conclusion based on data expected to be collected in the experiment
7. A biologist used the Internet to contact scientists around the world to obtain information about declining amphibian populations. He was able to gather data on 936 populations of amphibians,
consisting of 157 species from 37 countries. Results showed that the overall numbers of amphibians
dropped 15% a year from 1960 to 1966 and continued to decline about 2% a year through 1997.
What is the importance of collecting an extensive amount of data such as this? (1) Researchers will now be certain that the decline in the amphibian populations is due to
pesticides. (2) The data collected will prove that all animal populations around the world are threatened.
(3) Results from all parts of the world will be found to be identical.
(4) The quantity of data will lead to a better understanding of the extent
of the problem. 8. The first trial of a controlled experiment allows a scientist to isolate and test
(1) a logical conclusion (2) a variety of information
(3) a single variable (4) several variables