Embed Size (px)
Citation preview

1
INTRODUCTION TO MICROSOFT PROJECT 2007
CONTENTS
What is a Project ............................................................................................. 2
The Steps involved in Setting up a Project................................................... 3
Views................................................................................................................ 4
How To Start a new project ............................................................................ 6
The Gantt Chart............................................................................................... 8
Outlining/Summary tasks............................................................................. 10
Assigning Task Relationships ..................................................................... 13
Task Calendars ............................................................................................. 14
Resources...................................................................................................... 16
Resource Costs............................................................................................. 20
Calendars ...................................................................................................... 21
Scheduling with Resources ......................................................................... 23
Resource Overallocations............................................................................ 27
Deadlines and Task Constraints.................................................................. 30
Setting A Baseline ........................................................................................ 33
Tracking......................................................................................................... 35
Applying Filters & Sorting Data ................................................................... 38
Printing and Reports. ................................................................................... 39
Previewing and Printing Reports................................................................. 41

2
WHAT IS A PROJECT
A project is a well-defined sequence of events with an identifiable beginning and ending. A project is different from a process in that there is always a point when the project is complete and the goal has been met. The Need for Project Management
Project Management is the planning, organising and managing of tasks and resources to accomplish a defined objective, usually with the constraint of time and cost.
Project Management helps you to answer:
∗ How long the project will take.
∗ The impact on the overall project if a task is delayed.
∗ Which tasks are critical?
∗ Are sufficient resources allocated to the project to complete on time?
∗ The resource costs of the project.
∗ Is the project on schedule?
Project Management can be broken down into three phases:
Creating the project plan
Identifying the tasks to be completed and organising the resources available to complete the tasks.
Managing the project
Ensuring that the allocated resources complete the defined tasks on schedule and within budget
Progress reporting Producing reports on project progress.

3
THE STEPS INVOLVED IN SETTING UP A PROJECT
Critical Path Method (CPM)
This refers to a mathematical model that takes into account the relationships between tasks, their duration and any constraints regarding the availability of resources to identify which tasks are critical. A task is critical when its delay could effect the end date of the project.
Program Evaluation Review Technique (PERT)
A PERT chart, sometimes called a network chart, refers to the graphic representation of how the tasks are linked to one another. This chart is useful when it is more important to focus on the relationships between tasks rather than the time schedule.
Gantt Chart
Henry L Gantt developed a graphic charting system to depict activities across a time scale. The Gantt chart can be used in Microsoft Project to build a project as well as track and report it.
1. Set a schedule Create a workday and holiday schedule.
2. Define the project goals and determine what needs to be done.
Break the project into phases and subdivide phases into tasks.
Identify Project Milestones.
Estimate the duration of each task.
3. Determine the sequence of tasks.
Which tasks can be completed before others?
Which tasks can be completed at the same time?
Define task constraints.
4. Assign resources: Who is needed for each task?
What equipment is needed for each task?
What facilities are necessary?
5. Review the plan Verify the accuracy and completeness.
Circulate the plan for review.
6. Additional Planning Issues
Budget and cost constraints.
Who else needs project status information?
What are the consequences of missing deadlines?

4
VIEWS
A view is a format in which you enter and display information. The Gantt Chart view is the default view. It is made up of the Entry table on the left, used to enter task information and the Gantt chart on the right.
Views fall into three categories:
∗ Sheet views
∗ Chart and Graph views
∗ Form views
Views are displayed in single or combination format. A combination view displays any two single views together.
Changing Views
Project comes with 24 predefined views. You can use the View Menu to change views or the View bar located on the left side of the project window. The View Bar lists eight of the most commonly used view which are described below:

5
View Name Description
Calendar
A monthly calendar showing tasks and their duration's. Use this view to show the tasks scheduled in a specific week or range of months.
Gantt Chart
A list of tasks and related information and a chart showing tasks and their duration's over time. This is the most commonly used view to enter and schedule a list of tasks.
Network Diagram
A network diagram showing all tasks and task dependencies. Use this chart to create and fine-tune your schedule in a flowchart format.
Task Usage
A list of tasks showing assigned resources grouped under each task. Use this view to see which resources are assigned to specific tasks and to view resource work contours.
Tracking Gantt
A list of task and related information and a chart showing baseline and scheduled Gantt bars for each task. Use this view to compare the baseline and schedule with the actual
schedule.
Resource Graph
A graph showing resource allocation cost or work. Use this view to display information about a single resource or group of resources over time.
Resource Sheet
A list of resources and related information. Use this view to enter and edit resource information in a spreadsheet like format.
Resource Usage
A list of resources showing task assignments grouped under each resource. use this view to show cost or work allocation information over time for each resource per assignment and to set resource work contours.
More Views Opens the More Views dialog box which displays a list of every view available.

6
HOW TO START A NEW PROJECT
There are three activities that need to be completed before you enter individual project tasks:
1. Setting the Project Properties
2. Entering project working times and non working times
3. Setting the file properties
The Project Properties
If you don't enter a project start date or finish date, Microsoft Project automatically uses the current date as the start date.
1. From the Project Menu select Project Information
2. Enter a start date
To enter a start date
Type the date on which you want to start your project in the Start date box.
To enter a finish date Click Project Finish Date in the Schedule from box, and then type a finish date from which to schedule your project in the Finish date box. Tip: If your plans change, you can change your project information at any time by clicking Project Information on the Project menu.
Project uses the Current Date to calculate variances between baseline data and scheduled data unless there is a date in the Status Date field. The Calendar setting is used to change the Base calendar that Project uses to calculate how long the project will take to complete.

7
Setting File Properties
This is an optional activity but is useful because the options you enter can be used in header and footer details for printing and reporting
� Choose File, Properties
� The properties dialog box is displayed
� Enter text into the headings that you might wan to use later. You should a least enter the Title and Author.
Entering the project working times This involves setting the options and working times in the standard calendar that all other calendars use as a default.
� Choose Tools, Change Working Time
� Make sure that Standard project calendar is selected in the For drop down list.
� The default work times are 8am to Noon and 1pm to 5pm Monday to Friday, Fifty-two weeks of the year. Eight working hours per day with an hour for lunch.
� Change these settings to reflect you Organisations requirements. You do this by clicking the Details button to enter the working hours for the organisation as shown.
� Click the Exceptions tab to enter the non-working time for the company. EG: Public holidays.
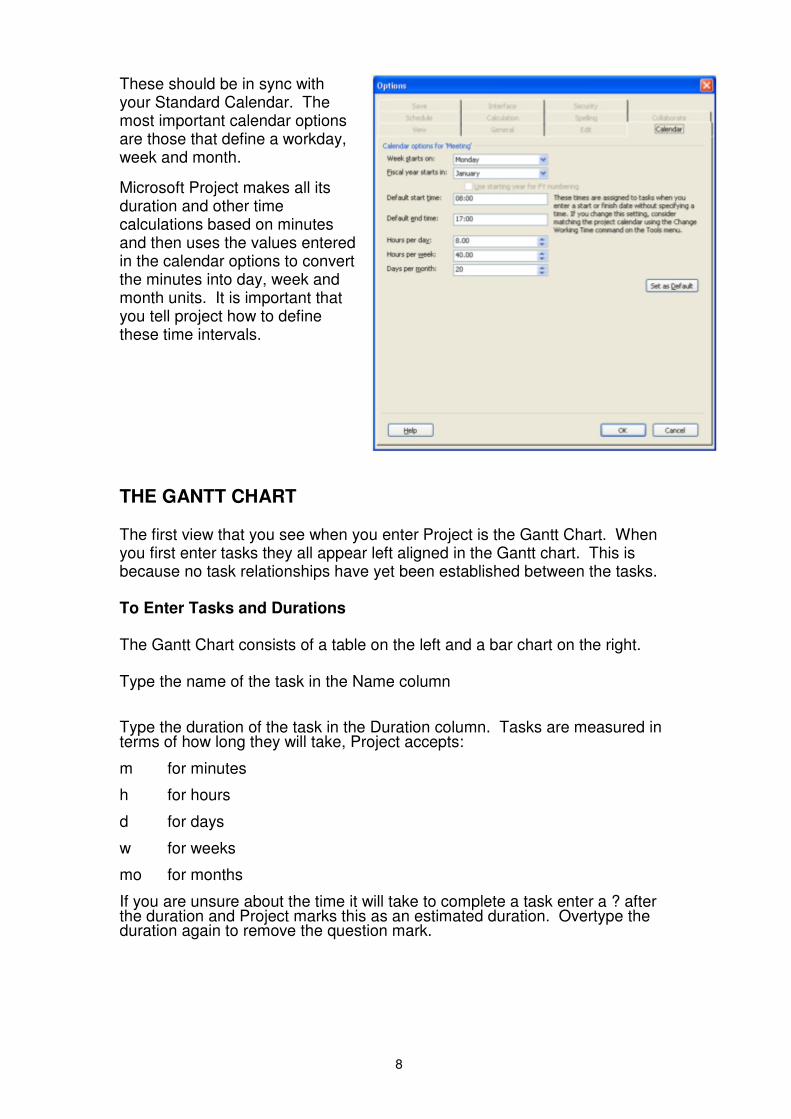
� Click on the Options button to make any changes to the Calendar options. Important to set these as you need to tell how many hours in the working day, week and month.
8
These should be in sync with your Standard Calendar. The most important calendar options are those that define a workday, week and month.
Microsoft Project makes all its duration and other time calculations based on minutes and then uses the values entered in the calendar options to convert the minutes into day, week and month units. It is important that you tell project how to define these time intervals.
THE GANTT CHART The first view that you see when you enter Project is the Gantt Chart. When you first enter tasks they all appear left aligned in the Gantt chart. This is because no task relationships have yet been established between the tasks. To Enter Tasks and Durations The Gantt Chart consists of a table on the left and a bar chart on the right. Type the name of the task in the Name column
Type the duration of the task in the Duration column. Tasks are measured in terms of how long they will take, Project accepts:
m for minutes
h for hours
d for days
w for weeks
mo for months
If you are unsure about the time it will take to complete a task enter a ? after the duration and Project marks this as an estimated duration. Overtype the duration again to remove the question mark.

9
Applying Elapsed Duration Elapsed duration is a type of duration that you can use when the activity or task continues around the clock, irrespective of the workday hours. For example, a ship carrying parts to a manufacturing plant doesn’t stop sailing at the end of the day. If it takes 14 hours for the ship to sail from one port to another you can enter 14eh, where the e indicates elapsed duration.
Milestones
Tasks with duration of Zero are set as milestones. Milestones usually represent the completion of an event, phase or other measurable goal within the project. When duration is entered as zero the Gantt bar changes to a diamond shaped marker.
Critical Tasks
A critical task is defined as a task, which if delayed, will delay the end date and time of the project. Critical tasks are shown as a red bar on the Gantt Chart.
Non Critical Tasks
A non-critical task is defined as a task, which if delayed, will not have an affect on the project end date.
To Widen the Task Column
If the name of the task is too long to display in the Name column: Move the mouse until it is on the vertical line between the Name and Duration titles. The mouse pointer will change to a double-headed arrow. Drag the mouse to the right to increase the column width or double click when the double-headed arrow appears and the column width is automatically resized to best fit the contents Moving Around the Table
The vertical scroll bar can be used to view up and down through the task list. To go to a specific task or different date press F5 and enter the required date or task number. The keyboard direction arrows can also be used to move to specific tasks. Ctrl+Home will move you to the first task on the list.

10
Recurring Tasks
A recurring task is a task that occurs repeatedly within a project.
This could be a weekly meeting, a status report or regular inspections. Instead of typing the task repeatedly within a schedule a recurring task needs only be entered once. A recurring task can be set to repeat daily, weekly, monthly or yearly
1 Click in the task name for the task that you want the recurring task to appear above.
2 Select Insert, Recurring Task.
3 Fill in the appropriate details
OUTLINING/SUMMARY TASKS Projects can be broken down into manageable portions by either using outlining to split tasks into logical groups, or you can create sub-projects, which can be set up as different tiles but linked to the main project. Sub-Projects are detailed as a separate section later in this manual. When you create your project you will have Phases, known as summary tasks and the tasks needed to complete those phases, known as subordinate tasks. Summary tasks are descriptive headings, subordinate tasks are details. A summary task is completed only when all the subordinate tasks have been completed.
Icon Description
Outdent
Outdents a task to a higher level.
Indent
Indents a task to a lower level. Indenting creates a summary task above.
Show Subtasks
Expands a summary task.
Hide Subtasks
Collapses a summary task.
Show
Select the outline level that you want to display or select the top option to show all tasks.

11
You can have up to 65,000 levels on outline mode. When you use the Edit Cut or Edit Copy commands to move a summary task, all of its subordinate tasks are moved with the summary task. If you want to move only the summary task, promote the subtasks first. Summary Task Summarises the cost, work and schedule information of the other tasks showing the total duration between the starting point of the earliest task and the finish of the latest task for the five subordinate tasks. Subtasks Any tasks that have been demoted below a summary task. Formatting an Outline The Tools, Options, View tab allows you to control how the outline is displayed on the Task sheet.
If a check appears in the box, the option is turned on. Click in the required box to turn the option on or off.
Show Summary Tasks The display of summary tasks can be turned on or off
Indent Name Name indented to reflect their outline levels.
Show Outline Number Outline numbers are used to represent the task’s position within the outline. The numbering system used is similar to the numbers used in legal documents or procedure manuals.
Show Outline Symbol Shows a + symbol if there are tasks that are not being displayed below the current outline level. Shows a – symbol to indicate all levels are displayed.
Project Summary Task Inserts a Task a task with an ID of 0 and the name of the project at the top of the task list.

12
Reorganising Summary Tasks When you move a summary task Microsoft Project moves all of its subordinate tasks
To Move a Summary Task
• Select the row containing the summary task by clicking on the row number preceding the name of the task.
• Select Edit, Cut.
• Select the row where you want to move the summary task to. • Select Edit, Paste Collapsing and Expanding an Outline One of the most useful features of outlining is that you can collapse or expand summary tasks to hide or display their subordinate tasks to control the amount of detail that displays on the screen or for printing the project. When collapsed, the tasks still exist in your project. Collapsing and expanding only affects the tasks you see on your computer screen.
To Collapse Part of an Outline
Select the summary task or tasks that you want to collapse.
Click on the Collapse button or double click on the ID number of the summary task.
To Expand Part of an Outline
Select the summary task or task that you want to expand.
Click on the Expand button or double click on ID number of the summary task.
To Expand the Outline for the Entire Project
Click on the Show All subtasks button

13
ASSIGNING TASK RELATIONSHIPS Microsoft Project lets you set up task relationships so that you can make one task’s start or finish date dependant upon another task’s start or finish date. A task that must be started or finished before another task can begin is called a predecessor task. A task that can only start or finish after another task has finished is called the successor task. Task Relationships
FS Finish to Start Task A
Task B
SS Start to Start Task A
Task B
FF Finish to Finish Task A
Task B
Linking Tasks with a Finish to Start Relationship Select the tasks to be linked and choose Edit, Link Tasks or click on the Link button on the standard toolbar. This links the tasks with a finish to start relationship. Lead and Lag You may wish to build in lead and lag times into your plan. In a finish to start relationship, an overlap between tasks is called a lead-time and a gap or time delay between two tasks is called a lag. Lead times are entered as negative numbers. To Enter Task Relationships in the Task Form Fields To display the Task form quickly, double click on the horizontal split bar on the vertical scroll bar.
Select the task to which you want to assign a predecessor on the Gantt Chart.
Click the Predecessor ID field at the bottom of the Task Form.
Type the predecessor task ID number.

14
If you want a task relationship other than finish to start, type the abbreviation in the Type field. If you want to add a lead or lag time, enter it in the Lag field. If you want a one day gap between one task starting and one task finishing enter 1d. If you want a one day overlap between two tasks enter –1d.
TASK CALENDARS By default, your tasks are scheduled by the project calendar. Task calendars define unique or specific exceptions for scheduling individual tasks, such as machinery that runs during nonworking time. Create a calendar for a task
1 On the Tools menu, click Change Working Time.
2 Click New.
3 In the Name box, type a name for your new calendar.
4 To begin with a default calendar, click Create new base calendar.
To create a new base calendar based on an existing calendar, click Make a copy of, and then click the calendar name in the calendar box.
5 Click OK
6 Make the required changes to the calendar:
� To change the calendar on specific days. Click the Details button and select the days on which you wish to make the change.
� To select nonadjacent days, hold down CTRL and click the days.
� To select adjacent days, hold down SHIFT and click the first and last day for the calendar change.
� Under Set selected date(s) to, click Use Default, Nonworking time, or Nondefault working time.

15
To Assign a Calendar to a Task
1 On the View menu, click Gantt Chart.
2 In the Task Name field, double click the task to which you want to assign a calendar.
3 Click the Advanced tab.
4 In the Calendar box, click the calendar you want to use for the task.
5 Select the Scheduling ignores resource calendars check box to have the task calendar ignore all resource calendars if applicable.
� If you choose to have Microsoft Project ignore resource calendars, a task will be scheduled even if resources assigned to the task have nonworking time set in their resource calendar.
Assign a calendar to a recurring or summary recurring task
In the Task Name field, double click the recurring or summary recurring task to which you want to assign a calendar.
Click Recurring Task Information
In the Recurring Task Information dialog box, click the calendar you want to assign to the recurring task in the Calendar box. Select the Scheduling ignores resource calendars check box to have the task calendar override all resource calendars if applicable.
The duration of a task is based on the combination of the standard, resource, or task calendar assigned.

16
RESOURCES
A resource can be any item, place or person necessary to completing the task. A task might require a single resource or multiple resources to be completed.
Resource names can be generic or specific in their description. For example a resource that performs administrative duties could be called Admin Assistant or Pat Robins. How you name your resources depends on the project and the scheduler's preference but whatever method you choose make sure you are consistent. For example, the resource John is only one resource, whilst the resource Mechanic could be one person or a team.
When a resource is assigned to a task a single unit or 100% is entered into the Max units field. This can be changed if you are entering a team as a single entry. You can enter a value of less than 100% if you wish. You can assign a single unit, partial unit or multiple units of a resource to a task but you shouldn't assign more units of a resource than you have available in the project.
Material Resources
Material resources are materials consumed in the completion of a task as opposed to equipment used to complete a task.
Entering Resources
You can enter resources in several different locations. The two most common locations are the Assign Resources dialog box and the Resource Sheet.
Assign Resource Dialog Box
• Click on the Assign Resources button and the Assign Resources Dialog box appears.
• Type the name of the resource in the name box and press Enter to move to the next row.
• Type the next name in the next row and repeat until you have entered all the required resources.
• Click Close.
17
The Resource Sheet
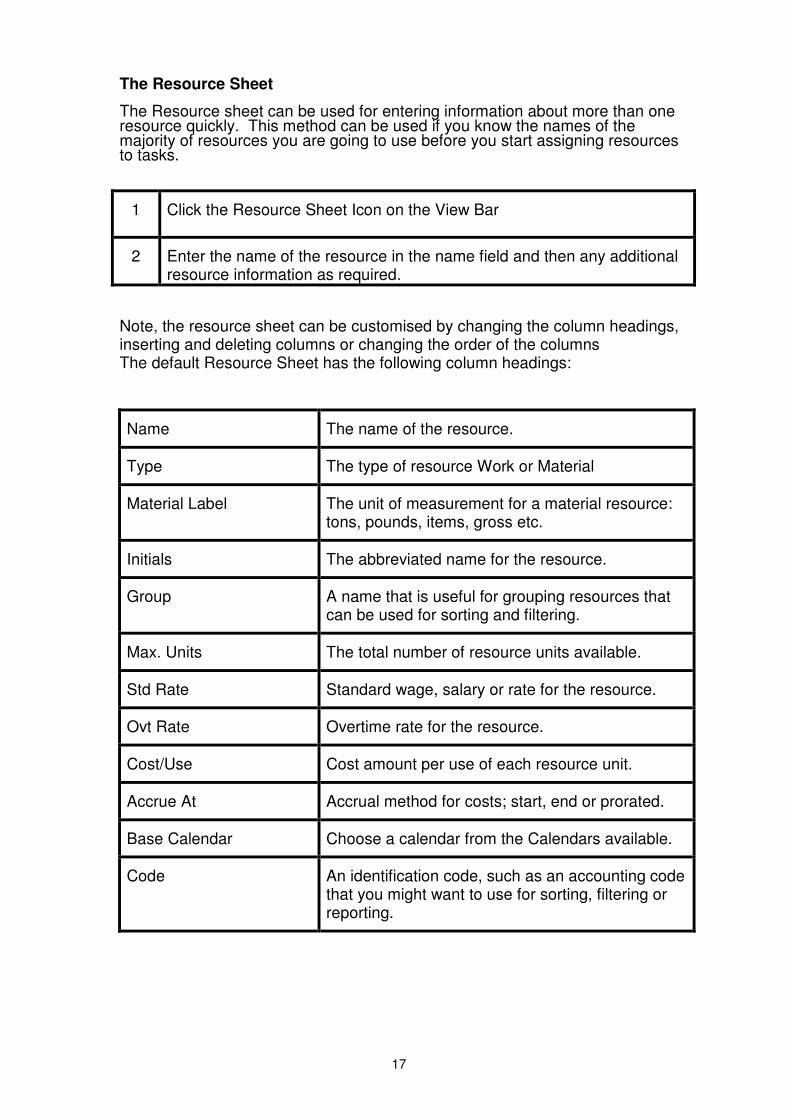
The Resource sheet can be used for entering information about more than one resource quickly. This method can be used if you know the names of the majority of resources you are going to use before you start assigning resources to tasks.
Note, the resource sheet can be customised by changing the column headings, inserting and deleting columns or changing the order of the columns The default Resource Sheet has the following column headings:
Name The name of the resource.
Type The type of resource Work or Material
Material Label The unit of measurement for a material resource: tons, pounds, items, gross etc.
Initials The abbreviated name for the resource.
Group A name that is useful for grouping resources that can be used for sorting and filtering.
Max. Units The total number of resource units available.
Std Rate Standard wage, salary or rate for the resource.
Ovt Rate Overtime rate for the resource.
Cost/Use Cost amount per use of each resource unit.
Accrue At Accrual method for costs; start, end or prorated.
Base Calendar Choose a calendar from the Calendars available.
Code An identification code, such as an accounting code that you might want to use for sorting, filtering or reporting.
1 Click the Resource Sheet Icon on the View Bar
2 Enter the name of the resource in the name field and then any additional resource information as required.

18
Assigning Work Resources 1 Select the task you want to assign a resource or resources to. 2 Click on the Assign Resources button and the assign resources dialog box appears 3 Select the required resource and click assign. 100% of that resource is assigned by default. You can change the percentage assignment, if you wish, in the Units field. Note you can select more than one resource by clicking and dragging over the required resource names or by holding down the CTRL key whilst you click on each required resource to make multiple selections You can assign one resource to more than one task by selecting all of the required tasks before you click on the assign button on the Resource Assignment dialog box. Assigning Material Resources Assigning Variable Material Consumption Variable material consumption is used when material consumption is increased as the task duration changes. They are assigned at an amount per time. For example, if you were assigning fuel for a generator the amount of fuel used would be dependant upon the length of time the generator was need for. If the generator uses an average of 2 litres per hour then when the fuel was assigned to a task you would enter 2/h in the units field for the fuel. The suffixes /m /h /d/ /w or /mon can be used to indicate time usage. Assigning Fixed Material Consumption This method assumes that the amount consumed is not related to the duration of the task. For example, you may have ordered a fixed amount of Topsoil for a landscaping project which is not dependant upon how long it will take to distribute the topsoil. When you assign a fixed amount of material to a task you just enter the number of units that will be consumed on the task.

19
The Resource Information Dialog Box (General) Double click on any resource name and the Resource Assignment dialog box appears
You can use this box to enter the following additional resource information:
Email Type in the Email box to specify the e-mail address for the resource.
Workgroup Select an option from the Workgroup box to specify the workgroup communication method used for the resource.
Available From and To dates
Click From and then type dates in the From and To boxes to specify a range of dates that the resource is available for the project. If a resource is assigned to tasks outside of these dates, then Microsoft Project indicates that the resource is overallocated.

20
RESOURCE COSTS
There are two types of costs in MS Project, resource costs and fixed costs.
Each resource or task can have a cost associated with it.
Resource costs can be accrued in several ways. They can be prorated by the hour or accrued at the end or the start of the task and an hourly rate might change during the duration of the project.
A resource might also have a different hourly rate for different types of work.
The resource sheet can be used to enter basic cost information.
To enter additional resource cost information use the Costs tab in the Resource Information Dialog box.
The Resource Information Dialog Box (Costs)
Using variable resource rates you can track changes over time in a project. Variable resource rates are time stamped so that new rates are applied to the project at the appropriate time. You can enter up to 25 different resource rate changes in each of the five cost rate tables to support increases or decreases to the resource cost rates.
By default, resources are assigned to tasks using the cost rate from table A. You can change the table in the Assignment Information dialog box. Rate changes can be entered as either a percentage or a number.
The new rate is calculated by adding the old rate plus the percentage of the old rate. A negative percentage calculates a decrease from the old rate.

21
The Assignment Information Box
1 Select the Task Usage view form the view bar.
2 Double click on the Resource name that you want to change the cost table allocation and the Assignment Information Box appears.
3 Click the Cost Rate Table down arrow and select the appropriate table
CALENDARS
Calendars define the working and non-working time for the project and for each resource assigned in the project.
As a change is made in the calendar Project automatically reschedules all tasks affected by the change.
There are two types of calendars, base calendars and resource calendars.
Base calendars define the working day for the project or a set of resources.
Resource calendars define the working days and working hours for a specific resource.
The default base calendar is called Standard. When a resource is added to a project a copy of the standard calendar is copied to create a resource calendar for each resource.
Project comes with two other base calendars; the 24 hour and Nightshift calendars. You can also create new base calendars for groups of resources.
Project has some default calendar options such as default start time and hours per day. These options are used to assign dates to tasks when no date or time is specified.
If changes are made to the default calendar options then the base calendar will need to be updated with those changes.
If the calendar options and base calendar do not reflect the same basic information then you might get a conflict between task and resource assignments.

22
The Calendar Options
To view or change the default settings for the calendar options:
1. Select Tools, Options.
2. Click the Calendar Tab.
3. The default calendar options are displayed.
The Base Calendar
Base calendars specify the basic working days, hours and holidays for the entire project or for a group of resources. The standard Project calendar is set as follows: Monday to Friday, 08:00 - 17:00, one hour for lunch, no holidays. Tools, Change Working Time, allows you to modify the base calendar. You can select from the list of current calendars or create a new Base Calendar To Edit A Base Calendar
1 To change a day for the entire calendar, select one or more day titles across the top of the calendar.
2 To change a specific day or days click and highlight the required days below the day titles.
3 To specify a day as a working day click the required day and click on working option button.
4 To specify a day as non working click the required day and click on non working option button.
To Edit a Resource Calendar
Resource Calendars are used to track the availability of individual resources. Because a resource calendar begins as a copy of the base calendar assigned to the resource, only exceptions for that particular resource should be entered into the resource calendar. Changes to a resource calendar might include holidays, training or meetings. A resource calendar for equipment might include scheduled maintenance or downtime for cleaning.
Resource calendars are edited in the same way as base calendars. Resource calendars are available in the Tools, Change Working Time dialog box or on the Working Time tab in the Resource Information dialog box.

23
Creating a New Base Calendar
Assigning Resources to different Base Calendars Base Calendars can be assigned to resources on the Resource Sheet or in the Change Working Time tab in the Resource information dialog box. If changes have been made to a resource calendar and then a new base calendar is assigned, the resource calendar changes remain in effect.
SCHEDULING WITH RESOURCES Effort Driven Scheduling
When you assign or remove people from a task, Microsoft Project will extend or shorten the duration of the task to accommodate the additional or fewer resources applied to the task—but it will not change the total work for the task. This is called effort-driven scheduling and is the default Microsoft Project uses to make resource assignments. As resources are added to a task, the total work on the task stays the same. The amount of work distributed to the resources assigned to the task, however, will change
Effort-driven scheduling applies only to resources being added to or removed from a task. It does not apply to Microsoft Project's calculation rules when changing work, duration, and unit values for resources already assigned to tasks. When working with effort-driven scheduling, keep the following in mind:
1 Select Tools, Change Working Time
2 Click New.
3 The create new base calendar dialog box appears. Type the name of the calendar in the Name field.
4 You can either create a new base calendar or make a copy of the existing base calendar.
5 Click OK
6 A new calendar appears for the name you specified. Make the appropriate changes
24
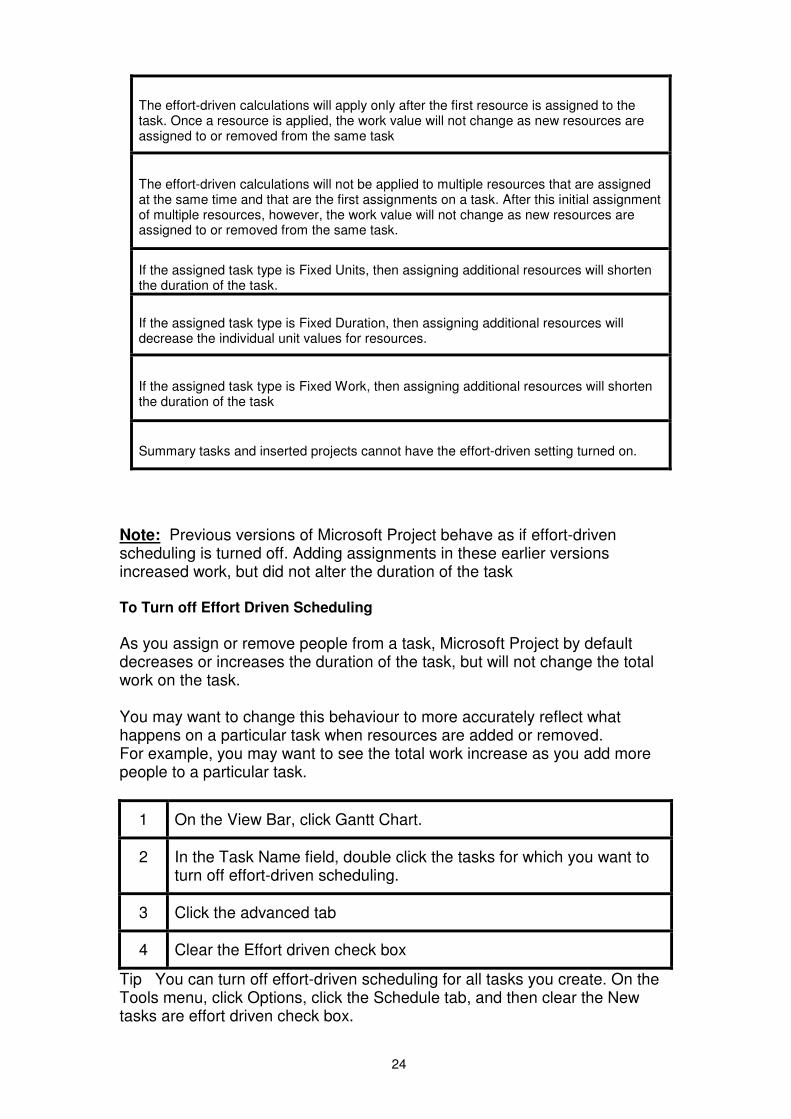
The effort-driven calculations will apply only after the first resource is assigned to the task. Once a resource is applied, the work value will not change as new resources are assigned to or removed from the same task
The effort-driven calculations will not be applied to multiple resources that are assigned at the same time and that are the first assignments on a task. After this initial assignment of multiple resources, however, the work value will not change as new resources are assigned to or removed from the same task.
If the assigned task type is Fixed Units, then assigning additional resources will shorten the duration of the task.
If the assigned task type is Fixed Duration, then assigning additional resources will decrease the individual unit values for resources.
If the assigned task type is Fixed Work, then assigning additional resources will shorten the duration of the task
Summary tasks and inserted projects cannot have the effort-driven setting turned on.
Note: Previous versions of Microsoft Project behave as if effort-driven scheduling is turned off. Adding assignments in these earlier versions increased work, but did not alter the duration of the task To Turn off Effort Driven Scheduling As you assign or remove people from a task, Microsoft Project by default decreases or increases the duration of the task, but will not change the total work on the task. You may want to change this behaviour to more accurately reflect what happens on a particular task when resources are added or removed. For example, you may want to see the total work increase as you add more people to a particular task.
1 On the View Bar, click Gantt Chart.
2 In the Task Name field, double click the tasks for which you want to turn off effort-driven scheduling.
3 Click the advanced tab
4 Clear the Effort driven check box
Tip You can turn off effort-driven scheduling for all tasks you create. On the Tools menu, click Options, click the Schedule tab, and then clear the New tasks are effort driven check box.

25
Task Types
The task type Fixed Unit is the default task type in Project. When resources are added or removed from a fixed unit task the duration of the task is generally affected. However, designating a task as effort-driven or adding or removing resources determines the true effect on the tasks duration. Example
Task X has a duration of 2 weeks, an initial resource assignment of one unit of Resource A, and total work of 80 Hours. The following table describes how a Fixed unit task accommodates resource and scheduling method changes after the initial assignments:
Fixed Unit - Effort Driven Duration Units Work
Add one unit of same Resource A 1 Week 200% Resource A 40 Hours Each
80 Hours Total
Add one unit of different resource B 1 Week 100% Resource A
100% Resource B
40 Hours
40 Hours
80 Hours Total
Fixed Unit - Without Effort Driven Duration Units Work
Add one unit of same Resource A 1 Week 200% Resource A 80 Hours Each
160 Hours Total
Add one unit of different resource B 2 Weeks 100% Resource A
100% Resource B
80 Hours
80 Hours
160 Hours Total

26
Modifying a Fixed Duration Task
If a task has a fixed duration then the duration remains the same when resources are added or removed.
The resource units or the total hours are affected on a fixed duration task depending on the scheduling method as illustrated below.
Example
Task X has a duration of 2 weeks, an initial resource assignment of one unit of Resource A, and total work of 80 Hours.
The following table describes how a Fixed unit task accommodates resource and scheduling method changes after the initial assignments
Fixed Duration - Effort Driven Duration Units Work
Add one unit of same Resource A 2 Weeks 200% Resource A
80 Hours Each
160 Hours Total
Add one unit of different resource B 2 Weeks 50% Resource A
50% Resource B
40 Hours
40 Hours
80 Hours Total
Fixed Duration - Without Effort Driven
Duration Units Work
Add one unit of same Resource A 1 Week 200% Resource A
80 Hours Each
160 Hours Total
Add one unit of different resource B 2 Weeks each
100% Resource A
100% Resource B
80 Hours
80 Hours
160 Hours Total
Modifying a Fixed Work Task
If a task has the task type Fixed Work, the total work for the task remains the same when resources are added or removed. The duration and the resource units are affected on a Fixed Work task. A Fixed Work task must be effort driven.

27
Example
Task X has a duration of 2 weeks, an initial resource assignment of one unit of Resource A, and total work of 80 Hours. The following table describes how a Fixed unit task accommodates resource and scheduling method changes after the initial assignments:
Fixed Work - Effort Driven Duration Units Work
Add one unit of same Resource A 1 Week 200% Resource A
40 Hours Each
80 Hours Total
Add one unit of different resource B 1 Weeks 100% Resource A
100% Resource B
40 Hours
40 Hours
80 Hours Total
How to Change the Task Type
1 Select View, More View and apply the Task Entry View.
2 The Gantt Chart is displayed in the top pane and the task form in the bottom pane.
3 Select the task that you want to change and click on the down arrow beside Task Type on the Task Form.
4 Select the appropriate Task Type.
RESOURCE OVERALLOCATIONS A resource conflict occurs when a resource is scheduled to perform more work than the resource can accomplish in the available working time.
Viewing Resource Workloads and Task Assignments Viewing resource workload helps to identify to what extent a resource is overallocated or underallocated. When a Resource is overallocated the resource text is highlighted in red and in a resource view a levelling indicator is displayed. Use the Resource Usage view and Resource Allocation view to identify and resolve resource overallocations. The resource management toolbar provides tools for resolving resource overallocation as well as assigning resources. The following table describes the buttons on the Resource Management toolbar.

28
Button Description
Resource Allocation View Displays the Resource Allocation view with the Resource Usage View in the top pane and the levelling Gantt in the bottom
Task Entry View Displays the Task Entry view which consists of the Gantt Chart view in the top pane and the Task Form view in the bottom pane.
Go To Next Overallocation Moves to the next overallocation
Assign Resources Opens the Assign Resources dialog box.
Share Resources Displays the Share Resources dialog box where resources can be made available to other projects.
Update Resource Pool Updates the project resource pool.
Address Book Displays the E-Mail address book for locating resources.
Resource Details Displays the Properties dialog box for the selected resource.
Using Resource Filters for a resource's task with the Using Resource filter.
Leveling Help Displays a set of procedures for leveling resources.
Leveling Resource Conflicts
Leveling is a strategy used to resolve resource overallocations by delaying or splitting tasks. Project examines overallocations by looking at task dependencies, slack time, dates, priorities, and constraints and determines if a task can be delayed or split to resolve a resource conflict.
To Display the Resource Leveling Dialog Box
From the Tools menu, select Level Resources
There are three setting areas in the Resource Leveling dialog box:
Leveling Calculations Area
Leveling Range
Resolving Overallocations Area

29
Leveling Calculations Area
Project can be set to manually or automatically perform leveling and search for overallocations based on a time period.
Leveling Range
Entire Project - level the entire project range which is the default Specified Date Range - tasks that occur in the specified date range. Resolving Overallocations Leveling Order
ID Only checks tasks in ascending order by task ID number
Standard checks tasks in order of predecessor dependencies, slack times, dates, priority and then constraints
Priority Standard checks task priority order first, predecessor dependencies, slack times, dates and then constraints
Level Only Within Available Slack levels only those tasks that will not affect the project finish date.
Leveling can adjust individual assignments on a task
levels a resource independent of any other resource working on a task.
Leveling can create splits in remaining work
interrupts tasks by creating splits in the remaining work on tasks or resource assignments.
Manual performs leveling only when the Level Now button is clicked.
Automatic performs leveling as changes are made to the schedule.
Look for overallocations on a ... Basis
tasks are considered overallocated if the total assigned work exceeds the total work hours for the specified block of time.
30
The Leveling Gantt View
From the View menu, more views, levelling Gannt Bars that represent changes made to tasks and resource assignments during leveling are displayed in this view. Green Gantt bars indicate the scheduled start and finish dates for a task before leveling occurred. Blue Gantt bars represent the newly scheduled start and finish dates for tasks after leveling occurred. The olive lines indicate delay and the aqua lines indicate slack. To Remove the last leveling operation To remove the last leveling operation click go to Tools Menu, Level Resources, clear Leveling. You can do this for the entire project or just the selected tasks. Manually Resolve Resource Overallocations Using Project to perform leveling operations might not always be enough to completely resolve all the resource conflicts in a project. Some suggestions for manual leveling are as follows:
Increase the maximum units of the resource Reschedule the task that has created the overallocation
• Add overtime
• Adjust dependencies or constraints
• Remove the resource if it isn't important to the task
• Replace the resource with another resource
• Make calendar adjustments to extend the working days and hours for the project or resource.
• Decrease the amount of work assigned to the resource.
DEADLINES AND TASK CONSTRAINTS
When a task is first entered into Project the task start date is the project start date.
After tasks are linked and resources are assigned Project sets start and finish dates based on task dependencies and resource availability.
This is the most effective way of scheduling because it incorporates flexibility. But, the projects need to reflect real life constraints.
A constraint is a restriction imposed on the start or finish date. Constraints can be applied to a task by using the Advanced Tab on the Task Information dialog box.

31
Flexible Constraints
Constraint Description Flexible For
As Soon As Possible Starts the task as soon as possible based on other constraints and dependencies.
All projects
As Late As Possible Starts the task as late as possible based on other constraints and dependencies.
All projects
Finish No Earlier Than
Finish the task on or after an entered date
Projects scheduled from a start date.
Start No Earlier Than Starts the task on or after an entered date.
Projects scheduled from a start date.
Finish No Later Than Finishes the task on or before an entered date
Projects scheduled from a finish date
Start No Later Then Starts the task on or before an entered date.
Projects scheduled from a finish date.
Inflexible Constraints
Inflexible constraints are tied to a particular date and should be used less often because they take flexibility away from the schedule. The following table describes the types of constraints and when they are inflexible:
Constraint Description Inflexible For
Finish No Earlier Than
Finishes the task on or after an entered date.
Projects scheduled with a finish date.
Start No Earlier Than Starts the task on or after an entered date.
Projects scheduled from a finish date.
Finish No Later Than Finishes the task on or before an entered date
Projects scheduled from a start date
Start No Later Then Starts the task on or before an entered date.
Projects scheduled from a start date.
Must Finish On Finishes the task on an entered date All Projects
Must Start On Starts the task on an entered date All Projects

32
To Apply a Constraint
1 Select the task and double click on the task to display the Task Information dialog box.
2 Click the Advanced tab.
3 Click the Type down arrow and select the required constraint
4 Click the date down arrow and select the required date.
5 Click OK and a constraint indicator icon is displayed in the Indicator field to the left of the Task Name.
Note: Project can move the start date beyond its constraint date.
• On the Tools menu, click Options.
• Click the schedule tab and then clear the Tasks will always Honour Their Constraint Dates check box.
Task links will now take precedence over constraints. This means that if a constraint is set and there is no way you are going to meet that date then you can leave the constraint information in the project for documentation.
When a Constraint Creates a Conflict
When task constraints are set, conflicts occur that can affect the project finish date or task dependency.
When a conflict occurs, the Planning Wizard appears and warns that a conflict or a potential conflict will exist if the constraint is applied.
For example, if you are about to apply a Must Start on constrain the system see this as an inflexible constraint and warns you that you have three choices:
• Cancel and no constraint will be set.
• Continue, but a Start No Earlier constraint will be set
Continue and a Must Start On constraint will be set.
Setting a Deadline
Rather than setting an inflexible constraint which might have a negative effect on the scheduling you can apply a Deadline date.
A Deadline date is a date that you want or need the task completed by.
Setting a Deadline does not affect the task scheduling in any way but Project places a downward pointing arrow on the Gantt Chart to indicate the Deadline and an indicator when the deadline is exceeded

33
To Set a Deadline
Double click on the Task to display the Task Information Form.
Select the Advanced Tab and Enter a Deadline Date. Troubleshooting
If a project is being scheduled from a start date then entering a start date for a task or dragging the Gantt bar automatically sets a Start No Earlier Than constraint.
If a finish date is entered, a Finish No Earlier Than constraint is automatically set.
If a project is being scheduled from a fish date, entering a s start date for a task or dragging the Gantt bar automatically sets a Start No Later Than constraint.
If a finish date is entered, a Finish No Later Than constraint is automatically set
SETTING A BASELINE
Once a project schedule has been created and the resource and task conflicts have been resolved the current schedule represents the best estimate of how the project should proceed and what resources it will take.
Before the first task begins a baseline should be set.
Setting the baseline is a critical step in the scheduling process.
As a project progresses, the start times, finish times and resource assignments will change.
A baseline is useful for comparing the planned schedule with later versions of the schedule to see what changes have occurred.
To save a baseline
When a baseline is set the data in the scheduled fields is copied over to the baseline fields.
If a baseline is saved before the schedule planning is finished, a new baseline can be saved over the existing baseline.
• Select Tools, Tracking, Set Baseline
Click OK.

34
Creating Interim Plans
An interim plan is generally saved at certain stages in the project.
These plans can then be compared to the baseline plan and the current schedule.
The data saved in an interim plan includes the start and finish dates and any split dates but resource or assignment data is saved.
1 Select Tool, Tracking, Save Baseline.
2 Select Save Interim Plan option. The Copy and Into boxes are active.
3 Click the Copy down arrow and select the date fields to be copied. Usually the Start/Finish Fields.
4 Click the Into down arrow and select the date field to which you wish to copy. If this is the first interim plan for the project select Start1/Finish1. Each interim plan set after that goes to the subsequent Start/Finish number.
5 In the For area make sure the Entire Project is selected although you can set an interim plan for specific tasks if you wish.
6 Click OK.

35
Clearing the Baseline
Select Tools, Tracking, Clear Baseline.
Select the appropriate Baseline to clear.
TRACKING
Tracking is the process of gathering and entering task information into the schedule. Before the first task in the project can begin the project schedule should be fully developed and a baseline should be set.
When actual task progress is entered, the project is automatically recalculated and subsequent tasks are rescheduled based on the actual data, task dependencies, resources and constraints.
Task progress should be entered chronologically so that the remainder of the project can be evaluated and both positive and negative impacts can be dealt with on a proactive basis rather than a reactive basis.
Entering Actual Progress
There are five types of actual data that can be entered in Project
• Actual Start and Finish dates
• Percentage Complete
• Actual Duration and Remaining Duration
• Actual and Remaining Work
Actual and remaining cost
Actual task data can be entered using some of the features detailed below.
The Update Tasks Dialog Box
1 Select the required task.
2 Select Tools, Tracking, Update Tasks.
3 You can now enter the appropriate date to reflect what is actually happening on the task.
The Tracking Toolbar
Display the tracking toolbar by selecting View, Toolbars, Tracking.

36
The Task Usage View
1 Select the Task Usage view from the View Bar.
2 Select Format, Details, Actual Work.
3 Select the required task and resource and enter the actual work completed.
Splitting Tasks
A task can be split or rescheduled to interrupt the work and then resume the remainder of the work at a later point in the schedule.
1 View the Gantt Chart
2 Select the required task
3 Click the Split Task button on the standard toolbar.
4 Position the mouse pointer on the Gantt bar for the task until the required start date of the split displayed.
5 Hold down the left mouse button and drag the split Gantt bar until the restart date is displayed.
Comparing the Baseline to Actual Data
The project baseline provides the basis for comparing costs, work and dates for all tasks and resources. By comparing the project progress to the baseline, the project can be monitored to ensure tasks are on schedule, resources are completing their work and costs are not exceeding the budget.
Project baselines can actual data can be viewed graphically in charts or numerically in tables. The following table describes the tools in Project to analyse and compare baseline, actual and scheduled data:

37
To View the Tracking Gantt • Select Tracking Gantt from the View Bar
Patterned Gantt bars represent the updated schedule for tasks that have not yet started or are in progress. Double click on any white are on the Gantt chart to view the Bar Styles definition dialog box to find out what each bar represents.
Viewing Progress Lines
A Progress line represents the Task's progress.
Progress can be drawn on the Gantt Chart view and Tracking Gantt view.
The progress line creates peaks. Peaks point to the left for work that is behind schedule and to the right for work that is ahead of schedule.
Progress lines can be automatically displayed at the current date, at recurring intervals and on specific dates.
Tool Type Description
Tracking Gantt Chart Displays actual and baseline information
Variance Table Displays the difference between the actual information and baseline information.
Work Table Displays the actual and baseline work hours and shows the variances.
Cost Table Displays the actual and baseline costs and shows the variances.
Cost Overbudget
Task Filter Displays all tasks with a cost greater than the baseline cost.
Slipping Tasks Task Filter Displays all tasks that are behind schedule.
Work Overbudget
Resource Filter
Displays all resources with scheduled work greater than the baseline work.

38
1 Select Tools, Tracking, and click Progress lines.
2. Select the appropriate progress line options and click OK.
You can also click on the Add progress Line button on the Tracking Toolbar to set progress lines with default settings.
To View Project Data in Tables
1 Select More Views form the View Bar.
2 Select Task Sheet then Apply.
3 Select View, Table, Cost. The Cost table is displayed. All task cost information, including variances, is displayed.
The Task Usage view and the Resource Usage view can be used to track project progress on a day to day basis.
APPLYING FILTERS & SORTING DATA
Filtering and sorting is used to display specific information within a project schedule.
Custom filters can be created to answer specific questions and sorting can be performs on more than one level to organise information.
Using AutoFilters
1 Select the Autofilter down arrow from the Formatting toolbar.
2 Select the required filter.
3 Select All Tasks to go back to normal.
Sorting Data
1 Select Project, Sort and select Sort By
2 The Sort By dialog Box appears.
3 Click on the Sort By down arrow and select the required option.
4 Select Ascending or Descending.
5 Click Sort.

39
Sorting can be applied in any view but when sorting tasks in a chart view the dependency lines are no longer useful for indicating link lines Grouping Data Click on the down arrow beside the Group Data area on the standard Toolbar and the following list appears: Select the Item you wan to group on. You will see rolled up totals relating to the grouping you have selected. You can define you own grouping structure by selecting Project, Group By, More Groups and New.
PRINTING AND REPORTS.
To communicate the project information you can print views and reports that meet the needs of a specific person or group.
You can print only the task s starting during the current month or a report showing the tasks assigned to a specific person.
Project comes with 26 predefined views and 25 predefined reports that can be printed.
Before you print a view or a report it can be previewed to determine the number of pages that will be printed and if any additional information needs to be added.
Using the Page Setup dialog box you can select the page orientation, adjust scaling, change margins and add or change the headers and footers.
You can also add page breaks to views and tables.

40
Creating a Header or Footer.
You can type your own text in the header or footer for left, centre and/or right alignment or you can use the following preset items:
Page Number Project Current Date System Date
Total Page Count Project Status Date System Time
Project Title View Name Subject
Company Name Report Name Author
Manager Name Filter Name Keyword
Project Start date File Name
Project Finish Date Last Saved Date
1 Select File, Page Set-up.
2 Click the Header or Footer Tab
3 Select the Left, Centre or Right tab.
4 Select the required information or type your own text. Click Add.
The header and footer information is only visible when previewing or printing.

41
PREVIEWING AND PRINTING REPORTS
Previewing Views
1 On the Standard Toolbar click the Print Preview button.
2 The preview window opens to display the Gantt Chart as it would look when printed.
3 Click the Printer Icon to print the Report.
Previewing a Report
1 On the Report menu, choose Reports.
The Report dialog box appears:
2 Click on the required category.
3 Click on the required report. The report is then displayed in Print Preview.
4 Click on the Printer Icon to print the report.

42
Edit S tandard or New BaseCalendar
Tools, Change W orkingTim e & Options button
Enter Docum ent P ropertiesFile,
Properties
Start Date other than today?
Y
YN
N
ProjectProject Inform ation
(Check Calendar Nam e)
Enter Tasks into theEntry Table in Gantt
Chart V iew
Schedule Tasks(Predecessors)
Tools, ResourcesShare Resources
Sharing Resources?
Define ResourcesView, Resource Sheet
Change Resource Calendar?Assign Resources
(button on standardtoolbar)
Check for V iable P lanview, More V iews
Resource A llocation
Resource Sheet
Y
N
Y
Y
N
N
Y
GENERATING A PROJECT WITH MICROSOFT PROJECT