Embed Size (px)
Citation preview

Introduction to
ParaViewAndrew Bauer

• Collaborative software R&D:
algorithms & applications, image &
data analysis, support & training
• Industry, government, academia
• Best known for open source
toolkits and applications
• 129 employees in US: ⅓ Masters,
⅓ PhD
• Founded in 1998; $28M revenue
2011
• 13 employees in France (Kitware
SAS)
SOFTWARE
PROCESS

• No licensing costs; proven in products
• Funding & contributions from around the
world
• VTK—the Visualization Toolkit
• ParaView—Large data visualization application
• ITK—Insight image analysis Toolkit
• CMake—cross-platform build system
– CDash, CTest, CPack, software process tools
• OpenView / Tangelo—Informatics and infovis
• Kiwi & VES—Mobile / GLES rendering
• IGSTK, Lesion Sizing Toolkit, CTK, vxl, Open
Chemistry Project, VolView, tubeTk, and
more…

Contents
• ParaView description, architecture and history
• GUI interface: the Pipeline Browser and the
Object Inspector
• ParaView objects: Filters, Representations and
Views
• Hands-on practice: vector visualization, data
analysis
• Running ParaView in parallel

An open-source application and architecture for
display and analysis of scientific datasets
• Application - you don’t have to write any code to analyze your data
• Architecture - designed to be extensible if you want to code
• Custom apps, plugins, Python scripting, Catalyst for in situ,
ParaViewWeb
• Open-source – BSD 3-clause license
• Display - excels at traditional scientific vis qualitative 3D rendering
• Analysis - data drill down through charts, stats, all the way to values
• ParaView – designed for parallel use: scales from notebooks to
world’s largest supercomputers
What is ParaView?

History• 1999 LANL/Kitware project (via ASCI Views)
– Build an end user tool from VTK
– Make VTK scale
– October 2002 first public release, version 0.6
• 2002-2005 Versions 0.6 through 2.6
– Continued growth under DOE Tri Labs, Army
Research Lab and various other partnerships
• September 2005 ParaQ project started
– Sandia, Kitware and CSimSoft
– Make ParaView easier to use
– Add quantitative analysis
– May 2007 version 3.0 released
• Continuing to evolve– 3.2, 3.4, 3.6, 3.8, 3.10, 3.12, 3.14, 3.98
– 4.0.1, 4.1, 4.2, 4.3.1 (Cooley@ALCF)
– 5.0.1, 5.1.2 (Current – 7/2016)
– http://www.paraview.org/Wiki/ParaView_Release_Notes

User InterfaceMenu Bar
Toolbars
View(s)
Pipeline Browser
Object Inspector

VTK & ParaView Lexicon
• Filter: an object that operates on data: reads its inputs and produces one or more outputs (aka pipeline object)– Reader: reads a file and produces an output– Source: produces an output, e.g. a cylinder
• View: visual information contained in window, e.g. 2D, 3D, spreadsheet
• Property: a filter or view parameter the user can set (e.g. file name, slice plane location, camera angle)
• Client: the GUI or Python connection to the server• Server: computer where the data and filters exist
– Built-in Server: client executable also running server– Remote Server: server is a separate process from the client

Help
• Windows & Linux: F1 in the GUI
• Mac: Command+Shift+/
• Mouse hover
• Online help
– The ParaView Guide
– The ParaView Tutorial
– ParaView Mailing Lists
– ParaView Wiki
– http://www.paraview.org/documentation/
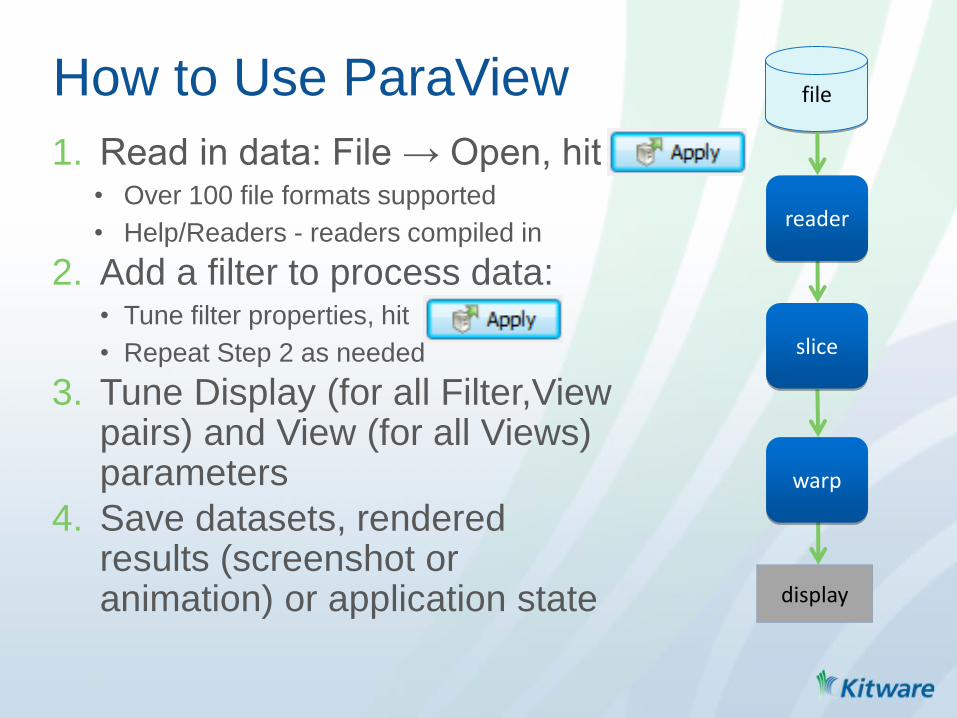
How to Use ParaView
1. Read in data: File → Open, hit• Over 100 file formats supported
• Help/Readers - readers compiled in
2. Add a filter to process data:• Tune filter properties, hit
• Repeat Step 2 as needed
3. Tune Display (for all Filter,Viewpairs) and View (for all Views) parameters
4. Save datasets, rendered results (screenshot or animation) or application state
reader
file
slice
warp
display
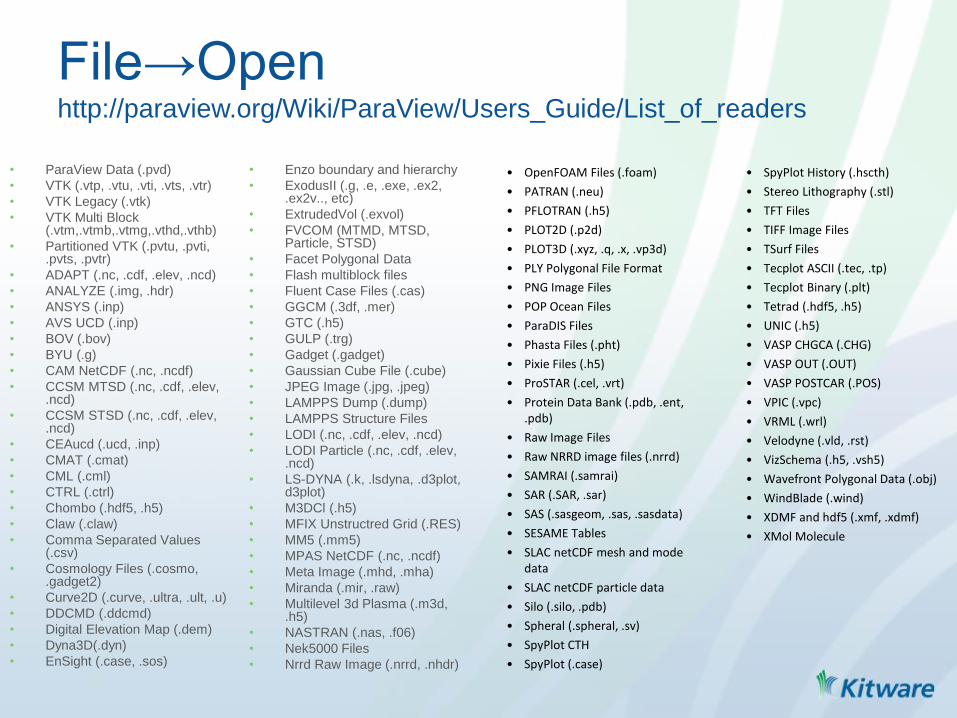
File→Openhttp://paraview.org/Wiki/ParaView/Users_Guide/List_of_readers
• ParaView Data (.pvd)
• VTK (.vtp, .vtu, .vti, .vts, .vtr)
• VTK Legacy (.vtk)
• VTK Multi Block (.vtm,.vtmb,.vtmg,.vthd,.vthb)
• Partitioned VTK (.pvtu, .pvti, .pvts, .pvtr)
• ADAPT (.nc, .cdf, .elev, .ncd)
• ANALYZE (.img, .hdr)
• ANSYS (.inp)
• AVS UCD (.inp)
• BOV (.bov)
• BYU (.g)
• CAM NetCDF (.nc, .ncdf)
• CCSM MTSD (.nc, .cdf, .elev, .ncd)
• CCSM STSD (.nc, .cdf, .elev, .ncd)
• CEAucd (.ucd, .inp)
• CMAT (.cmat)
• CML (.cml)
• CTRL (.ctrl)
• Chombo (.hdf5, .h5)
• Claw (.claw)
• Comma Separated Values (.csv)
• Cosmology Files (.cosmo, .gadget2)
• Curve2D (.curve, .ultra, .ult, .u)
• DDCMD (.ddcmd)
• Digital Elevation Map (.dem)
• Dyna3D(.dyn)
• EnSight (.case, .sos)
• Enzo boundary and hierarchy
• ExodusII (.g, .e, .exe, .ex2, .ex2v.., etc)
• ExtrudedVol (.exvol)
• FVCOM (MTMD, MTSD, Particle, STSD)
• Facet Polygonal Data
• Flash multiblock files
• Fluent Case Files (.cas)
• GGCM (.3df, .mer)
• GTC (.h5)
• GULP (.trg)
• Gadget (.gadget)
• Gaussian Cube File (.cube)
• JPEG Image (.jpg, .jpeg)
• LAMPPS Dump (.dump)
• LAMPPS Structure Files
• LODI (.nc, .cdf, .elev, .ncd)
• LODI Particle (.nc, .cdf, .elev, .ncd)
• LS-DYNA (.k, .lsdyna, .d3plot, d3plot)
• M3DCl (.h5)
• MFIX Unstructred Grid (.RES)
• MM5 (.mm5)
• MPAS NetCDF (.nc, .ncdf)
• Meta Image (.mhd, .mha)
• Miranda (.mir, .raw)
• Multilevel 3d Plasma (.m3d, .h5)
• NASTRAN (.nas, .f06)
• Nek5000 Files
• Nrrd Raw Image (.nrrd, .nhdr)
• OpenFOAM Files (.foam)
• PATRAN (.neu)
• PFLOTRAN (.h5)
• PLOT2D (.p2d)
• PLOT3D (.xyz, .q, .x, .vp3d)
• PLY Polygonal File Format
• PNG Image Files
• POP Ocean Files
• ParaDIS Files
• Phasta Files (.pht)
• Pixie Files (.h5)
• ProSTAR (.cel, .vrt)
• Protein Data Bank (.pdb, .ent, .pdb)
• Raw Image Files
• Raw NRRD image files (.nrrd)
• SAMRAI (.samrai)
• SAR (.SAR, .sar)
• SAS (.sasgeom, .sas, .sasdata)
• SESAME Tables
• SLAC netCDF mesh and mode data
• SLAC netCDF particle data
• Silo (.silo, .pdb)
• Spheral (.spheral, .sv)
• SpyPlot CTH
• SpyPlot (.case)
• SpyPlot History (.hscth)
• Stereo Lithography (.stl)
• TFT Files
• TIFF Image Files
• TSurf Files
• Tecplot ASCII (.tec, .tp)
• Tecplot Binary (.plt)
• Tetrad (.hdf5, .h5)
• UNIC (.h5)
• VASP CHGCA (.CHG)
• VASP OUT (.OUT)
• VASP POSTCAR (.POS)
• VPIC (.vpc)
• VRML (.wrl)
• Velodyne (.vld, .rst)
• VizSchema (.h5, .vsh5)
• Wavefront Polygonal Data (.obj)
• WindBlade (.wind)
• XDMF and hdf5 (.xmf, .xdmf)
• XMol Molecule

Filter Properties and the Apply
Button
• ParaView is meant to process large data – it might take
a long time when changing a filter property
• Net result is you won’t see any data change until you hit
the glowing Apply button on the Properties tab of the
Object inspector (unless auto apply is on)
Toggle auto apply
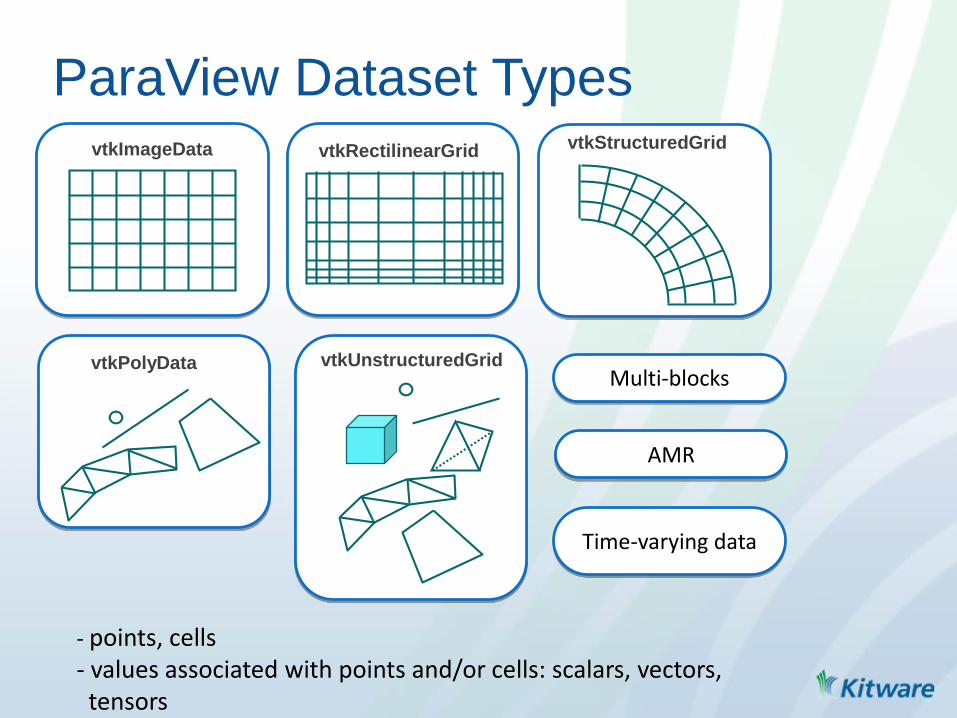
ParaView Dataset TypesvtkStructuredGridvtkRectilinearGridvtkImageData
vtkUnstructuredGridvtkPolyDataMulti-blocks
AMR
Time-varying data
- points, cells- values associated with points and/or cells: scalars, vectors, tensors

First Hands-On Example
Create a Cylinder
source
• Click on Sources
menu and select
Cylinder
• Click

Object Inspector: Properties and
Information Tabs
Active Filter
highlighted

Object Inspector:
Information Tab
• Information about the Active Filter’s output
• Dataset type
• Size (bytes, #points, #cells)
• Geometric bounds
• Structured bounds
• Arrays:• Name
• Association =point, =cell
• Data Type
• Data Ranges (and scalar/vector)
• Temporal Domain
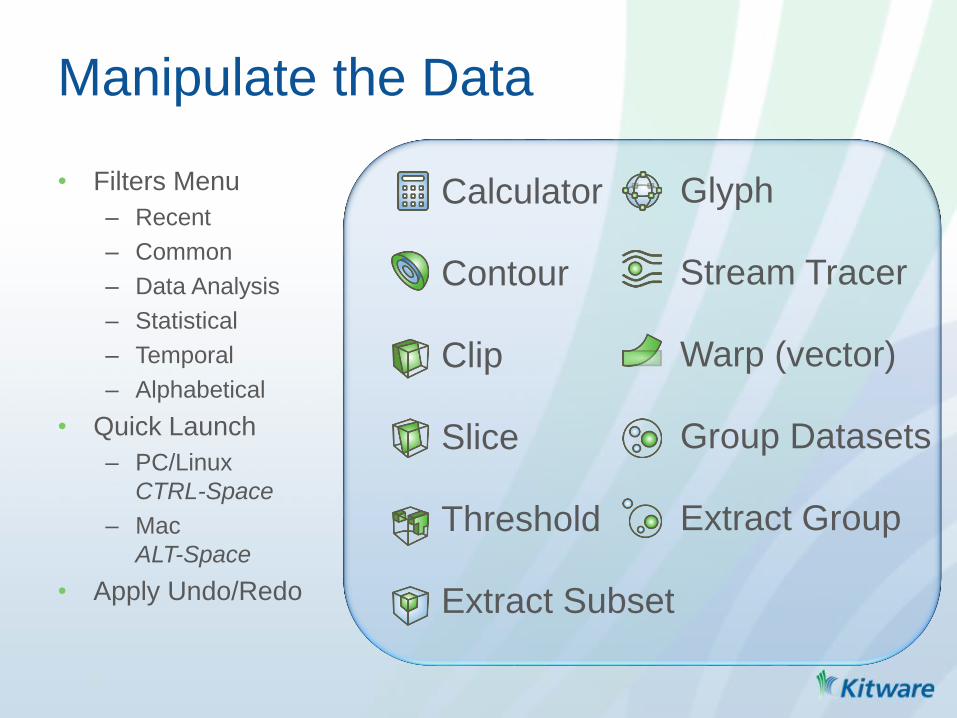
• Filters Menu
– Recent
– Common
– Data Analysis
– Statistical
– Temporal
– Alphabetical
• Quick Launch
– PC/Linux
CTRL-Space
– Mac
ALT-Space
• Apply Undo/Redo
Manipulate the Data
Calculator
Contour
Clip
Slice
Threshold
Extract Subset
Glyph
Stream Tracer
Warp (vector)
Group Datasets
Extract Group

• Use pipeline browser to navigate the graph
• Select a reader/filter to make it active, then object inspector,
information tab and display tab pertain to it
• Eyeball is to show/hide filter output in active view
Pipeline Browser: Condensed Pipeline
Graph
disk_out_ref.ex2
(hidden)
StreamTracer
(hidden)
Slice
(hidden)
WarpByVector
(displayed)
Tube
(displayed,
Active Filter)
Active Filter highlighted
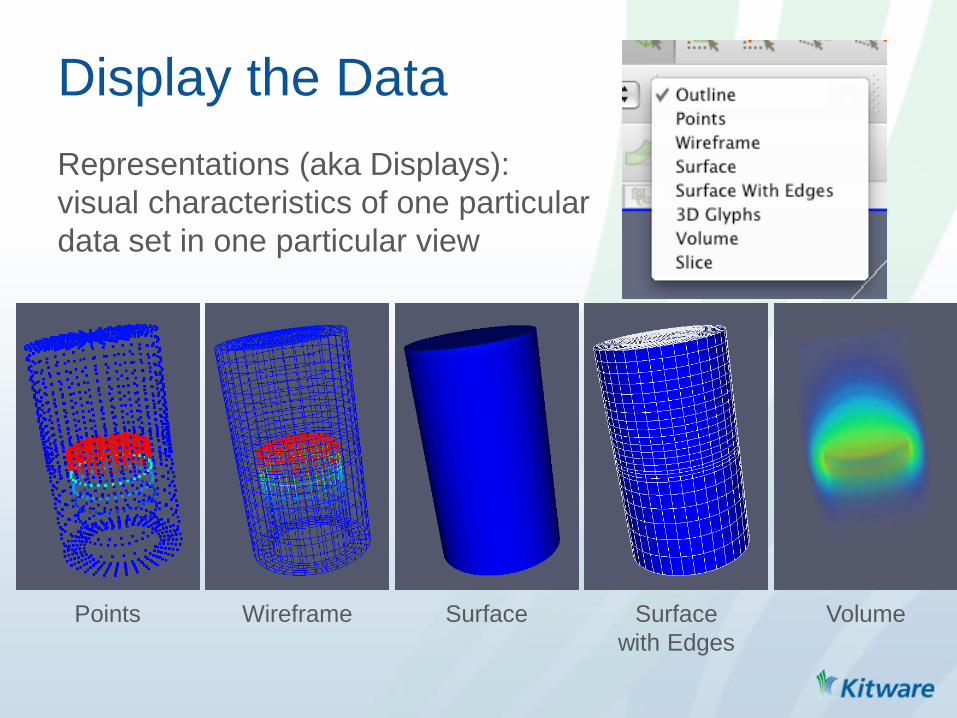
Representations (aka Displays):
visual characteristics of one particular
data set in one particular view
Display the Data
Points Wireframe Surface Surface
with Edges
Volume

Views – Windows onto one or more data sets
• Active View has blue border
Display the Data
21
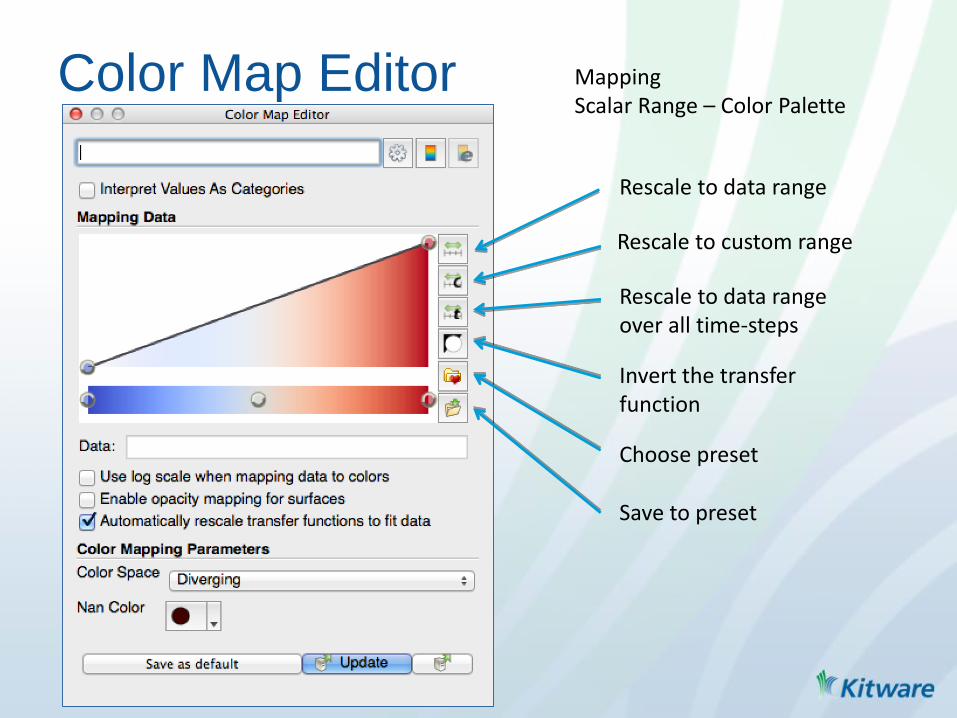
Color Map Editor
Rescale to data range
Rescale to custom range
Rescale to data range over all time-steps
Invert the transfer function
Choose preset
Save to preset
MappingScalar Range – Color Palette
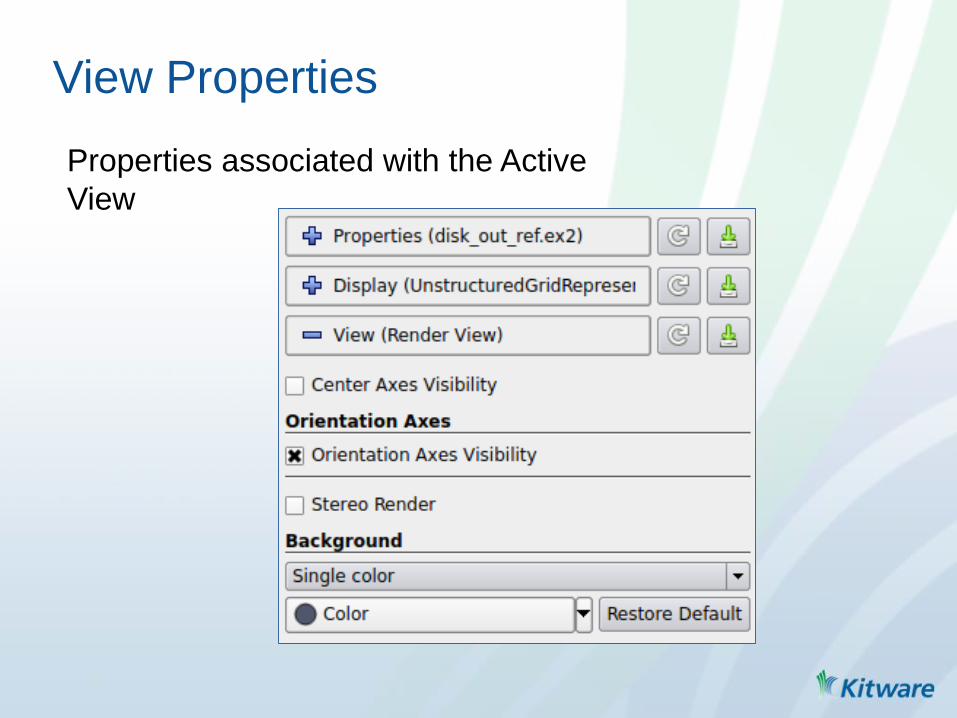
View Properties
Properties associated with the Active
View

Find Properties (for Filters, Displays and
Views)
Advanced
Properties
Search for properties
Toggle on/off advanced properties

Query Data by Attributes’ Values – Find
Data Dialog

• Visually select interesting data
• shown in all compatible views
• can then label, extract etc
• ‘Select Cells On’ to get nearest
cells on surface
• Select Points On’ to get nearest
points on surface
• ‘Select Cells Through’ to get all
cells intersecting a frustum
• ‘Select Points Through’
for selecting points inside a
frustum
Query Data Visually - Selection

Exporting Data, Images & Movies• Data
– File → Save Data…
• Active filter’s data, prompted for file format
• Only list of valid file formats shown. Primarily VTK
formats + Exodus, Ensight, XDMF/HDF5, csv
• Images
– File → Save Screenshot…
• Either selected view or all
• png, bmp, tif, ppm, jpg formats
• Override Color Palette to get print, presentation, etc. style
– File → Export Scene…
• Export visible scene in a format for high quality rendering
• eps, pdf, ps, svg, pov, vrml, webgl, x3d, x3db formats
• Movies
– File → Save Animation…
• avi, ogg, ffmpeg → avi formats

Shortcuts for Repetitive Tasks
• State files
– File → Save State… & File → Load State…
– .pvsm extension for XML based state file
– Will prompt for file locations for readers
• Python tracing
– Tools → Start Trace & Tools → Stop Trace
– Logs GUI actions and shows the corresponding
actions in ParaView’s Python API
– Can create a GUI macro button to replay the trace
steps
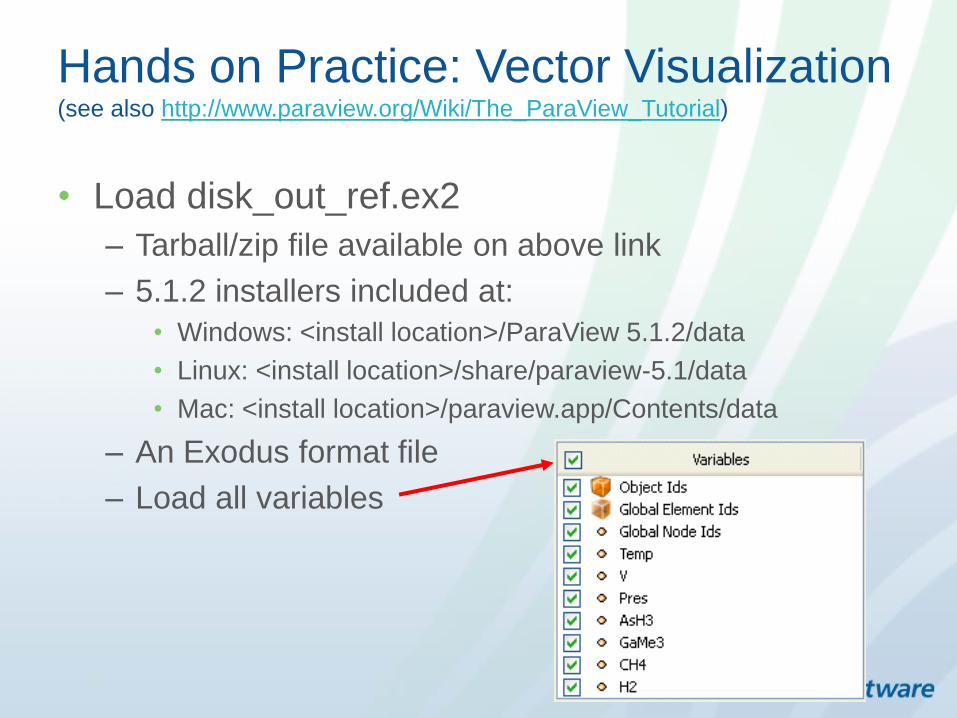
Hands on Practice: Vector Visualization(see also http://www.paraview.org/Wiki/The_ParaView_Tutorial)
• Load disk_out_ref.ex2
– Tarball/zip file available on above link
– 5.1.2 installers included at:
• Windows: <install location>/ParaView 5.1.2/data
• Linux: <install location>/share/paraview-5.1/data
• Mac: <install location>/paraview.app/Contents/data
– An Exodus format file
– Load all variables

Data Set Details
Shown in the Information tab
• Multi-block (group of data sets)
• Not time varying
• Roughly 8000 cells and points, 2MB
• 11.5 units in diameter, 20 units in height

• Show as surface with
edges to see structure
• Set opacity to 0.5
• Looks like a cylinder with a
recess
Hands on Practice: Vector Visualization
readerrepresentation
file

• Apply slice filter
– Align with z and use 10
offset values
• Color by Temp
• Show Temp lookup table
• Adjust opacity of
reader(0.1) and slice(1.0)
to see temperature
variation clearly
Hands on Practice: Vector Visualization
reader
slice
representation
representation
file

• Apply warp filter
– Warp slices along V
vector field with a
scale factor of 0.1
• Compare with display
of slice
– Can see how vector
field pushes up in
center and down
further out
– Seeing convection
of a heated gas, it
rises at
the heat source
Hands on Practice: Vector Visualization
reader
file
slice
warp

• Change warp opacity to .2
• Apply streamline filter
– Starts from seed points and advects along vector field to show vector flow
• Apply tube filter
– Gives infinitely thin streamlines volume so we can see them well
• Set opacity to 1.0 and color by vorticity
– We are seeing rotation
– A heated plate is spinning in gas
• Manipulate streamline’s seed points
Hands on Practice: Vector Visualization
reader
file
slice
warp
stream line
tube

41
Putting It Together: Data Analysis
reader
plot over line
histogram
view 3
view 2
view 4

What to Expect from Parallel ParaView
• Amdahl’s Law
• Gustafson’s Law
aka Strong scaling:
If data size is fixed, can’t always expect great scalability.
More processors != faster
aka Weak scaling:
As data size grows, you must have more resources.
More disk and memory = higher resolution possible
Speedup(CPUs) =1
Serial +Parallel
CPUs
Speedup(Machines) =
Machines- Serial*(Machines-1)

Large Data Processed by
ParaView
1 billion cell asteroid
detonation simulationsource: Sandia National Labs
6 billion cell CFD
simulation on 1M MPI
ranks using ParaView
Catalyst on Mirasource: Kitware, UC Boulder
(Jansen & Rasquin)

Reader
Contour
White Box
Reader
Contour
White Box
MPIX/N GB X/N GB
N component Data Parallelism for X GByte
…
Render ServerRender Server
Render ServerRender Server
ClientData ServerData Server
Data ServerData Server
Data ServerData Server
Depth Composite
Tile Display
Control,
Display and Rendering
of Small Data
www.paraview.org/Wiki/ParaView/ParaView_Readers_and_Parallel_Data_Distribution

ParaView’s running modes
Built-in aka Standalone aka Serial
all components within one process (client may be GUI or pvpython)“paraview” || “pvpython”
Combined Server
data processing and parallel rendering in MPI job of combined processes. control from TCP connected client.“mpiexec -n x pvserver &;
paraview”#||pvpython #+ Connect
Batch
Server is an MPI job which directly runs a python script“mpiexec –n x pvbatch \
vis_script.py”
Split server
Data processing and parallel rendering are both MPI jobs. “mpiexec –n x pvdataserver&; \
mpiexec –n y pvrenderserver
&; \ paraview” #+ Connect
DS RS Client
RS RSRSRS
DS
Client
ClientDS RSDS RS
DS RS
DS RSDS RS
DS RS

• Follow instructions at www.alcf.anl.gov/user-guides/paraview-cooley –
currently use ParaView 4.3.1 (5.1.2 being set up on Cooley)
• Fetch Servers
• Windows to COOLEY@ANL or COOLEY@ANL
• Import Selected
Connecting to a Server
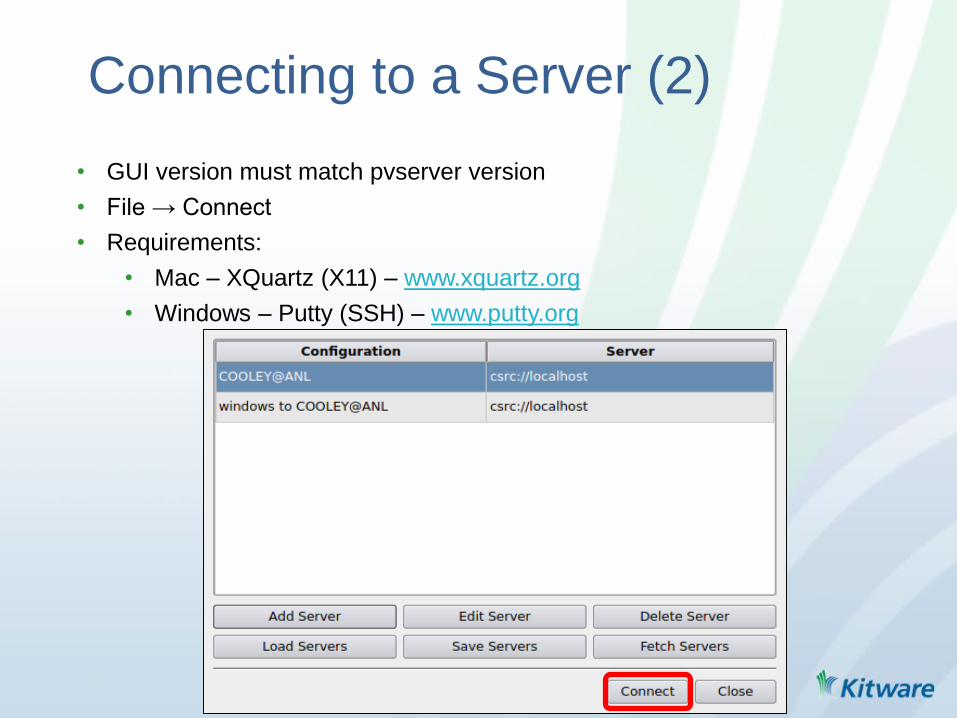
• GUI version must match pvserver version
• File → Connect
• Requirements:
• Mac – XQuartz (X11) – www.xquartz.org
• Windows – Putty (SSH) – www.putty.org
Connecting to a Server (2)

• Set:
• Xterm executable
• Linux & Mac
• SSH executable
• plink on Windows
• Username
• ParaView version (v4.3.1 or
v5.1.2 for bleeding edge)
• Number of nodes to reserve
• Number of minutes to reserve
• Account (ATPESC2016)
• Queue
Connecting to a Server (3)

Level of Detail – Maintain Interactivity
Type 1: Geometrically based
• Edit → Settings → Render View →
• LOD threshold = 0.1
• Down-samples geometry while
interacting

Level of Detail – Maintain Interactivity
Type 2: Image Based
• Edit → Settings → Render View →
• Remote Render Threshold = 0.1
• Image Reduction Factor = 10
• Down-samples pixels while interacting

Current Directions
• Catalyst– In situ ParaView http://catalyst.paraview.org
• Web and Mobile– ParaViewWeb front end http://paraviewweb.kitware.com/PW
– VES/KiwiViewer http://www.kiwiviewer.org
• OpenGL rendering overhaul– https://blog.kitware.com/new-opengl-rendering-in-vtk/
• Ray tracing– https://blog.kitware.com/vtk-and-paraview-now-with-ray-traced-rendering/
• SMP and GPGPU acceleration– VTK-m http://m.vtk.org/index.php/Main_Page
– vtkSMPTools https://blog.kitware.com/simple-parallel-computing-with-
vtksmptools-2/

Thank You!
Questions?