Embed Size (px)
DESCRIPTION
Introduction to Public Health in Emergencies II: Overview of Concepts and Indicators. Outcomes of Emergencies. Dislocation of populations Destruction of social networks, infrastructure and ecosystems Increased morbidity and mortality Abuses of human rights - PowerPoint PPT Presentation
Citation preview
Introduction to Public Health in Emergencies II:
Overview of Concepts and Indicators
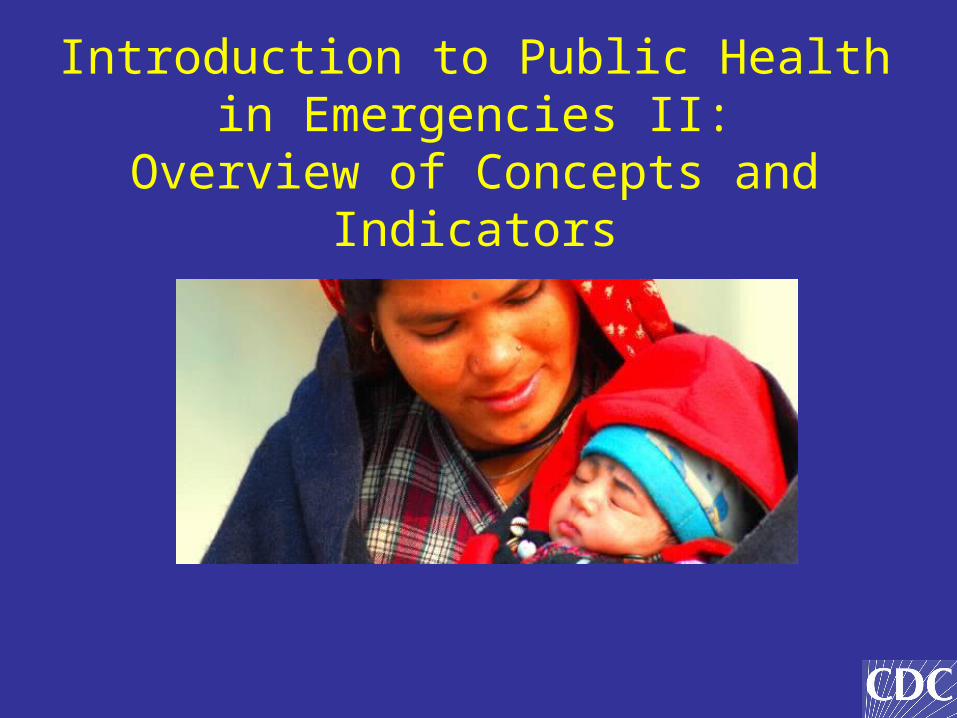
Outcomes of Emergencies
Dislocation of populations Destruction of social
networks, infrastructure and ecosystems
Increased morbidity and mortality
Abuses of human rights Social and political
marginalization
1. Acute - life saving interventions
2. Post-Emergency or Stabilization phase - crisis has peaked
3. Reconstruction/Rehabilitation - re-establishment of infrastructure, improve level of preparedness and skills compared to pre-emergency
Three Phases of emergencies
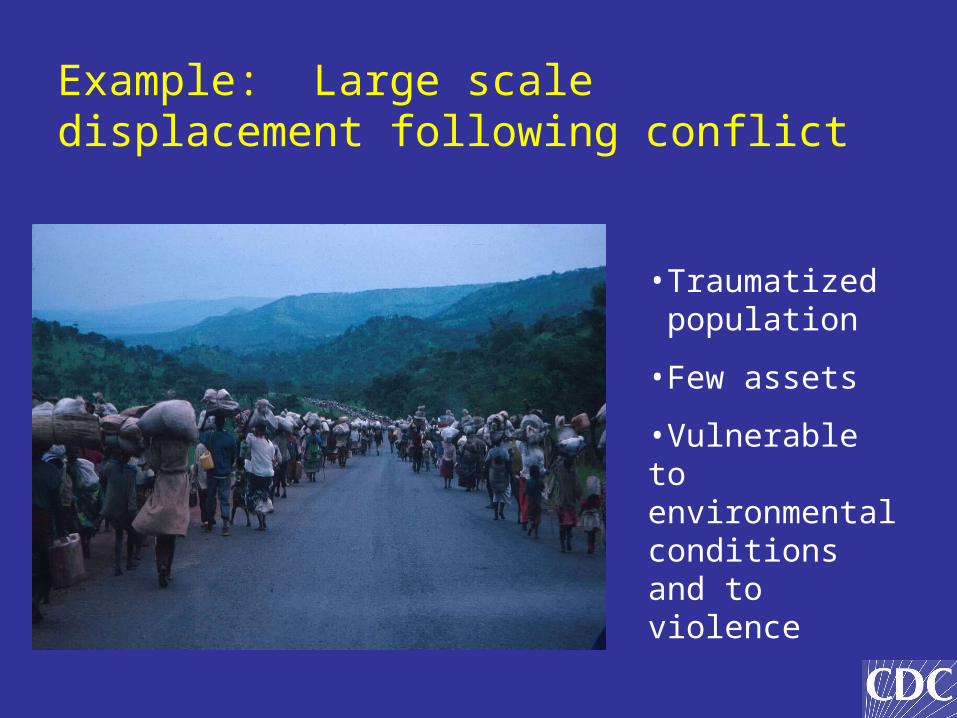
Example: Large scale displacement following conflict
•Traumatized population
•Few assets
•Vulnerable to environmental conditions and to violence
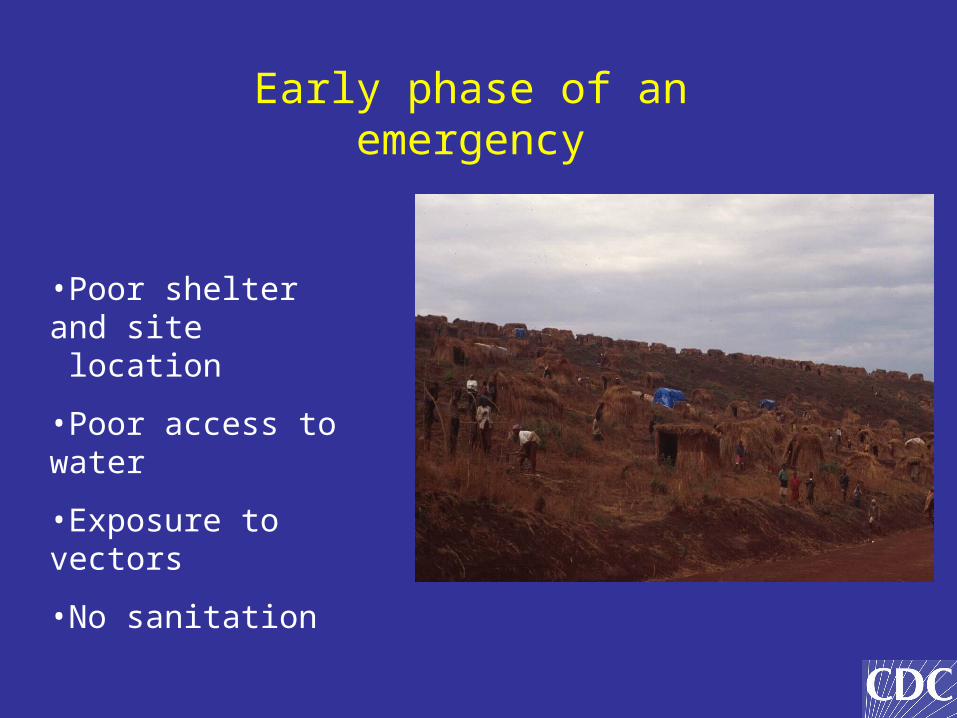
Early phase of an emergency
•Poor shelter and site location
•Poor access to water
•Exposure to vectors
•No sanitation
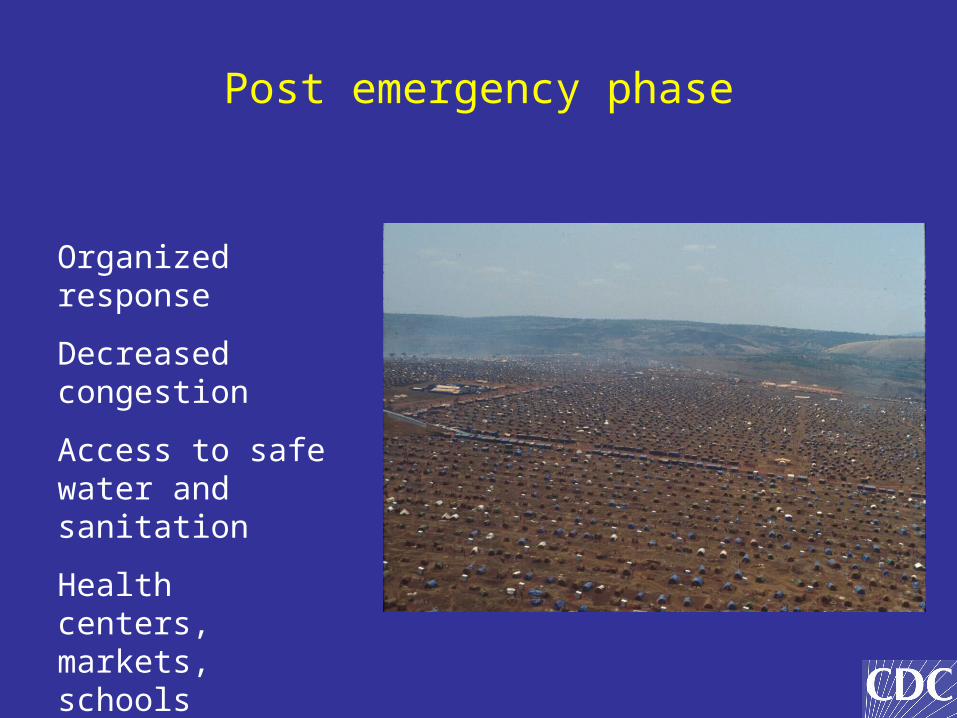
Post emergency phase
Organized response
Decreased congestion
Access to safe water and sanitation
Health centers, markets, schools
Different Emergency Scenarios
• Displaced population• In organized camps or transit centers• Informal settlements• Living with host communities
• Non-displaced but emergency affected
May be a combination of scenarios
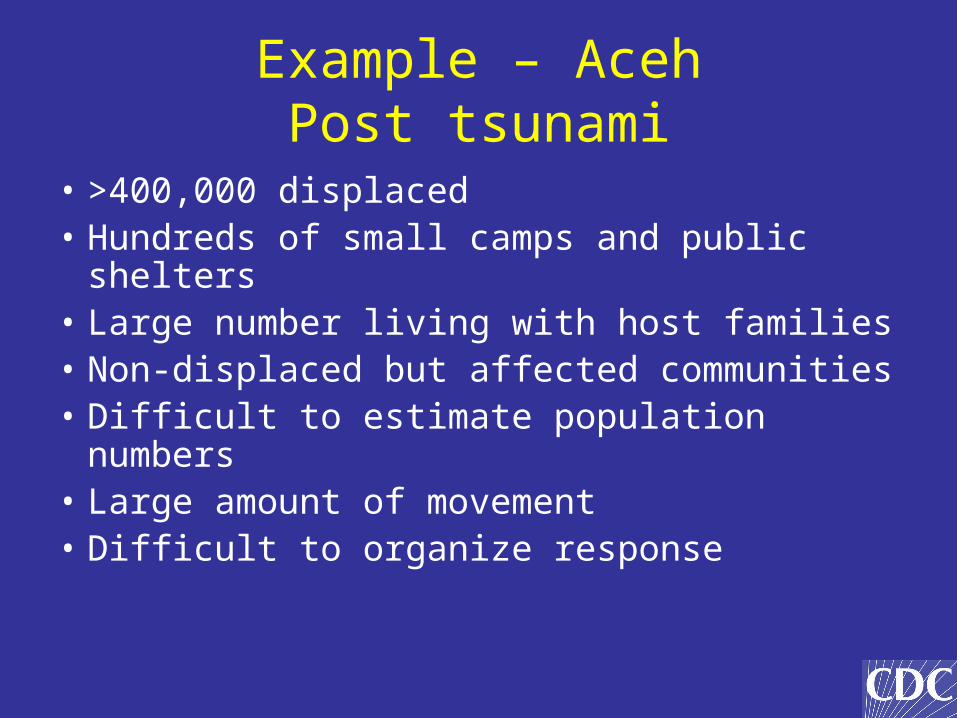
Example – AcehPost tsunami
• >400,000 displaced• Hundreds of small camps and public
shelters• Large number living with host families• Non-displaced but affected communities• Difficult to estimate population numbers• Large amount of movement• Difficult to organize response
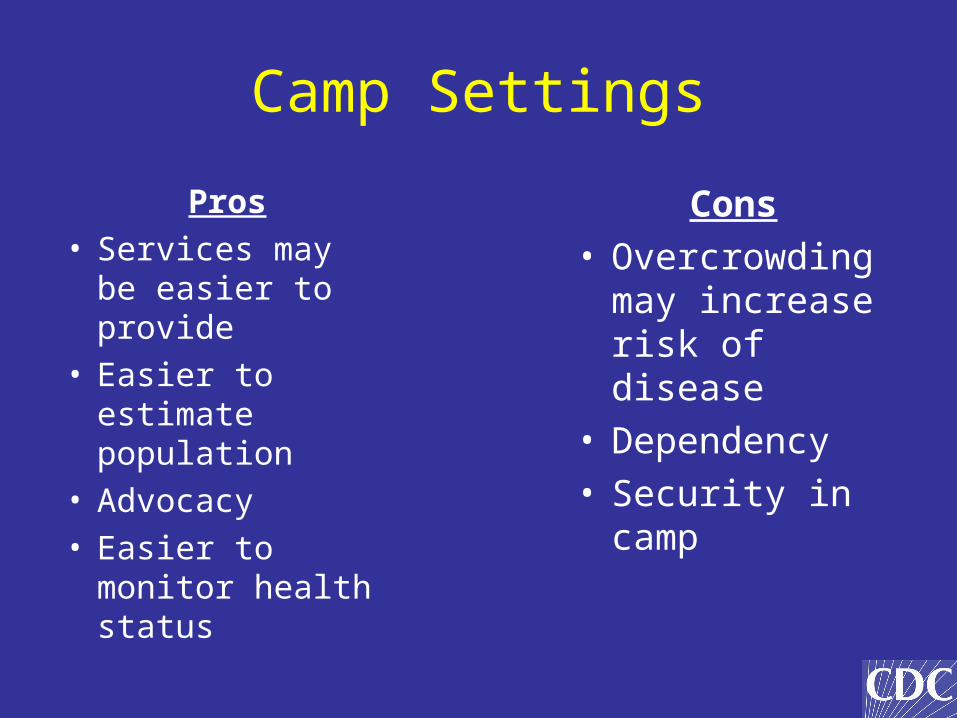
Camp Settings
Pros• Services may be
easier to provide• Easier to
estimate population
• Advocacy• Easier to monitor
health status
Cons• Overcrowding
may increase risk of disease
• Dependency• Security in camp
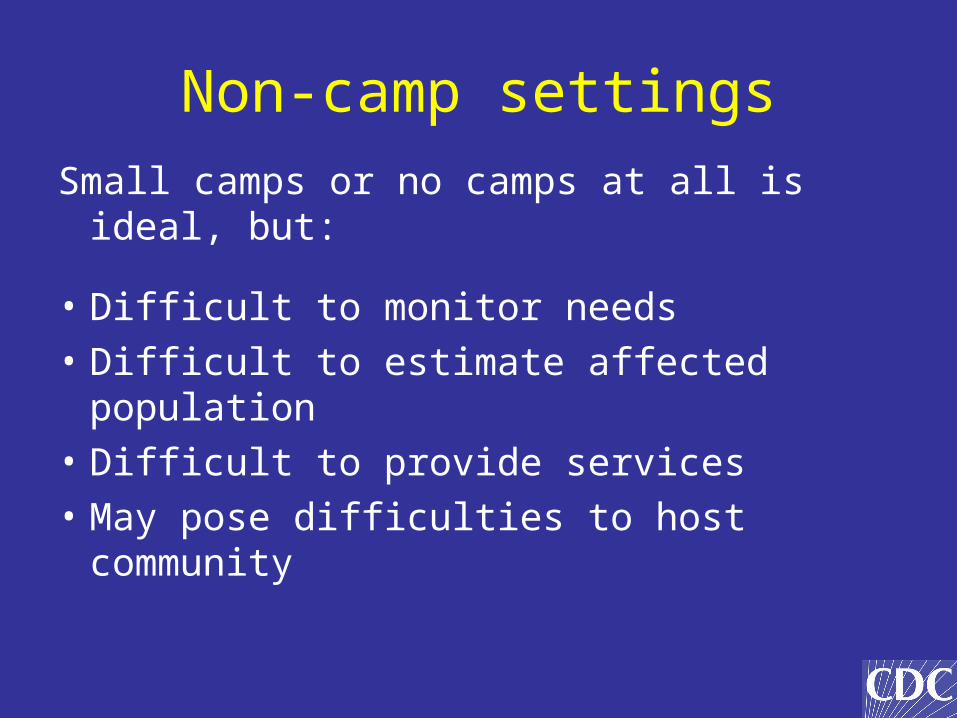
Non-camp settings
Small camps or no camps at all is ideal, but:
• Difficult to monitor needs
• Difficult to estimate affected population
• Difficult to provide services
• May pose difficulties to host community
What are the major causes of mortality and morbidity?
What are the major causes of mortality and morbidity?
– Diarrhea– ARI– Measles– Malaria– Malnutrition
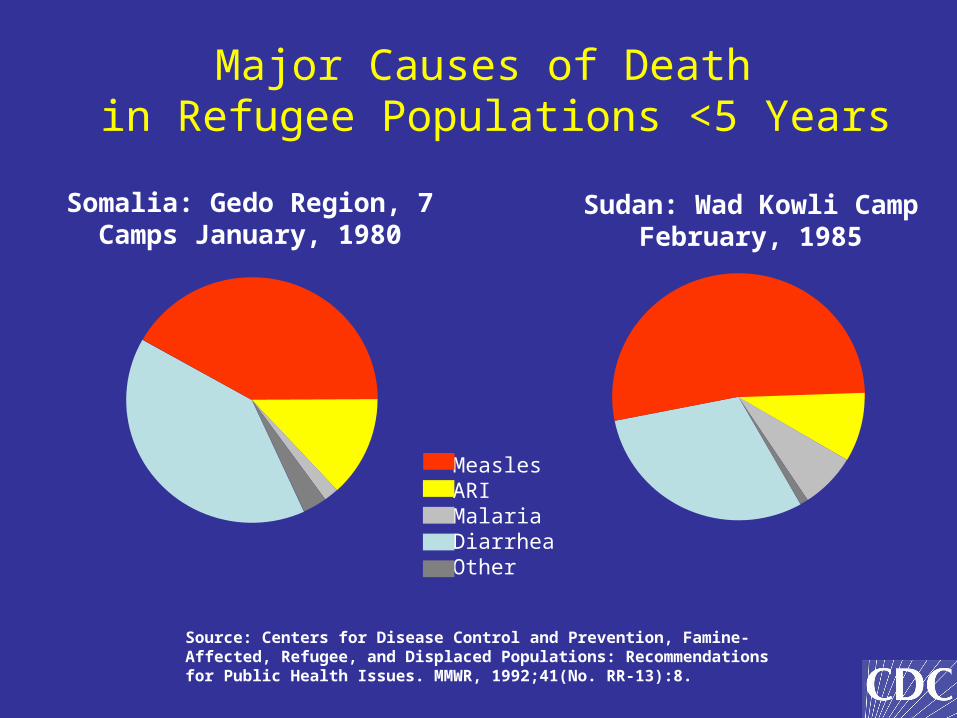
Major Causes of Death in Refugee Populations <5 Years
Sudan: Wad Kowli CampFebruary, 1985
Somalia: Gedo Region, 7 Camps January, 1980
Source: Centers for Disease Control and Prevention, Famine-Affected, Refugee, and Displaced Populations: Recommendations for Public Health Issues. MMWR, 1992;41(No. RR-13):8.
MeaslesARIMalariaDiarrheaOther
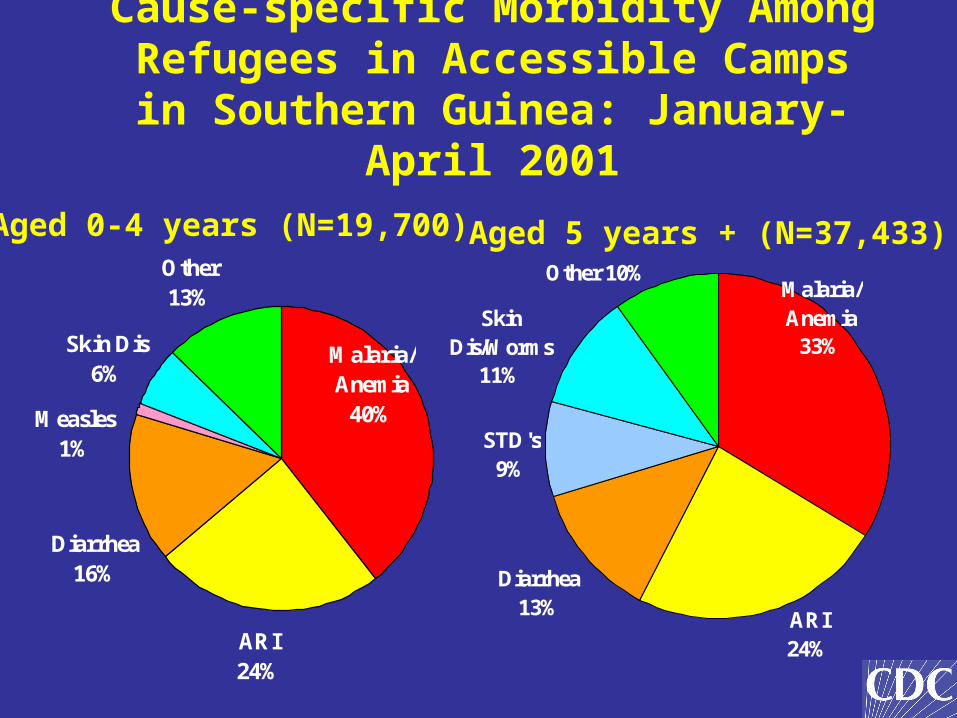
Cause-specific Morbidity Among Refugees in Accessible Camps in
Southern Guinea: January-April 2001
ARI24%
Skin Dis6%
Malaria/Anemia
40%
Other13%
Measles1%
Diarrhea16%
ARI24%
Diarrhea13%
STD's9%
Skin Dis/Worms
11%
Malaria/Anemia
33%
Other 10%
Aged 0-4 years (N=19,700) Aged 5 years + (N=37,433)
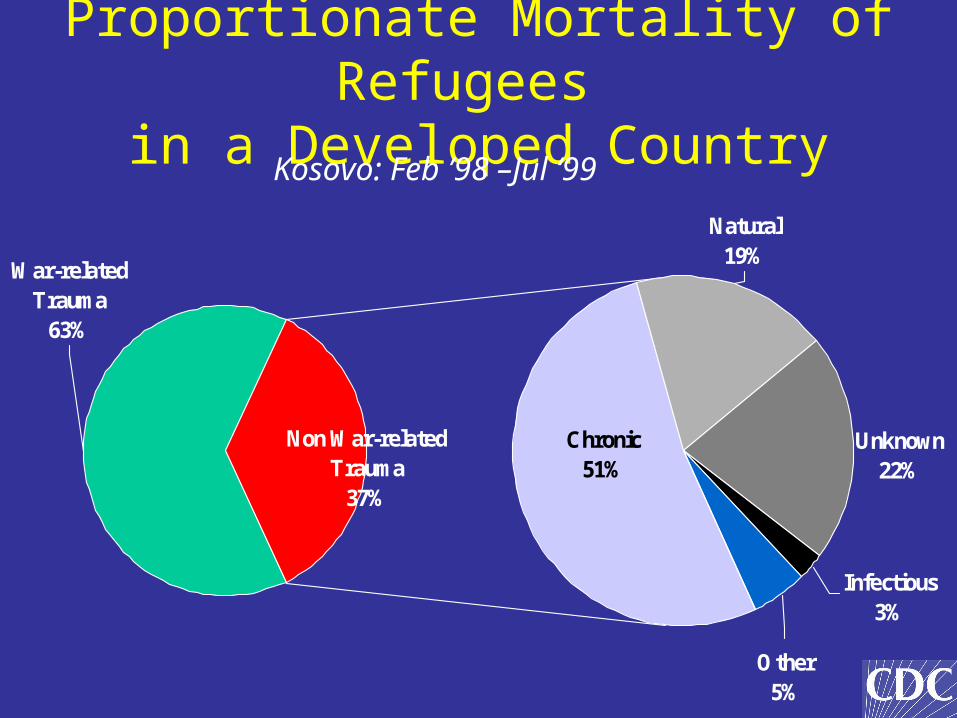
Proportionate Mortality of Refugees in a Developed Country
War-relatedTrauma
63%
Natural19%
Non War-relatedTrauma
37%
Chronic51%
Unknown22%
Infectious3%
Other5%
Kosovo: Feb ’98 –Jul ‘99

What are the public health priorities in an emergency?
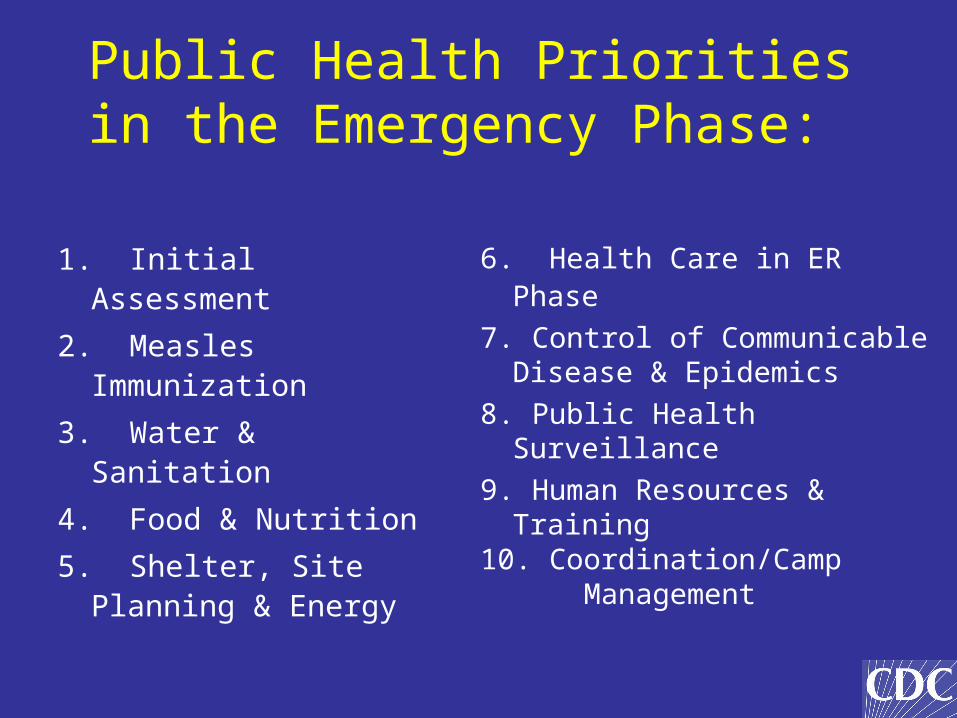
Public Health Priorities in the Emergency Phase:
1. Initial Assessment
2. Measles Immunization
3. Water & Sanitation
4. Food & Nutrition
5. Shelter, Site Planning & Energy
6. Health Care in ER Phase
7. Control of Communicable Disease & Epidemics
8. Public Health Surveillance
9. Human Resources & Training
10. Coordination/Camp Management
Use of indicators in humanitarian emergencies
Indicators used in Emergencies
• How do we monitor the health status of the population?– Acute malnutrition– Mortality
• How do we monitor access to services and effectiveness of the response?– SPHERE standards
Indicators in Emergencies
• Nutritional indicators: prevalence of wasting– Weight for Height
• Z scores (surveys) • % of median (admission to feeding programs)
– MUAC (screening)
• Mortality indicators – Crude Mortality Rate (CMR) – Under 5 Mortality Rate (<5 MR)
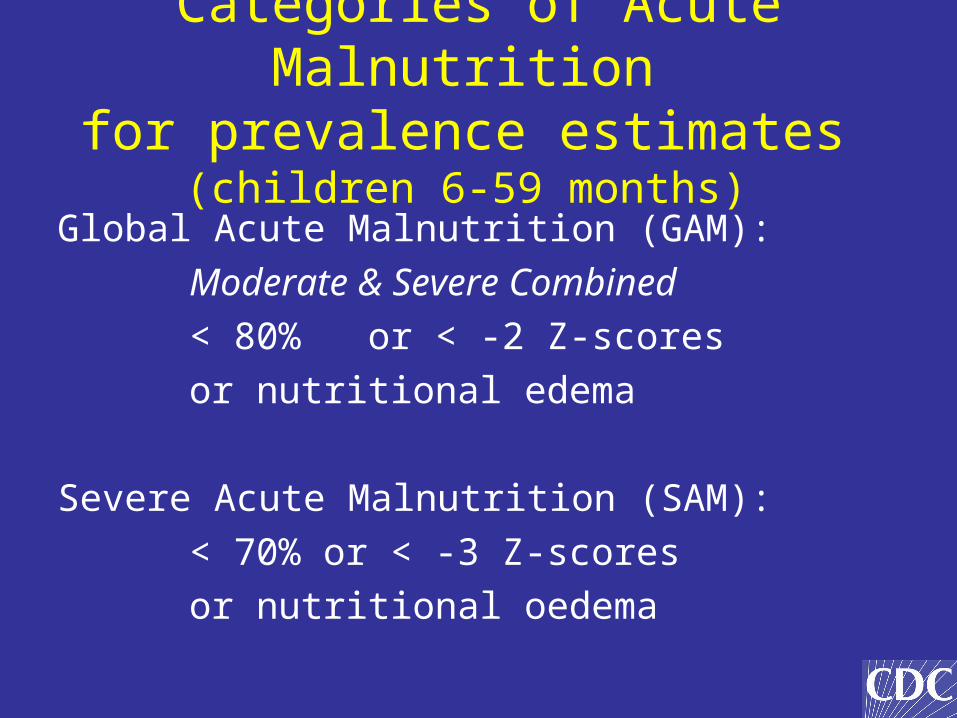
Categories of Acute Malnutrition for prevalence estimates
(children 6-59 months)
Global Acute Malnutrition (GAM):
Moderate & Severe Combined
< 80% or < -2 Z-scores
or nutritional edema
Severe Acute Malnutrition (SAM):
< 70% or < -3 Z-scores
or nutritional oedema
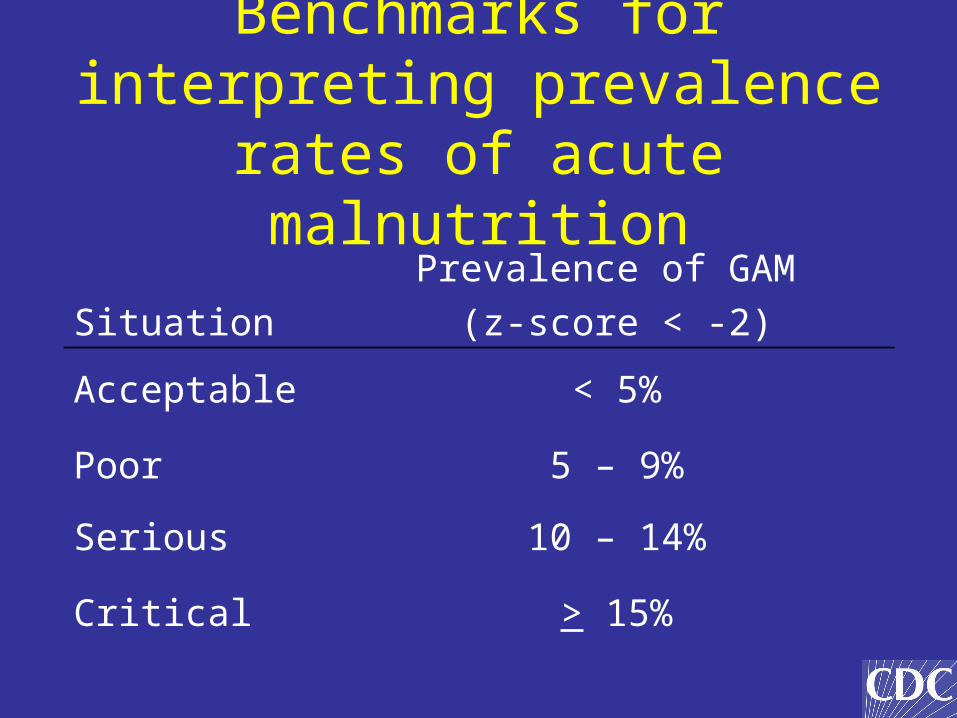
Benchmarks for interpreting prevalence rates of acute
malnutrition
Situation
Prevalence of GAM
(z-score < -2)
Acceptable < 5%
Poor 5 – 9%
Serious 10 – 14%
Critical > 15%
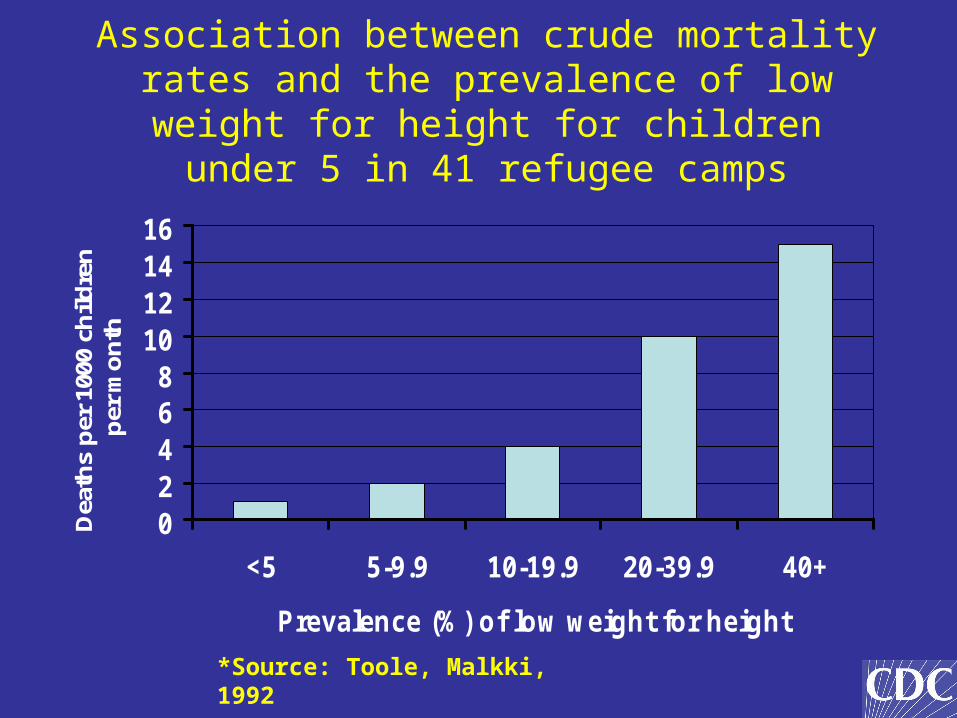
Association between crude mortality rates and the prevalence of low weight for height for
children under 5 in 41 refugee camps
02468
10121416
<5 5-9.9 10-19.9 20-39.9 40+
Prevalence (%) of low weight for height
Dea
ths
per
100
0 ch
ildre
n
per
mo
nth
*Source: Toole, Malkki, 1992
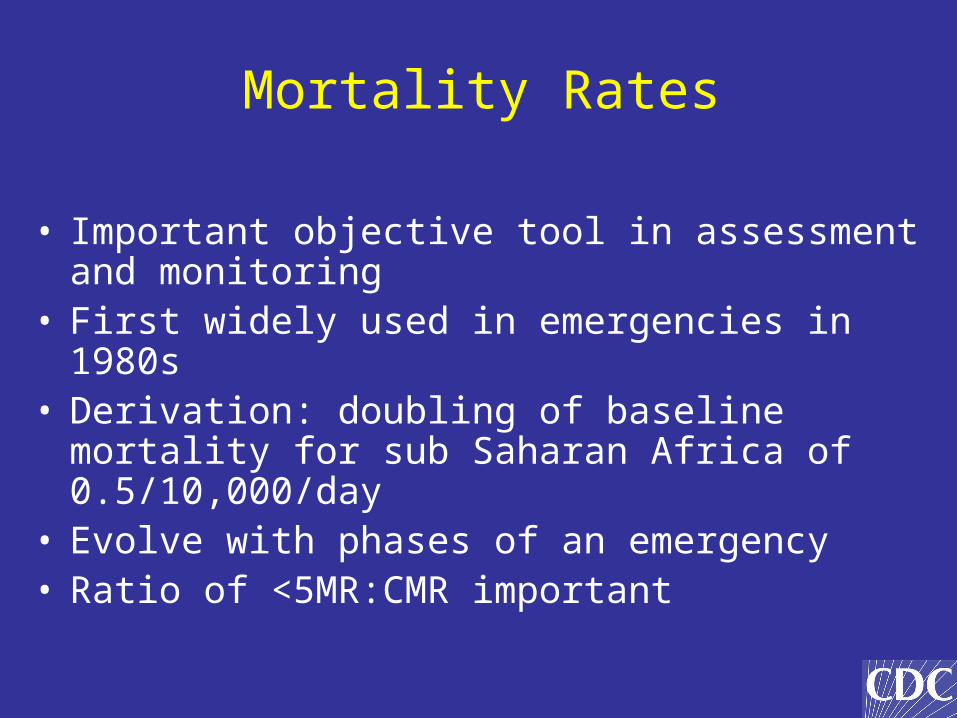
Mortality Rates
• Important objective tool in assessment and monitoring
• First widely used in emergencies in 1980s• Derivation: doubling of baseline mortality for sub
Saharan Africa of 0.5/10,000/day• Evolve with phases of an emergency• Ratio of <5MR:CMR important
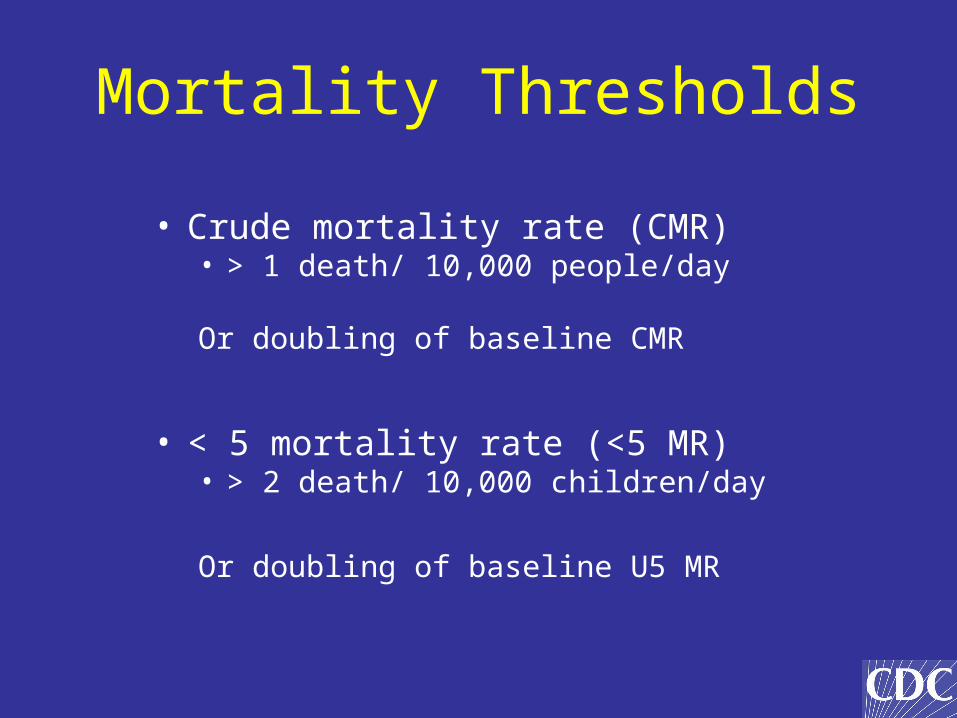
Mortality Thresholds
• Crude mortality rate (CMR)• > 1 death/ 10,000 people/day
Or doubling of baseline CMR
• < 5 mortality rate (<5 MR)• > 2 death/ 10,000 children/day
Or doubling of baseline U5 MR
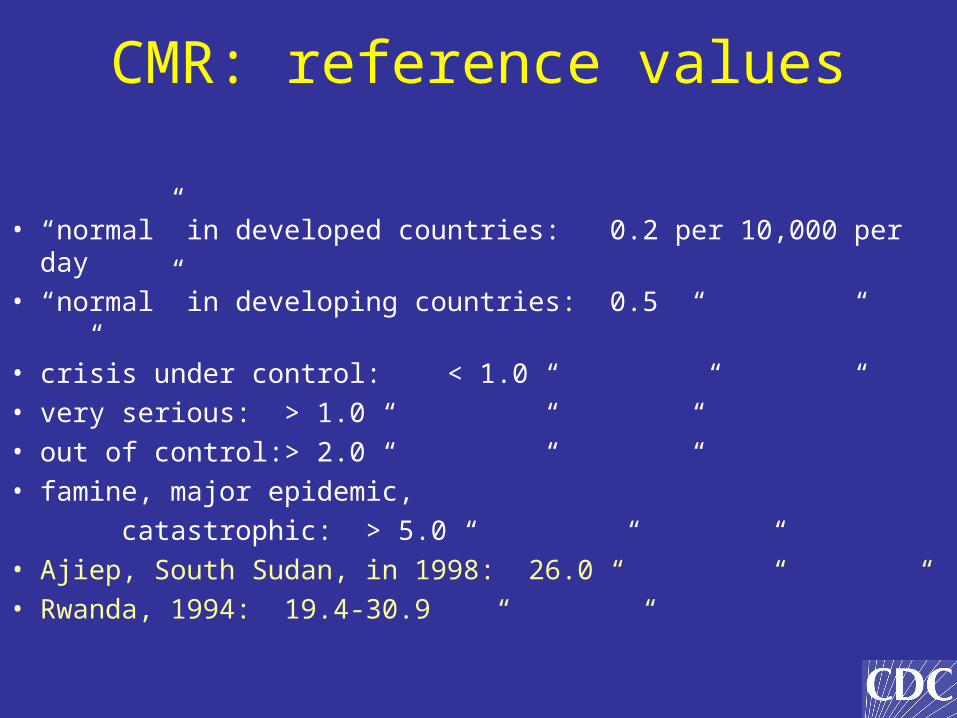
CMR: reference values
• “normal” in developed countries: 0.2 per 10,000 per day• “normal” in developing countries: 0.5 “ “ “• crisis under control: < 1.0 “ “ “• very serious: > 1.0 “ “ “• out of control: > 2.0 “ “ “• famine, major epidemic,
catastrophic: > 5.0 “ “ “• Ajiep, South Sudan, in 1998: 26.0 “ “ “• Rwanda, 1994: 19.4-30.9 “ “
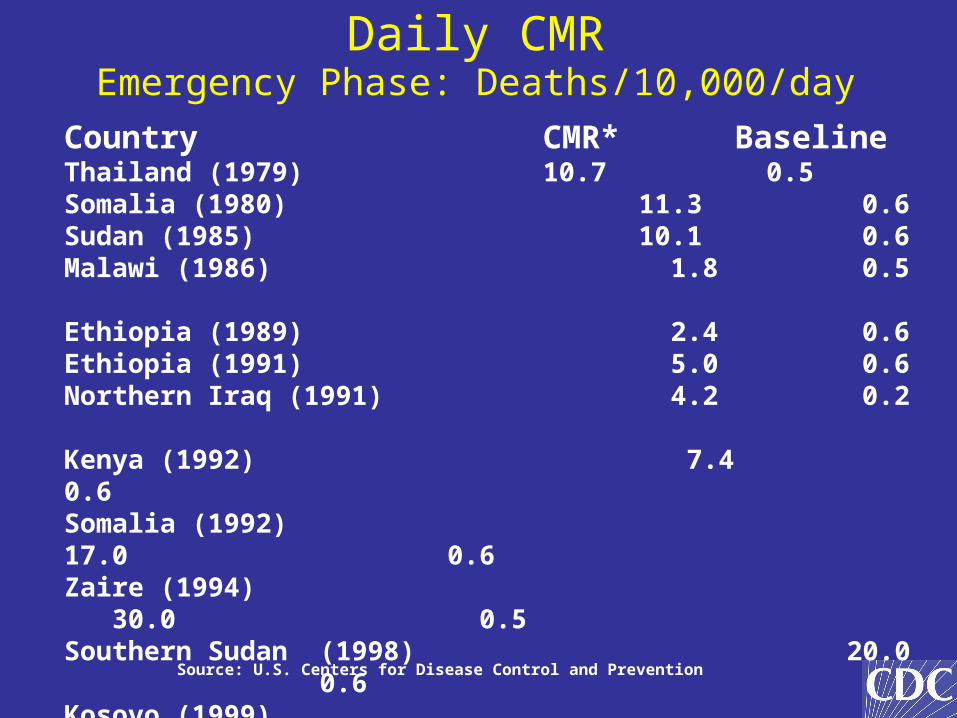
Daily CMREmergency Phase: Deaths/10,000/day
Country CMR* BaselineThailand (1979) 10.7 0.5Somalia (1980) 11.3 0.6Sudan (1985) 10.1 0.6Malawi (1986) 1.8 0.5
Ethiopia (1989) 2.4 0.6Ethiopia (1991) 5.0 0.6Northern Iraq (1991) 4.2 0.2
Kenya (1992) 7.4 0.6Somalia (1992) 17.0 0.6Zaire (1994) 30.0 0.5Southern Sudan (1998) 20.0 0.6Kosovo (1999) 1.0 0.1Ethiopia (2000) 3.2 0.6
Source: U.S. Centers for Disease Control and Prevention
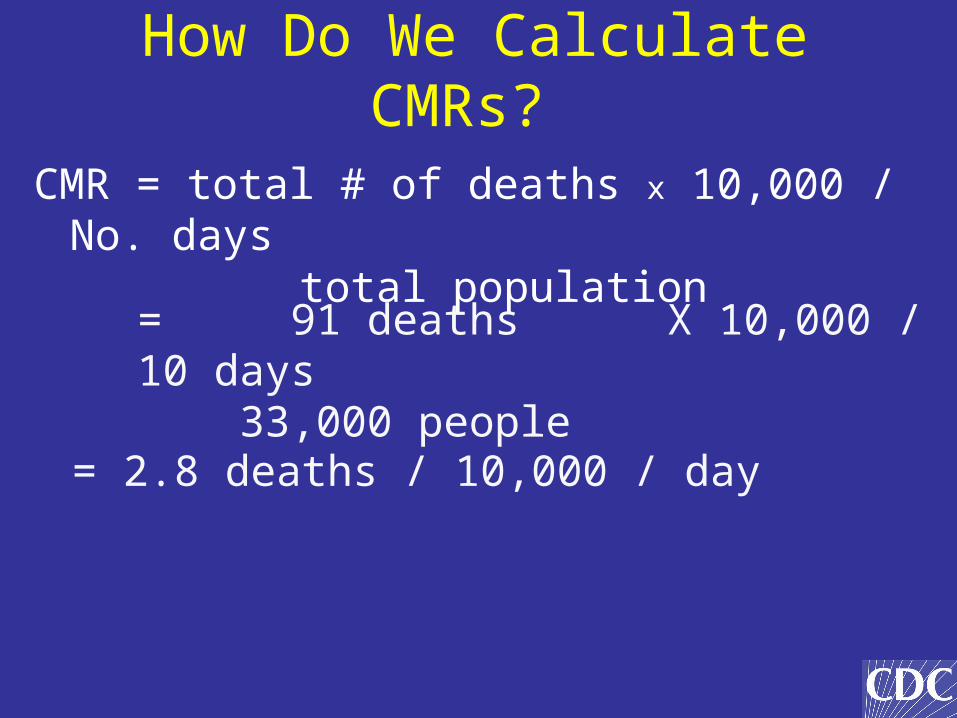
= 91 deaths X 10,000 / 10 days 33,000 people
CMR = total # of deaths x 10,000 / No. days total population
= 2.8 deaths / 10,000 / day
How Do We Calculate CMRs?
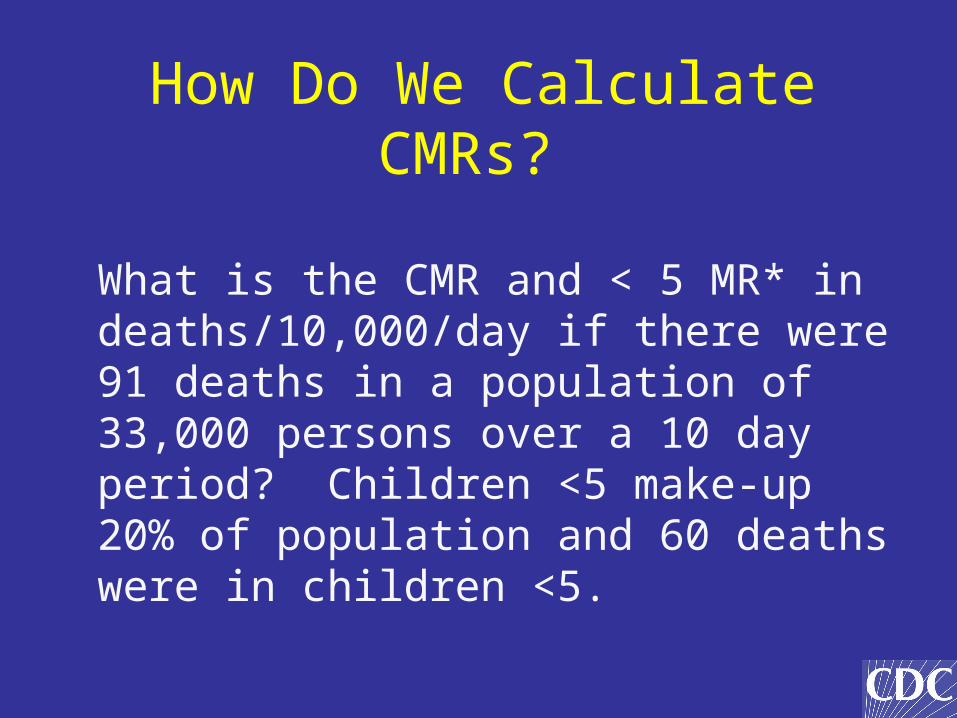
What is the CMR and < 5 MR* in deaths/10,000/day if there were 91 deaths in a population of 33,000 persons over a 10 day period? Children <5 make-up 20% of population and 60 deaths were in children <5.
How Do We Calculate CMRs?
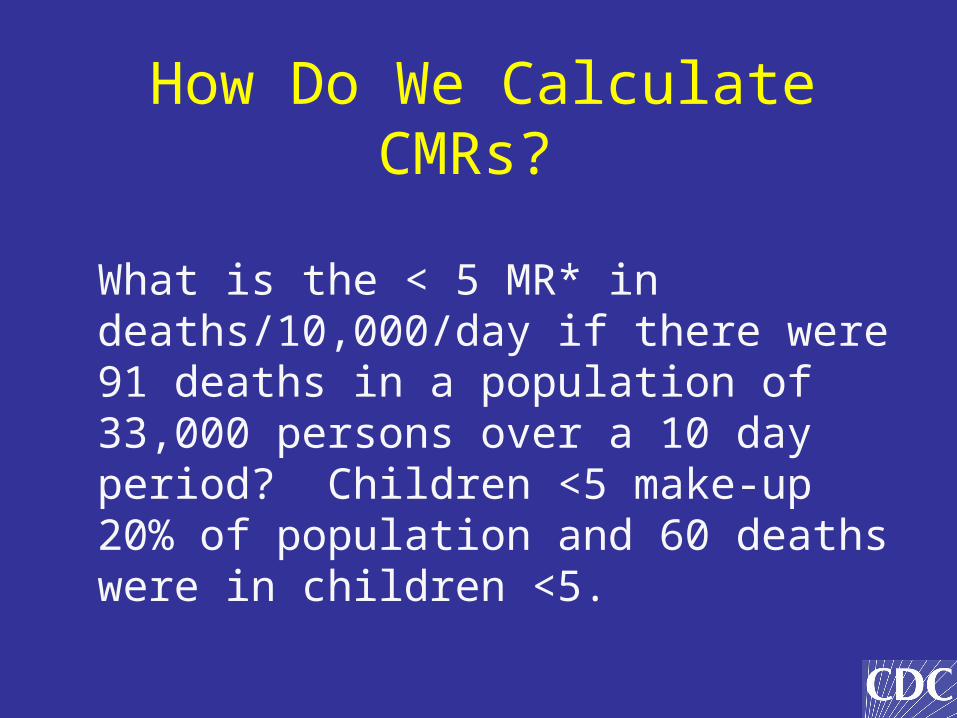
What is the < 5 MR* in deaths/10,000/day if there were 91 deaths in a population of 33,000 persons over a 10 day period? Children <5 make-up 20% of population and 60 deaths were in children <5.
How Do We Calculate CMRs?
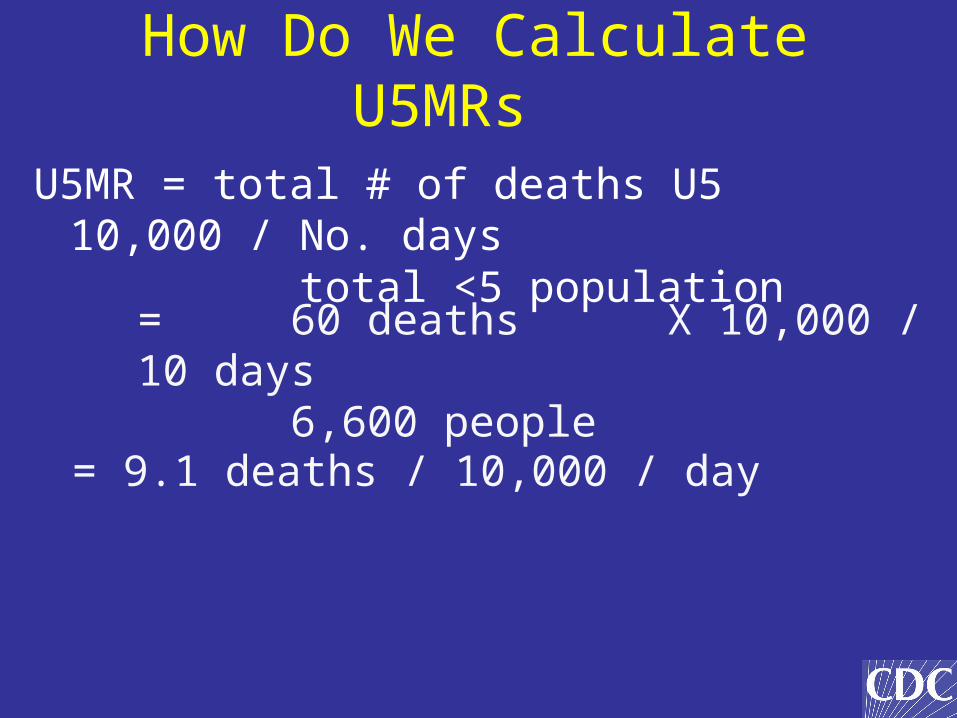
= 60 deaths X 10,000 / 10 days 6,600 people
U5MR = total # of deaths U5 10,000 / No. days total <5 population
= 9.1 deaths / 10,000 / day
How Do We Calculate U5MRs
Excess Mortality
• Mortality in excess of baseline levels
• Total number of deaths as opposed to mortality rate
• Simpler to understand than mortality rates
• Effective in raising public awareness
• Examples– Democratic Republic of Congo– Iraq
SPHERE
• Launched in 1997
• Standardized indicators for core areas of humanitarian response
• Improve quality of the response
• Improve accountability
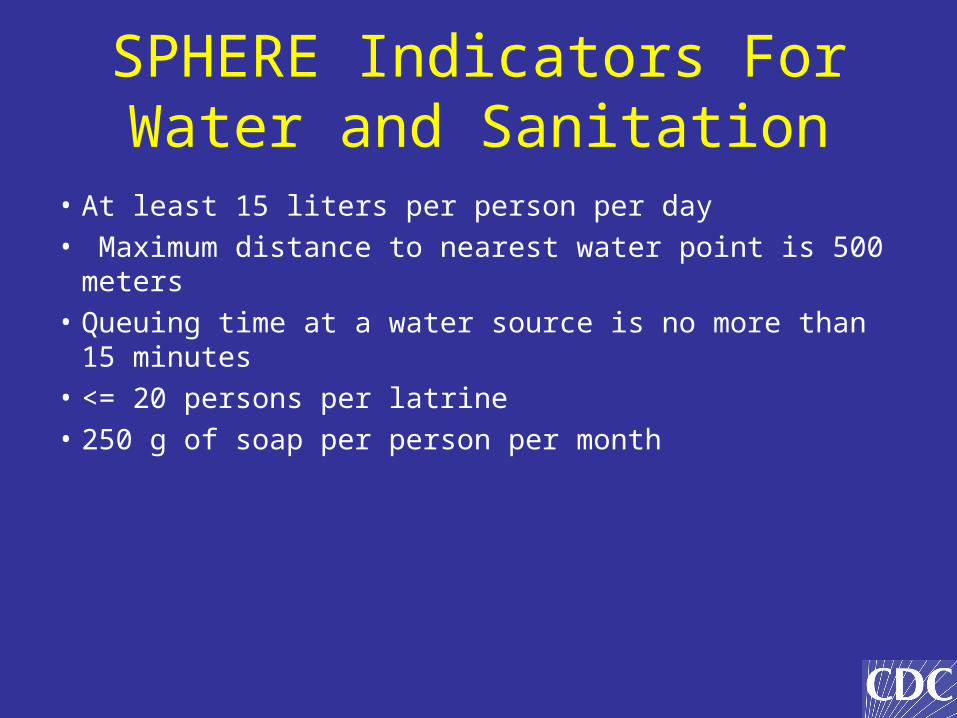
SPHERE Indicators For Water and Sanitation
• At least 15 liters per person per day
• Maximum distance to nearest water point is 500 meters
• Queuing time at a water source is no more than 15 minutes
• <= 20 persons per latrine
• 250 g of soap per person per month
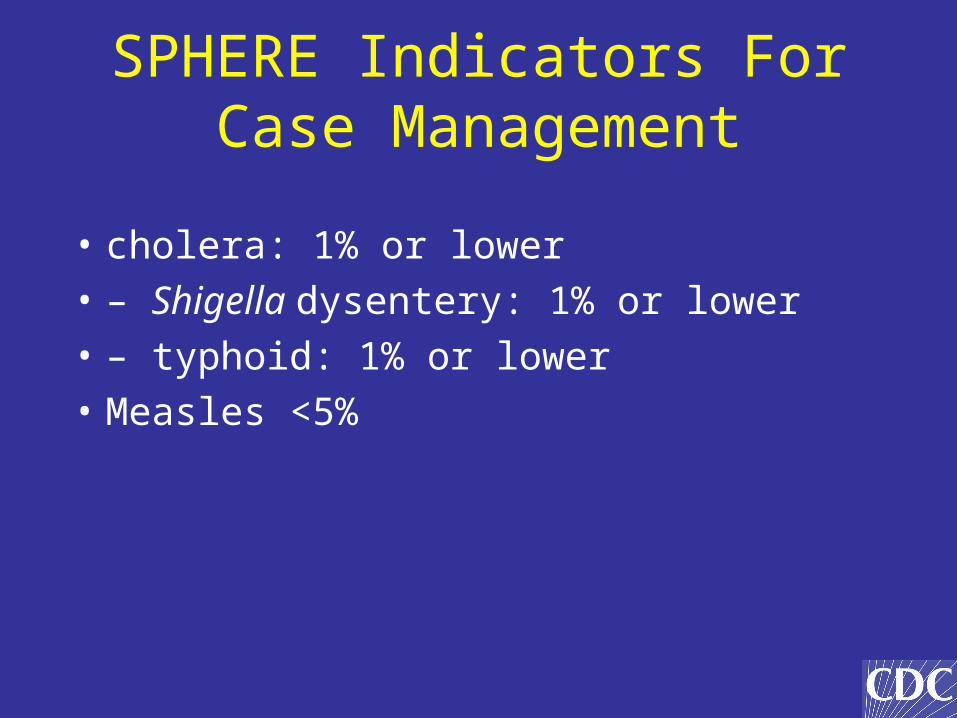
SPHERE Indicators For Case Management
• cholera: 1% or lower• – Shigella dysentery: 1% or lower• – typhoid: 1% or lower• Measles <5%
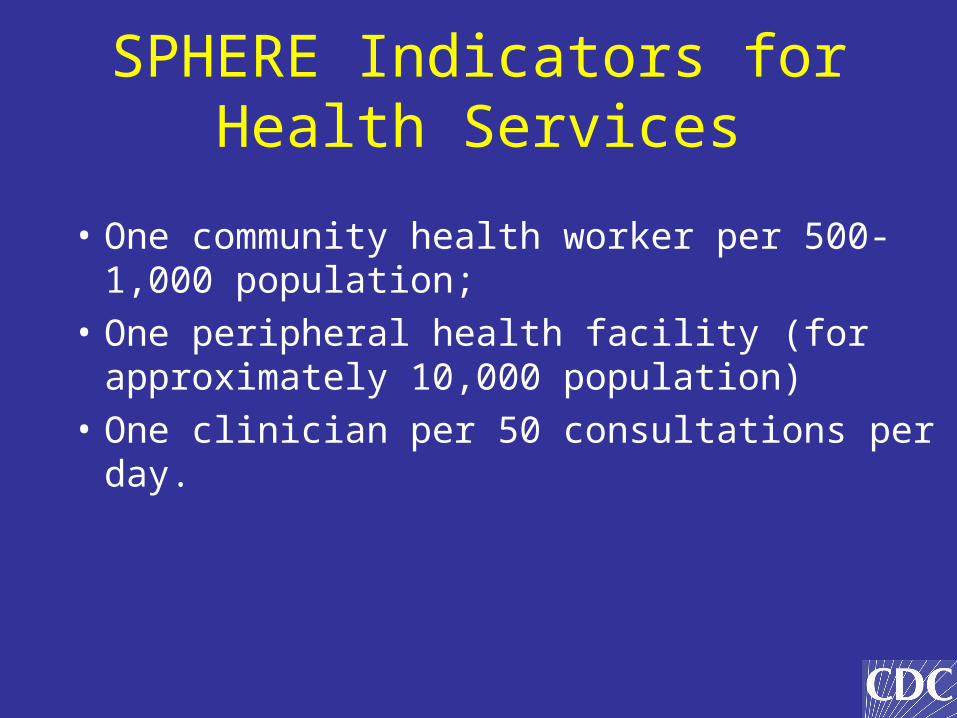
SPHERE Indicators for Health Services
• One community health worker per 500-1,000 population;
• One peripheral health facility (for approximately 10,000 population)
• One clinician per 50 consultations per day.
Questions?