Embed Size (px)
Citation preview

1
Introduction to Risk and Return and opportunity cost of capital
Chapter 11 BBM
08/29/12

11-2
Risk and Return
Risk and Return are related.
How?
We now focus on risk and return and their relationship to the opportunity cost of capital.
How?
11-3
Equity Rates of Return: A Review
Capital Gain + Dividend Initial Share PricePercentage Return =
Capital GainInitial Share PriceCapital Gain Yield =
Dividend Initial Share PriceDividend Yield =

11-4
Real Rates of Return
1 + nominal rate of return1 + inflation rate1 real rate of return =
Example: Suppose inflation from December 2009 to December 2010 was 1.5%. What was GE stock’s real rate of return, if its nominal rate of return
was 23.93%?
Recall the relationship between real rates and nominal rates:

11-5
Total Returns for Different Asset Classes
The Value of an Investment of $1 in 1900

11-6
What Drives the Difference in Total Returns?
Maturity Premium: Extra average return from investing in longer term Treasury securities.
Risk Premium: Expected return in excess of risk-free return as compensation for risk.

11-7
Risk Premium: Example
Interest Rate on Normal RiskExpected Market Return = +
Treasury Bills Premium
1981: 21.4% = 14% + 7.4%
2008: 9.6% = 2.2% + 7.4%

11-8
Returns and Risk
How are the expected returns and the risk of a security related?

11-9
Measuring Risk
Variance: Average value of squared deviations from mean. A measure of volatility.
Standard Deviation: Square root of variance. Also a measure of volatility.
What is risk?
How can it be measured?

10
Market Indexes
Dow Jones Industrial Average (The Dow)Value of a portfolio holding one share in each of 30 large industrial firms.
Standard & Poor’s Composite Index (The S&P 500)Value of a portfolio holding shares in 500 firms. Holdings are proportional to the number of shares in the issues.
OMX SPI index
11
OMX Stockholm PI• OMX nordiska börs använder en gemensam indelning och uppbyggnad av
index för de nordiska marknaderna. En enhetlig indexstandard ökar förståelsen för de nordiska indexen och underlättar jämförelser mellan olika index.
• OMX Stockholm 30 (OMXS30) – PI OMX Stockholm 30 är OMX Nordiska Börs Stockholms ledande aktieindex. Indexet består av de 30 mest aktivt handlade aktierna på den Nordiska Börsen i Stockholm.
• OMX Stockholm All-Share (OMXS) – PI OMX Nordiska Börs Stockholms All-Share-index innefattar alla aktier som är noterade på den Nordiska Börsen i Stockholm. Basdatum för All-Share-index på OMX Nordiska Börs Stockholm är den 31 december 1995, med basvärdet 100.

12
Average Market Risk Premium (by country)
4,29 4,69 5,05 5,43 5,5 5,61 5,67 6,04 6,29 6,94 7,137,94 8,34 8,4 8,74 9,1 9,61 10,21
0123456789
1011D
enm
ark
Bel
giu
m
Sw
itze
rlan
d
Irel
and
Sp
ain
Nor
way
Can
ada
U.K
.
Net
her
lan
ds
Ave
rage
U.S
.
Sw
eden
Au
stra
lia
Sou
th A
fric
a
Ger
man
y
Fra
nce
Jap
an
Ital
y
Risk premium, %
Country
Market risk premium = Market rate of return – risk-free rate
13
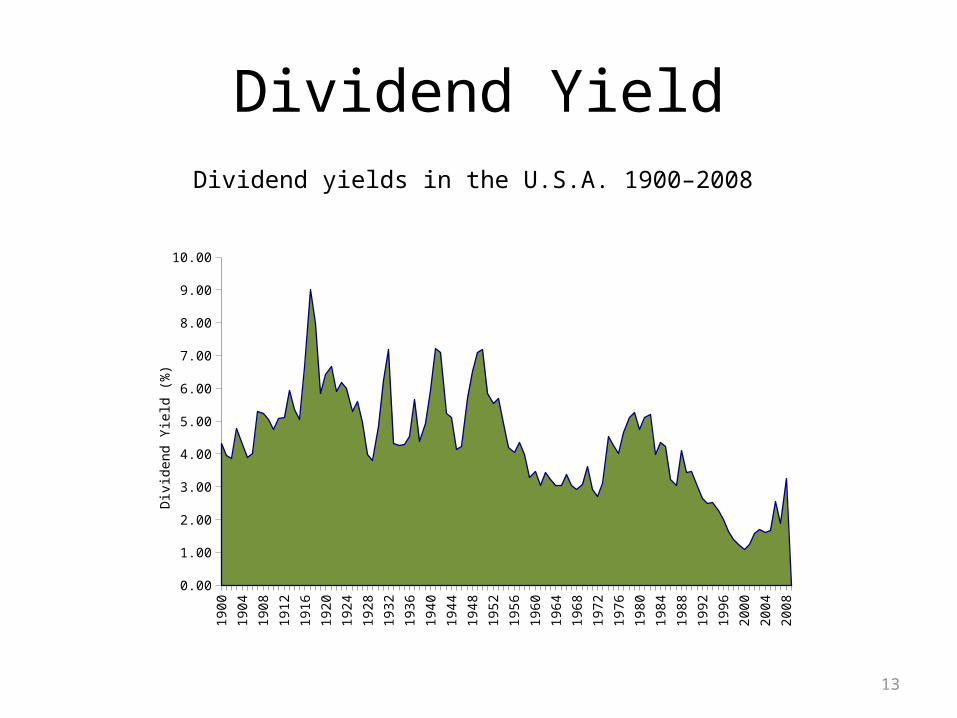
Dividend YieldDividend yields in the U.S.A. 1900–2008
1900
1903
1906
1909
1912
1915
1918
1921
1924
1927
1930
1933
1936
1939
1942
1945
1948
1951
1954
1957
1960
1963
1966
1969
1972
1975
1978
1981
1984
1987
1990
1993
1996
1999
2002
2005
2008
0.00
1.00
2.00
3.00
4.00
5.00
6.00
7.00
8.00
9.00
10.00
Div
iden
d Y
ield
(%
)

14
-60.0
-40.0
-20.0
0.0
20.0
40.0
60.0
80.0
Rates of Return 1900-2008
Source: Ibbotson Associates Year
Perc
enta
ge R
etur
nStock Market Index Returns
15
Measuring Risk
1 24
11 11
21
17
24
13
32
0
4
8
12
16
20
24
-50
to -
40
-40
to -
30
-30
to -
20
-20
to -
10
-10
to 0
0 to
10
10 t
o 20
20 t
o 30
30 t
o 40
40 t
o 50
50 t
o 60
Return %
# of Years
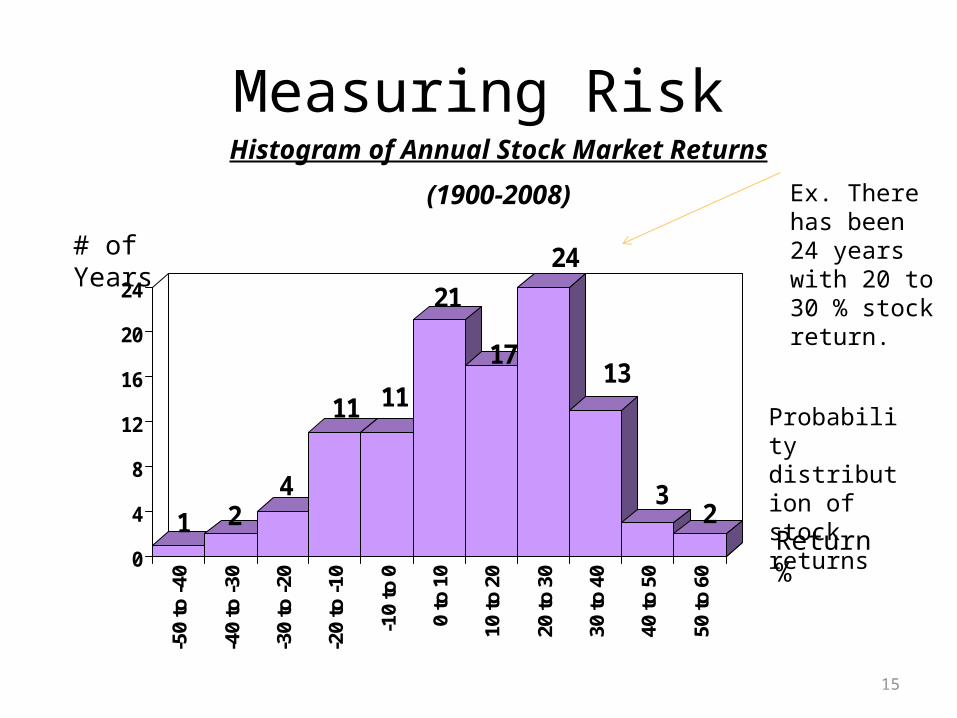
Histogram of Annual Stock Market Returns
(1900-2008)
Probability distribution of stock returns
Ex. There has been 24 years with 20 to 30 % stock return.

Thinking About Risk
• Message 1– Some Risks Look Big and Dangerous but Really Are
Diversifiable
• Message 2– Market Risks Are Macro Risks
• Message 3– Risk Can Be Measured

11-17
Historical Risk(1900-2010)

11-18
Risk and Diversification
DiversificationStrategy designed to reduce risk by spreading a portfolio across many investments.
Unique Risk:Risk factors affecting only that firm. Also called “diversifiable risk.”
Market Risk:Economy-wide sources of risk that affect the overall stock market. Also called “systematic risk.”
19
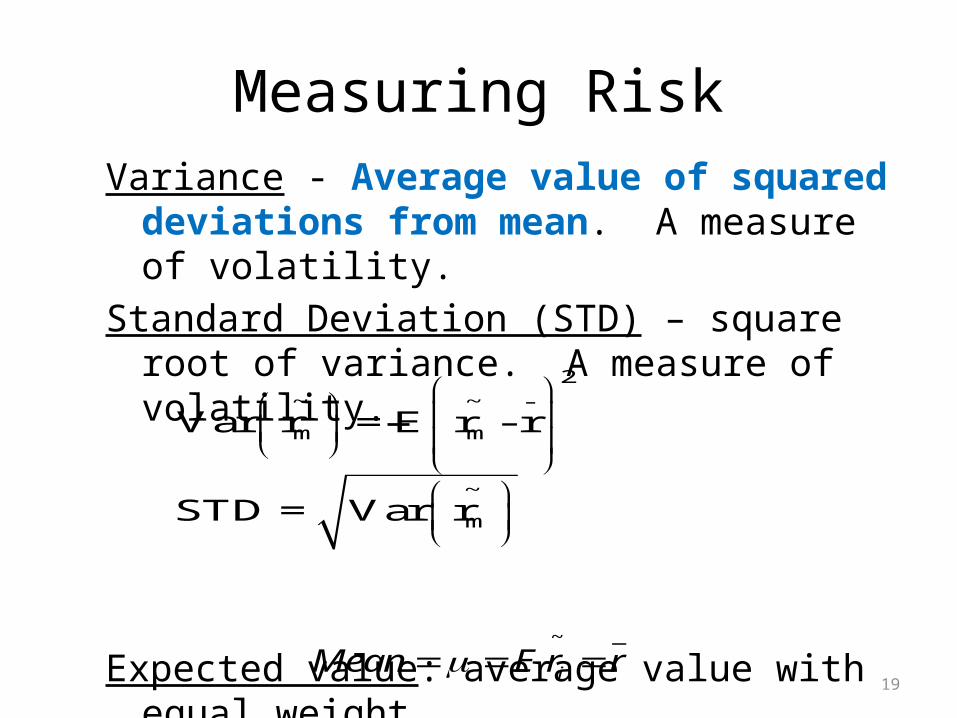
Measuring RiskVariance - Average value of squared deviations
from mean. A measure of volatility.Standard Deviation (STD) – square root of variance.
A measure of volatility.
Expected value: average value with equal weight.
2~ ~ -
m m
~
m
Var r = E r - r
STD = Var r
_~
iMean E r r

Measuring RiskExample from page: 320. Coin Toss Game-calculating
variance and standard deviation(1) (2) (3)
Percent Rate of Return Deviation from Mean Squared Deviation
+ 40 + 30 900
+ 10 0 0
+ 10 0 0
- 20 - 30 900
Variance = average of squared deviations = 1800 / 4 = 450
Standard deviation = square of root variance = 450 = 21.2%

21
Measuring RiskYou start with 100 kr. Toss two coins at a time. Head up you
gain 20%, tails up you lose 10%. There are all together 4 outcomes. (HH) (HT) (TH) (TT). Coin Toss Game-calculating variance and standard deviation

22
Measuring Risk
Portfolio rate
of return=
fraction of portfolio
in first assetx
rate of return
on first asset
+fraction of portfolio
in second assetx
rate of return
on second asset
((
(())
))
Expected return is just a weighted average of individual stock returns.

23
Dow Jones RiskAnnualized Standard Deviation of the DJIA over the preceding 52 weeks
(1900 – 2008)
0
10
20
30
40
50
60
70
Years
Stan
dard
Dev
iatio
n (%
)

24
Measuring Risk
Diversification - Strategy designed to reduce risk by spreading the portfolio across many investments.
Unique Risk - Risk factors affecting only that firm. Also called “diversifiable risk.”
Market Risk - Economy-wide sources of risk that affect the overall stock market. Also called “systematic risk.”

Market IndexDeviations from Squared
Year Rate of Return, % Average Return, % Deviations
2002 -20.9 -29.4 864.362003 31.6 23.1 533.612004 12.5 4.0 16.002005 6.4 -2.1 4.412006 15.8 7.3 53.292007 5.6 -2.9 8.41
Total 51.0 1,480.08
Average return = 51.0/6 = 8.50%246.6815.71%
Variance = average of squared deviations = 1,480.08/6 = Standard deviation = square root of variance =
Obs: step 1, get the Mean 8,5%, step 2, get the deviations from the mean and step 3, square it to get the variance. Since we have 6 years’ observations, divide it with 6.

11-26
Risk and Diversification

27
Portfolio Risk
22
22
211221
1221
211221
122121
21
σxσσρx x
σxx2Stock
σσρx x
σxxσx1Stock
2Stock 1Stock
The variance of a two stock portfolio is the sum of these four boxes
)σσρxx(2σxσxVariance Portfolio 21122122
22
21
21

28
Portfolio RiskExample
Suppose you invest 60% of your portfolio in Campbell Soup and 40% in Boeing. The expected dollar return on your Campbell Soup stock is 3.1% and on Boeing is 9.5%. The expected return on your portfolio is:
%7.5)5.940(.)1.360(.Return Expected

29
Portfolio Risk
2222
22
211221
2112212221
21
)7.23()40(.σx7.238.151
60.40.σσρxxBoeing
7.238.151
60.40.σσρxx)8.15()60(.σx Soup Campbell
Boeing Soup Campbell
Example
Suppose you invest 60% of your portfolio in Campbell Soup and 40% in Boeing. The expected dollar return on your Campbell Soup stock is 3.1% and on Boeing is 9.5%. The standard deviation of their annualized daily returns are 15.8% and 23.7%, respectively. Assume a correlation coefficient of 1.0 and calculate the portfolio variance.

11-30
Do stock prices move together?
What effect does diversification have on a portfolio’s total risk, unique risk and market risk?

31
Portfolio RiskExample
Suppose you invest 60% of your portfolio in Campbell Soup and 40% in Boeing. The expected dollar return on your Campbell Soup stock is 3.1% and on Boeing is 9.5%. The standard deviation of their annualized daily returns are 15.8% and 23.7%, respectively. Assume a correlation coefficient of 1.0 and calculate the portfolio variance.
% 19.0 5.359 Deviation Standard
5.35915.8x23.7)2(.40x.60x
]x(23.7)[(.40)
]x(15.8)[(.60) Variance Portfolio22
22
Obs: Since the correlation coefficient is 1, there is no portfolio risk reduction at all! The average standard deviation for the two stocks is the same 18,96%=15,8*0,6+23,7*0,4

32
Portfolio RiskAnother Example
Suppose you invest 60% of your portfolio in Exxon Mobil and 40% in Coca Cola. The expected dollar return on your Exxon Mobil stock is 10% and on Coca Cola is 15%. The expected return on your portfolio is:
%12)1540(.)1060(. ReturnExpected

33
Portfolio RiskAnother Example
Suppose you invest 60% of your portfolio in Exxon Mobil and 40% in Coca Cola. The expected dollar return on your Exxon Mobil stock is 10% and on Coca Cola is 15%. The standard deviation of their annualized daily returns are 18.2% and 27.3%, respectively. Assume a correlation coefficient of 1.0 and calculate the portfolio variance.
% 21.8 0.477 DeviationStandard
0.47718.2x27.3)2(.40x.60x
]x(27.3)[(.40)
]x(18.2)[(.60) Variance Portfolio22
22
Again the correlation coefficient= 1, no gain on diversification! But it sure lowered the risk and the return by averaging.

34
Portfolio Risk
)rx()r(x Return PortfolioExpected 2211
)σσρxx(2σxσxVariance Portfolio 21122122
22
21
21

35
Portfolio RiskExample Correlation Coefficient = .4Stocks %s % of Portfolio Avg ReturnABC Corp 28% 60% 15%Big Corp 42% 40% 21%
Standard Deviation = weighted avg. = 33.6 (this is an average of the std)Standard Deviation = Portfolio = 28.1
Real Standard Deviation:Portfolio Variance = (282)(.62) + (422)(.42) + 2(.4)(.6)(28)(42)(.4) STD=sqrt (Variance) = 28.1 CORRECT
Mean: r = (15%)(.60) + (21%)(.4) = 17.4%

36
Portfolio RiskExample Correlation Coefficient = .4Stocks s % of Portfolio Avg ReturnABC Corp 28% 60% 15%Big Corp 42% 40% 21%
Standard Deviation = weighted avg = 33.6 Standard Deviation = Portfolio = 28.1 Return = weighted avg = Portfolio = 17.4%
Let’s Add stock New Corp to the portfolio

37
Portfolio RiskExample Correlation Coefficient = .3Stocks s % of Portfolio Avg ReturnPortfolio 28.1 50% 17.4%New Corp 30 50% 19%
NEW Standard Deviation = weighted avg. std= 31.80 NEW Standard Deviation = Portfolio = 23.43 NEW Mean = weighted avg = Portfolio = 18.20%
NOTE: Higher return & Lower risk How did we do that? DIVERSIFICATION

38
The Variance Covariance MatrixThe shaded boxes contain variance terms; the remainder contain covariance terms. Adding them up you get the portfolio variance.
1
2
3
4
5
6
N
1 2 3 4 5 6 NSTOCK
STOCK
To calculate portfolio variance add up the boxes
39
Portfolio Risk
Market Portfolio - Portfolio of all assets in the economy. In practice a broad stock market index, such as the S&P Composite, is used to represent the market.
Beta - Sensitivity of a stock’s return to the return on the market portfolio.

40
The Security Market LineThe return on Dell stock changes on average by 1.41% for each additional 1% change inthe market return. Beta = 1.41.
fMif
imm
fMf
rrEr
rrErrE
)(
)()(
The model is the famous CAPM: Capital asset pricing model, you get the r---required rate of return or cost of capital from this!
41
Portfolio Risk
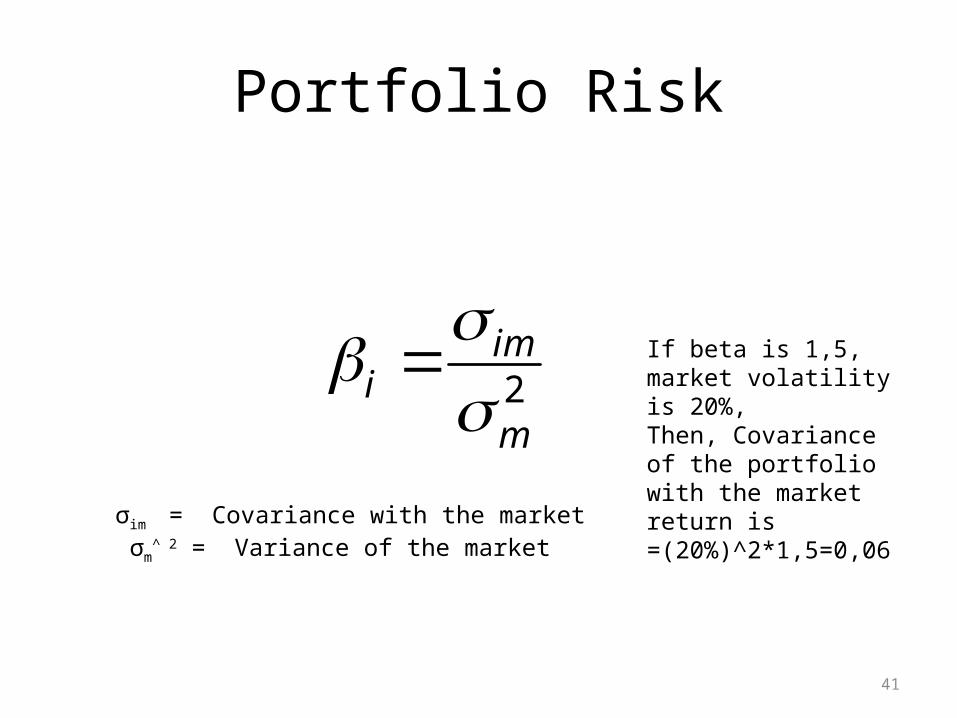
2im
im
σim = Covariance with the market σm
^ 2 = Variance of the market
If beta is 1,5, market volatility is 20%, Then, Covariance of the portfolio with the market return is =(20%)^2*1,5=0,06

42
Portfolio Risk
2m
imiB
Covariance with the market
Variance of the market
43
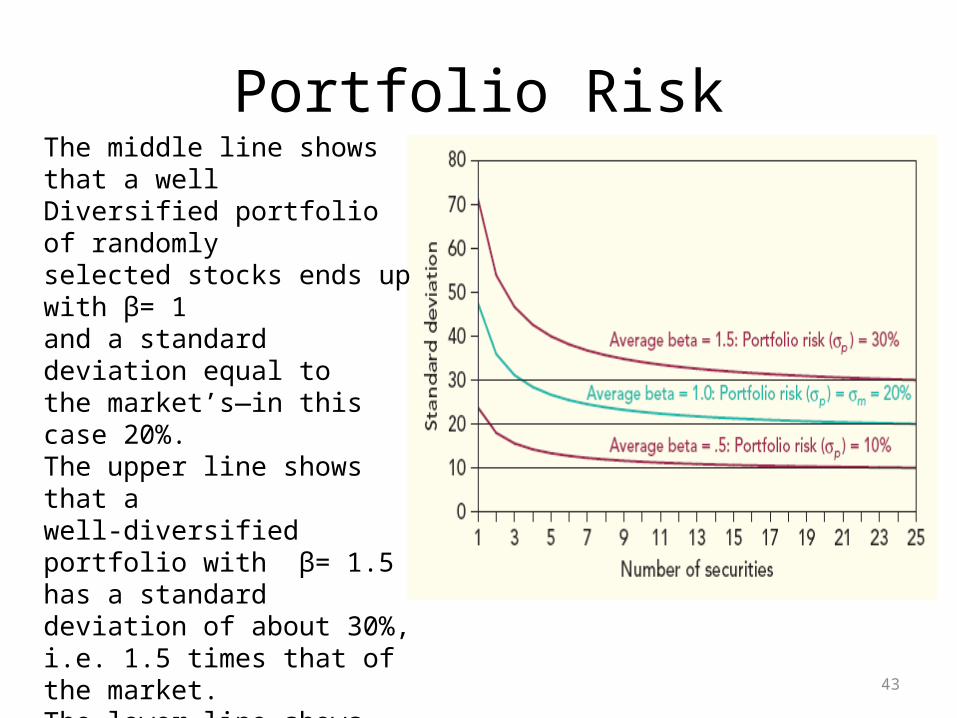
Portfolio RiskThe middle line shows that a wellDiversified portfolio of randomlyselected stocks ends up with β= 1and a standard deviation equal tothe market’s—in this case 20%.The upper line shows that awell-diversified portfolio with β= 1.5 has a standard deviation of about 30%, i.e. 1.5 times that of the market.The lower line shows that awell-diversified portfolio with β = .5 has a standard deviation of about 10%—half that of the market.
44
Beta
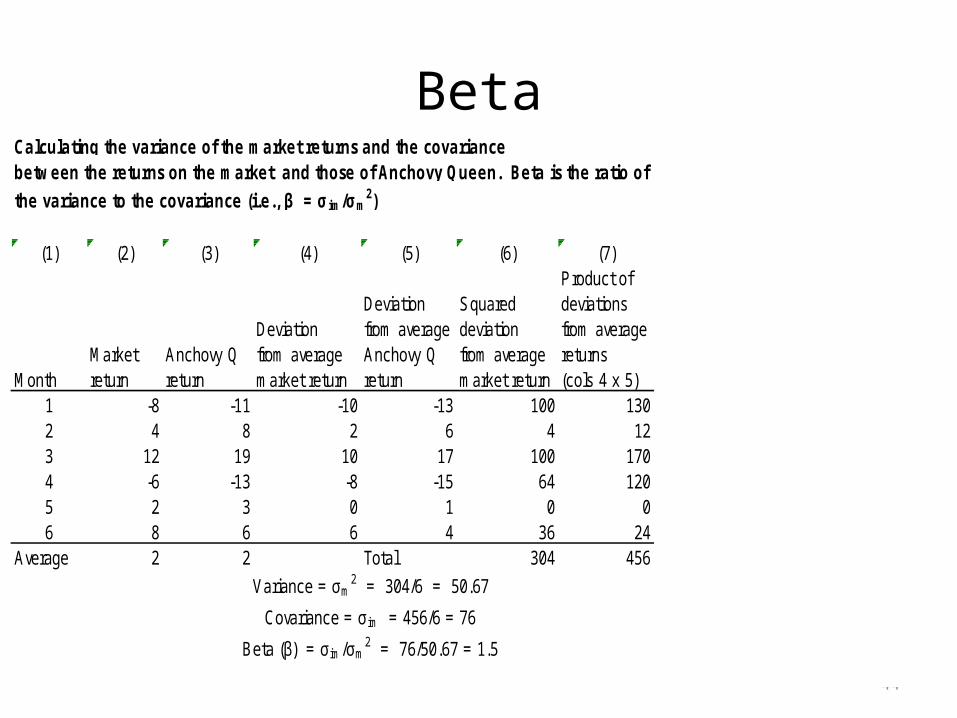
(1) (2) (3) (4) (5) (6) (7)Product of
Deviation Squared deviationsDeviation from average deviation from average
Market Anchovy Q from average Anchovy Q from average returnsMonth return return market return return market return (cols 4 x 5)
1 -8 -11 -10 -13 100 1302 4 8 2 6 4 123 12 19 10 17 100 1704 -6 -13 -8 -15 64 1205 2 3 0 1 0 06 8 6 6 4 36 24
Average 2 2 Total 304 456
Variance = σm2 = 304/6 = 50.67
Covariance = σ im = 456/6 = 76
Beta (β) = σ im /σm2 = 76/50.67 = 1.5
Calculating the variance of the market returns and the covariance between the returns on the market and those of Anchovy Queen. Beta is the ratio of
the variance to the covariance (i.e., β = σ im/σm2)
Check the figure see if it is right! Find out how to use excel to calculate variance and mean of a portfolio.