Embed Size (px)
Citation preview
Introduction to Spectral Cytometry using Cytek® Aurora and Northern Lights
Day 3

What happens when I have too much caffeine!
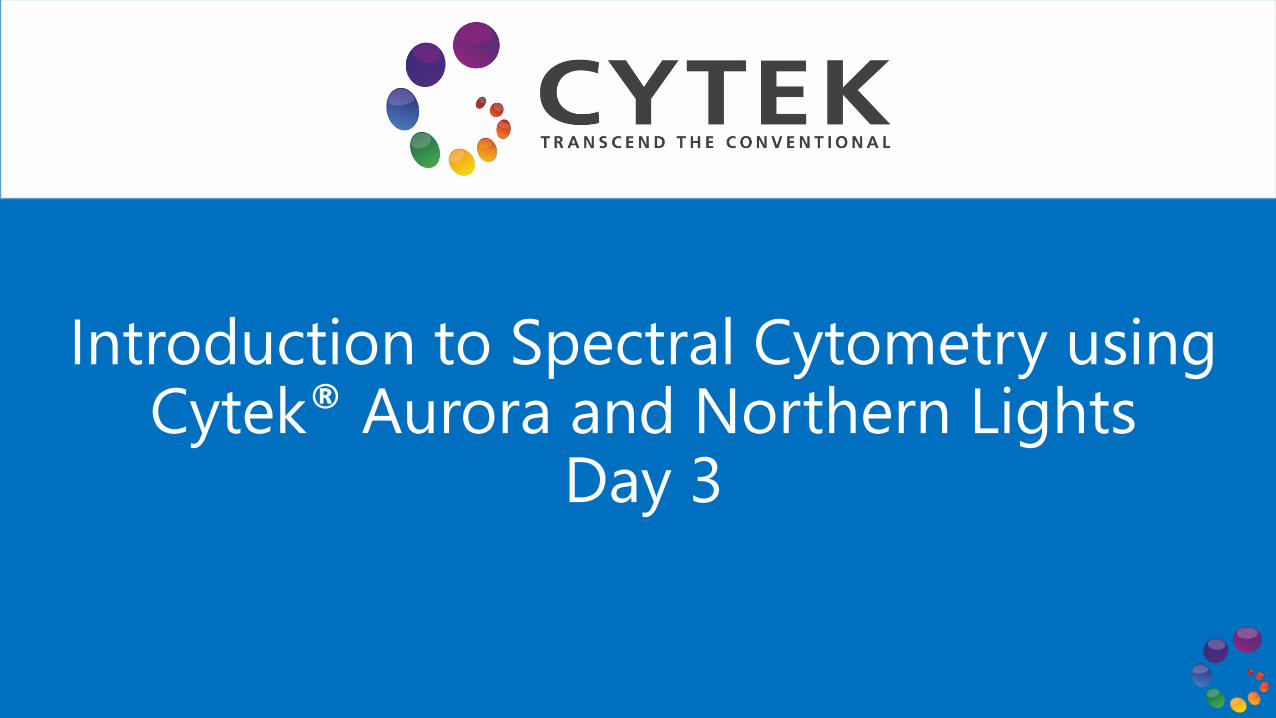
A B cell panel for human PBMCs
Marker FluorLevel of Expression /
Cell Frequency
Control: Beads
or CellsControl Stained With
CD19 BV510 High/ intermediate Cells Any bright BV510IgD BV421 High/ intermediate Cells Any bright BV421
CD27 BV785 Intermediate/ high Cells CD27 BV785, same lotCD62L BV605 High/ high Cells CD62L BV605, same lotCD38 Pacific Blue High/intermediate Cells Any bright Pacific BlueIgM BV650 High/ intermediate Cells IgM BV650, same lotIgG B711 Low/ low Beads IgG BV711, same lot
unstained PBMCs
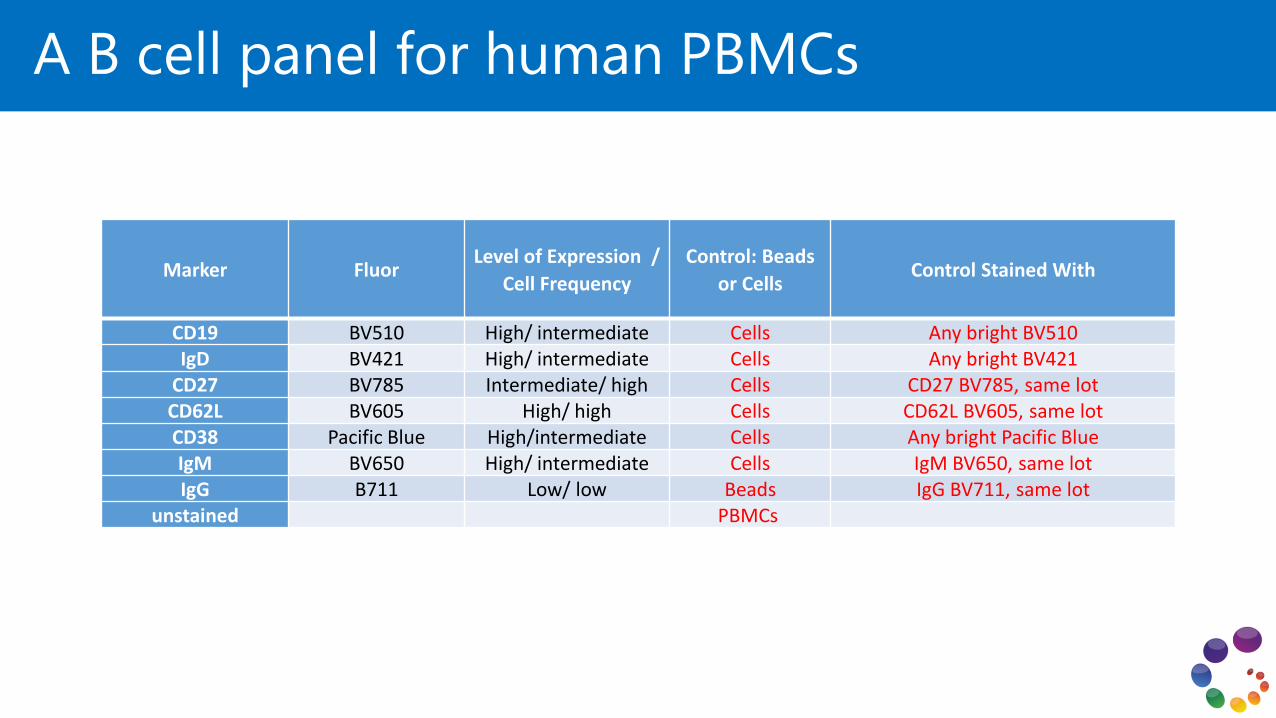
Intracellular Cytokine Staining/Proliferation Assay, cultured PBMCs
Marker Fluor Level of Expression /
Cell Frequency
Control: Beads
or Cells
Control Stained With
CFSE High/high Unstim cells CFSE well titrated*CD3 PE CF594 Low/ high Unstim cells CD3 PE-CF594, same lotCD4 APC Low/high Unstim cells Any bright APC, but CD4 is goodCD8 APC R700 Intermediate/high Cells CD8 APC-R700, same lotIFNg efluor 450 Intermediate/ int. Stim cells Any bright eFluor 450IL-4 PE Cy7 High/low Stim cells IL-4 PE-Cy7, same lot, higher stopping gate for enough events
IL-17 PerCP e710 Low/low Beads IL-17 PerCPeFluor710, same lotviability Aqua Amine Dye high/low Cells Aqua Amine Dye
unstained PBMCs cultured Unstim and stimulated
Separate controls
*Switch CFSE to Cell Trace Violet – much easier to titrate into range
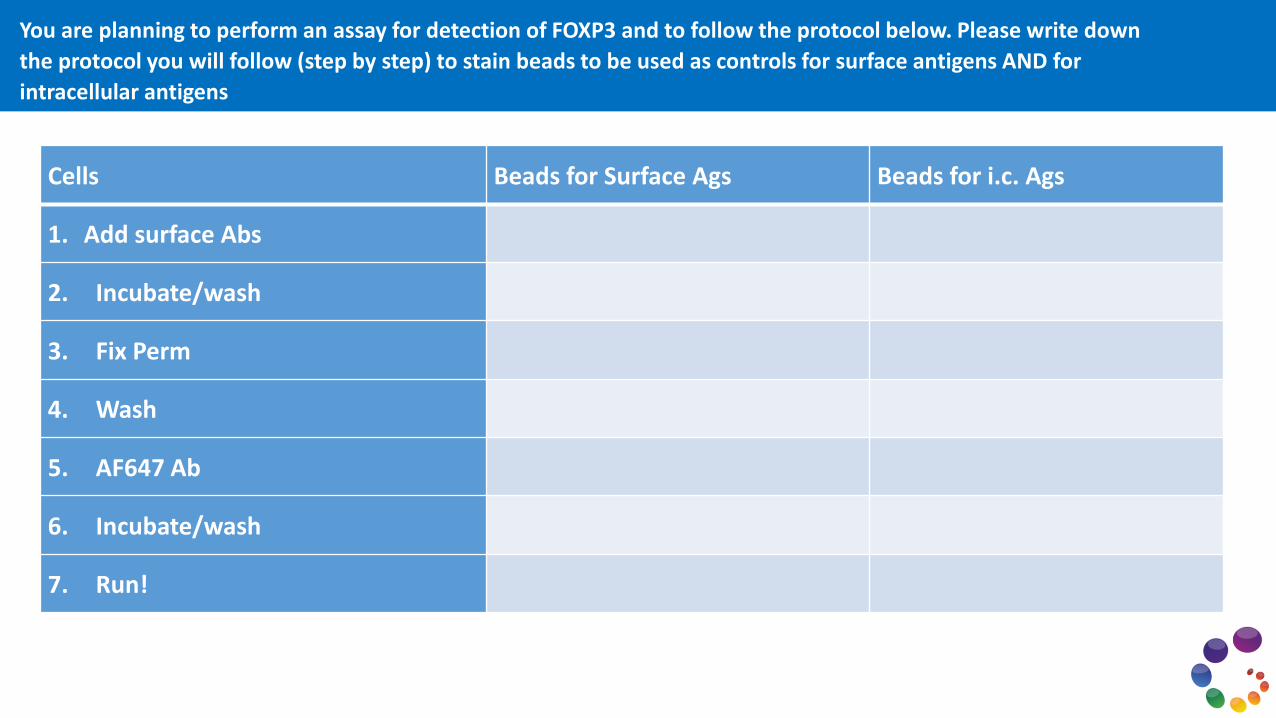
Cells Beads for Surface Ags Beads for i.c. Ags
1. Add surface Abs
2. Incubate/wash
3. Fix Perm
4. Wash
5. AF647 Ab
6. Incubate/wash
7. Run!
You are planning to perform an assay for detection of FOXP3 and to follow the protocol below. Please write down
the protocol you will follow (step by step) to stain beads to be used as controls for surface antigens AND for
intracellular antigens
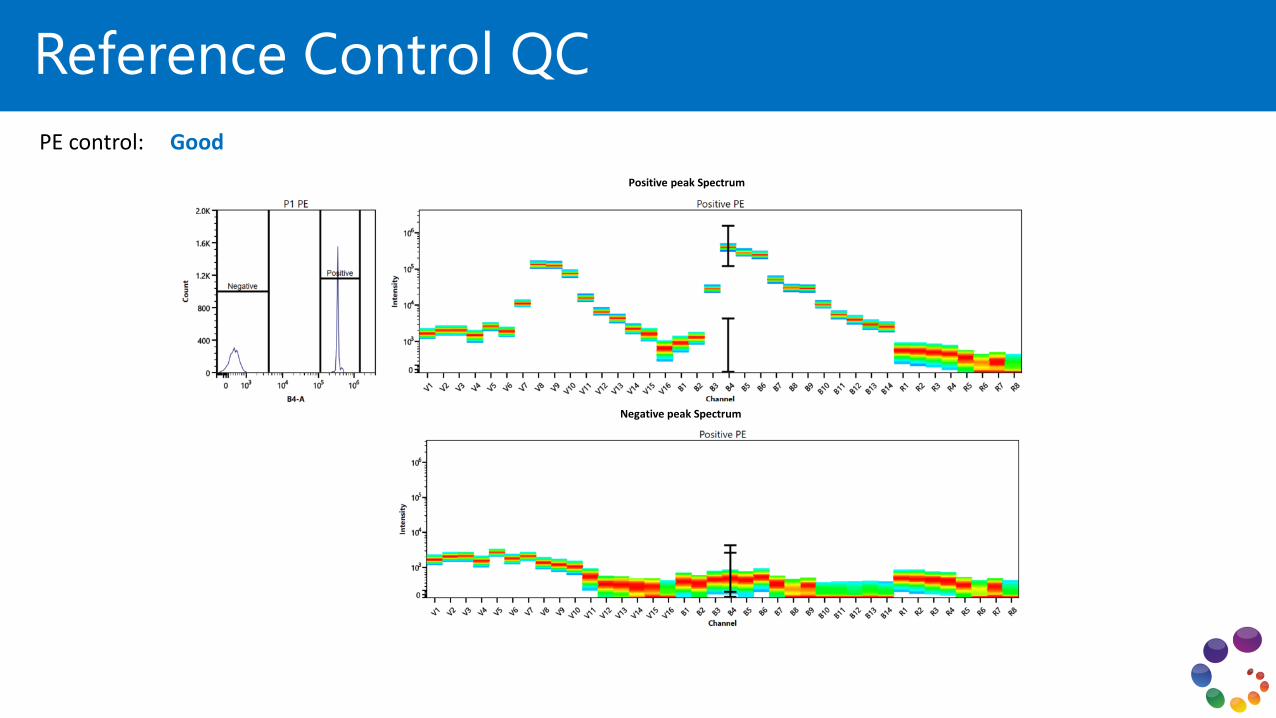
Reference Control QC
Positive peak Spectrum
Negative peak Spectrum
PE control: Good
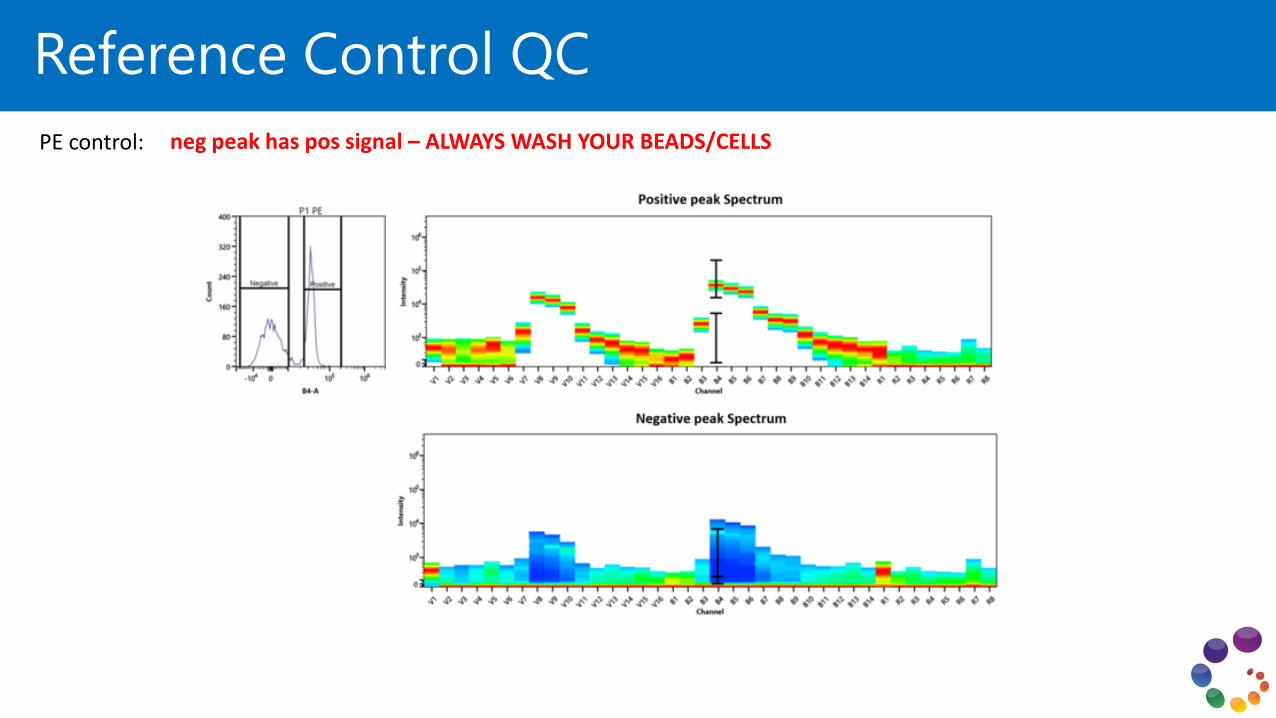
Reference Control QC
PE control: neg peak has pos signal – ALWAYS WASH YOUR BEADS/CELLS
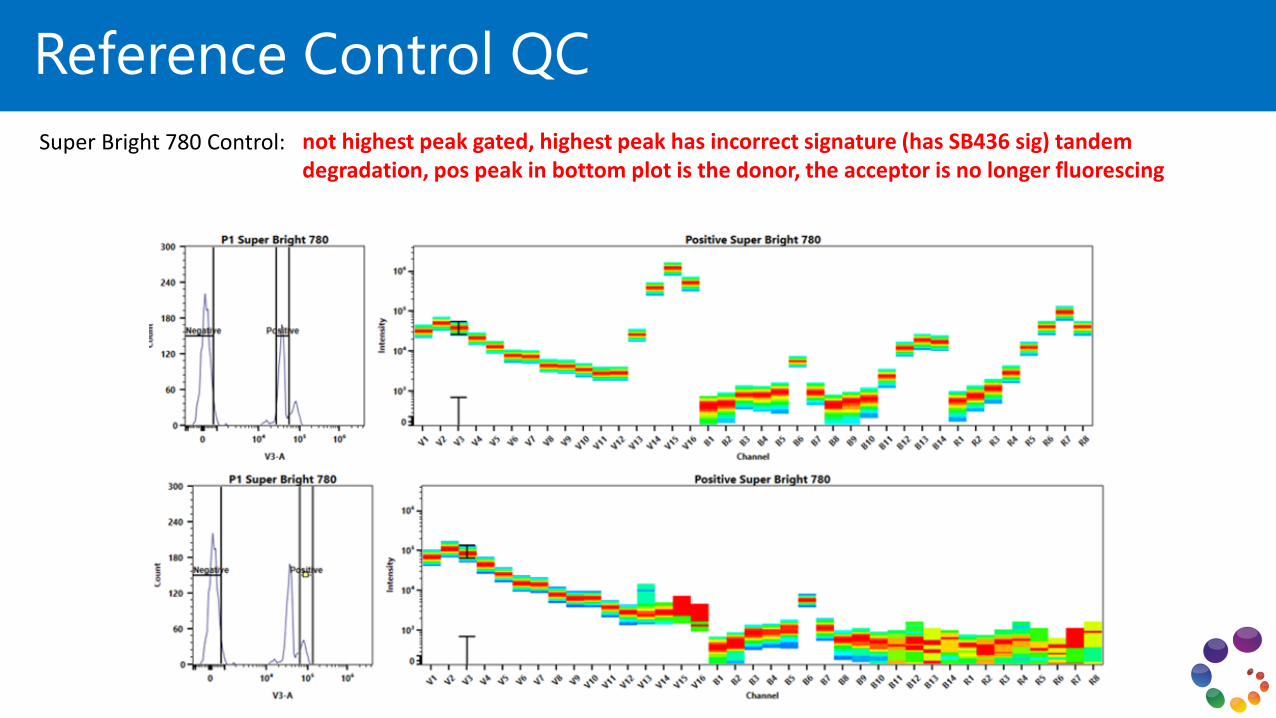
Reference Control QC
Super Bright 780 Control: not highest peak gated, highest peak has incorrect signature (has SB436 sig) tandem degradation, pos peak in bottom plot is the donor, the acceptor is no longer fluorescing
Reference Control QC
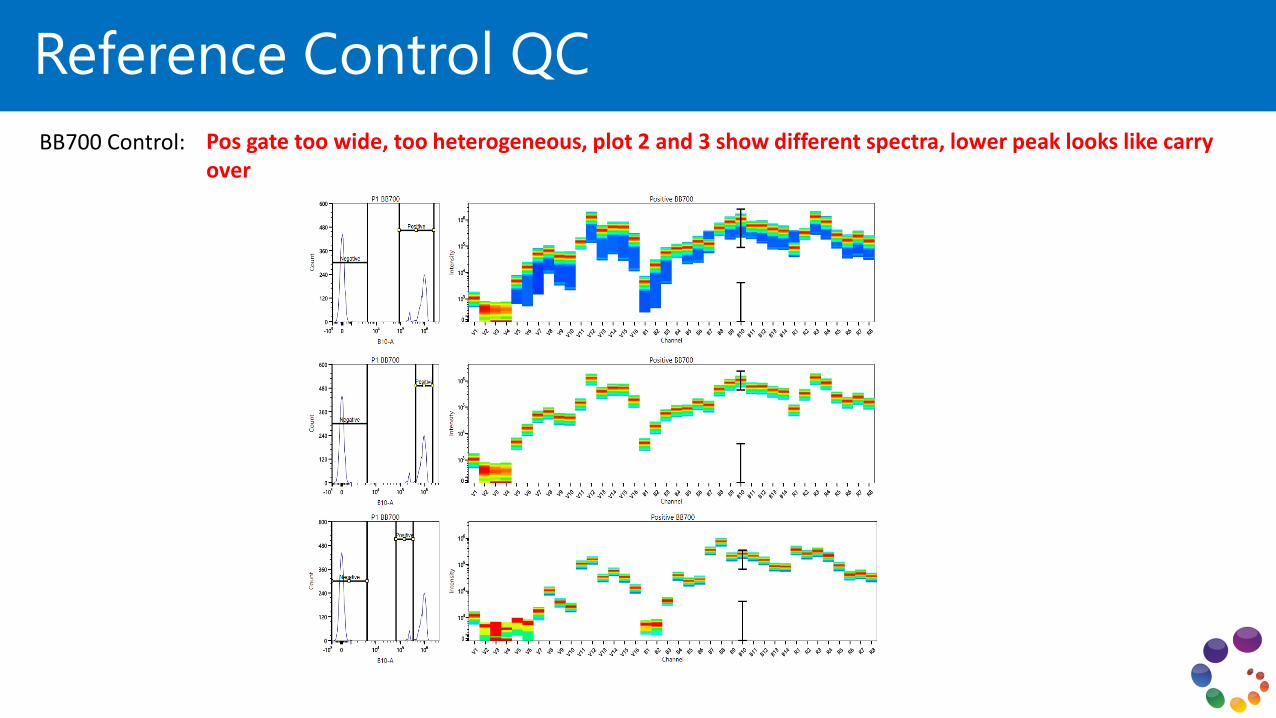
BB700 Control: Pos gate too wide, too heterogeneous, plot 2 and 3 show different spectra, lower peak looks like carry over
Reference Control QC
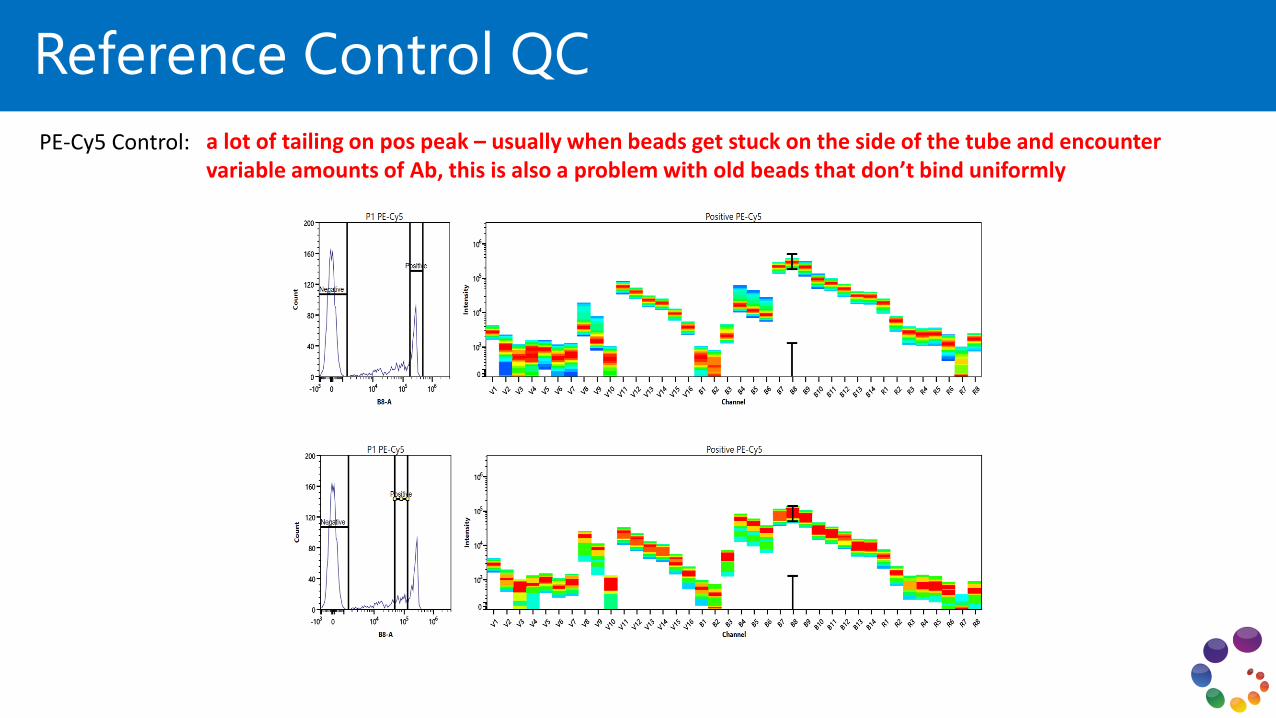
PE-Cy5 Control: a lot of tailing on pos peak – usually when beads get stuck on the side of the tube and encounter variable amounts of Ab, this is also a problem with old beads that don’t bind uniformly
Knowledge Review
• Analyze full spectrum signatures✓Understand how full spectrum signatures are generated
✓Identify unique signatures
✓Normalize spectrum signatures
✓QC and troubleshoot signatures
• Understand the fundamentals of spectral unmixing✓How it works
✓How it compares to compensation
✓Understand the workflow in Spectroflo
✓Understand the requirements for optimal reference controls
✓How to QC reference controls
Objectives
By the end of Day 3, you should be able to:
• Understand how to plan and design a multicolor panel✓Understand the fundamentals of panel design
✓Understand the tools available for fluorochrome selection and successful panel design
✓Panel performance evaluation and optimization strategies

Know the BiologyPlanning a Multicolor Experiment
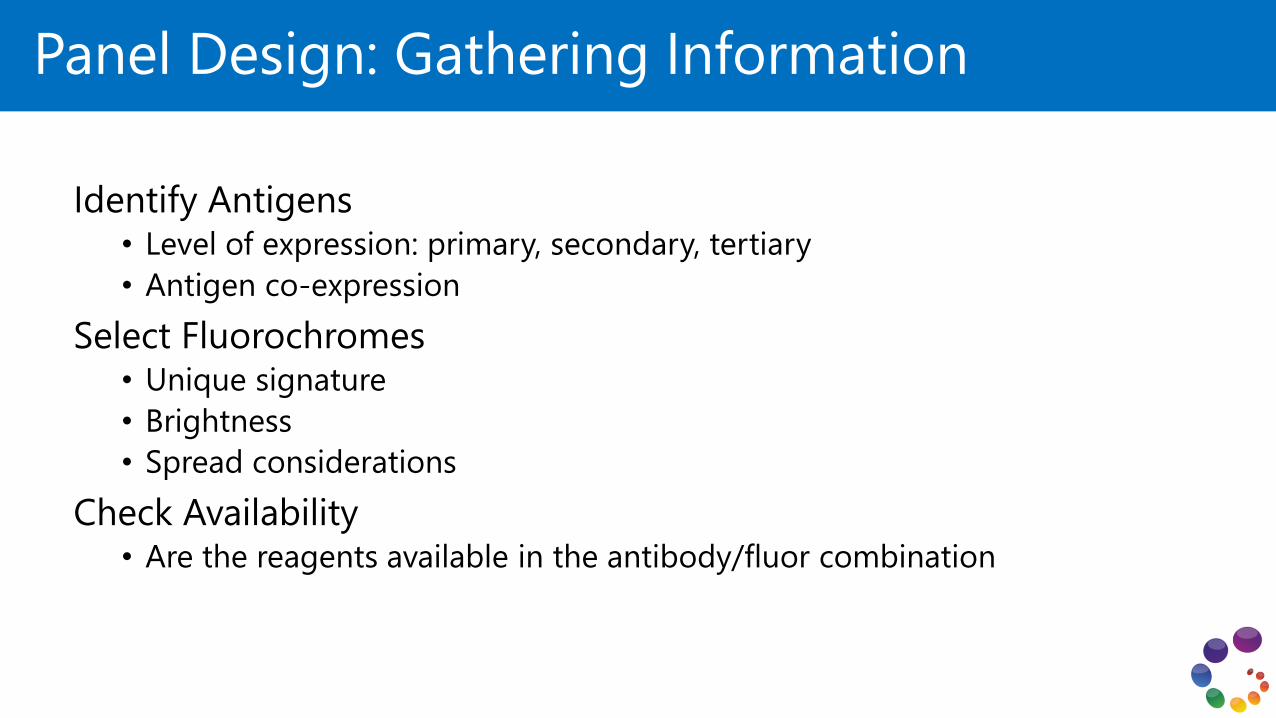
Panel Design: Gathering Information
Identify Antigens• Level of expression: primary, secondary, tertiary
• Antigen co-expression
Select Fluorochromes• Unique signature
• Brightness
• Spread considerations
Check Availability • Are the reagents available in the antibody/fluor combination
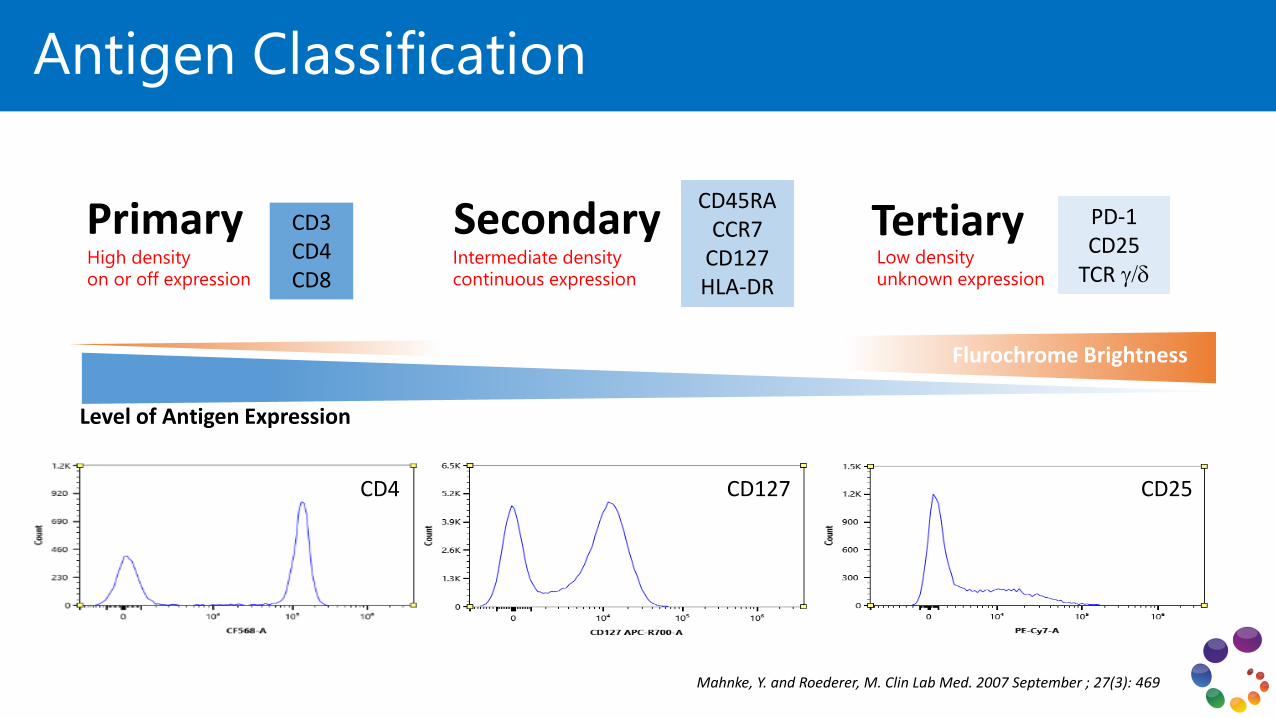
SecondaryPrimary TertiaryCD3CD4CD8
CD45RA CCR7
CD127HLA-DR
PD-1CD25
TCR g/d
Level of Antigen Expression
Mahnke, Y. and Roederer, M. Clin Lab Med. 2007 September ; 27(3): 469
Antigen Classification
High densityon or off expression
Intermediate densitycontinuous expression
Low densityunknown expression
CD4 CD127 CD25
Flurochrome Brightness
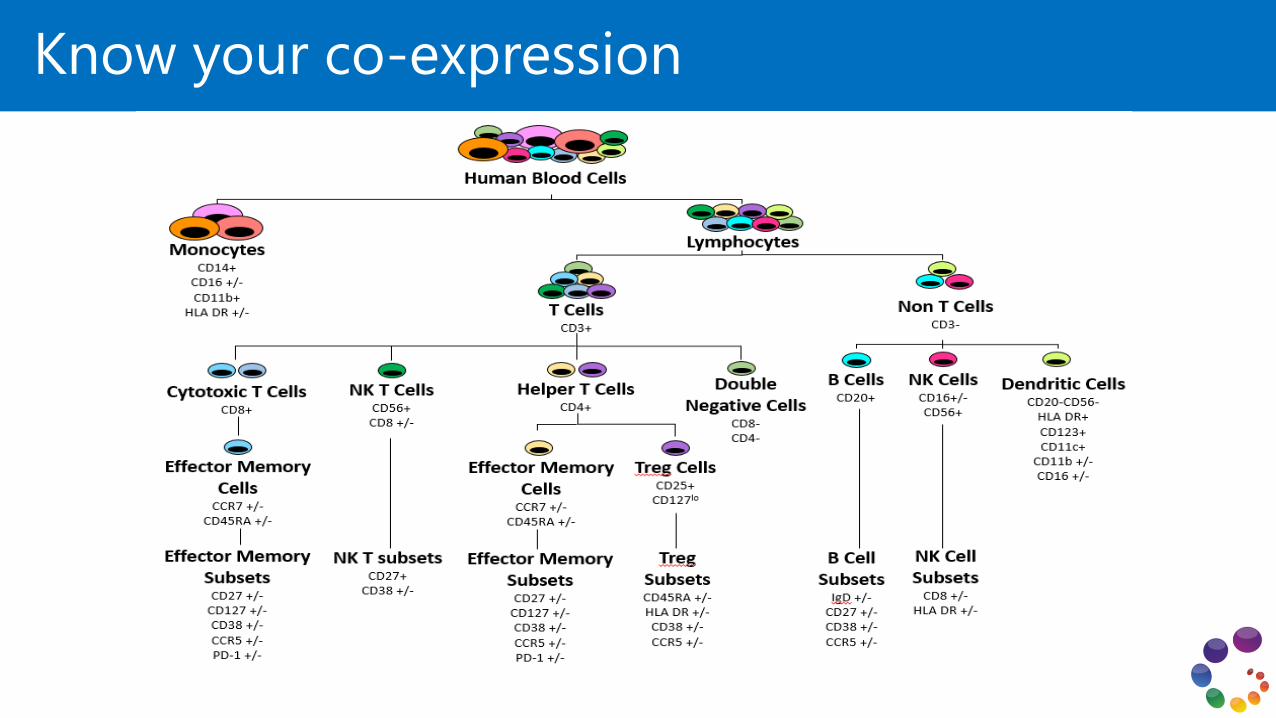
Know your co-expression
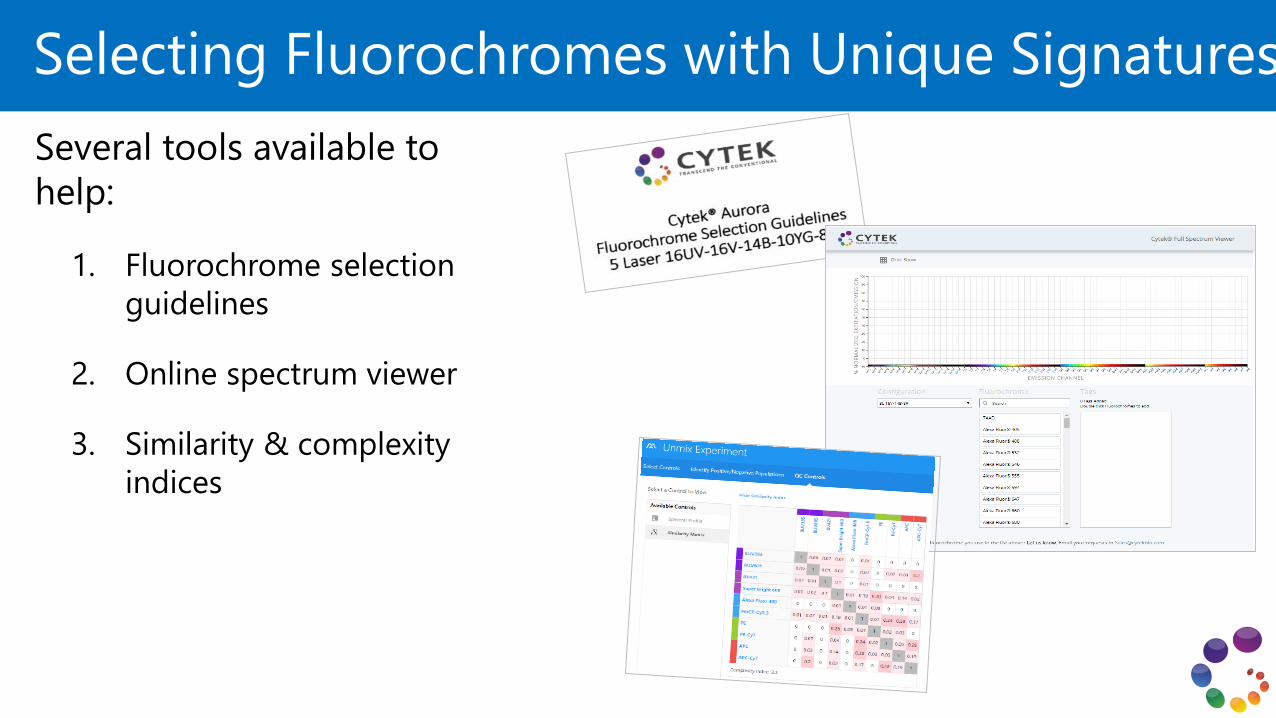
Selecting Fluorochromes with Unique Signatures
Several tools available to
help:
1. Fluorochrome selection
guidelines
2. Online spectrum viewer
3. Similarity & complexity
indices
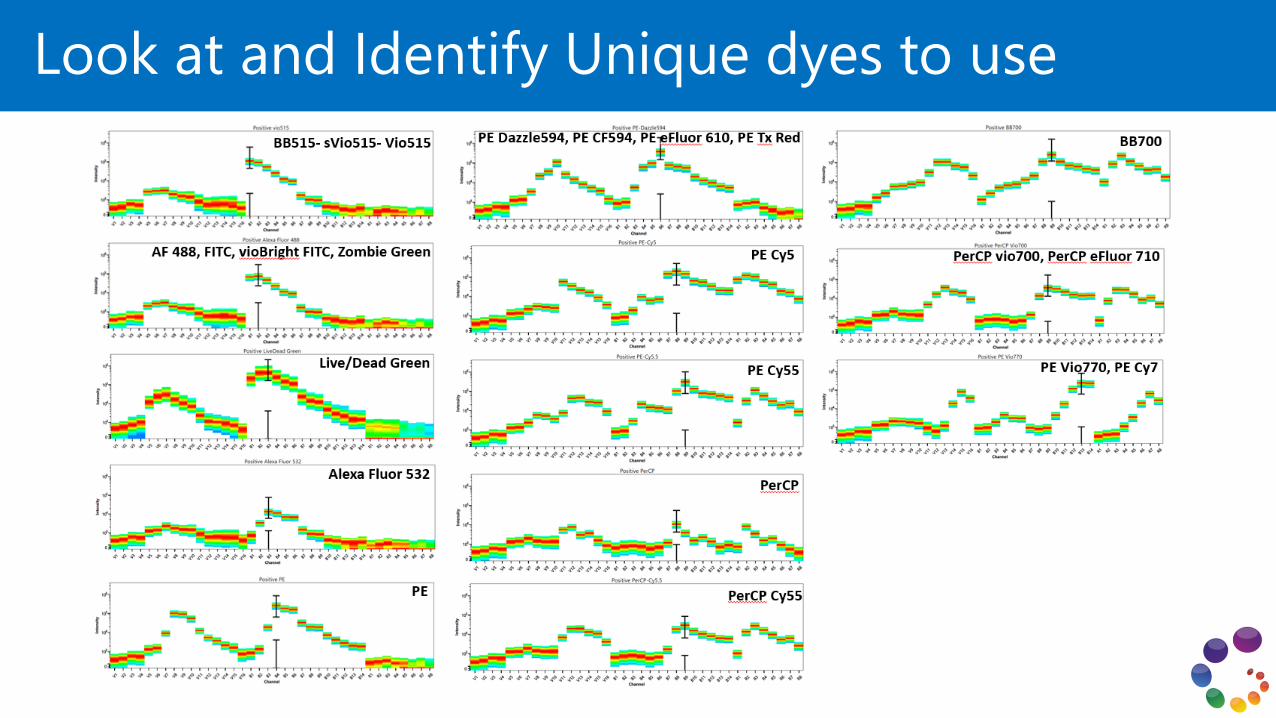
Blue Laser Unique SignaturesLook at and Identify Unique dyes to use

Fluorochrome selectionStain index
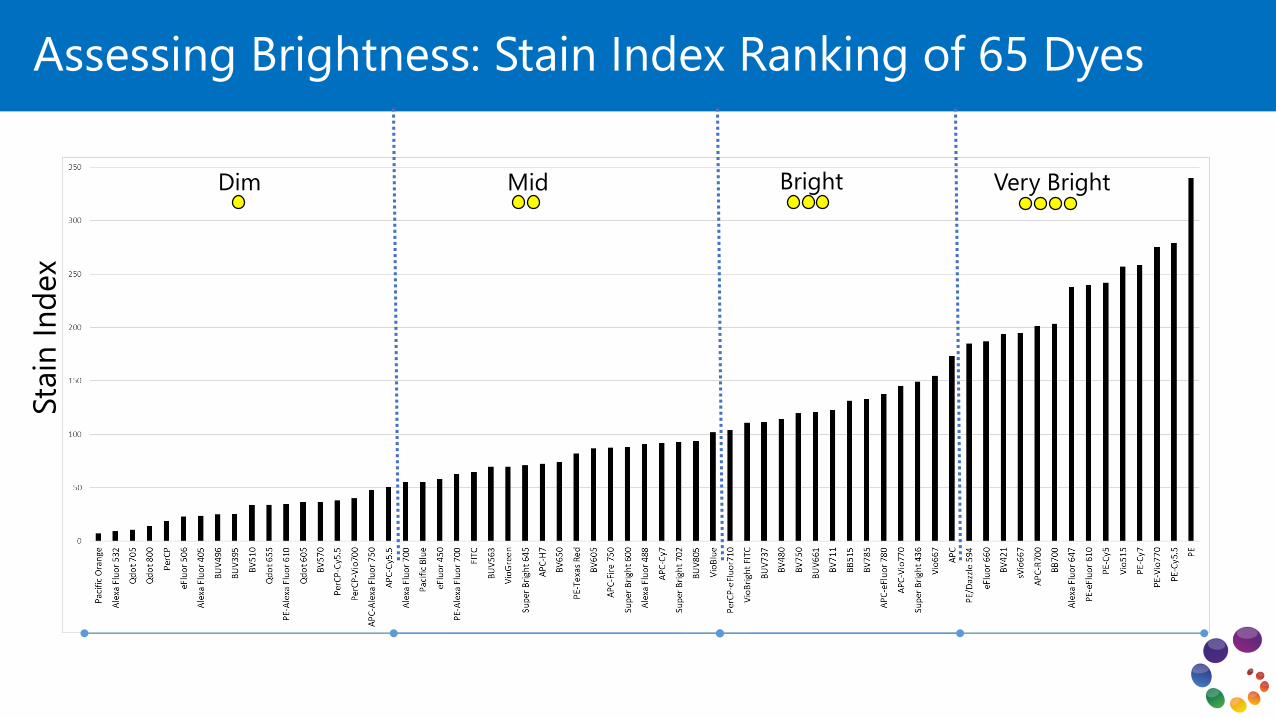
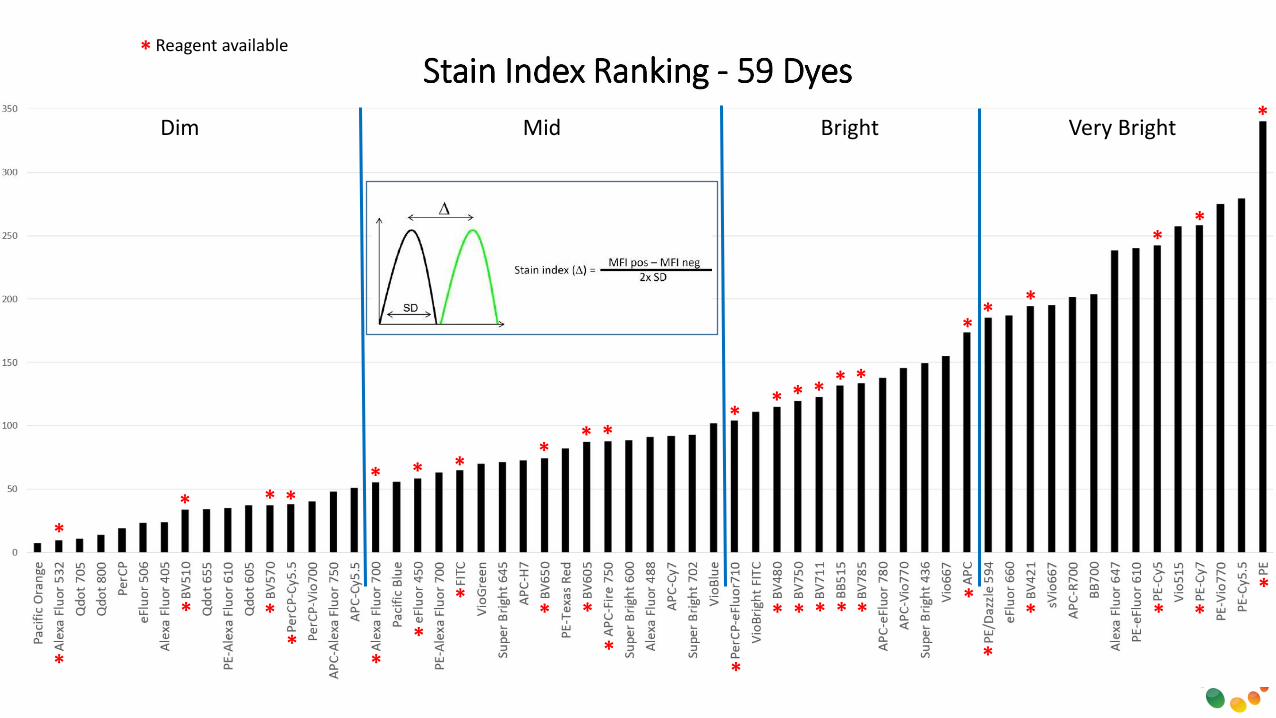
Assessing Brightness: Stain Index Ranking of 65 DyesSta
in In
dex
Dim Mid Bright Very Bright
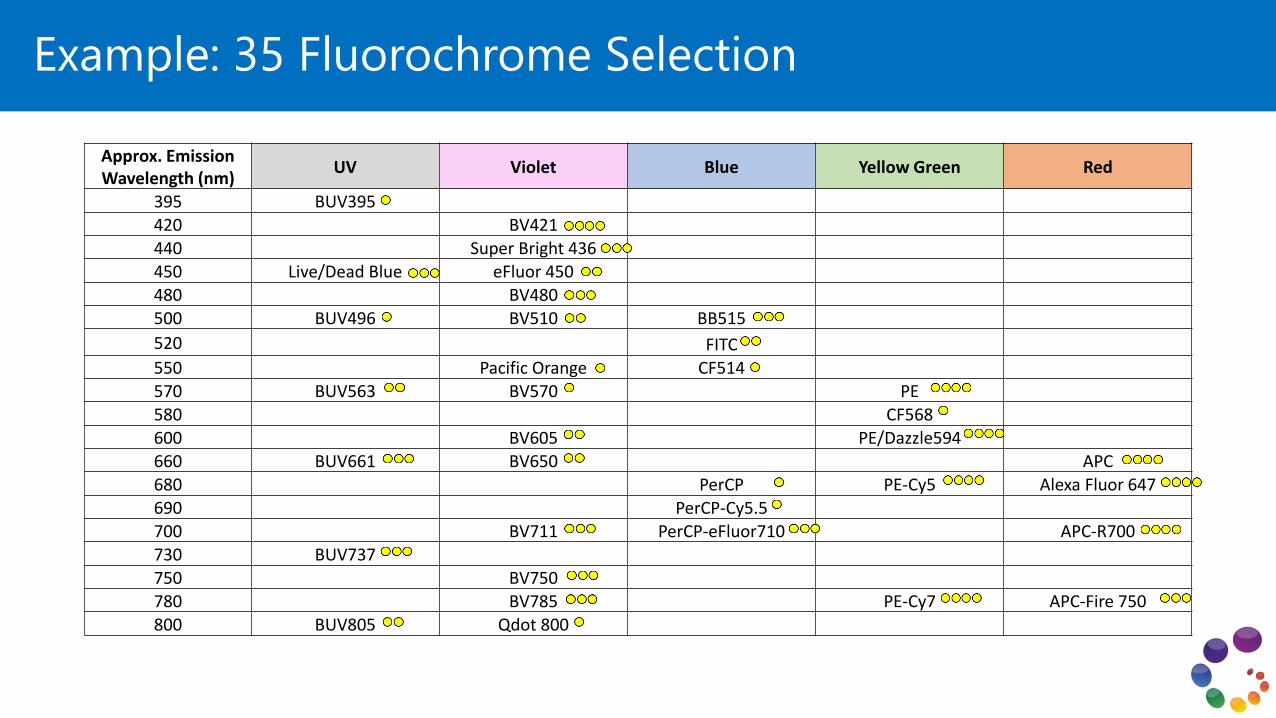
Example: 35 Fluorochrome Selection
Approx. Emission Wavelength (nm)
UV Violet Blue Yellow Green Red
395 BUV395
420 BV421440 Super Bright 436450 Live/Dead Blue eFluor 450
480 BV480500 BUV496 BV510 BB515
520 FITC
550 Pacific Orange CF514570 BUV563 BV570 PE580 CF568600 BV605 PE/Dazzle594
660 BUV661 BV650 APC680 PerCP PE-Cy5 Alexa Fluor 647
690 PerCP-Cy5.5700 BV711 PerCP-eFluor710 APC-R700
730 BUV737750 BV750780 BV785 PE-Cy7 APC-Fire 750
800 BUV805 Qdot 800

Fluorochrome selectionUnderstanding Spread
SINGLE COLOR SCENARIO
Marker A Fluor X
Marker A Fluor Y
MFI Fluor X
Co
un
ts
MFI Fluor Y
Co
un
ts
Main Contributors for Resolution Reduction
• Instrument Performance
• Instrument Setup
• Fluorochrome Brightness
MULTICOLOR SCENARIO
Marker A Fluor XSINGLE STAINED
Marker A Fluor XMULTICOLOR TUBE
MFI Fluor X
Co
un
ts
MFI Fluor X
Co
un
ts
Main Contributors for Resolution Reduction
• Spread
• Antibody titer
Assessing Antigen Resolution
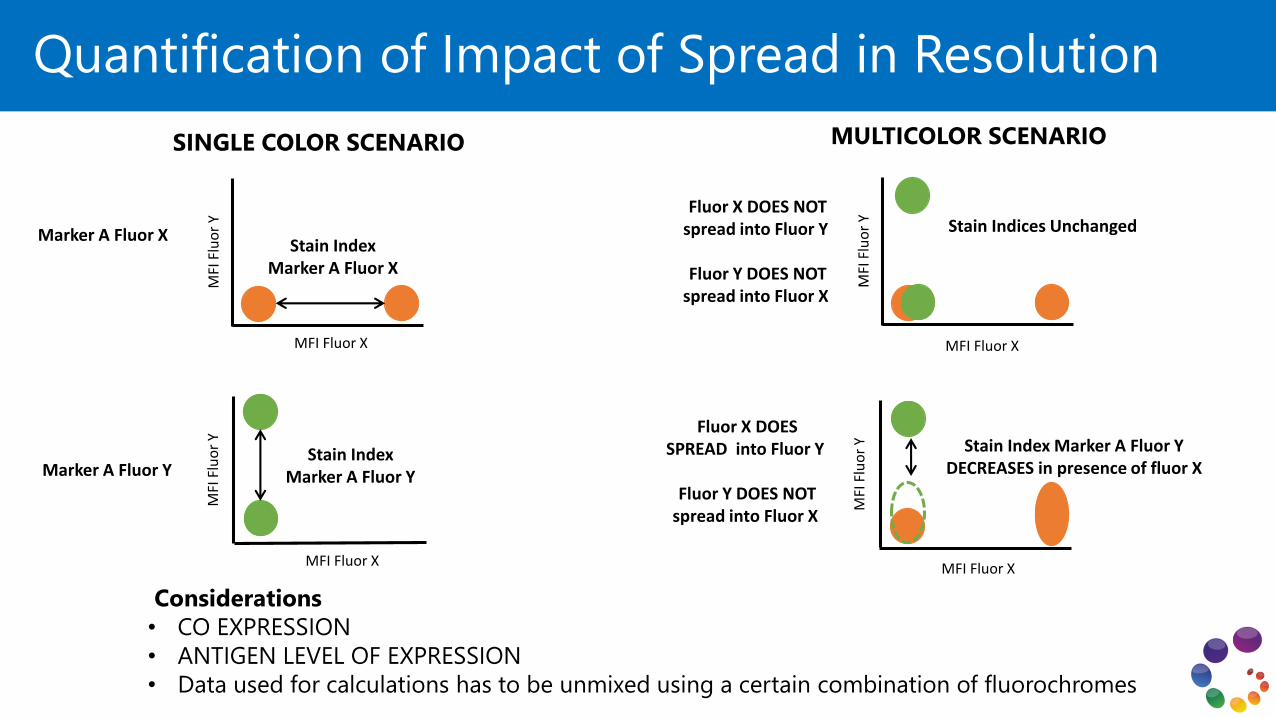
SINGLE COLOR SCENARIO
Marker A Fluor X
Marker A Fluor Y
MFI Fluor X
MFI
Flu
or
Y
MFI Fluor X
MFI
Flu
or
Y
Stain Index Marker A Fluor X
Stain Index Marker A Fluor Y
MULTICOLOR SCENARIO
Fluor X DOES NOT spread into Fluor Y
Fluor Y DOES NOT spread into Fluor X
MFI
Flu
or
Y
Stain Indices Unchanged
MFI Fluor X
Fluor X DOES SPREAD into Fluor Y
Fluor Y DOES NOT spread into Fluor X
MFI
Flu
or
Y Stain Index Marker A Fluor YDECREASES in presence of fluor X
MFI Fluor X
Considerations
• CO EXPRESSION
• ANTIGEN LEVEL OF EXPRESSION
• Data used for calculations has to be unmixed using a certain combination of fluorochromes
Quantification of Impact of Spread in Resolution
Cross Stain Index Calculation
Fluor X DOES
SPREAD into Fluor Y
Fluor Y DOES NOT
spread into Fluor X MFI Flu
or
Y Stain Index Marker A Fluor Y
DECREASES in presence of fluor X
MFI Fluor X
By unmixing CD4 stained cells
with multiple fluors we can
assess how much the positive
population spread into other
dyes (rSD) .
1 2
Spread % Reduction
We use that spread to calculate how much the
single stained Stain Index (1) is reduced by the
spread introduced by another dye (2)
25
Cross Stain Index Matrix: 35 Color Panel
Dye in row impacts dye in column
BU
V3
95
LIV
E D
EAD
Blu
e
BU
V4
96
BU
V5
63
BU
V6
61
BU
V7
37
BU
V8
05
BV
42
1
Sup
er
Bri
ght
43
6
eFl
uo
r 4
50
BV
48
0
BV
51
0
Pac
ific
Ora
nge
BV
57
0
BV
60
5
BV
65
0
BV
71
1
BV
75
0
BV
78
5
Qd
ot
80
0
BB
51
5
FITC
CF5
14
Pe
rCP
Pe
rCP
-Cy5
.5P
erC
P-e
Flu
or
71
0P
E
CF5
68
PE-
Daz
zle
594
PE-
Cy5
PE-
Cy7
AP
C
Ale
xa F
luo
r 6
47
AP
C-R
70
0
AP
C-e
Flu
or
78
0
BUV395LIVE DEAD Blue
BUV496BUV563BUV661BUV737BUV805BV421
Super Bright 436eFluor 450
BV480BV510
Pacific OrangeBV570BV605BV650BV711BV750BV785
Qdot 800BB515FITC
CF514PerCP
PerCP-Cy5.5
PerCP-eFluor 710
PECF568
PE-Dazzle594PE-Cy5PE-Cy7
APCAlexa Fluor 647
APC-R700APC-eFluor 780
No
Impact
High
Impact
Unmixed CD4 APC
APC
BU
V395
Unmixed CD4 PE-Cy7
BU
V805
PE-Cy7
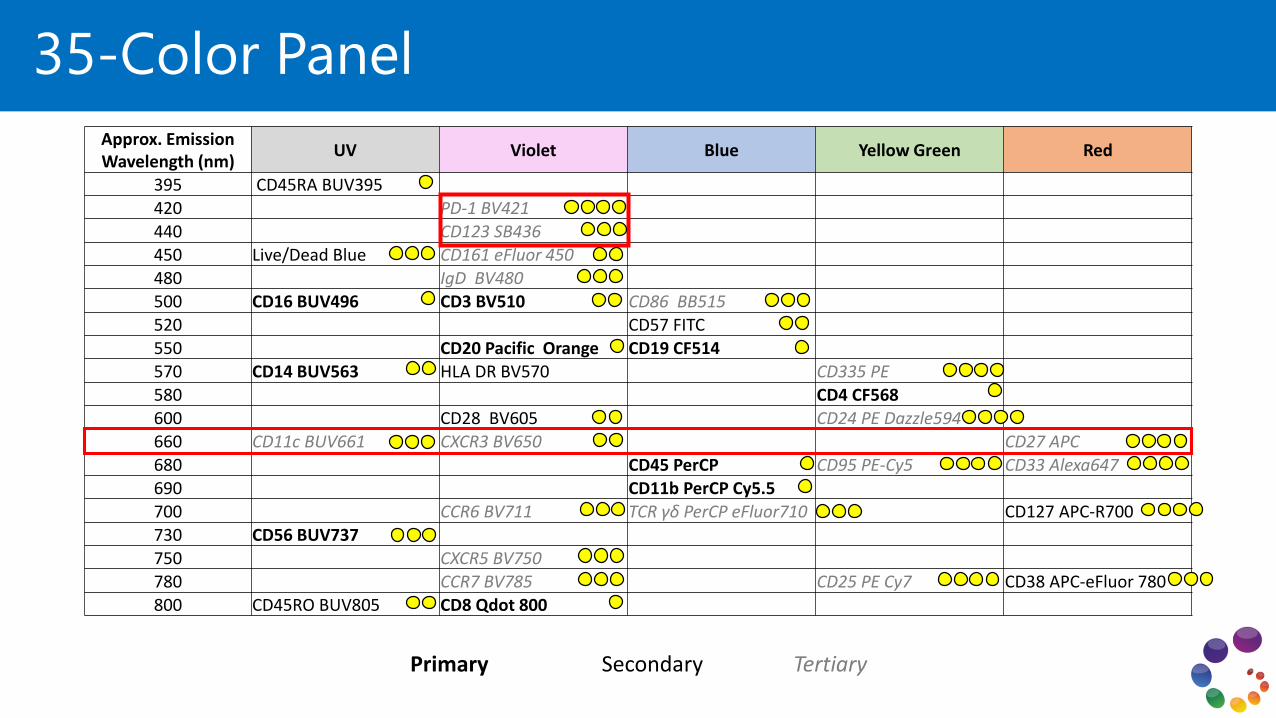
35-Color Panel
Approx. Emission Wavelength (nm)
UV Violet Blue Yellow Green Red
395 CD45RA BUV395420 PD-1 BV421
440 CD123 SB436
450 Live/Dead Blue CD161 eFluor 450480 IgD BV480500 CD16 BUV496 CD3 BV510 CD86 BB515520 CD57 FITC550 CD20 Pacific Orange CD19 CF514570 CD14 BUV563 HLA DR BV570 CD335 PE
580 CD4 CF568600 CD28 BV605 CD24 PE Dazzle594
660 CD11c BUV661 CXCR3 BV650 CD27 APC
680 CD45 PerCP CD95 PE-Cy5 CD33 Alexa647690 CD11b PerCP Cy5.5700 CCR6 BV711 TCR γδ PerCP eFluor710 CD127 APC-R700
730 CD56 BUV737750 CXCR5 BV750780 CCR7 BV785 CD25 PE Cy7 CD38 APC-eFluor 780
800 CD45RO BUV805 CD8 Qdot 800
Primary Secondary Tertiary
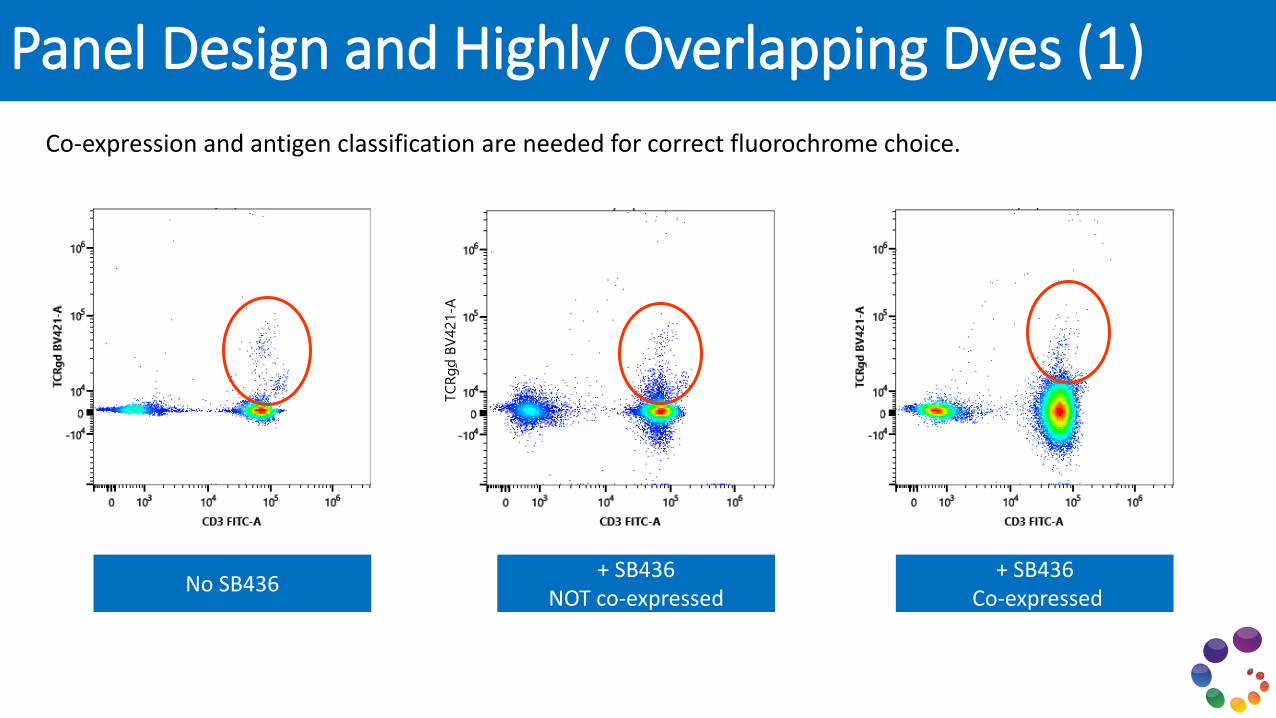
Co-expression and antigen classification are needed for correct fluorochrome choice.
Panel Design and Highly Overlapping Dyes (1)
No SB436+ SB436
NOT co-expressed+ SB436
Co-expressed
TC
Rg
dB
V421-A
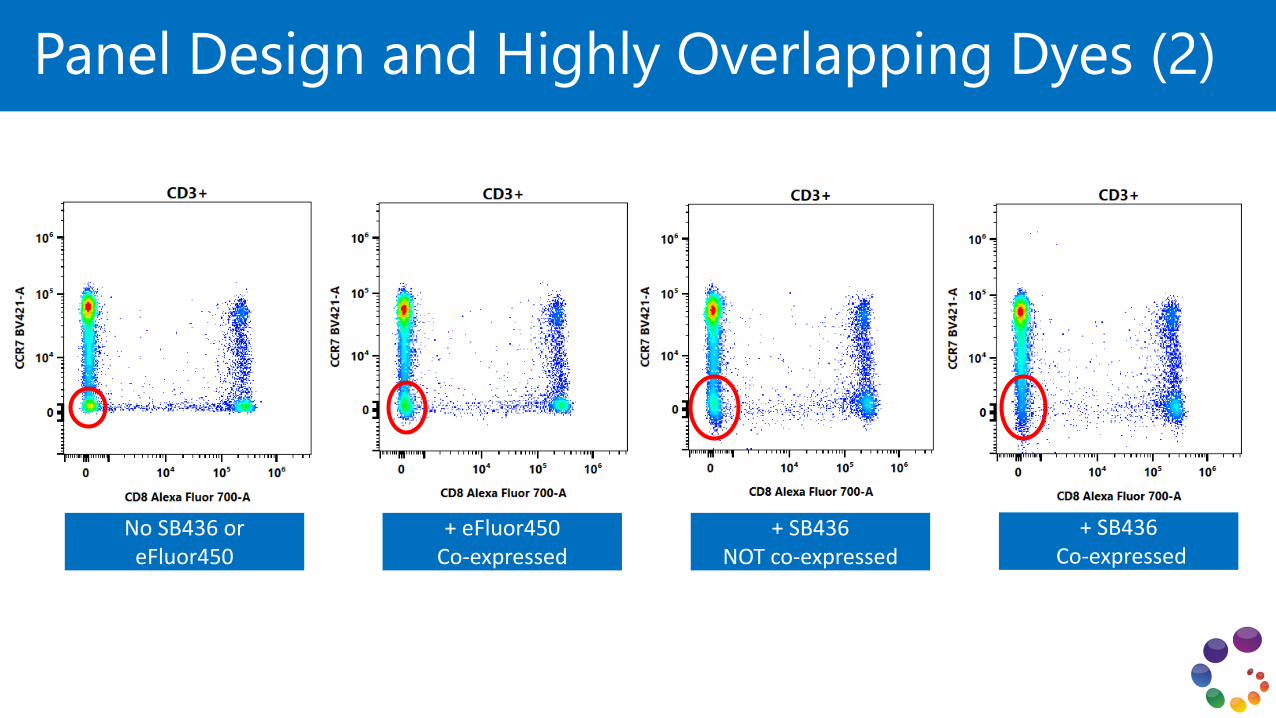
No SB436 or eFluor450
+ eFluor450 Co-expressed
+ SB436 NOT co-expressed
+ SB436Co-expressed
Panel Design and Highly Overlapping Dyes (2)

Panel EvaluationMaking sure your panel is optimal
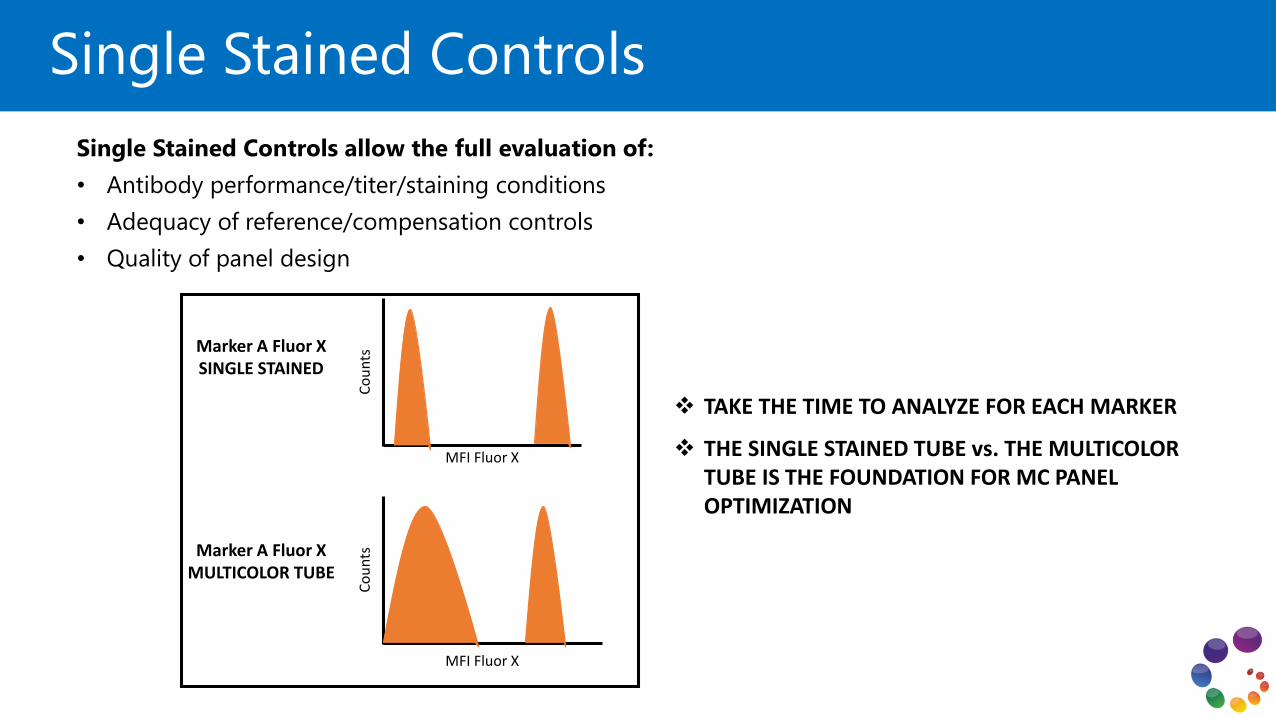
Single Stained Controls allow the full evaluation of:
• Antibody performance/titer/staining conditions
• Adequacy of reference/compensation controls
• Quality of panel design
Marker A Fluor XSINGLE STAINED
Marker A Fluor XMULTICOLOR TUBE
MFI Fluor X
Co
un
ts
MFI Fluor X
Co
un
ts
❖ TAKE THE TIME TO ANALYZE FOR EACH MARKER
❖ THE SINGLE STAINED TUBE vs. THE MULTICOLOR TUBE IS THE FOUNDATION FOR MC PANEL OPTIMIZATION
Single Stained Controls
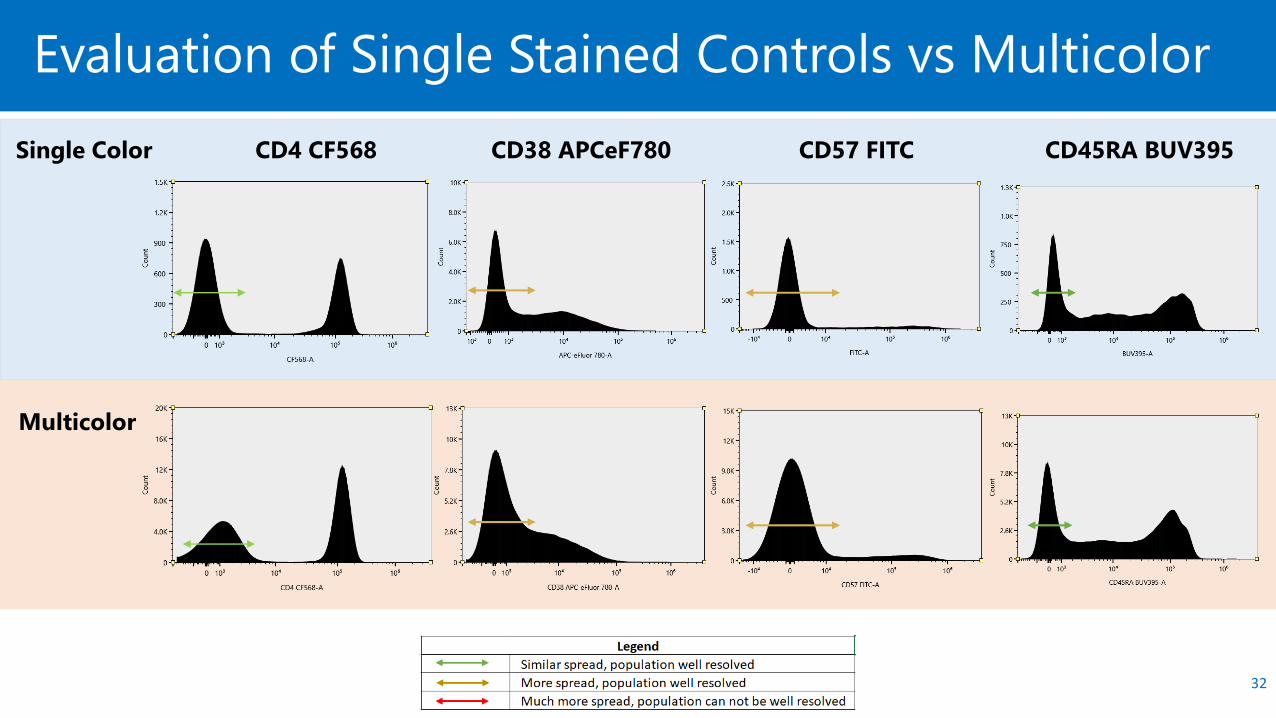
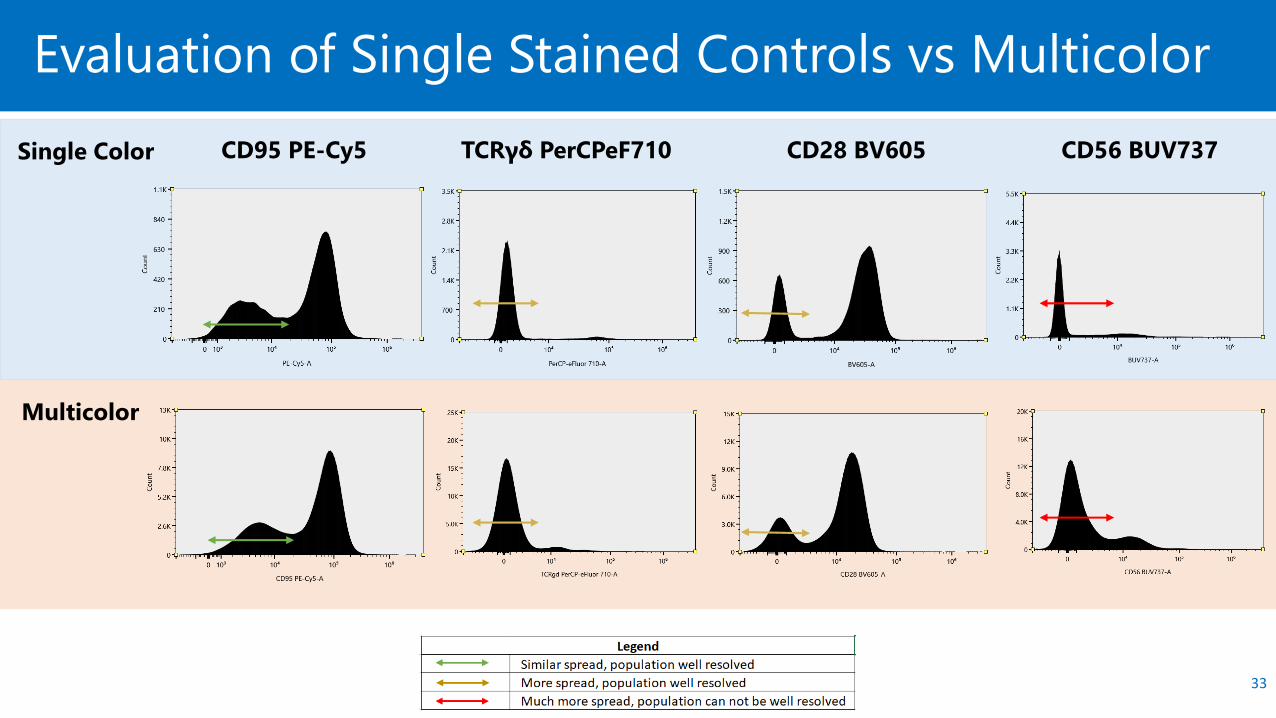
Evaluation of Single Stained Controls vs Multicolor
32
Multicolor
Single Color CD4 CF568 CD57 FITCCD38 APCeF780 CD45RA BUV395
Evaluation of Single Stained Controls vs Multicolor
33
Multicolor
Single Color CD95 PE-Cy5 CD28 BV605TCRγδ PerCPeF710 CD56 BUV737
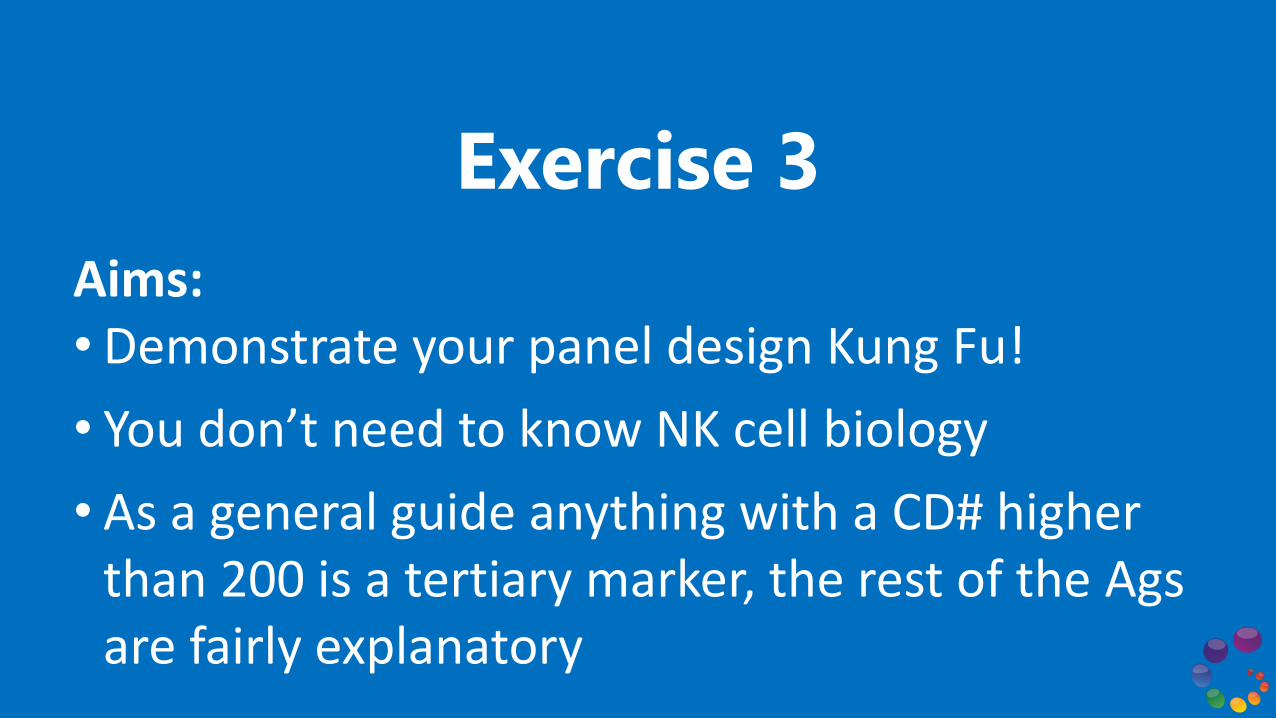
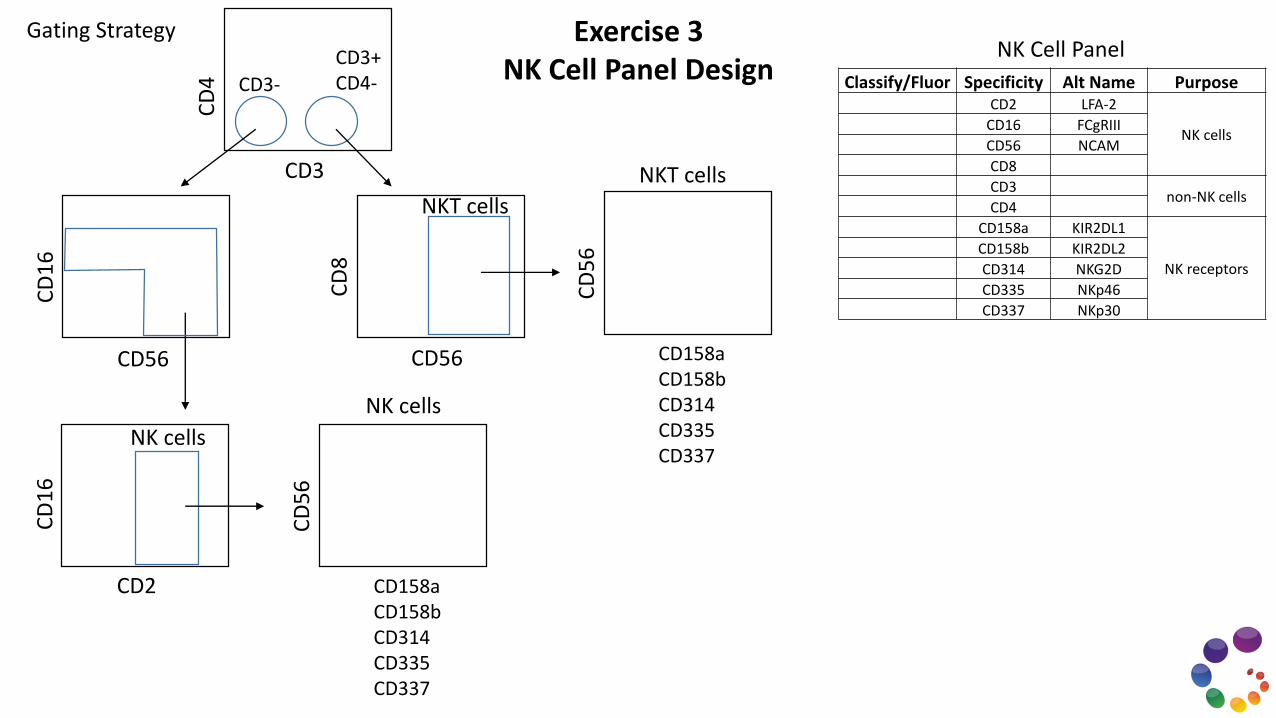
Exercise 3
Aims:• Demonstrate your panel design Kung Fu!
• You don’t need to know NK cell biology
• As a general guide anything with a CD# higher than 200 is a tertiary marker, the rest of the Agsare fairly explanatory
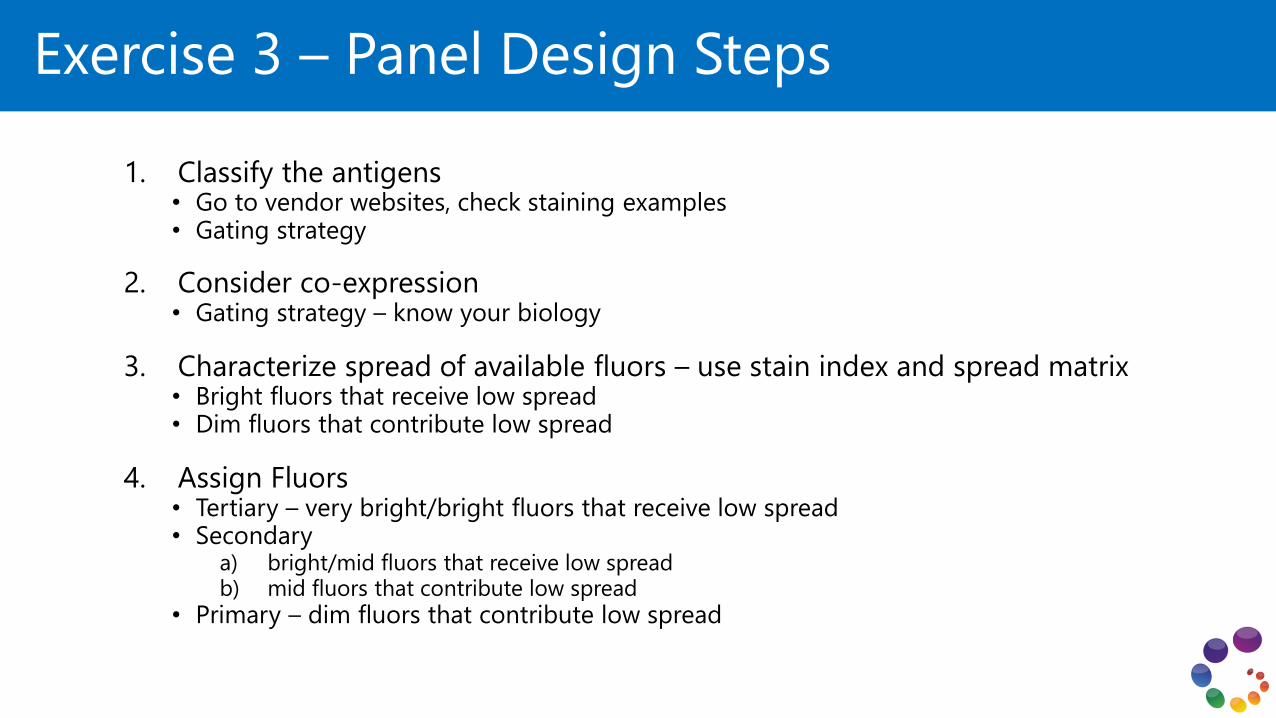
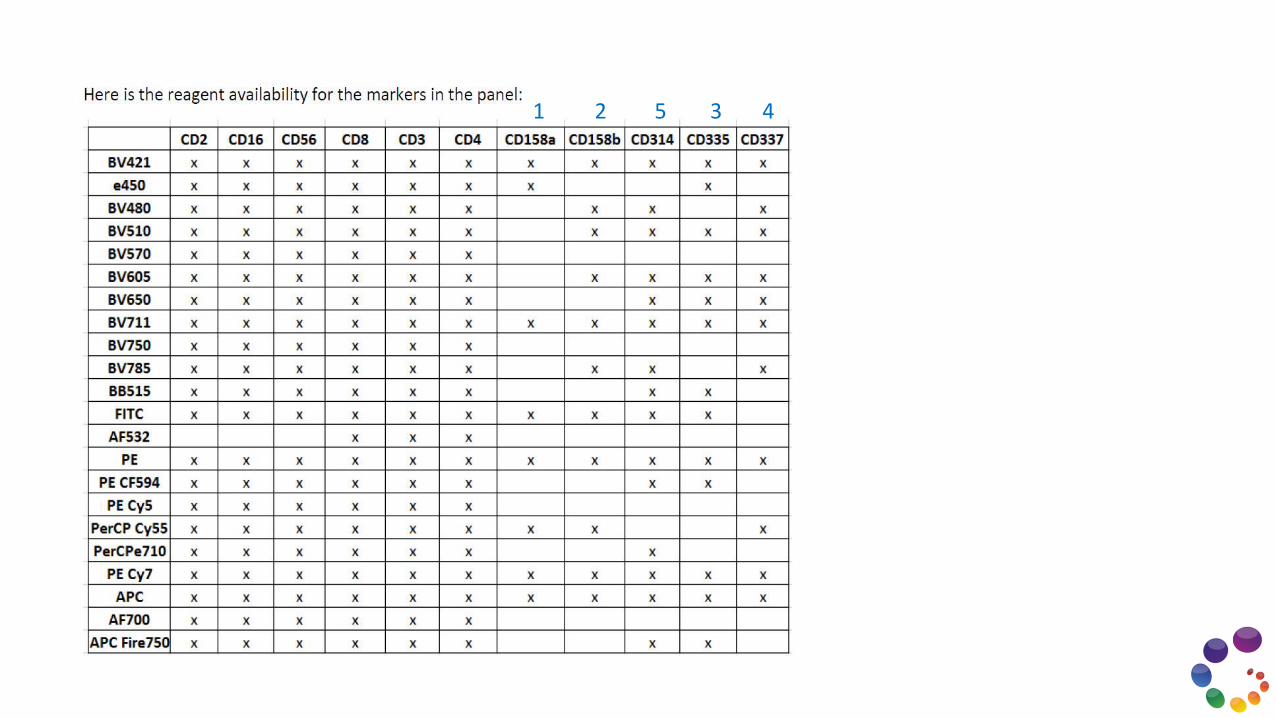
Exercise 3 – Panel Design Steps
1. Classify the antigens• Go to vendor websites, check staining examples• Gating strategy
2. Consider co-expression• Gating strategy – know your biology
3. Characterize spread of available fluors – use stain index and spread matrix• Bright fluors that receive low spread• Dim fluors that contribute low spread
4. Assign Fluors• Tertiary – very bright/bright fluors that receive low spread• Secondary
a) bright/mid fluors that receive low spreadb) mid fluors that contribute low spread
• Primary – dim fluors that contribute low spread
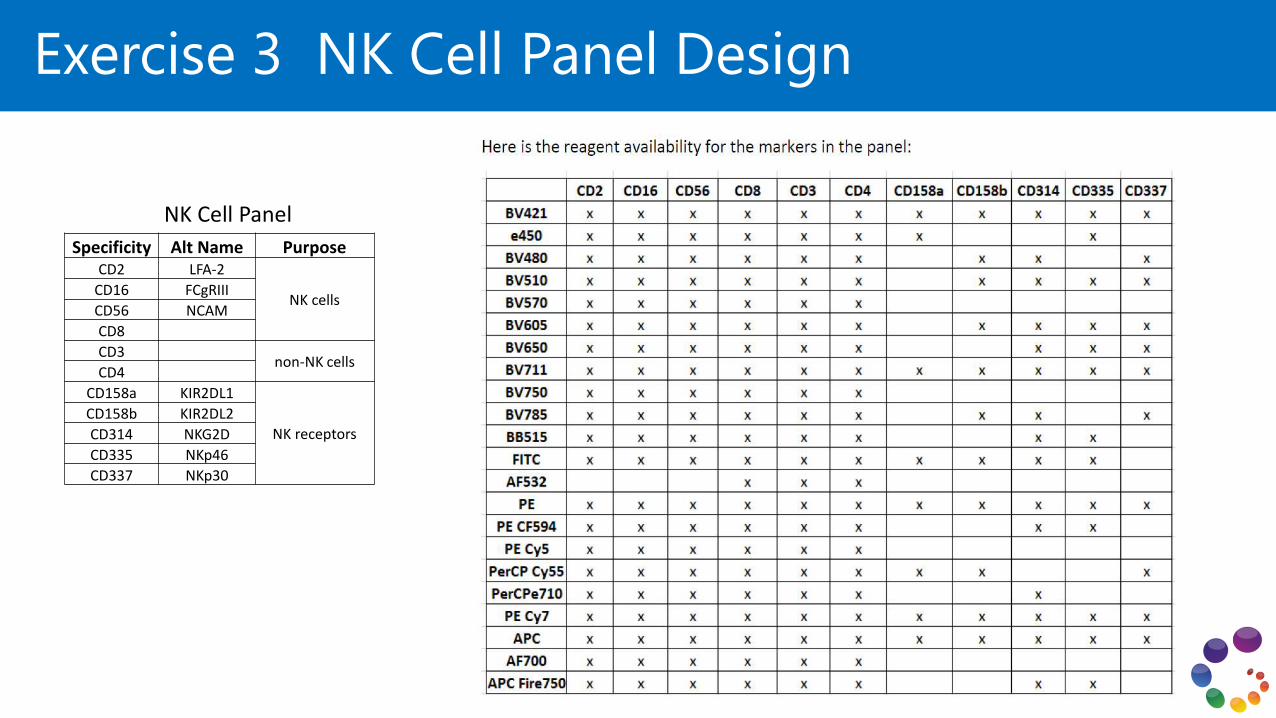
Exercise 3 NK Cell Panel Design
Specificity Alt Name PurposeCD2 LFA-2
NK cellsCD16 FCgRIII
CD56 NCAM
CD8
CD3non-NK cells
CD4
CD158a KIR2DL1
NK receptors
CD158b KIR2DL2
CD314 NKG2D
CD335 NKp46
CD337 NKp30
NK Cell Panel
Classify/Fluor Specificity Alt Name PurposeCD2 LFA-2
NK cellsCD16 FCgRIII
CD56 NCAM
CD8
CD3non-NK cells
CD4
CD158a KIR2DL1
NK receptors
CD158b KIR2DL2
CD314 NKG2D
CD335 NKp46
CD337 NKp30
NK Cell Panel
CD3
CD
4 CD3-
CD3+CD4-
CD56
CD
16
CD56C
D8
NK cells
NKT cells
CD2
CD
16
CD158aCD158bCD314CD335CD337
CD
56
CD158aCD158bCD314CD335CD337
CD
56
NK cells
NKT cells
Gating Strategy Exercise 3NK Cell Panel Design
1 2 3 45
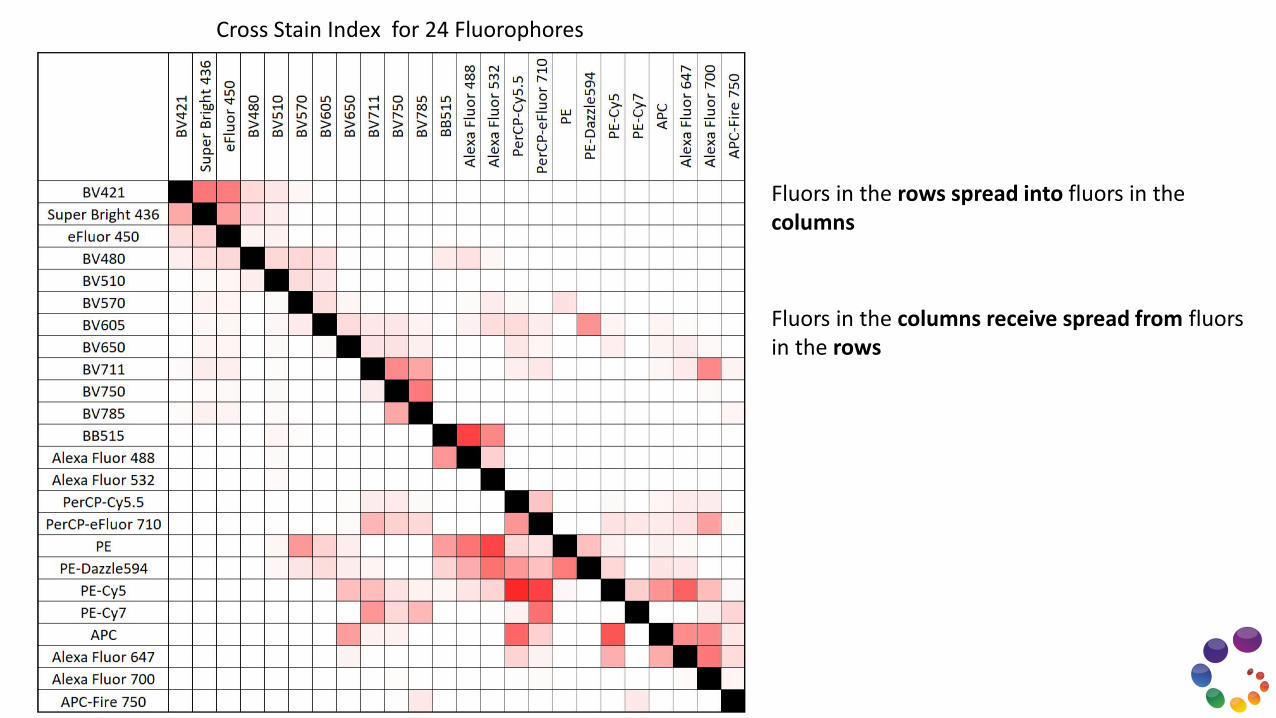
Cross Stain Index for 24 Fluorophores
Fluors in the rows spread into fluors in the columns
Fluors in the columns receive spread from fluorsin the rows
Very BrightBrightMidDim
*
*
*
*
*
*
*
*
*
*
*
*
*
*
*
*
*
*
*
*
*
*
*
*
*
*
*
*
*
*
*
*
*
*
*
*
*
*
*
*
*
*
* Reagent available
*
*
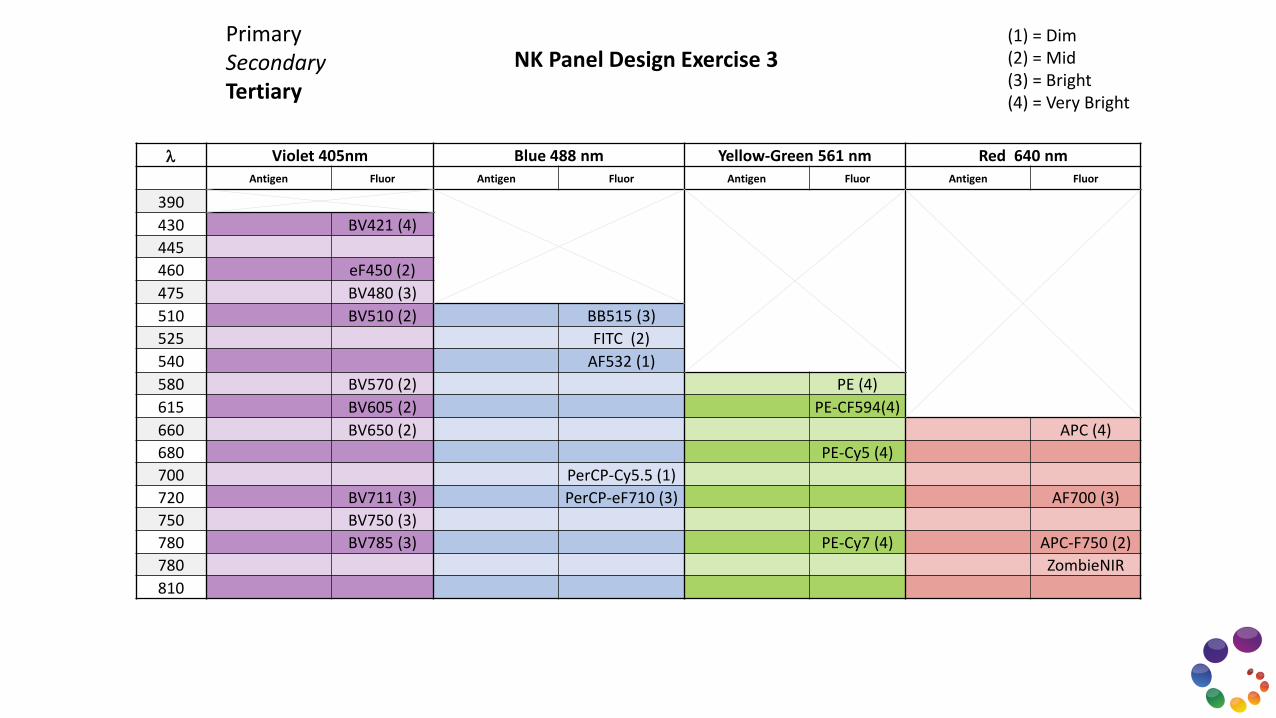
l Violet 405nm Blue 488 nm Yellow-Green 561 nm Red 640 nmAntigen Fluor Antigen Fluor Antigen Fluor Antigen Fluor
390
430 BV421 (4)
445
460 eF450 (2)
475 BV480 (3)
510 BV510 (2) BB515 (3)
525 FITC (2)
540 AF532 (1)
580 BV570 (2) PE (4)
615 BV605 (2) PE-CF594(4)
660 BV650 (2) APC (4)
680 PE-Cy5 (4)
700 PerCP-Cy5.5 (1)
720 BV711 (3) PerCP-eF710 (3) AF700 (3)
750 BV750 (3)
780 BV785 (3) PE-Cy7 (4) APC-F750 (2)
780 ZombieNIR
810
NK Panel Design Exercise 3PrimarySecondaryTertiary
(1) = Dim(2) = Mid(3) = Bright(4) = Very Bright

Questions?