Embed Size (px)
DESCRIPTION
statistics
Citation preview

Introduction to Introduction to STATISTICSSTATISTICS

■ Statistics is the science of conducting studies to collect, organize, summarize, analyze, present, interpret and draw conclusions from data.

What is data?What is data?It is the collection of facts,
concepts or instructions in a formalized manner suitable for communication or processing by human.
Collection of data is known as a data set and a single observation a data point.

Statistics- Statistics- IntroductionIntroductionMost people become familiar with probability and statistics through radio, television, newspapers, and magazines. For example, the following statements were found in newspapers.Based on the 2000 census, 40.5 million households have two vehicles. The average age of top 50 powerful persons in India is decreased from 58 years in 2003 to 54 years in 2006.
The average cost of a wedding is nearly Rs 10,00,000.
Women who eat fish once a week are 29% less likely to develop heart disease.
PopulationThe complete collection of measurements outcomes, object or individual under
study
SampleA subset of a population, containing the objects or
outcomes that are actually observed
ParameterA number that describes a population characteristics
StatisticA number that describes a
sample characteristics
Basic ConceptsBasic ConceptsData
An information coming from observations, counts,
measurements, or responses. The basic idea behind all statistical methods of data analysis is to The basic idea behind all statistical methods of data analysis is to
make inferences about a make inferences about a populationpopulation by studying small by studying small samplesample chosen chosen from it from it

Samples and PopulationsSamples and Populations
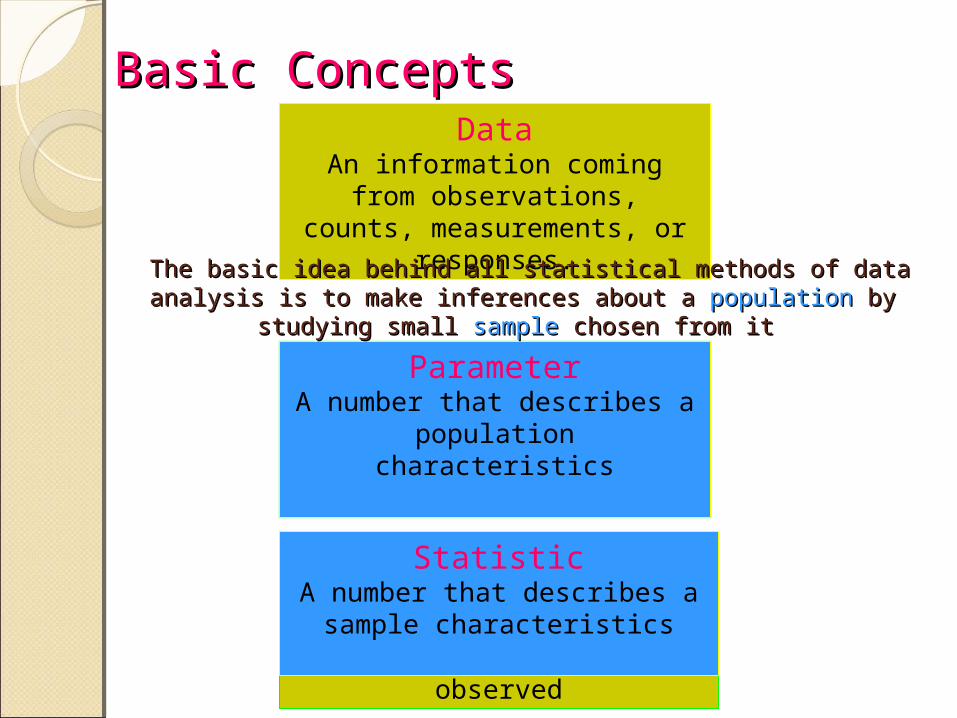
Descriptive StatisticsDescriptive Statistics
■Consists of the collection, organization, classification, summarization, and presentation of data obtain from the sample.
■Used to describe the characteristics of the sample
■Used to determine whether the sample represent the target population by comparing sample statistic and population parameter
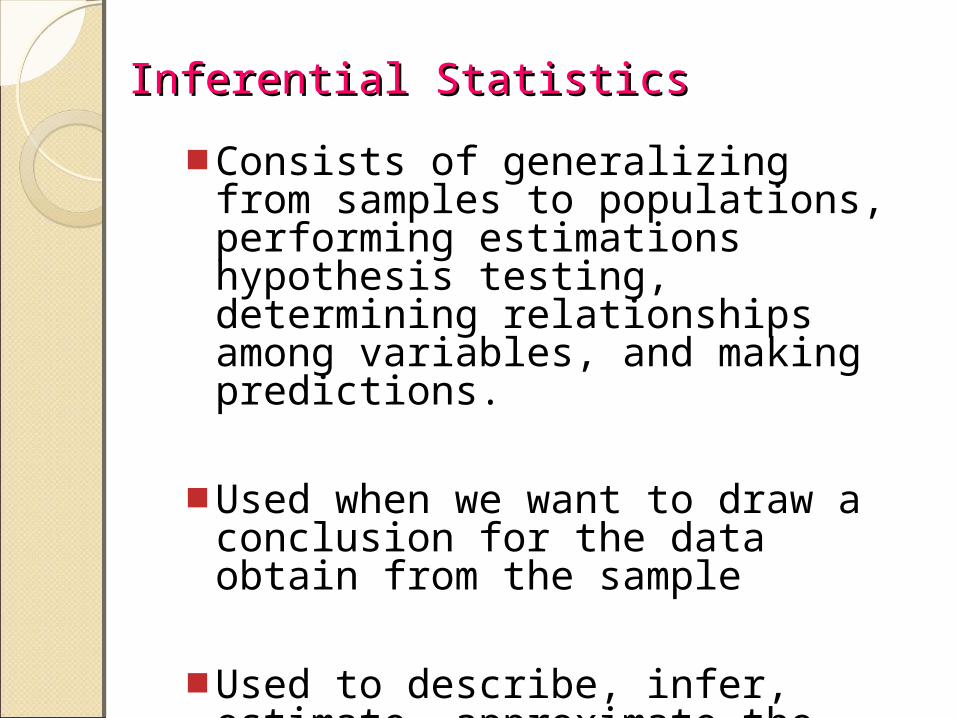
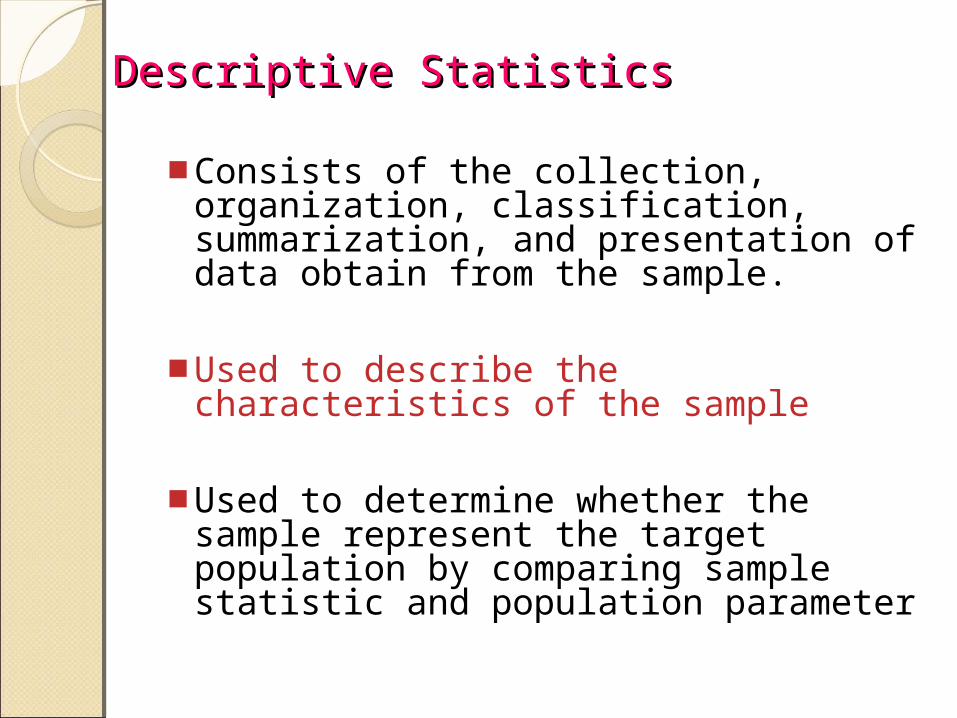
Inferential StatisticsInferential Statistics■Consists of generalizing from
samples to populations, performing estimations hypothesis testing, determining relationships among variables, and making predictions.
■Used when we want to draw a conclusion for the data obtain from the sample
■Used to describe, infer, estimate, approximate the characteristics of the target population

InferencesInferences■Consider:
◦Average length of females and males: 90cm and 100cm respectively.
◦Descriptive statistics: the values.◦Inference: males are (in general)
larger than females.
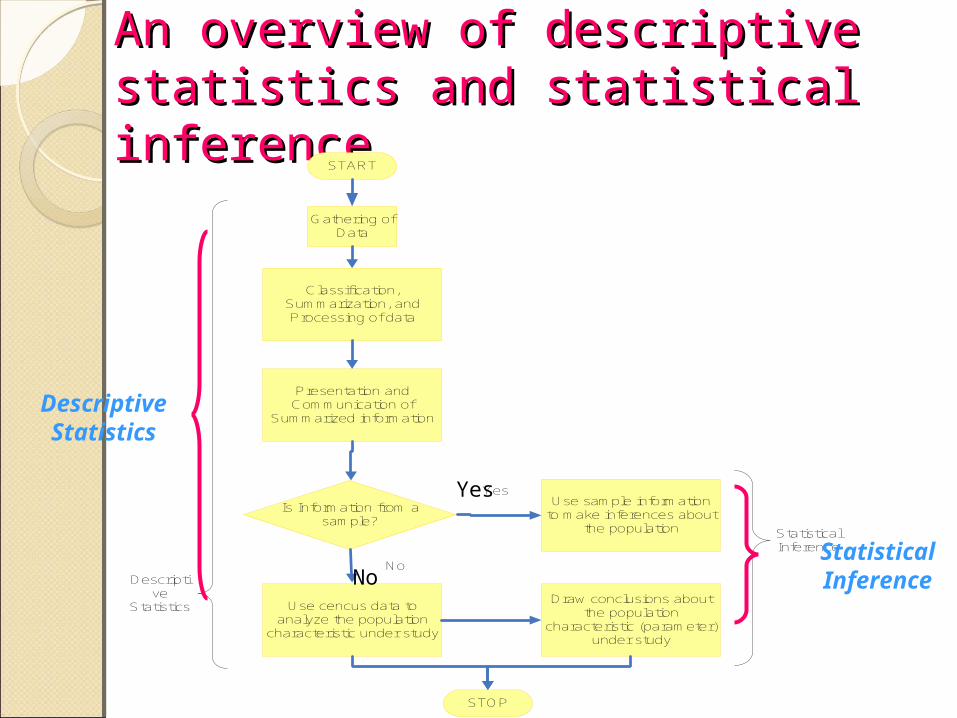
An overview of descriptive An overview of descriptive statistics and statistical inferencestatistics and statistical inference
START
Gathering of Data
Classification, Summarization, and Processing of data
Presentation and Communication of
Summarized information
Is Information from a sample?
Use cencus data to analyze the population
characteristic under study
Use sample information to make inferences about
the population
Draw conclusions about the population
characteristic (parameter) under study
STOP
Yes
No
Statistical Inference
Descriptive
Statistics
Statistical
Inference
Descriptive
Statistics
No
Yes

Data Collection Data Collection
■Collect data◦e.g. Survey
■Present data◦e.g. Tables and graphs
■Characterize data◦e.g. Sample mean =
■Mean weight is 120 poundsiX
n

Types of data Types of data Qualitative/ Categorical and
Quantitative/Numerical ◦ Nominal, Ordinal, Interval and Ratio ◦ Discrete--Nominal and ordinal ◦ Continuous -- Interval and ratio
Cross-sectional , Temporal and Spatial
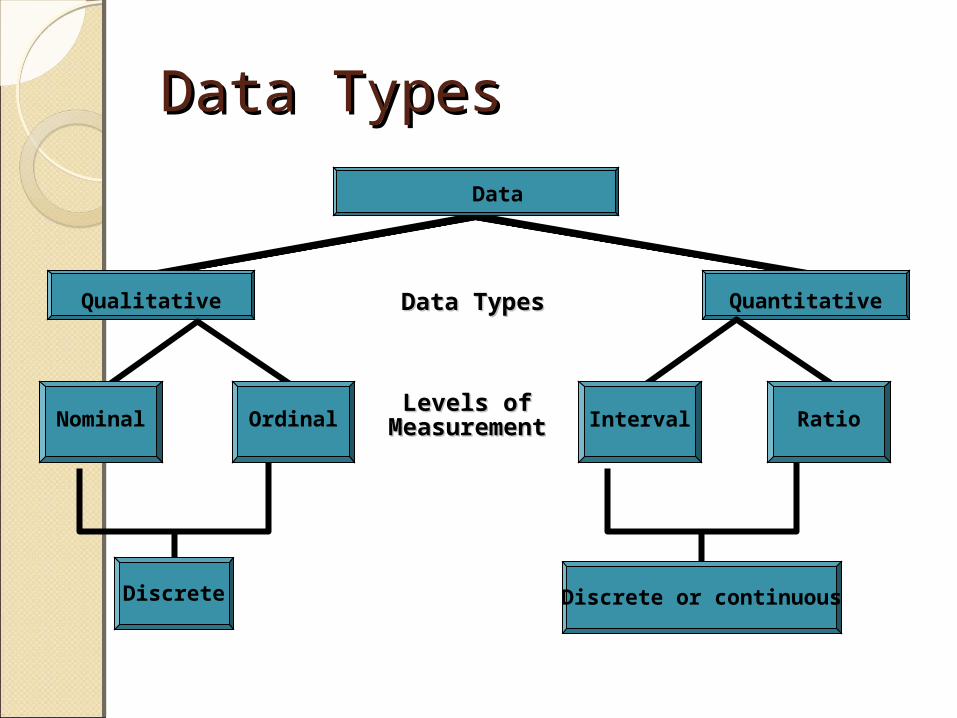
Data TypesData Types Data
Qualitative QuantitativeData TypesData Types
Nominal Ordinal Interval RatioLevels of Levels of MeasurementMeasurement
Discrete Discrete or continuous

Qualitative/ Categorical Qualitative/ Categorical variablesvariablesHere, data are classified on the
basis of some attribute or quality such as gender, literacy, religion, employment etc.
These attributes under study cannot be measured.
One can only find out whether it is present or absent in the units of population under study.

ExampleExample• Attribute under study – blindness• Here, we can determine how many
persons are blind in a given population.• It is not possible to measure the
degree of blindness in each case.• Attributes can be:• Gender (Males and females)• Literacy (literates and illiterates)• Employment (employed and
unemployed)

Two types of categorical Two types of categorical variables variables NominalOrdinal

Nominal data Nominal data • Nominal data are the labels or
assigned numbers.• Car number Car number • Roll number Roll number • STD codeSTD code• Color of bike Color of bike • House numberHouse number• Such data are used for Such data are used for
identifying individuals and identifying individuals and places .places .

Ordinal data Ordinal data • Ordinal data can be arranged in Ordinal data can be arranged in
order such as worst to best or order such as worst to best or best to worstbest to worst
• Same as nominal but there is an order within the groups into which the data is classified.
• Unable to say by how much they differ from each other.
-- Rating of hotels, restaurants and movies.

Quantitative/Numerical Quantitative/Numerical variablesvariablesHere, the data are classified on the
basis of some characteristics capable of quantitative measurements such as:
Marks scored by students in classHeight of individuals Income of individuals Age of individualsExpenditure of individuals
Two types of Quantitative Two types of Quantitative variablesvariablesInterval dataRatio data
Quantitative variables can be discrete or continuous.

Interval dataInterval data
• Interval data can be on a Interval data can be on a numerical scale .numerical scale .
• zero point does not mean zero point does not mean absence of property.absence of property.
• TemperatureTemperature

Ratio data Ratio data • It possess all the properties of It possess all the properties of
interval data with meaningful ratio interval data with meaningful ratio of two valuesof two values
• Ratio data differ from interval data Ratio data differ from interval data in that there is a definite zero in that there is a definite zero point(nothing exists for the variable point(nothing exists for the variable at zero point)at zero point)
• Height Height • Weight Weight • PricePrice• LengthLength• Sales revenueSales revenue

Discrete variables Discrete variables The variables is said to be discrete if
it assumes only some specific values.Discrete variables arises in a situation where counting is involved. number of credit cards held by an
individual number of defective items in
boxes of 100 items number of students in the class

Continuous variables Continuous variables Continuous variables arises in
situations when some sort of measurement is involved in range. life of an electric bulb waiting time for customers at
a bank’s counter. rainfall temperature

The ABC Marketing Corporation has asked you for information
about the car you drive. For each question, identify each of the types
of data requested as either Qualitative data or Quantitative data. When numeric data is requested, identify the variable as discrete or continuous.
1. What is the weight of your car?2. In which city was your car made?3. How many people can be seated in your car?4. What’s the distance traveled from your home to your
school?5. What’s the color of your car?6. How many cars are in your household?7. What’s the length of your car?
Case LetCase Let

Levels of MeasurementLevels of Measurement
Level Put in categorie
s
Arrange in order
Subtract values
Divide values
Nominal Yes No No No
Ordinal Yes Yes No No
Interval Yes Yes Yes No
Ratio Yes Yes Yes Yes

Cross-sectional DataCross-sectional Data■ Cross-sectional data comprises of a variable
recorded over at the same point or period of time for many individuals , organization, places etc.
• Ages of all students at the time of joining IMS , in the year 2008.
• Number of students enrolled in IIM, in the year 2008.
• Stock prices of Infosys Technologies, TCS, and Wipro on31st March 2008.
• Population of Delhi, Mumbai , Chennai and Kolkata as per 2001 census.

Temporal DataTemporal Data
■ Temporal data also referred as time-series data , is the data about an individual organization , places etc over a period of time.
• Marks obtained by student from standard I to XII.
• Total business of ICICI bank as at the end of last five years.
•Population of India from the year 1931 to 2001

Spatial DataSpatial Data■ Spatial data is the data based on
geographical location basis. • Income tax collection from
various states•Sales of Times Of India in Delhi. • Production of wheat in different
states of the country

Data Collection TechniquesData Collection TechniquesMethod of Data
Collection
Data collected and recorded by
others(secondary study)
Data collected directly from the
field of enquiry(primary
data)

Primary Data Primary Data • Data originally collected in the process of
investigations are known as primary data.• Primary data consists of figures collected
at first hand in order to satisfy the purpose of a particular statistical enquiry.
• Merits :Original in natureMore reliable and accurateCan be used with greater confidence bz the
enquirer knows its origin.Exactly matches the needs of the project.

Demerits : ExpensiveTime-consumingCollection of data involves creating
new definitions and measuring instruments such as questionnaires or interview forms and training people to use these specifically designed instruments.

Data Collection Data Collection TechniquesTechniques
Collection of Primary Data
Mailed Questionnaire Method
Direct Personal Investigation
Indirect Oral Observation
Observation
Interview
Schedule Sent Through
Investigator

Collection of primary dataCollection of primary data• Direct personal investigation
Personal interview ( the investigator personally approaches each informant and gathers the required information)
Personal observation ( here, rather than asking anybody, the investigator personally observes and records the information related to a particular field)
• Indirect oral observation (here, instead of directly approaching the actual field or person, data are collected from third party informant)
• Questionnaire method ( here, a well-prepared questionnaire is given to a list of persons with the request to return them duly filled in)

Designing a QuestionnaireDesigning a Questionnaire• The no. of questions should be as few as
possible• Questions should be of objective type. Yes
or no type or simple tick marking answers are preferred.
• Questions should be properly arranged to have a systematic and easy flow of answer.
• Questions affecting the sentiment and pride of the respondent should be avoided.
• Necessary instructions and guidelines should be provided to make it easy for the respondent to answer.

Types of QuestionnairesTypes of QuestionnairesStructured or Non structured
questionnaire.Disguised and Non – disguised
questionnaire.

Structured or Non structured Structured or Non structured questionnairequestionnaire
Structured questionnaire : consists of a set of questions arranged in a predetermined order . Each question requires the respondent to make a choice among a few given predetermined responses.
Example :How frequently do you go to watch a movie?Choices (Very frequently, often, sometimes,
never)Such questions are called closed questions.

Non Structured questionnaire : consists of what are called open-ended questions.
Example:How do you spend your free time?How do you describe the ambience of the
new store?Such questions give the respondent
freedom to answer according to their views and opinions.

Disguised and Non – Disguised and Non – disguised questionnairedisguised questionnaire
Non – disguised questionnaire: here, the purpose or objectives of the study are made known to the respondent.
Disguised questionnaire: here, respondents are not taken into confidence regarding purpose or objectives of the study.
Disguised questionnaire is not very popular as respondents may not be forthcoming in their answers when they do not know the objectives or relevance of the questions or the study.

Secondary dataSecondary dataSecondary data consists of figures
which were collected originally to satisfy a particular enquiry but now are being used for different enquiry.
Sources of secondary data:JournalsReportsGovernment and non-Government
publications.

Data Collection TechniquesData Collection Techniques
4141
Collection of Secondary Data
Journals, News-papers
Publication by Government / International Organization
Universities and Research Organizations
BooksInternet

• Merits :Readily availableLess expensive compared to primary
dataLess time – consuming compared to
primary data• Demerits :
These may not be relevant in the present context.
These may not have the needed accuracy or reliability.
These may not be adequate.

Types of secondary data Types of secondary data ■ Internal or external■ Internal
■Company Reports , Intranet■ External
■Newspaper, magazines, websites, RBI publications

■ The two major areas of statistics are descriptive and inferential.
■ When the populations to be studied are large, statisticians use subgroups called samples.
■ Data can be classified as qualitative or quantitative.
■ The four basic types of measurement are nominal, ordinal, interval, and ratio.
44
SummarySummary