Embed Size (px)
Citation preview
This work is licensed under a Creative Commons Attribution-Non Commercial 4.0 International License (http://creativecommons.org/licenses/by-nc/4.0/) and may be adapted or reproduced with attribution to the IRI and for any non-commercial purpose.
Introduction to the Data Library (DL):
Data Selection in Time
Training ModuleNovember 29, 2016Version 1.0
International Research Institute for Climate and Society (IRI), (2016). Introduction to the Data Library (DL)-Data Selection in Time. November 29, Version 1.0. Palisades: IRI.
3.
CONTENTS
1 Introduction to the Data Library (DL) - Data Selection in Time 11.1 Introduction . . . . . . . . . . . . . . . . . . . . . . . . . . . . . . . . . . . . . . . . . . . . . . . 11.2 Overview . . . . . . . . . . . . . . . . . . . . . . . . . . . . . . . . . . . . . . . . . . . . . . . . . 21.3 Access . . . . . . . . . . . . . . . . . . . . . . . . . . . . . . . . . . . . . . . . . . . . . . . . . . 21.4 Data Selection . . . . . . . . . . . . . . . . . . . . . . . . . . . . . . . . . . . . . . . . . . . . . . 21.5 Filters . . . . . . . . . . . . . . . . . . . . . . . . . . . . . . . . . . . . . . . . . . . . . . . . . . . 51.6 [more] Functions . . . . . . . . . . . . . . . . . . . . . . . . . . . . . . . . . . . . . . . . . . . . . 61.7 Summary . . . . . . . . . . . . . . . . . . . . . . . . . . . . . . . . . . . . . . . . . . . . . . . . . 101.8 Quiz . . . . . . . . . . . . . . . . . . . . . . . . . . . . . . . . . . . . . . . . . . . . . . . . . . . 101.9 Reference(s) . . . . . . . . . . . . . . . . . . . . . . . . . . . . . . . . . . . . . . . . . . . . . . . 11
i

ii
CHAPTER
ONE
INTRODUCTION TO THE DATA LIBRARY (DL) - DATA SELECTION INTIME
1.1 Introduction
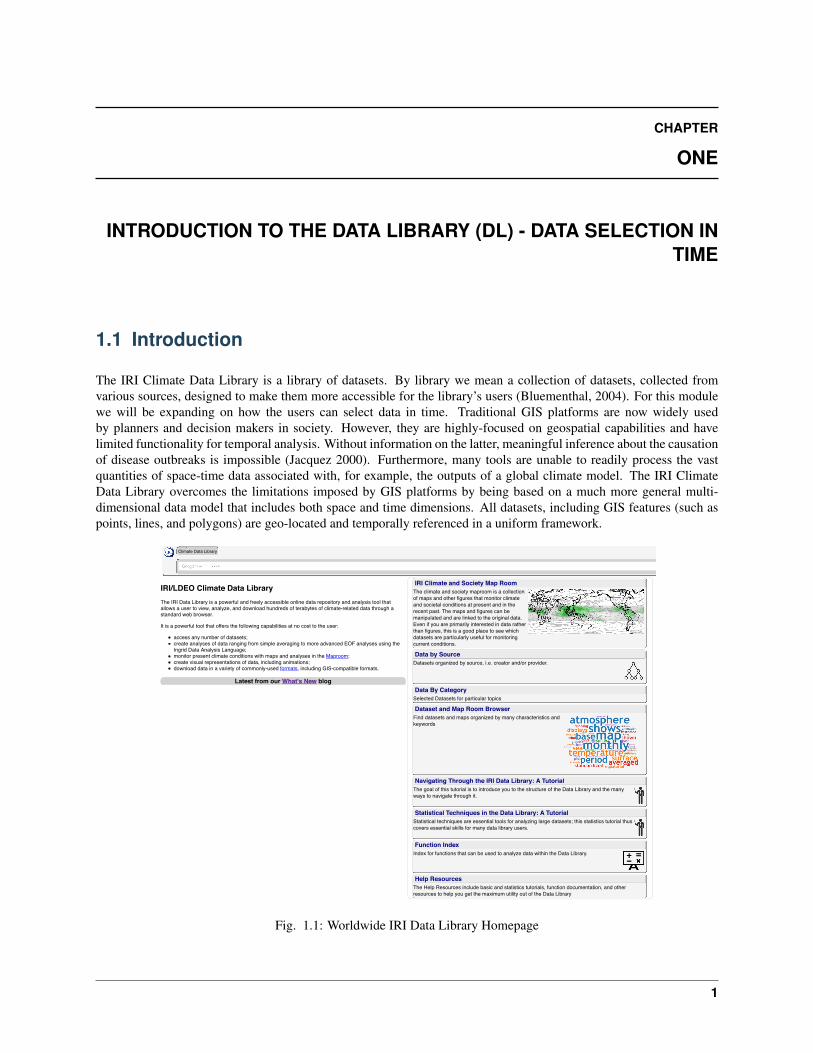
The IRI Climate Data Library is a library of datasets. By library we mean a collection of datasets, collected fromvarious sources, designed to make them more accessible for the library’s users (Bluementhal, 2004). For this modulewe will be expanding on how the users can select data in time. Traditional GIS platforms are now widely usedby planners and decision makers in society. However, they are highly-focused on geospatial capabilities and havelimited functionality for temporal analysis. Without information on the latter, meaningful inference about the causationof disease outbreaks is impossible (Jacquez 2000). Furthermore, many tools are unable to readily process the vastquantities of space-time data associated with, for example, the outputs of a global climate model. The IRI ClimateData Library overcomes the limitations imposed by GIS platforms by being based on a much more general multi-dimensional data model that includes both space and time dimensions. All datasets, including GIS features (such aspoints, lines, and polygons) are geo-located and temporally referenced in a uniform framework.
IRI/LDEO Climate Data LibraryThe IRI Data Library is a powerful and freely accessible online data repository and analysis tool thatallows a user to view, analyze, and download hundreds of terabytes of climate-related data through astandard web browser.
It is a powerful tool that offers the following capabilities at no cost to the user:
access any number of datasets;create analyses of data ranging from simple averaging to more advanced EOF analyses using theIngrid Data Analysis Language;monitor present climate conditions with maps and analyses in the Maproom;create visual representations of data, including animations;download data in a variety of commonly-used formats, including GIS-compatible formats.
Latest from our What's New blog
IRI Climate and Society Map RoomThe climate and society maproom is a collectionof maps and other figures that monitor climateand societal conditions at present and in therecent past. The maps and figures can bemanipulated and are linked to the original data.Even if you are primarily interested in data ratherthan figures, this is a good place to see whichdatasets are particularly useful for monitoringcurrent conditions.
Data by SourceDatasets organized by source, i.e. creator and/or provider.
Data By CategorySelected Datasets for particular topics
Dataset and Map Room BrowserFind datasets and maps organized by many characteristics andkeywords
Navigating Through the IRI Data Library: A TutorialThe goal of this tutorial is to introduce you to the structure of the Data Library and the manyways to navigate through it.
Statistical Techniques in the Data Library: A TutorialStatistical techniques are essential tools for analyzing large datasets; this statistics tutorial thuscovers essential skills for many data library users.
Function IndexIndex for functions that can be used to analyze data within the Data Library.
Help ResourcesThe Help Resources include basic and statistics tutorials, function documentation, and otherresources to help you get the maximum utility out of the Data Library
Icons made by Freepik from www.flaticon.com
▼
IRI/LDEO
Climate Data Library
Fig. 1.1: Worldwide IRI Data Library Homepage
1
Introduction to the Data Library (DL) - Data Selection in Time, Release 1.0.0
1.2 Overview
How is Data Selection in Time categorized?
The Data Selection in Time has 3 levels:
• “Data selection” in time
• “Filters”: Climatology: yearly-climatology Anomaly: yearly-anomalies
• [more] Functions: averages in time, e.g., using: boxAverage runningAverage monthlyAverage [on dailydata] seasonalAverage [on monthly data]
1.3 Access
The IRI Data Library can be accessed with the following links:
• Worldwide: http://iridl.ldeo.columbia.edu/
• Chile: http://www.climatedatalibrary.cl/
• Venezuela: http://datoteca.ole2.org/
• Uruguay: http://dlibrary.snia.gub.uy/
• Rwanda: http://maproom.meteorwanda.gov.rw/
• Ethiopia: http://www.ethiometmaprooms.gov.et:8082/
• Tanzania: http://maproom.meteo.go.tz/
• Mali: http://197.155.140.164/
• Ghana: http://maps.meteo.gov.gh:89/
• Zambia: http://41.72.104.142/
• Madagascar: http://map.meteomadagascar.mg/
• Peru: http://ons.snirh.gob.pe/
• Niger: http://cradata.agrhymet.ne/
• Kenya (KMD): http://kmddl.meteo.go.ke:8081/
• Kenya (ICPAC): http://digilib.icpac.net/
1.4 Data Selection
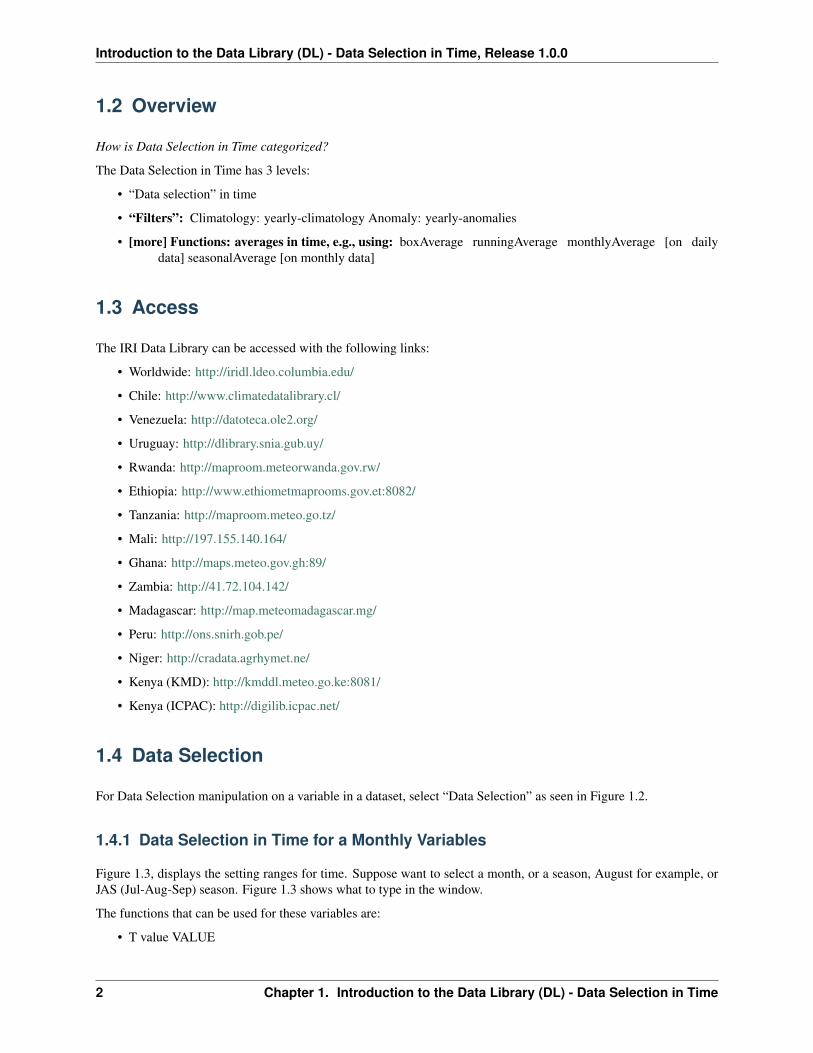
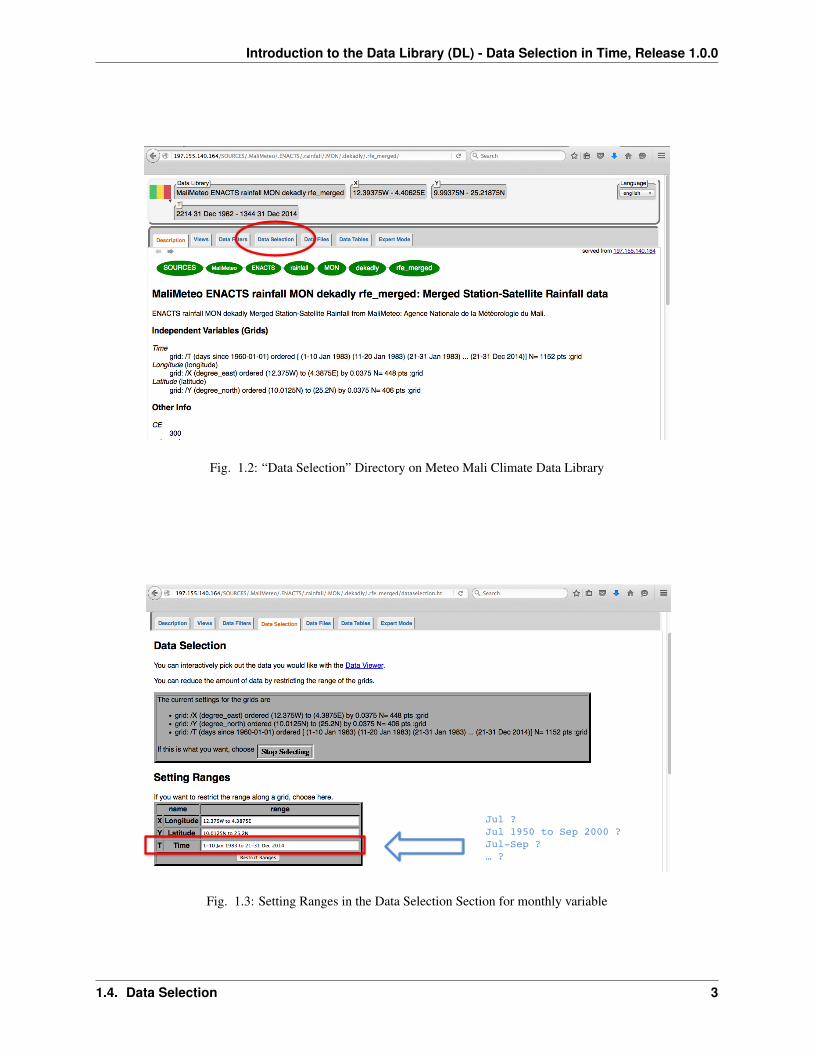
For Data Selection manipulation on a variable in a dataset, select “Data Selection” as seen in Figure 1.2.
1.4.1 Data Selection in Time for a Monthly Variables
Figure 1.3, displays the setting ranges for time. Suppose want to select a month, or a season, August for example, orJAS (Jul-Aug-Sep) season. Figure 1.3 shows what to type in the window.
The functions that can be used for these variables are:
• T value VALUE
2 Chapter 1. Introduction to the Data Library (DL) - Data Selection in Time
Introduction to the Data Library (DL) - Data Selection in Time, Release 1.0.0
Fig. 1.2: “Data Selection” Directory on Meteo Mali Climate Data Library
Jul ?Jul 1950 to Sep 2000 ?Jul-Sep ?… ?
Fig. 1.3: Setting Ranges in the Data Selection Section for monthly variable
1.4. Data Selection 3
Introduction to the Data Library (DL) - Data Selection in Time, Release 1.0.0
• T value1 value2 value3 . . . VALUES
• T first last RANGE
For example:
• T (Aug 1984) VALUE
• T (1-10 Jul) VALUES
• T (Jul) VALUES
• T (Jul 1950) (Jul 2015) RANGE
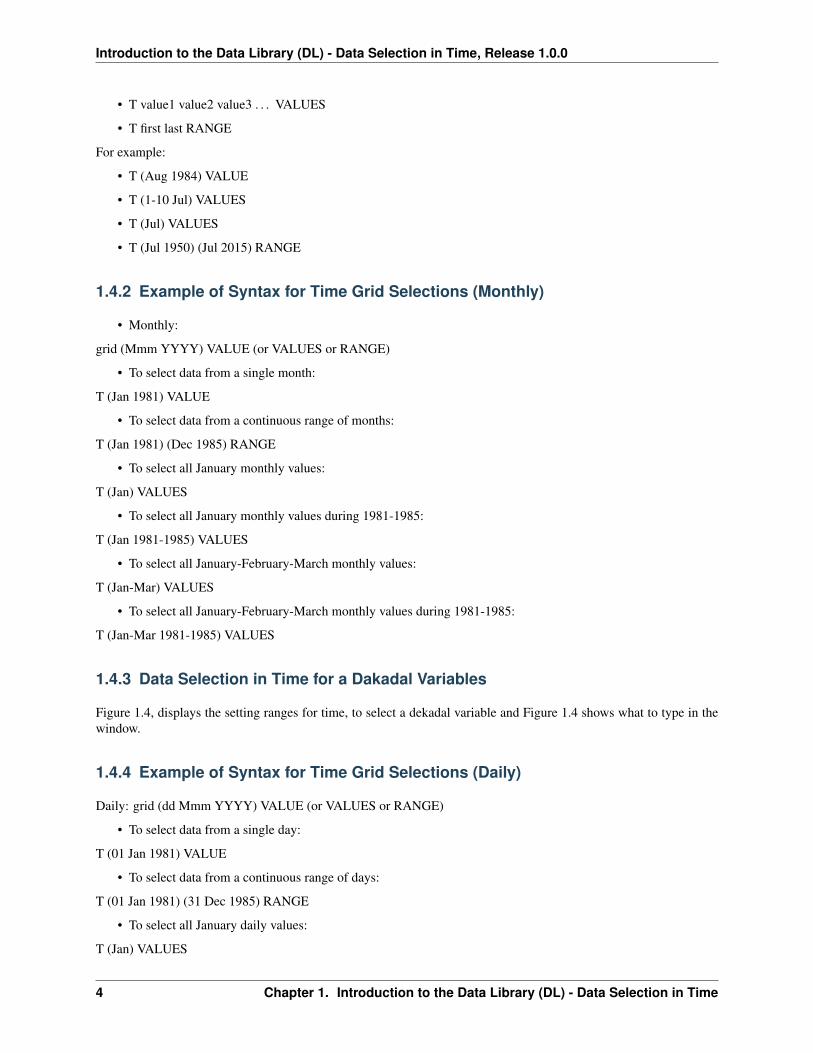
1.4.2 Example of Syntax for Time Grid Selections (Monthly)
• Monthly:
grid (Mmm YYYY) VALUE (or VALUES or RANGE)
• To select data from a single month:
T (Jan 1981) VALUE
• To select data from a continuous range of months:
T (Jan 1981) (Dec 1985) RANGE
• To select all January monthly values:
T (Jan) VALUES
• To select all January monthly values during 1981-1985:
T (Jan 1981-1985) VALUES
• To select all January-February-March monthly values:
T (Jan-Mar) VALUES
• To select all January-February-March monthly values during 1981-1985:
T (Jan-Mar 1981-1985) VALUES
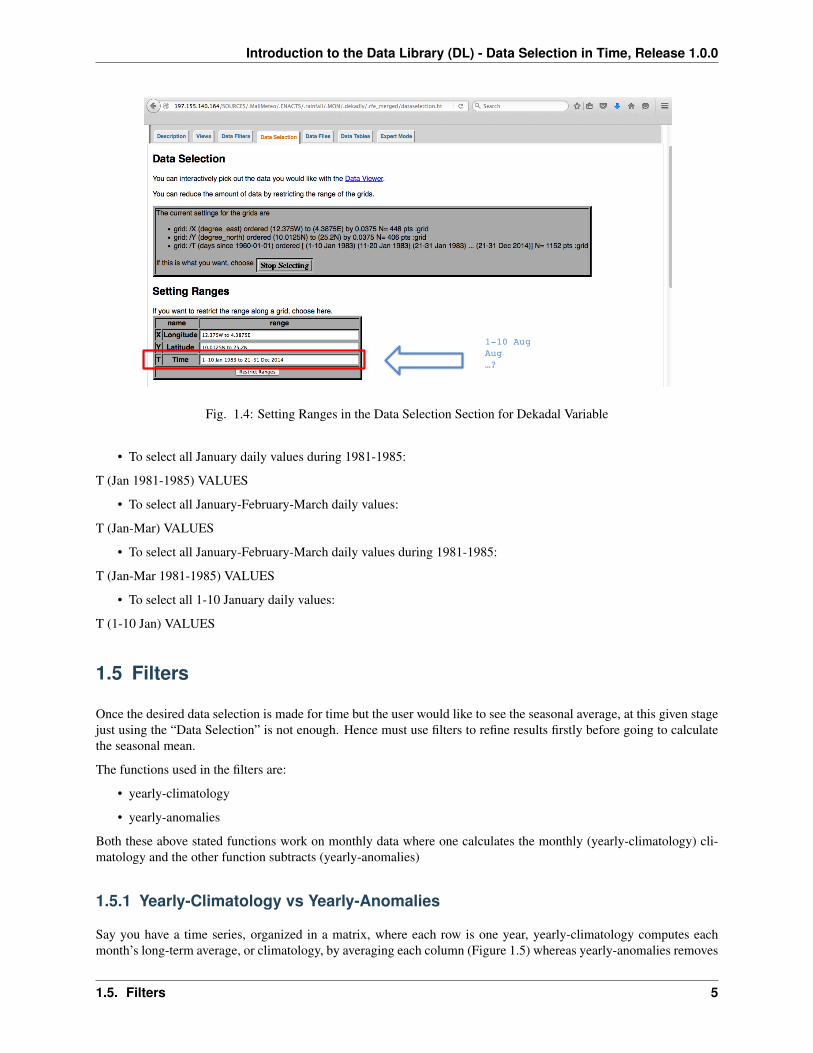
1.4.3 Data Selection in Time for a Dakadal Variables
Figure 1.4, displays the setting ranges for time, to select a dekadal variable and Figure 1.4 shows what to type in thewindow.
1.4.4 Example of Syntax for Time Grid Selections (Daily)
Daily: grid (dd Mmm YYYY) VALUE (or VALUES or RANGE)
• To select data from a single day:
T (01 Jan 1981) VALUE
• To select data from a continuous range of days:
T (01 Jan 1981) (31 Dec 1985) RANGE
• To select all January daily values:
T (Jan) VALUES
4 Chapter 1. Introduction to the Data Library (DL) - Data Selection in Time
Introduction to the Data Library (DL) - Data Selection in Time, Release 1.0.0
1-10 AugAug…?
Fig. 1.4: Setting Ranges in the Data Selection Section for Dekadal Variable
• To select all January daily values during 1981-1985:
T (Jan 1981-1985) VALUES
• To select all January-February-March daily values:
T (Jan-Mar) VALUES
• To select all January-February-March daily values during 1981-1985:
T (Jan-Mar 1981-1985) VALUES
• To select all 1-10 January daily values:
T (1-10 Jan) VALUES
1.5 Filters
Once the desired data selection is made for time but the user would like to see the seasonal average, at this given stagejust using the “Data Selection” is not enough. Hence must use filters to refine results firstly before going to calculatethe seasonal mean.
The functions used in the filters are:
• yearly-climatology
• yearly-anomalies
Both these above stated functions work on monthly data where one calculates the monthly (yearly-climatology) cli-matology and the other function subtracts (yearly-anomalies)
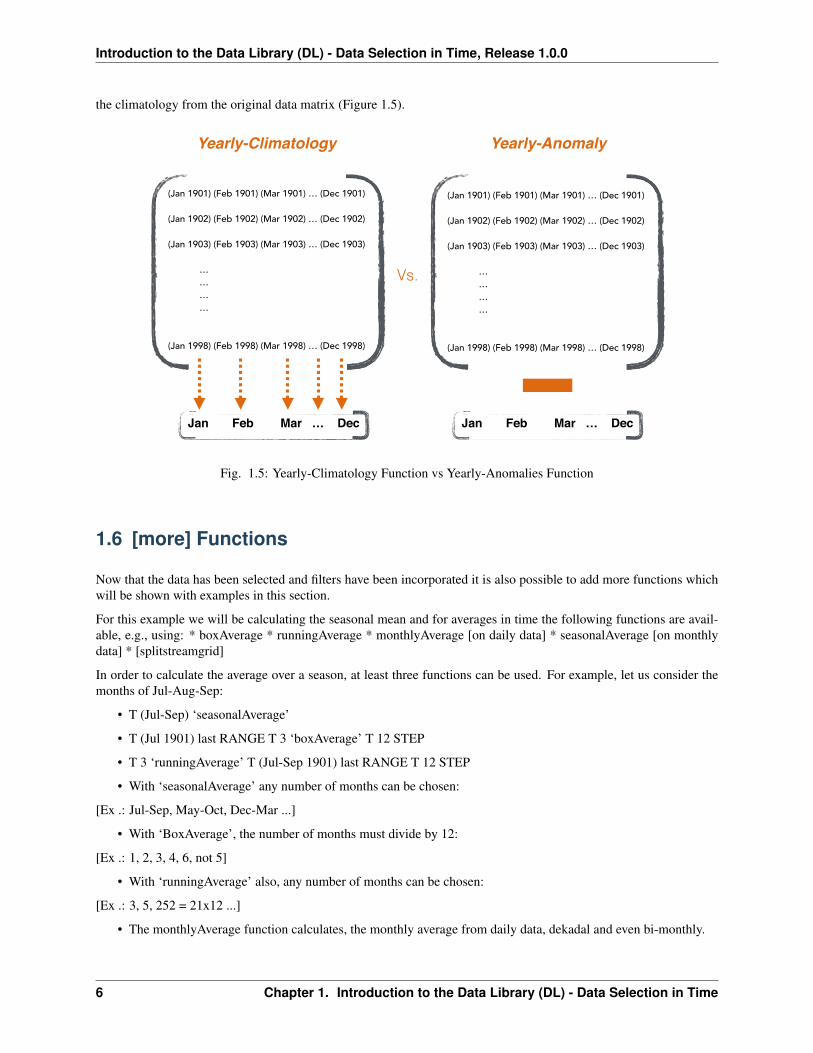
1.5.1 Yearly-Climatology vs Yearly-Anomalies
Say you have a time series, organized in a matrix, where each row is one year, yearly-climatology computes eachmonth’s long-term average, or climatology, by averaging each column (Figure 1.5) whereas yearly-anomalies removes
1.5. Filters 5
Introduction to the Data Library (DL) - Data Selection in Time, Release 1.0.0
the climatology from the original data matrix (Figure 1.5).
(Jan 1901) (Feb 1901) (Mar 1901) … (Dec 1901)
(Jan 1902) (Feb 1902) (Mar 1902) … (Dec 1902)
(Jan 1903) (Feb 1903) (Mar 1903) … (Dec 1903)
… … … …
(Jan 1998) (Feb 1998) (Mar 1998) … (Dec 1998)
(Jan 1901) (Feb 1901) (Mar 1901) … (Dec 1901)
(Jan 1902) (Feb 1902) (Mar 1902) … (Dec 1902)
(Jan 1903) (Feb 1903) (Mar 1903) … (Dec 1903)
… … … …
(Jan 1998) (Feb 1998) (Mar 1998) … (Dec 1998)
Jan Feb Mar … Dec Jan Feb Mar … Dec
Yearly-Climatology Yearly-Anomaly
Vs.
Fig. 1.5: Yearly-Climatology Function vs Yearly-Anomalies Function
1.6 [more] Functions
Now that the data has been selected and filters have been incorporated it is also possible to add more functions whichwill be shown with examples in this section.
For this example we will be calculating the seasonal mean and for averages in time the following functions are avail-able, e.g., using: * boxAverage * runningAverage * monthlyAverage [on daily data] * seasonalAverage [on monthlydata] * [splitstreamgrid]
In order to calculate the average over a season, at least three functions can be used. For example, let us consider themonths of Jul-Aug-Sep:
• T (Jul-Sep) ‘seasonalAverage’
• T (Jul 1901) last RANGE T 3 ‘boxAverage’ T 12 STEP
• T 3 ‘runningAverage’ T (Jul-Sep 1901) last RANGE T 12 STEP
• With ‘seasonalAverage’ any number of months can be chosen:
[Ex .: Jul-Sep, May-Oct, Dec-Mar ...]
• With ‘BoxAverage’, the number of months must divide by 12:
[Ex .: 1, 2, 3, 4, 6, not 5]
• With ‘runningAverage’ also, any number of months can be chosen:
[Ex .: 3, 5, 252 = 21x12 ...]
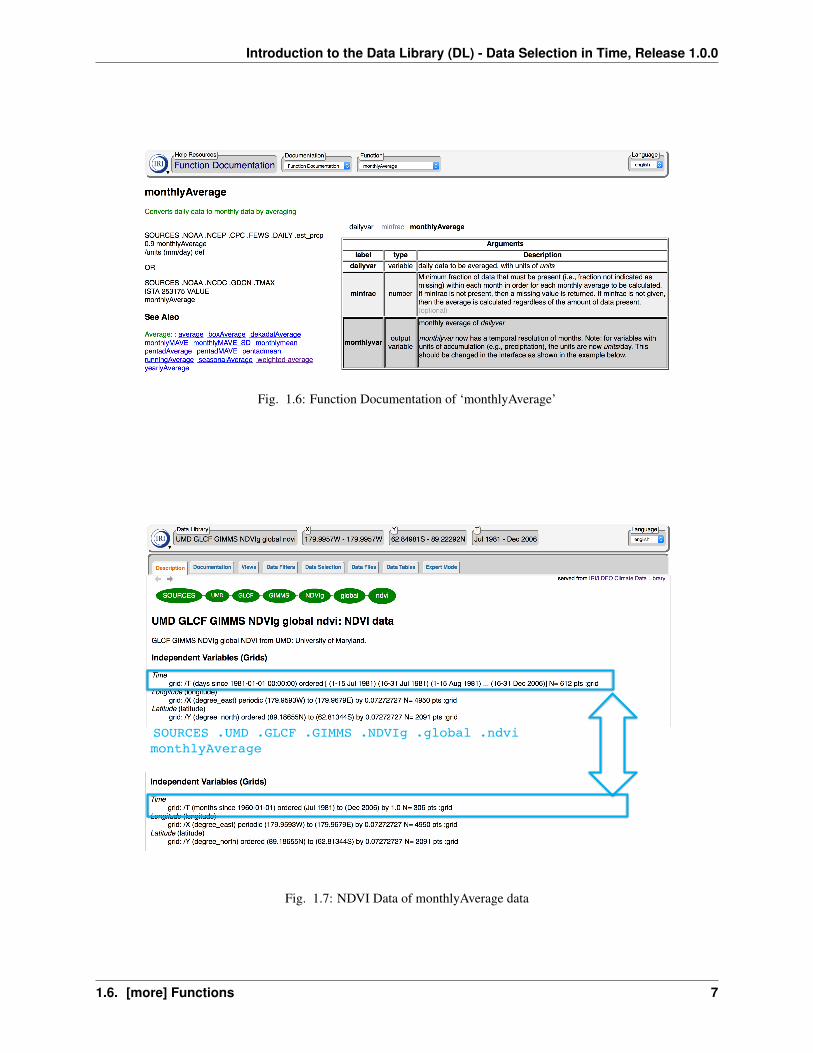
• The monthlyAverage function calculates, the monthly average from daily data, dekadal and even bi-monthly.
6 Chapter 1. Introduction to the Data Library (DL) - Data Selection in Time
Introduction to the Data Library (DL) - Data Selection in Time, Release 1.0.0
Fig. 1.6: Function Documentation of ‘monthlyAverage’
SOURCES .UMD .GLCF .GIMMS .NDVIg .global .ndvi monthlyAverage
Fig. 1.7: NDVI Data of monthlyAverage data
1.6. [more] Functions 7
Introduction to the Data Library (DL) - Data Selection in Time, Release 1.0.0
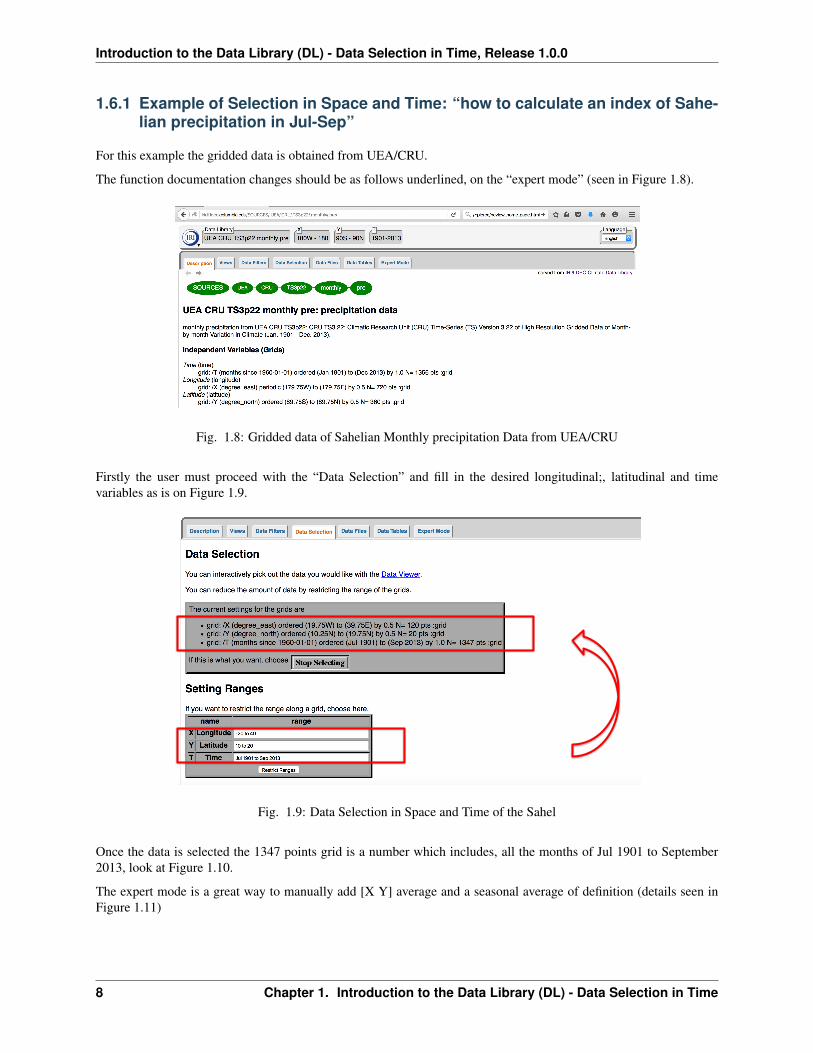
1.6.1 Example of Selection in Space and Time: “how to calculate an index of Sahe-lian precipitation in Jul-Sep”
For this example the gridded data is obtained from UEA/CRU.
The function documentation changes should be as follows underlined, on the “expert mode” (seen in Figure 1.8).
Fig. 1.8: Gridded data of Sahelian Monthly precipitation Data from UEA/CRU
Firstly the user must proceed with the “Data Selection” and fill in the desired longitudinal;, latitudinal and timevariables as is on Figure 1.9.
Fig. 1.9: Data Selection in Space and Time of the Sahel
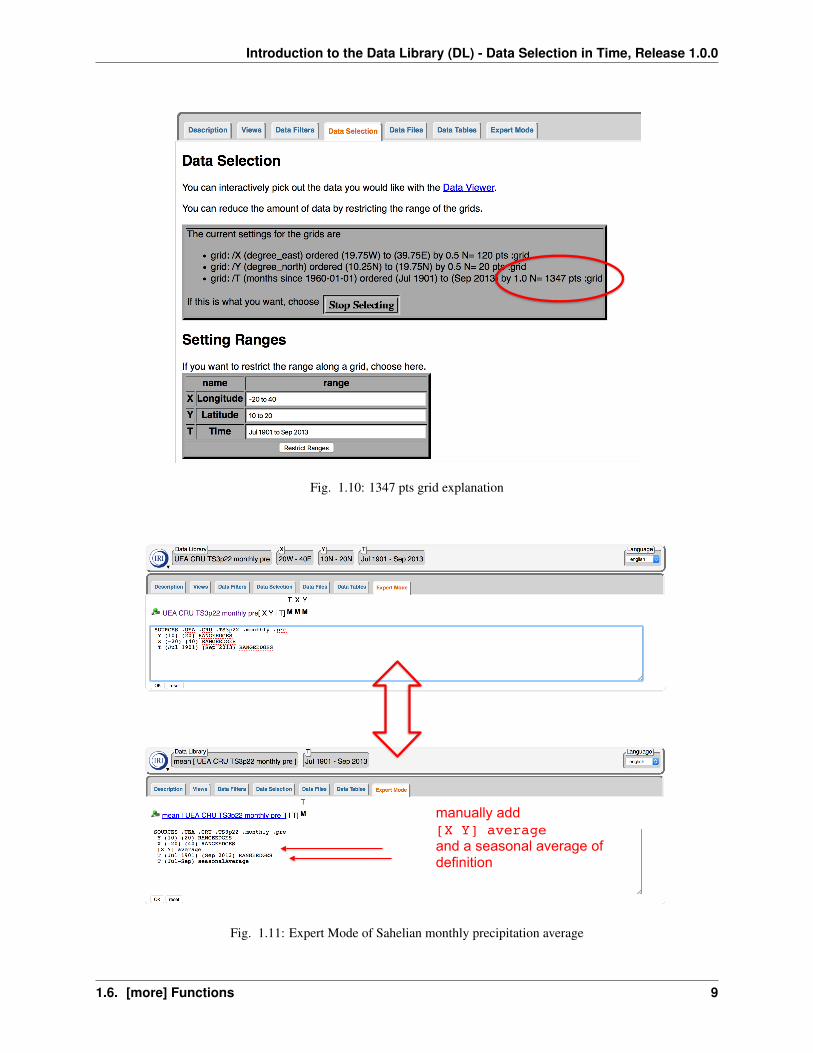
Once the data is selected the 1347 points grid is a number which includes, all the months of Jul 1901 to September2013, look at Figure 1.10.
The expert mode is a great way to manually add [X Y] average and a seasonal average of definition (details seen inFigure 1.11)
8 Chapter 1. Introduction to the Data Library (DL) - Data Selection in Time
Introduction to the Data Library (DL) - Data Selection in Time, Release 1.0.0
Fig. 1.10: 1347 pts grid explanation
manually add [X Y] averageand a seasonal average of definition
Fig. 1.11: Expert Mode of Sahelian monthly precipitation average
1.6. [more] Functions 9
Introduction to the Data Library (DL) - Data Selection in Time, Release 1.0.0
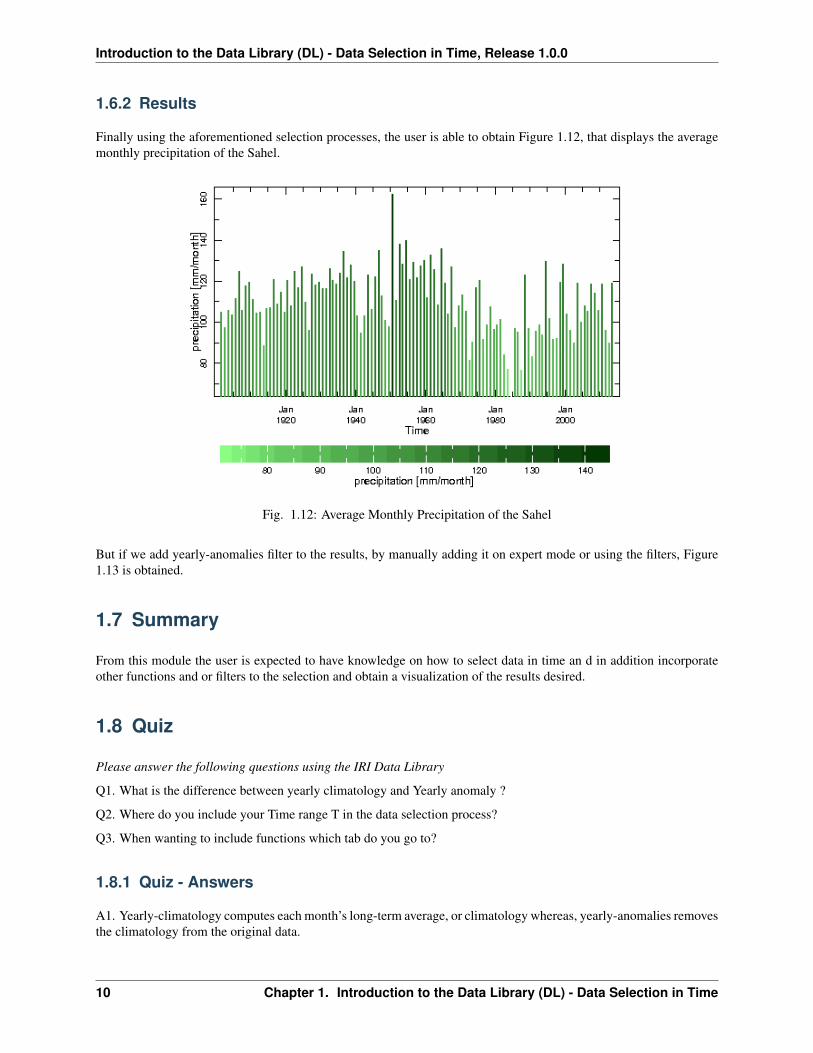
1.6.2 Results
Finally using the aforementioned selection processes, the user is able to obtain Figure 1.12, that displays the averagemonthly precipitation of the Sahel.
Fig. 1.12: Average Monthly Precipitation of the Sahel
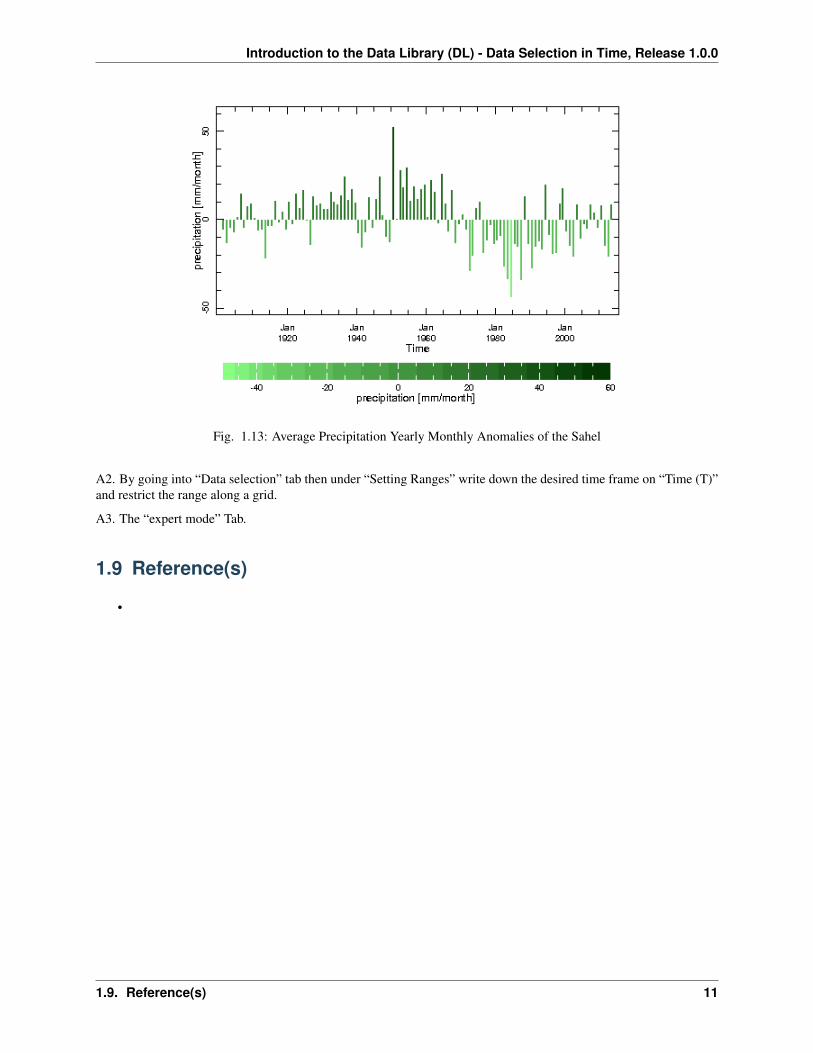
But if we add yearly-anomalies filter to the results, by manually adding it on expert mode or using the filters, Figure1.13 is obtained.
1.7 Summary
From this module the user is expected to have knowledge on how to select data in time an d in addition incorporateother functions and or filters to the selection and obtain a visualization of the results desired.
1.8 Quiz
Please answer the following questions using the IRI Data Library
Q1. What is the difference between yearly climatology and Yearly anomaly ?
Q2. Where do you include your Time range T in the data selection process?
Q3. When wanting to include functions which tab do you go to?
1.8.1 Quiz - Answers
A1. Yearly-climatology computes each month’s long-term average, or climatology whereas, yearly-anomalies removesthe climatology from the original data.
10 Chapter 1. Introduction to the Data Library (DL) - Data Selection in Time
Introduction to the Data Library (DL) - Data Selection in Time, Release 1.0.0
Fig. 1.13: Average Precipitation Yearly Monthly Anomalies of the Sahel
A2. By going into “Data selection” tab then under “Setting Ranges” write down the desired time frame on “Time (T)”and restrict the range along a grid.
A3. The “expert mode” Tab.
1.9 Reference(s)
•
1.9. Reference(s) 11