Embed Size (px)
Citation preview

Konstantinos GeorgakopoulosEXERGIA S.A.Public workshop AthensMay 26, 2011
Introduction to theproject BioGrace

Public workshop AthensMay 26, 2011
Slide 2
Contents
1. Introduction
2. Why harmonisation of biofuel GHG calculations?
3. Project BioGrace
4. One list of standard values
5. Concluding summary

Public workshop AthensMay 26, 2011
Slide 3
Introduction
GHG calculations under Renewable Energy Directive (RED)and Fuel Quality Directive (FQD)
RED and FQD: same sustainability criteria including GHG
RED article 19:
oEconomic operators may use- default values (19.1.a)- actual values calculated according to Annex V.C (19.1.b)- sum of actual value and disaggregated default value (19.1.c)
o In Europe default values only when feedstock is produced in area on list (19.2) or from waste/residue
RED article 18:
o Independent auditors must check information (18.3)
oCan be part of voluntary certification schemes (18.4)

Public workshop AthensMay 26, 2011
Slide 4
Introduction
o Input data
oStandard values (“conversion factors”)
Cultivation of rapeseed Calculated emissionsYield Emissions per MJ FAME
Rapeseed 3.113 kg ha-1 year-1g CO2 g CH4 g N2O g CO2, eq
Moisture content 10,0%
By-product Straw n/a kg ha-1 year-1
Energy consumption
Diesel 2.963 MJ ha-1 year-1 6,07 0,00 0,00 6,07
Agro chemicals
N-fertiliser 137,4 kg N ha-1 year-1 9,08 0,03 0,03 18,89CaO-fertiliser 19,0 kg CaO ha-1 year-1 0,05 0,00 0,00 0,06K2O-fertiliser 49,5 kg K2O ha-1 year-1
0,62 0,00 0,00 0,67
P2O5-fertiliser 33,7 kg P2O5 ha-1 year-10,76 0,00 0,00 0,80
Pesticides 1,2 kg ha-1 year-1 0,28 0,00 0,00 0,32
Seeding material
Seeds- rapeseed 6 kg ha-1 year-1 0,06 0,00 0,00 0,10
STANDARD VALUESparameter:
unit: gCO2/kg gCH4/kg gN2O/kg gCO2-eq/kgN-fertiliser 2827,0 8,68 9,6418 5880,6
GHG emission coefficient

Public workshop AthensMay 26, 2011
Slide 5
Contents
1. Introduction
2. Why harmonisation of biofuel GHG calculations?
3. Project BioGrace
4. One list of standard values
5. Concluding summary
Public workshop AthensMay 26, 2011
Slide 6
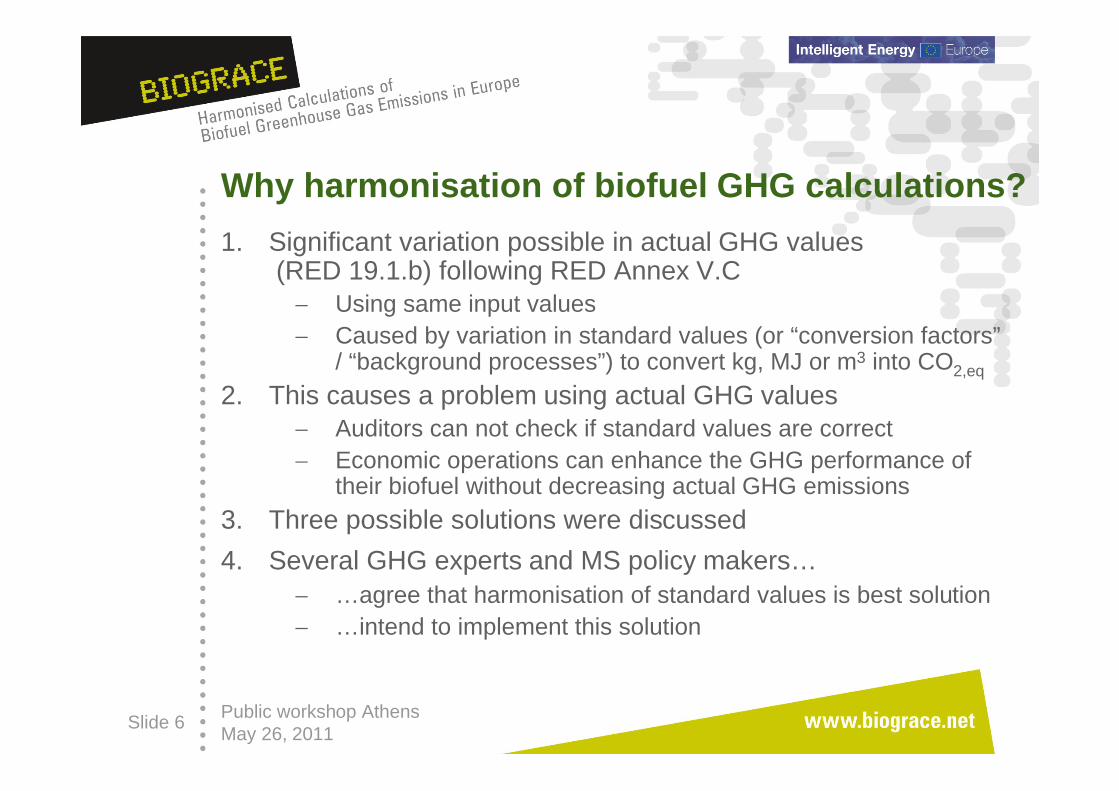
Why harmonisation of biofuel GHG calculations?
1. Significant variation possible in actual GHG values(RED 19.1.b) following RED Annex V.C Using same input values Caused by variation in standard values (or “conversion factors”
/ “background processes”) to convert kg, MJ or m3 into CO2,eq
2. This causes a problem using actual GHG values Auditors can not check if standard values are correct Economic operations can enhance the GHG performance of
their biofuel without decreasing actual GHG emissions
3. Three possible solutions were discussed
4. Several GHG experts and MS policy makers… …agree that harmonisation of standard values is best solution …intend to implement this solution
Public workshop AthensMay 26, 2011
Slide 7
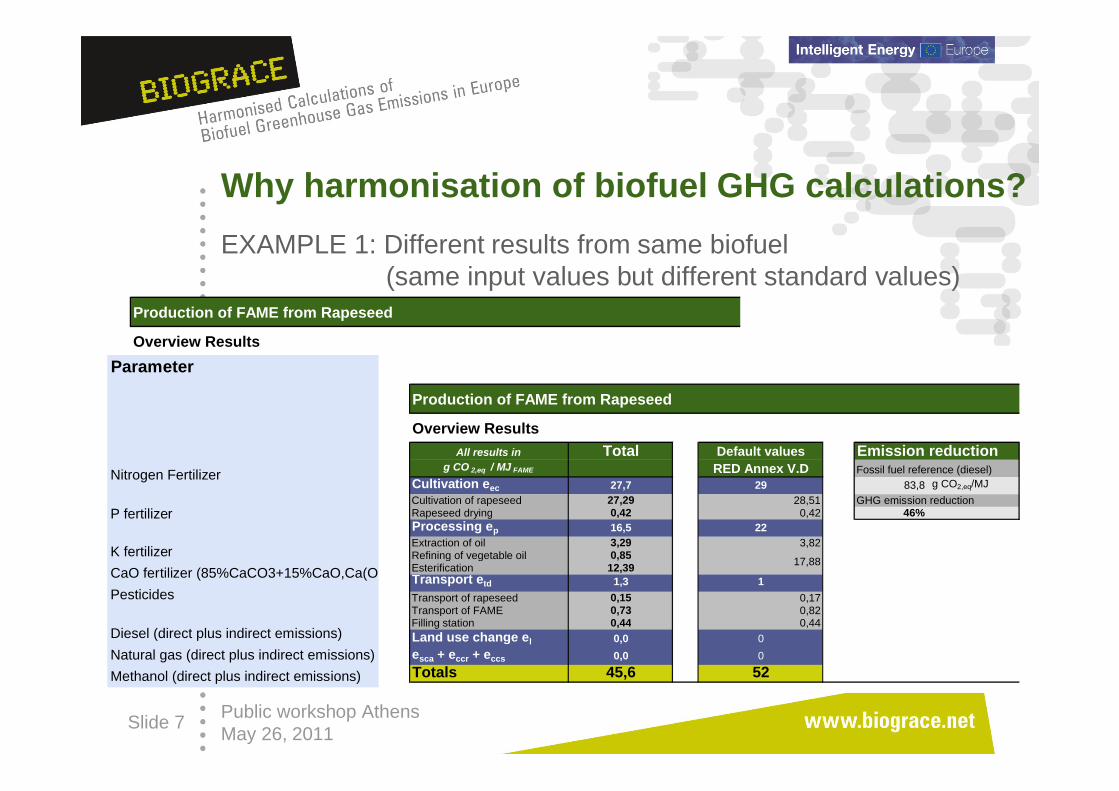
Why harmonisation of biofuel GHG calculations?
EXAMPLE 1: Different results from same biofuel(same input values but different standard values)
Production of FAME from Rapeseed
Overview Results
All results in Total Default values Emission reductiong CO 2,eq / MJ FAME RED Annex V.D Fossil fuel reference (diesel)
Cultivation eec 28,9 29 83,8 g CO2,eq/MJ
Cultivation of rapeseed 28,49 28,51 GHG emission reductionRapeseed drying 0,42 0,42 38%Processing ep 21,7 22
Extraction of oil 3,83 3,82Refining of vegetable oil 1,02Esterification 16,84Transport etd 1,4 1
Transport of rapeseed 0,17 0,17Transport of FAME 0,82 0,82Filling station 0,44 0,44Land use change el 0,0 0
esca + eccr + eccs 0,0 0
Totals 52,0 52
17,88
Parameter Unit Source
EC (RED Netherlands UK GermanyAnnex V) (Ecofys / CE) RFA IFEU
Nitrogen Fertilizer g CO2eq/kg 5917,2 6367,0 6800,0 6410
P fertilizer g CO2eq/kg 1013,5 700,0354 for TSP, 95 for
rock phosphate, 596 for MAP
1180
K fertilizer g CO2eq/kg 579,2 453,0 333,0 663
CaO fertilizer (85%CaCO3+15%CaO,Ca(OH)2) g CO2eq/kg 130,0 179,0 124,0 297
Pesticides g CO2eq/kg 11025,7 17256,8 17300,0 1240
Diesel (direct plus indirect emissions) g CO2eq/MJ 87,6 76,7 86,4 89,1
Natural gas (direct plus indirect emissions) g CO2eq/MJ 68,0 53,9 62,0 62,8
Methanol (direct plus indirect emissions) g CO2eq/MJ 98,1 137,5 138,5 62,5
Production of FAME from Rapeseed
Overview Results
All results in Total Default values Emission reductiong CO 2,eq / MJ FAME RED Annex V.D Fossil fuel reference (diesel)
Cultivation eec 27,7 29 83,8 g CO2,eq/MJ
Cultivation of rapeseed 27,29 28,51 GHG emission reductionRapeseed drying 0,42 0,42 46%Processing ep 16,5 22
Extraction of oil 3,29 3,82Refining of vegetable oil 0,85Esterification 12,39Transport etd 1,3 1
Transport of rapeseed 0,15 0,17Transport of FAME 0,73 0,82Filling station 0,44 0,44Land use change el 0,0 0
esca + eccr + eccs 0,0 0
Totals 45,6 52
17,88

Public workshop AthensMay 26, 2011
Slide 8
Why harmonisation of biofuel GHG calculations?
1. Significant variation possible in actual GHG values(RED 19.1.b) following RED Annex V.C Using same input values Caused by variation in standard values (or “conversion factors”
/ “background processes”) to convert kg, MJ or m3 into CO2,eq
2. This causes a problem using actual GHG values Auditors can not check if standard values are correct Economic operators can enhance the GHG performance of
their biofuel without decreasing actual GHG emissions
3. Three possible solutions were discussed, of which two theoretical
4. Several GHG experts and MS policy makers… …agree that harmonisation of standard values is best solution …intend to implement this solution

Public workshop AthensMay 26, 2011
Slide 9
Formulation of project BioGrace
1. Dresden workshop (June 2, 2009) led to project based on finding that harmonisation is needed initiated by advisors to governments with expertise on GHG
calculations (IFEU, RFA, SenterNovem = NL Agency)
2. Project received letters of support from governments France, Germany, Netherlands, Spain, UK
3. Proposal for subsidy from “Intelligent Energy Europe” Advantage: funding from EC Disadvantage: long lead time
(submission end of June 2009, start project in April 2010)
4. Work was already started 2nd half of 2009 Because of tight timeline implementation RED
5. Final preparation of project Contract negotiation Dec. 2009 – March 2010

Public workshop AthensMay 26, 2011
Slide 10
Contents
1. Introduction
2. Why harmonisation of biofuel GHG calculations?
3. Project BioGrace
4. One list of standard values
5. Concluding summary
Public workshop AthensMay 26, 2011
Slide 11
Project BioGrace
Biofuel Greenhouse Gas emissions: alignment of calculations in Europe
Aim of project:o Harmonise calculations of biofuel greenhouse gas (GHG)
emissions performed in EU-27 under legislation implementing the Renewable Energy and Fuel Quality directives
Consortiumo Agencies/organisations close to national governments and
experts in GHG calculations Coordinator: Agentschap NL (formerly SenterNovem) Partners: ADEME, BE2020, BIO-IS, CIEMAT, IFEU, EXERGIA,
STEM

Public workshop AthensMay 26, 2011
Slide 12
Project BioGrace

Public workshop AthensMay 26, 2011
Slide 13
Project BioGrace
Key objectives are:
1. Cause transparency
2. Cause harmonisation
3. Facilitate stakeholders
4. Disseminate results

Public workshop AthensMay 26, 2011
Slide 14
Project BioGrace
Key objectives are:
1. Cause transparencyReproduce biofuel default GHG values (Annex V RED) - Has not been done by the Commission or JEC- Is a recurrent exercise
2. Cause harmonisationCause that GHG calculation tools give the same results
3. Facilitate stakeholdersAllow relevant stakeholders to calculate actual values
4. Disseminate resultsMake our results public to all relevant stakeholders

Public workshop AthensMay 26, 2011
Slide 15
Project BioGrace
Key objectives are:
1. Cause transparencyReproduce biofuel default GHG values (Annex V RED)
2. Cause harmonisationCause that GHG calculation tools give the same results- All tools that are linked to our project- Note: this is a policy effort, not a scientific effort
3. Facilitate stakeholdersAllow relevant stakeholders to calculate actual values
4. Disseminate resultsMake our results public to all relevant stakeholders

Public workshop AthensMay 26, 2011
Slide 16
Project BioGrace
Key objectives are:
1. Cause transparencyReproduce biofuel default GHG values (Annex V RED)
2. Cause harmonisationCause that GHG calculation tools give the same results
3. Facilitate stakeholdersAllow relevant stakeholders to calculate actual values- By providing them calculation tools- By improving tools following stakeholder input
4. Disseminate resultsMake our results public to all relevant stakeholders

Public workshop AthensMay 26, 2011
Slide 17
Project BioGrace
Key objectives are:
1. Cause transparencyReproduce biofuel default GHG values (Annex V RED)
2. Cause harmonisationCause that GHG calculation tools give the same results
3. Facilitate stakeholdersAllow relevant stakeholders to calculate actual values
4. Disseminate resultsMake our results public to all relevant stakeholders- All information is available through www.BioGrace.net- All information is for free ! - Public stakeholder workshops
31 May: Madrid 1 June: Stockholm

Public workshop AthensMay 26, 2011
Slide 18
Project BioGrace
o BioGrace will also: make a list of additional standard values list rules for making actual calculations add ‘sophisticated’ support sheets for calculation of direct land use change (based on Commission Decision) N2O emissions (based on IPCC Tier 1)
o BioGrace will not: add pathways to the Excel file with GHG calculations that
are not listed in RED Annex V help stakeholders make actual calculations check actual calculations at the request of stakeholders
o Feedback by stakeholders is warmly welcomed

Public workshop AthensMay 26, 2011
Slide 19
Project BioGrace
Project coordinator: Agentschap NL (NL Agency)Dr. John P.A. Neefte-mail: [email protected]
Project partners: - ADEME, France (Bruno Gagnepain)- BE2020, Austria (Dina Bacovsky)- BIO IS, France (Remy Lauranson)- CIEMAT, Spain (Yolanda Lechon)- EXERGIA, Greece (Konstantinos
Georgakopoulos)- IFEU, Germany (Horst Fehrenbach)- STEM, Sweden (Matti Parikka)
Project duration: 2 years (April 2010 – March 2012)
Project website: www.BioGrace.net

Public workshop AthensMay 26, 2011
Slide 20
Contents
1. Introduction
2. Why harmonisation of biofuel GHG calculations?
3. Project BioGrace
4. One list of standard values
5. Concluding summary
Public workshop AthensMay 26, 2011
Slide 21
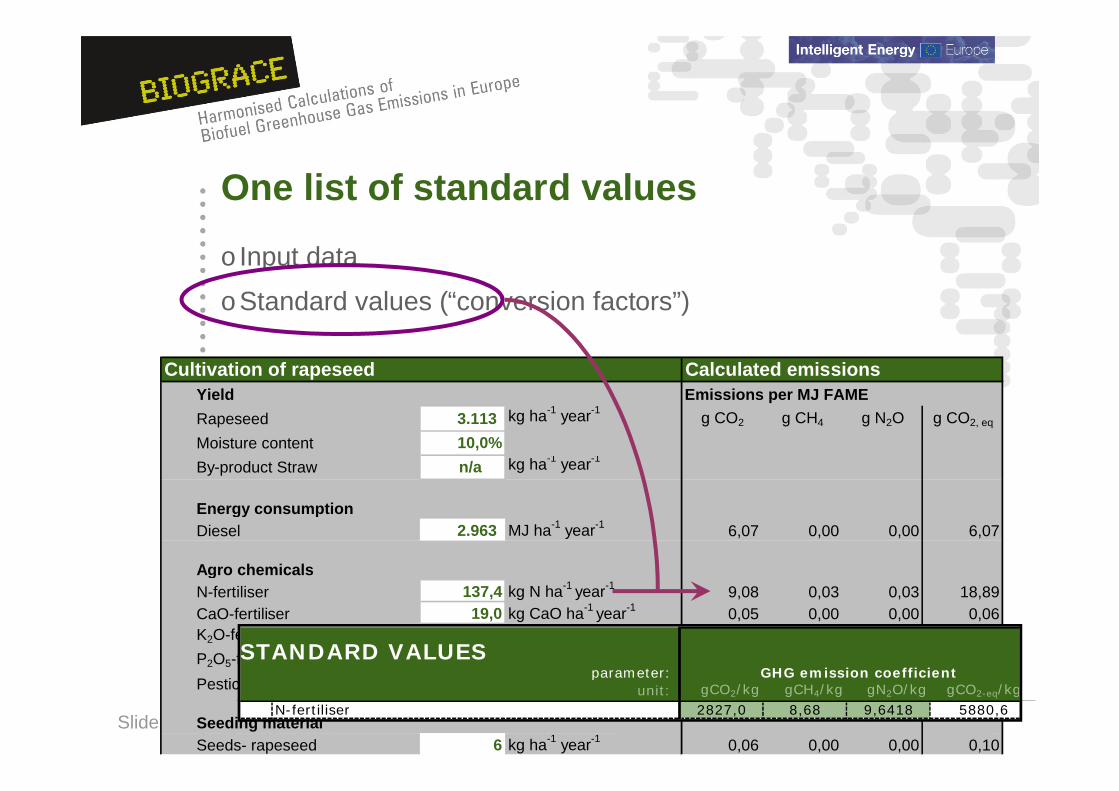
One list of standard values
o Input data
oStandard values (“conversion factors”)
Cultivation of rapeseed Calculated emissionsYield Emissions per MJ FAME
Rapeseed 3.113 kg ha-1 year-1g CO2 g CH4 g N2O g CO2, eq
Moisture content 10,0%
By-product Straw n/a kg ha-1 year-1
Energy consumption
Diesel 2.963 MJ ha-1 year-1 6,07 0,00 0,00 6,07
Agro chemicals
N-fertiliser 137,4 kg N ha-1 year-1 9,08 0,03 0,03 18,89CaO-fertiliser 19,0 kg CaO ha-1 year-1 0,05 0,00 0,00 0,06K2O-fertiliser 49,5 kg K2O ha-1 year-1
0,62 0,00 0,00 0,67
P2O5-fertiliser 33,7 kg P2O5 ha-1 year-10,76 0,00 0,00 0,80
Pesticides 1,2 kg ha-1 year-1 0,28 0,00 0,00 0,32
Seeding material
Seeds- rapeseed 6 kg ha-1 year-1 0,06 0,00 0,00 0,10
STANDARD VALUESparameter:
unit: gCO2/kg gCH4/kg gN2O/kg gCO2-eq/kgN-fertiliser 2827,0 8,68 9,6418 5880,6
GHG emission coefficient
Public workshop AthensMay 26, 2011
Slide 22
One list of standard values
List of standard values
o is publicly available
o to be used by everyone that makes GHG calculations under RED/FQD based legislation
We are achieving this by:
Including values in all software tools
Causing that list is known by all GHG calculation experts
Showing that these (and only these) standard values lead to RED defaults
Requesting policy makers to make reference from national legislation (implementing RED / FQD)

Public workshop AthensMay 26, 2011
Slide 23
One list of standard values
STANDARD VALUES LHVparameter: Density MJ/kg
unit: gCO2/kg gCH4/kg gN2O/kg gCO2-eq/kg gCO2/MJ gCH4/MJ gN2O/MJ gCO2-eq/MJ MJfossil/kg MJfossil/MJ kg/m3 (at 0% water) MJ/t.km gCH4/t.km gN2O/t.km
Global Warming Potentials (GWP's)CO2 1CH4 23N2O 296
Agro inputs N-fertiliser 2827,0 8,68 9,6418 5880,6 48,99P2O5-fertiliser 964,9 1,33 0,0515 1010,7 15,23K2O-fertiliser 536,3 1,57 0,0123 576,1 9,68CaO-fertiliser 119,1 0,22 0,0183 129,5 1,97Pesticides 9886,5 25,53 1,6814 10971,3 268,40Seeds- corn - - - - - Seeds- rapeseed 412,1 0,91 1,0028 729,9 7,87Seeds- soy bean - - - - - Seeds- sugarbeet 2187,7 4,60 4,2120 3540,3 36,29Seeds- sugarcane 1,6 0,00 0,0000 1,6 0,02Seeds- sunflower 412,1 0,91 1,0028 729,9 7,87Seeds- wheat 151,1 0,28 0,4003 275,9 2,61EFB compost (palm oil) 0,0 0,00 0,0000 0,0 0,00
Fuels- gasses Natural gas (4000 km, Russian NG quality) 61,58 0,1981 0,0002 66,20 1,1281Natural gas (4000 km, EU Mix qualilty) 62,96 0,1981 0,0002 67,59 1,1281
Fuels- liquidsDiesel 87,64 - - 87,64 1,16 832 43,1Gasoline 745 43,2HFO 84,98 - - 84,98 1,088 970 40,5Ethanol 794 26,81Methanol 92,80 0,2900 0,0003 99,57 1,6594 793 19,9FAME 890 37,2Syn diesel (BtL) 780 44,0HVO 780 44,0
Fuels / feedstock / byproducts - solidsHard coal 102,38 0,3835 0,0003 111,28 1,0886 26,5Lignite 116,76 0,0091 0,0001 116,98 1,0156 9,2Corn 18,5FFB 24,0Rapeseed 26,4Soybeans 23,5Sugar beet 16,3Sugar cane 19,6Sunflowerseed 26,4Wheat 17,0Animal fat 37,1BioOil (byproduct FAME from waste oil) 21,8Crude vegetable oil 36,0DDGS 16,0Glycerol 16,0Palm kernel meal 17,0
GHG emission coefficientFuel
efficiencyTransport exhaust gas
emissionsFossil energy input
Both Excel and Word versions
available at
www.BioGrace.net
Version 3 - Public
Condensed list of standard values, version 3 - Public
This file gives the standard values as published on www.biograce.net in Word format.
Two Word versions of this list exist:
1. A complete list of standard values, containing all the values as listed in the Excel version
2. A condensed list showing the most important standard values
This file contains the condensed list.
Abbreviations and definitions used can be found in the Excel file on the web page
http://www.biograce.net/content/ghgcalculationtools/standardvalues.
1 Global Warming potentials
CO2 1 g CO2,eq / g CO2
CH4 23 g CO2,eq / g CH4
N2O 296 g CO2,eq / g N2O
2 GHG emission coefficients
N-fertiliser 5880,6 g CO2,eq/kg N
P2O5-fertiliser 1010,7 g CO2,eq/kg P2O5
K2O-fertiliser 576,1 g CO2,eq/kg K2O
CaO-fertiliser 129,5 g CO2,eq/kg CaO

Public workshop AthensMay 26, 2011
Slide 24
One list of standard values
List of standard values
o European Commission makes reference to list

Public workshop AthensMay 26, 2011
Slide 25
Transparency & harmonisation

Public workshop AthensMay 26, 2011
Slide 26
One list of standard values
List of standard values
o European Commission makes reference to list
o Member States include list in Technical Guidance:
Austria, Sweden, UK are preparing to do
Germany, Ireland, Netherlands are about to decide to do so
o Example (from UK consultation on C&S Technical Guidance)
The RFA therefore proposes the following approach to which standard values should be used:1. For the reporting period 2011/2012, the RFA proposes
to align its current standard emission factors with the ones proposed by the BioGrace project.

Public workshop AthensMay 26, 2011
Slide 27
One list of standard values
List of standard values
o When motivated, other standard values can be usedo BioGrace will publish a calculation rule for this, stating that
For standard values not yet on the list- a reliable source (literature, database) should be given - auditors can verify this information conform RED Article 18.3
For standard values that are already listed:- reliable information is submitted showing how these values
were determined- auditors can verify this information conform RED Article 18.3.- it is shown that this input was used in the production of the
biofuel- the use of this alternative standard value does not contradict
any other calculation rule

Public workshop AthensMay 26, 2011
Slide 28
Contents
1. Introduction
2. Why harmonisation of biofuel GHG calculations?
3. Project BioGrace
4. One list of standard values
5. Concluding summary
Public workshop AthensMay 26, 2011
Slide 29
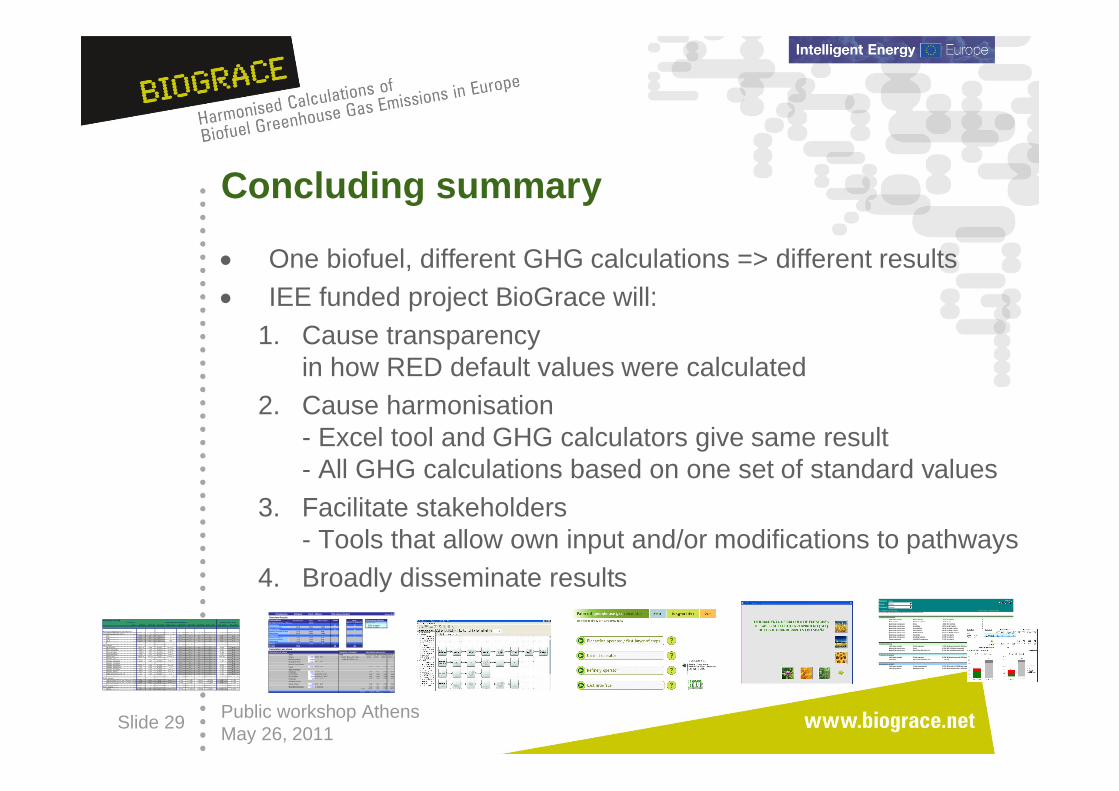
Concluding summary
One biofuel, different GHG calculations => different results
IEE funded project BioGrace will:
1. Cause transparencyin how RED default values were calculated
2. Cause harmonisation- Excel tool and GHG calculators give same result- All GHG calculations based on one set of standard values
3. Facilitate stakeholders- Tools that allow own input and/or modifications to pathways
4. Broadly disseminate resultsReference: Diesel
Biofuel: Biodiesel 1
Feedstock: Rapeseed 1
D = Default; U = User input shtBioRapeseed Version 3.0.6 - Februari 2010Current chain: Biodiesel from Rapeseed (not saved by user)
Feedstock productionYield main product Raw rapeseed 3113 kg / (ha*yr) DMain product Moisture content 0,10 kg / kg DMaterial & energy use Diesel 2963 MJ / (ha*yr) DMaterial & energy use N fertilizer 137,4 kg N / (ha*yr) DMaterial & energy use CaO fertilizer 19,00 kg CaO / (ha*yr) DMaterial & energy use K2O fertilizer 49,46 kg K2O / (ha*yr) DMaterial & energy use P2O5 fertilizer 33,67 kg P2O5 / (ha*yr) DMaterial & energy use Pesticides 1,230 kg / (ha*yr) DMaterial & energy use Seeding material 6,000 kg / (ha*yr) DDirect emissions Field N2O emissions 3,103 kg / (ha*yr) D
Feedstock dryingYield main product Dried rapeseed 1,000 MJdried rapeseed / (MJraw rapeseed) DMaterial & energy use Diesel 0,181 MJ / (GJdried rapeseed) DMaterial & energy use Electricity (EU-mix, LV) 3,079 MJ / (GJdried rapeseed) D
Transport feedstockYield main product Dried rapeseed 0,990 MJdried rapeseed / (MJdried rapeseed) DTransport 40 t truck (payload: 27 t) 50 km D
Extraction in oil millYield main product Crude rapeseed oil 0,613 MJcrude oil / (MJdried rapeseed) DYield by-product Rapeseed cake 0,387 MJrapeseed cake / (MJdried rapeseed) D
Biodiesel
Rapeseed
STANDARD VALUESparameter:
unit: gCO2/kg gCH4/kg gN2O/kg gCO2-eq/kg gCO2/MJ gCH4/MJ gN2O/MJ gCO2-eq/MJ MJfossil/kg MJfossil/MJ
Process independent parametersGreenhouse gas emissions
CO2 n.r. n.r. n.r. 1 n.r. n.r. n.r. n.r. N.A. N.A.CH4 n.r. n.r. n.r. 25 n.r. n.r. n.r. n.r. N.A. N.A.N2O n.r. n.r. n.r. 298 n.r. n.r. n.r. n.r. N.A. N.A.
Agro inputs N-fertiliser 2827,0 8,68 9,6418 5917,2 n.r. n.r. n.r. n.r. 48,99 N.A.P2O5-fertiliser 964,9 1,33 0,0515 1013,5 n.r. n.r. n.r. n.r. 15,23 N.A.K2O-fertiliser 536,3 1,57 0,0123 579,2 n.r. n.r. n.r. n.r. 9,68 N.A.CaO-fertiliser 119,1 0,22 0,0183 130,0 n.r. n.r. n.r. n.r. 1,97 N.A.Pesticides 9886,5 25,53 1,6814 11025,7 n.r. n.r. n.r. n.r. 268,40 N.A.Seeds- corn - - - - n.r. n.r. n.r. n.r. - N.A.Seeds- rapeseed 412,1 0,91 1,0028 733,7 n.r. n.r. n.r. n.r. 7,87 N.A.Seeds- soy bean - - - - n.r. n.r. n.r. n.r. - N.A.Seeds- sugarbeet 2187,7 4,60 4,2120 3557,9 n.r. n.r. n.r. n.r. 36,29 N.A.Seeds- sugarcane 1,6 0,00 0,0000 1,6 n.r. n.r. n.r. n.r. 0,02 N.A.Seeds- sunflower 412,1 0,91 1,0028 733,7 n.r. n.r. n.r. n.r. 7,87 N.A.Seeds- wheat 151,1 0,28 0,4003 277,3 n.r. n.r. n.r. n.r. 2,61 N.A.EFB compost (palm oil) 0,0 0,00 0,0000 0,0 n.r. n.r. n.r. n.r. 0,00 N.A.
Fuels- gasses Natural gas (4000 km, Russian NG quality)N.A. N.A. N.A. N.A. 61,58 0,1981 0,0002 66,595 N.A. 1,1281Natural gas (4000 km, EU Mix qualilty) N.A. N.A. N.A. N.A. 62,96 0,1981 0,0002 67,984 N.A. 1,1281
Fuels- liquidsDiesel n.r. n.r. n.r. n.r. 87,51 0,0014 0,0000 87,557 n.r. 1,1575
GHG emission coefficient Fossil energy input
Production Ethanol from Wheat (NG steam boiler) Version 1.0
Overview ResultsCalculation Not allocated Alloc. Alloc.results Total RED Allocation factorsAll results in g CO2,eq / MJEthanol factor Annex V Table D Ethanol plant
Cultivation 23 23 59,5% to ethanolCultivation of wheat 39,40 59,5% 23,44 40,5% to DDGS
Processing 21 21Handling & storage of wheat 0,10 59,5% 0,06Ethanol plant 35,34 59,5% 21,03
Transport 2 2Transport of wheat 0,52 59,5% 0,31Transport of ethanol 1,10 100% 1,10Filling station 0,45 100% 0,45
Bonus 0 100% 0 0 0
Totals 76,9 46 46
Calculation per phaseCultivation of wheat Quantity of product Calculated emissions
Yield Yield Emissions per MJ fuel (end product)
Wheat 5.200 kg ha-1
year-1
76.466 MJWheat ha-1
year-1
g CO2 g CH4 g N2O g CO2, eq
Moisture content 13,5% 1,000 MJ / MJWheat, input
By-product Straw 2.145 kg ha-1
year-1
Energy consumption
Diesel 3.716 MJ ha-1
year-1
8,01 0,00 0,00 8,01
Agro chemicals
N-fertiliser 109,3 kg N ha-1
year-1
7,61 0,02 0,03 15,92K2O-ferti liser 16,4 kg K2O ha
-1 year
-10,22 0,00 0,00 0,23
P2O5-fertiliser 21,6 kg P2O5 ha-1 year
-10,51 0,00 0,00 0,54
Pesticides 2,3 kg ha-1
year-1
0,57 0,00 0,00 0,63
Seeding material
Seeds- wheat 120 kg ha-1
year-1
0,45 0,00 0,00 0,82
Field N2O emissions 0,024 g / MJwheat 0,00 0,00 0,04 13,24Total 17,36 0,03 0,07 39,40
Result g CO2,eq / MJEthanol 39,40

Public workshop AthensMay 26, 2011
Slide 30
Thank you for your attention
The sole responsibility for the content of this presentation lies with the authors. It does not necessarily reflectthe opinion of the European Union.
The European Commission is not responsible for any use that may be made of the information contained therein.

Eva KallivokaEXERGIA S.A.Public workshop AthensMay 26, 2011
National GHG calculators –harmonized in co-operation with BioGrace
Public workshop AthensMay 26, 2011
Slide 2
Contents
1. Introduction
2. Dutch GHG calculator
3. German GHG calculator
4. Spanish GHG calculator
5. UK GHG calculator
6. Conclusions
Public workshop AthensMay 26, 2011
Slide 3
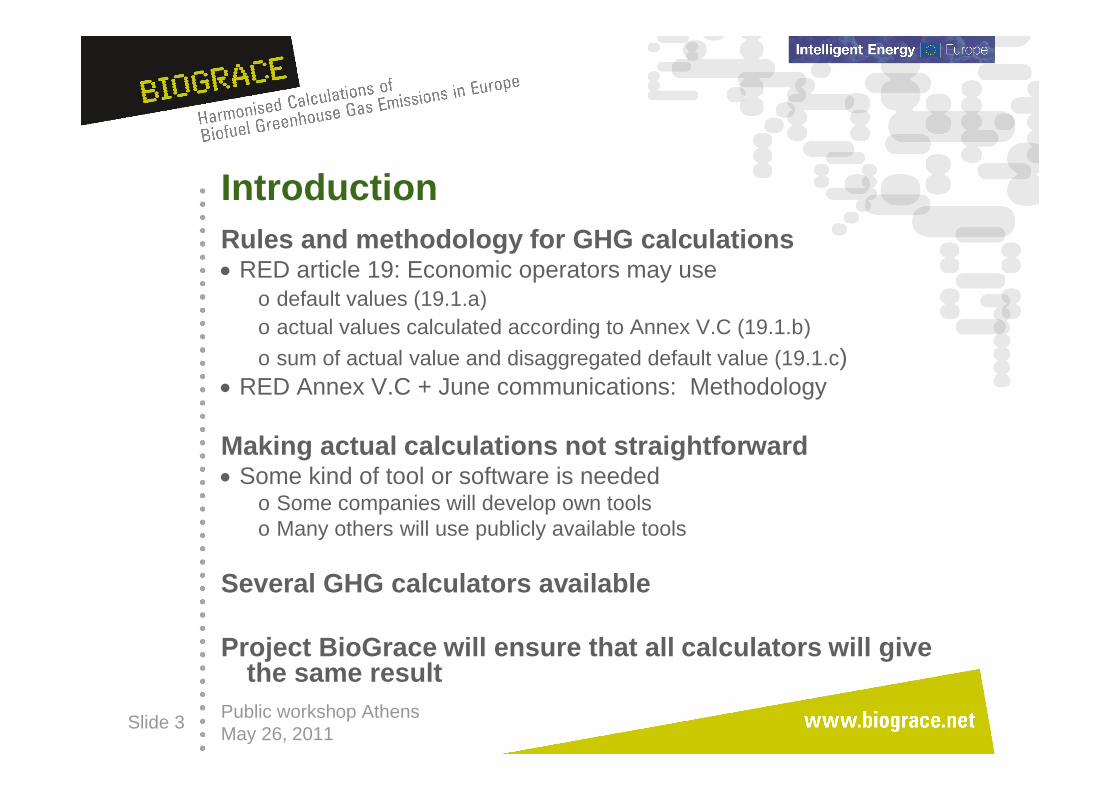
IntroductionRules and methodology for GHG calculations RED article 19: Economic operators may use
o default values (19.1.a)o actual values calculated according to Annex V.C (19.1.b)
o sum of actual value and disaggregated default value (19.1.c) RED Annex V.C + June communications: Methodology
Making actual calculations not straightforward Some kind of tool or software is needed
o Some companies will develop own toolso Many others will use publicly available tools
Several GHG calculators available
Project BioGrace will ensure that all calculators will givethe same result

Public workshop AthensMay 26, 2011
Slide 4
Contents
1. Introduction
2. Dutch GHG calculator
3. German GHG calculator
4. Spanish GHG calculator
5. UK GHG calculator
6. Conclusions

Public workshop AthensMay 26, 2011
Slide 5
Dutch tool - General informationBackground
o Dutch government prepared a reporting obligation on sustainability for biofuels to start per 1-1-2009
o This was abandoned after the publication of the draft Renewable Energy Directive (RED).
The Dutch GHG calculatoro was developed in 2007/2008 by consultants EcoFys and CE
o has been available for (Dutch) stakeholders to make GHG calculation on biofuels
o has not been used extensively due to lack of legal framework in 2008 – 2010
o was recently updated and made “RED”- proof by Agency NL

Public workshop AthensMay 26, 2011
Slide 6
Dutch GHG toolReference: Diesel
Biofuel: Biodiesel 1
Feedstock: Rapeseed 1
D = Default; U = User input shtBioRapeseed Version 3.1 - augustus 2010Current chain: Biodiesel from Rapeseed (not saved by user)
Feedstock productionYield main product Raw rapeseed 3113 kg / (ha*yr) DMain product Moisture content 0,10 kg / kg DMaterial & energy use Diesel 2963 MJ / (ha*yr) DMaterial & energy use N fertilizer 137,4 kg N / (ha*yr) DMaterial & energy use CaO fertilizer 19,00 kg CaO / (ha*yr) DMaterial & energy use K2O fertilizer 49,46 kg K2O / (ha*yr) DMaterial & energy use P2O5 fertilizer 33,67 kg P2O5 / (ha*yr) DMaterial & energy use Pesticides 1,230 kg / (ha*yr) DMaterial & energy use Seeding material - rapeseed 6,000 kg / (ha*yr) DField emissions Field N2O emissions 3,103 kg / (ha*yr) DField emissions Direct Land Use Change No g CO2/MJbiofuel D
Feedstock dryingYield main product Dried rapeseed 1,000 MJdried rapeseed / (MJraw rapeseed) DMain product Moisture content 0,10 kg / kg DMaterial & energy use Diesel 0,181 MJ / (GJdried rapeseed) DMaterial & energy use Electricity (EU-mix, LV) 3,079 MJ / (GJdried rapeseed) D
Transport feedstockYield main product Dried rapeseed 0,990 MJdried rapeseed / (MJdried rapeseed) DMain product Moisture content 0,10 kg / kg DTransport Truck for dry product (Diesel) 50 km D
Extraction in oil millYield main product Crude vegetable oil 0,613 MJcrude oil / (MJdried rapeseed) DYield by-product Rapeseed cake 0,387 MJrapeseed cake / (MJdried rapeseed) D
Calculate Results
Load Default Values Chain management
Adapt Chain
Biodiesel Disclaimer
Rapeseed

Public workshop AthensMay 26, 2011
Slide 7
Dutch GHG toolSummary Input Summary output
(MJ) (% of ref.) (g CO2-eq.) (% of ref.) (MJ) (%) (g CO2-eq.) (%)Biofuel Biodiesel Feedstock production 0,1672 14% 28,7496 34%Feedstock Rapeseed Transport actions 0,0233 2% 1,4345 2%Process - Conversion operations 0,3677 32% 21,5636 26%Reference Diesel
End use 1,0000 87% 70,1047 84%Fossil indirect 0,1550 13% 13,6953 16%
Total 0,5582 48,3% 51,7477 61,8% 1,1550 100% 83,8000 100%% Reduction 51,7% 38,2% 0%
Avoided emission (tonne CO2/ha/yr) 1371,5
Biodiesel from Rapeseed Reference: DieselEnergy use (per MJ) GHG emissions (kg/MJ) Energy use (per MJ) GHG emissions (kg/MJ)
Energy use [% of reference]
48,3%
100%
0%
20%
40%
60%
80%
100%
120%
Biodiesel fromRapeseed
Reference: Diesel
Fossil indirect
End use
ConversionoperationsTransport actions
GHG emissions [% of reference]
61,8%
100%
Biodiesel from Rapeseed Reference: Diesel
0%
20%
40%
60%
80%
100%
120%
Biofuels greenhouse gas calculator
Print summary results
Show detailed results
Return to input

Public workshop AthensMay 26, 2011
Slide 8
Dutch GHG toolBiofuel BiodieselFeedstock RapeseedProcess -Reference Diesel
Absolute Numbers (including allocation) Relative contribution (including allocation)Energy use Emission CO2 Emission N2O Emission CH4 Emission GHG Energy use Emission CO2 Emission N2O Emission CH4
[MJ fossil fuel/ [kg CO2/ [kg CO2-eq/ [kg CO2-eq/ [kg CO2-eq/ [%] [%] [%] [%]MJ biofuel] MJ biofuel] MJ biofuel] MJ biofuel] MJ biofuel]
Feedstock productionDiesel 0,047 3,555 0,00E+00 0,00E+00 3,555 8,4% 6,9% 0,0% 0,0%N fertilizer 0,092 5,319 5,370 0,376 11,065 16,5% 10,3% 10,4% 0,7%CaO fertilizer 5,13E-04 0,031 1,41E-03 1,29E-03 0,034 0,1% 0,1% 0,0% 0,0%K2O fertilizer 6,55E-03 0,363 2,47E-03 0,024 0,390 1,2% 0,7% 0,0% 0,0%P2O5 fertilizer 7,02E-03 0,445 7,03E-03 0,014 0,466 1,3% 0,9% 0,0% 0,0%Pesticides 4,52E-03 0,166 8,38E-03 9,89E-03 0,185 0,8% 0,3% 0,0% 0,0%Seeding material - rapeseed 6,46E-04 0,034 0,024 1,72E-03 0,060 0,1% 0,1% 0,0% 0,0%Field N2O emissions 0,00E+00 0,00E+00 12,575 0,00E+00 12,575 0,0% 0,0% 24,3% 0,0%Direct Land Use Change - 0,00E+00 - - 0,00E+00 - 0,0% - -Total Feedstock production 0,159 9,914 17,989 0,427 28,331 28,4% 19,2% 34,8% 0,8%
Allocation burden of this and previous steps to main product Raw rapeseed 100,0%Allocation burden of this and previous steps to by-product Raw rapeseed 0,0%Allocation burden of this step to Biodiesel at end-of-chain 58,6%
Feedstock dryingDiesel 2,13E-04 0,016 0,00E+00 0,00E+00 0,016 0,0% 0,0% 0,0% 0,0%Electricity (EU-mix, LV) 8,51E-03 0,377 5,05E-03 0,021 0,403 1,5% 0,7% 0,0% 0,0%Total Feedstock drying 8,72E-03 0,393 5,05E-03 0,021 0,419 1,6% 0,8% 0,0% 0,0%
Allocation burden of this and previous steps to main product Dried rapeseed 100,0%Allocation burden of this and previous steps to by-product Dried rapeseed 0,0%Allocation burden of this step to Biodiesel at end-of-chain 58,6%
Transport feedstockTruck for dry product (Diesel) 2,29E-03 0,173 0,00E+00 2,43E-04 0,173 0,4% 0,3% 0,0% 0,0%Total Transport feedstock 2,29E-03 0,173 0,00E+00 2,43E-04 0,173 0,4% 0,3% 0,0% 0,0%
Return to overview results Return to input
Public workshop AthensMay 26, 2011
Slide 9
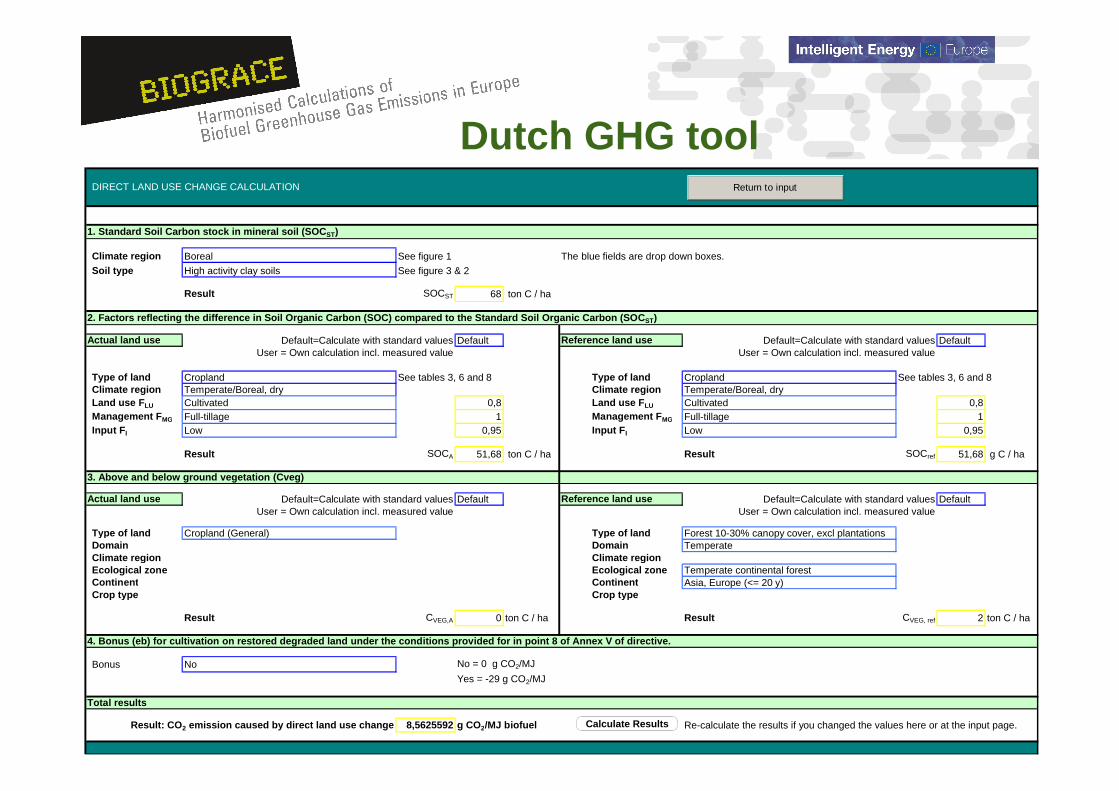
Dutch GHG toolDIRECT LAND USE CHANGE CALCULATION
1. Standard Soil Carbon stock in mineral soil (SOCST)
Climate region Boreal See figure 1 The blue fields are drop down boxes.
Soil type High activity clay soils See figure 3 & 2
Result SOCST 68 ton C / ha
2. Factors reflecting the difference in Soil Organic Carbon (SOC) compared to the Standard Soil Organic Carbon (SOCST)
Actual land use Default=Calculate with standard values Default Reference land use Default=Calculate with standard values DefaultUser = Own calculation incl. measured value User = Own calculation incl. measured value
Type of land Cropland See tables 3, 6 and 8 Type of land Cropland See tables 3, 6 and 8Climate region Temperate/Boreal, dry Climate region Temperate/Boreal, dryLand use FLU Cultivated 0,8 Land use FLU Cultivated 0,8Management FMG Full-tillage 1 Management FMG Full-tillage 1Input FI Low 0,95 Input FI Low 0,95
Result SOCA 51,68 ton C / ha Result SOCref 51,68 g C / ha
3. Above and below ground vegetation (Cveg)
Actual land use Default=Calculate with standard values Default Reference land use Default=Calculate with standard values DefaultUser = Own calculation incl. measured value User = Own calculation incl. measured value
Type of land Cropland (General) Type of land Forest 10-30% canopy cover, excl plantationsDomain Domain TemperateClimate region Climate regionEcological zone Ecological zone Temperate continental forestContinent Continent Asia, Europe (<= 20 y)Crop type Crop type
Result CVEG,A 0 ton C / ha Result CVEG, ref 2 ton C / ha
4. Bonus (eb) for cultivation on restored degraded land under the conditions provided for in point 8 of Annex V of directive.
Bonus No No = 0 g CO2/MJ
Yes = -29 g CO2/MJ
Total results
Result: CO2 emission caused by direct land use change 8,5625592 g CO2/MJ biofuel Re-calculate the results if you changed the values here or at the input page.
Return to input
Calculate Results

Public workshop AthensMay 26, 2011
Slide 10
Dutch tool - SummaryContents
o Excel-based toolo Tool is rather similar to BioGrace Excel sheets, but
It is more user-friendly: no calculations details, results in graphs
DLUC calculations are user-friendly
o The software programming makes it less flexible More difficult to modify pathways or build new ones
Statuso Tool is available on-line via
www.senternovem.nl/gave_english/ghg_toolo All 22 chains (BioGrace) are includedo Updates follow updates of BioGrace Excel sheet

Public workshop AthensMay 26, 2011
Slide 11
Contents
1. Introduction
2. Dutch GHG calculator
3. German GHG calculator
4. Spanish GHG calculator
5. UK GHG calculator
6. Conclusions

Public workshop AthensMay 26, 2011
Slide 12
German tool - general information
Backgroundo No public tool has been available so far in Germany
o Aim: to facilitate stakeholders calculating actual values(combination of actual values and disaggregated default values)
The German GHG calculatoro is made by IFEU, contracted by BMU
o should be finalised mid 2011
o should be in line with BLE Guidance
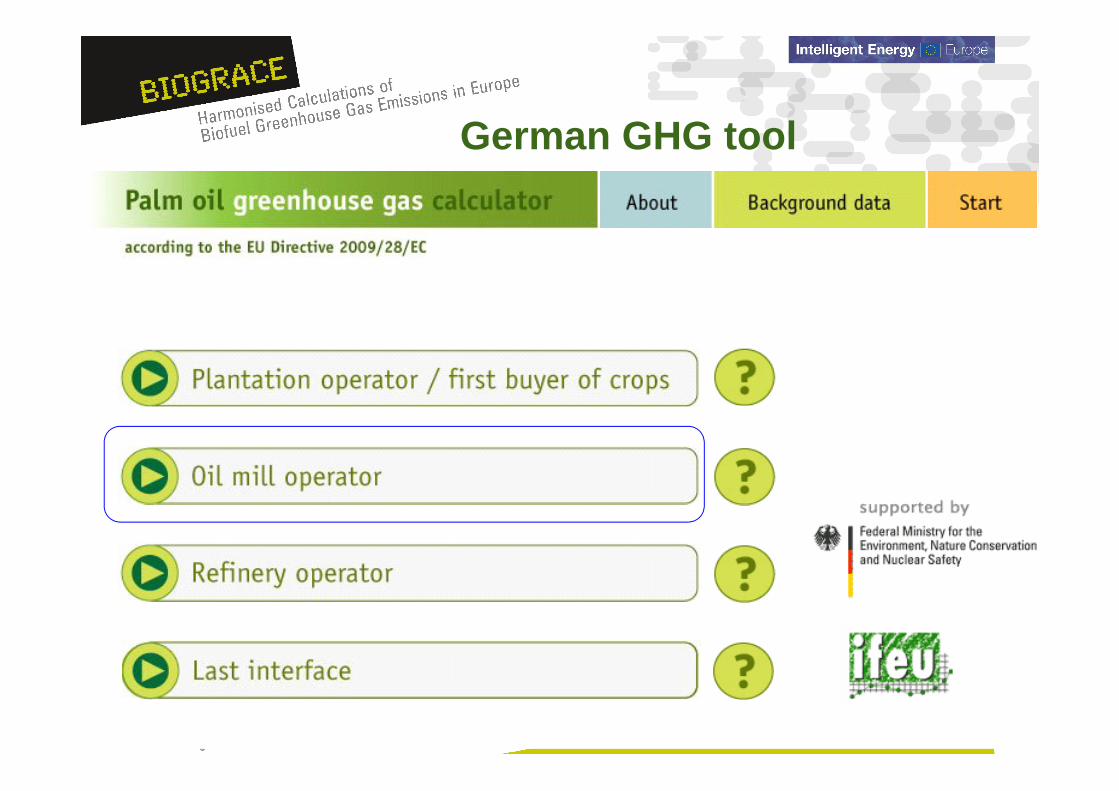
o is strongly linked to economic operators: 1 sheet dedicated for cultivators, mill operators, refinery operators, etc.

Public workshop AthensMay 26, 2011
Slide 13
German GHG tool

Public workshop AthensMay 26, 2011
Slide 14
German GHG tool

Public workshop AthensMay 26, 2011
Slide 15
German GHG tool
I. Market actor: Plantation operator, first purchaserStep-by-step manual for calculating GHG emissions of oil palm cultivation
The CO2 emissions from
oil palm cultivation amount to
123,7 g CO2eq/kg FFB
Size of the FFB batch
0 kg
Enter your operating data in step 1-4 to calculate CO2 emissions of your FFB batch
STEP 1 - GHG emissions from land use changes
Do FFB s originate from plantation areas that were plantation areas before january 1st 2008?
yes Emissions from land use change are zero.
Click here to calculate emissions in sheet "land use changes"
Which emissions arose from land use changes?
0 kg CO2eq per ha per year
STEP 2 - GHG emissions from cultivation

Public workshop AthensMay 26, 2011
Slide 16
German GHG tool
I. Market actor: Plantation operator, first purchaser
Step-by-step manual for calculating CO2 emissions from land use change
#WAARDE!
kg CO2eq per ha per year
Specify the parameters in step 1-4 to calculate CO2 emissions from land use changes
STEP 1 - Carbon stock in above and below ground biomass on 01.01.2008 (CSR)
Please select:
Vegetation type Forest (10-30% canopy cover)
Domain
Climate region
Ecological zone
Continent
Above and below ground carbon on 01.01.08 Please make a valid selection t C/ha
STEP 2 - Soil carbon on 01.01.2008 (CSR)
Climate region Tropical, moist
Please select:
Soil type Low activity clay soils
S tandard soil carbon t C/ha 47
The European Commission has published guidelines for the calculation of land carbon stocks (notified under document C (2010) 3751). These consist of tables with values for carbon stock in soils, above and below ground biomass for different soil types, climate regions, vegetation types etc.

Public workshop AthensMay 26, 2011
Slide 17
I. Market actor: Plantation operator, first purchaserStep-by-step manual for calculating GHG emissions of oil palm cultivation
The CO2 emissions from
oil palm cultivation amount to
123,7 g CO2eq/kg FFB
Size of the FFB batch
0 kg
Enter your operating data in step 1-4 to calculate CO2 emissions of your FFB batch
STEP 1 - GHG emissions from land use changes
Do FFB s originate from plantation areas that were plantation areas before january 1st 2008?
yes Emissions from land use change are zero.
Click here to calculate emissions in sheet "land use changes"
Which emissions arose from land use changes?
0 kg CO2eq per ha per year
STEP 2 - GHG emissions from cultivation
STEP 2 - GHG emissions from cultivation
What is your FFB yield per ha per year?
19.000 kg FFBs per ha per year
What is the size of your cultivation area?
28 ha
How much fertilizer did you apply per ha per year? Please enter the amount for each of the following fertilizers.
N-fertiliser 128,0 kg N per ha per year
P2O5-fertiliser 144,0 kg P2O5 per ha per year
K2O-fertiliser 200,0 kg K2O per ha per year
German GHG tool

Public workshop AthensMay 26, 2011
Slide 18
German GHG tool
Public workshop AthensMay 26, 2011
Slide 19
German GHG tool
Public workshop AthensMay 26, 2011
Slide 20
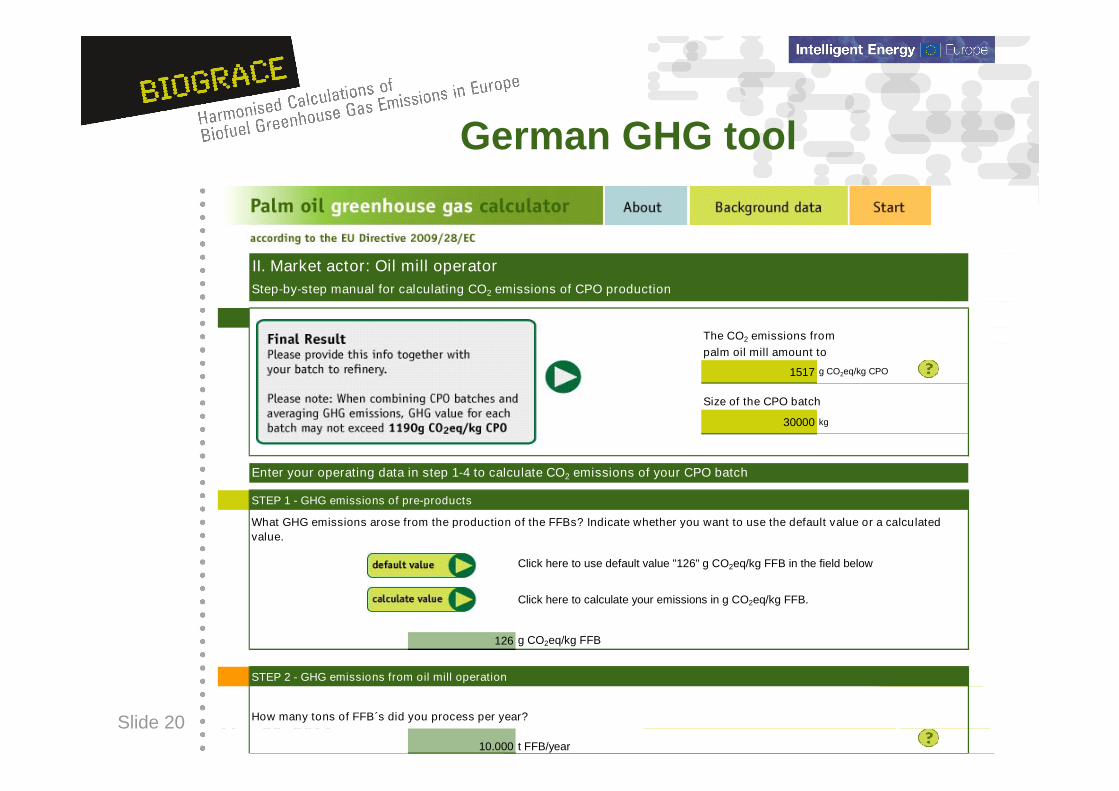
German GHG tool
II. Market actor: Oil mill operatorStep-by-step manual for calculating CO2 emissions of CPO production
The CO2 emissions from
palm oil mill amount to
1517 g CO2eq/kg CPO
Size of the CPO batch
30000 kg
Enter your operating data in step 1-4 to calculate CO2 emissions of your CPO batch
STEP 1 - GHG emissions of pre-products
Click here to use default value "126" g CO2eq/kg FFB in the field below
126 g CO2eq/kg FFB
STEP 2 - GHG emissions from oil mill operation
How many tons of FFB s did you process per year?
10.000 t FFB/year
What GHG emissions arose from the production of the FFBs? Indicate whether you want to use the default value or a calculated value.
Click here to calculate your emissions in g CO2eq/kg FFB.
Public workshop AthensMay 26, 2011
Slide 21
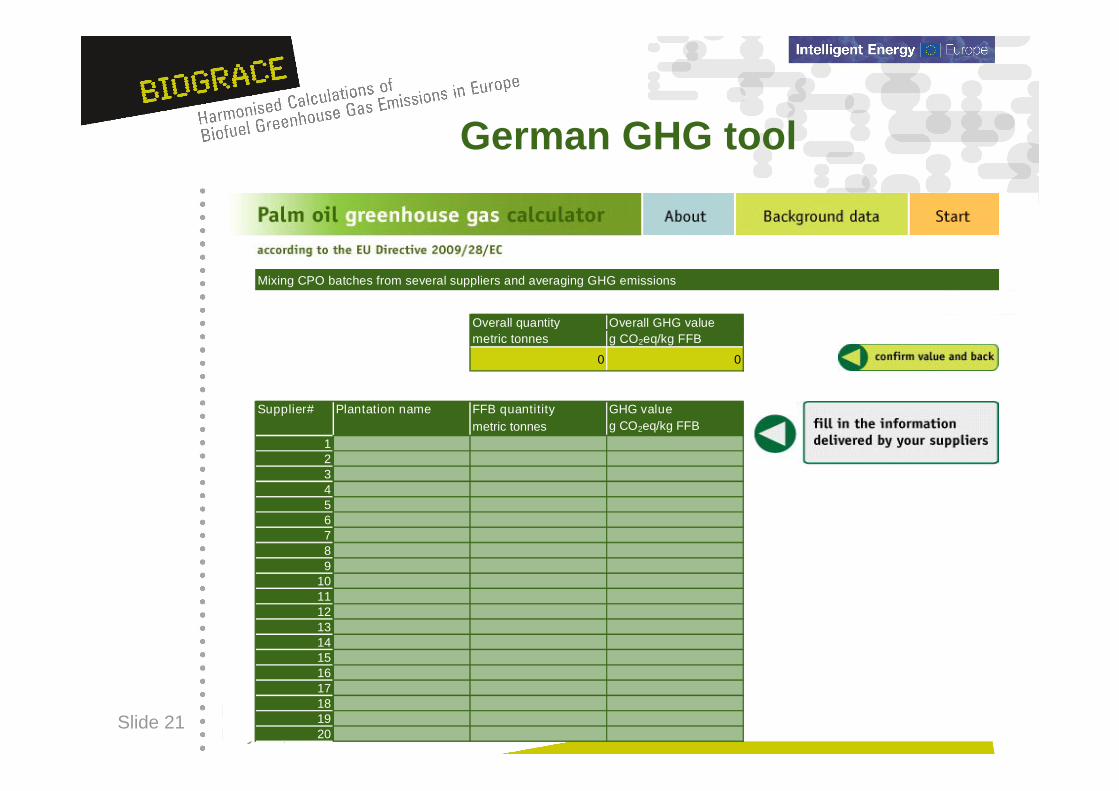
German GHG tool
Mixing CPO batches from several suppliers and averaging GHG emissions
Overall quantity Overall GHG valuemetric tonnes g CO2eq/kg FFB
0 0
Supplier# Plantation name FFB quantitity GHG valuemetric tonnes g CO2eq/kg FFB
123456789
1011121314151617181920

Public workshop AthensMay 26, 2011
Slide 22
German GHG tool
Public workshop AthensMay 26, 2011
Slide 23
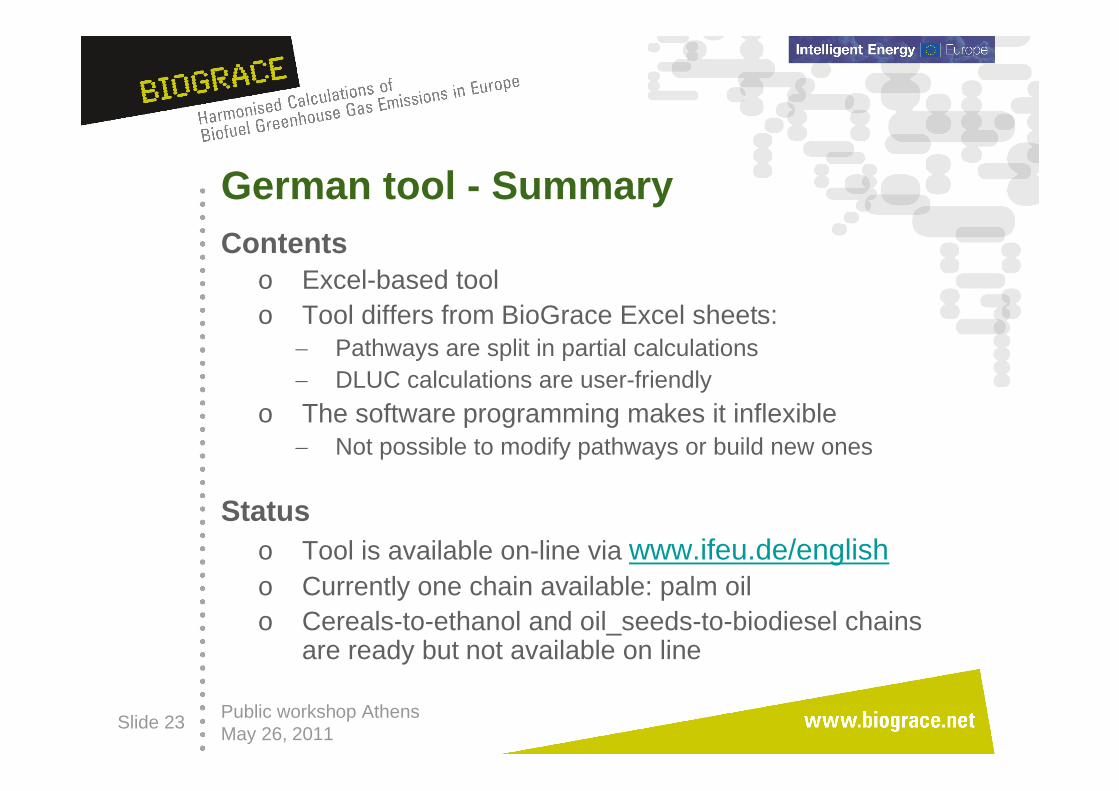
German tool - SummaryContents
o Excel-based toolo Tool differs from BioGrace Excel sheets:
Pathways are split in partial calculations DLUC calculations are user-friendly
o The software programming makes it inflexible Not possible to modify pathways or build new ones
Statuso Tool is available on-line via www.ifeu.de/englisho Currently one chain available: palm oilo Cereals-to-ethanol and oil_seeds-to-biodiesel chains
are ready but not available on line

Public workshop AthensMay 26, 2011
Slide 24
Contents
1. Introduction
2. Dutch GHG calculator
3. German GHG calculator
4. Spanish GHG calculator
5. UK GHG calculator
6. Conclusions

Public workshop AthensMay 26, 2011
Slide 25
Spanish tool - general information
Backgroundo No public tool has been available so far in Spain
o Aim: to provide stakeholders (especially farmers and small biofuel companies) with a tool to calculate the GHG emissions required by the RED
The Spanish GHG calculatoro being developed by CIEMAT, contracted by IDAE
o focuses on agricultural stages
o uses data from NUTS study (actual values or averages calculated for smaller geographical areas)

Public workshop AthensMay 26, 2011
Slide 26
Spanish GHG tool

Public workshop AthensMay 26, 2011
Slide 27
Biofuel and raw material selection screen
Spanish GHG tool

Public workshop AthensMay 26, 2011
Slide 28
Agricultural county selection screen
Spanish GHG tool
NUTs2 NUTs3 NUTs4

Public workshop AthensMay 26, 2011
Slide 29
Fertilization data input screen
Spanish GHG tool
Typical values for the agricultural county selected are uploaded
Values to reproduce the default values of the RED are uploaded

Public workshop AthensMay 26, 2011
Slide 30
Transformation data input screen
Spanish GHG tool
Values to reproduce the default values of the RED are uploaded

Public workshop AthensMay 26, 2011
Slide 31
Results screen
Spanish GHG tool

Public workshop AthensMay 26, 2011
Slide 32
Spanish tool - SummaryContents
o Tool build in Javao Focus on Spain:
Contains data on agricultural inputs and yields for 6 crops used to produce biofuels in Spain at the level of agrarian county (NUTs4)
Any farmer in the country can select his/her county and crop and the corresponding values regarding agricultural inputs and yields will appear in the tool.
o For processing and transport: RED default valueso Standard values from BioGrace
Statuso Biodiesel from rapeseed, rapeseed HVO and ethanol from
wheat CHP chains readyo Final version expected mid-2011

Public workshop AthensMay 26, 2011
Slide 33
Contents
1. Introduction
2. Dutch GHG calculator
3. German GHG calculator
4. Spanish GHG calculator
5. UK GHG calculator
6. Conclusions

Public workshop AthensMay 26, 2011
Slide 34
UK tool - general informationBackground
o UK GHG calculator was developed under RTFO reporting scheme
o Calculator existing since 2008, regularly updatedo Aim is to facilitate stakeholders calculating actual values
under RTFO reporting
The UK GHG calculatoro was made and is regularly updated by consultant E4Tech,
contracted by RFAo has recently been made “RED-proof”o strongly linked to RTFO reporting schemeo provides more “standard values” as compared to BioGrace

Public workshop AthensMay 26, 2011
Slide 35
UK GHG tool

Public workshop AthensMay 26, 2011
Slide 36
UK GHG tool
Public workshop AthensMay 26, 2011
Slide 37
UK GHG tool
Public workshop AthensMay 26, 2011
Slide 38
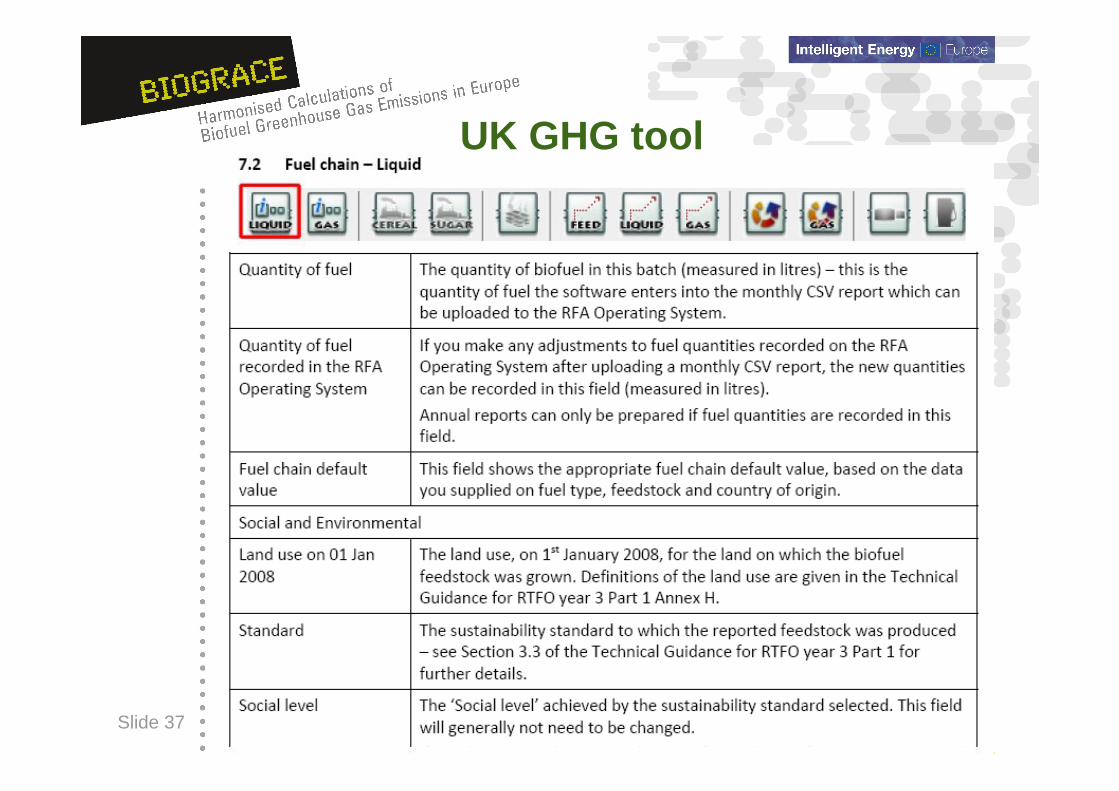
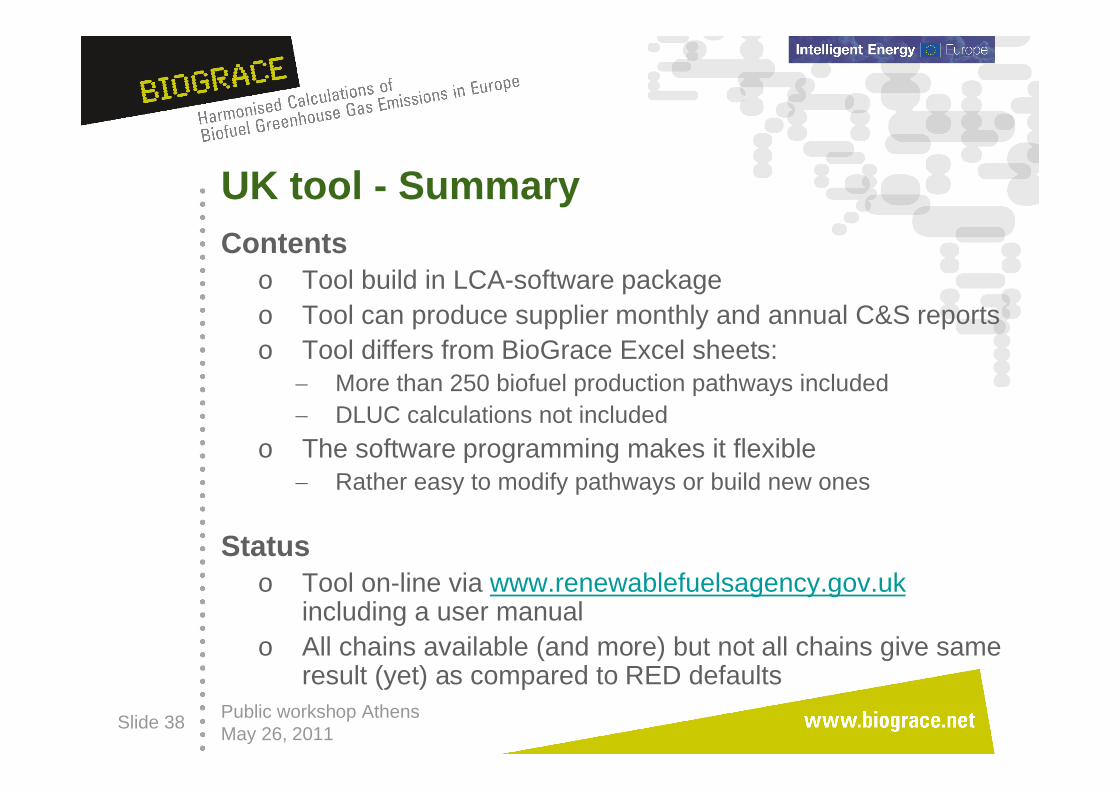
UK tool - SummaryContents
o Tool build in LCA-software packageo Tool can produce supplier monthly and annual C&S reportso Tool differs from BioGrace Excel sheets:
More than 250 biofuel production pathways included DLUC calculations not included
o The software programming makes it flexible Rather easy to modify pathways or build new ones
Statuso Tool on-line via www.renewablefuelsagency.gov.uk
including a user manualo All chains available (and more) but not all chains give same
result (yet) as compared to RED defaults

Public workshop AthensMay 26, 2011
Slide 39
Contents
1. Introduction
2. Dutch GHG calculator
3. German GHG calculator
4. Spanish GHG calculator
5. UK GHG calculator
6. Comparison of results
7. Conclusions

Public workshop AthensMay 26, 2011
Slide 40
Comparison of results
Public workshop AthensMay 26, 2011
Slide 41
Contents
1. Introduction
2. Dutch GHG calculator
3. German GHG calculator
4. Spanish GHG calculator
5. UK GHG calculator
6. Comparison of results
7. Conclusions

Public workshop AthensMay 26, 2011
Slide 42
ConclusionsSeveral GHG calculators available
o Two exist since 2008, three (including BioGrace Excel sheets) are newly developed
o Project BioGrace will ensure that all calculators will givethe same result
o Some allow to modify or build new pathways, others don’t
National GHG calculators have different aimso Some are more focussed on national data or national
reporting, others are more international orientedo Focus on different aspects
Agricultural stages (Spain) Supply of data through the chain of custody (Germany)

Public workshop AthensMay 26, 2011
Slide 43
Thank you for your attention
The sole responsibility for the content of this presentation lies with the authors. It does not necessarily reflectthe opinion of the European Union.
The European Commission is not responsible for any use that may be made of the information contained therein.

Yolanda LechónCIEMATPublic workshop AthensMay 26, 2011
The BioGrace Excel GHG calculation tool - Basics

Slide 2
Contents
1. Steps from cultivation to filling station
2. Use individual input numbers
3. Navigate through tool
4. Standard values
5. Define own standard values
6. Inconsistent use of global warming potentials
Demonstratedin Excel Spreadsheet vs.4
Public workshop AthensMay 26, 2011

Slide 3
Steps from cultivation to filling station
eee: combined with ep
esca: methodology still under discussion
eu: maybe relevant for biogas pathways
eec, ep, etd = basic „disaggregated default values“
el: following the decision 2010/335/EU
eeccs/ccr: technology not in place
Public workshop AthensMay 26, 2011

Slide 4
Steps from cultivation to filling station
Cultivation
Processing step 1
Transport raw material
Direct land-use change
Processing step 2
Transport intermediate product
Filling station
Transport biofuel
el
eec
eep
eep
etd
etd
etd
etd
eep
etd
el
eec
esca
Public workshop AthensMay 26, 2011

Slide 5
Steps from cultivation to filling stationThe aggregation on top
Public workshop AthensMay 26, 2011
Slide 6
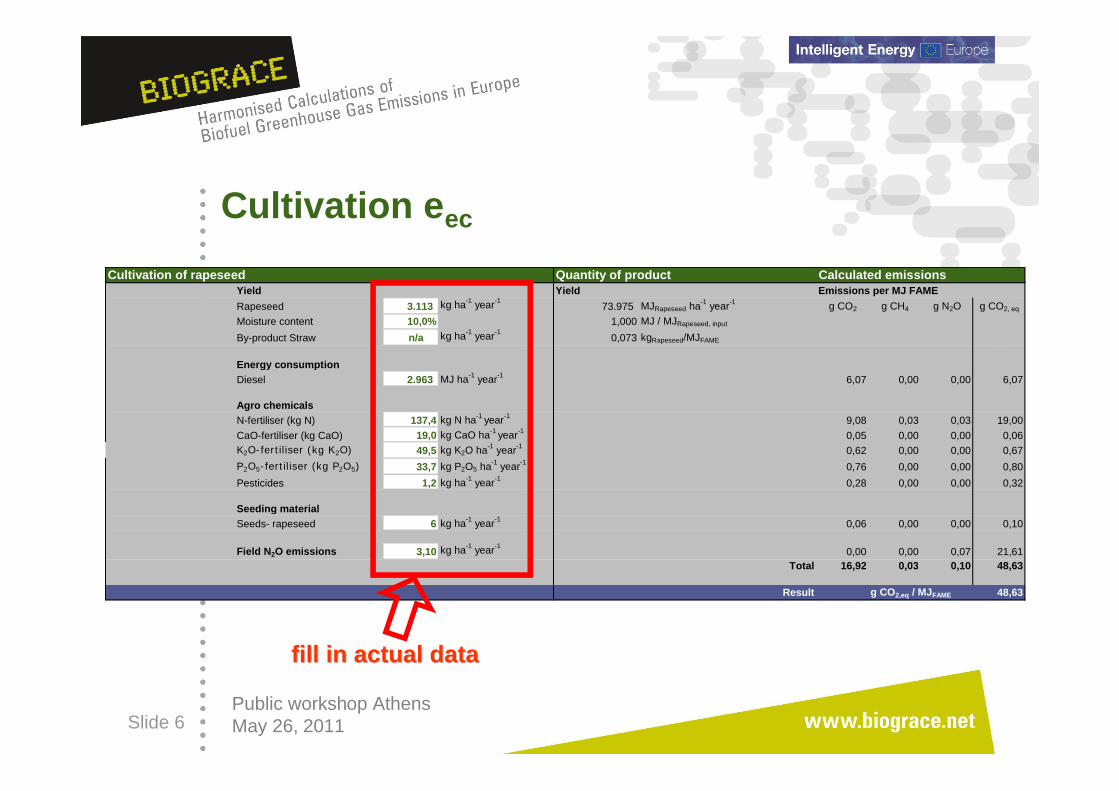
Cultivation eec
Cultivation of rapeseed Quantity of product Calculated emissionsYield Yield Emissions per MJ FAME
Rapeseed 3.113 kg ha-1 year-173.975 MJRapeseed ha-1 year-1 g CO2 g CH4 g N2O g CO2, eq
Moisture content 10,0% 1,000 MJ / MJRapeseed, input
By-product Straw n/a kg ha-1 year-10,073 kgRapeseed/MJFAME
Energy consumption
Diesel 2.963 MJ ha-1 year-1 6,07 0,00 0,00 6,07
Agro chemicals
N-fertiliser (kg N) 137,4 kg N ha-1 year-1 9,08 0,03 0,03 19,00
CaO-fertiliser (kg CaO) 19,0 kg CaO ha-1 year-10,05 0,00 0,00 0,06
K2O-fertiliser (kg K2O) 49,5 kg K2O ha-1 year-1 0,62 0,00 0,00 0,67
P2O5-fertiliser (kg P2O5) 33,7 kg P2O5 ha-1 year-1 0,76 0,00 0,00 0,80
Pesticides 1,2 kg ha-1 year-1 0,28 0,00 0,00 0,32
Seeding material
Seeds- rapeseed 6 kg ha-1 year-1 0,06 0,00 0,00 0,10
Field N2O emissions 3,10 kg ha-1 year-10,00 0,00 0,07 21,61
Total 16,92 0,03 0,10 48,63
Result g CO2,eq / MJFAME 48,63
fill in actual datafill in actual data
Public workshop AthensMay 26, 2011
Slide 7
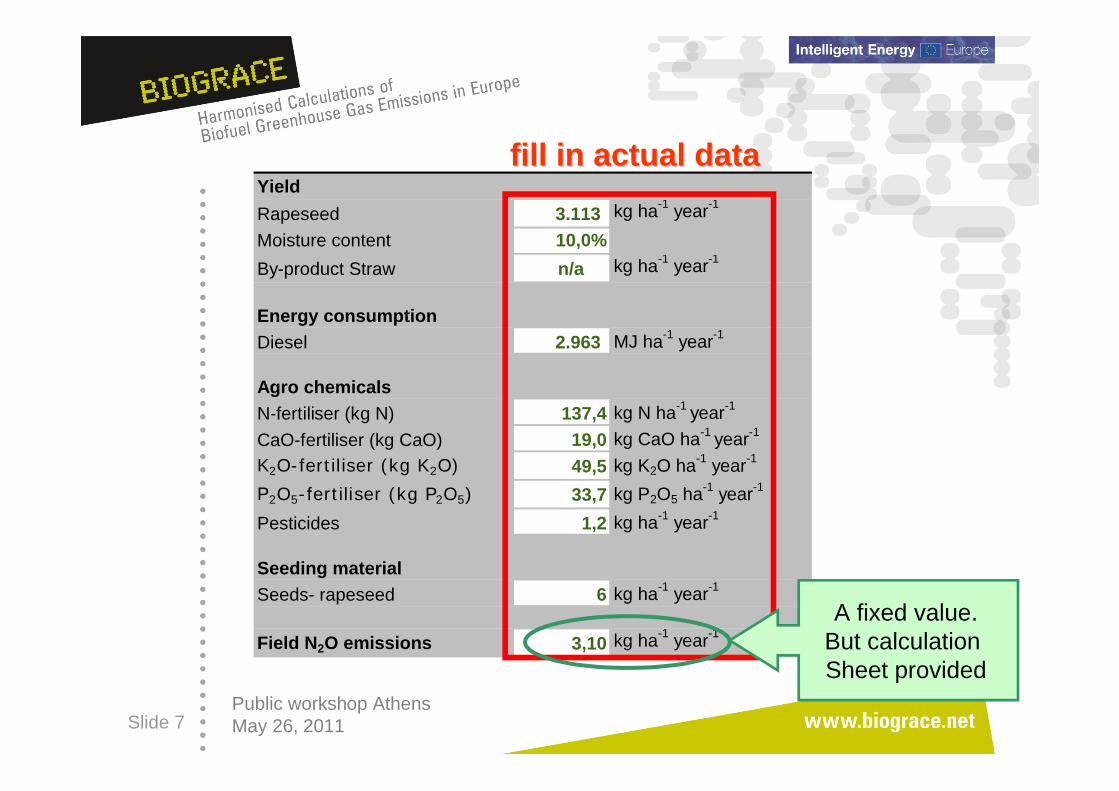
Yield
Rapeseed 3.113 kg ha-1 year-1
Moisture content 10,0%
By-product Straw n/a kg ha-1 year-1
Energy consumption
Diesel 2.963 MJ ha-1 year-1
Agro chemicals
N-fertiliser (kg N) 137,4 kg N ha-1 year-1
CaO-fertiliser (kg CaO) 19,0 kg CaO ha-1 year-1
K2O-fertiliser (kg K2O) 49,5 kg K2O ha-1 year-1
P2O5-fertiliser (kg P2O5) 33,7 kg P2O5 ha-1 year-1
Pesticides 1,2 kg ha-1 year-1
Seeding material
Seeds- rapeseed 6 kg ha-1 year-1
Field N2O emissions 3,10 kg ha-1 year-1
fill in actual datafill in actual data
A fixed value.But calculation Sheet provided
Public workshop AthensMay 26, 2011

Slide 8
Cultivation eec
Cultivation of rapeseed Quantity of product Calculated emissionsYield Yield Emissions per MJ FAME
Rapeseed 3.113 kg ha-1 year-173.975 MJRapeseed ha-1 year-1 g CO2 g CH4 g N2O g CO2, eq
Moisture content 10,0% 1,000 MJ / MJRapeseed, input
By-product Straw n/a kg ha-1 year-10,073 kgRapeseed/MJFAME
Energy consumption
Diesel 2.963 MJ ha-1 year-1 6,07 0,00 0,00 6,07
Agro chemicals
N-fertiliser (kg N) 137,4 kg N ha-1 year-1 9,08 0,03 0,03 19,00
CaO-fertiliser (kg CaO) 19,0 kg CaO ha-1 year-10,05 0,00 0,00 0,06
K2O-fertiliser (kg K2O) 49,5 kg K2O ha-1 year-1 0,62 0,00 0,00 0,67
P2O5-fertiliser (kg P2O5) 33,7 kg P2O5 ha-1 year-1 0,76 0,00 0,00 0,80
Pesticides 1,2 kg ha-1 year-1 0,28 0,00 0,00 0,32
Seeding material
Seeds- rapeseed 6 kg ha-1 year-1 0,06 0,00 0,00 0,10
Field N2O emissions 3,10 kg ha-1 year-10,00 0,00 0,07 21,61
Total 16,92 0,03 0,10 48,63
Result g CO2,eq / MJFAME 48,63
fill in actual datafill in actual data
conversion factors conversion factors yield relatedyield related
Public workshop AthensMay 26, 2011

Slide 9
Quantity of productYield
73.975 MJRapeseed ha-1 year-1
1,000 MJ / MJRapeseed, input
0,073 kgRapeseed/MJFAME
yield related conversion factorsyield related conversion factorsraw material per final raw material per final biofuelbiofuel
values as a function of input values values as a function of input values and/or of the chain and/or of the chain
Public workshop AthensMay 26, 2011

Slide 10
Cultivation eec
Cultivation of rapeseed Quantity of product Calculated emissionsYield Yield Emissions per MJ FAME
Rapeseed 3.113 kg ha-1 year-173.975 MJRapeseed ha-1 year-1 g CO2 g CH4 g N2O g CO2, eq
Moisture content 10,0% 1,000 MJ / MJRapeseed, input
By-product Straw n/a kg ha-1 year-10,073 kgRapeseed/MJFAME
Energy consumption
Diesel 2.963 MJ ha-1 year-1 6,07 0,00 0,00 6,07
Agro chemicals
N-fertiliser (kg N) 137,4 kg N ha-1 year-1 9,08 0,03 0,03 19,00
CaO-fertiliser (kg CaO) 19,0 kg CaO ha-1 year-10,05 0,00 0,00 0,06
K2O-fertiliser (kg K2O) 49,5 kg K2O ha-1 year-1 0,62 0,00 0,00 0,67
P2O5-fertiliser (kg P2O5) 33,7 kg P2O5 ha-1 year-1 0,76 0,00 0,00 0,80
Pesticides 1,2 kg ha-1 year-1 0,28 0,00 0,00 0,32
Seeding material
Seeds- rapeseed 6 kg ha-1 year-1 0,06 0,00 0,00 0,10
Field N2O emissions 3,10 kg ha-1 year-10,00 0,00 0,07 21,61
Total 16,92 0,03 0,10 48,63
Result g CO2,eq / MJFAME 48,63
fill in actual datafill in actual data
conversion factors conversion factors yield relatedyield related
multiplying multiplying input valuesinput valueswith with ““standard valuesstandard values““
Public workshop AthensMay 26, 2011

Slide 11
Cultivation eecInfoper kg rapeseed per ha, year
g CO2, eq kg CO2, eq
83,40 259,7
261,19 813,2
0,79 2,5
9,20 28,6
10,96 34,1
4,36 13,6
1,41 4,4
296,99 924,7668,31 2080,7
g CO2, eq
6,07
19,00
0,06
0,67
0,80
0,32
0,10
21,6148,63
48,63
Results related to Results related to raw material or acreageraw material or acreage
Cultivation of rapeseedYield
Rapeseed
Moisture content
By-product Straw
Energy consumption
Diesel
Agro chemicals
N-fertiliser (kg N)
CaO-fertiliser (kg CaO)
K2O-fertiliser (kg K2O)
P2O5-fertiliser (kg P2O5)
Pesticides
Seeding material
Seeds- rapeseed
Field N2O emissions
Public workshop AthensMay 26, 2011

Slide 12
Processing ep
Extraction of oil Quantity of product Calculated emissionsYield Emissions per MJ FAME
Crude vegetable oil 0,6125 MJOil / MJRapeseed 44.861 MJOil ha-1 year-1 g CO2 g CH4 g N2O g CO2, eq
By-product Rapeseed cake 0,3875 MJRapeseed cake / MJRapeseed 0,606 MJ / MJRapeseed, input
0,029 kgOil / MJFAME
Energy consumptionElectricity EU mix MV 0,0118 MJ / MJOil 1,47 0,00 0,00 1,58
Steam (from NG boiler) 0,0557 MJ / MJOil
NG Boiler Emissions from NG boilerCH4 and N2O emissions from NG boiler 0,00 0,00 0,00 0,02
Natural gas input / MJ steam 1,111 MJ / MJSteam
Natural gas (4000 km, EU Mix qualilty)0,062 MJ / MJOil 4,08 0,01 0,00 4,41
Electricity input / MJ steam 0,020 MJ / MJSteam
Electricity EU mix MV 0,001 MJ / MJOil 0,14 0,00 0,00 0,15
Chemicalsn-Hexane 0,0043 MJ / MJOil 0,36 0,00 0,00 0,37
Total 6,06 0,02 0,00 6,53
Result g CO2,eq / MJFAME 6,53
Step 1, oil extraction
fill in actual datafill in actual data
Public workshop AthensMay 26, 2011
conversion factors conversion factors yield relatedyield related

Slide 13
Transport etd of FAME
fill in actual datafill in actual data
Transport of FAME to and from depot Quantity of product Calculated emissionsFAME 1,000 MJFAME / MJFAME 42790,9 MJFAME ha-1 year-1 Emissions per MJ FAME
0,578 MJ / MJRapeseed, input g CO2 g CH4 g N2O g CO2, eq
Transport perTruck for liquids (Diesel) 300 km 0,0047 ton km / MJRapeseed, input 0,71 0,00 0,00 0,71
Fuel Diesel
Energy cons. depotElectricity EU mix LV 0,00084 MJ / MJFAME 0,10 0,00 0,00 0,11
Result g CO2,eq / MJFAME 0,8225
Filling station Quantity of productYield 1,000 MJFAME / MJFAME 42790,9 MJFAME ha-1 year-1 Emissions per MJ FAME
0,578 MJ / MJRapeseed, input g CO2 g CH4 g N2O g CO2, eq
Energy consumptionElectricity EU mix LV 0,0034 MJ / MJFAME 0,41 0,00 0,00 0,44
Result g CO2,eq / MJFAME 0,44
Public workshop AthensMay 26, 2011
conversion factors conversion factors yield relatedyield related

Slide 14
Include new process steps
Set up completely new biofuel production chains
Afternoon session “Practical calculation”
Navigate through tool
Standard values
Define own standard values
Inconsistent use of global warming potentials
BioGrace GHG calculations – version 3 - Public.xlsPublic workshop AthensMay 26, 2011

The BioGrace Excel GHG calculation tool – Other parts

Slide 16
Contents
1. Introduction
2. Land use change
3. Improved agricultural management
4. CO2 storage or replacement
5. New items in Public version 4- User manual- Calculation rules- Track changes
6. New item for Public version 5:- Calculation of N2O field emissions
7. BioGrace as a voluntary scheme
Public workshop AthensMay 26, 2011

Slide 17
Introduction
esca: Carbon storage from improvedagricultural management
el: Land use change,following the decision 2010/335/EU
eeccs/ccr: CO2 capture, storage orreplacement
Public workshop AthensMay 26, 2011

Slide 18
Introduction
Cultivation
Processing step 1
Transport raw material
Direct land-use change, Improved man. practices
Processing step 2
Transport intermediate product
Filling station
Transport biofuel
el
Storage, replacement
esca
eccs
eccr
Public workshop AthensMay 26, 2011
Slide 19
Contents
1. Introduction
2. Land use change
3. Improved agricultural management
4. CO2 storage or replacement
5. New items in Public version 4- User manual- Calculation rules- Track changes
6. New item for Public version 5:- Calculation of N2O field emissions
7. BioGrace as a voluntary scheme
Public workshop AthensMay 26, 2011

Slide 20
Land Use Change
General principles :
1. Annex V of the RED gives the general calculation guidelines (part C, point 7):
2. Calculation rules are explained in the following the decision2010/335/EU: Commission Decision of 10 June 2010 on guidelines for the calculation of land use carbon stocks for the purpose of Annex V of Directive 2009/28/EC.
This communication gives:- Consistent representation of land carbon stocks
- Calculation rules
- Default data for applying this formula (tables)
Public workshop AthensMay 26, 2011
Slide 21
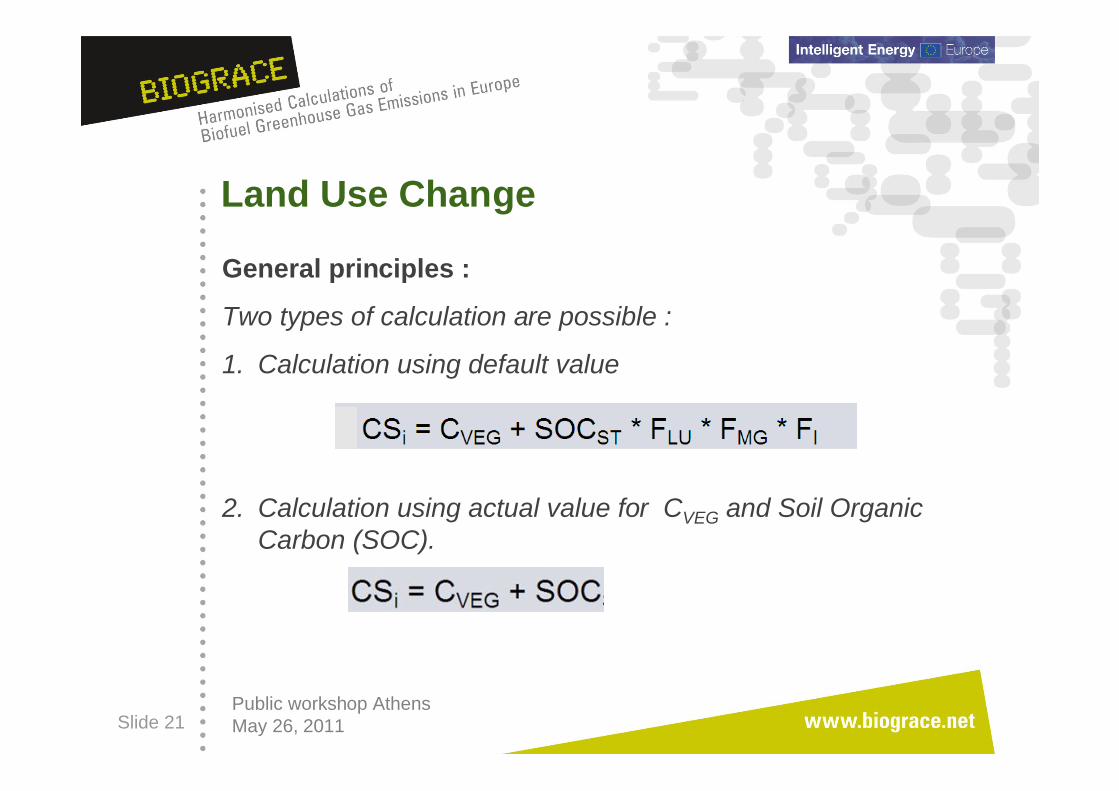
Land Use Change
General principles :
Two types of calculation are possible :
1. Calculation using default value
2. Calculation using actual value for CVEG and Soil Organic Carbon (SOC).
Public workshop AthensMay 26, 2011

Slide 22
Step 1 : declare LUC in your pathway
Text appear
Public workshop AthensMay 26, 2011

Slide 23
Step 2 : Go to the LUC excel sheet and read through this
sheet. Get the Commission Decision 2010/335/EU with you.
Step 3 : Choose the type of calculation : default or actual and fill the appropriate white cells.
Public workshop AthensMay 26, 2011

Slide 24
Step 4 (default calculation) : use EC decision to fill out data
Public workshop AthensMay 26, 2011
Slide 25
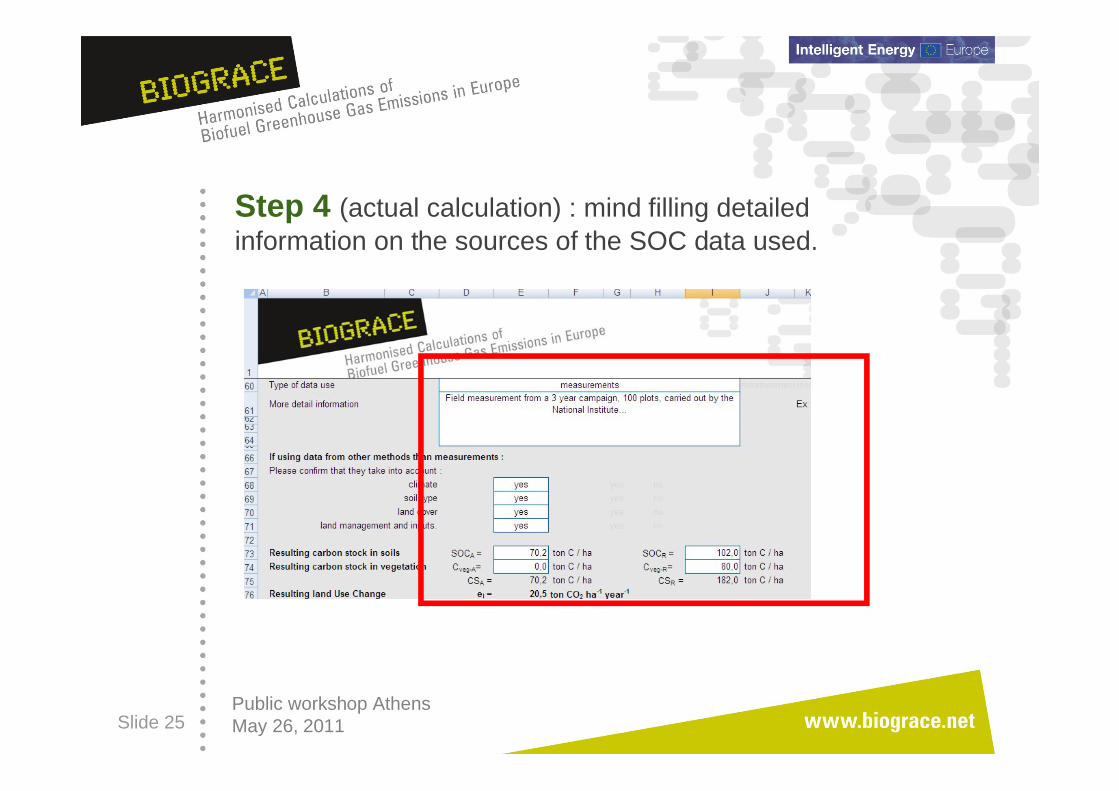
Step 4 (actual calculation) : mind filling detailed information on the sources of the SOC data used.
Public workshop AthensMay 26, 2011
Slide 26
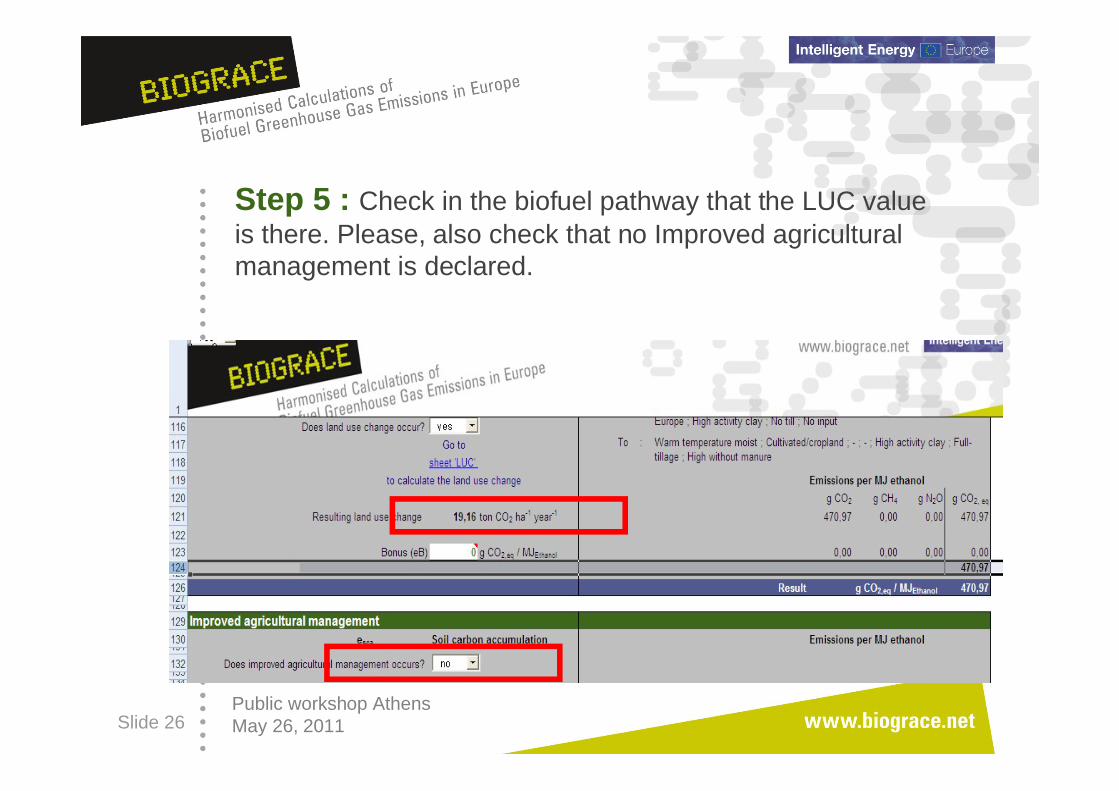
Step 5 : Check in the biofuel pathway that the LUC value is there. Please, also check that no Improved agricultural management is declared.
Public workshop AthensMay 26, 2011
Slide 27
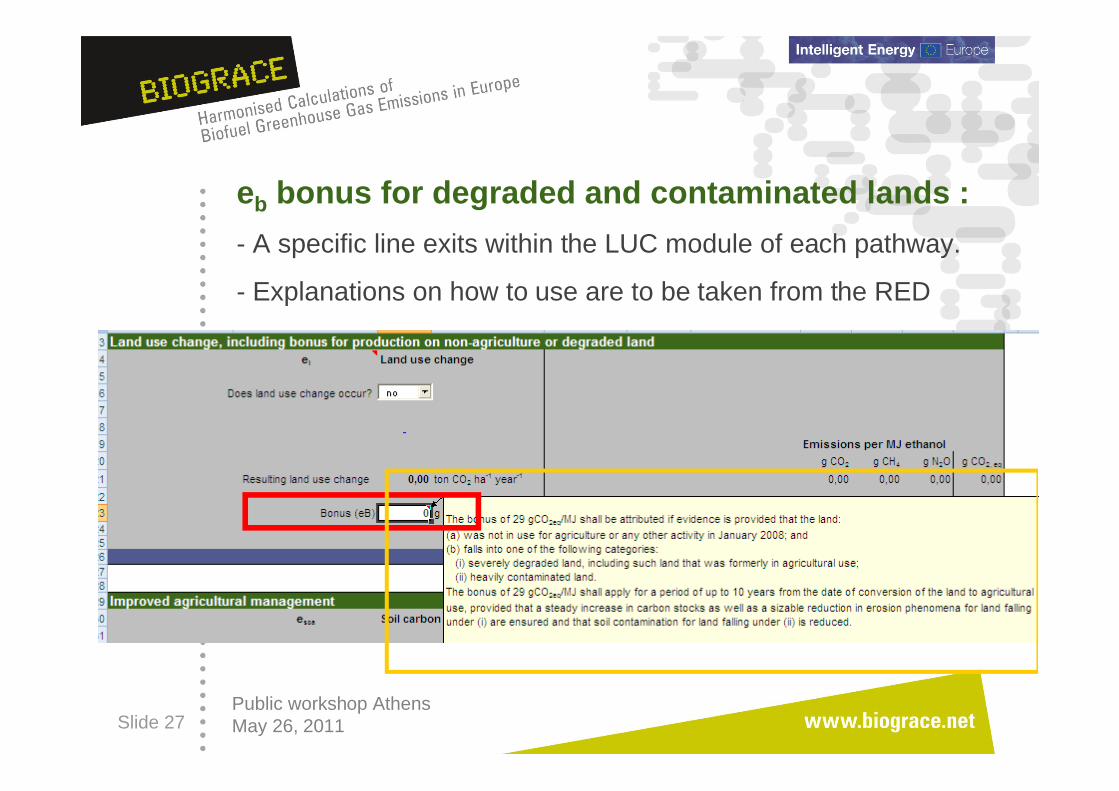
eb bonus for degraded and contaminated lands :
- A specific line exits within the LUC module of each pathway.
- Explanations on how to use are to be taken from the RED
Public workshop AthensMay 26, 2011

Slide 28
Contents
1. Introduction
2. Land use change
3. Improved agricultural management
4. CO2 storage or replacement
5. New items in Public version 4- User manual- Calculation rules- Track changes
6. New item for Public version 5:- Calculation of N2O field emissions
7. BioGrace as a voluntary scheme
Public workshop AthensMay 26, 2011

Slide 29
Improved Agricultural Management
1. Annex V of the RED has a specific term for carbon stock accumulation thanks to improved practices, but does not give much more explanations on how to calculate it
2. Calculation rules from the Commission Decision can serve as guidelines for making first level calculations
3. As for LUC, actual data can be used to assess them
4. In the BioGrace tool, an esca sheet exist to carry out the calculation
5. This sheet is build on the same frame than the LUC sheet
6. Don’t declare esca when LUC are already declared (double counting)
Public workshop AthensMay 26, 2011

Slide 30
Contents
1. Introduction
2. Land use change
3. Improved agricultural management
4. CO2 storage or replacement
5. New items in Public version 4- User manual- Calculation rules- Track changes
6. New item for Public version 5:- Calculation of N2O field emissions
7. BioGrace as a voluntary scheme
Public workshop AthensMay 26, 2011

Slide 31
CO2 storage or replacementGeneral principles :
1. Annex V of the RED has specific terms for carbon stock accumulation thanks to improved practices, but does not give much more explanations
2. In the BioGrace tool, two modules exist to declare these technological solutions. The value in g CO2/MJ has to be added
3. Please, keep track of your calculations for verification requirements
Public workshop AthensMay 26, 2011

Slide 32
CO2 storage or replacementGeneral principles :
4. Replacement : “Emission saving from carbon capture and replacement, eccr, shall be limited to emissions avoided through the capture of CO2 of which the carbon originates from biomass and which is used to replace fossil-derived CO2 used in commercial products and services.”
5. Storage : “Emission saving from carbon capture and geological storage eccs, that have not already been accounted for in ep, shall be limited to emissions avoided through the capture and sequestration of emitted CO2 directly related to the extraction, transport, processing and distribution of fuel.”
Public workshop AthensMay 26, 2011

Slide 33
Contents
1. Introduction
2. Land use change
3. Improved agricultural management
4. CO2 storage or replacement
5. New items in Public version 4- User manual- Calculation rules- Track changes
6. New item for Public version 5:- Calculation of N2O field emissions
7. BioGrace as a voluntary scheme
Public workshop AthensMay 26, 2011
Slide 34
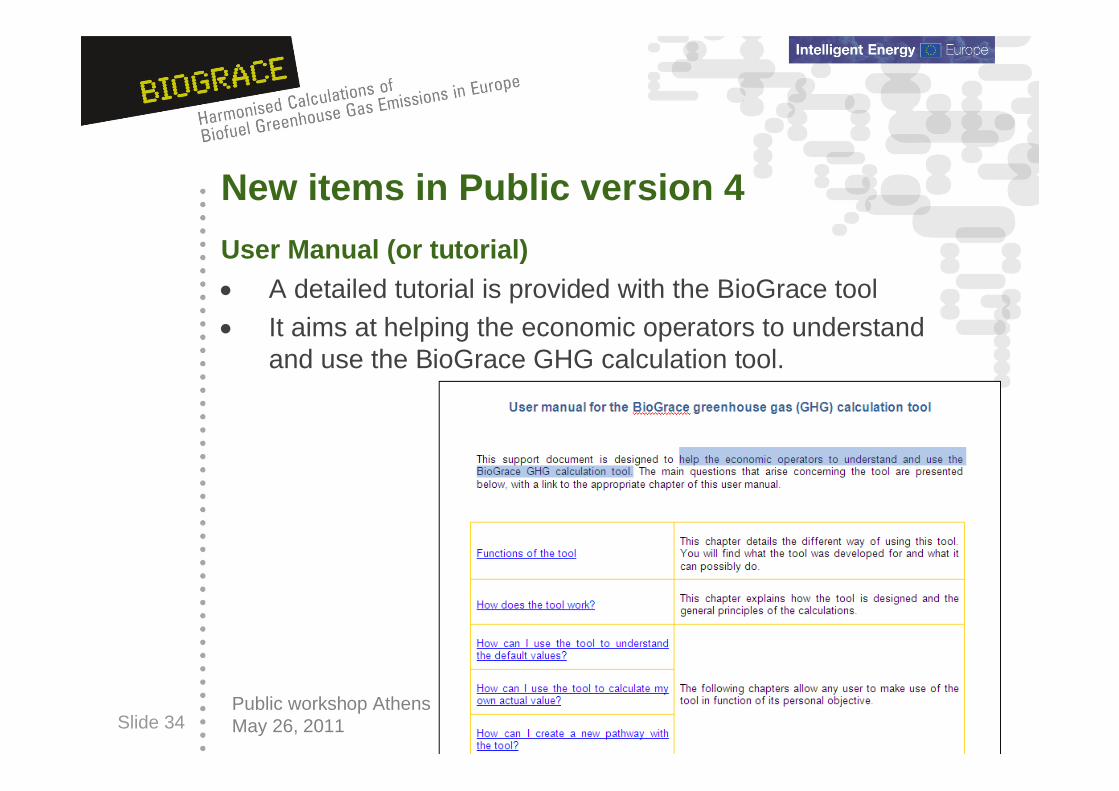
New items in Public version 4
User Manual (or tutorial)
A detailed tutorial is provided with the BioGrace tool
It aims at helping the economic operators to understand and use the BioGrace GHG calculation tool.
Public workshop AthensMay 26, 2011

Slide 35
New items in Public version 4Calculation rules Making actual calculations under the RED/FQD requires rules
Which input data and standard values are allowed? Cut-off criterion Combination of actual and disaggregated values
Many of these rules not yet defined More detailed than methodology in RED Annex V.C Some rules given in communications, several are not covered
BioGrace has made a document “calculation rules” Published as a separate document Linked to GHG Excel tool
European Commission will be evaluating rules… … when assessing a voluntary certification scheme after a
request for recognition
Public workshop AthensMay 26, 2011

Public workshop HeidelbergApril 14, 2011
Slide 36
Production of Ethanol from Sugarbeet (steam from NG boiler) Version 4 - Public
Overview Results
All results in Non- allocated Allocation Allocated Total Default values Allocation factors Emission reductiong CO 2,eq / MJ Ethanol results factor results RED Annex V.D Ethanol plant Fossil fuel reference (petrol)
Cultivation eec 11,5 12 71,3% to ethanol 83,8 g CO2,eq/MJ
Cultivation of sugarbeet 16,16 71,3% 11,52 11,54 28,7% to Sugar beet pulp GHG emission reductionProcessing ep 26,4 26 52%
Ethanol plant 37,03 71,3% 26,40 26,42Transport etd 2,3 2
Transport of sugarbeet 1,11 71,3% 0,79 0,84 Calculations in this Excel sheet……Transport of ethanol 1,10 100% 1,10 1,10Filling station 0,44 100% 0,44 0,44Land use change el 0,0 71,3% 0,0 0,0 0
esca + eccr + eccs 0,0 100% 0,0 0,0 0
Totals 55,8 40,3 40 As explained in "About" under "Inconsistent use of GWP's"
When using this GHG calculation tool, the BioGrace calculation rules must be respected.
Calculation per phase The rules are included in the zip file in which you downloaded this tool. The rules are also available at www.BioGrace.net
Cultivation of sugarbeet Quantity of product Calculated emissions InfoYield Yield Emissions per MJ ethanol per kg sugarbeet per ha, year
Sugar beet 68.860 kg ha-1 year-1280.605 MJSugar beet ha-1 year-1 g CO2 g CH4 g N2O g CO2, eq g CO2, eq kg CO2, eq
Moisture content 75,0% 1,000 MJ / MJSugarbeet, input
0,451 kgSugarbeet/MJethanol
follow JEC calculations by using GWP values 25 for CH4 and 298 for N2O
strictly follow the methodology as given in Directives 2009/28/EC and 2009/30/EC
Track changes: OFF
New items in Public version 4
Track changes
One of the calculation rules:
“Use ‘track changes’ for verification purposes”
Production of Ethanol from Sugarbeet (steam from NG boiler) Version 4 - Public
Overview Results
All results in Non- allocated Allocation Allocated Total Default values Allocation factors Emission reductiong CO 2,eq / MJ Ethanol results factor results RED Annex V.D Ethanol plant Fossil fuel reference (petrol)
Cultivation eec 11,5 12 71,3% to ethanol 83,8 g CO2,eq/MJ
Cultivation of sugarbeet 16,16 71,3% 11,52 11,54 28,7% to Sugar beet pulp GHG emission reductionProcessing ep 26,4 26 52%
Ethanol plant 37,03 71,3% 26,40 26,42Transport etd 2,3 2
Transport of sugarbeet 1,11 71,3% 0,79 0,84 Calculations in this Excel sheet……Transport of ethanol 1,10 100% 1,10 1,10Filling station 0,44 100% 0,44 0,44Land use change el 0,0 71,3% 0,0 0,0 0
esca + eccr + eccs 0,0 100% 0,0 0,0 0
Totals 55,8 40,3 40 As explained in "About" under "Inconsistent use of GWP's"
When using this GHG calculation tool, the BioGrace calculation rules must be respected.
Calculation per phase The rules are included in the zip file in which you downloaded this tool. The rules are also available at www.BioGrace.net
Cultivation of sugarbeet Quantity of product Calculated emissions InfoYield Yield Emissions per MJ ethanol per kg sugarbeet per ha, year
Sugar beet 68.860 kg ha-1 year-1280.605 MJSugar beet ha-1 year-1 g CO2 g CH4 g N2O g CO2, eq g CO2, eq kg CO2, eq
Moisture content 75,0% 1,000 MJ / MJSugarbeet, input
0,451 kgSugarbeet/MJethanol
follow JEC calculations by using GWP values 25 for CH4 and 298 for N2O
strictly follow the methodology as given in Directives 2009/28/EC and 2009/30/EC
Track changes: ON
Production of Ethanol from Sugarbeet (steam from NG boiler) Version 4 - Public
Overview Results
All results in Non- allocated Allocation Allocated Total Default values Allocation factors Emission reductiong CO 2,eq / MJ Ethanol results factor results RED Annex V.D Ethanol plant Fossil fuel reference (petrol)
Cultivation eec 11,3 12 71,3% to ethanol 83,8 g CO2,eq/MJ
Cultivation of sugarbeet 15,89 71,3% 11,33 11,54 28,7% to Sugar beet pulp GHG emission reductionProcessing ep 26,4 26 52%
Ethanol plant 37,03 71,3% 26,40 26,42Transport etd 2,3 2
Transport of sugarbeet 1,11 71,3% 0,79 0,84 Calculations in this Excel sheet……Transport of ethanol 1,10 100% 1,10 1,10Filling station 0,44 100% 0,44 0,44Land use change el 0,0 71,3% 0,0 0,0 0
esca + eccr + eccs 0,0 100% 0,0 0,0 0
Totals 55,6 40,1 40 As explained in "About" under "Inconsistent use of GWP's"
When using this GHG calculation tool, the BioGrace calculation rules must be respected.
Calculation per phase The rules are included in the zip file in which you downloaded this tool. The rules are also available at www.BioGrace.net
Cultivation of sugarbeet Quantity of product Calculated emissions InfoYield Yield Emissions per MJ ethanol per kg sugarbeet per ha, year
Sugar beet 70.000 kg ha-1 year-1285.250 MJSugar beet ha-1 year-1 g CO2 g CH4 g N2O g CO2, eq g CO2, eq kg CO2, eq
Moisture content 75,0% 1,000 MJ / MJSugarbeet, input
0,451 kgSugarbeet/MJethanol
follow JEC calculations by using GWP values 25 for CH4 and 298 for N2O
strictly follow the methodology as given in Directives 2009/28/EC and 2009/30/EC
Track changes: ON

Slide 37
Contents
1. Introduction
2. Land use change
3. Improved agricultural management
4. CO2 storage or replacement
5. New items in Public version 4- User manual- Calculation rules- Track changes
6. New item for Public version 4:- Calculation of N2O field emissions
7. BioGrace as a voluntary scheme
Public workshop AthensMay 26, 2011

Slide 38
New item in Public version 5
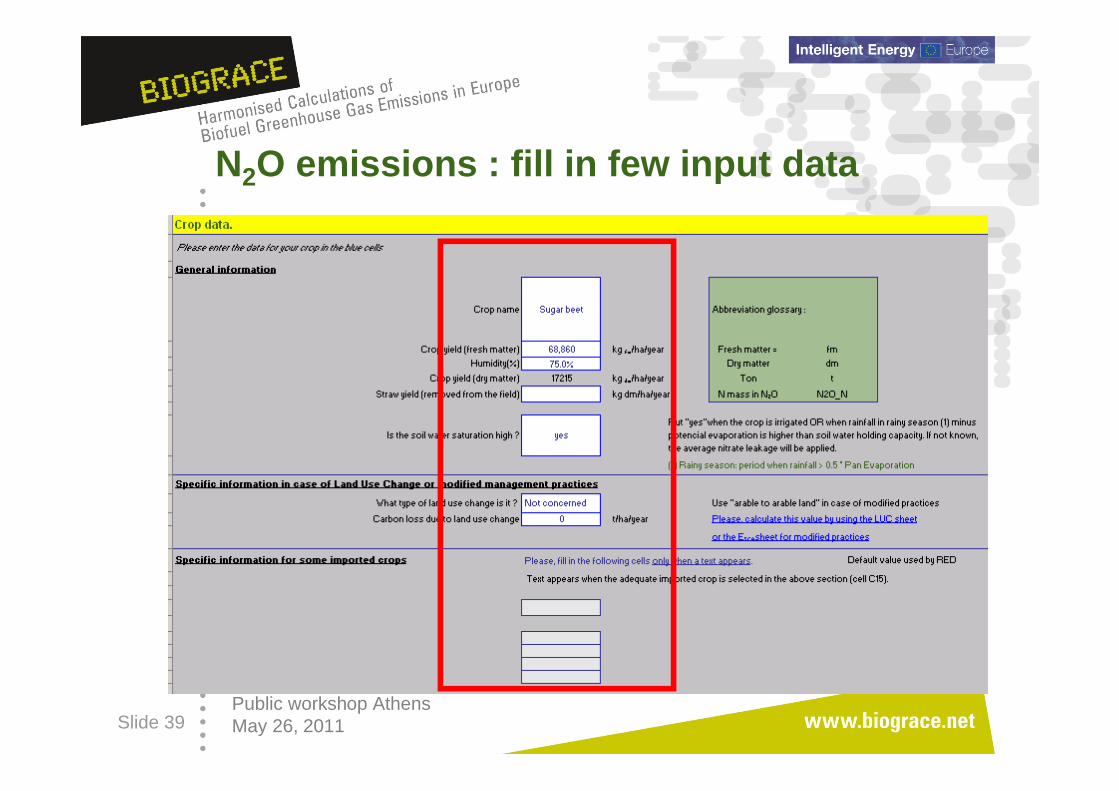
Calculation of N2O field emissions
1. A major contributors to GHG emissions of most of the pathways
2. Default value : N2O emissions calculated from a model (DNDC, average EU), except some pathways (IPCC Tier 1 for soybeans, palm trees, sugarcane)
3. For new pathways or when modifying the cultivation data from an existing pathways : BioGrace recommends to use IPCC Tier 1 estimation for this emission
4. BioGrace tool aims to provide an Excel sheet for making N2O calculations
Public workshop AthensMay 26, 2011
Slide 39
N2O emissions : fill in few input data
Public workshop AthensMay 26, 2011

Slide 40
N2O direct emissions
Public workshop AthensMay 26, 2011

Slide 41
N2O indirect emissions :
Total N2O emissions :

Slide 42
Contents
1. Introduction
2. Land use change
3. Improved agricultural management
4. CO2 storage or replacement
5. New items in Public version 4- User manual- Calculation rules- Track changes
6. New item for Public version 5:- Calculation of N2O field emissions
7. BioGrace as a voluntary scheme
Public workshop AthensMay 26, 2011

Slide 43
BioGrace as a voluntary schemeObservations: Current voluntary cert. schemes do not include GHG tool
ISSC, REDcert, NTA8080, RSPO, RTRS, Bonsucro (BSI)
European Commission only allows use of GHG tool if it is recognised as a voluntary cert. scheme
To our knowledge no GHG tools have been send to Commission for recognition Some schemes will be send in, eg. National GHG tools Information on actual developments is scarce
GHG tool can be used as “add-on” to existing schemes
BioGrace has submitted the GHG tool to EC for recognition as avoluntary scheme
Public workshop AthensMay 26, 2011
Slide 44
BioGrace as a voluntary scheme
BioGrace voluntary scheme consist of a zip file with1. BioGrace Excel GHG tool2. BioGrace calculation rules3. BioGrace user manual
BioGrace scheme does not contain requirements on audits and mass balance BioGrace has to be used together with another scheme
Time schedule
Sent in BioGrace tool to EC for recognition April
Recognition period lasts … ?
Public workshop AthensMay 26, 2011

Slide 45
Thank you for your attention
The sole responsibility for the content of this presentation lies with the authors. It does not necessarily reflectthe opinion of the European Union.
The European Commission is not responsible for any use that may be made of the information contained therein.
Public workshop AthensMay 26, 2011