Embed Size (px)
Citation preview
Introduction to theIntroduction to theWorld Industry ServiceWorld Industry Service
April 2009
Copyright © 2009 IHS Global Insight. All Rights Reserved. 2
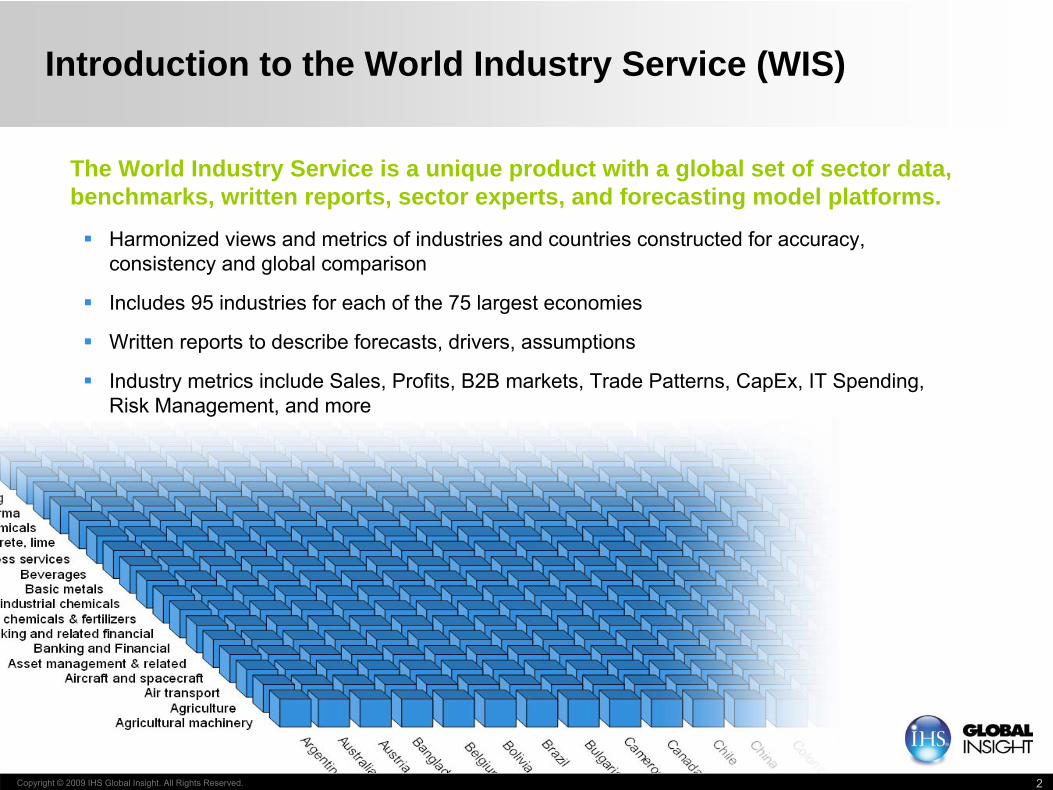
Introduction to the World Industry Service (WIS)
The World Industry Service is a unique product with a global set of sector data, benchmarks, written reports, sector experts, and forecasting model platforms.
Harmonized views and metrics of industries and countries constructed for accuracy, consistency and global comparison
Includes 95 industries for each of the 75 largest economies
Written reports to describe forecasts, drivers, assumptions
Industry metrics include Sales, Profits, B2B markets, Trade Patterns, CapEx, IT Spending, Risk Management, and more
Copyright © 2009 IHS Global Insight. All Rights Reserved. 3
Introduction to the World Industry Service (WIS)
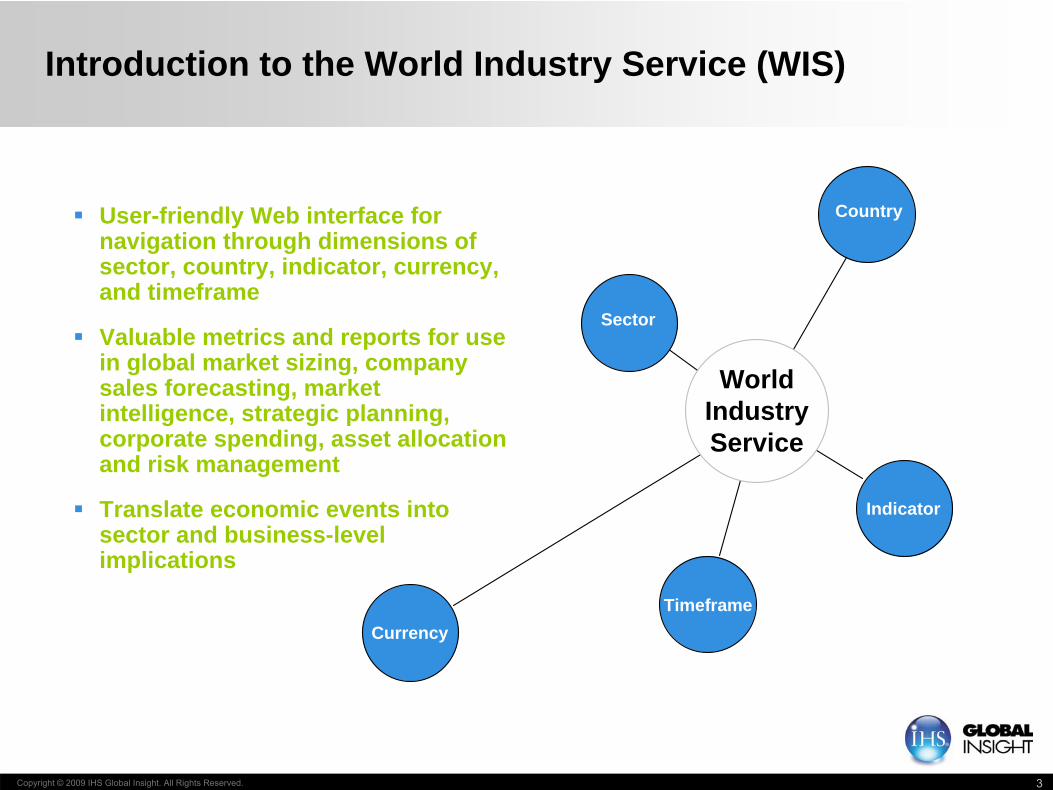
User-friendly Web interface for navigation through dimensions of sector, country, indicator, currency, and timeframe
Valuable metrics and reports for use in global market sizing, company sales forecasting, market intelligence, strategic planning, corporate spending, asset allocation and risk management
Translate economic events into sector and business-level implications
Sector
Country
Indicator
CurrencyTimeframe
World Industry Service
Copyright © 2009 IHS Global Insight. All Rights Reserved. 4
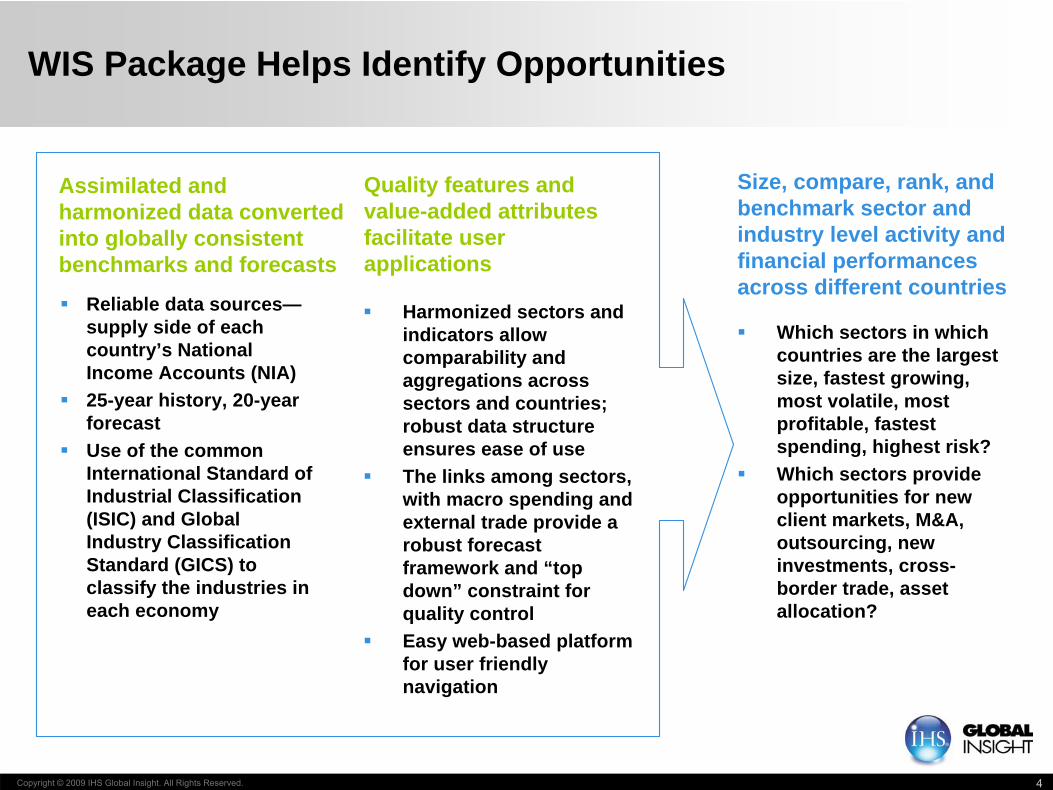
Assimilated and harmonized data converted into globally consistent benchmarks and forecasts
Reliable data sources—supply side of each country’s National Income Accounts (NIA)
25-year history, 20-year forecast
Use of the common International Standard of Industrial Classification (ISIC) and Global Industry Classification Standard (GICS) to classify the industries in each economy
WIS Package Helps Identify Opportunities
Size, compare, rank, and benchmark sector and industry level activity and financial performances across different countries
Which sectors in which countries are the largest size, fastest growing, most volatile, most profitable, fastest spending, highest risk?
Which sectors provide opportunities for new client markets, M&A, outsourcing, new investments, cross-border trade, asset allocation?
Quality features and value-added attributes facilitate user applications
Harmonized sectors and indicators allow comparability and aggregations across sectors and countries; robust data structure ensures ease of use
The links among sectors, with macro spending and external trade provide a robust forecast framework and “top down” constraint for quality control
Easy web-based platform for user friendly navigation
Copyright © 2009 IHS Global Insight. All Rights Reserved. 5
WIS Includes Analysts and Analysis Behind the Numbers
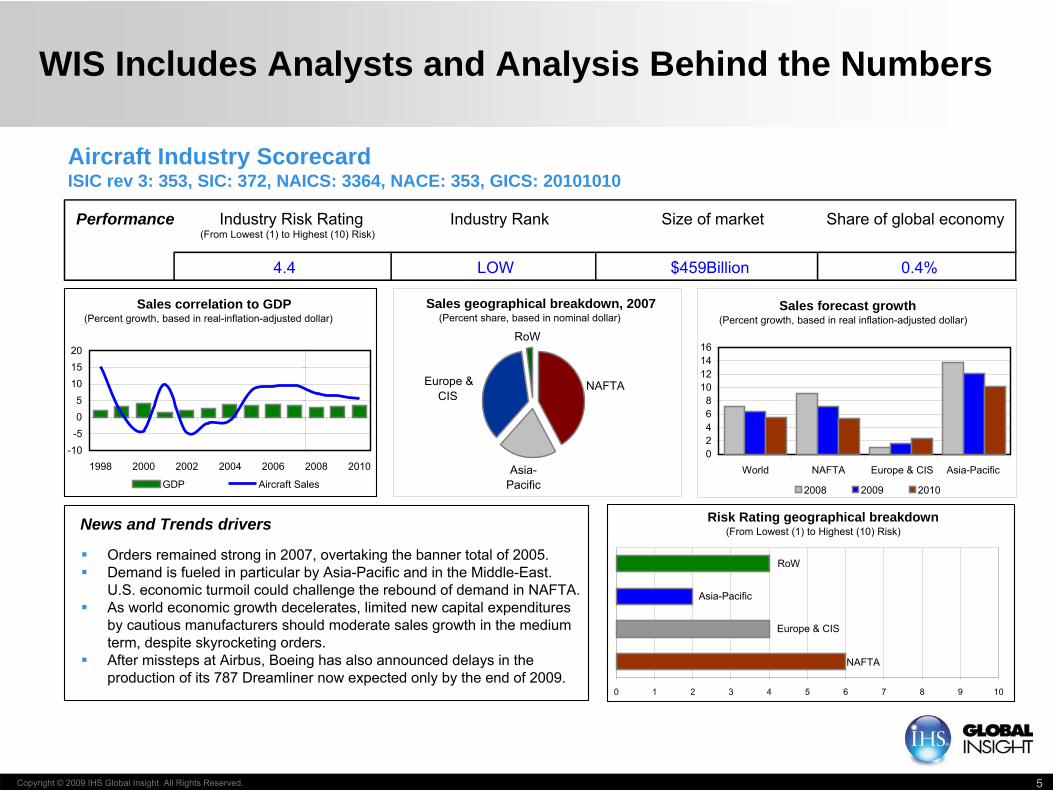
News and Trends drivers
Orders remained strong in 2007, overtaking the banner total of 2005. Demand is fueled in particular by Asia-Pacific and in the Middle-East.
U.S. economic turmoil could challenge the rebound of demand in NAFTA. As world economic growth decelerates, limited new capital expenditures
by cautious manufacturers should moderate sales growth in the medium term, despite skyrocketing orders.
After missteps at Airbus, Boeing has also announced delays in the production of its 787 Dreamliner now expected only by the end of 2009.
Performance
LOW 0.4%
Industry RankIndustry Risk Rating(From Lowest (1) to Highest (10) Risk)
4.4
Share of global economySize of market
$459Billion
02468
10121416
World NAFTA Europe & CIS Asia-Pacific
2008 2009 2010
Sales forecast growth(Percent growth, based in real inflation-adjusted dollar)
NAFTA
Asia-Pacific
RoW
Europe & CIS
Sales geographical breakdown, 2007(Percent share, based in nominal dollar)
0 1 2 3 4 5 6 7 8 9 10
NAFTA
Asia-Pacific
Europe & CIS
RoW
Risk Rating geographical breakdown(From Lowest (1) to Highest (10) Risk)
Sales correlation to GDP(Percent growth, based in real-inflation-adjusted dollar)
-10-505
101520
1998 2000 2002 2004 2006 2008 2010
GDP Aircraft Sales
Aircraft Industry ScorecardISIC rev 3: 353, SIC: 372, NAICS: 3364, NACE: 353, GICS: 20101010
Copyright © 2009 IHS Global Insight. All Rights Reserved. 6
Who Are WIS Clients?
Sales forecasting Procurement Market intelligence Strategic planning Public sector revenues Credit risk research Investment management
Decision Makers, Planners, and Analysts
Copyright © 2009 IHS Global Insight. All Rights Reserved. 7
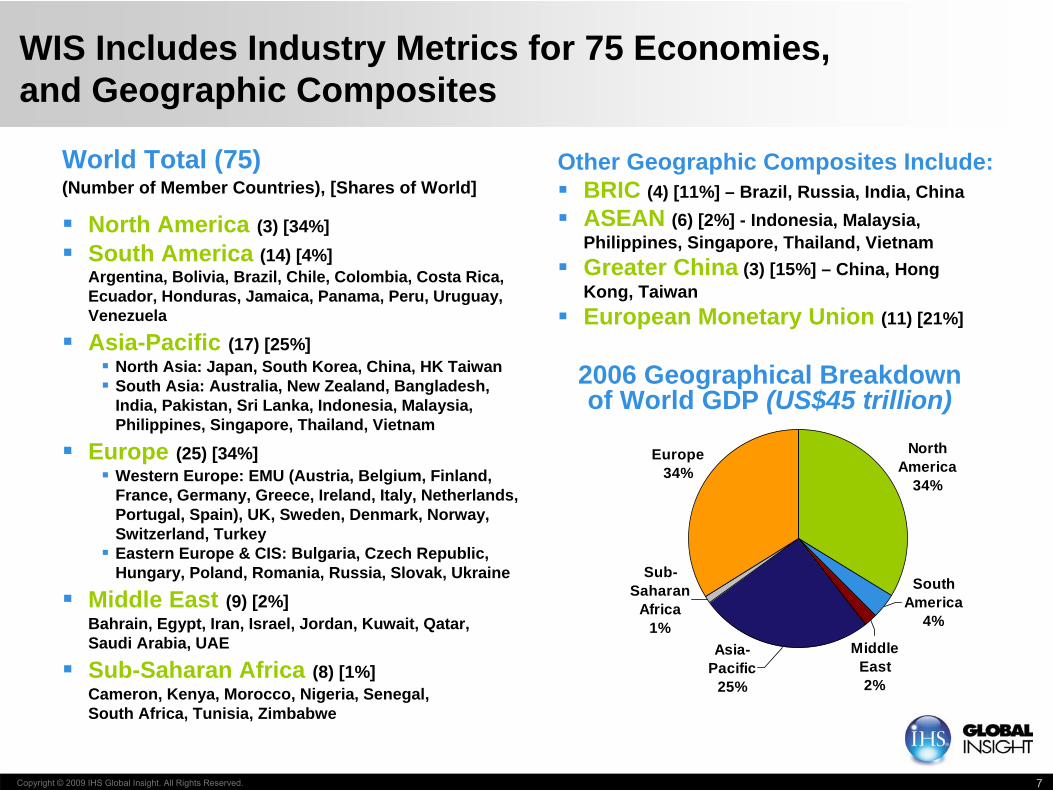
2006 Geographical Breakdown of World GDP (US$45 trillion)
WIS Includes Industry Metrics for 75 Economies, and Geographic Composites
World Total (75)(Number of Member Countries), [Shares of World]
North America (3) [34%] South America (14) [4%]
Argentina, Bolivia, Brazil, Chile, Colombia, Costa Rica, Ecuador, Honduras, Jamaica, Panama, Peru, Uruguay, Venezuela
Asia-Pacific (17) [25%] North Asia: Japan, South Korea, China, HK Taiwan South Asia: Australia, New Zealand, Bangladesh,
India, Pakistan, Sri Lanka, Indonesia, Malaysia, Philippines, Singapore, Thailand, Vietnam
Europe (25) [34%] Western Europe: EMU (Austria, Belgium, Finland,
France, Germany, Greece, Ireland, Italy, Netherlands, Portugal, Spain), UK, Sweden, Denmark, Norway, Switzerland, Turkey Eastern Europe & CIS: Bulgaria, Czech Republic,
Hungary, Poland, Romania, Russia, Slovak, Ukraine
Middle East (9) [2%]Bahrain, Egypt, Iran, Israel, Jordan, Kuwait, Qatar, Saudi Arabia, UAE
Sub-Saharan Africa (8) [1%]Cameron, Kenya, Morocco, Nigeria, Senegal, South Africa, Tunisia, Zimbabwe
Other Geographic Composites Include: BRIC (4) [11%] – Brazil, Russia, India, China ASEAN (6) [2%] - Indonesia, Malaysia,
Philippines, Singapore, Thailand, Vietnam Greater China (3) [15%] – China, Hong
Kong, Taiwan European Monetary Union (11) [21%]
Sub-Saharan
Africa 1%
North America
34%
South America
4%
Middle East2%
Asia-Pacific
25%
Europe34%
Copyright © 2009 IHS Global Insight. All Rights Reserved. 8
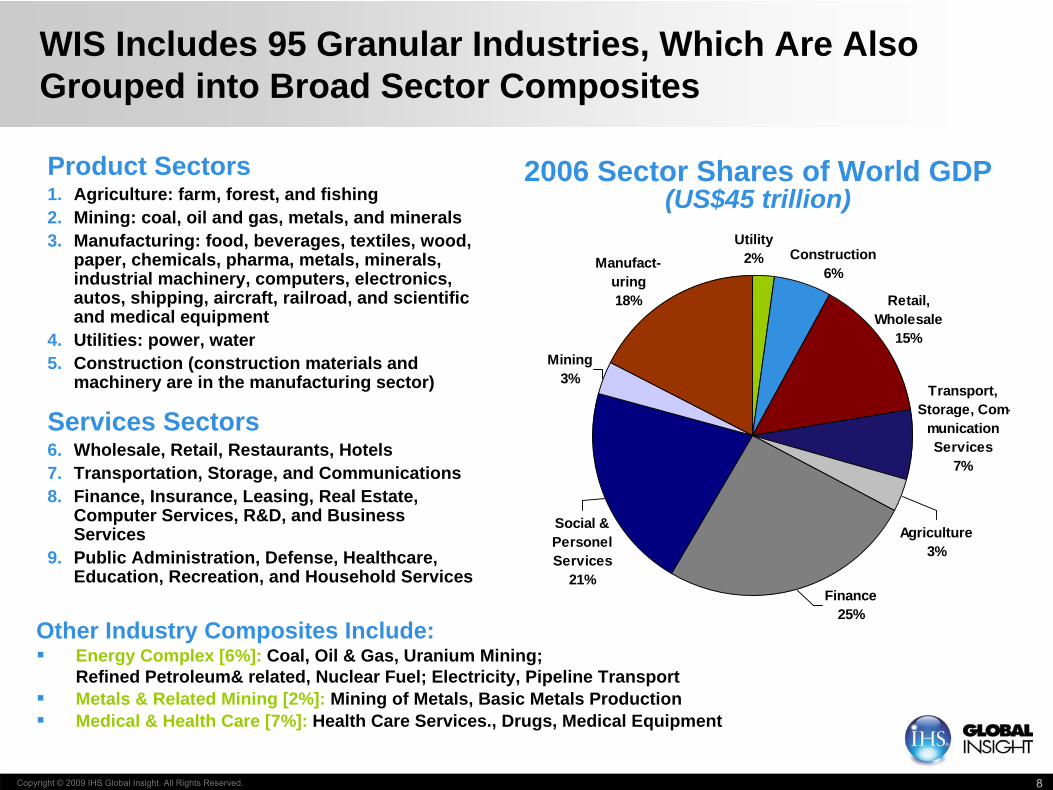
Product Sectors1. Agriculture: farm, forest, and fishing2. Mining: coal, oil and gas, metals, and minerals3. Manufacturing: food, beverages, textiles, wood,
paper, chemicals, pharma, metals, minerals, industrial machinery, computers, electronics, autos, shipping, aircraft, railroad, and scientific and medical equipment
4. Utilities: power, water5. Construction (construction materials and
machinery are in the manufacturing sector)
Services Sectors6. Wholesale, Retail, Restaurants, Hotels7. Transportation, Storage, and Communications8. Finance, Insurance, Leasing, Real Estate,
Computer Services, R&D, and Business Services
9. Public Administration, Defense, Healthcare, Education, Recreation, and Household Services
WIS Includes 95 Granular Industries, Which Are Also Grouped into Broad Sector Composites
Mining3%
Retail, Wholesale
15%
Construction6%
Finance25%
Social & Personel Services
21%
Transport, Storage, Com-
munication Services
7%
Agriculture3%
Utility2%Manufact-
uring18%
2006 Sector Shares of World GDP(US$45 trillion)
Other Industry Composites Include: Energy Complex [6%]: Coal, Oil & Gas, Uranium Mining;
Refined Petroleum& related, Nuclear Fuel; Electricity, Pipeline Transport Metals & Related Mining [2%]: Mining of Metals, Basic Metals Production Medical & Health Care [7%]: Health Care Services., Drugs, Medical Equipment
Copyright © 2009 IHS Global Insight. All Rights Reserved. 9
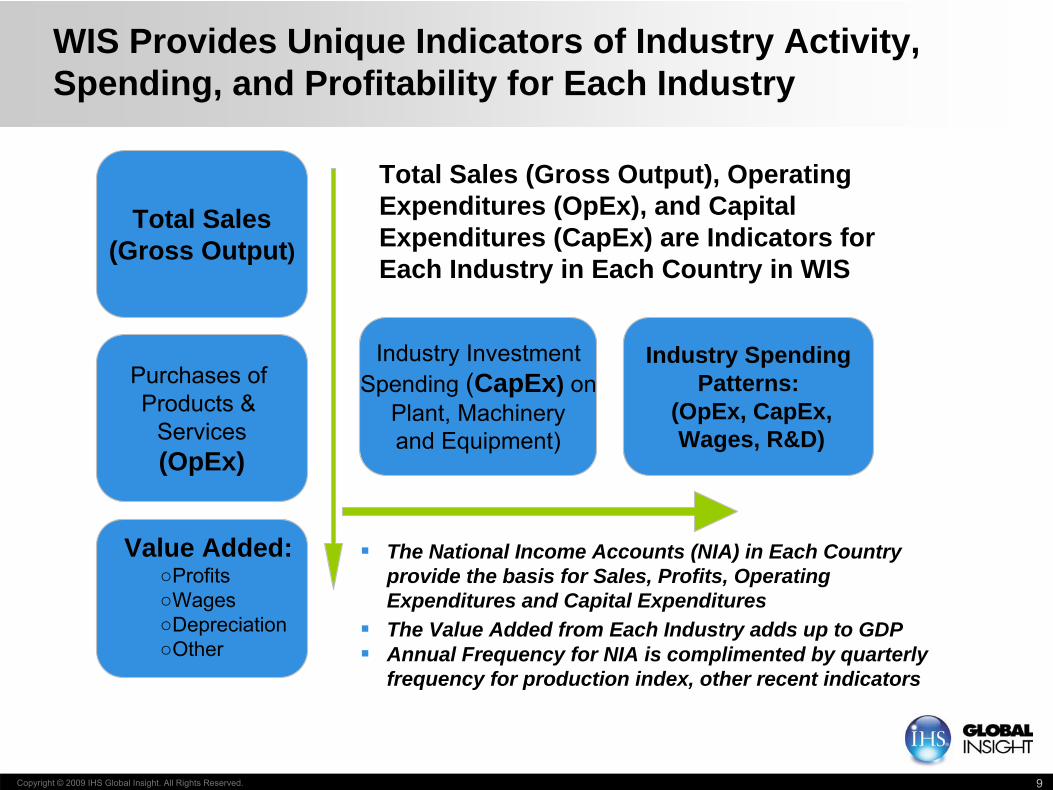
Total Sales (Gross Output), Operating Expenditures (OpEx), and Capital Expenditures (CapEx) are Indicators for Each Industry in Each Country in WIS
The National Income Accounts (NIA) in Each Country provide the basis for Sales, Profits, Operating Expenditures and Capital Expenditures
The Value Added from Each Industry adds up to GDP Annual Frequency for NIA is complimented by quarterly
frequency for production index, other recent indicators
Industry InvestmentSpending (CapEx) on
Plant, Machinery and Equipment)
Purchases of Products &
Services(OpEx)
Total Sales(Gross Output)
Value Added:○Profits○Wages○Depreciation○Other
Industry SpendingPatterns:
(OpEx, CapEx,Wages, R&D)
WIS Provides Unique Indicators of Industry Activity, Spending, and Profitability for Each Industry
Copyright © 2009 IHS Global Insight. All Rights Reserved. 10
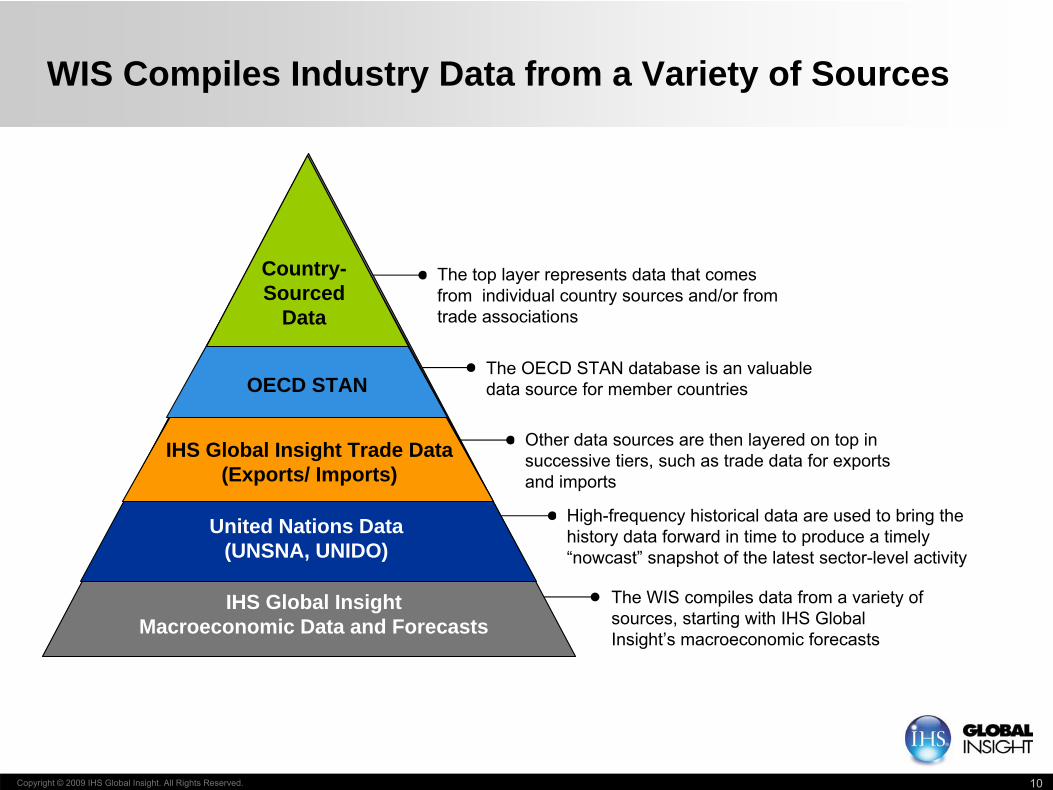
WIS Compiles Industry Data from a Variety of Sources
United Nations Data(UNSNA, UNIDO)
OECD STAN
Country-Sourced
Data
The WIS compiles data from a variety of sources, starting with IHS Global Insight’s macroeconomic forecasts
IHS Global Insight Trade Data(Exports/ Imports)
IHS Global Insight Macroeconomic Data and Forecasts
Other data sources are then layered on top in successive tiers, such as trade data for exports and imports
The OECD STAN database is an valuable data source for member countries
The top layer represents data that comes from individual country sources and/or from trade associations
High-frequency historical data are used to bring the history data forward in time to produce a timely “nowcast” snapshot of the latest sector-level activity
Copyright © 2009 IHS Global Insight. All Rights Reserved. 11
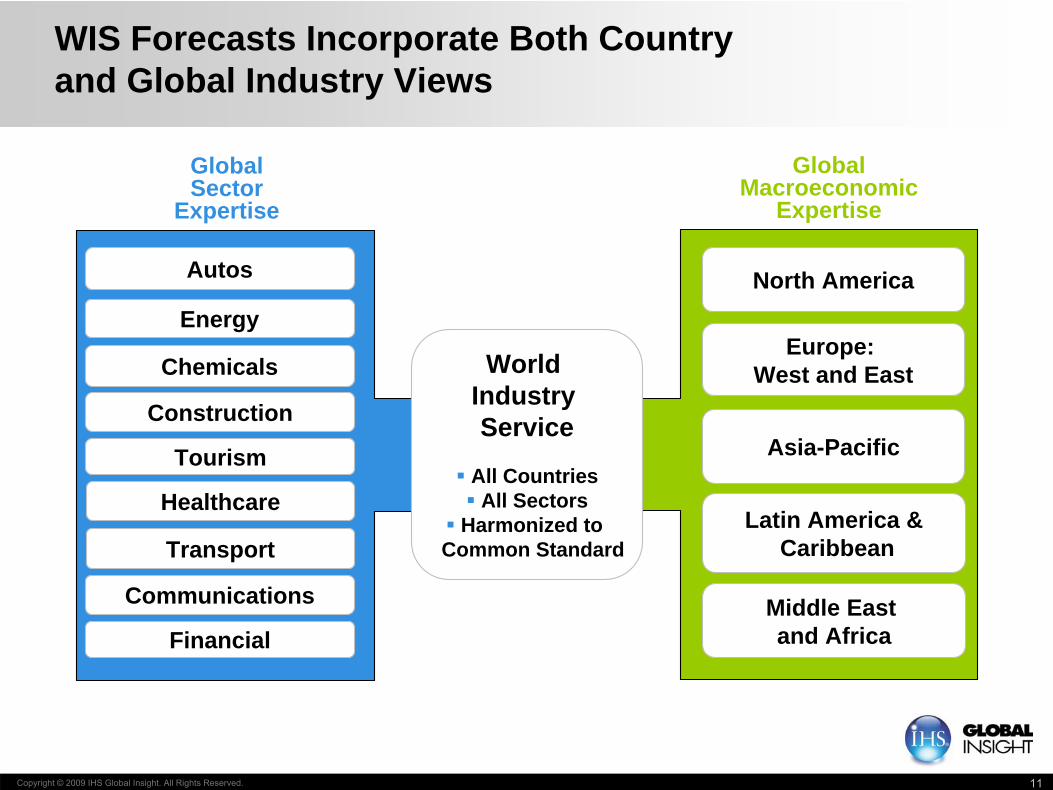
WIS Forecasts Incorporate Both Country and Global Industry Views
Global Sector
Expertise
Global Macroeconomic
Expertise
World Industry Service
All Countries All Sectors
Harmonized to Common Standard
North America
Middle East and Africa
Europe: West and East
Asia-Pacific
Latin America &Caribbean
Autos
Tourism
Energy
Chemicals
Construction
Financial
Healthcare
Transport
Communications
Copyright © 2009 IHS Global Insight. All Rights Reserved. 12
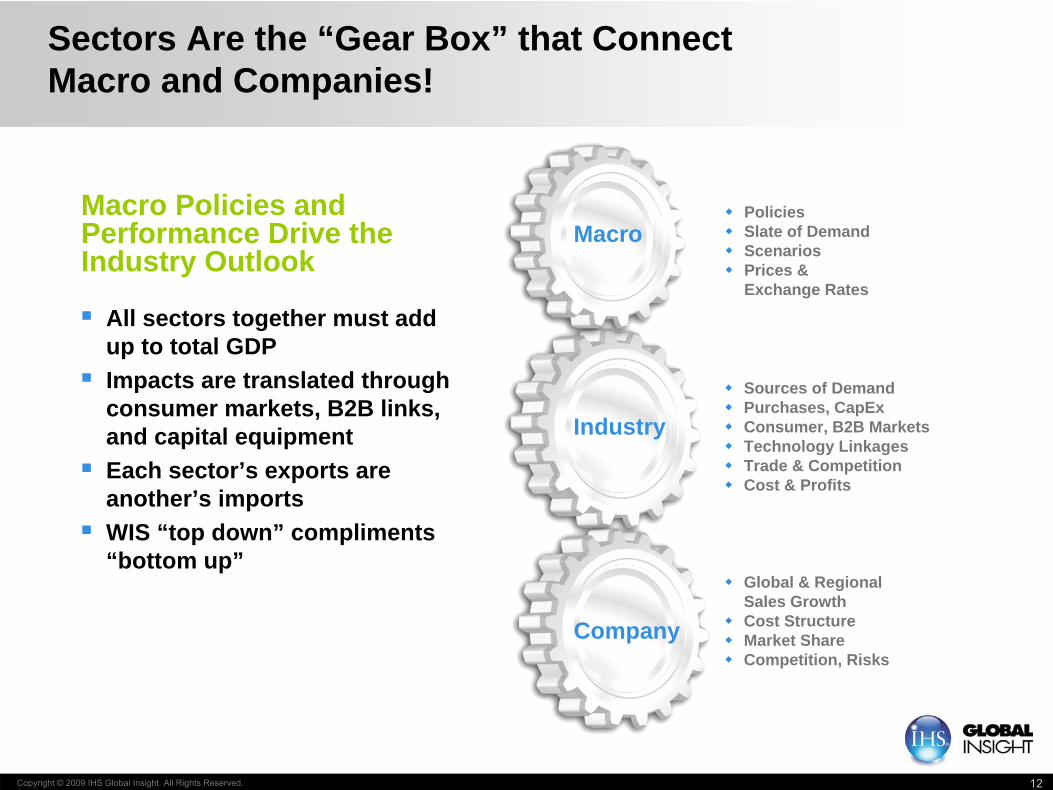
Macro Policies and Performance Drive the Industry Outlook
All sectors together must add up to total GDP
Impacts are translated through consumer markets, B2B links, and capital equipment
Each sector’s exports are another’s imports
WIS “top down” compliments “bottom up”
Macro Policies Slate of Demand Scenarios Prices &
Exchange Rates
Industry
Sources of Demand Purchases, CapEx Consumer, B2B Markets Technology Linkages Trade & Competition Cost & Profits
Company
Sectors Are the “Gear Box” that Connect Macro and Companies!
Global & Regional Sales Growth
Cost Structure Market Share Competition, Risks
Copyright © 2009 IHS Global Insight. All Rights Reserved. 13
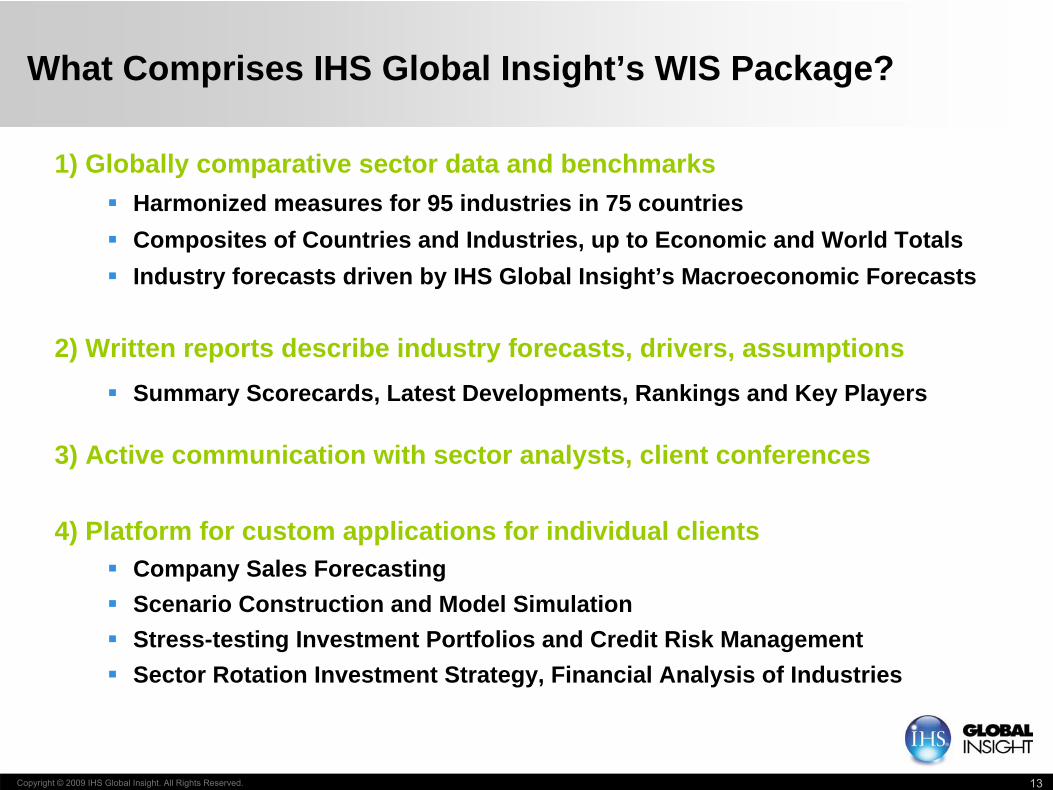
What Comprises IHS Global Insight’s WIS Package?
1) Globally comparative sector data and benchmarks Harmonized measures for 95 industries in 75 countries Composites of Countries and Industries, up to Economic and World Totals Industry forecasts driven by IHS Global Insight’s Macroeconomic Forecasts
2) Written reports describe industry forecasts, drivers, assumptions Summary Scorecards, Latest Developments, Rankings and Key Players
3) Active communication with sector analysts, client conferences
4) Platform for custom applications for individual clients Company Sales Forecasting Scenario Construction and Model Simulation Stress-testing Investment Portfolios and Credit Risk Management Sector Rotation Investment Strategy, Financial Analysis of Industries
Copyright © 2009 IHS Global Insight. All Rights Reserved. 14
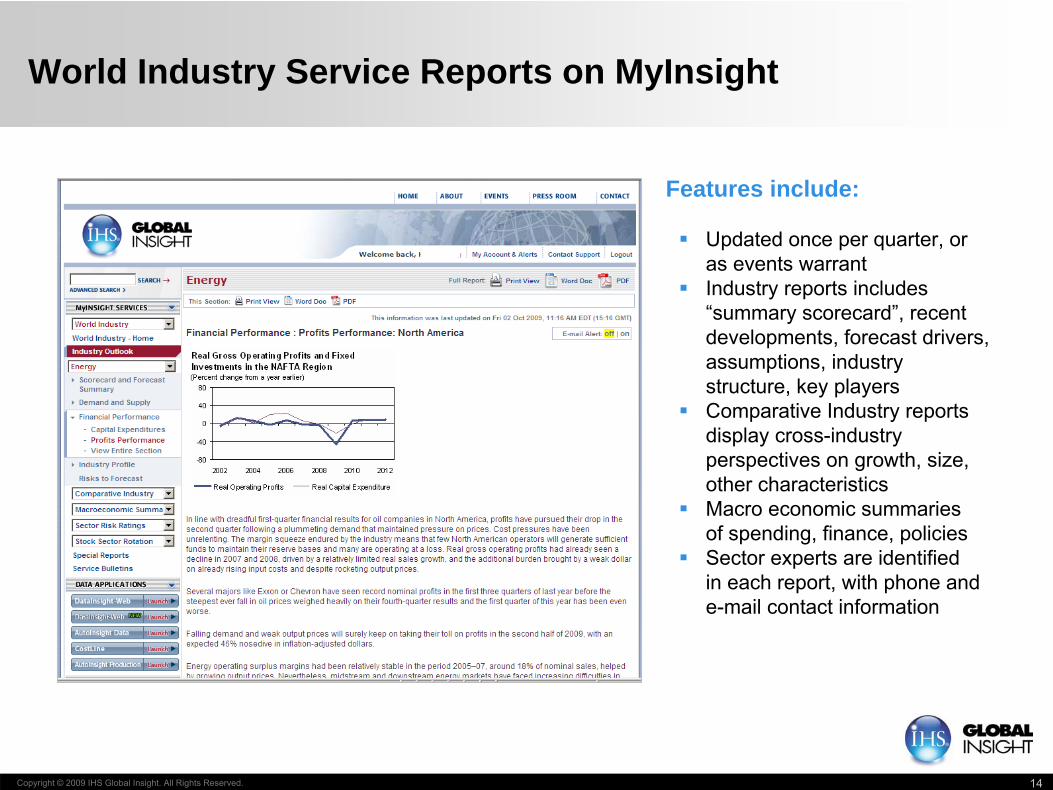
World Industry Service Reports on MyInsight
Features include:
Updated once per quarter, or as events warrant
Industry reports includes “summary scorecard”, recent developments, forecast drivers, assumptions, industry structure, key players
Comparative Industry reports display cross-industry perspectives on growth, size, other characteristics
Macro economic summaries of spending, finance, policies
Sector experts are identified in each report, with phone and e-mail contact information
Copyright © 2009 IHS Global Insight. All Rights Reserved. 15
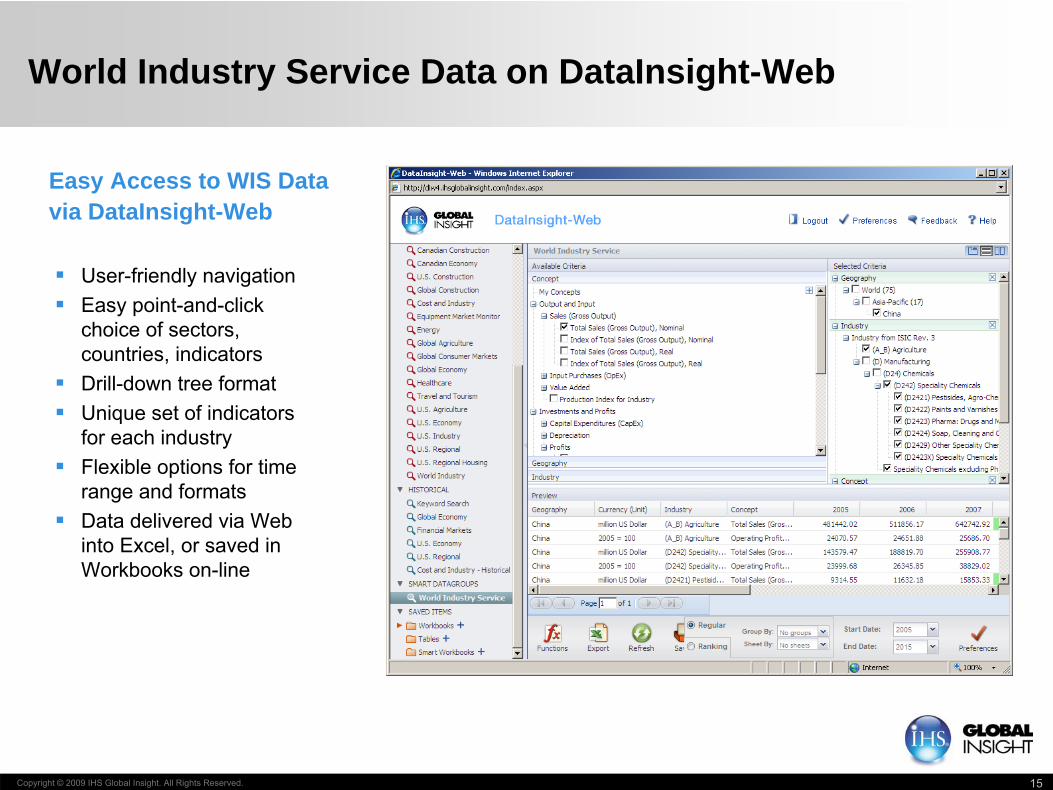
User-friendly navigation Easy point-and-click
choice of sectors, countries, indicators
Drill-down tree format Unique set of indicators
for each industry Flexible options for time
range and formats Data delivered via Web
into Excel, or saved in Workbooks on-line
Easy Access to WIS Data via DataInsight-Web
World Industry Service Data on DataInsight-Web
Copyright © 2009 IHS Global Insight. All Rights Reserved. 16
For more information, please see our public Web sites:
1) World Industry Service Home Pagehttp://www.ihsglobalinsight.com/WorldIndustry
2) Applications for Custom Market Indexes / Key Drivers for Technologywww.ihsglobalinsight.com/WIS
3) Sector Risk Ratingswww.ihsglobalinsight.com/WIS-Risk
4) Stock Sector Rotation Strategywww.ihsglobalinsight.com/WIS-Financial
Translating Economic Events into Implications for Global Sector Markets