Embed Size (px)
Citation preview

An independent licensee of the Blue Cross and Blue Shield Association. U7430b, 2/11
Introduction to US Health
Insurer Analytics
Daryl Wansink, PhD
Director, Health Economics
Blue Cross Blue Shield North Carolina

Blue Cross Blue Shield of North Carolina
+ Health care crisis in United States
+ Solutions my team provides analytic support for
+ Overview of Health Economics team
+ Analytics Evolution
Agenda
2

33
PHOTO of HQ from KyleBlue Cross and Blue Shield of North Carolina
+ North Carolina’s largest health insurer
+ 3.8 million members
+ 26,000 in-network providers
+ 4,200 employees
+ $6.4 billion revenue (2013)
+ Founded in 1933

+ Blue Cross Blue Shield of North Carolina
Health care crisis in United States
+ Solutions my team provides analytic support for
+ Overview of Health Economics team
+ Analytics Evolution
Agenda
4
+ Reform of the healthcare system is at a critical juncture
+ Current care delivery and payment system leads to
tremendous inefficiencies compared to other countries▪ Cost in US much higher
▪ Quality is OK but comes at a high price (Low value)
▪ Outcomes are mixed (Low value)
+ Provider analytics increasingly important in health care
industry
Health Care Crisis
5

+ US spends
a lot of
money on
healthcare
Health Care Crisis
6
$0 $2,000 $4,000 $6,000 $8,000 $10,000
United States
Norway
Switzerland
Netherlands
Luxembourg
Canada
Denmark
Austria
Germany
France
Belgium
Ireland
Sweden
Iceland
Australia
United Kingdom
Total health expenditure per capita in US dollars
0% 5% 10% 15% 20%
United States
Norway
Switzerland
Netherlands
Luxembourg
Canada
Denmark
Austria
Germany
France
Belgium
Ireland
Sweden
Iceland
Australia
United Kingdom
Total health expenditure as a % of GDP
www.oecd-ilibrary.org/sites/health_glance-2011

0 0.1 0.2 0.3 0.4 0.5 0.6 0.7 0.8 0.9 1
Sepsis during admission
Pulmonary embolism or DVT following surgery
Accidental puncture during surgery
Foreign object left in patient after surgery
Screening for cervical cancer
Screening for breast cancer
Preventable admits for asthma
Preventable admits for diabetes
+ US does not
get good
value for that
money
Health Care Crisis
7
Worst
RankingBest
Ranking
International Rank of US on Quality of Care Measures
www.oecd-ilibrary.org/sites/health_glance-2011

+ More care
doesn’t
equate to
better quality
or greater
life
expectancy
Health Care Crisis
8
Mortality Rate due
to Cardiac DiseaseRate of Angioplasty
per 100,000
population
www.oecd-ilibrary.org/sites/health_glance-2011
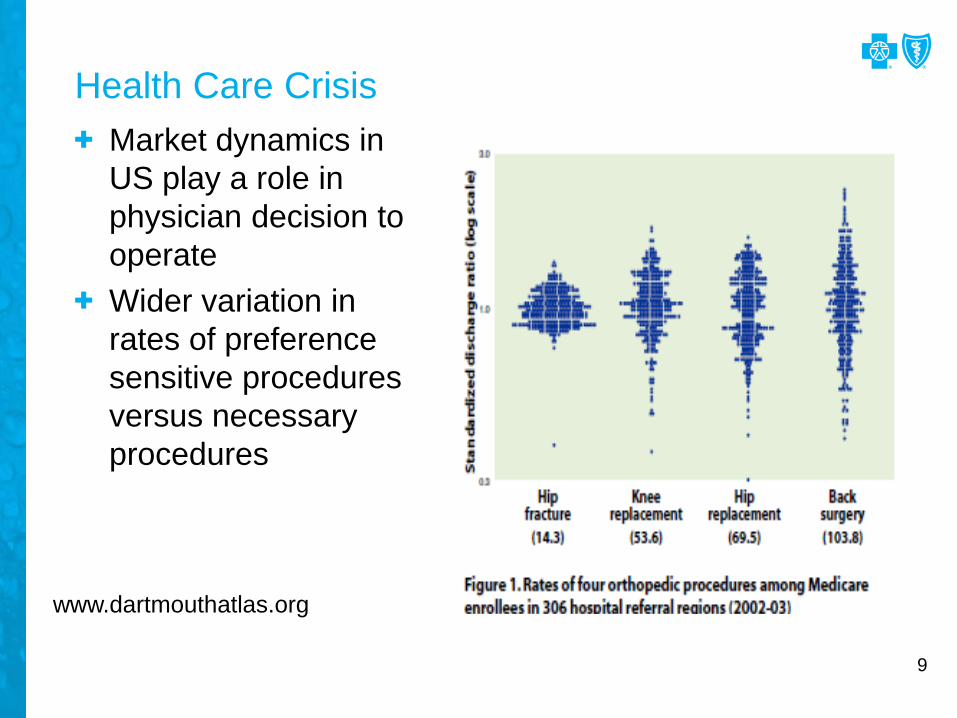
+ Market dynamics in
US play a role in
physician decision to
operate
+ Wider variation in
rates of preference
sensitive procedures
versus necessary
procedures
Health Care Crisis
9
www.dartmouthatlas.org

+ High correlation between
supply of hospital beds
and medical admissions
+ No correlation between
hospital beds and
medically necessary
procedures
+ Market dynamics play a
role in choice to admit a
patient
Health Care Crisis
10
www.dartmouthatlas.org

+ Insurers have several key ways to improve the value of
the healthcare system:▪ Network management – who provides services and at what
price
▪ Benefit design – services covered and what percent member pays
+ Positive consequence of Affordable Care Act▪ Increased collaboration between payers and providers
▪ Why?
Health Care Crisis: Solutions
11

+ Blue Cross Blue Shield of North Carolina
+ Health care crisis in United States
Solutions my team provides analytic support for
+ Overview of Health Economics team
+ Analytics Evolution
Agenda
12
+ Types of collaboration:
+ Patient Centered Medical Homes▪ Increased fee schedule
▪ Data sharing
+ New payment models▪ Bundled payment
▪ Tiered networks
▪ Pay for performance (quality measures)
+ Accountable Care Organizations▪ Exclusive narrow network
▪ Data sharing
+ New Ventures▪ Mergers of payer and provider
▪ Co-funding innovative delivery systems
Health Care Crisis: Solutions
13

+ Value based initiatives for members:
+ Reduce cost-sharing for high value services▪ Taking medications
▪ Preventive services
▪ Seeking care at high value providers– Centers of excellence for procedures
– Designated providers in tiered network
+ Monetary incentives for ‘good behavior’▪ Going to general practitioner
▪ Using urgent care instead of emergency department
+ Providing cost and quality information on providers
Health Care Crisis: Solutions
14

+ Blue Cross Blue Shield of North Carolina
+ Health care crisis in United States
+ Solutions my team provides analytic support for
Overview of Health Economics team
+ Analytics Evolution
Agenda
15

+ Interdisciplinary Team▪ Degrees in Economics, Health Policy, Psychology, Sociology, Industrial
Engineering
▪ Prior experience from industries like: Financial, Cruise line, Marketing, Health
Policy Think Tank (RAND, RTI)
+ Team consists of Informatics Scientists (What the heck is that?!)
▪ Experienced in advanced analytic techniques in applied setting
– Data mining
– Statistical modeling
– Program evaluation
▪ Capable of working with business units to advise on
– Analyses to conduct
– Recommendations for action
▪ Responsible for all aspects of analysis
– Hypothesis, Data extraction, Analysis, Write-up, Presentation
Health Economics Team
16

+ Comparative Effectiveness Research/Evaluation▪ Medical policy changes (e.g., coverage of services)
▪ Healthcare programs (disease management, case management, wellness)
▪ Physician programs (Patient Centered Medical Homes, Blue Quality Physician Program, Carolina Advanced Health)
▪ Campaigns (care gap closure, ER education/steerage)
▪ Benefit design changes (co-pay waivers, tiered benefit steerage)
+ Operations support▪ Building statistical models to optimize business operations
▪ Daily stratification of membership for enrollment in case management
▪ Staffing models for healthcare
▪ Segmentation for campaigns (mostly in Healthcare)
▪ Develop and implement methodology to tier facilities and specialists for Blue Select
What We Do
17
+ Advanced analytic collaboration▪ Refining underwriting models with A&U
▪ Developing customer lifetime value models with Marketing, IMAS and A&U
▪ Developing gravity models for network management – aka market influence of providers
▪ Exploring use of social network analysis for Health Delivery Re-Design
▪ Development of new data sources for consumption by other areas
– Provider performance metrics
– ACO attribution
What We Do
18

+ Base
+ STAT
+ Enterprise Miner
+ Enterprise Guide
+ JMP
+ Marketing Automation
+ SAS Grid coming soon…
SAS Tools
19

Finance Network Management
Marketing/ Sales
HealthcareActuarial/
Underwriting
Claims Payment
BCBSNC Divisions with Analytic Support
20
Business analysts
Business analysts
Business analysts
Actuaries / Underwriters
Business analysts
Risk Modeling
Information Management & Analytic Services:Warehouse/Business Intelligence
Health Economics:Advanced Analytics
Clinical Informatics
Analysts
+ Blue Cross Blue Shield of North Carolina
+ Health care crisis in United States
+ Solutions my team provides analytic support for
+ Overview of Health Economics team
Analytics Evolution
Agenda
21
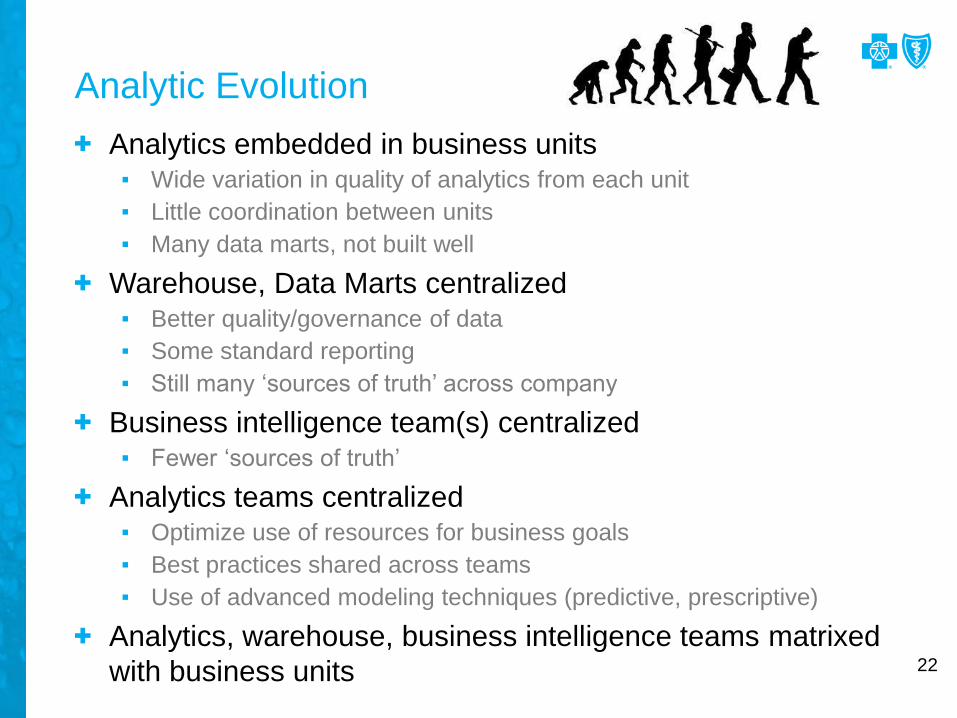
+ Analytics embedded in business units▪ Wide variation in quality of analytics from each unit
▪ Little coordination between units
▪ Many data marts, not built well
+ Warehouse, Data Marts centralized▪ Better quality/governance of data
▪ Some standard reporting
▪ Still many ‘sources of truth’ across company
+ Business intelligence team(s) centralized▪ Fewer ‘sources of truth’
+ Analytics teams centralized▪ Optimize use of resources for business goals
▪ Best practices shared across teams
▪ Use of advanced modeling techniques (predictive, prescriptive)
+ Analytics, warehouse, business intelligence teams matrixed
with business units
Analytic Evolution
22

+ Need analytic champions in business units▪ Strong support from senior leadership
+ Business areas must be ready to become data driven▪ Need vision for how analytics will be used to improve business
▪ Management must make data-driven decisions
▪ Not all companies need to evolve to sophisticated analytics
+ It’s all about the data▪ Data must be organized in ways to enable analytics
▪ Data marts often are sufficient
– Quicker to develop
– Flexible to change in business need
– Domain specificity makes them less complex
– Accuracy/Cleanliness varies by business need
▪ Data warehouse necessary for tracking core business functions
Analytic Evolution: Keys to Success
23
+ Analytic talent is hard to develop on the job▪ Easier to learn the business issues than how to be an analyst
▪ May require turnover in staff or significant re-training
+ Necessity is the mother of invention▪ Pilot new analytics for specific business problems
▪ Pick an important problem
▪ Pick a problem where success is easily defined
▪ Accelerating analytics in one business area easier than doing so across the entire company at once
▪ Start with small interdisciplinary teams
– Analyst/Statistician
– Business person
– Data scientist
24
Analytic Evolution: Keys to Success