Embed Size (px)
Citation preview

Introduction to Visualization and Advanced Computer Graphics
Jian Huang, CS 594, Spring, 2002

Visualization
• “A picture is worth more than a thousand words”. – a Chinese proverb
• “A picture is worth more than a thousand numbers”.
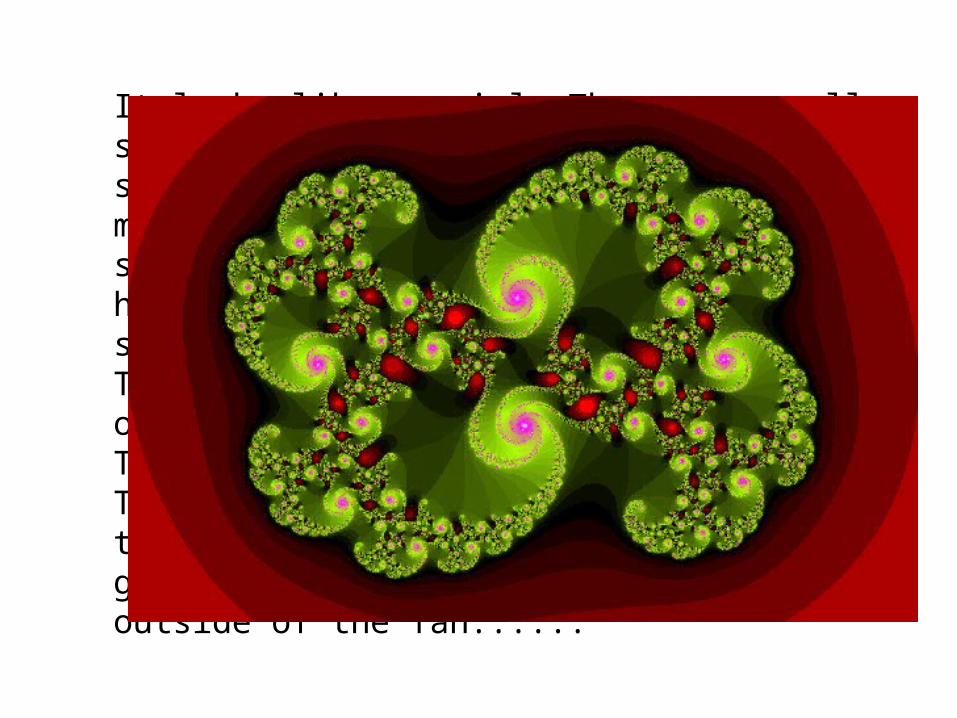
It looks like a swirl. There are smaller swirls at the edges. It has different shades of red at the outside, and is mostly green at the inside. The smaller swirls have purple highlights. The green has also different shades. Each small swirl is composed of even smaller ones. The swirls go clockwise. Inside the object, there are also red highlights. Those have different shades of red also. The green shades vary in a fan, while the purple ones are more uni-color. The green shades get darker towards the outside of the fan......

(10,20,21), (12,13,14), (13,32,12),...., (1,2,3), (2,4,5),(3,5,6),.....
Terrain geometry:
Terrain Texture:
Time 0:
(23,34,54), (23,34,23), (45,26,78),....
Volumetric cloud cover:0, 0, 12, 14, 15, 15, 17, 12, 23, 45,.....
Wind vectors:(0.2, 0.3, 0.93,5), (0.4,0.5,0.76,12),...,
Volumetric cloud cover:0, 0, 11, 12, 13, 16, 20, 12, 32, 45,.....
Wind vectors:(0.4,0.5,0.76,12),(0.5,0.5,0.7,6),...
Time 1:

What Is Visualization?
• “seeing is believing”• we observe and draw conclusions• seeing is also understanding• beware of ‘illusions’ (magicians)

What Is Visualization?
• Transformation of data or information into pictures
• engages primary human sensory apparatus - vision

What Is Visualization?
• Is a Tool for:– Aid For Learning/Understanding– Compact Representation Of
Information (e.g. Numbers)– “Carrier” of Information

Visualization Flavors?
• Scientific Vis. - User Interfaces, data representation/processing Algorithms, Visual Representations
• Data Visualization - Include financial data and statistical methods
• Information Visualization - Abstract Data: WWW documents, file structures, arbitrary relationships
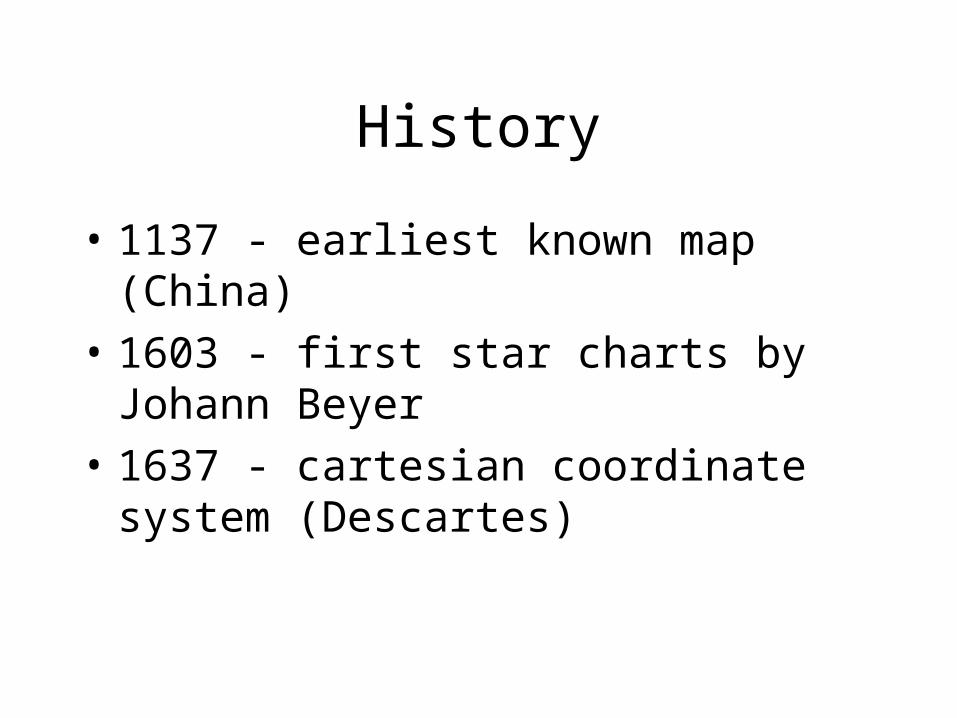
History
• 1137 - earliest known map (China)• 1603 - first star charts by Johann
Beyer• 1637 - cartesian coordinate system
(Descartes)

History (2) - Statistical
• 1686 - first meteorological chart (Halley)• 1693 - mortality
tables of city of Breslau (Halley) -> first attempt to correlate two variables

History (3) - 2D
• Approx. 1750 - contour lines (height)
• 1817 - isotherms (temperature)• 1829 - isochromatic lines (color)• 1864 - isobars (pressure)

History (4) - 3D Imaging
• 1895 - X rays by W. Röntgen• 1898 - stereo X rays (mackenzie-
davidson) - locating foreign bodies in humans
• 1938 - x-ray sections or slices (3D!)• 1912 - x-ray crystallography (Laue)
- position of atoms in a crystal

History (5) - Computer Graphics
• 1949 - SAGE air defense - tracked position of aircraft by radar, analyzed results and display on CRT
• 1965 - sketchpad (Sutherland) - interactive graphical drawing system
• Used to be BIG and EXPENSIVE
History (6) - Scientific Visualiz.
1987 - NSF report [McCormick87]• Personal/exploratory graphics - to enable a
scientist to gain more knowledge (interact with data)
• Peer graphics - enable scientist to show information to their colleagues and to collaborate
• Presentation graphics - communicate information and results (high quality, fully annotated)
• Publication of visualization - enable others to use the data (replicable)

History (7) - Augmented Reality.
• 1983 - responsive environments (Myron Krueger)
• 1995(?) - Cave

Visualization Domains
Volumetric data sources are usually produced by:
• Scanning devices• Computation (mathematical), or• Simple measuring

Applications - Vis. As a Toolkit
Application tools usually coupled with
• Haptic feedback devices• Stereo output (glasses)• Interactivity
demanding of the rendering algorithmdemanding of the rendering algorithm
Scanning - Domains
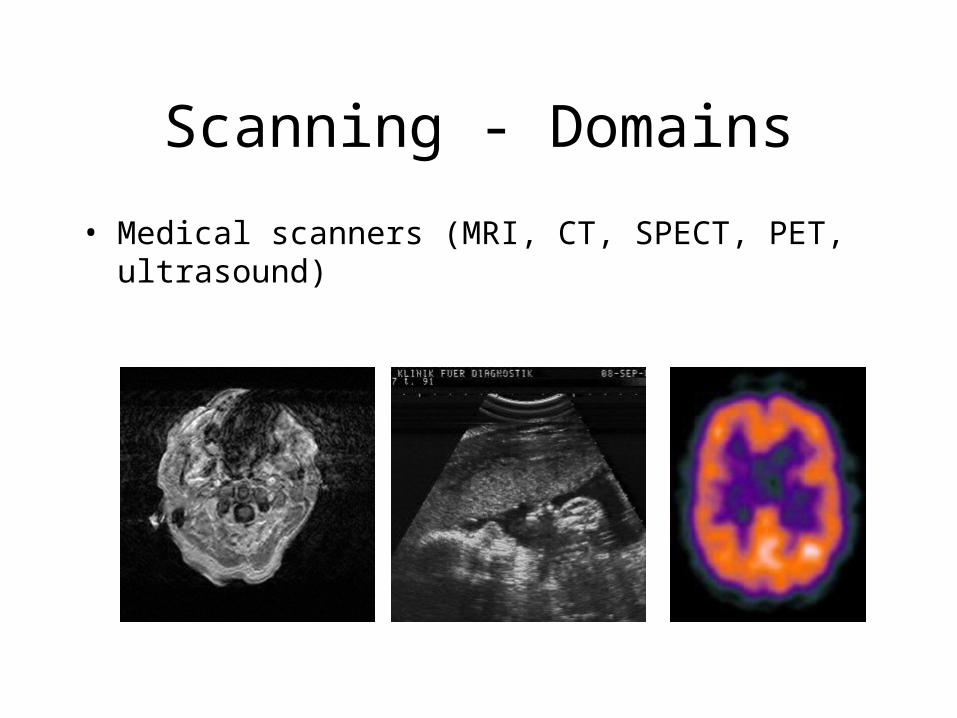
• Medical scanners (MRI, CT, SPECT, PET, ultrasound)

Scanning - Applications
• Primary education• Medical education for surgery, anesthesia • Illustration of medical procedures to the
patient

Scanning - Applications
• Surgical simulation for treatment planning• Tele-medicine• Inter-operative visualization in brain surgery,
biopsies, etc.• Industrial purposes (quality control, security)• Games with realistic 3D effects?

Scanning (2)
• Domain - biological scanners, electronic microscopes, confocal microscopes
• Apps - paleontology, microscopic analysis

Scientific Computation - Domain
• Mathematical analysis
• ODE/PDE (ordinary and partial differential equations)
• Finite element analysis (FE),
• Supercomputer simulations,

Scientific Computation - Apps
• Computational fluid dynamics (CFD),
• Computational field simulations (CFS),

Vector Field Viz Applications
Computational Fluid Dynamics Weather modeling

Vector Field Visualization Challenges
General Goal: Display the field’s directional information
Domain Specific: Detect certain features Vortex cores, Swirl

Streamlines
A curves that connect all the particle positions
Streamlines (cont’d)
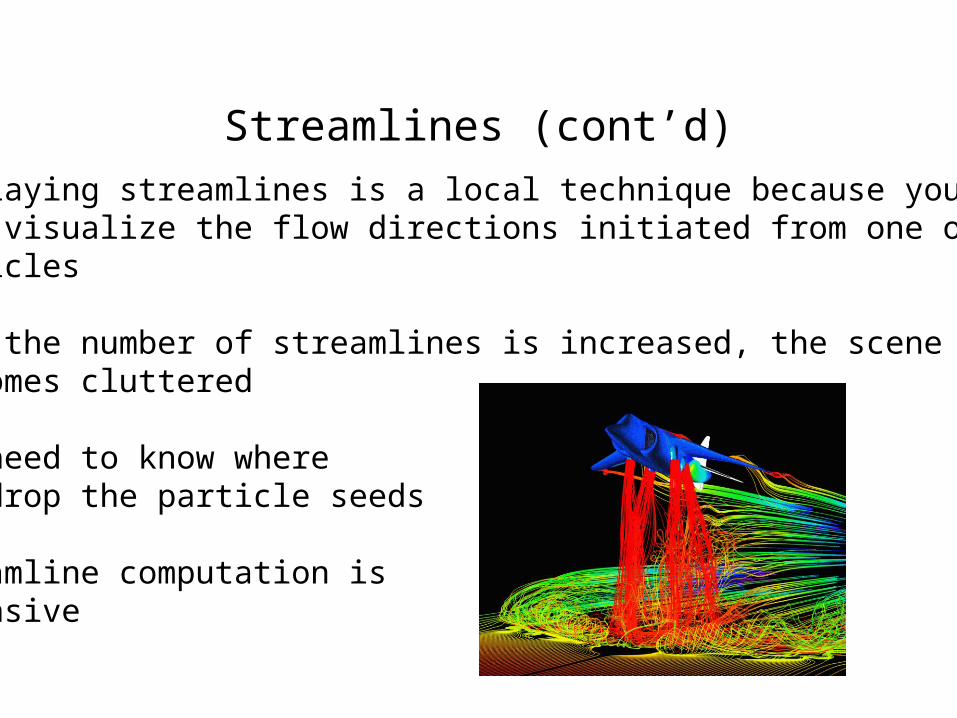
- Displaying streamlines is a local technique because you can only visualize the flow directions initiated from one or a few particles
- When the number of streamlines is increased, the scene becomes cluttered
- You need to know where to drop the particle seeds
- Streamline computation is expensive

Measuring - Domains
• Orbiting satellites
• Spacecraft
• Seismic devices
• Statistical Data

Measuring - Applications
• for military intelligence,
• weather and atmospheric studies
• planetary and interplanetary exploration
• oil, precious metal exploitation, and
• earth quake studies
• Statistical Analysis - Info Vis (Financial Data …)

TaxonomyVolumes
CT, MRI, UltrasoundSeismic
Numerical Simulations
Surfaces
Data
Geometricmodel
Voxelization
discretization
Surface extraction
polygonalization
Scanners, sensors,cameras
samplingscanning
Supercomputers
Computation / Sim
ulation
Image(signal)
visu
aliz
atio
nImage
processing
Computer vision /
Pattern Recognition
Computer graphics
DisplayVideo
Recording
Viz vs. Graphics vs.. Imaging
• Imaging - Enhance, analyze, manipulate and store 2D/3D images
• Graphics - Make pictures! Digital Image Synthesis: sampling + illumination
• Visualization - Exploration, transformation, viewing data as images

Relation To Other Fields
Visualization
Vision
Signal/ImageProcessing
IlluminationEngineering
OpticsComputational
Geometry
AppliedMathematics
Hardware UserInterfaces
PsychologyCognition

Our Topics• Data representation on various types of grids• Rendering of scalar and multi-modal data sets• Rendering of vector fields and diffusion data sets• Efficient iso-surfacing algorithms• Distance fields and voxelization• Parallel graphics and visualization • Point-based graphics• Image-based graphics• Information visualization• Basic geometrical modeling concepts
What I expect?• Good programming skills in C/C++
• Can perform a decent quality design
• Can think mathematically
• Basic understanding of parallel or distributed computation
• Can work independently and would like to do innovative work (a technical report by end of semester)
• Professional critique and presentation of research work
• A little sleep deprivation

Pre-requisite
• Understand: viewing pipeline, transformation and rasterization, visibility algorithms, lighting and shading, texture mapping and anti-aliasing
• Have TA help sessions on these topics.

I will not
• Teach C/C++
• Go over every nutty detail of material
• Teach data structure and algorithm analysis
• Teach computer architecture
• Teach parallel programming

Publication Opportunities• IEEE Conference on Visualization (03/29/2002)
• IEEE Symposium on Volume Graphics (03/31/2002)
• IEEE Symposium on Information Visualization (03/29/2002)
• Eurographics Workshop on Parallel Graphics and Visualization (around 04/15/2002)
• IEEE Transactions on Visualization and Computer Graphics
• ACM Transactions on Graphics
• Many more coming up in later 2002