Embed Size (px)
Citation preview

Introduction
PART I
Human capital is considered an important determinant of economicgrowth and an effective vehicle for reducing inequality and absolutepoverty. When countries invest in human capital through education,there is the potential for generating benefits to society that go beyondthose acquired by the individuals involved. Available evidence suggeststhat education is associated with lower fertility rates, healthier and bet-ter-educated children, and stronger national identity. Not surprisingly,most developing countries, including those in the MENA region, havecommitted substantial resources over the last 40 years to expand and im-prove their education systems.
Attaining the above benefits from investing in human capital througheducation is not automatic, however. All too often, higher investment ineducation is not associated with faster economic growth, especially whenthe system fails to produce the level, mix, and quality of skilled labor re-quired to meet demand or when demand itself is inadequate or distorted.Similarly, poor-quality education effectively erodes its returns, leading tohigh dropout rates, especially among the poor. Finally, rather than en-hancing social cohesion, improving health outcomes, and strengtheningthe future development capacity of a nation, education is sometimes usedby vested interest groups to advance particular causes at the expense ofthe broader public good.
In light of the uncertainty surrounding the outcomes of investment ineducation, Part I of this report—The Case for Education Reform in theMENA Region—explores the extent to which MENA countries havebeen successful in their effort at making education work for develop-ment. More concretely, chapter 1 documents MENA’s investment inhuman capital through education over the past 40 years or so, and showshow this investment has affected education outcomes. Chapter 2 ex-plores the extent to which investment in education has been translatedinto higher economic growth, improved income equality, and lowerpoverty in the region. Chapter 3 analyzes the state of readiness of the ed-ucation systems in the region to deal with such new challenges as glob- 7
01-Chap01-R1 12/5/07 3:16 PM Page 7

8 The Road Not Traveled
alization and the knowledge economy, demographic pressure, and fi-nance of education.
The upshot of the analysis is that MENA countries have committedmore resources to education than other developing countries at a similarlevel of per capita income. As a result, the region was able to improve ac-cess to education at all levels of instruction for boys and girls at rates notpreviously seen in the developing world. The main shortcoming of pastefforts lies in the weak link between the improvements in the level, qual-ity, and distribution of human capital and economic growth, income dis-tribution, and poverty reduction. Past investments in education have notgenerated the maximum benefits to individuals and society. Thus, thecase for education reform is compelling. This case is further reinforcedby the lack of readiness of most education systems in the region to dealwith globalization and the increasing emphasis on knowledge in the de-velopment process, the region’s enormous youth bulge, and the addi-tional financial resources required to expand higher levels of instruction,having essentially achieved full enrollment at the primary level.
01-Chap01-R1 12/5/07 3:16 PM Page 8
Investment in Education
CHAPTER 1
How much have MENA countries invested in human capital througheducation over the past four decades? What has been the impact of thisinvestment on the level, quality, and distribution of human capital? Whathas been the impact on such human indicators as fertility and infant mor-tality rates as well as life expectancy? How well did the region performin accumulating human capital compared with other developing coun-tries? These are the questions addressed in this chapter.
The value of reviewing how much or how little countries in the re-gion have invested in human capital through education is that it docu-ments progress made to date. It also situates the region relative to otherdeveloping countries, especially in a world of increasing capital mobility.In addition, the review sets the stage for exploring the relationshipamong human capital and economic growth, income distribution, andpoverty reduction in chapter 2.
This chapter is organized into four sections: the first three examineinvestment in education under three facets of human capital: its level, itsquality, and its distribution. The fourth section is devoted to noneco-nomic returns. Although all of these facets of human capital are relatedto each other, as will be noted occasionally, they are addressed separatelyfor the sake of clarity.
Investment in Education and the Level of Human Capital
A number of measures are effective in gauging a country’s effort to in-crease the level of human capital through education, including publicspending,1 enrollment rates, and the number of years of schooling. A his-torical and comparative assessment of the effort made by MENA coun-tries along these dimensions is presented in the following paragraphs.
9
01-Chap01-R1 12/5/07 3:16 PM Page 9

10 The Road Not Traveled
Public Sector Spending on Education
The MENA region does well on spending on education as a proportionof GDP compared to East Asia and Latin America (table 1.1). In the pe-riod 1965–2003, MENA governments spent an average of approximately5 percent of their GDP on education, whereas our sample of East Asianand Latin American countries spent closer to 3 percent. In recent years,the proportion of GDP spent by MENA governments as a whole ex-ceeded those of East Asia and Latin America by about 1.5 percentagepoints.2
In terms of public expenditure per pupil, MENA countries also spendon average more per student at all levels of education than do our sam-ple of comparator countries. This observation is supported by the figurespresented in table 1.2, which are reported in 2000 dollars after adjustingfor purchasing power parity (PPP) to reflect differences in the price of abasket of consumption goods across countries.
These figures confirm the strong collective effort to invest in educa-tion in the MENA region. However, they also reveal that most MENAcountries are placing more public effort per pupil into secondary thaninto primary education and, to a greater extent, into tertiary than intosecondary education.3 This pattern of spending favors children in fami-lies of higher social class, who are likely to send their children to univer-sity. Conversely, if most of the spending were allocated to primaryschooling, this would imply greater investment in a broader portion ofthe population.
Enrollment Rates
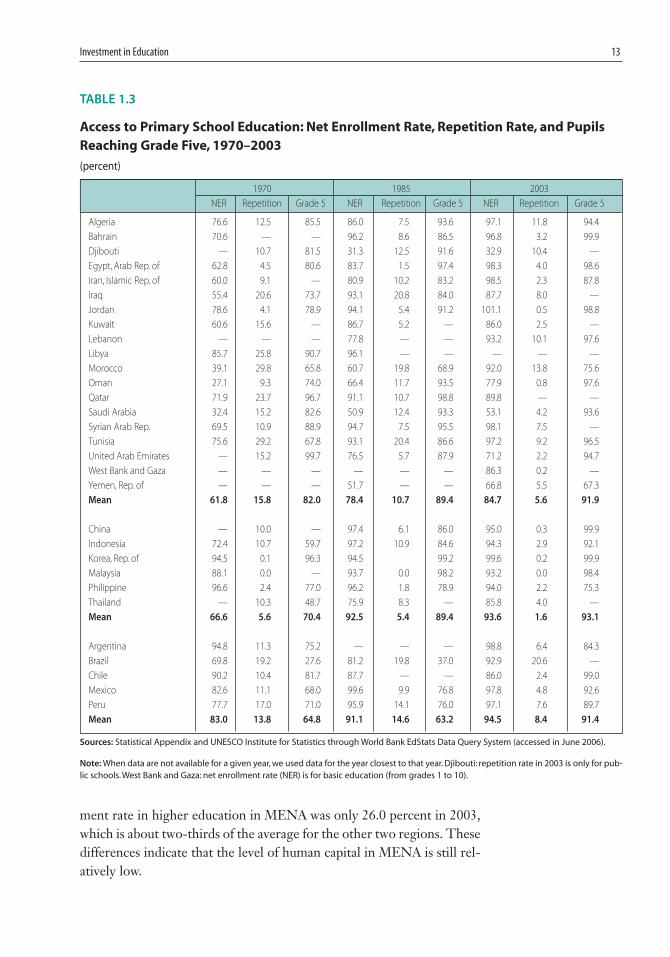
The large amount of spending on education as a percent of GDP in theMENA region has successfully increased enrollment. Indeed, net enroll-ment rates, measured as the percentage of number of pupils enrolledwho are of the official age group for a given level of education in that agegroup, improved significantly over time. If the current level of effort issustained, the region can catch up with other regions in the near future.More concretely, the majority of MENA counties were able to achievealmost universal enrollment in primary education and even completionof fifth grade as a percentage of the age cohort (table 1.3).
With some exceptions (e.g., Djibouti, Saudi Arabia, and the Republicof Yemen), MENA countries are educating most young people, bothboys and girls, at the primary level.
Similar progress has been made with respect to the proportion of theage cohort attending secondary school and university. The data pre-sented in table 1.4 indicate that the MENA region was able to increase
01-Chap01-R1 12/5/07 3:16 PM Page 10

Investment in Education 11
enrollment at the secondary school level by almost threefold between1970 and 2003; the number was approximately fivefold at the level of
TABLE 1.1
Average of Public Expenditure in Education as a Percentage
of GDP, 1965–2003
1965–74 1975–84 1985–94 1995–2003
Algeria 6.2 6.1 7.2 6.1
Bahrain — 3.3 4.1 3.6
Djibouti — 3.3 5.7
Egypt, Arab Rep. of 4.7 5.4 4.8 5.6
Iran, Islamic Rep. of — 5.0 4.2 4.6
Iraq — 4.4 4.4 —
Jordan 3.2 5.2 6.1 6.4
Kuwait — 4.1 7.1 6.3
Lebanon — 2.0 2.9
Libya — 5.2 8.4 —
Morocco 3.4 6.3 5.6 5.9
Oman — 2.1 3.6 3.9
Qatar — 3.6 4.0 —
Saudi Arabia 3.6 6.7 7.2 6.3
Syrian Arab. Rep. 3.3 5.4 4.3 3.2
Tunisia 6.2 5.2 5.9 6.8
United Arab Emirates — 1.3 2.0 1.7
West Bank and Gaza — — 9.5
Yemen, Rep. of — — 5.6 5.8
Mean 4.4 4.6 5.0 5.3
China 1 2.4 2.3 2.3
Indonesia 2.6 2.1 1.1 1.2
Korea, Rep. of 2.7 3.6 3.8 3.9
Malaysia 4.1 6.1 5.5 6.2
Philippines — 1.8 2.4 3.4
Thailand 2.8 3.6 3.6 4.8
Mean 2.6 3.3 3.1 3.6
Argentina 1.9 2.1 2.2 4.1
Brazil — 3.3 4.1 3.6
Chile 4 4.6 3.0 3.7
Mexico 2.3 4.3 3.7 5.0
Peru 3.7 3.0 3.1 3.1
Mean 3.0 3.4 3.2 3.9
Sources: UNESCO Institute for Statistics through EdStats Data Query System (accessed in June 2006), UN-ESCO Statistical Yearbooks and Statistical Appendix, except for the following data: Algeria 1995: Ministry ofNational Education, Ministry of Finance, and National Office for Statistics through Banque Mondiale 2005;Egypt 1990: Ministry of Finance through World Bank 2002b; 1995–1999: Ministry of Finance, Egypt;Lebanon 1998: UNDP 2003.Yemen 1997–1999: Ministry of Finance.
Note: When data are not available in a given year, we used the year closest to that year. Averages are basedon data for more than four points, except for the following data: Bahrain 1995–2003: average of 1995, 1996,and 1997. Libya 1975–1984: average of 1975, 1980, and 1984. Syrian Arab Rep. 1995–2003: average of 1995,1996, and 1997.Yemen 1985–1994: average of 1993 and 1994.
01-Chap01-R1 12/5/07 3:16 PM Page 11

12 The Road Not Traveled
higher education.4 Despite this impressive progress, the average level ofeducation among the population is still lower in MENA than in the com-parator areas. Admittedly, the region started from a lower base than thatfound in the countries in East Asia and Latin America. But the fact re-mains that the average gross enrollment rate in secondary schools inMENA in 2003 was 75 percent, compared to 78 and 90 percent for EastAsia and Latin America, respectively. Similarly, the average gross enroll-
TABLE 1.2
Public Expenditure per Student by Level of Education and Ratio of Expenditure for
Secondary/Primary and Tertiary/Primary, 2000
(PPP Constant 2000 International $a)
Tertiary
Primary Primary Secondary Secondary/ spending/ Tertiary/
spending/pupil spending/ spending/ primary student secondary
1980 pupil 2002 pupil 2002 2002 2002 2002
Algeria 493 628 952 1.52 — —
Bahrain — 2,620 2,931 1.12 — —
Iran, Islamic Rep. of 793 738 770 1.04 2,135 2.77
Jordan — 596 705 1.18 — —
Kuwait 2,935 2,709 3,336 1.23 — —
Morocco 436 714 1,831 2.56 3,442 1.88
Oman — 1,766 2,765 1.57 7,248 2.62
Saudi Arabia 4,278 3,817 3,749 0.98 — —
Syrian Arab. Rep. 222 477 883 1.85 — —
Tunisia 482 1,000 1,530 1.53 4,065 2.66
Mean 1,377 1,506 1,945 1.46 4,222 2.48
Indonesia — 89 173 1.94 480 2.77
Korea, Rep. of 483 2,882 4,173 1.45 885 0.21
Malaysia 486 1,778 2,500 1.41 9,036 3.61
Philippines 241 446 368 0.83 582 1.58
Thailand 219 1,027 728 0.71 2,048 2.81
Mean 357 1,245 1,589 1.27 2,606 2.20
Argentina 745 1,164 1,593 1.37 1,393 0.87
Brazil 592 832 829 1.00 3,779 4.56
Chile 444 1,504 1,480 0.98 1,687 1.14
Colombia 259 1,077 1,106 1.03 1,881 1.70
Mexico 341 1,264 1,420 1.12 4,379 3.08
Peru 383 305 419 1.37 674 1.61
Uruguay 684 585 670 1.15 1,409 2.10
Mean 493 962 1074 1.15 2,172 2.15
Sources: 2003b, World Bank WDI central database (accessed in June 2006) and UNESCO Institute for Statistics Statistical Yearbooks.
Note: When data are not available in a given year, we used the year closest to that year.a. The international dollar is a hypothetical unit of currency that has the same purchasing power that the U.S. dollar has in the United States ata given point in time, i.e., it means the U.S. dollar converted at purchasing power parity (PPP) exchange rates.
01-Chap01-R1 12/5/07 3:16 PM Page 12
Investment in Education 13
ment rate in higher education in MENA was only 26.0 percent in 2003,which is about two-thirds of the average for the other two regions. Thesedifferences indicate that the level of human capital in MENA is still rel-atively low.
TABLE 1.3
Access to Primary School Education: Net Enrollment Rate, Repetition Rate, and Pupils
Reaching Grade Five, 1970–2003
(percent)
1970 1985 2003
NER Repetition Grade 5 NER Repetition Grade 5 NER Repetition Grade 5
Algeria 76.6 12.5 85.5 86.0 7.5 93.6 97.1 11.8 94.4
Bahrain 70.6 — — 96.2 8.6 86.5 96.8 3.2 99.9
Djibouti — 10.7 81.5 31.3 12.5 91.6 32.9 10.4 —
Egypt, Arab Rep. of 62.8 4.5 80.6 83.7 1.5 97.4 98.3 4.0 98.6
Iran, Islamic Rep. of 60.0 9.1 — 80.9 10.2 83.2 98.5 2.3 87.8
Iraq 55.4 20.6 73.7 93.1 20.8 84.0 87.7 8.0 —
Jordan 78.6 4.1 78.9 94.1 5.4 91.2 101.1 0.5 98.8
Kuwait 60.6 15.6 — 86.7 5.2 — 86.0 2.5 —
Lebanon — — — 77.8 — — 93.2 10.1 97.6
Libya 85.7 25.8 90.7 96.1 — — — — —
Morocco 39.1 29.8 65.8 60.7 19.8 68.9 92.0 13.8 75.6
Oman 27.1 9.3 74.0 66.4 11.7 93.5 77.9 0.8 97.6
Qatar 71.9 23.7 96.7 91.1 10.7 98.8 89.8 — —
Saudi Arabia 32.4 15.2 82.6 50.9 12.4 93.3 53.1 4.2 93.6
Syrian Arab Rep. 69.5 10.9 88.9 94.7 7.5 95.5 98.1 7.5 —
Tunisia 75.6 29.2 67.8 93.1 20.4 86.6 97.2 9.2 96.5
United Arab Emirates — 15.2 99.7 76.5 5.7 87.9 71.2 2.2 94.7
West Bank and Gaza — — — — — — 86.3 0.2 —
Yemen, Rep. of — — — 51.7 — — 66.8 5.5 67.3
Mean 61.8 15.8 82.0 78.4 10.7 89.4 84.7 5.6 91.9
China — 10.0 — 97.4 6.1 86.0 95.0 0.3 99.9
Indonesia 72.4 10.7 59.7 97.2 10.9 84.6 94.3 2.9 92.1
Korea, Rep. of 94.5 0.1 96.3 94.5 99.2 99.6 0.2 99.9
Malaysia 88.1 0.0 — 93.7 0.0 98.2 93.2 0.0 98.4
Philippine 96.6 2.4 77.0 96.2 1.8 78.9 94.0 2.2 75.3
Thailand — 10.3 48.7 75.9 8.3 — 85.8 4.0 —
Mean 66.6 5.6 70.4 92.5 5.4 89.4 93.6 1.6 93.1
Argentina 94.8 11.3 75.2 — — — 98.8 6.4 84.3
Brazil 69.8 19.2 27.6 81.2 19.8 37.0 92.9 20.6 —
Chile 90.2 10.4 81.7 87.7 — — 86.0 2.4 99.0
Mexico 82.6 11.1 68.0 99.6 9.9 76.8 97.8 4.8 92.6
Peru 77.7 17.0 71.0 95.9 14.1 76.0 97.1 7.6 89.7
Mean 83.0 13.8 64.8 91.1 14.6 63.2 94.5 8.4 91.4
Sources: Statistical Appendix and UNESCO Institute for Statistics through World Bank EdStats Data Query System (accessed in June 2006).
Note: When data are not available for a given year, we used data for the year closest to that year. Djibouti: repetition rate in 2003 is only for pub-lic schools. West Bank and Gaza: net enrollment rate (NER) is for basic education (from grades 1 to 10).
01-Chap01-R1 12/5/07 3:16 PM Page 13

14 The Road Not Traveled
Moreover, there seems to be a big difference in the path taken by theMENA region in expanding the average level of education among thepopulation compared with the approaches used in East Asia and LatinAmerica. In MENA, expansion was not always through progressive uni-versalization of primary schooling, followed by secondary and thenhigher education. Nor was it often in response to growing demand andthe emergence of new and dynamic sectors. In the Arab Republic ofEgypt, for example, the expansion of secondary and higher educationwas ahead of full enrollment at the lower levels of education. In the ma-jority of MENA countries, expansion took place without a correspon-ding increase in new job opportunities in the more dynamic sectors ofthe economy.
The combination of free education at the secondary and higher levelsand a policy of guaranteed employment in the public sector has had neg-ative side effects: a demand for higher education that does not corre-spond to real economic needs and a lowering of demand for technical ed-ucation because of the nontechnical nature of guaranteed jobs ingovernment.
In contrast to the pattern of expansion observed in the MENA region,the growth of secondary and especially higher education in East Asia, ex-cept for the Philippines, has primarily been in response to new and dy-namic industrial-sector needs in terms of skilled labor. For example, inChina, since 2001, university enrollment has been expanded to nearly 20percent of the age cohort, following a long period of high growth. Sim-ilarly, the Republic of Korea’s higher education system did not begin togrow until after almost 15 years of rapid economic growth, and it wasmainly supported with private funding.
In Latin America, the expansion of education has had some connec-tion to the demand for labor. In the 1980s, secondary and higher educa-tion expanded rapidly, despite the debt crisis, economic recession, andrelatively high unemployment. Enrollment at both levels continued toincrease in the 1990s, a period of much higher growth. Within LatinAmerica, the expansion of secondary and higher education was in re-sponse to demand in Brazil, Chile, Colombia, and Mexico, but was farahead of economic needs in other countries, such as Peru. In fact, inBrazil and Mexico, university expansion seems to be lagging behind eco-nomic needs (Carnoy 2001).
Years of Schooling in the Adult Population
Increased enrollment is expected to increase the average years of school-ing over time. By this measure, which is frequently used in growth re-gressions as a proxy for investment in human capital, the data show that
01-Chap01-R1 12/5/07 3:16 PM Page 14

Investment in Education 15
between 1960 and 2000, the average number of years of education in theadult population (15 years old and over) in the MENA region grew morerapidly than in other regions of the world (see table 1.5). However, by2000, the region averaged 5.4 years of school attainment, compared to7.3 and 7.2 years for East Asia and Latin America, respectively. The main
Sources: Statistical Appendix and UNESCO Institute for Statistics through World Bank EdStats Data Query System (accessed in June 2006).
Note: When data are not available for a given year, we used the year closest to that year. Libya: Secondary and tertiary gross enrollment rates(GERs) in 2003 are from 2002.United Arab Emirates:Tertiary 2003 data are from 2002.Qatar:Tertiary 1970 data are from 1975.Brazil:Tertiary 1985data are from 1990.
TABLE 1.4
Gross Enrollment Rates in Secondary and Tertiary Education, 1970–2003
(percent)
1970 1985 2003
Secondary Tertiary Secondary Tertiary Secondary Tertiary
Algeria 11.2 1.8 51.4 7.9 80.7 19.6
Bahrain 51.3 1.4 97.2 12.8 98.8 34.4
Djibouti 6.6 — 11.7 — 21.5 1.6
Egypt, Arab Rep. of 28.4 6.9 61.4 18.1 87.1 32.6
Iran, Islamic Rep. of 27.1 2.9 45.0 4.6 81.9 22.5
Iraq 24.4 4.8 53.8 11.5 42.0 15.4
Jordan 32.8 2.1 52.2 13.1 87.4 39.3
Kuwait 63.5 4.0 90.9 16.6 89.9 22.3
Lebanon 41.5 21.0 60.6 27.8 88.7 47.6
Libya 20.8 2.9 58.8 9.2 103.9 56.2
Morocco 12.6 1.4 35.4 8.7 47.6 10.6
Oman 0 — 26.5 0.8 86.4 12.9
Qatar 36.3 4.5 82.3 20.7 96.8 19.1
Saudi Arabia 12.1 1.6 40.1 10.6 67.8 27.7
Syrian Arab. Rep. 38.1 8.3 58.2 17.1 63.2 —
Tunisia 22.7 2.6 38.9 5.5 81.3 28.6
United Arab Emirates 21.8 — 54.7 6.8 66.5 22.5
West Bank and Gaza — — — — 93.6 37.9
Yemen, Rep. of — — — — 45.9 13.2
Mean 26.5 4.7 54.1 12.0 75.3 25.8
China 24.3 0.1 39.7 2.9 72.5 19.1
Indonesia 16.1 2.5 41.3 — 64.1 16.7
Korea, Rep. of 41.6 7.4 91.7 34.1 90.9 88.5
Malaysia 34.2 — 53.0 5.9 75.8 32.4
Philippines 45.8 16.8 64.4 24.9 85.9 28.8
Thailand 17.4 3.1 30.5 19.0 77.3 41.0
Mean 29.9 6.0 53.4 17.3 77.8 37.7
Argentina 44.4 13.4 70.2 35.7 86.4 63.9
Brazil 25.9 4.7 35.4 11.3 102.0 22.3
Chile 37.4 9.1 66.9 15.6 89.2 43.0
Mexico 22.5 5.4 56.5 15.9 79.7 23.4
Peru 30.7 10.5 62.8 22.4 91.7 33.4
Mean 32.2 8.6 58.4 20.2 89.8 37.2
01-Chap01-R1 12/5/07 3:16 PM Page 15

16 The Road Not Traveled
problem for MENA countries, then, is not the growth of the averageyears of schooling; rather, it is the extremely low initial level of educationin most countries in the 1960s and 1970s.
Thus, in 1960, Jordan’s adult population had an average of only 2.33years of schooling, which is lower than the level in every East Asian and
TABLE 1.5
Average Years of Schooling of the Total Population Aged 15 and
Over, 1960–2000
1960 1980 2000
Algeria 0.98 2.68 5.37
Bahrain 1.04 3.62 6.11
Djibouti — — —
Egypt, Arab Rep. of — 2.34 5.51
Iran, Islamic Rep. of 0.80 2.82 5.31
Iraq 0.29 2.66 3.95
Jordan 2.33 4.28 6.91
Kuwait 2.89 4.53 7.05
Lebanon — — —
Libya 0.97 3.87 —
Morocco — — —
Oman — — —
Qatar — — —
Saudi Arabia — — —
Syrian Arab. Rep. 1.35 3.65 5.77
Tunisia 0.61 2.94 5.02
United Arab Emirates — 2.87 —
West Bank and Gaza — — —
Yemen, Rep. of — 0.34 2.91
Mean 1.25 3.05 5.39
Korea, Rep. of 4.25 7.91 10.84
Indonesia 1.55 3.67 4.99
Malaysia 2.88 5.09 6.80
Thailand 4.30 4.43 6.50
Philippine 4.24 6.51 8.21
China — 4.76 6.35
Mean 3.44 5.40 7.28
Argentina 5.25 7.03 8.83
Brazil 2.85 3.11 4.88
Chile 5.21 6.42 7.55
Mexico 2.76 4.77 7.23
Peru 3.30 6.11 7.58
Mean 3.87 5.49 7.21
Sources: Statistical Appendix and Barro-Lee 2000.
Note: When data are not available in a given year, we used the year closest to that year. Libya: AYS in 1960are from 1965, and 1980 from 1985. United Arab Emirates: AYS in 1980 are from 1975. Yemen: AYS in 2000are from 1999. AYS in 1980 for Yemen are for Yemen, N. Arab.
01-Chap01-R1 12/5/07 3:16 PM Page 16
Investment in Education 17
Latin American country on our list except Indonesia. By 2000, Jordan’spopulation had higher average education levels (6.91 years) than In-donesia, Malaysia, Thailand, China, and Brazil—most of which hadstarted in 1960 with higher levels of education than Jordan. The gap be-tween other MENA countries for which we have data and East Asia andLatin America has also been reduced. Even so, the average level of edu-cation in MENA in 2000 is still less than it is in East Asia and LatinAmerica by more than one full year.
The number of years of schooling is a popular but inaccurate measureof human capital investment, however, because it assumes that the qual-ity of each year of schooling in each country is the same. It assumes thatmost countries teach approximately the same academic skills in variousgrades of primary, lower secondary, and upper secondary schools. Theseassumptions clearly do not hold, and need to be corrected by one meas-ure of quality or another; this is the subject we turn to next.
Investment in Education and the Quality of Human Capital
Measuring the quality of education is illusive, and can only be approxi-mated by using different indicators. In this section, three such indicatorsare used: scores on international tests, fields of study in higher education,and literacy rates. Imperfect as these indicators may be, they provide a rea-sonable “weight” that can be attached to the number of years of schoolingin the labor force as an improved measure of human capital investment.
Quality of Secondary Education
A large number of countries in the MENA region, in East Asia, and inLatin America have now participated in one or more international testsof eighth graders (Trends in International Math and Science Study—TIMSS) or 15-year-olds (Programme for International Student Assess-ment—PISA). The results on these tests capture the relative amount oflanguage and math learned by those who are reaching the end of lowersecondary school.
Table 1.6 shows the average math scores for 21 countries in theMENA, East Asian, and Latin American regions.5 The results indicatethat the average of 401 for the MENA region is modestly below that ofLatin American countries (406) but significantly below that of East Asia(466). More broadly, the MENA region scores below the internationalaverage of 489,6 let alone the top performing country, Singapore, whoseaverage score for TIMSS 1995, 1999, and 2003 is 617.
01-Chap01-R1 12/5/07 3:16 PM Page 17

18 The Road Not Traveled
Within the region, the Islamic Republic of Iran, Lebanon, and Jordanscore above the regional average, while Saudi Arabia and Morocco arebelow the average.
Usually, test scores are adjusted by GDP per capita and gross enroll-ment rates in secondary schools to take into account the possible effectof higher social class on student performance. Higher GDP/capita istypically associated with a higher average level of family education andresources, and lower gross enrollment rates in secondary school indicatethat the education system is more elitist and selective, thus probably con-tributing to higher test scores. Thus, we would expect to find a positiverelationship between test scores and GDP/capita and a negative rela-tionship between test scores and gross enrollment rates.
We estimate such an equation, using the indicators provided in table1.6 and leaving out the three Gulf States (Bahrain, Kuwait, and SaudiArabia) because their very high GDP per capita and low scores are notrepresentative of the typical relationship between these two variables.The estimated equation is as follows:
Test score = 351.44+ 0.0116 GDP/cap –0.1163 GrossSecEnr +ε; R2 = 0.47(1)
(3.78) (–0.15)
The figures in parentheses are the t-values, showing that the esti-mated coefficient for GDP/capita is significant at the 1 percent level, andthe coefficient for gross secondary enrollment is not significantly differ-ent from zero, although it has the expected negative sign.
Using this equation, we can predict the test score each country shouldhave if the students do as well as those in other countries of the worldthat have the same GDP/capita and gross secondary enrollment rates.Table 1.7 ranks the 18 countries in our sample by test score, then usesequation (1) to estimate the predicted value of the test score based on thecountry’s values of the two independent variables. The difference be-tween the actual and the predicted value is the “residual,” or the unex-plained part of the test score. A positive residual indicates that studentsin that country do better than GDP/capita and gross enrollment wouldpredict; a negative score indicates the opposite.
It is interesting to note that when we adjust for their GDP/capita andgross secondary enrollment rates, Jordan, Lebanon, and Egypt movedown the rank order relative to their rank order in the absolute score.Morocco moves up the rank order. Iran and Tunisia remain essentially atabout the level predicted. If the test scores reflect the quality of educa-tion systems, as opposed to some other socioeconomic variables we havenot accounted for, this implies that MENA’s education systems may be
01-Chap01-R1 12/5/07 3:16 PM Page 18

Investment in Education 19
functioning satisfactorily in some countries given their level of economicdevelopment, whereas those in other countries fall below this average. Inthat sense, at the lower secondary level at least, the quality of human cap-ital in some of the MENA countries may also be acceptable.
If we include the three Gulf States for which we have test score data—Bahrain, Kuwait, and Saudi Arabia—this picture changes. The estimatedregression line of test scores on GDP/capita and gross secondary enroll-ment is essentially flat, and the coefficients of GDP/capita and gross sec-ondary enrollment are not significantly different from zero. One reason
TABLE 1.6
Average Test Scores of TIMSS and PISA, GDP/Capita (2003), and Gross Secondary
Enrollment Rate
(percent, 2000)
Approximate average GDP/capita Secondary gross
Test taken test score 2003 enrollment 2000
Bahrain TIMSS 2003 401 17,212 96
Egypt, Arab Rep. of TIMSS 2003 406 3,731 86
Iran, Islamic Rep. of TIMSS 95/99/03 420 6,608 77
Jordan TIMSS 99/03 426 4,081 87
Kuwait TIMSS 95 392 17,049 89
Lebanon TIMSS 03 433 4,793 80
Morocco TIMSS 99/03 362 3,783 40
Saudi Arabia TIMSS 2003 332 12,495 72
Tunisia TIMSS 99/03, PISA 03 420 6,765 77
Mean 399 8,502 78
Indonesia TIMSS 99/03, PISA 2000/03 409 3,175 57
Korea, Rep. of TIMSS 95/99/03, PISA 2000/03 574 16,977 94
Malaysia TIMSS 99/03 514 8,986 70
Philippines TIMSS 99/03 362 4,082 77
Thailand TIMSS 95/99, PISA 2900/03 478 7,175 82
Mean 467 8,079 76
Argentina PISA 2000 430 11,436 97
Brazil PISA 2000/03 398 7,360 108
Chile TIMSS 99/03, PISA 2000 404 9,706 75
Colombia TIMSS 95 385 6,331 70
Mexico PISA 2000/03 429 8,661 75
Peru PISA 2000 358 4,969 81
Uruguay PISA 03 453 7,822 98
Mean 408 8,041 86.3
International average TIMSS 95/99/03 489
Top performing countries TIMSS 95/99/03 617
Sources: TIMSS: http://timss.bc.edu/. PISA: ttp://www.pisa.oecd.org. GDP per capita PPP (constant 2000 international $): World Bank 2005. Sec-ondary Gross Enrollment Rate: Statistical Appendix.
Note: TIMSS is conducted by IEA (International Association for the Evaluation of Educational Achievement). PISA is conducted by OECD (Or-ganisation for Economic Co-operation and Development).
01-Chap01-R1 12/5/07 3:16 PM Page 19

20 The Road Not Traveled
for this is that the very high GDP/capita in the three oil states reflectswealth per inhabitant, but it is not the kind of wealth based on higher ed-ucation and social capital associated with children’s higher academic per-formance in school. Even after a generation of high income from petro-leum exports, apparently the academic level in these countries remains low.
Field of Study by Higher Education Students
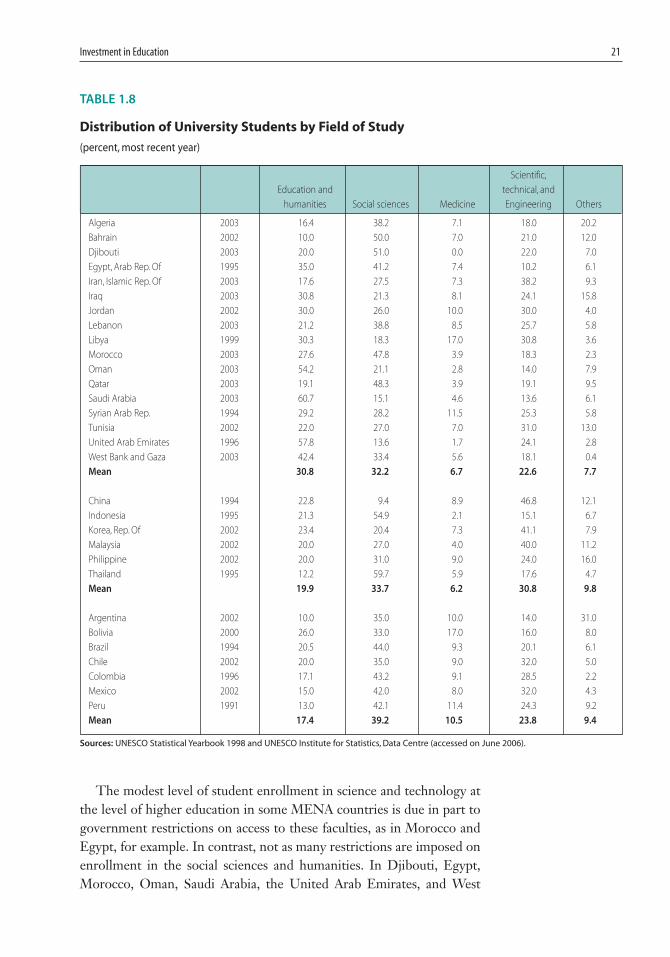
The proportion of enrollment in university in science and engineeringversus humanities and social sciences could be viewed as another indexof the “quality” of human capital at the level of higher education. Theunderlying assumption here is that scientists and engineers are likely tocontribute more to economic growth than are social scientists and stu-dents of humanity because of the increasing importance of technologicalinnovation and adaptation in the development process.7 If this assump-tion holds, it is instructive to look at the data in table 1.8, which indicatethat MENA countries have a high percentage of their university studentsstudying humanities and social sciences. In more than half of the MENAcountries, about two-thirds of the students major in those fields. Thispattern of enrollment is the opposite of what we observe in East Asiaand, to a lesser extent, in Latin America.
TABLE 1.7
Test Scores of TIMSS and PISA Unadjusted, and Adjusted for GDP/Capita Ordered by
Residuals
Predicted
Test score test scorea Residual
Korea, Rep. of 574 Malaysia 448 66
Malaysia 514 Thailand 425 53
Thailand 478 Korea, Rep. of 537 37
Uruguay 453 Jordan 389 37
Lebanon 433 Lebanon 398 35
Argentina 430 Indonesia 382 27
Mexico 429 Uruguay 431 22
Jordan 426 Egypt, Arab Rep. of 385 21
Iran, Islamic Rep. of 420 Iran, Islamic Rep. of 419 1
Tunisia 420 Tunisia 421 �1
Indonesia 409 Mexico 443 �14
Egypt, Arab Rep. of 406 Brazil 424 �26
Chile 404 Philippines 390 �28
Brazil 398 Morocco 391 �29
Colombia 385 Colombia 417 �32
Morocco 362 Peru 400 �42
Philippines 362 Argentina 473 �43
Peru 358 Chile 455 �51
Note: Based on regression estimate of test score run on GDP/capita in 2003 and gross secondary enrollment rate, 2000.
01-Chap01-R1 12/5/07 3:16 PM Page 20
Investment in Education 21
The modest level of student enrollment in science and technology atthe level of higher education in some MENA countries is due in part togovernment restrictions on access to these faculties, as in Morocco andEgypt, for example. In contrast, not as many restrictions are imposed onenrollment in the social sciences and humanities. In Djibouti, Egypt,Morocco, Oman, Saudi Arabia, the United Arab Emirates, and West
TABLE 1.8
Distribution of University Students by Field of Study
(percent, most recent year)
Scientific,
Education and technical, and
humanities Social sciences Medicine Engineering Others
Algeria 2003 16.4 38.2 7.1 18.0 20.2
Bahrain 2002 10.0 50.0 7.0 21.0 12.0
Djibouti 2003 20.0 51.0 0.0 22.0 7.0
Egypt, Arab Rep. Of 1995 35.0 41.2 7.4 10.2 6.1
Iran, Islamic Rep. Of 2003 17.6 27.5 7.3 38.2 9.3
Iraq 2003 30.8 21.3 8.1 24.1 15.8
Jordan 2002 30.0 26.0 10.0 30.0 4.0
Lebanon 2003 21.2 38.8 8.5 25.7 5.8
Libya 1999 30.3 18.3 17.0 30.8 3.6
Morocco 2003 27.6 47.8 3.9 18.3 2.3
Oman 2003 54.2 21.1 2.8 14.0 7.9
Qatar 2003 19.1 48.3 3.9 19.1 9.5
Saudi Arabia 2003 60.7 15.1 4.6 13.6 6.1
Syrian Arab Rep. 1994 29.2 28.2 11.5 25.3 5.8
Tunisia 2002 22.0 27.0 7.0 31.0 13.0
United Arab Emirates 1996 57.8 13.6 1.7 24.1 2.8
West Bank and Gaza 2003 42.4 33.4 5.6 18.1 0.4
Mean 30.8 32.2 6.7 22.6 7.7
China 1994 22.8 9.4 8.9 46.8 12.1
Indonesia 1995 21.3 54.9 2.1 15.1 6.7
Korea, Rep. Of 2002 23.4 20.4 7.3 41.1 7.9
Malaysia 2002 20.0 27.0 4.0 40.0 11.2
Philippine 2002 20.0 31.0 9.0 24.0 16.0
Thailand 1995 12.2 59.7 5.9 17.6 4.7
Mean 19.9 33.7 6.2 30.8 9.8
Argentina 2002 10.0 35.0 10.0 14.0 31.0
Bolivia 2000 26.0 33.0 17.0 16.0 8.0
Brazil 1994 20.5 44.0 9.3 20.1 6.1
Chile 2002 20.0 35.0 9.0 32.0 5.0
Colombia 1996 17.1 43.2 9.1 28.5 2.2
Mexico 2002 15.0 42.0 8.0 32.0 4.3
Peru 1991 13.0 42.1 11.4 24.3 9.2
Mean 17.4 39.2 10.5 23.8 9.4
Sources: UNESCO Statistical Yearbook 1998 and UNESCO Institute for Statistics, Data Centre (accessed on June 2006).
01-Chap01-R1 12/5/07 3:16 PM Page 21
22 The Road Not Traveled
Bank and Gaza, more than 70 percent of the students are in the human-ities and social sciences. This pattern of enrollment is historically con-sistent with a policy of absorbing most university graduates into civilservice jobs, but is ill suited to a development strategy that draws on pri-vate initiatives and dynamic manufacturing and service sectors.
Illiteracy Rates
A third dimension of the quality of human capital is literacy rates amongthe adult population. By this measure, table 1.9 indicates that, despite therapid growth of enrollment in primary schools in MENA in the past 20years, a high fraction of the adult population (one in five adults in 2003)is still illiterate. The level of illiteracy in the adult population, especiallyamong women, sharply distinguishes most MENA countries from mostLatin American and East Asian societies. In two countries—Moroccoand Yemen—about one-half the population remains illiterate. The totalnumber of illiterates in MENA countries (54 million) represents about1.5 percent of all the illiterate adults in the world. The 36 million illiter-ate women in MENA also represent about 2.2 percent of all illiteratewomen in the world.8
Female illiteracy has come down in the MENA region over time, andthe rate of change has been rapid and steady. However, given the largegaps that persist between MENA and other comparators, full conver-gence is still a long way off. Whereas average female illiteracy rates are 30percent for the MENA region, they are as low as 9 and 12 percent amongcomparator countries in Latin America and East Asia, respectively. As forthe literacy gap between men and women, there is clear evidence of rapidequalization over time. While the ratio of literate females to literate maleswas only 0.60 in 1980, it had risen to almost 0.83 by 2003. Once again,the rate of progress was faster in MENA than among its comparators.
Several factors account for the gender gap in the MENA region. Onefactor is social, as the enrollment of boys in schools was historically fa-vored over that of girls. Adult males may also have more learning oppor-tunities to become literate in the workplace. In addition, because womentend to live longer than men, at any given time there are more womenwho grew up in times of low school coverage in the oldest age cohorts.However, most of the MENA countries have significantly reduced theirilliteracy rate since 1980. This in turn has reduced the absolute differencebetween men and women from 26 percent to 15 percent. The problemof high female illiteracy will gradually be reduced in the MENA regionthanks to increasing universal primary education for girls. Nevertheless,Algeria, Egypt, Morocco, and Yemen still have a long way to go in reducing female illiteracy.
01-Chap01-R1 12/5/07 3:16 PM Page 22

Investment in Education 23
Investment in Education and the Distribution of Human Capital
While enrollment and quality of education may increase, access to edu-cation can remain limited to high-income groups, to those who live inurban areas, or to boys at the expense of girls. This would lead to un-
TABLE 1.9
Illiteracy Rates of the Population Aged 15 and over by Gender, 1980–2000/04
(percent)
Illiteracy rate 1980 Illiteracy rate 2003
Total Males Females Total Males Females
Algeria 63.4 50.5 75.5 30.1 20.4 39.9
Bahrain 28.8 21.6 40.7 13.5 11.5 16.4
Djibouti — — — — — —
Egypt, Arab Rep. of 60.7 46.3 75.3 28.6 17.0 40.6
Iran, Islamic Rep. of 50.3 39.1 61.8 23.0 16.5 29.6
Iraq — — — 26.0 15.9 35.8
Jordan 30.8 17.8 44.6 9.7 4.9 15.3
Kuwait 32.2 27.0 40.6 6.7 5.6 9.0
Lebanon — — — — — —
Libya 47.3 28.8 69.5 18.3 8.2 29.3
Morocco 71.4 57.9 84.5 47.7 34.3 60.4
Oman 63.8 48.6 83.7 18.7 13.2 26.5
Qatar 30.2 28.2 34.6 11.0 10.9 11.4
Saudi Arabia 49.2 35.0 67.7 20.7 12.9 30.7
Syrian Arab Rep. 46.7 27.8 66.2 20.4 14.0 26.4
Tunisia 55.1 41.6 68.8 25.7 16.6 34.7
United Arab Emirates 34.6 32.6 41.0 22.7 24.4 19.3
West Bank and Gaza — — — 8.1 3.3 12.6
Yemen, Rep. of 80.0 61.8 94.5 51.0 30.5 71.5
Mean 49.6 37.6 63.7 22.5 15.3 30.0
China 32.9 21.0 45.7 9.1 4.9 13.5
Indonesia 31.0 20.9 40.6 9.6 6.0 13.2
Korea, Rep. of — — — — —
Malaysia 28.8 20.0 37.7 11.3 8.0 14.7
Philippines 12.2 11.2 13.2 7.4 7.5 7.4
Thailand 12.5 7.5 17.4 7.4 5.1 9.5
Mean 23.5 16.1 30.9 9.0 6.3 11.6
Argentina 5.6 5.3 6.0 2.8 2.8 2.8
Brazil 24.0 22.0 25.9 11.4 11.6 11.2
Chile 8.6 7.7 9.5 4.3 4.2 4.4
Mexico 18.7 13.7 23.5 9.1 7.6 10.4
Peru 20.6 11.7 29.4 12.3 6.5 17.9
Mean 15.5 12.1 18.9 8.0 6.5 9.3
Source: Statistical Appendix and UNESCO Institute of Statistics (through WB EdStats).
Note: When data were not available for a given year, the data for a year close to that year were used.
01-Chap01-R1 12/5/07 3:16 PM Page 23

24 The Road Not Traveled
equal distribution of human capital, eroding its potential as a mechanismfor reducing poverty and enhancing economic growth. The issue ad-dressed in this section is whether or not the region’s education strategiesfavored a more egalitarian distribution of human capital over time. Theanswer is ambiguous at best; inclusion policies may have diminished overtime while gender parity efforts proved effective.
Inclusion Policies
In addition to the high level of public spending and the expansion of en-rollment, wide access to education has been assured in most MENAcountries through a policy of free education for all that was enactedmostly in the 1950s and 1960s. This policy was generally applied at alllevels of education, from basic to tertiary. Education was considered bymany countries as a right; this was especially true in the Maghreb coun-tries, Egypt and Syria. As a result of these policies, the region hadachieved more equality in the distribution of education in 1970 than hadour sample of countries from East Asia and Latin America. As shown intable 1.10, the data indicate that the standard deviation from the mean ofyears of education in the adult population (15 years of age or older) wasonly 3.4 in the MENA region, whereas the corresponding standard de-viations for Latin America and East Asia were 3.64 and 3.77, respec-tively.9 Between 1985 and 2000, however, both the MENA and non-MENA countries exhibited rising standard deviations from the mean ofyears of schooling in the adult population. Yet this trend was so strong inthe MENA region that the average dispersion of education became moreskewed than in the other two regions.
Increasing education inequality in MENA is further supported by ad-ditional data on the percentage of enrollment by poor versus nonpoorand rural versus urban populations in primary and secondary educationfor a sample of countries. The data, shown in table 1.11, are derived fromhousehold surveys in the second half of the 1990s. These data are avail-able for only six MENA countries and over time only for Egypt and Mo-rocco. Nevertheless, they reveal that, despite good intentions, the non-poor and students who live in urban areas tend to have higher access toeducation at both levels than the poor and those who live in rural areas.The only exceptions are Algeria and Iran, where the data show almostequal access by both groups across geographical locations for primaryeducation.
Why did MENA countries move from a situation of somewhat equaldistribution of education to a situation in which distribution has becomemore skewed over time? The answer can be traced to a number of fac-tors, some of which are structural in nature while others are policy
01-Chap01-R1 12/5/07 3:16 PM Page 24

Investment in Education 25
driven. On the former front, standard deviations from the mean tend toincrease over time as countries expand their educational systems because,as the average level of education increases from low levels, dispersion in-creases. Subsequently, as the average level of education reaches intoupper secondary school, the dispersion levels off and eventually declinesas a ceiling effect (i.e., university graduate education) cuts off the upperend of the distribution. Because MENA countries started from a lowerlevel of school attainment and a more equitable distribution of educa-tional attainment than countries in other regions, such a trend was al-most inevitable. On the policy front, it has already been noted that theregion allocated higher expenditures per pupil in secondary relative tobasic education compared to East Asia and Latin America.
Some countries, like Egypt, also opted to expand secondary and higheducation before full enrollment in primary schools was completed, al-though this practice was an exception. Both policy decisions would have
TABLE 1.10
Distribution of Education, 1970–2000
(standard deviation from the average years of schooling of the population aged 15 and above)
1970 1975 1980 1985 1990 1995 2000
Algeria 3.11 3.46 3.89 4.38 4.78 4.95 5.03
Egypt, Arab Rep. of — 3.42 4.24 4.67 5.00 5.13 5.24
Iran, Islamic Rep. of 3.43 3.92 4.28 4.49 4.66 4.90 5.08
Jordan 4.14 4.37 4.93 5.21 5.35 5.37 5.41
Morocco — — — — — — —
Syrian Arab Rep. 3.23 3.84 4.32 4.65 4.80 4.76 4.77
Tunisia 3.09 3.93 4.34 4.65 4.82 5.01 5.15
Yemen, Rep. of — 0.90 1.55 2.55 3.29 — —
Mean 3.40 3.41 3.94 4.37 4.67 5.02 5.11
Korea, Rep. of 4.53 4.55 4.68 4.42 4.03 4.04 4.03
Malaysia 4.00 4.18 4.30 4.44 4.49 4.51 4.55
Philippines 3.81 3.83 3.94 3.93 3.78 3.84 3.71
Thailand 3.30 3.39 3.62 4.01 4.29 4.53 4.71
Indonesia 3.22 3.34 3.47 3.29 4.33 4.45 4.53
China — 4.43 4.36 4.37 4.36 4.36 4.34
Mean 3.77 3.95 4.06 4.08 4.21 4.29 4.31
Argentina 3.54 3.78 3.72 4.02 3.94 4.04 4.14
Brazil 3.55 3.22 3.41 3.56 3.65 3.73 3.87
Chile 4.04 4.15 4.35 4.43 4.56 4.76 4.90
Colombia 3.04 3.65 3.81 3.95 4.17 4.35 4.50
Mexico 3.67 3.80 4.40 4.51 4.62 4.65 4.64
Peru 4.04 4.07 4.41 4.48 4.58 4.67 4.74
Uruguay 3.98 3.86 4.00 4.05 4.26 4.40 4.53
Mean 3.69 3.79 4.01 4.14 4.25 4.37 4.47
Source: Thomas, Wang, and Fan 2001.
01-Chap01-R1 12/5/07 3:16 PM Page 25

26 The Road Not Traveled
provided more benefit to families in higher social classes than to those atthe bottom.
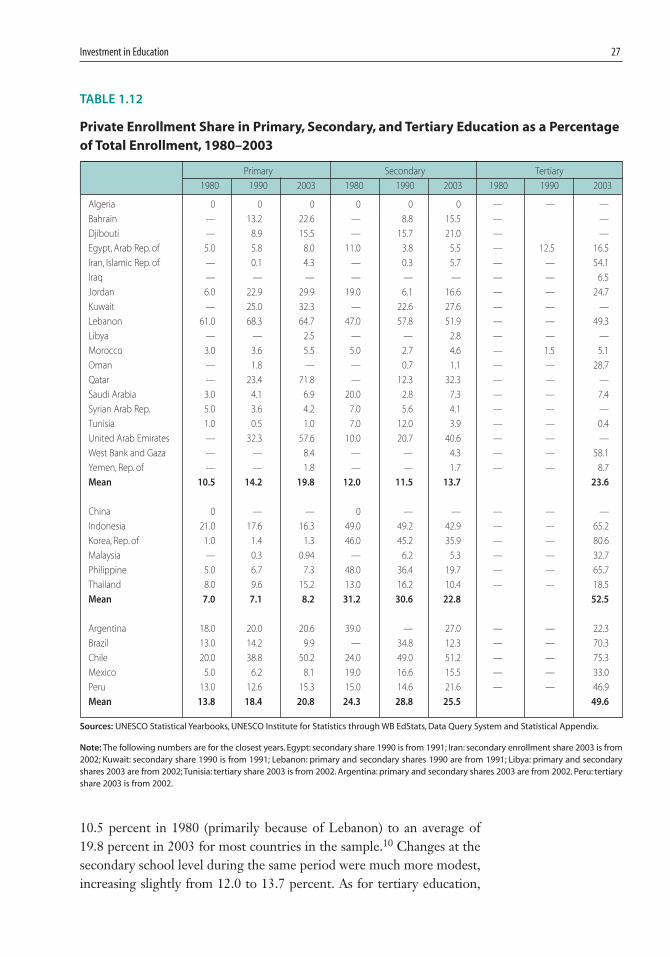
In addition to the factors described above, the region has increasinglyrelied on the private sector for the provision of education at different lev-els (table 1.12). While this trend may increase the inequity in the distri-bution of education, the outcome depends on the strategy adopted bygovernment, especially in terms of the level of education left to the pri-vate sector and the nature of public funding. A strategy that relies on theprivate sector for the provision of education at higher levels with govern-ment commitment to providing basic education is likely to be more egal-itarian than one that allows greater private sector involvement in basic ed-ucation relative to higher education. Similarly, a strategy that commitspublic funding to poor students, even if they enroll in private schools, islikely to be more egalitarian than one that leaves full funding to house-holds irrespective of their ability to pay. On both counts, the MENA re-gion’s strategy fares less well than the strategy adopted by the East Asiancountries and, to a lesser extent, by the Latin American countries.
More concretely, the information provided in table 1.12 indicates thatthe MENA countries have allowed greater private participation in theprovision of education at all levels over time, whereas other regions de-creased their share of private education enrollment in secondary educa-tion. For basic education, the average enrollment rate increased from
TABLE 1.11
Enrollment Rates for Poor and Nonpoor
(percent)
Urban Rural
Poor Nonpoor Poor Nonpoor
Algeria 1995 primary 96.0 95.0 89.0 89.0
secondary 77.0 82.0 59.0 66.0
Egypt, Arab Rep. of 1995 6–15 89.5 98.0 92.9 95.6
15–19 66.0 83.9 67.2 74.7
1999 6–15 95.8 98.5 93.5 96.7
15–19 72.4 84.9 64.7 72.9
Iran, Islamic Rep. of 2001 6–10 99.0 100.0 98.0 98.0
11–13 92.0 97.0 76.0 84.0
Morocco 1990 7–15 70.7 84.1 34.3 43.2
1998 7–15 69.4 87.2 36.4 49.8
Tunisia 2000 6–18 79.4 82.2 67.0 70.7
Yemen, Rep. of 1998 10–14 83.0 92.1 59.6 62.0
Sources: Algeria: LSMS (ENMNV), ONS, and staff estimates cited in World Bank 1999; Egypt: World Bank 2002a; Iran: SECH Survey 2001 throughWorld Bank 2006; Morocco: Statistical Office, 1990/91 and 1998/99 LSMS data through World Bank 2001; Tunisia: INS, based on HBCS 2000through World Bank 2003a.Yemen: estimates based on 1998 HBCS through World Bank 2002c.
Note: Algeria: using upper general poverty line. Morocco: using higher poverty lines (2674 DH in urban and 2384 DH in rural areas).Tunisia: poorand economically vulnerable.Yemen: for the 10–14 age group. Information for the 5–9 age group is not available.
01-Chap01-R1 12/5/07 3:16 PM Page 26
Investment in Education 27
10.5 percent in 1980 (primarily because of Lebanon) to an average of19.8 percent in 2003 for most countries in the sample.10 Changes at thesecondary school level during the same period were much more modest,increasing slightly from 12.0 to 13.7 percent. As for tertiary education,
TABLE 1.12
Private Enrollment Share in Primary, Secondary, and Tertiary Education as a Percentage
of Total Enrollment, 1980–2003
Primary Secondary Tertiary
1980 1990 2003 1980 1990 2003 1980 1990 2003
Algeria 0 0 0 0 0 0 — — —
Bahrain — 13.2 22.6 — 8.8 15.5 — —
Djibouti — 8.9 15.5 — 15.7 21.0 — —
Egypt, Arab Rep. of 5.0 5.8 8.0 11.0 3.8 5.5 — 12.5 16.5
Iran, Islamic Rep. of — 0.1 4.3 — 0.3 5.7 — — 54.1
Iraq — — — — — — — — 6.5
Jordan 6.0 22.9 29.9 19.0 6.1 16.6 — — 24.7
Kuwait — 25.0 32.3 — 22.6 27.6 — — —
Lebanon 61.0 68.3 64.7 47.0 57.8 51.9 — — 49.3
Libya — — 2.5 — — 2.8 — — —
Morocco 3.0 3.6 5.5 5.0 2.7 4.6 — 1.5 5.1
Oman — 1.8 — — 0.7 1.1 — — 28.7
Qatar — 23.4 71.8 — 12.3 32.3 — — —
Saudi Arabia 3.0 4.1 6.9 20.0 2.8 7.3 — — 7.4
Syrian Arab Rep. 5.0 3.6 4.2 7.0 5.6 4.1 — — —
Tunisia 1.0 0.5 1.0 7.0 12.0 3.9 — — 0.4
United Arab Emirates — 32.3 57.6 10.0 20.7 40.6 — — —
West Bank and Gaza — — 8.4 — — 4.3 — — 58.1
Yemen, Rep. of — — 1.8 — — 1.7 — — 8.7
Mean 10.5 14.2 19.8 12.0 11.5 13.7 23.6
China 0 — — 0 — — — — —
Indonesia 21.0 17.6 16.3 49.0 49.2 42.9 — — 65.2
Korea, Rep. of 1.0 1.4 1.3 46.0 45.2 35.9 — — 80.6
Malaysia — 0.3 0.94 — 6.2 5.3 — — 32.7
Philippine 5.0 6.7 7.3 48.0 36.4 19.7 — — 65.7
Thailand 8.0 9.6 15.2 13.0 16.2 10.4 — — 18.5
Mean 7.0 7.1 8.2 31.2 30.6 22.8 52.5
Argentina 18.0 20.0 20.6 39.0 — 27.0 — — 22.3
Brazil 13.0 14.2 9.9 — 34.8 12.3 — — 70.3
Chile 20.0 38.8 50.2 24.0 49.0 51.2 — — 75.3
Mexico 5.0 6.2 8.1 19.0 16.6 15.5 — — 33.0
Peru 13.0 12.6 15.3 15.0 14.6 21.6 — — 46.9
Mean 13.8 18.4 20.8 24.3 28.8 25.5 49.6
Sources: UNESCO Statistical Yearbooks, UNESCO Institute for Statistics through WB EdStats, Data Query System and Statistical Appendix.
Note: The following numbers are for the closest years. Egypt: secondary share 1990 is from 1991; Iran: secondary enrollment share 2003 is from2002; Kuwait: secondary share 1990 is from 1991; Lebanon: primary and secondary shares 1990 are from 1991; Libya: primary and secondaryshares 2003 are from 2002; Tunisia: tertiary share 2003 is from 2002. Argentina: primary and secondary shares 2003 are from 2002. Peru: tertiaryshare 2003 is from 2002.
01-Chap01-R1 12/5/07 3:16 PM Page 27

28 The Road Not Traveled
while the information is scant the available information suggests thatonly a few countries (Lebanon, Iran, and West Bank and Gaza) alloweda significant private sector involvement. A second main observation isthat the average rate of enrollment in private schools in MENA in 2003was higher at the basic level than it was in secondary education. In thesame year, enrollment in tertiary education was only modestly higher(about 24 percent) than the average enrollment rate in secondaryschools.
The above pattern stands in sharp contrast to that of East Asia and, toa lesser extent, Latin America. East Asia has essentially privatized higherlevels of schooling and left primary education almost entirely in the pub-lic hands. The pattern of enrollment in private schools in 2003 was 8.2percent in primary schools, 22.8 percent in secondary schools, and 52.5percent in higher education. Except in China and Malaysia, a significantfraction of the cost of higher education in East Asia is borne by families.A similar pattern holds for Latin America, although with lower publiccommitment to primary education than in East Asia. Thus, from bothregions, countries like Korea, China, Brazil, and Chile have significantlyprivatized their higher education systems, either by limiting space at freepublic universities so that expansion has to take place in fee-charging pri-vate universities (as in Korea and Brazil) or by charging high fees at pub-lic universities (as in Chile and China).11 In that sense, private educationis used as a strategy to mobilize private resources and also to sociallystratify educational access.
Gender Parity
Notwithstanding some growing inequality in the distribution ofhuman capital in general, as noted above, the MENA region has maderemarkable progress in the last 30 years with respect to closing the gen-der gap in education. Progress has been steady and rapid, covering alllevels of education. As shown in tables 1.13 and 1.14, gender parity forbasic education is almost complete. Although the region started with rel-atively low levels of gender parity, the parity indices for secondary andhigher education are not significantly different from the correspondingindices for Latin America and East Asia. The area where more progressis still needed is in relation to illiteracy, which remains significant amongthe female adult population, as discussed in the section on educationquality.
Progress has not been even across all counties, however. With respectto primary education, Djibouti and Yemen have yet to close the gendergap. At the level of secondary education, although few countries have at-tained full secondary enrollment, almost all have attained gender parity.
01-Chap01-R1 12/5/07 3:16 PM Page 28

Investment in Education 29
Only Djibouti, Iraq, Morocco, and Yemen still have significant second-ary education gender gaps. Furthermore, for Algeria, Bahrain, Jordan,Kuwait, Lebanon, Libya, Tunisia, the United Arab Emirates, and WestBank and Gaza, the gender gap at secondary levels is smaller than it is atprimary levels. Gender parity rates for higher education are even higher
TABLE 1.13
Gender Parity Index of Gross Intake Rate to Grade 1, Gross Enrollment Rate, and
Repetition Rate in Primary Education
(female as a proportion of male)
1970 1985 2003
GIR GER Repetition GIR GER Repetition GIR GER Repetition
Algeria — 0.62 — 0.87 0.81 0.69 0.98 0.93 0.63
Bahrain — 0.74 — 1.04 1.06 1.04 0.99 1.00 0.75
Djibouti 0.43 0.42 0.85 — 0.70 — 0.83 0.79 1.00
Egypt, Arab Rep. of 0.70 0.65 1.54 0.86 0.81 0.82 0.98 0.95 0.58
Iran, Islamic Rep. of 0.60 0.56 0.62 0.88 0.80 — 1.15 1.10 0.55
Iraq 0.46 0.43 1.07 0.94 0.85 0.85 0.94 0.82 0.72
Jordan — 0.82 — 1.01 1.01 — 1.01 1.01 0.94
Kuwait 0.82 0.76 0.96 0.98 0.97 0.98 0.99 1.01 0.82
Lebanon — 0.86 — — — — 0.99 0.96 0.71
Libya 0.85 0.62 0.95 — 0.92 — — 1.00 —
Morocco — 0.55 — — 0.64 0.87 0.95 0.90 0.74
Oman — 0.16 — 0.99 0.80 0.7 1.02 1.00 0.64
Qatar 0.92 0.85 0.99 1.06 0.97 0.61 1.00 0.98 —
Saudi Arabia — 0.47 — 0.85 0.78 0.58 1.00 0.96 0.66
Syrian Arab Rep. 0.73 0.62 0.85 0.93 0.88 0.82 0.97 0.95 0.79
Tunisia — 0.66 — 0.94 0.85 0.88 1.01 1.00 0.67
United Arab Emirates — 0.63 — 0.97 1.00 0.85 0.99 0.97 0.68
West Bank and Gaza — — — — — — 0.99 1.00 0.84
Yemen, Rep. of — — — — — — 0.77 0.73 0.83
Mean 0.69 0.61 0.98 0.95 0.86 0.81 0.97 0.95 0.74
China — — — — — — 0.98 1.00 0.76
Indonesia — 0.83 — — 0.86 — 0.96 0.98 1.00
Korea, Rep. of 1.00 0.99 0.88 1.02 0.94 — 1.00 0.99 —
Malaysia — 0.89 — 1.01 1.02 — 1.00 1.00 —
Philippines — — — 0.94 0.99 0.99 0.93 0.99 0.54
Thailand — 0.91 — — 0.99 — 0.93 0.96 1.03
Mean 0.90 0.99 0.96 0.97 0.99 0.83
Argentina 0.98 1.01 0.79 — 1.01 — 1.00 0.99 0.69
Brazil — 1.00 — — — — 0.92 0.94 0.96
Chile 1.00 1.00 0.83 — 0.97 — 0.98 0.95 0.62
Mexico — 0.94 — — 0.98 — 0.99 0.98 0.66
Peru 0.86 0.87 0.93 — 0.96 — 1.01 0.99 0.94
Mean 0.95 0.96 0.85 0.98 0.98 0.97 0.77
Sources: Statistical Appendix and UNESCO Institute of Statistics (through World Bank EdStats).
Note: Gross Intake Rate (GIR) to grade 1 is the total number of new entrants in the first grade of primary education, regardless of age, expressedas a percentage of the population of theoretical age to primary education.
01-Chap01-R1 12/5/07 3:16 PM Page 29

30 The Road Not Traveled
than they are for secondary education in most MENA countries. In fact,only in Djibouti, Iraq, and Yemen does the proportion of male studentssignificantly surpass that of females. In Algeria, Bahrain, Iran, Jordan,Kuwait, Lebanon, Libya, Oman, Qatar, Saudi Arabia, Tunisia, theUnited Arab Emirates, and West Bank and Gaza, female students out-number male students. Most countries achieved gender parity during the1990s.
TABLE 1.14
Gender Parity Index of Gross Enrollment Rate in Secondary and Tertiary Education
(female as a proportion of male)
1970 1985 2003
Secondary Tertiary Secondary Tertiary Secondary Tertiary
Algeria 0.41 0.25 0.74 0.47 1.07 1.08
Bahrain 0.72 1.29 0.99 1.70 1.06 1.84
Djibouti 0.37 — 0.62 — 0.69 0.82
Egypt, Arab Rep. of 0.49 0.37 0.70 0.46 0.93 —
Iran, Islamic Rep. of 0.51 0.35 0.66 0.4 0.94 1.11
Iraq 0.43 0.3 0.57 0.6 0.66 0.45
Jordan 0.57 0.49 1.08 0.93 1.02 1.10
Kuwait 0.81 1.16 0.91 1.16 1.06 2.72
Lebanon 0.68 0.32 0.98 — 1.09 1.12
Libya 0.23 0.13 0.94 — 1.06 1.09
Morocco 0.42 0.19 0.67 0.47 0.84 0.87
Oman — — 0.49 0.6 0.96 1.37
Qatar 0.72 — 1.10 2.63 0.97 2.86
Saudi Arabia 0.26 0.1 0.65 0.78 0.88 1.50
Syrian Arab Rep. 0.39 0.26 0.70 0.57 0.93 —
Tunisia 0.38 0.25 0.7 0.58 1.05 1.28
United Arab Emirates 0.32 — 1.00 1.96 1.06 3.24
West Bank and Gaza — — — — 1.05 1.04
Yemen, Rep. of — — — — 0.49 0.38
Mean 0.48 0.42 0.79 0.95 0.94 1.40
China 0.52 — 0.7 0.44 1.00 0.85
Indonesia 0.51 0.32 0.75 — 0.99 0.79
Korea, Rep. of 0.65 0.34 0.98 0.46 1.00 0.61
Malaysia 0.68 — 1.01 0.8 1.14 1.41
Philippines 0.94 1.28 1.02 — 1.11 1.28
Thailand 0.70 0.62 — — 1.00 1.17
Mean 0.67 0.64 0.89 0.57 1.04 1.02
Argentina 1.14 0.77 1.13 1.13 1.07 1.51
Brazil 1.03 0.61 — — 1.11 1.32
Chile 1.15 0.63 1.09 0.78 1.01 0.94
Mexico 0.64 0.26 0.95 0.61 1.07 0.97
Peru 0.77 0.54 0.90 — 1.01 1.07
Mean 0.95 0.56 1.02 0.84 1.05 1.16
Sources: Statistical Appendix and UNESCO Institute of Statistics (through World Bank EdStats).
01-Chap01-R1 12/5/07 3:16 PM Page 30

Investment in Education 31
Investment in Education and Noneconomic Outcomes
In addition to the immediate impact of investment in education onhuman capital accumulation, this investment also has the potential ofcontributing to lower fertility and infant mortality rates and longer lifeexpectancy. Such outcomes were observed in other developing counties,especially as education spread among females. Given that MENA coun-tries have also significantly improved their gender parity over the last fewdecades, we should observe similar trends in the region as well. The datapresented below support this prediction.
As shown in figure 1.1, MENA countries started from very high fer-tility and infant mortality rates and very low life expectancy in 1960 inrelation to our comparator countries from East Asia and Latin America.By 2004, the MENA region had caught up with the average life ex-pectancy of East Asia and Latin America and had brought infant mortal-ity rates to levels very close to those of these regions. While fertility ratesin MENA are still higher than in the other regions, the average numberof children per woman in the region declined from seven in 1960 tothree in 2004. Progress in MENA was remarkable; it outpaced the rateof progress elsewhere.
Within the region, however, significant variations remain. For exam-ple, Yemen, Djibouti, and Oman still have fertility rates of greater thanfour, compared with a fertility rate of two in Lebanon, Algeria, andKuwait. Similarly, life expectancy is only 53 years in Djibouti and 61years in Yemen, compared with 79 in Tunisia and 75 in Bahrain. Never-theless, in all of the MENA countries, these indicators have improvedover time.
Summing Up
The countries of the MENA region got off to a late start in investing inhuman capital through formal schooling, but once they began, they gen-erally spent a relatively high percentage of their GDP on education andraised the average level of schooling in their populations relatively rap-idly. At present, almost all countries in the region educate their boys andgirls at the primary level, and a significant percentage of the relevant agecohorts are engaged in secondary and tertiary education. Literacy rateshave been reduced significantly and some countries score relatively wellon international tests, especially when the level of income and gross en-rollment rates are taken into account. Moreover, most countries of theregion were able to achieve gender parity at almost all levels of educa-
01-Chap01-R1 12/5/07 3:16 PM Page 31

32 The Road Not Traveled
tion, and to improve fertility and infant mortality rates as well as life ex-pectancy.
Notwithstanding this impressive track record, the region lags behindEast Asia and to some extent Latin America in terms of the level, qual-ity, and even distribution of human capital. The average number of yearsof schooling in MENA is below both regions by more than one year.
FIGURE 1.1
Fertility and Mortality Rates and Life Expectancy, 1960–2004
2
3
4
5
6
7
1960 1970 1980 1990 2000 2004
0
50
100
150
200
250
1960 1970 1980 1990 2000 2004
45
50
55
60
65
70
75
80
1960 1970 1980 1990 2000 2004
MENA East Asia Latin America
a. Fertility rate, total (births per woman)
b. Mortality rate, under 5 (per 1,000 live births)
c. Life expectancy at birth (years)
Source: World Development Indicators 2005.
01-Chap01-R1 12/5/07 3:16 PM Page 32

Investment in Education 33
The rapid expansion of secondary and higher education was accommo-dated by employment in the public sector at relatively high wages ratherthan by increased demand for higher educated labor by a dynamic pri-vate sector. In addition, the pattern of public expenditure is biased infavor of students at higher levels of education compared with other re-gions, which reflects a bias in favor of the socially privileged class.
On the quality of human capital, literacy rates in the region are stilllow. The problem is especially acute in Yemen, Morocco, Algeria, andEgypt. In addition, because of the very low levels of initial enrollment ofwomen, female illiteracy is even higher. The lagging investment in theeducation of women may have kept fertility rates from falling as soonhistorically and as rapidly as in other regions of the world. The pictureis somewhat better when quality is assessed on the basis of the academicperformance of eighth- and ninth-grade students on international tests.The results rank Lebanon, Jordan, Iran, and Tunisia at the high end, andSaudi Arabia, Morocco, and Kuwait at the low end of the test scorerange. When adjusted to take into account GDP per capita and gross en-rollment rates, Lebanon and Jordan do as well as some of the higherscoring East Asian countries. Even then, however, the scores are muchlower in math than, for example, those in Korea or Malaysia. Thus, laborin the MENA region does not have the same human capital as Malaysiaor Korea.
As for the distribution of human capital, it has become worse overtime in MENA when education equality is measured by the standard de-viation of the years of schooling. Starting from a relatively equal distri-bution in the 1960s and 1970s, the standard deviation of the mean yearsof schooling is now higher in the region than it is in East Asia or LatinAmerica. Surely more and more children are enrolled in schools in theregion and the Gini coefficient is declining in MENA and elsewhere, aswill be discussed below, but the relative educational attainment betweenthem has widened. Meanwhile, the allocation of public expendituresseems to favor higher education, and the increasing reliance on the pri-vate sector is pursued without a clear strategy as to the level of educationleft to the private sector or as to how poor students may access privateschools.
These generalizations clearly do not apply equally to all countries inthe MENA region, which is rather heterogeneous in the degree to whichcountries have invested in human capital and in their investment strate-gies. Syria, for example, has invested much less in human capital than,say, Jordan. Morocco seems to spend much more on its secondary edu-cation students relative to primary education students than its neighborAlgeria. Given their very high average income per capita, the oil states,such as Bahrain, Kuwait, and Saudi Arabia, all seem to provide, on aver-
01-Chap01-R1 12/5/07 3:16 PM Page 33

34 The Road Not Traveled
age, lower quality education than most other MENA countries. Thesedifferences influence the role of human capital in achieving economicgrowth and the distribution of its benefits in each country. Nevertheless,the region on the whole also exhibits a number of similarities. These in-clude high levels of commitment to investment in education and genderparity, and frequently a policy of guaranteed employment in govern-ment. The question we take up next is how much past investments in ed-ucation have contributed to economic growth, better income distribu-tion, and lower poverty in the region.
Endnotes
1. Unfortunately, information on household expenditure on education overtime was not available for most MENA countries.
2. Typically, comparator countries are selected on the basis of a criterion suchas per capita income. However, this criterion is not appropriate for MENA coun-tries because they diverge widely in their per capita income. Thus, we opted fora stratified sample of countries from East Asia and Latin America because: (i)these countries seem to share some socioeconomic characteristics with the re-gion (apparently more than countries from SSA or East Europe do), and (ii) theyhave made some progress on reforming their education systems.
3. The data on secondary and higher education spending in table 1.2 have tobe interpreted with some care. The figures only represent the amount the publicsector spends on all students, which would underestimate spending per pupil incountries with significant unsubsidized private secondary education (including Ar-gentina, Brazil, Colombia, Indonesia, Korea, Lebanon, and Philippines) andhigher education (Brazil, Chile, Korea, Philippines). Also, it would not take intoconsideration significant private financial contribution to public university edu-cation (Chile).
4. Net enrollment data for secondary school and university are not reported bymost countries. Thus, the gross enrollment rates reported in table 1.4 have to beinterpreted with caution. They tend to overestimate the proportion of the agecohort attending secondary schools, because repetition rates are high and thereare many overage students at that level of instruction. The other problem withthese data is that enrollment rates in tertiary include nonuniversity, postsec-ondary education, which varies from country to country. For example, the pro-portion of students in university in Argentina in 2001 was about 35 percent, butthe total shown in table 1.4 for all post-secondary is 57 percent.
5. Four countries, all in Latin America, took only the PISA test. Eleven coun-tries took only the TIMSS (all of the countries in the MENA except Tunisia fellinto this category). In the cases where students only took one test, we used thatsingle score. In the cases where the country participated in various years on thesame test, we averaged the scores. To make the PISA score comparable to theTIMSS, we converted the 2000 PISA score to an estimated 1999 TIMSS scoreusing a formula estimated by regressing the 1999 TIMSS score on the 2000PISA in 17 countries that participated in both tests. We converted the 2003 PISAscore to a 2003 TIMSS score with another formula estimated by regressing
01-Chap01-R1 12/5/07 3:16 PM Page 34

Investment in Education 35
TIMSS 2003 on PISA 2003 for 22 countries that took both tests.The estimated equations are: TIMSS 1999 = 157.2 + 0.7165 PISA 2000 +ε,
and TIMSS 2003 = 111.8 + 0.8084 PISA 2003 + ε. The intercept term of theTIMSS 1999 equation is significant at the 5 percent level; all other coefficientsare significant at the 1 percent level.
In cases where a country participated in both tests, we converted the PISA testscore to TIMSS equivalents and averaged the scores.
6. The international average score here is the average of the international av-erage scores of TIMSS 1995, 1999, and 2003.
7. Murphy, Shleifer, and Vishny 1991 show that countries with a high propor-tion of scientific graduates have higher growth rates than do countries wheremost graduates come from the humanities.
8. UNESCO Institute for Statistics and Government Development Financeand World Development Indicators central database (accessed in 2006).
9. We also report the Gini coefficients of the number of years of schooling forthe same set of countries in table 2.7. As will be seen in chapter 2, the educationGini coefficients tend to decline from very high values in the MENA countriesbecause, initially, a high fraction of the population had zero years of education.Almost all other countries also exhibit declining Gini coefficients. Nevertheless,the average Gini for MENA countries between 1970 and 2000 was still greaterthan it was in other regions.10. Algeria (where the private sector is prohibited from providing education atany level) and Tunisia are clear exceptions. In addition, a number of MENAcountries (e.g., Syria, Morocco, and Egypt) exhibit a similar commitment to pri-mary education as the countries in East Asia.11. In Chile, although private education is highly subsidized through a vouchersystem, private contributions at the primary and secondary levels are significantand, at the tertiary level, represent 70 percent of total spending. Similarly, in Braziland Argentina, private contributions at primary and secondary levels are large. InBrazil, 72 percent of students in higher education attend private institutions.
References
Barro, Robert J., and Jong-Wha Lee. 2000. “International Data on Ed-ucational Attainment: Updates and Implications.” NBER WorkingPaper Series 7911, National Bureau of Economic Research, Cam-bridge, MA.
Carnoy, Martin. 2001. Sustaining Flexibility. Cambridge, MA: HarvardUniversity Press.
———. 2004. “Policy Brief on Literacy in the MENA Region.” Wash-ington, DC: USAID.
Ministry of Education, Yemen. 2002. School Census. Sanaa: Republic ofYemen.
01-Chap01-R1 12/5/07 3:16 PM Page 35

36 The Road Not Traveled
Murphy, Shleifer, and Vishny. 1991. “The Allocation of Talent: Implica-tion for Growth.” Quarterly Journal of Economics (106) 2: 503 –530.
Programme for International Student Assessment (PISA). PISA 2000Database. Paris: OECD.
———. 2003. PISA 2003 Database. Paris: OECD.
Thomas, Vinod, Yan Wang, and Xibo Fan. 2001. “Measuring EducationInequality: Gini Coefficients of Education.” Middle East and NorthAfrica Working Paper Series 2525, World Bank, Washington, DC.
UNDP. 2003. Human Development Report. New York: UNDP.
UNESCO Statistical Yearbook. 1990, 1995, 1998, 1999.
World Bank, 1999. Democratic and Popular Republic of AlgeriaGrowth, Employment and Poverty Reduction (In Two Volumes).Volume II: Annexes. Report No. 18564-AL.Washington, DC: WorldBank.
———. 2001. Kingdom of Morocco Poverty Update (In Two Volumes).Volume II: Annexes. Report No. 21506-MOR. Washington, DC:World Bank.
———. 2002a. Arab Republic of Egypt Education Sector Review:Progress and Priorities for the Future. Volume II: Statistical Annexes.Report No. 24905-EGT.
———. 2002b. Arab Republic of Egypt Poverty Reduction in Egypt Di-agnosis and Strategy (In Two Volumes) Volume II: Annexes. ReportNo. 24234-EGT. Washington, DC: World Bank.
———. 2002c. Republic of Yemen Poverty Update (In Two Volumes)Volume 1: Main Report. Report No. 24422-YEM. Washington, DC:World Bank.
———. 2003a. Republic of Tunisia Poverty Update (In Two Volumes)Volume I: Main Report. Washington, DC: World Bank.
———. 2003b. World Development Indicators. Washington, DC:World Bank.
01-Chap01-R1 12/5/07 3:16 PM Page 36

Investment in Education 37
———. 2005. World Development Indicators and World Development Indica-tors Online. Washington, DC: World Bank.
———. 2006. Islamic Republic of Iran Developing Education for theKnowledge Economy: Strategy for Achieving Universal Access andEquity in Basic Education. Washington, DC: World Bank.
01-Chap01-R1 12/5/07 3:16 PM Page 37

01-Chap01-R1 12/5/07 3:16 PM Page 38