Embed Size (px)
Citation preview
Atmos. Chem. Phys., 11, 4547–4556, 2011www.atmos-chem-phys.net/11/4547/2011/doi:10.5194/acp-11-4547-2011© Author(s) 2011. CC Attribution 3.0 License.
AtmosphericChemistry
and Physics
Influence of Galactic Cosmic Rays on atmospheric compositionand dynamics
M. Calisto1, I. Usoskin2, E. Rozanov1,3, and T. Peter1
1Institute for Atmospheric and Climate Science ETH, Zurich, Switzerland2Sodankyla Geophysical Observatory, University of Oulu, 90014 Oulu, Finland3Physical-Meteorological Observatory/World Radiation Center, Davos, Switzerland
Received: 26 November 2010 – Published in Atmos. Chem. Phys. Discuss.: 10 January 2011Revised: 25 April 2011 – Accepted: 27 April 2011 – Published: 13 May 2011
Abstract. This study investigates the influence of the Galac-tic Cosmic Rays (GCRs) on the atmospheric composition,temperature and dynamics by means of the 3-D ChemistryClimate Model (CCM) SOCOL v2.0. Ionization rates wereparameterized according to CRAC:CRII (Cosmic Ray in-duced Cascade: Application for Cosmic Ray Induced Ion-ization), a detailed state-of-the-art model describing the ef-fects of GCRs in the entire altitude range of the CCM from0–80 km. We find statistically significant effects of GCRs ontropospheric and stratospheric NOx, HOx, ozone, tempera-ture and zonal wind, whereas NOx, HOx and ozone are an-nually averaged and the temperature and the zonal wind aremonthly averaged. In the Southern Hemisphere, the modelsuggests the GCR-induced NOx increase to exceed 10 %in the tropopause region (peaking with 20 % at the pole),whereas HOx is showing a decrease of about 3 % caused byenhanced conversion into HNO3. As a consequence, ozone isincreasing by up to 3 % in the relatively unpolluted southerntroposphere, where its production is sensitive to additionalNOx from GCRs. Conversely, in the northern polar lowerstratosphere, GCRs are found to decrease O3 by up to 3 %,caused by the additional heterogeneous chlorine activationvia ClONO2 + HCl following GCR-induced production ofClONO2. There is an apparent GCR-induced acceleration ofthe zonal wind of up to 5 m s−1 in the Northern Hemispherebelow 40 km in February, and a deceleration at higher alti-tudes with peak values of 3 m s−1 around 70 km altitude. Themodel also indentifies GCR-induced changes in the surfaceair, with warming in the eastern part of Europe and in Rus-sia (up to 2.25 K for March values) and cooling in Siberia
Correspondence to:M. Calisto([email protected])
and Greenland (by almost 2 K). We show that these surfacetemperature changes develop even when the GCR-inducedionization is taken into account only above 18 km, suggest-ing that the stratospherically driven strengthening of the po-lar night jet extends all the way down to the Earth’s surface.
1 Introduction
Galactic cosmic rays (GCRs) are energetic particles (mostlyprotons andα-particles) which originate from outside of thesolar system. While their flux outside the solar system canbe regarded as roughly isotropic and time independent, atleast on the time scales studied here (Usoskin et al., 2004),the intensity of GCRs near the Earth varies as a result of themodulation inside the heliosphere, i.e. the spatial region ofabout 200 Earth-Sun distances controlled by the solar windand the solar magnetic field. Variations of the cosmic rayflux depend also on particle energy: the flux of less ener-getic (<1 GeV) particles varies by an order of magnitudemodulated by the solar cycle, while energetic GCRs (above100 GeV) are hardly modulated (Bazilevskaya et al., 2008).
When galactic cosmic rays enter the Earth’s atmospherethey collide with the ambient atmospheric gas molecules,thereby ionizing them. In this process they may produce sec-ondary particles, which can be sufficiently energetic to con-tribute themselves to further ionization of the neutral gases.This leads to the development of an ionization cascade (orshower). The intensity and penetration depth of the cascadedepends on the energy of the primary cosmic particles. Cas-cades of particles with several hundred MeV of kinetic en-ergy may reach the ground. However, due to their chargecosmic ray particles are additionally deflected by the geo-magnetic field. Almost all particles can penetrate into the
Published by Copernicus Publications on behalf of the European Geosciences Union.
4548 M. Calisto et al.: Influence of Galactic Cosmic Rays on atmospheric composition and dynamics
1
1
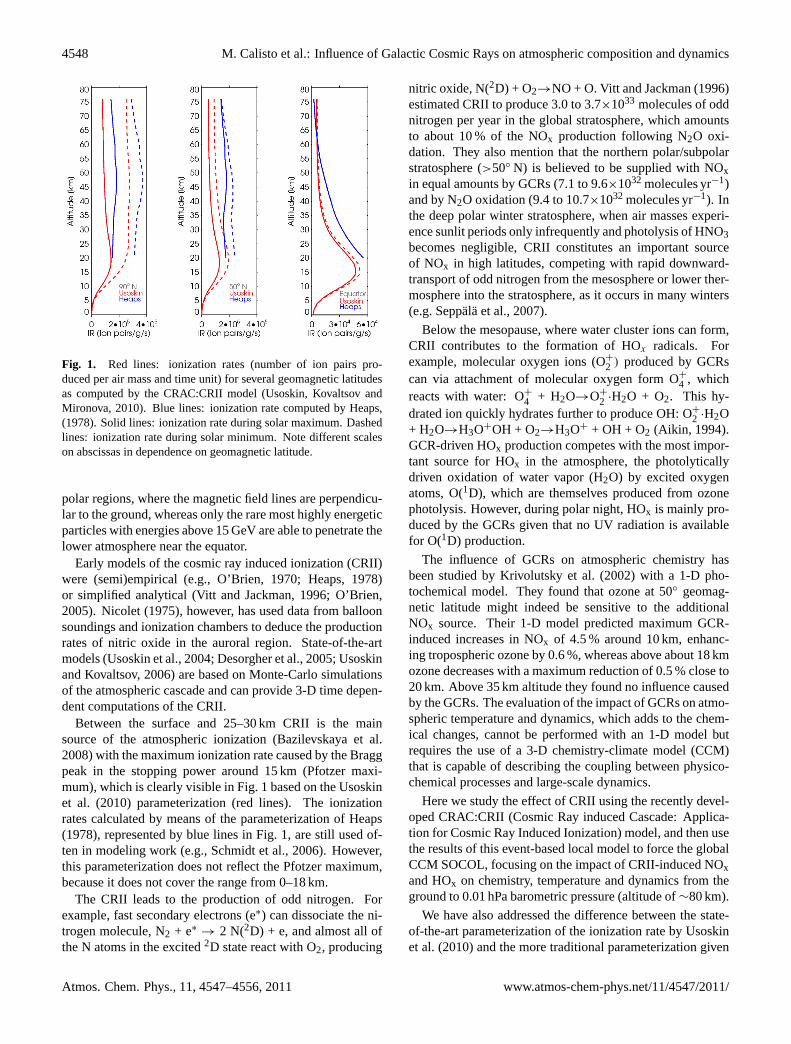
2 3 Fig. 1. Red lines: ionization rates (number of ion pairs pro-
duced per air mass and time unit) for several geomagnetic latitudesas computed by the CRAC:CRII model (Usoskin, Kovaltsov andMironova, 2010). Blue lines: ionization rate computed by Heaps,(1978). Solid lines: ionization rate during solar maximum. Dashedlines: ionization rate during solar minimum. Note different scaleson abscissas in dependence on geomagnetic latitude.
polar regions, where the magnetic field lines are perpendicu-lar to the ground, whereas only the rare most highly energeticparticles with energies above 15 GeV are able to penetrate thelower atmosphere near the equator.
Early models of the cosmic ray induced ionization (CRII)were (semi)empirical (e.g., O’Brien, 1970; Heaps, 1978)or simplified analytical (Vitt and Jackman, 1996; O’Brien,2005). Nicolet (1975), however, has used data from balloonsoundings and ionization chambers to deduce the productionrates of nitric oxide in the auroral region. State-of-the-artmodels (Usoskin et al., 2004; Desorgher et al., 2005; Usoskinand Kovaltsov, 2006) are based on Monte-Carlo simulationsof the atmospheric cascade and can provide 3-D time depen-dent computations of the CRII.
Between the surface and 25–30 km CRII is the mainsource of the atmospheric ionization (Bazilevskaya et al.2008) with the maximum ionization rate caused by the Braggpeak in the stopping power around 15 km (Pfotzer maxi-mum), which is clearly visible in Fig. 1 based on the Usoskinet al. (2010) parameterization (red lines). The ionizationrates calculated by means of the parameterization of Heaps(1978), represented by blue lines in Fig. 1, are still used of-ten in modeling work (e.g., Schmidt et al., 2006). However,this parameterization does not reflect the Pfotzer maximum,because it does not cover the range from 0–18 km.
The CRII leads to the production of odd nitrogen. Forexample, fast secondary electrons (e∗) can dissociate the ni-trogen molecule, N2 + e∗
→ 2 N(2D) + e, and almost all ofthe N atoms in the excited2D state react with O2, producing
nitric oxide, N(2D) + O2→NO + O. Vitt and Jackman (1996)estimated CRII to produce 3.0 to 3.7×1033 molecules of oddnitrogen per year in the global stratosphere, which amountsto about 10 % of the NOx production following N2O oxi-dation. They also mention that the northern polar/subpolarstratosphere (>50◦ N) is believed to be supplied with NOxin equal amounts by GCRs (7.1 to 9.6×1032 molecules yr−1)and by N2O oxidation (9.4 to 10.7×1032 molecules yr−1). Inthe deep polar winter stratosphere, when air masses experi-ence sunlit periods only infrequently and photolysis of HNO3becomes negligible, CRII constitutes an important sourceof NOx in high latitudes, competing with rapid downward-transport of odd nitrogen from the mesosphere or lower ther-mosphere into the stratosphere, as it occurs in many winters(e.g. Seppala et al., 2007).
Below the mesopause, where water cluster ions can form,CRII contributes to the formation of HOx radicals. Forexample, molecular oxygen ions (O+
2 ) produced by GCRscan via attachment of molecular oxygen form O+
4 , whichreacts with water: O+4 + H2O→O+
2 ·H2O + O2. This hy-drated ion quickly hydrates further to produce OH: O+
2 ·H2O+ H2O→H3O+OH + O2→H3O+ + OH + O2 (Aikin, 1994).GCR-driven HOx production competes with the most impor-tant source for HOx in the atmosphere, the photolyticallydriven oxidation of water vapor (H2O) by excited oxygenatoms, O(1D), which are themselves produced from ozonephotolysis. However, during polar night, HOx is mainly pro-duced by the GCRs given that no UV radiation is availablefor O(1D) production.
The influence of GCRs on atmospheric chemistry hasbeen studied by Krivolutsky et al. (2002) with a 1-D pho-tochemical model. They found that ozone at 50◦ geomag-netic latitude might indeed be sensitive to the additionalNOx source. Their 1-D model predicted maximum GCR-induced increases in NOx of 4.5 % around 10 km, enhanc-ing tropospheric ozone by 0.6 %, whereas above about 18 kmozone decreases with a maximum reduction of 0.5 % close to20 km. Above 35 km altitude they found no influence causedby the GCRs. The evaluation of the impact of GCRs on atmo-spheric temperature and dynamics, which adds to the chem-ical changes, cannot be performed with an 1-D model butrequires the use of a 3-D chemistry-climate model (CCM)that is capable of describing the coupling between physico-chemical processes and large-scale dynamics.
Here we study the effect of CRII using the recently devel-oped CRAC:CRII (Cosmic Ray induced Cascade: Applica-tion for Cosmic Ray Induced Ionization) model, and then usethe results of this event-based local model to force the globalCCM SOCOL, focusing on the impact of CRII-induced NOxand HOx on chemistry, temperature and dynamics from theground to 0.01 hPa barometric pressure (altitude of∼80 km).
We have also addressed the difference between the state-of-the-art parameterization of the ionization rate by Usoskinet al. (2010) and the more traditional parameterization given
Atmos. Chem. Phys., 11, 4547–4556, 2011 www.atmos-chem-phys.net/11/4547/2011/
M. Calisto et al.: Influence of Galactic Cosmic Rays on atmospheric composition and dynamics 4549
by Heaps (1978), which was based on fitting results fromsealed ionization chambers flown continuously (yearly) onballoons extending to heights of 35 km. The parameteriza-tion by Heaps (1978) was and is widely used in various mod-els (Verronen et al., 2002; Schmidt et al., 2006; Winkler etal., 2009).
Many studies of atmospheric chemistry and dynamicsomit the influence of GCRs altogether, as was done for ex-ample in the first Chemistry-Climate Model Validation Ac-tivity (CCMVal) for coupled CCMs (Eyring et al., 2006)and in the most recent CCMVal report (see the homepageof SPARC:http://www.atmosp.physics.utoronto.ca/SPARC/ccmval final/index.php). Here, we use the CCM SOCOL,which is one of the CCMs that participated in the CCMValactivity, to investigate the consequences of this omission.
The models and experimental setup are described inSect. 2, the results containing the GCR effects on severalchemical species and the comparison between the parame-terizations by Usoskin et al. (2010) and Heaps (1978) arepresented in Sect. 3. In Sect. 4 we give a short summary ofthe results.
2 Description of the model and experimental setup
2.1 Chemistry-climate modeling with SOCOL
The CCM SOCOL represents a combination of theglobal circulation model MA-ECHAM4 and the chemistry-transport model MEZON. MA-ECHAM4 (Manzini et al.,1997) is a spectral model with T30 horizontal truncation re-sulting in a grid spacing of about 3.75◦; in the vertical di-rection the model has 39 levels in a hybrid sigma-pressurecoordinate system spanning the model atmosphere from thesurface to 0.01 hPa.
The chemical-transport part MEZON (Rozanov et al.,1999; Egorova et al., 2003) has the same vertical and hor-izontal resolution and treats 41 chemical species of theoxygen, hydrogen, nitrogen, carbon, chlorine and brominegroups, which are coupled by 140 gas-phase reactions, 46photolysis reactions and 16 heterogeneous reactions in/onaqueous sulfuric acid aerosols, water ice and nitric acid trihy-drate (NAT). The original version of the CCM SOCOL wasdescribed by Egorova et al. (2005).
Mixing ratios as a function of time of long lived well-mixed gases (e.g. N2O, CH4, ODS) were prescribed in theplanetary boundary layer with no spatial dependency, whilethe fluxes of NOx and CO were prescribed using emissiondata sets. The time dependent solar irradiance was also takeninto account. The sea surface temperatures and sea ice distri-butions were prescribed from observational data. All appliedboundary conditions except GCRs are identical to the REF-B1 run described by Morgenstern et al. (2010).
An extensive evaluation of the CCM SOCOL (Egorovaet al., 2005; Eyring et al., 2006, 2007) revealed model de-ficiencies in the chemical-transport part and led to the de-velopment of the CCM SOCOL v2.0 (which is applied inthis study). The new features of the SOCOLv2.0 are: (i) allspecies are transported separately; (ii) the mass fixer correc-tion after each semi-Lagrangian transport step is calculatedfor the chlorine, bromine and nitrogen families instead forindividual family members, but then applied to each individ-ual species; (iii) the mass fixer is applied to ozone only overthe latitude band 40◦ S–40◦ N to avoid artificial mass loss inthe polar areas; (iv) the water vapor removal by the high-est ice clouds (between 100 hPa and the tropical cold pointtropopause) is explicitly taken into account to prevent anoverestimation of stratospheric water content; (v) the list ofozone-depleting substances is extended to 15 for the chemi-cal treatment, while for the transport they are still clusteredinto three tracer groups; (vi) the heterogeneous chemistrymodule was updated to include HNO3 uptake by aqueous sul-furic acid aerosols, a parameterization of the liquid-phase re-active uptake coefficients and the NAT particle number den-sities are limited by an upper boundary of 5×10⁻⁴ cm−3 totake account of the fact that observed NAT clouds are oftenstrongly supersaturated. A comprehensive description andevaluation of the CCM SOCOL v2.0 is presented by Schraneret al. (2008).
2.2 Cosmic Ray Induced Ionization modeling
Here we study the effect of CRII using the recently devel-oped CRAC:CRII model (see Usoskin et al., 2004; Usoskinand Kovaltsov, 2006), which has been extended from thestratosphere (Usoskin and Kovaltsov, 2006) to the upper at-mosphere (Usoskin et al., 2010). The model is based on aMonte-Carlo simulation of the atmospheric cascade and re-produces the observed data within 10 % accuracy in the tro-posphere and lower stratosphere (Bazilevskaya et al., 2008;Usoskin et al., 2009). Usoskin’s parameterization workswell in the lower part below 30 km, where GCRs are themain source of ionization. The CRAC:CRII model has beenverified by comparison with available direct data sets andother models (e.g., Bazilevskaya et al., 2008; Usoskin et al.,2009). It does, however, underestimate the ionization above∼30 km since it neglects other non-GCR sources of ioniza-tion, UVI and precipitating particles (higher up in the polaratmosphere). On the other hand, Heaps’ parameterization isbased on scarce empirical data and may contain large uncer-tainties. It appears to be closer to the data in the upper polaratmosphere. As a summary, we believe that Usoskin’s modelproduces more realistic results below 30 km, but is prone tounderestimating ionization above that altitude. The resultsof the CRAC:CRII model are parameterized to give ion pairproduction rate as a function of the altitude (quantified viathe barometric pressure), geomagnetic latitude (quantifiedvia geomagnetic cutoff rigidity) and solar activity (quantified
www.atmos-chem-phys.net/11/4547/2011/ Atmos. Chem. Phys., 11, 4547–4556, 2011
4550 M. Calisto et al.: Influence of Galactic Cosmic Rays on atmospheric composition and dynamics
via the modulation potential8), see Usoskin et al. (2005). InFig. 1 we show the ionization rates for several geomagneticlatitudes as computed by the CRAC:CRII model (red line),compared to the ionization rates computed by the parame-terization of Heaps (1978) (blue line). Solid lines show theionization rates during solar minimum, the dashed lines dur-ing solar maximum.
This parameterization of the ionization rates cannot be di-rectly used in CCM SOCOL, which has no explicit treatmentof ion chemistry and requires the conversion of the ionizationrates into NOx and HOx production rates. Following Porteret al. (1976), we assumed that 1.25 NOx molecules are pro-duced per ion pair, and 45 % of this NOx production is as-sumed to yield ground state atomic nitrogen N(4S), whereas55 % yields the electronically excited state atomic nitrogenN(2D). While the ground state may lower the overall NOxconcentration via N(4S) + NO → N2 + O, N(2D) convertsinstantaneously to NO (see Introduction).
The production of HOx has been studied by Solomon andCrutzen (1981) with a 1-D time-dependent model of neutraland ion chemistry. They parameterized the number of oddhydrogen particles produced per ion pair as a function of al-titude and ionization for daytime, polar summer conditionsof temperature, air density and solar zenith angle. We im-plement their parameterization in the CCM SOCOL to takeinto account the GCR induced production of HOx from theground up to the height of 0.01 hPa barometric pressure (al-titude of∼80 km).
For this study, we have carried out three 27-year long runsof CCM SOCOL v2.0 from 1976 to 2002 considering thesolar cycle dependency and applying the actually observedvariations in the cosmic ray flux. The control run has beenperformed without the influence of the galactic cosmic rays,while two experiment runs include GCRs using the ioniza-tion rates given by Usoskin et al. (2010) and Heaps (1978).Our model is driven by time varying boundary conditionsfor the source gases, aerosol loading, solar irradiance andsea surface temperatures. All resulting changes in the at-mospheric state are taken into account for the calculation ofstatistical significance. The computed statistical significancewould probably be higher if boundary conditions were heldfixed, because the variability around the mean state is smallerin the absence of changes in the prescribed fields. The firsttwo years of the runs have been omitted from the analysisto eliminate possible spin up problems of the model. In thispaper we analyze only the difference between two runs (withand without GCRs) to establish the upper limit of the poten-tial effects. The analysis of the difference between solar maxand solar min is more complicated because the extraction ofthe GCR related signal would require time dependent sta-tistical analysis (e.g. multiple regression analysis), which isdifficult for our rather short time series. In a final section wecompare the results with runs using the often applied CRIIparameterization of Heaps (1978).
2
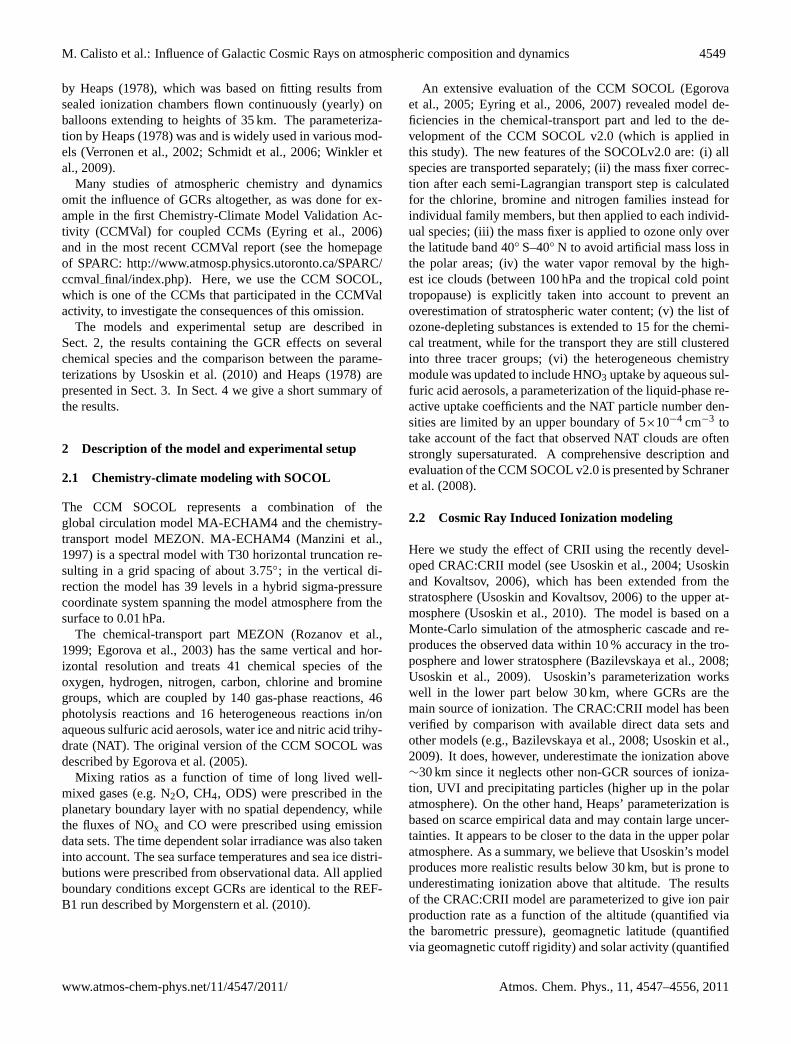
Fig. 2. Annual mean effect of GCRs on zonal mean NOx,([NOx]GCR-[NOx]control)/[NOx]control, in percent ([NOx] = [NO]+ [NO2]). Results are averaged from 1978–2002 (after allowingfor a 2-year model spin-up) with appropriate accounting for solarminimum and maximum periods. Solid contours indicate positive,dotted contours negative changes. Hatched areas (enclosed by solidcontours) indicate changes with at least 95 % statistical significance.
3
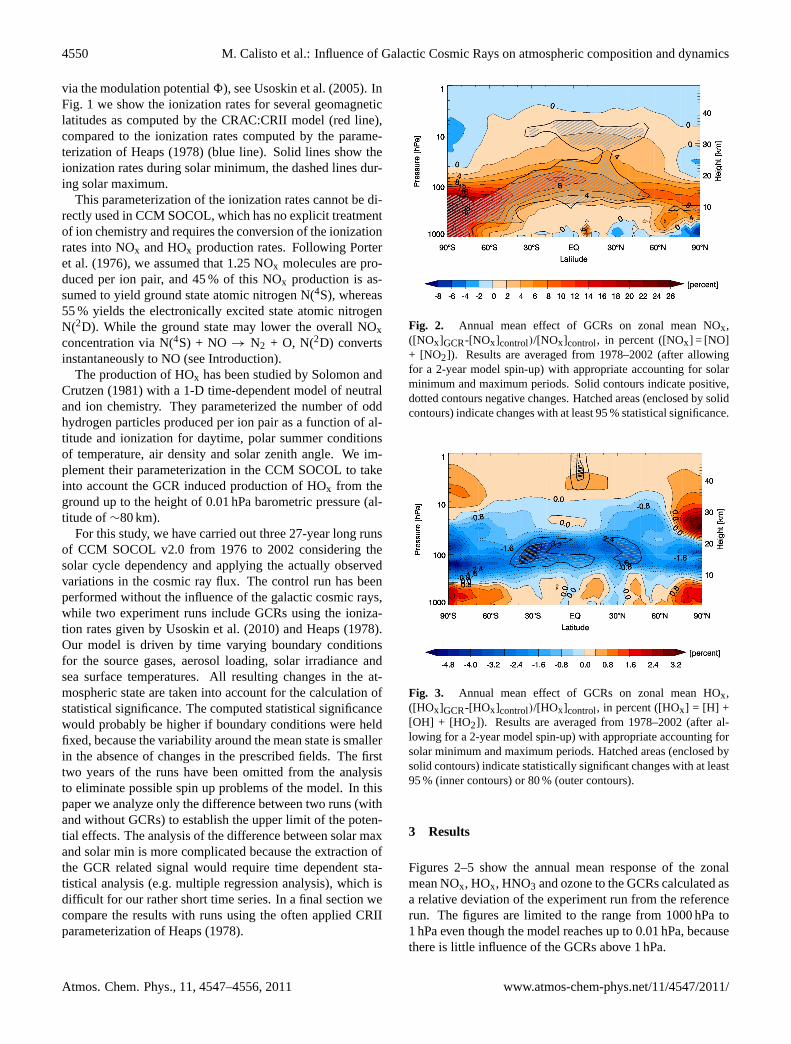
Fig. 3. Annual mean effect of GCRs on zonal mean HOx,([HOx]GCR-[HOx]control)/[HOx]control, in percent ([HOx] = [H] +[OH] + [HO2]). Results are averaged from 1978–2002 (after al-lowing for a 2-year model spin-up) with appropriate accounting forsolar minimum and maximum periods. Hatched areas (enclosed bysolid contours) indicate statistically significant changes with at least95 % (inner contours) or 80 % (outer contours).
3 Results
Figures 2–5 show the annual mean response of the zonalmean NOx, HOx, HNO3 and ozone to the GCRs calculated asa relative deviation of the experiment run from the referencerun. The figures are limited to the range from 1000 hPa to1 hPa even though the model reaches up to 0.01 hPa, becausethere is little influence of the GCRs above 1 hPa.
Atmos. Chem. Phys., 11, 4547–4556, 2011 www.atmos-chem-phys.net/11/4547/2011/
M. Calisto et al.: Influence of Galactic Cosmic Rays on atmospheric composition and dynamics 4551
4
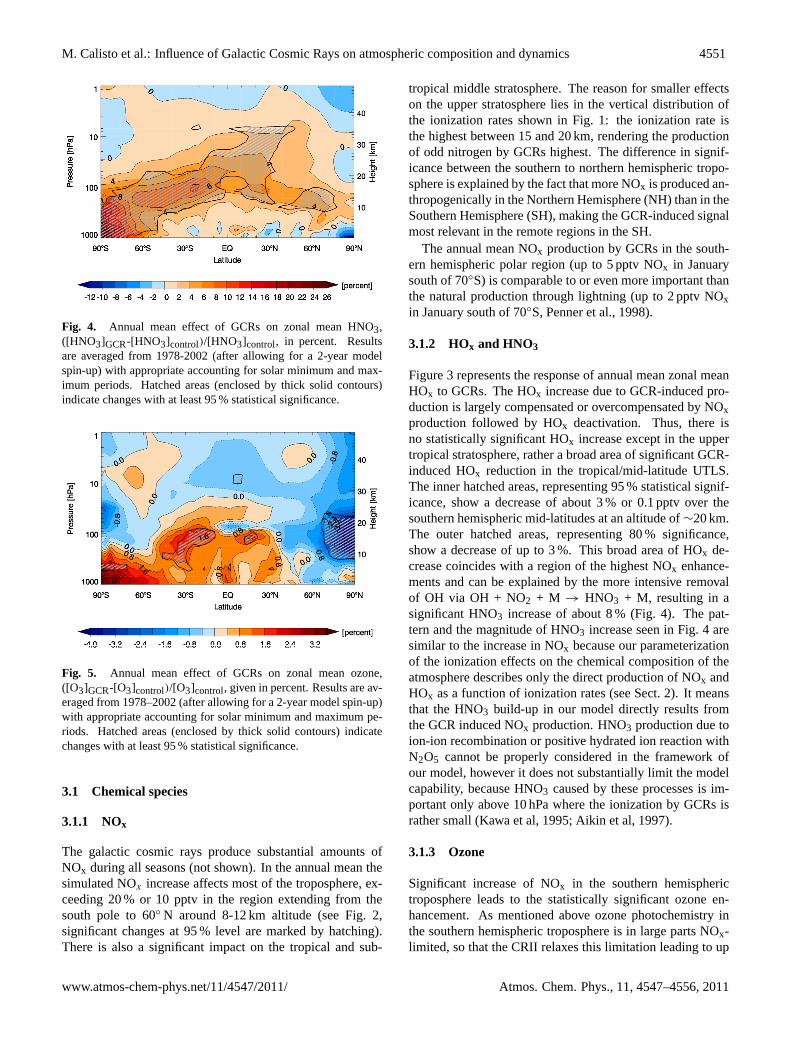
Fig. 4. Annual mean effect of GCRs on zonal mean HNO3,([HNO3]GCR-[HNO3]control)/[HNO3]control, in percent. Resultsare averaged from 1978-2002 (after allowing for a 2-year modelspin-up) with appropriate accounting for solar minimum and max-imum periods. Hatched areas (enclosed by thick solid contours)indicate changes with at least 95 % statistical significance.
5
Fig. 5. Annual mean effect of GCRs on zonal mean ozone,([O3]GCR-[O3]control)/[O3]control, given in percent. Results are av-eraged from 1978–2002 (after allowing for a 2-year model spin-up)with appropriate accounting for solar minimum and maximum pe-riods. Hatched areas (enclosed by thick solid contours) indicatechanges with at least 95 % statistical significance.
3.1 Chemical species
3.1.1 NOx
The galactic cosmic rays produce substantial amounts ofNOx during all seasons (not shown). In the annual mean thesimulated NOx increase affects most of the troposphere, ex-ceeding 20 % or 10 pptv in the region extending from thesouth pole to 60◦ N around 8-12 km altitude (see Fig. 2,significant changes at 95 % level are marked by hatching).There is also a significant impact on the tropical and sub-
tropical middle stratosphere. The reason for smaller effectson the upper stratosphere lies in the vertical distribution ofthe ionization rates shown in Fig. 1: the ionization rate isthe highest between 15 and 20 km, rendering the productionof odd nitrogen by GCRs highest. The difference in signif-icance between the southern to northern hemispheric tropo-sphere is explained by the fact that more NOx is produced an-thropogenically in the Northern Hemisphere (NH) than in theSouthern Hemisphere (SH), making the GCR-induced signalmost relevant in the remote regions in the SH.
The annual mean NOx production by GCRs in the south-ern hemispheric polar region (up to 5 pptv NOx in Januarysouth of 70◦S) is comparable to or even more important thanthe natural production through lightning (up to 2 pptv NOxin January south of 70◦S, Penner et al., 1998).
3.1.2 HOx and HNO3
Figure 3 represents the response of annual mean zonal meanHOx to GCRs. The HOx increase due to GCR-induced pro-duction is largely compensated or overcompensated by NOxproduction followed by HOx deactivation. Thus, there isno statistically significant HOx increase except in the uppertropical stratosphere, rather a broad area of significant GCR-induced HOx reduction in the tropical/mid-latitude UTLS.The inner hatched areas, representing 95 % statistical signif-icance, show a decrease of about 3 % or 0.1 pptv over thesouthern hemispheric mid-latitudes at an altitude of∼20 km.The outer hatched areas, representing 80 % significance,show a decrease of up to 3 %. This broad area of HOx de-crease coincides with a region of the highest NOx enhance-ments and can be explained by the more intensive removalof OH via OH + NO2 + M → HNO3 + M, resulting in asignificant HNO3 increase of about 8 % (Fig. 4). The pat-tern and the magnitude of HNO3 increase seen in Fig. 4 aresimilar to the increase in NOx because our parameterizationof the ionization effects on the chemical composition of theatmosphere describes only the direct production of NOx andHOx as a function of ionization rates (see Sect. 2). It meansthat the HNO3 build-up in our model directly results fromthe GCR induced NOx production. HNO3 production due toion-ion recombination or positive hydrated ion reaction withN2O5 cannot be properly considered in the framework ofour model, however it does not substantially limit the modelcapability, because HNO3 caused by these processes is im-portant only above 10 hPa where the ionization by GCRs israther small (Kawa et al, 1995; Aikin et al, 1997).
3.1.3 Ozone
Significant increase of NOx in the southern hemispherictroposphere leads to the statistically significant ozone en-hancement. As mentioned above ozone photochemistry inthe southern hemispheric troposphere is in large parts NOx-limited, so that the CRII relaxes this limitation leading to up
www.atmos-chem-phys.net/11/4547/2011/ Atmos. Chem. Phys., 11, 4547–4556, 2011
4552 M. Calisto et al.: Influence of Galactic Cosmic Rays on atmospheric composition and dynamics
to 3 % or 1 ppbv ozone increase (see Fig. 5). Conversely, inthe northern polar lowermost stratosphere a significant ozonedecrease of more than 3 % is caused by the additional pro-duction of ClONO2 via ClO + NO2 + M → ClONO2 + M,which in a second step reacts in heterogeneous reactions onpolar stratospheric cloud particles or cold sulfate aerosols toenhance chlorine activation, ClONO2 + HCl het
→ Cl2 + HNO3(with subsequent photolysis Cl2 + hv → Cl + Cl). As a sec-ondary effect, higher HNO3 concentrations in the polar win-ter stratosphere lead to enhanced polar stratospheric cloudoccurrences, and hence to faster heterogeneous chemical pro-cessing. The ozone decrease by the activated chlorine is neg-ligible in the southern hemispheric polar region because thebackground concentration of chlorine is too high. The south-ern hemispheric polar region is closer to saturation (moreavailable Cly due to stronger downward transport in polarvortex, lower temperature, more PSC’s, very low ozone),therefore no statistical significant ozone decrease caused bythe GCRs is observed.
The latitudinal average of our results for O3 and NOx re-semble the results of simple 1-D model calculations pub-lished by Krivolutsky et al. (2002). For ozone they modeleda maximum increase in the troposphere at a height of approx-imately 10 km and a maximum decrease at about 20 km. ForNO and NO2, their peak is visible at 10 km. In their workthe influence of the GCRs vanishes above 35 km. The hemi-spheric asymmetries discussed above could, of course, notbe retrieved in their 1-D calculation. Also, because Krivolut-sky et al. (2002) did not discuss HOx in their paper, it is notpossible to make a quantitative comparison with our results.
3.2 Temperatures and winds
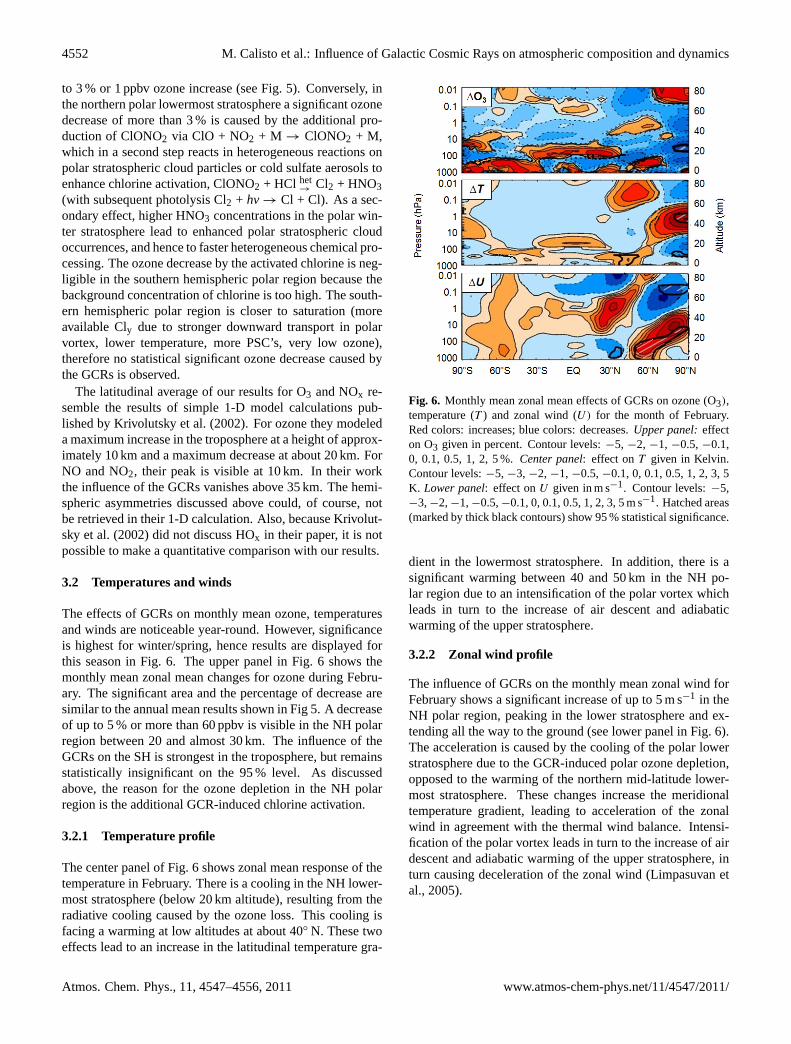
The effects of GCRs on monthly mean ozone, temperaturesand winds are noticeable year-round. However, significanceis highest for winter/spring, hence results are displayed forthis season in Fig. 6. The upper panel in Fig. 6 shows themonthly mean zonal mean changes for ozone during Febru-ary. The significant area and the percentage of decrease aresimilar to the annual mean results shown in Fig 5. A decreaseof up to 5 % or more than 60 ppbv is visible in the NH polarregion between 20 and almost 30 km. The influence of theGCRs on the SH is strongest in the troposphere, but remainsstatistically insignificant on the 95 % level. As discussedabove, the reason for the ozone depletion in the NH polarregion is the additional GCR-induced chlorine activation.
3.2.1 Temperature profile
The center panel of Fig. 6 shows zonal mean response of thetemperature in February. There is a cooling in the NH lower-most stratosphere (below 20 km altitude), resulting from theradiative cooling caused by the ozone loss. This cooling isfacing a warming at low altitudes at about 40◦ N. These twoeffects lead to an increase in the latitudinal temperature gra-
6
Fig. 6. Monthly mean zonal mean effects of GCRs on ozone (O3),temperature (T ) and zonal wind (U) for the month of February.Red colors: increases; blue colors: decreases.Upper panel:effecton O3 given in percent. Contour levels:−5, −2, −1, −0.5,−0.1,0, 0.1, 0.5, 1, 2, 5 %.Center panel: effect onT given in Kelvin.Contour levels:−5, −3, −2, −1, −0.5,−0.1, 0, 0.1, 0.5, 1, 2, 3, 5K. Lower panel: effect onU given in m s−1. Contour levels:−5,−3,−2,−1,−0.5,−0.1, 0, 0.1, 0.5, 1, 2, 3, 5 m s−1. Hatched areas(marked by thick black contours) show 95 % statistical significance.
dient in the lowermost stratosphere. In addition, there is asignificant warming between 40 and 50 km in the NH po-lar region due to an intensification of the polar vortex whichleads in turn to the increase of air descent and adiabaticwarming of the upper stratosphere.
3.2.2 Zonal wind profile
The influence of GCRs on the monthly mean zonal wind forFebruary shows a significant increase of up to 5 m s−1 in theNH polar region, peaking in the lower stratosphere and ex-tending all the way to the ground (see lower panel in Fig. 6).The acceleration is caused by the cooling of the polar lowerstratosphere due to the GCR-induced polar ozone depletion,opposed to the warming of the northern mid-latitude lower-most stratosphere. These changes increase the meridionaltemperature gradient, leading to acceleration of the zonalwind in agreement with the thermal wind balance. Intensi-fication of the polar vortex leads in turn to the increase of airdescent and adiabatic warming of the upper stratosphere, inturn causing deceleration of the zonal wind (Limpasuvan etal., 2005).
Atmos. Chem. Phys., 11, 4547–4556, 2011 www.atmos-chem-phys.net/11/4547/2011/
M. Calisto et al.: Influence of Galactic Cosmic Rays on atmospheric composition and dynamics 4553
7
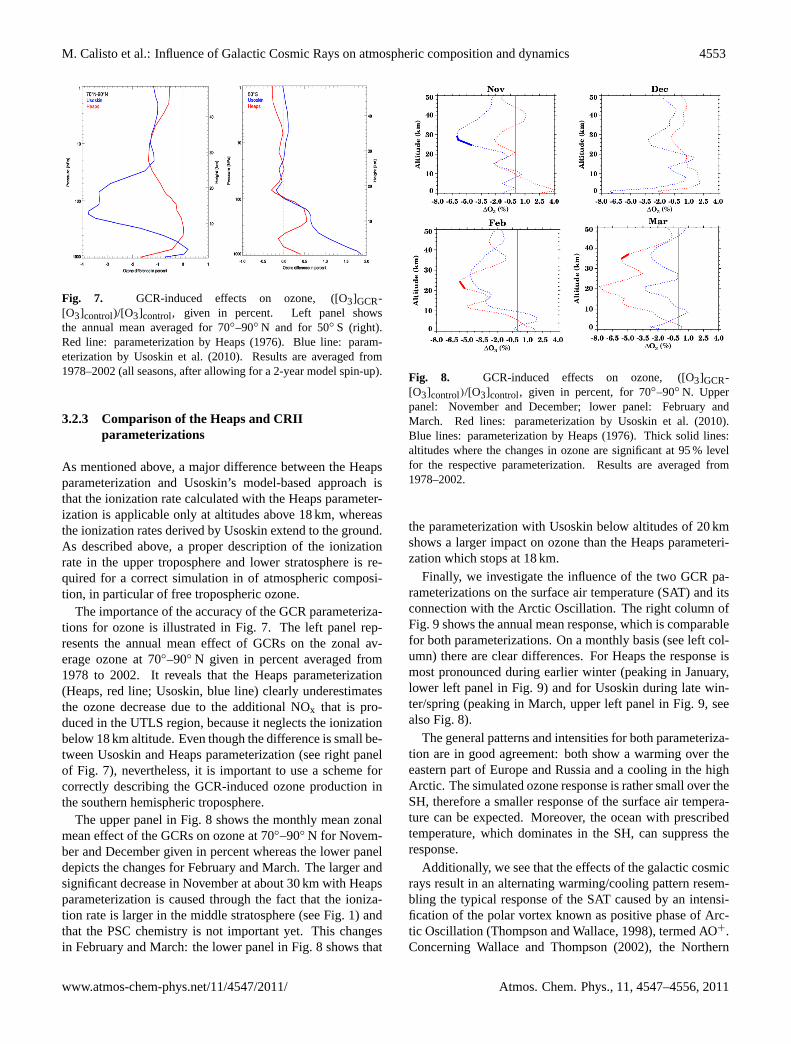
Fig. 7. GCR-induced effects on ozone, ([O3]GCR-[O3]control)/[O3]control, given in percent. Left panel showsthe annual mean averaged for 70◦–90◦ N and for 50◦ S (right).Red line: parameterization by Heaps (1976). Blue line: param-eterization by Usoskin et al. (2010). Results are averaged from1978–2002 (all seasons, after allowing for a 2-year model spin-up).
3.2.3 Comparison of the Heaps and CRIIparameterizations
As mentioned above, a major difference between the Heapsparameterization and Usoskin’s model-based approach isthat the ionization rate calculated with the Heaps parameter-ization is applicable only at altitudes above 18 km, whereasthe ionization rates derived by Usoskin extend to the ground.As described above, a proper description of the ionizationrate in the upper troposphere and lower stratosphere is re-quired for a correct simulation in of atmospheric composi-tion, in particular of free tropospheric ozone.
The importance of the accuracy of the GCR parameteriza-tions for ozone is illustrated in Fig. 7. The left panel rep-resents the annual mean effect of GCRs on the zonal av-erage ozone at 70◦–90◦ N given in percent averaged from1978 to 2002. It reveals that the Heaps parameterization(Heaps, red line; Usoskin, blue line) clearly underestimatesthe ozone decrease due to the additional NOx that is pro-duced in the UTLS region, because it neglects the ionizationbelow 18 km altitude. Even though the difference is small be-tween Usoskin and Heaps parameterization (see right panelof Fig. 7), nevertheless, it is important to use a scheme forcorrectly describing the GCR-induced ozone production inthe southern hemispheric troposphere.
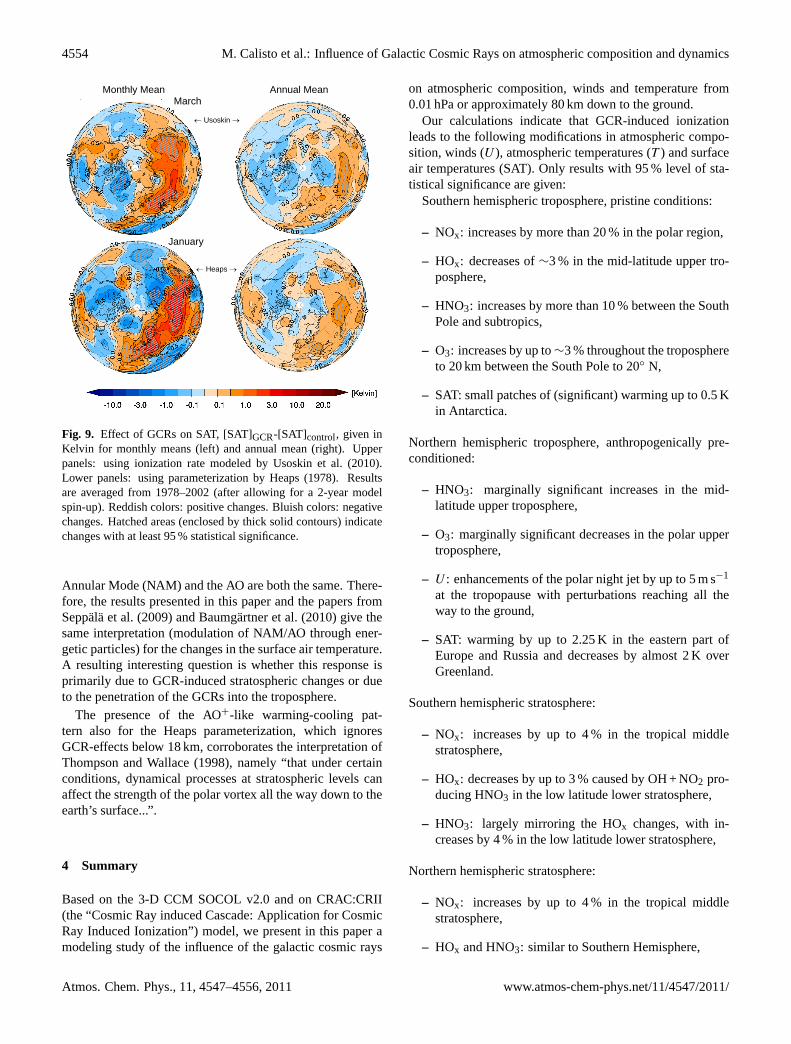
The upper panel in Fig. 8 shows the monthly mean zonalmean effect of the GCRs on ozone at 70◦–90◦ N for Novem-ber and December given in percent whereas the lower paneldepicts the changes for February and March. The larger andsignificant decrease in November at about 30 km with Heapsparameterization is caused through the fact that the ioniza-tion rate is larger in the middle stratosphere (see Fig. 1) andthat the PSC chemistry is not important yet. This changesin February and March: the lower panel in Fig. 8 shows that
8
Fig. 8. GCR-induced effects on ozone, ([O3]GCR-[O3]control)/[O3]control, given in percent, for 70◦–90◦ N. Upperpanel: November and December; lower panel: February andMarch. Red lines: parameterization by Usoskin et al. (2010).Blue lines: parameterization by Heaps (1976). Thick solid lines:altitudes where the changes in ozone are significant at 95 % levelfor the respective parameterization. Results are averaged from1978–2002.
the parameterization with Usoskin below altitudes of 20 kmshows a larger impact on ozone than the Heaps parameteri-zation which stops at 18 km.
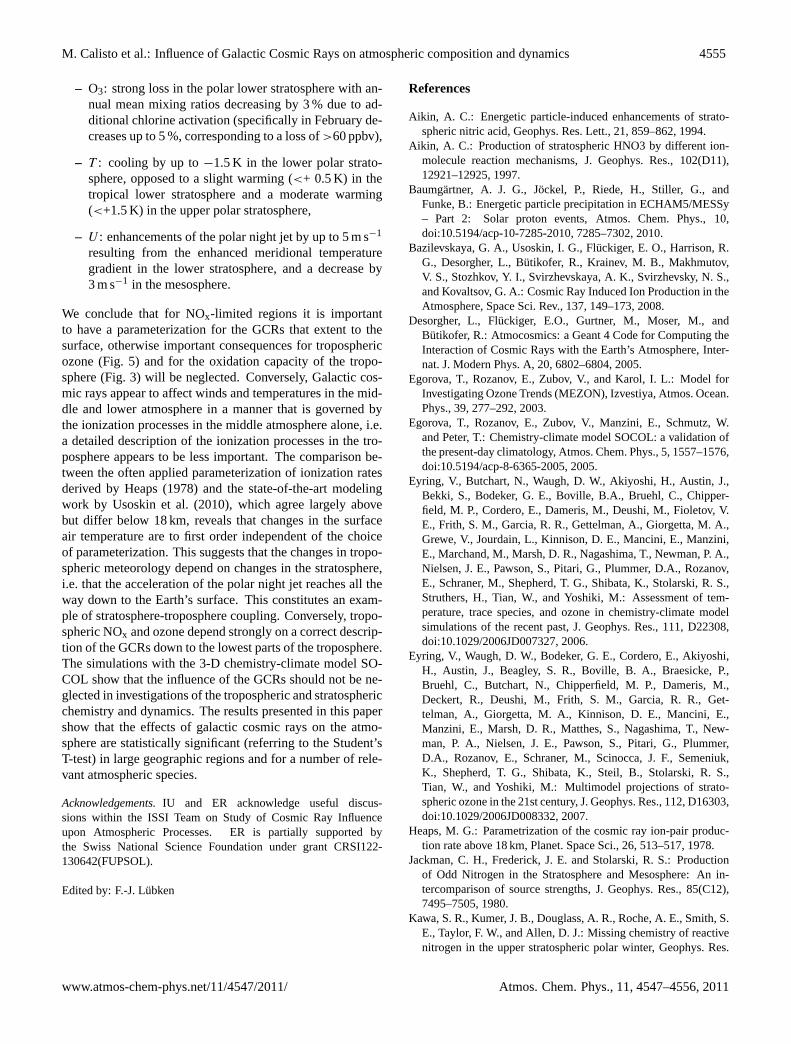
Finally, we investigate the influence of the two GCR pa-rameterizations on the surface air temperature (SAT) and itsconnection with the Arctic Oscillation. The right column ofFig. 9 shows the annual mean response, which is comparablefor both parameterizations. On a monthly basis (see left col-umn) there are clear differences. For Heaps the response ismost pronounced during earlier winter (peaking in January,lower left panel in Fig. 9) and for Usoskin during late win-ter/spring (peaking in March, upper left panel in Fig. 9, seealso Fig. 8).
The general patterns and intensities for both parameteriza-tion are in good agreement: both show a warming over theeastern part of Europe and Russia and a cooling in the highArctic. The simulated ozone response is rather small over theSH, therefore a smaller response of the surface air tempera-ture can be expected. Moreover, the ocean with prescribedtemperature, which dominates in the SH, can suppress theresponse.
Additionally, we see that the effects of the galactic cosmicrays result in an alternating warming/cooling pattern resem-bling the typical response of the SAT caused by an intensi-fication of the polar vortex known as positive phase of Arc-tic Oscillation (Thompson and Wallace, 1998), termed AO+.Concerning Wallace and Thompson (2002), the Northern
www.atmos-chem-phys.net/11/4547/2011/ Atmos. Chem. Phys., 11, 4547–4556, 2011
4554 M. Calisto et al.: Influence of Galactic Cosmic Rays on atmospheric composition and dynamics
9
Monthly Mean Annual Mean March ← Usoskin → January
← Heaps →
Fig. 9. Effect of GCRs on SAT, [SAT]GCR-[SAT]control, given inKelvin for monthly means (left) and annual mean (right). Upperpanels: using ionization rate modeled by Usoskin et al. (2010).Lower panels: using parameterization by Heaps (1978). Resultsare averaged from 1978–2002 (after allowing for a 2-year modelspin-up). Reddish colors: positive changes. Bluish colors: negativechanges. Hatched areas (enclosed by thick solid contours) indicatechanges with at least 95 % statistical significance.
Annular Mode (NAM) and the AO are both the same. There-fore, the results presented in this paper and the papers fromSeppala et al. (2009) and Baumgartner et al. (2010) give thesame interpretation (modulation of NAM/AO through ener-getic particles) for the changes in the surface air temperature.A resulting interesting question is whether this response isprimarily due to GCR-induced stratospheric changes or dueto the penetration of the GCRs into the troposphere.
The presence of the AO+-like warming-cooling pat-tern also for the Heaps parameterization, which ignoresGCR-effects below 18 km, corroborates the interpretation ofThompson and Wallace (1998), namely “that under certainconditions, dynamical processes at stratospheric levels canaffect the strength of the polar vortex all the way down to theearth’s surface...”.
4 Summary
Based on the 3-D CCM SOCOL v2.0 and on CRAC:CRII(the “Cosmic Ray induced Cascade: Application for CosmicRay Induced Ionization”) model, we present in this paper amodeling study of the influence of the galactic cosmic rays
on atmospheric composition, winds and temperature from0.01 hPa or approximately 80 km down to the ground.
Our calculations indicate that GCR-induced ionizationleads to the following modifications in atmospheric compo-sition, winds (U ), atmospheric temperatures (T ) and surfaceair temperatures (SAT). Only results with 95 % level of sta-tistical significance are given:
Southern hemispheric troposphere, pristine conditions:
– NOx: increases by more than 20 % in the polar region,
– HOx: decreases of∼3 % in the mid-latitude upper tro-posphere,
– HNO3: increases by more than 10 % between the SouthPole and subtropics,
– O3: increases by up to∼3 % throughout the troposphereto 20 km between the South Pole to 20◦ N,
– SAT: small patches of (significant) warming up to 0.5 Kin Antarctica.
Northern hemispheric troposphere, anthropogenically pre-conditioned:
– HNO3: marginally significant increases in the mid-latitude upper troposphere,
– O3: marginally significant decreases in the polar uppertroposphere,
– U : enhancements of the polar night jet by up to 5 m s−1
at the tropopause with perturbations reaching all theway to the ground,
– SAT: warming by up to 2.25 K in the eastern part ofEurope and Russia and decreases by almost 2 K overGreenland.
Southern hemispheric stratosphere:
– NOx: increases by up to 4 % in the tropical middlestratosphere,
– HOx: decreases by up to 3 % caused by OH + NO2 pro-ducing HNO3 in the low latitude lower stratosphere,
– HNO3: largely mirroring the HOx changes, with in-creases by 4 % in the low latitude lower stratosphere,
Northern hemispheric stratosphere:
– NOx: increases by up to 4 % in the tropical middlestratosphere,
– HOx and HNO3: similar to Southern Hemisphere,
Atmos. Chem. Phys., 11, 4547–4556, 2011 www.atmos-chem-phys.net/11/4547/2011/
M. Calisto et al.: Influence of Galactic Cosmic Rays on atmospheric composition and dynamics 4555
– O3: strong loss in the polar lower stratosphere with an-nual mean mixing ratios decreasing by 3 % due to ad-ditional chlorine activation (specifically in February de-creases up to 5 %, corresponding to a loss of>60 ppbv),
– T : cooling by up to−1.5 K in the lower polar strato-sphere, opposed to a slight warming (<+ 0.5 K) in thetropical lower stratosphere and a moderate warming(<+1.5 K) in the upper polar stratosphere,
– U : enhancements of the polar night jet by up to 5 m s−1
resulting from the enhanced meridional temperaturegradient in the lower stratosphere, and a decrease by3 m s−1 in the mesosphere.
We conclude that for NOx-limited regions it is importantto have a parameterization for the GCRs that extent to thesurface, otherwise important consequences for troposphericozone (Fig. 5) and for the oxidation capacity of the tropo-sphere (Fig. 3) will be neglected. Conversely, Galactic cos-mic rays appear to affect winds and temperatures in the mid-dle and lower atmosphere in a manner that is governed bythe ionization processes in the middle atmosphere alone, i.e.a detailed description of the ionization processes in the tro-posphere appears to be less important. The comparison be-tween the often applied parameterization of ionization ratesderived by Heaps (1978) and the state-of-the-art modelingwork by Usoskin et al. (2010), which agree largely abovebut differ below 18 km, reveals that changes in the surfaceair temperature are to first order independent of the choiceof parameterization. This suggests that the changes in tropo-spheric meteorology depend on changes in the stratosphere,i.e. that the acceleration of the polar night jet reaches all theway down to the Earth’s surface. This constitutes an exam-ple of stratosphere-troposphere coupling. Conversely, tropo-spheric NOx and ozone depend strongly on a correct descrip-tion of the GCRs down to the lowest parts of the troposphere.The simulations with the 3-D chemistry-climate model SO-COL show that the influence of the GCRs should not be ne-glected in investigations of the tropospheric and stratosphericchemistry and dynamics. The results presented in this papershow that the effects of galactic cosmic rays on the atmo-sphere are statistically significant (referring to the Student’sT-test) in large geographic regions and for a number of rele-vant atmospheric species.
Acknowledgements.IU and ER acknowledge useful discus-sions within the ISSI Team on Study of Cosmic Ray Influenceupon Atmospheric Processes. ER is partially supported bythe Swiss National Science Foundation under grant CRSI122-130642(FUPSOL).
Edited by: F.-J. Lubken
References
Aikin, A. C.: Energetic particle-induced enhancements of strato-spheric nitric acid, Geophys. Res. Lett., 21, 859–862, 1994.
Aikin, A. C.: Production of stratospheric HNO3 by different ion-molecule reaction mechanisms, J. Geophys. Res., 102(D11),12921–12925, 1997.
Baumgartner, A. J. G., Jockel, P., Riede, H., Stiller, G., andFunke, B.: Energetic particle precipitation in ECHAM5/MESSy– Part 2: Solar proton events, Atmos. Chem. Phys., 10,doi:10.5194/acp-10-7285-2010, 7285–7302, 2010.
Bazilevskaya, G. A., Usoskin, I. G., Fluckiger, E. O., Harrison, R.G., Desorgher, L., Butikofer, R., Krainev, M. B., Makhmutov,V. S., Stozhkov, Y. I., Svirzhevskaya, A. K., Svirzhevsky, N. S.,and Kovaltsov, G. A.: Cosmic Ray Induced Ion Production in theAtmosphere, Space Sci. Rev., 137, 149–173, 2008.
Desorgher, L., Fluckiger, E.O., Gurtner, M., Moser, M., andButikofer, R.: Atmocosmics: a Geant 4 Code for Computing theInteraction of Cosmic Rays with the Earth’s Atmosphere, Inter-nat. J. Modern Phys. A, 20, 6802–6804, 2005.
Egorova, T., Rozanov, E., Zubov, V., and Karol, I. L.: Model forInvestigating Ozone Trends (MEZON), Izvestiya, Atmos. Ocean.Phys., 39, 277–292, 2003.
Egorova, T., Rozanov, E., Zubov, V., Manzini, E., Schmutz, W.and Peter, T.: Chemistry-climate model SOCOL: a validation ofthe present-day climatology, Atmos. Chem. Phys., 5, 1557–1576,doi:10.5194/acp-8-6365-2005, 2005.
Eyring, V., Butchart, N., Waugh, D. W., Akiyoshi, H., Austin, J.,Bekki, S., Bodeker, G. E., Boville, B.A., Bruehl, C., Chipper-field, M. P., Cordero, E., Dameris, M., Deushi, M., Fioletov, V.E., Frith, S. M., Garcia, R. R., Gettelman, A., Giorgetta, M. A.,Grewe, V., Jourdain, L., Kinnison, D. E., Mancini, E., Manzini,E., Marchand, M., Marsh, D. R., Nagashima, T., Newman, P. A.,Nielsen, J. E., Pawson, S., Pitari, G., Plummer, D.A., Rozanov,E., Schraner, M., Shepherd, T. G., Shibata, K., Stolarski, R. S.,Struthers, H., Tian, W., and Yoshiki, M.: Assessment of tem-perature, trace species, and ozone in chemistry-climate modelsimulations of the recent past, J. Geophys. Res., 111, D22308,doi:10.1029/2006JD007327, 2006.
Eyring, V., Waugh, D. W., Bodeker, G. E., Cordero, E., Akiyoshi,H., Austin, J., Beagley, S. R., Boville, B. A., Braesicke, P.,Bruehl, C., Butchart, N., Chipperfield, M. P., Dameris, M.,Deckert, R., Deushi, M., Frith, S. M., Garcia, R. R., Get-telman, A., Giorgetta, M. A., Kinnison, D. E., Mancini, E.,Manzini, E., Marsh, D. R., Matthes, S., Nagashima, T., New-man, P. A., Nielsen, J. E., Pawson, S., Pitari, G., Plummer,D.A., Rozanov, E., Schraner, M., Scinocca, J. F., Semeniuk,K., Shepherd, T. G., Shibata, K., Steil, B., Stolarski, R. S.,Tian, W., and Yoshiki, M.: Multimodel projections of strato-spheric ozone in the 21st century, J. Geophys. Res., 112, D16303,doi:10.1029/2006JD008332, 2007.
Heaps, M. G.: Parametrization of the cosmic ray ion-pair produc-tion rate above 18 km, Planet. Space Sci., 26, 513–517, 1978.
Jackman, C. H., Frederick, J. E. and Stolarski, R. S.: Productionof Odd Nitrogen in the Stratosphere and Mesosphere: An in-tercomparison of source strengths, J. Geophys. Res., 85(C12),7495–7505, 1980.
Kawa, S. R., Kumer, J. B., Douglass, A. R., Roche, A. E., Smith, S.E., Taylor, F. W., and Allen, D. J.: Missing chemistry of reactivenitrogen in the upper stratospheric polar winter, Geophys. Res.
www.atmos-chem-phys.net/11/4547/2011/ Atmos. Chem. Phys., 11, 4547–4556, 2011
4556 M. Calisto et al.: Influence of Galactic Cosmic Rays on atmospheric composition and dynamics
Lett., 22, 2629–2632, 1995.Krivolutsky, A., Bazilevskaya, G., Vyushkova, T., and Knyazeva,
G.: Influence of cosmic rays on chemical composition of theatmosphere: data analysis and photochemical modeling, Phys.Chem. Earth, 27, 471–476, 2002.
Limpasuvan, V., Hartmann, D. L., Thompson, D. L. H., Jeev,K., and Yung, Y. L.: Stratosphere-troposphere evolution dur-ing polar vortex intensification, J. Geophys. Res., 110, D24101,doi:10.1029/2005JD006305, 2005.
Manzini, E., McFarlane, N. A., and McLandress, C.: Impact of theDoppler spread parameterization on the simulation of the middleatmosphere circulation using the MA/ECHAM4 general circula-tion model, J. Geophys. Res. Atmos., 102(D22), 25751–25762,1997.
Morgenstern, O., Akiyoshi, H., Bekki, S., Braesicke, P., Butchart,N., Chipperfield, M. P., Cugnet, D., Deushi, M., Dhomse, S. S.,Garcia, R. R., Gettelman, A., Gillett, N. P., Hardiman, S. C.,Jumelet, J., Kinnison, D. E., Lamarque, J.-F., Lott, F., Marchand,M., Michou, M., Nakamura, T., Olivie, D., Peter, T., Plummer,D., Pyle, J. A., Rozanov, E., Saint-Martin, D., Scinocca, J. F.,Shibata, K., Sigmond, M., Smale, D., Teyssedre, H., Tian, W.,Voldoire, A., and Yamashita, Y.: Anthropogenic forcing of theNorthern Annular Mode in CCMVal-2 models, J. Geophys. Res.,115, D00M03,doi:10.1029/2009JD013347, 2010.
Nicolet, M.: On the production of nitric oxide by cosmic rays in themesosphere and stratosphere, Planet. Space Sci., 23, 637–649,1975.
O’Brien, K.: Calculated Cosmic Ray Ionization in the Lower At-mosphere, J. Geophys. Res., 75(22), 4357–4359, 1970.
O’Brien, K.: The theory of cosmic-ray and high-energy solar-particle transport in the atmosphere, in: The Natural RadiationEnvironment VII, Seventh International Symposium on the Nat-ural Radiation Environment (NRE-VII), edited by: McLaughlin,J. P., Simopoulos, S. E., and Steinhausler, F., Elsevier, Amster-dam, The Netherlands, 29–44, 2005.
Penner, J. E., Bergmann, D. J., Walton, J. J., Kinnison, D., Prather,M. J., Rotman, D., Price, C., Pickering, K. E., and Baughcum, S.L.: An evaluation of upper troposphere NOx with two models, J.Geophys. Res., 103, 22097–22113, 1998.
Porter, H. S., Jackman, C. H. and Green, A. E. S.: Efficiencies forproduction of atomic nitrogen and oxygen by relativistic protonimpact in air, J. Chem. Phys., 65, No. 1, 1976.
Rozanov, E. V., Zubov, V. A., Schlesinger, M. E., Yang, F. andAndronova, N. G.: The UIUC three-dimensional stratosphericchemical transport model: Description and evaluation of the sim-ulated source gases and ozone, J. Geophys. Res., 104, 11755–11781, 1999.
Schmidt, H., Brasseur, G. P., Charron, M., Manzini, E., Giorgetta,M. A., Diehl, T., Fomichev, V. I., Kinnison, D., Marsh, D., andWalters, S.: The HAMMONIA Chemistry Climate Model: Sen-sitivity of the Mesopause Region to the 11-Year Solar Cycle andCO2 Doubling, J. Climate, 19, 3903–3931, 2006
Schraner, M., Rozanov, E., Schnadt Poberaj, C., Kenzelmann, P.,Fischer, A. M., Zubov, V., Luo, B. P., Hoyle, C. R., Egorova,T., Fueglistaler, S., Bronnimann, S., Schmutz, W., and Peter, T.:Technical Note: Chemistry-climate model SOCOL: version 2.0with improved transport and chemistry/microphysics schemes,Atmos. Chem. Phys., 8, 5957–5974,doi:10.5194/acp-8-5957-2008, 2008.
Seppala, A., Verronen, P. T., Clilverd, M. A., Randall, C. E.,Tamminen, J., Sofieva, J. Backman, L., and Kyrola, E.: Arc-tic and Antarctic polar winter NOx and energetic particle pre-cipitation in 2002–2006, Geophys. Res. Lett., 34, L12810,doi:10.1029/2007GL029733, 2007.
Seppala, A., Randall, C. E., Clilverd, M. A., Rozanov, E.,and Rodger, C. J.: Geomagnetic activity and polar surfaceair temperature variability, J. Geophys. Res., 114, A10312,doi:10.1029/2008JA014029, 2009.
Shindell, D. T., Schmidt, G. A., Miller, R. L., and Rind, D.:Northern Hemisphere winter climate response to greenhouse gas,ozone, solar, and volcanic forcing, J. Geophys. Res., 106(D7),7193–7210, 2001.
Solomon, S., Rusch, D. W., Gerard, J.-C., Reidt, G. C. and Crutzen,P. J.: The effect of particle precipitation events on the neutraland ion chemistry of the middle atmosphere: II. Odd Hydrogen,Planet. Space Sci., 29(8), 885–892, 1981.
Thompson, D. W. J. and Wallace, J. M.: The Arctic Oscillationsignature in the wintertime geopotential height and temperaturefields, Geophys. Res. Lett., 25(9), 1297–1300, 1998.
Wallace, J. M. and Thompson, D. W. J.: The Pacific Center of Ac-tion of the Northern Hemisphere Annular Mode: Real or Artifact,J. Clim., 2002.
Usoskin I. G., Gladysheva, O. G., and Kovaltsov, G. A.: Cosmicray-induced ionization in the atmosphere: spatial and temporalchanges, J. Atmos. Sol. Terr. Phys., 66, 1791–1796, 2004.
Usoskin, I. G., Alanko-Huotari, K., Kovaltsov, G. A., and Mur-sula, K.: Heliospheric modulation of cosmic rays: Monthly re-construction for 1951–2004, J. Geophys. Res., 110, A12108,doi:10.1029/2005JA011250, 2005.
Usoskin, I. G. and Kovaltsov, G. A.: Cosmic ray induced ionizationin the atmosphere: Full modeling and practical applications, J.Geophys. Res., 111, D21206,doi:10.1029/2006JD007150, 2006.
Usoskin, I. G., Desorgher, L., Velinov, P., Storini, M., Fluckiger, E.O., Butikofer, R., and Kovaltsov, G. A.: Ionization of the earth’satmosphere by solar and galactic cosmic rays, Acta Geophys.,57, 88–101, 2009.
Usoskin, I. G., Kovaltsov, G. A., and Mironova, I. A.: Cos-mic ray induced ionization model CRAC:CRII: An extensionto the upper atmosphere, J. Geophys. Res., 115, D10302,doi:10.1029/2009JD013142, 2010.
Verronen, P. T., Turunen, E., Ulich, Th., and Kyrola, E.: Mod-elling the effects of the October 1989 solar proton event on meso-spheric odd nitrogen using a detailed ion and neutral chemistrymodel, Ann. Geophys., 20, 1967–1976,doi:10.5194/angeo-20-1967-2002, 2002.
Vitt, F. M. and Jackman, C. H.: A comparison of sources of oddnitrogen production from 1974 through 1993 in the Earth’s mid-dle atmosphere as calculated using a two-dimensional model, J.Geophys. Res., 101(D3), 6729–6739, 1996.
Winkler, H., Kazeminejad, S., Sinnhuber, M., Kallenrode, M.-B., and Notholt, J.: Conversion of mesospheric HCl into ac-tive chlorine during the solar proton event in July 2000 inthe northern polar region, J. Geophys. Res., 114, D00I03,doi:10.1029/2008JD011587, 2009.
Atmos. Chem. Phys., 11, 4547–4556, 2011 www.atmos-chem-phys.net/11/4547/2011/