Embed Size (px)
Citation preview

Influence of hyaluronic acid on bacterial and fungal species,including clinically relevant opportunistic pathogens
Andrea Ardizzoni • Rachele G. Neglia • Maria C. Baschieri •
Claudio Cermelli • Manuela Caratozzolo • Elena Righi •
Beniamino Palmieri • Elisabetta Blasi
Received: 13 May 2011 / Accepted: 28 July 2011 / Published online: 4 September 2011
� Springer Science+Business Media, LLC 2011
Abstract Hyaluronic acid (HA) has several clinical
applications (aesthetic surgery, dermatology, orthopaedics
and ophtalmology). Following recent evidence, suggesting
antimicrobial and antiviral properties for HA, we investi-
gated its effects on 15 ATCC strains, representative of
clinically relevant bacterial and fungal species. The in vitro
system employed allowed to assess optical density of broth
cultures as a measure of microbial load in a time-dependent
manner. The results showed that different microbial species
and, sometimes, different strains belonging to the same
species, are differently affected by HA. In particular,
staphylococci, enterococci, Streptococcus mutans, two
Escherichia coli strains, Pseudomonas aeruginosa, Can-
dida glabrata and C. parapsilosis displayed a HA dose-
dependent growth inhibition; no HA effects were detected
in E. coli ATCC 13768 and C. albicans; S. sanguinis was
favoured by the highest HA dose. Therefore, the influence
of HA on bacteria and fungi warrants further studies aimed
at better establishing its relevance in clinical applications.
1 Introduction
Hyaluronic acid (HA) is a glycosaminoglycan made up of
glucuronic acid and N-acetylglucosamine disaccharide
units. It is a uniform, linear, unbranched and tiled mole-
cule, with highly variable length and molecular weight (up
to 106 Da). It is abundant in skin (up to 56%) and in
connective tissues, with a turnover ranging from several
hours to a few days depending on tissues. Also, HA con-
stitutes one of the main components of extracellular
matrices. In some tissues, like vitreous humour and syno-
vial fluid, HA is the primary responsible for the function
and the physical characteristics associated with these sub-
stances. Its length, coupled to its high hydrating property,
allows many HA polymers to organize in a reticular
structure, which in turn produces a molecular framework.
Such scaffolding, besides supporting tissues’ tone and
shape, acts as a filter to prevent the diffusion of high
molecular weight substances and dissemination of infec-
tious agents [1].
Because of its biological properties, including non
immunogenicity which is an essential prerequisite for
biocompatibility, HA and its derivatives are broadly used
in pharmacy and medicine, especially in segment surgery
as well as in wound and burn therapy [2]. In particular, HA
plays a prominent role in wound-healing processes, as it is
naturally angiogenic when degraded to small fragments,
which act as ‘‘danger signals’’ [3–6]. Also, HA is known to
promote early inflammation, which is critical for initiating
wound healing, while at later times it contributes to matrix
stabilization, thus participating to downregulation of
inflammatory reactions [5, 6].
HA is mainly used in aesthetic surgery and in derma-
tology, where it is injected, together with collagen proteins,
to eliminate wrinkles and to prevent skin aging. HA has
A. Ardizzoni � R. G. Neglia � M. C. Baschieri � C. Cermelli �M. Caratozzolo � E. Righi
Dipartimento di Scienze di Sanita Pubblica, Universita
di Modena e Reggio Emilia, Modena, Italy
B. Palmieri
Dipartimento di Chirurgia Generale, Universita di Modena e
Reggio Emilia, Modena, Italy
E. Blasi
Dipartimento di Laboratori, Anatomia Patologica e Medicina
Legale, Universita di Modena e Reggio Emilia, Modena, Italy
E. Blasi (&)
Istituti Biologici (2� piano), Via Campi 287, 41125 Modena,
Italy
e-mail: [email protected]
123
J Mater Sci: Mater Med (2011) 22:2329–2338
DOI 10.1007/s10856-011-4408-2
many other therapeutical applications, including its use in
ophtalmic surgery of the vitreous body, in otologic surgery
as a regenerator after perforation of the tympanic mem-
brane and, in orthopedics, as an antiphlogistic lubricant and
a preserving agent of joint’s synovial fluid [1].
HA is administered as a high molecular weight com-
pound; such a formulation prevents degradation by physio-
logical hyaluronidases, thus allowing long time persistence
of HA and no production of small fragments. Notoriously,
the latter would promote undesirable inflammatory reac-
tions due to their direct interactions with the cells of the
innate immune system. A better understanding of the wide
spectrum role of HA, both in biological and pathological
conditions, has been recently reviewed [7].
In spite of such a wide employment, only a few studies
have been conducted to assess the effects, if any, of HA on
infectious agents. Initial in vitro evidence ascribes to HA
an antiviral activity with respect to HSV2 [8], rubella virus,
Newcastle disease virus and vesicular stomatitis virus [9].
Recently, a study conducted by our group on the in vitro
antiviral and virucidal activity of a high molecular weight
HA demonstrates that, depending upon the virus consid-
ered, HA may exert strong (on Coxsackievirus B5, Mumps
virus and Influenza Virus A/H1N1), mild (on HSV1 and
Porcine parvovirus) or even no antiviral activity (on Ade-
novirus-5, HHV-6, Porcine Reproductive and Respiratory
Syndrome Virus), whereas no virucidal activity was ever
observed [10].
As for bacteria, scant and sometimes controversial data
are available. In one hand, it has been reported that
staphylococci and streptococci are able to grow in presence
of Na-hyaluronate (0.7%); accordingly, it has been sug-
gested that, by producing hyaluronidases in the presence of
HA, such bacteria may immediately obtain low molecular
weight sugars, useful as nutrients [11]. In line with this
hypothesis, a decrease in viscosity of extracellular matrix
has been recorded, thus likely facilitating microbial spread;
as a matter of fact, most hyaluronidase producing Gram
positive bacteria are able to cause skin and/or mucosal
infections. Furthermore, Zhang and coworkers [12] have
shown that, in HA-enriched growth medium, Streptococcus
pyogenes upregulates several virulence factors emphasiz-
ing that the streptococcal ability to degrade HA should
be considered as a virulence factor itself. On the other
hand, several papers provide evidence that HA can exert
bacteriostatic effects on staphylococci and streptococci,
depending on HA concentration and molecular weight [11,
13–15]. Additional studies claim that Pseudomonas aeru-
ginosa is not affected by HA [14–16]. Finally, up to date,
no direct bactericidal or fungicidal effects by HA have
been observed [13, 17].
Here, by an in vitro assay, we investigated the effects of
HA on a group of bacterial and fungal strains, mostly
known to be clinically relevant as common cause of human
infections, either at mucosal/skin level or in tissues as
responsible of iatrogenic infections associated with clinical
practice. We show that HA can have different effects on
different microbial species and sometimes also on different
strains belonging to the same species.
2 Materials and methods
2.1 Culture media
The following liquid and solid media were used for strain
maintenance and viable count assessment: Brain Heart
Infusion (BHI) and Brain Heart Agar (BHA) (Oxoid,
Hampshire, U.K.) for the bacterial strains, Sabouraud
Dextrose Broth (SDB—Biokar Diagnostics, France) and
Sabouraud Dextrose Agar (SDA—Oxoid, Hampshire,
U.K.) for the yeast strains. The following selective media
were used to identify the bacterial strains: Mannitol Salt
Agar (MSA—Fluka Biochemika, Germany) for staphylo-
cocci; Mitis salivarius Agar (MsA—Becton–Dickinson,
MD, USA) for oral streptococci; McConkeyAgar (Oxoid,
Hampshire, U.K.) for Escherichia coli and Pseudomonas
aeruginosa; Bile Aesculin Agar (BAA—Oxoid, Hamp-
shire, U.K.) for enterococci.
2.2 Hyaluronic acid
High molecular weight (1837 kDa) hyaluronic acid in
powder (batch #A04A 13/03/2008, Shiseido Co. Ltd.,
Kakegawa Factory, Japan) was gently provided by IBSA
(Institute Biochemique SA, Lugano, CH). HA was diluted
in sterile saline solution to obtain a final concentration of
8 mg/ml. After a complete resuspension, (obtained through
a 24 h stirring) and sterilization by using 0,45 lm filters
(Schleicher & Schuell, Germany), HA solution was ali-
quoted and frozen at -20�C until use.
2.3 Microorganisms
The following 11 bacterial and 4 fungal strains were
employed: Enterococcus faecalis (ATCC 29212), E. hirae
(ATCC 10541), Escherichia coli (ATCC 10536, 13762 and
25922), Pseudomonas aeruginosa (ATCC 15442 and
27853), Staphylococcus aureus (ATCC 25923), S. epide-
rmidis (ATCC 12228), Streptococcus mutans (ATCC
25175), S. sanguinis (ATCC 10556), Candida albicans
(ATCC 90028 and 90029), C. glabrata (ATCC 90030) and
C. parapsilosis (ATCC 22019).
In order to perform experiments, microbial cells (from
stocks kept at -80�C) were revitalized in BHI or SDB
and then checked for purity on selective agar plates. From
2330 J Mater Sci: Mater Med (2011) 22:2329–2338
123

isolated colonies, subcultures were expanded in broth, for
18 h (bacteria) and 24 h (yeasts), up to a microbial con-
centrations of 1.5 9 108 CFU/ml for the bacteria and
1.5 9 106 CFU/ml for the fungi, according to the optical
density (O.D.) of the 0.5 McFarland standard [18].
Finally, the microbial suspensions were prepared in BHI
(bacterial strains) or SDB (fungal strains), in order to
obtain the working concentrations of 5 9 106 CFU/ml or
5 9 103 CFU/ml for the bacteria and 5 9 105 CFU/ml for
the fungi. As an internal control, viable counting was
performed.
McFarland standards were prepared, as detailed else-
where [18], and used as reference for densitometric assays,
using the Tecan Sunrise microplate reader (Tecan,
Austria).
2.4 Evaluation of HA effect on microorganisms
The assay was performed in 96-well microplates (Corning
Inc., NY, USA); 100 ll/well of microbial suspensions
were added to 100 ll/well of saline (control) or HA, at
the final concentrations of 4 mg/ml (HA1), 2 mg/ml
(HA2), 1 mg/ml (HA3), 0.5 mg/ml (HA4) and 0.25 mg/ml
(HA5). The blank wells contained only BHI, with saline
solution, or HA at the above mentioned concentra-
tions. McFarland standards were dispensed in each plate
(200 ll/well), as internal controls. Every condition was
tested in quadruplicate wells. The plates were incubated at
37�C in a moist chamber. The O.D. values were read
immediately (time 0) and at hourly intervals (with the
exception of night hours) for at least 72 h. At the end of
each experiment, viable counts were assessed by Colony
Forming Units (CFUs) assay in some wells, randomly
sampled.
O.D. values were measured at two different wavelengths
(595 nm for the bacteria and 540 nm for the yeasts) by
means of a microplate reader (Tecan, Austria).
2.5 Data analysis
Data obtained from the O.D. readings were used to draw
charts where O.D. was expressed as a function of time.
Each point of the curves represented the average value of 4
replicates (subtracted of the blank) of the same experi-
mental condition. The standard deviation values were not
reported to facilitate charts’ reading. Statistical analyses
were performed at approximately 6 h intervals: at each
fixed time, analysis of variance (ANOVA) and Bonferroni
post hoc test were carried out to assess overall difference in
O.D. readings obtained from different groups in relation to
control groups. Statistical significance was set at P \ 0.05,
while P values\0.01 were indicative of highly statistically
significant differences.
3 Results
3.1 Effects of HA on staphylococcal strains
In order to evaluate the effect of HA on staphylococcal
strains, S. aureus ATCC 25923 (Fig. 1a, b) and S. epide-
rmidis ATCC 12228 (Fig. 1c, d) were employed at two
starting bacterial loads, 5 9 103 CFU/ml (Fig. 1a, c) and
5 9 106 CFU/ml (Fig. 1b, d). At time 0, bacteria were
exposed to increasing concentrations of HA (from
0.25 mg/ml to 4 mg/ml, as detailed in Sect. 2) and then
assessed for O.D. at different times, up to 72 h. As shown
in Fig. 1, each staphylococcal species displayed a peculiar
trend, in the kinetics of O.D.; the curve profiles appeared
very similar (panel A vs. panel B; panel C vs. panel D) and
only slightly shifted towards later times, when considering
the lower bacterial starting concentration. In particular,
S. aureus O.D. increased by the time in all groups; yet,
when compared to controls, HA-treated bacteria showed
delayed and lower O.D. curves depending on the HA doses
(panels A and B). When assessing S. epidermidis in the
presence of HA (panels C and D), we found little or no
O.D. increase in bacteria exposed to the three highest HA
doses, while at 0.5 mg/ml (HA4), a gradual increment in
O.D. occurred after 30 h and reached the maximal levels,
comparable to the controls’ values, between 50 and 60 h.
In both experimental conditions (panels C and D), control
group’s O.D. partially decreased at 70–72 h.
Statistical analysis, performed on data depicted in panels
B and D, showed that the differences in O.D., between S.
aureus exposed to each HA concentration and the control
group, were highly significant at all the time points; the
only exception was the lowest dose (HA5), where signifi-
cance was lost after 6 h of incubation (Fig. 1, bottom left
panel). As for S. epidermidis (Fig. 1, bottom right panel),
the differences in O.D. between HA-treated and control
groups were statistically significant at all the concentra-
tions with the exception of HA5, where significance was
lost after 10 h of incubation and it was regained at 72 h
(P \ 0.05). It should be noted that, at 70–72 h, the sig-
nificance occurring between control and HA4 or HA5 O.D.
was actually due to control levels being significantly below
those observed in HA-treated groups.
In parallel groups, viable cells were determined as CFUs
(viable CFUs) in HA-treated and untreated groups and then
compared to the bacterial concentrations estimated by O.D.
(O.D. CFUs). As an example, for S. epidermidis at 72 h,
the O.D. CFUs versus viable CFUs were 5.3 9 109 versus
2.4 9 109 (controls), 6.8 9 109 versus 3.3 9 109 (HA5-
treated bacteria), 6.4 9 109 versus 1.2 9 109 (HA4-treated
bacteria), 2.7 9 109 versys 1.2 9 109 (HA3-treated bac-
teria), 1.8 9 109 versus 0.6 9 109 (HA2-treated bacteria),
1.4 9 109 versus 0.1 9 109 (HA1-treated bacteria). Based
J Mater Sci: Mater Med (2011) 22:2329–2338 2331
123

on the similarities between viable CFUs and O.D. CFUs,
hereafter, the O.D. reading was taken as measure of bac-
terial load, while viable CFUs were occasionally evaluated.
3.2 Effects of HA on streptococcal and enterococcal
strains
In order to evaluate the effects of HA on streptococci and
enterococci, 4 strains were selected: S. mutans ATCC 25175,
S. sanguinis ATCC 10556, E. faecalis ATCC 29212 and
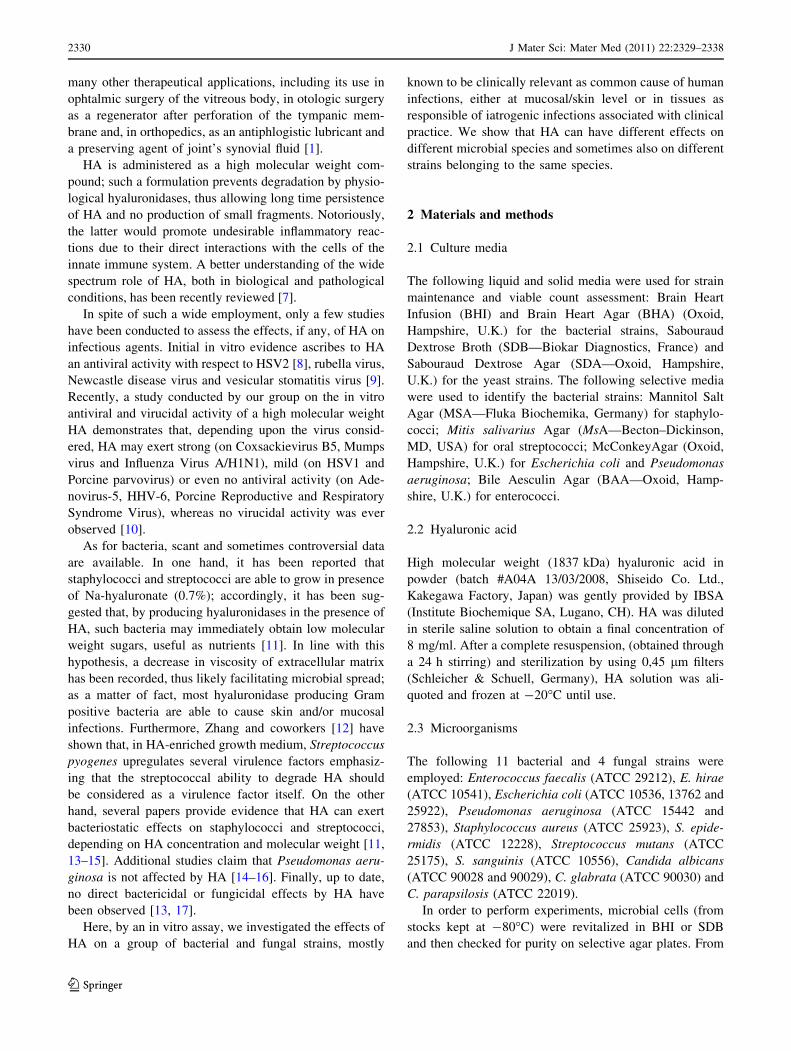
E. hirae ATCC 10541. Figure 2 depicts the O.D. values of
HA-treated and untreated groups as a function of time.
HA displayed a strong inhibitory effect on S. mutans, at
all the doses from 24 h onwards (Fig. 2a). In particular,
while control group slowly and gradually increased,
reaching the plateau level after 48 h, the HA-treated groups
showed a delayed O.D. increase irrespectively of the doses,
reaching plateau levels much below the control group
(P \ 0.01), at all the time-points.
As shown in Fig. 2b, also S. sanguinis was influenced by
HA, but to a different extent. In particular, between 6 and
10 h, a significant dose-dependent reduction of O.D. was
observed (groups HA1, HA2, HA3 vs control group).
Unexpectedly, a drastic and transient (20–35 h) increment
in O.D. was detected in HA1-treated streptococci. Later on,
as well as for all the other groups, no statistically signifi-
cant differences were recorded.
As depicted in Fig. 2c, E. faecalis showed a rapid and
sharp increase in O.D. reaching the maximal values at 10 h
(control and HA5), 22 h (HA4), or 26 h (HA3), followed by a
slight time-related decrease in all the three treated groups as
well as in the control. Differently, O.D. of HA2-treated
bacteria after an initial increase (0–10 h) remained at the
same O.D. levels up to 36 h; then, a gradual increment
occurred and maximal O.D. levels were achieved at the latest
time-points (from 70 h on). In contrast, E. faecalis exposed
at the highest dose (HA1) showed O.D. levels that, after an
initial peak (reaching at 10 h values about half of controls)
gradually decreased by the time. Statistically significant
differences were consistently recorded.
As shown in Fig. 2d, HA displayed a clear inhibitory
dose-dependent effect against E. hirae, being the O.D. of
A
B
0,00,20,40,60,81,01,21,41,61,8
0 10 20 30 40 50 60 70 80
Time (hours)
O.D. S. aureus 25923 (5 x 10 3CFU/ml)
0,00,20,40,60,81,01,21,41,61,8
0 10 20 30 40 50 60 70 80Time (hours)
O.D.
6h 10h 24h 33h 48h 52h 56h 72h
HA1 ** ** ** ** ** ** ** **HA2 ** ** ** ** ** ** ** **HA3 ** ** ** ** ** ** ** **HA4 ** ** ** ** ** ** ** **HA5 ** - - - - - - -
S. aureus 25923(5 x 10⁶ CFU/ml)
C
D
0,0
0,2
0,4
0,6
0,8
1,0
1,2
1,4
0 10 20 30 40 50 60 70 80Time (hours)
O.D. S. epidermidis 12228
12228
(5 x 10³ CFU/ml)
S. epidermidis
0,0
0,2
0,4
0,6
0,8
1,0
1,2
1,4
0 10 20 30 40 50 60 70 80Time (hours)
O.D.
6h 10h 24h 33h 48h 52h 56h 72h
HA1 ** ** ** ** ** ** ** **HA2 ** ** ** ** ** ** ** **HA3 ** ** ** ** ** ** ** **HA4 ** ** ** ** ** * - **HA5 ** ** - - - - - **
(5 x 10⁶ CFU/ml)
Fig. 1 Effects of HA on staphylococcal strains. Kinetic curves of
O.D. in S. aureus ATCC 25923 (panels a and b) and S. epidermidisATCC 12228 (panels c and d). The bacteria were exposed to five
different HA concentrations (4, 2, 1, 0.5 and 0.25 mg/ml) or to
medium (control). The bacteria were employed at two different
starting concentrations, 5 9 103 CFU/ml (panels a and c) and
5 9 106 CFU/ml (panels b and d). Lower panels: statistical
significance between HA-treated and untreated S. aureus and
S. epidermidis, at the starting concentration of 5 9 106 CFU/ml.
Eight different time points are shown. filled diamond controls (no
hyaluronic acid); square HA1 (4 mg/ml hyaluronic acid); triangleHA2 (2 mg/ml hyaluronic acid); times HA3 (1 mg/ml hyaluronic
acid); snowflake HA4 (0.5 mg/ml hyaluronic acid); circle HA5
(0.25 mg/ml hyaluronic acid). **Highly significant (P \ 0.01);
*significant (P \ 0.05); - not significant (P [ 0.05)
2332 J Mater Sci: Mater Med (2011) 22:2329–2338
123
controls always significantly above that of treated bacteria;
in particular, such effect was dose-dependent and signifi-
cant at all the times and with all the HA doses (with the
exception of a partial effect displayed by HA5 group, at
most of the times).
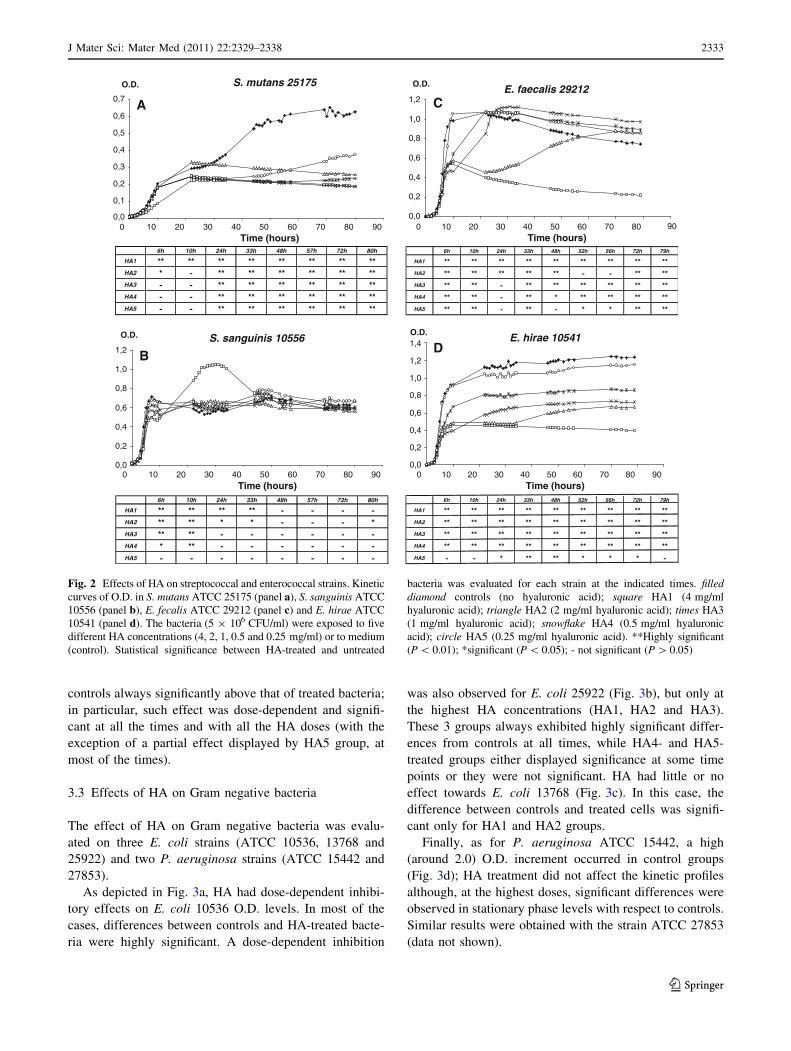
3.3 Effects of HA on Gram negative bacteria
The effect of HA on Gram negative bacteria was evalu-
ated on three E. coli strains (ATCC 10536, 13768 and
25922) and two P. aeruginosa strains (ATCC 15442 and
27853).
As depicted in Fig. 3a, HA had dose-dependent inhibi-
tory effects on E. coli 10536 O.D. levels. In most of the
cases, differences between controls and HA-treated bacte-
ria were highly significant. A dose-dependent inhibition
was also observed for E. coli 25922 (Fig. 3b), but only at
the highest HA concentrations (HA1, HA2 and HA3).
These 3 groups always exhibited highly significant differ-
ences from controls at all times, while HA4- and HA5-
treated groups either displayed significance at some time
points or they were not significant. HA had little or no
effect towards E. coli 13768 (Fig. 3c). In this case, the
difference between controls and treated cells was signifi-
cant only for HA1 and HA2 groups.
Finally, as for P. aeruginosa ATCC 15442, a high
(around 2.0) O.D. increment occurred in control groups
(Fig. 3d); HA treatment did not affect the kinetic profiles
although, at the highest doses, significant differences were
observed in stationary phase levels with respect to controls.
Similar results were obtained with the strain ATCC 27853
(data not shown).
A
BE. hirae 10541
0,0
0,2
0,4
0,6
0,8
1,0
1,2
1,4
0 10 20 30 40 50 60 70 80 90Time (hours)
O.D.
6h 10h 24h 33h 48h 52h 56h 72h 79h
HA1 ** ** ** ** ** ** ** ** **HA2 ** ** ** ** ** ** ** ** **HA3 ** ** ** ** ** ** ** ** **HA4 ** ** ** ** ** ** ** ** **HA5 - - * ** ** * * * -
C
D
E. faecalis 29212
0,0
0,2
0,4
0,6
0,8
1,0
1,2
0 10 20 30 40 50 60 70 80 90Time (hours)
O.D.
6h 10h 24h 33h 48h 52h 56h 72h 79h
HA1 ** ** ** ** ** ** ** ** **HA2 ** ** ** ** ** - - ** **HA3 ** ** - ** ** ** ** ** **HA4 ** ** - ** * ** ** ** **HA5 ** ** - ** - * * ** **
S. sanguinis 10556
0,0
0,2
0,4
0,6
0,8
1,0
1,2
0 10 20 30 40 50 60 70 80 90Time (hours)
O.D.
6h 10h 24h 33h 48h 57h 72h 80h
HA1 ** ** ** ** - - - -HA2 ** ** * * - - - *HA3 ** ** - - - - - -HA4 * ** - - - - - -HA5 - - - - - - - -
0,0
0,1
0,2
0,3
0,4
0,5
0,6
0,7
0 10 20 30 40 50 60 70 80 90Time (hours)
O.D.
6h 10h 24h 33h 48h 57h 72h 80h
HA1 ** ** ** ** ** ** ** **HA2 * - ** ** ** ** ** **HA3 - - ** ** ** ** ** **HA4 - - ** ** ** ** ** **HA5 - - ** ** ** ** ** **
S. mutans 25175
Fig. 2 Effects of HA on streptococcal and enterococcal strains. Kinetic
curves of O.D. in S. mutans ATCC 25175 (panel a), S. sanguinis ATCC
10556 (panel b), E. fecalis ATCC 29212 (panel c) and E. hirae ATCC
10541 (panel d). The bacteria (5 9 106 CFU/ml) were exposed to five
different HA concentrations (4, 2, 1, 0.5 and 0.25 mg/ml) or to medium
(control). Statistical significance between HA-treated and untreated
bacteria was evaluated for each strain at the indicated times. filleddiamond controls (no hyaluronic acid); square HA1 (4 mg/ml
hyaluronic acid); triangle HA2 (2 mg/ml hyaluronic acid); times HA3
(1 mg/ml hyaluronic acid); snowflake HA4 (0.5 mg/ml hyaluronic
acid); circle HA5 (0.25 mg/ml hyaluronic acid). **Highly significant
(P \ 0.01); *significant (P \ 0.05); - not significant (P [ 0.05)
J Mater Sci: Mater Med (2011) 22:2329–2338 2333
123

3.4 Effects of HA on fungal cells
Four Candida spp. strains were assessed for their sensitivity
to HA: C. albicans ATCC 90028 and 90029, C. glabrata
ATCC 90030, and C. parapsilosis ATCC 22019. In par-
ticular, HA caused negligible O.D. variations amongst
treated groups and controls, on the C. albicans ATCC
90029 (Fig. 4a). Accordingly, no statistically significant
differences could be highlighted between controls and
HA-treated cells, the only exception being the fungi incu-
bated with the highest HA concentration (HA1) up to
61 h. A similar trend was obtained with C. albicans 90028
(data not shown).
Differently, as shown in Fig. 4b, C. glabrata was
affected by HA in the range between 0.25 and 2 mg/ml
(HA5 to HA2). Unexpectedly, yeast cells incubated with
4 mg/ml (HA1) showed O.D. values higher than the other
HA-treated groups and just below control’s O.D.. As a
consequence most of the differences between HA-treated
groups and controls were significant at all times, with the
exception of HA1. As for HA-treated C. parapsilosis, O.D.
values were consistently lower than controls’ (Fig. 4c); the
phenomenon was dose-dependent and highly significant for
all the HA doses, but HA5.
4 Discussion
As a major component of the extracellular matrix in con-
nective tissues, HA plays several physiological roles, such
as structure maintenance, moisturizing, tissue lubrication
and wound healing. These features, associated with an
A C
E. coli 25922
0,00,2
0,4
0,6
0,8
1,0
1,2
1,4
1,6
1,8
0 10 20 30 40 50 60 70 80 90Time (hours)
O.D.
6h 10h 24h 33h 48h 52h 56h 72h 79h
HA1 ** ** ** ** ** ** ** ** **HA2 ** ** ** ** ** ** ** ** **HA3 ** ** ** ** ** ** ** ** **HA4 * - - * * * * * -HA5 - - - - - - - - -
P. aeruginosa 15442
0,0
0,5
1,0
1,5
2,0
2,5
0 20 40 60 80 100 120 140
Time (hours)
O.D.
6h 10h 24h 33h 48h 52h 56h 72h 79h 83h 128h
HA1 ** ** ** ** ** ** ** ** ** ** **
HA2 ** ** ** ** ** ** ** ** ** ** **
HA3 ** ** ** ** ** ** ** ** ** ** **
HA4 ** ** ** ** ** ** ** ** ** ** **
HA5 ** ** ** ** - - - - - - -
DB
E. coli 10536
0,00,2
0,4
0,6
0,8
1,0
1,2
1,4
1,6
1,8
0 20 40 60 80 100 120 140Time (hours)
O.D. E. coli 13768
0,00,2
0,4
0,6
0,8
1,0
1,2
1,4
1,6
0 10 20 30 40 50 60 70 80 90
Time (hours)
O.D.
6h 10h 24h 33h 48h 52h 56h 72h 79h 83h 128h
HA1 ** ** ** ** ** ** ** ** ** ** **
HA2 ** ** ** ** ** ** ** ** ** ** **
HA3 ** ** ** ** ** ** ** ** ** ** **
HA4 ** ** ** ** ** ** ** ** ** ** **
HA5 * - * ** ** ** ** ** ** ** **
6h 10h 24h 33h 48h 52h 56h 72h 79h
HA1 - ** ** ** ** ** - * *HA2 - * ** ** ** ** - ** **HA3 - - * - - - - - -HA4 - - * - - - - - -HA5 - - - - - - - - -
Fig. 3 Effects of HA on Gram negative bacteria. Kinetic curves of
O.D. in E. coli ATCC 10536 (panel a), E. coli ATCC 25922 (panel b),
E. coli ATCC 13768 (panel c) and P. aeruginosa ATCC 15442 (panel
d). The bacteria (5 9 106 CFU/ml) were exposed to five different HA
concentrations (4, 2, 1, 0.5 and 0.25 mg/ml) or to medium (control).
Statistical significance between HA-treated and untreated bacteria
was evaluated for each strain at the indicated times. filled diamondcontrols (no hyaluronic acid); square HA1 (4 mg/ml hyaluronic acid);
triangle HA2 (2 mg/ml hyaluronic acid); times HA3 (1 mg/ml
hyaluronic acid); snowflake HA4 (0.5 mg/ml hyaluronic acid); circleHA5 (0.25 mg/ml hyaluronic acid). **Highly significant (P \ 0.01);
*significant (P \ 0.05); - not significant (P [ 0.05)
2334 J Mater Sci: Mater Med (2011) 22:2329–2338
123

excellent safety profile, prompted the use of hexogenous
HA in medical practice as well as in aesthetic and cosmetic
fields [1]. Recently, experimental evidence on antiviral and
antimicrobial properties of HA [8–10, 13, 15, 19] has
added further appeal to HA-containing products used in
clinical practice.
Here, we show that a high molecular weight HA has
different effects on different bacterial and yeast cells. In
particular, we employed a widely accepted in vitro system
[13, 16, 17] that allows simultaneous evaluation of several
HA doses, in multiple replicates that are all repeatedly
assessed for at least 72 h; by this approach real long-term
kinetic curves, devoid of inter-assay variations, are obtained.
By preliminary experiments, we demonstrate that the in
vitro O.D. variations in bacterial cultures exposed to HA do
not depend on the initial bacterial density; as a matter of
fact, the overall trends are very similar in S. epidermidis
and S. aureus when starting with 5 9 103 or 5 9 106
CFU/ml cell concentration; only an expected delay in curve
slopes is recorded, but interestingly the final plateau levels
are comparable between groups treated with the same HA
dose, irrespectively of the initial bacterial load. Moreover,
the superimposable results obtained in terms of viable
CFUs strengthen the relevance of the O.D. as a parameter
to investigate the HA effects on microbial growth. By this
model, we have assessed several bacterial and fungal
species, for at least 72 h and in the presence of different
HA doses, thus, providing a wide-range in vitro picture of
what HA may represent in terms of microbial promotion/
inhibition.
Specifically, our data indicate that S. aureus growth is
affected by HA, with an inhibition proportional to the HA
concentration employed; the only exception is the HA1
dose which returns intermediate inhibitory effects. This
somehow unexpected result consistently occurs also irre-
spectively of the initial microbial load; whether the highest
HA concentration may induce in S. aureus yet unravelled
metabolic pathways capable of reverting the initial inhib-
itory effects remains an open question. In any case, these
results add insights to the controversial literature reporting
A
C
BC. glabrata 90030
0,0
0,2
0,4
0,6
0,8
1,0
1,2
0 10 20 30 40 50 60 70 80 90 100
Time (hours)
O.D.
12h 26h 36h 48h 61h 72h 88h
HA1 ** - - - * - *HA2 ** ** ** ** ** ** **HA3 ** ** ** ** ** ** **HA4 * ** ** ** ** ** **HA5 ** ** ** ** ** ** **
C. parapsilosis 22019
0,0
0,2
0,4
0,6
0,8
1,0
1,2
0 10 20 30 40 50 60 70 80 90 100
Time (hours)
O.D.
12h 26h 36h 48h 61h 72h 88h
HA1 ** ** ** ** ** ** **HA2 ** ** ** ** ** ** **HA3 ** ** ** ** ** ** **HA4 - - - * ** ** **HA5 - - - - - - -
C. albicans 90029
0,0
0,2
0,4
0,6
0,8
1,0
1,2
1,4
1,6
0 10 20 30 40 50 60 70 80 90 100
Time (hours)
O.D.
12h 26h 36h 48h 61h 72h 88h
HA1 ** - * * ** - -HA2 - - - - - - -HA3 * - - - - - -HA4 * - - - - - -HA5 - - - - * - -
Fig. 4 Effects of HA on fungal cells. Kinetic curves of O.D. in
C. albicans ATCC 90029 (panel a), C. glabrata ATCC 90030 (panel
b) and C. parapsilosis ATCC 22019 (panel c). The fungi (5 9 105
CFU/ml) were exposed to five different HA concentrations (4, 2, 1,
0.5 and 0.25 mg/ml) or to medium (control). Statistical significance
between HA-treated and untreated fungi was evaluated for each strain
at the indicated times. filled diamond controls (no hyaluronic acid);
square HA1 (4 mg/ml hyaluronic acid); triangle HA2 (2 mg/ml
hyaluronic acid); times HA3 (1 mg/ml hyaluronic acid); snowflakeHA4 (0.5 mg/ml hyaluronic acid); circle HA5 (0.25 mg/ml hyalu-
ronic acid). **Highly significant (P \ 0.01); *significant (P \ 0.05);
- not significant (P [ 0.05)
b
J Mater Sci: Mater Med (2011) 22:2329–2338 2335
123
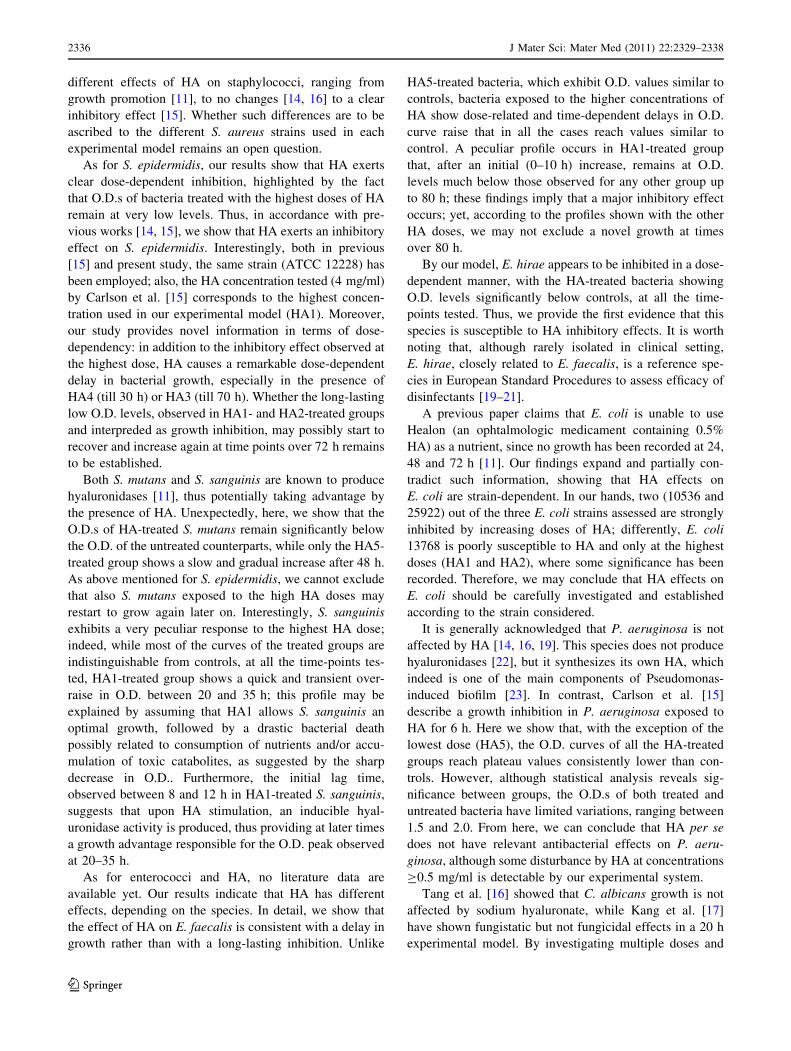
different effects of HA on staphylococci, ranging from
growth promotion [11], to no changes [14, 16] to a clear
inhibitory effect [15]. Whether such differences are to be
ascribed to the different S. aureus strains used in each
experimental model remains an open question.
As for S. epidermidis, our results show that HA exerts
clear dose-dependent inhibition, highlighted by the fact
that O.D.s of bacteria treated with the highest doses of HA
remain at very low levels. Thus, in accordance with pre-
vious works [14, 15], we show that HA exerts an inhibitory
effect on S. epidermidis. Interestingly, both in previous
[15] and present study, the same strain (ATCC 12228) has
been employed; also, the HA concentration tested (4 mg/ml)
by Carlson et al. [15] corresponds to the highest concen-
tration used in our experimental model (HA1). Moreover,
our study provides novel information in terms of dose-
dependency: in addition to the inhibitory effect observed at
the highest dose, HA causes a remarkable dose-dependent
delay in bacterial growth, especially in the presence of
HA4 (till 30 h) or HA3 (till 70 h). Whether the long-lasting
low O.D. levels, observed in HA1- and HA2-treated groups
and interpreded as growth inhibition, may possibly start to
recover and increase again at time points over 72 h remains
to be established.
Both S. mutans and S. sanguinis are known to produce
hyaluronidases [11], thus potentially taking advantage by
the presence of HA. Unexpectedly, here, we show that the
O.D.s of HA-treated S. mutans remain significantly below
the O.D. of the untreated counterparts, while only the HA5-
treated group shows a slow and gradual increase after 48 h.
As above mentioned for S. epidermidis, we cannot exclude
that also S. mutans exposed to the high HA doses may
restart to grow again later on. Interestingly, S. sanguinis
exhibits a very peculiar response to the highest HA dose;
indeed, while most of the curves of the treated groups are
indistinguishable from controls, at all the time-points tes-
ted, HA1-treated group shows a quick and transient over-
raise in O.D. between 20 and 35 h; this profile may be
explained by assuming that HA1 allows S. sanguinis an
optimal growth, followed by a drastic bacterial death
possibly related to consumption of nutrients and/or accu-
mulation of toxic catabolites, as suggested by the sharp
decrease in O.D.. Furthermore, the initial lag time,
observed between 8 and 12 h in HA1-treated S. sanguinis,
suggests that upon HA stimulation, an inducible hyal-
uronidase activity is produced, thus providing at later times
a growth advantage responsible for the O.D. peak observed
at 20–35 h.
As for enterococci and HA, no literature data are
available yet. Our results indicate that HA has different
effects, depending on the species. In detail, we show that
the effect of HA on E. faecalis is consistent with a delay in
growth rather than with a long-lasting inhibition. Unlike
HA5-treated bacteria, which exhibit O.D. values similar to
controls, bacteria exposed to the higher concentrations of
HA show dose-related and time-dependent delays in O.D.
curve raise that in all the cases reach values similar to
control. A peculiar profile occurs in HA1-treated group
that, after an initial (0–10 h) increase, remains at O.D.
levels much below those observed for any other group up
to 80 h; these findings imply that a major inhibitory effect
occurs; yet, according to the profiles shown with the other
HA doses, we may not exclude a novel growth at times
over 80 h.
By our model, E. hirae appears to be inhibited in a dose-
dependent manner, with the HA-treated bacteria showing
O.D. levels significantly below controls, at all the time-
points tested. Thus, we provide the first evidence that this
species is susceptible to HA inhibitory effects. It is worth
noting that, although rarely isolated in clinical setting,
E. hirae, closely related to E. faecalis, is a reference spe-
cies in European Standard Procedures to assess efficacy of
disinfectants [19–21].
A previous paper claims that E. coli is unable to use
Healon (an ophtalmologic medicament containing 0.5%
HA) as a nutrient, since no growth has been recorded at 24,
48 and 72 h [11]. Our findings expand and partially con-
tradict such information, showing that HA effects on
E. coli are strain-dependent. In our hands, two (10536 and
25922) out of the three E. coli strains assessed are strongly
inhibited by increasing doses of HA; differently, E. coli
13768 is poorly susceptible to HA and only at the highest
doses (HA1 and HA2), where some significance has been
recorded. Therefore, we may conclude that HA effects on
E. coli should be carefully investigated and established
according to the strain considered.
It is generally acknowledged that P. aeruginosa is not
affected by HA [14, 16, 19]. This species does not produce
hyaluronidases [22], but it synthesizes its own HA, which
indeed is one of the main components of Pseudomonas-
induced biofilm [23]. In contrast, Carlson et al. [15]
describe a growth inhibition in P. aeruginosa exposed to
HA for 6 h. Here we show that, with the exception of the
lowest dose (HA5), the O.D. curves of all the HA-treated
groups reach plateau values consistently lower than con-
trols. However, although statistical analysis reveals sig-
nificance between groups, the O.D.s of both treated and
untreated bacteria have limited variations, ranging between
1.5 and 2.0. From here, we can conclude that HA per se
does not have relevant antibacterial effects on P. aeru-
ginosa, although some disturbance by HA at concentrations
C0.5 mg/ml is detectable by our experimental system.
Tang et al. [16] showed that C. albicans growth is not
affected by sodium hyaluronate, while Kang et al. [17]
have shown fungistatic but not fungicidal effects in a 20 h
experimental model. By investigating multiple doses and
2336 J Mater Sci: Mater Med (2011) 22:2329–2338
123

measuring microbial O.D. till 90 h in two different strains,
our present findings explain the apparent dichotomy
between the results provided by the literature. A significant
delay in C. albicans O.D. increase is detected initially and
only with the highest HA dose, but no effects are evident at
later times, irrespective of the strain employed. Thus, taken
together, previous and present results indicate that HA may
exert some anticandidal effects, but exclusively at massive
doses and only at early time points, likely as long as fungi
are exponentially growing.
Concerning C. glabrata and C. parapsilosis, our results
provide the first evidence on their susceptibility to HA. In
particular, both strains are inhibited to a similar extent and
in a dose-dependent manner. The only exception is HA1
that, unexpectedly, has little or no effects on C. glabrata,
for reasons that remain to be established. Overall, we may
conclude that HA provides an inhibitory signal also to
fungal pathogens, although to a different extent, depending
on the species considered and the dose of HA employed.
Overall, our findings show that different microbial
species and even different strains belonging to the same
species are differentially affected by a high molecular
weight HA, in dose-dependent fashion. Several hypotheses
may be forwarded to explain these findings. We cannot
exclude the occurrence of non specific antimicrobial
mechanisms. For example, the pronounced ability of this
polysaccharide to absorb and retain water may account for
the impaired and/or delayed growth of some of the tested
microorganisms, after a suitable time-related adaptation
(Figs. 3c, 4a). Also, the interaction between HA and spe-
cific microbial surface moieties, shared only among certain
strains, may influence biological activities, such as bacte-
rial co-aggregation; this hypothesis is in line with the
recent observation that HA exerts distinct antiviral effects
depending upon the virus [10]. Finally, as described above,
unexpectedly no advantage is provided by HA to micro-
organisms commonly considered hyaluronidase producers,
such as Gram positive bacteria. In this respect, studies
performed in minimal medium supplemented with HA as
the unique carbon source, indicate that none of the strains
employed in the present study are able to grow (data not
shown), suggesting that either hyaluronidases are not ade-
quately produced or that the HA here assessed is not sus-
ceptible to microbial hydrolysis. Further wide-spectrum
studies are warranted to investigate these hypotheses.
5 Conclusions
In conclusion, our study provides evidence on the effects
of HA against a wide range of microbial agents, many of
which are known opportunistic pathogens and/or cause of
common iatrogenic infections. Our long-term kinetic study
allows to distinguish among early vs transient vs continu-
ous HA inhibitory effects on microbial agents; to our
opinion, this is a critical aspect since exogenous HA per-
sists for long time in tissues.
We can summarize our data by clustering the investi-
gated microbial strains in three groups: (a) those that show
a dose-dependent growth inhibition by HA, namely
staphylococci, enterococci, S. mutans, two out of three
E. coli strains, P. aeruginosa, C. glabrata and C. parapsilosis;
(b) those that are not affected by HA, i.e. E. coli ATCC
13768 strain and C. albicans; (c) S. sanguinis that seems to
be transiently favoured by HA at 4 mg/ml. Whether and to
what extent these findings may have an in vivo counter-
part remains indeed an open question. Although with its
intrinsic limitations, this in vitro approach has allowed
wide spectrum analysis and long term assessment of HA
biological activity on bacterial and fungal cells, as a pre-
liminary and necessary step toward a better comprehension
of the peculiarities of HA.
Acknowledgments The Authors are grateful to IBSA (Institut
Biochimique SA, CH-6903 Lugano), that founded part of the research
activity and the salary of M.C.
References
1. Romagnoli M, Belmontesi M. Hyaluronic acid-based fillers:
theory and practice. Clin Dermatol. 2008;26:123–59.
2. Vazquez JR, Short B, Findlow AH, Nixon BP, Boulton AJ,
Armstrong DG. Outcomes of hyaluronan therapy in diabetic foot
wounds. Diabetes Res Clin Pract. 2003;59:123–7.
3. Slevin M, Krupinski J, Gaffney J, Matou S, West D, Delisser H,
Savani RC, Kumar S. Hyaluronan-mediated angiogenesis in
vascular disease: uncovering RHAMM and CD44 receptor sig-
nalling pathways. Matrix Biol. 2007;26:58–68.
4. Gao F, Yang CX, Mo W, Liu YW, He YQ. Hyaluronan oligo-
saccharides are potential stimulators to angiogenesis via
RHAMM mediated signal pathway in wound healing. Clin Invest
Med. 2008;31:106–16.
5. Campo GM, Avenoso A, Campo S, D’Ascola A, Nastasi G,
Calatroni A. Molecular size hyaluronan differently modulates
toll-like receptor-4 in LPS-induced inflammation in mouse
chondrocytes. Biochimie. 2010;92:204–15.
6. Campo GM, Avenoso A, Campo S, D’Ascola A, Nastasi G,
Calatroni A. Small hyaluronan oligosaccharides induce inflam-
mation by engaging both toll-like-4 and CD44 receptors in
human chondrocytes. Biochem Pharmacol. 2010;80:480–90.
7. Jiang D, Liang J, Noble PW. Hyaluronan as an immune regulator
in human diseases. Physiol Rev. 2011;91:221–64.
8. Tiunnikov GI, Kostina GA, Radaeva IF, Bakulina LF. Effects of
hyaluronic acid preparation on the development of herpetic
infection in cell culture. Vopr Virusol. 2002;47:37–9.
9. Patterson RL, Peterson DA, Deinhardt F, Howard F. Rubella and
rheumatoid arthritis: hyaluronic acid and susceptibility of cul-
tured rheumatoid synovial cells to viruses. Proc Soc Exp Biol
Med. 1975;149:594–8.
10. Cermelli C, Cuoghi A, Scuri M, Bettua C, Neglia RG, Ardizzoni
A, Blasi E, Iannitti T, Palmieri B. In vitro evaluation of antiviral
J Mater Sci: Mater Med (2011) 22:2329–2338 2337
123

and virucidal activity of a high molecular weight hyaluronic acid.
Virol J. 2011;8:141–8.
11. Costagliola C, Del Prete A, Winkler NR, Carpineto P, Ciancaglini
M, Piccolomini R, Mastropasqua L. The ability of bacteria to use
Na-hyaluronate as a nutrient. Acta Ophtalmol Scand. 1996;74:
566–8.
12. Zhang M, McDonald FM, Sturrock SS, Charnock SJ, Humphery-
Smith I, Black GW. Group A streptococcus cell-associated
pathogenic proteins as revealed by growth in hyaluronic acid-
enriched media. Proteomics. 2007;7:1379–90.
13. Pirnazar P, Wolinsky L, Nachnani S, Haake S, Pilloni A, Bernard
GW. Bacteriostatic effects of hyaluronic acid. J Periodontol.
1999;70:370–4.
14. Bardavio J, Miserachs N, Fava P, Olle M, Rodriguez Y. Estudio
del crecimiento bacteriano in vitro en sustancias viscoelasticas.
Annals d’Oftalmologia. 2003;11:239–44.
15. Carlson GA, Dragoo JL, Samimi B, Bruckner DA, Bernard GW,
Hedrick M, Benhaim P. Bacteriostatic properties of biomatrices
against common orthopaedic pathogens. Biochem Biophys Res
Commun. 2004;321:472–8.
16. Tang ZH, Hou CL, Chen QQ. Experimental study on bacterio-
stasis of chitosan and sodium hyaluronate. Zhongguo Xiu Fu
Chong Jian Wai Ke Za Zhi. 2002;16:259–61.
17. Kang JH, Kim YY, Chang JY, Kho HS. Influences of hyaluronic
acid on the anticandidal activities of lysozyme and the peroxidase
system. Oral Dis. 2011 (in press).
18. Lauderdale TL, Chapin KC, Murray PR. Reagents. In: Murray
PR, Baron EJ, Pfaller MA, Tenover FC, Yolken RH, editors.
Manual of clinical microbiology, 7th edn. ASM Press,
Washington D.C.; 1999. pp. 1665–73.
19. Radaeva IF, Kostina GA, Il’ina SG, Kostyleva RN. Antimicrobial
activity of hyaluronic acid. Zh Mikrobiol Epidemiol Immunobiol.
2001;1:74–5.
20. UNI EN 13697. Chemical disinfectants and antiseptics—
Quantitative non-porous surface test for the evaluation of bacte-
ricidal and/or fungicidal activity of chemical disinfectants used in
food, industrial, domestic and institutional areas—Test method
and requirements without mechanical action (phase 2/step 2);
2001.
21. UNI EN 14349. Chemical disinfectants and antiseptics—Quan-
titative surface test for the evaluation of bacterial activity of
chemical disinfectants and antiseptics used in veterinary field on
non-porous surfaces without mechanical action—Test method
and requirements (phase 2, step 2); 2005.
22. Wretlind B, Heden L, Sjoberg L, Wadstrom T. Production of
enzymes and toxins by hospital strains of Pseudomonas aeru-ginosa in relation to serotype and phage typing pattern. J Med
Microbiol. 1973;6:91–100.
23. Brown MRW, Scott Foster JH, Clamp JR. Composition of
Pseudomonas aeruginosa slime. J Biochem. 1969;112:521–5.
2338 J Mater Sci: Mater Med (2011) 22:2329–2338
123