Embed Size (px)
Citation preview

Invariant mass analysis from run19 AuAu200
Xilin LiangUniversity of California, Riverside
Forward upgrade face to face meetingFeb. 28, 2020

Introduction
ECal
𝜋"(𝐸", �⃗�")𝛾( (𝐸(, �⃗�()
𝛾) (𝐸), �⃗�))𝜃
𝜃: opening angle
𝑑,,
Cluster (Point) 1
Cluster (Point) 2
Energy asymmetry(𝑍,,) = /01/2/03/2
Z ≈ 738 cm
2
• We use Cluster finder to get all the clusters in each event.
total energy of two clusters (points) : E1 + E2
• Sanity check of Ecal prototype by using 𝜋" at run19 AuAu200 data.
• We use Point maker to get all the points in each event.

Data set• We use the AuAu200 data in run19.• Total amount of the data we use is about 97.8 M (16 datasets).• Rough gain assigned to each channel is 0.00086 GeV / ADC Channel
The energy of a cell = sum of ADC in time bin [35 , 60] × gain.• The shower shape scale parameter for point maker is 1.6 .• Keep only min bias trigger data.• Total amount of data left is about 67.9 M• About 69.4% of all the data
3

Event selection for cluster finder / point maker• Step 1: Select clusters / points only at Ecal
• Step 2: Clusters / Point energy cuts
• Each cluster / point energy > 1 GeV
• 𝑍,, < 0.7
• 10 GeV < E1 + E2 < 20GeV ➔ 8 GeV < E1 + E2 < 25 GeV
• Step 3: Detector multiplicity cuts
• 3 <= Tof multiplicity <= 40 ➔ 3 <= Tof multiplicity <= 60
• Ecal multiplicity (energy of hit > 1 GeV) <= 15 ➔ Ecal multiplicity (energy of hit > 1 GeV) <= 20
• Step 4: Select the best pair of clusters / points
• In each event, choose the pair of clusters / points whose total energy is highest
4

Plots (using cluster finder)
The invariant mass plot shows an obvious peak right at 𝜋" invariant mass. The red line indicates the position for 𝜋" invariant mass.
Three lines for expected position for 𝜋" at corresponding Zgg.The lines roughly match.
5

Plots (using point maker)
The invariant mass plot shows an obvious peak right at 𝜋" invariant mass. The red line indicates the position for 𝜋" invariant mass.
Three lines for expected position for 𝜋" at corresponding Zgg.The lines roughly match.
6

Invariant mass sorted by highest energy tower• These plots are invariant mass sorted by highest energy tower from cluster / point of each
event.
• These 64 plots are shown in back up slides (cluster finder: slide 15 – 16) ; (point maker: slide 18 - 19)• Then use an exponential fit for the peak around 𝜋" invariant mass and record the mean for
the exponential fit which is supposed to be the peak for each invariant mass sorted plot.• Most peaks are close to 𝜋" invariant mass.• The peaks that not fit well are mostly at the edge of prototype ECal.
7
Cluster finder Point maker
Conclusion
• Applying gain 0.00086 GeV/ch and only min bias trigger, we get the peak from invariant mass plot right at 𝜋" invariant mass. It looks more likely to be 𝜋" invariant mass peak. This gain should be very close to the best gain for prototype test data.
8

Back up
9

Data set• Total amount of the data we use is about 97.8 M.
• 1. Data set: run20191005 (Totally about 1.6 M events)• 2. Data set: run20191010 (Totally about 1.7 M events)• 3. Data set: run20191013 (Totally about 2.86 M events)• 4. Data set: run20191016 (Totally about 2.3 M events)• 5. Data set: run20192002 (Totally about 7.26 M events)• 6. Data set: run20192008 (Totally about 7.25 M events)• 7. Data set: run20193004 (Totally about 4.55 M events) • 8. Data set: run20193015 (Totally about 2.05 M events)• 9. Data set: run20192011 (Totally about 5.74 M events)• 10. Data set: run20192022 (Totally about 8.72 M events)• 11. Data set: run20193014 (Totally about 8.95 M events)• 12. Data set: run20193018 (Totally about 9.02 M events)• 13. Data set: run20192007 (Totally about 7.25 M events)• 14. Data set: run20192023 (Totally about 9.45 M events)• 15. Data set: run20193020 (Totally about 9.25 M events) • 16. Data set: run20193025 (Totally about 10.0 M events)
10

Gain analysis for data and MC• MC: 40 k MC using Hijing generator (Heavy Ion Jet Interaction
Generator)• We draw the energy spectrum for each tower in ECal, which
are the plots recording the energy of every hit for all the events.• Next we use exponential function (f(x)=exp([0]+[1]*x)) to fit
the energy spectrum, where [1] is the slope from the fit.• Fitting range [30, 130] (GeV) for gain 0.02 GeV/ch data • Fitting range [1,5] (GeV) for MC (using Hijing generator)
11
0 1 2 3 4 5 6 7
8 9 10 11 12 13 14 15
16 17 18 19 20 21 22 23
24 25 26 27 28 29 30 31
32 33 34 35 36 37 38 39
40 41 42 43 44 45 46 47
48 49 50 51 52 53 54 55
56 57 58 59 60 61 62 63
FCS ECal 8 × 8 tower
For data (gain 0.02GeV/ch)
For MC (using Hijing generator)
One example for tower energy spectrum from MC

Gain analysis result• Compare the slope from fit for tower energy spectrum between data and MC. Then use
the formula to calculate the correct gain for data.
• 𝑐𝑜𝑟𝑟𝑒𝑐𝑡 𝑔𝑎𝑖𝑛 = >?@AB CD@E CFG C@D HIGI("."))>?@AB CD@E CFG C@D LM ×𝑔𝑎𝑖𝑛(0.02GeV/ch)
• Reason:• The energy spectrum for towers of data and MC should behave similarly, so they should have the
similar distribution. If we use exponential function to express their spectra, their slope should be same.
• So we choose 0.00086 GeV/ch for data
After gain analysis:The ratio is close to 1
Before gain analysis:The ratio is about 0.043
12

Ecal Mult vs Tof Mult for MC and data• Only consider fcs prototype Ecal tower whose hit energy > 1 GeV • From the MC plot, we choose a wider range: • Tof Multiplicity: [3 , 60] • Ecal Multiplicity: [0 , 20]
13
MC (using Hijing operator) data

Invariant mass plot for each change (cluster finder)
14
No change
Ecal multiplicity (energy of hit > 1 GeV) <= 20
3 <= Tofmultiplicity <= 60
8 GeV < E1 + E2 < 25 GeV

Highest tower sorted invariant mass plot (# 0 - 31)Cluster finder
15
Red line indicates position for 𝜋" invariant mass
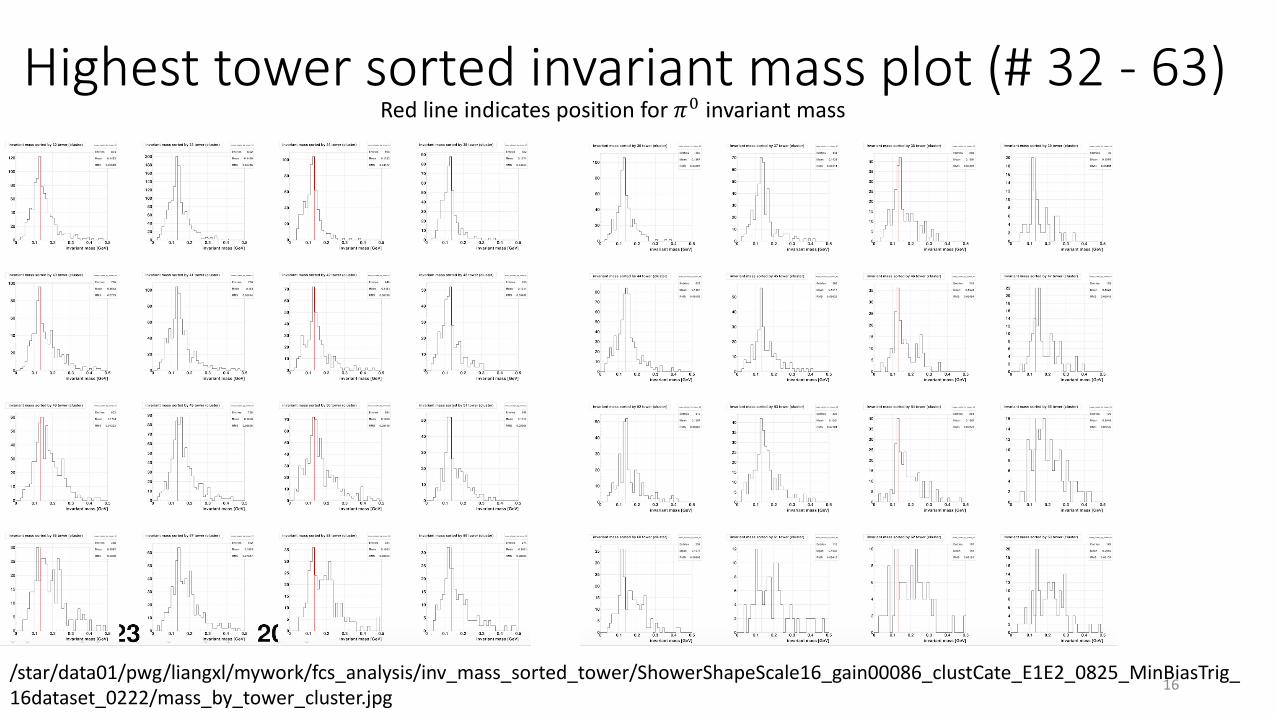
Highest tower sorted invariant mass plot (# 32 - 63)
/star/data01/pwg/liangxl/mywork/fcs_analysis/inv_mass_sorted_tower/ShowerShapeScale16_gain00086_clustCate_E1E2_0825_MinBiasTrig_16dataset_0222/mass_by_tower_cluster.jpg
16
Red line indicates position for 𝜋" invariant mass

Invariant mass plot for each change (point maker)
17
No change
Ecal multiplicity (energy of hit > 1 GeV) <= 20
3 <= Tofmultiplicity <= 60
8 GeV < E1 + E2 < 25 GeV

Highest tower sorted invariant mass plot (# 0 - 31)Point maker
18
Red line indicates position for 𝜋" invariant mass

Highest tower sorted invariant mass plot (# 32 - 63)
/star/data01/pwg/liangxl/mywork/fcs_analysis/inv_mass_sorted_tower/ShowerShapeScale16_gain00086_clustCate_E1E2_0825_MinBiasTrig_16dataset_0222/mass_by_tower_point.jpg
19
Red line indicates position for 𝜋" invariant mass