Embed Size (px)
Citation preview
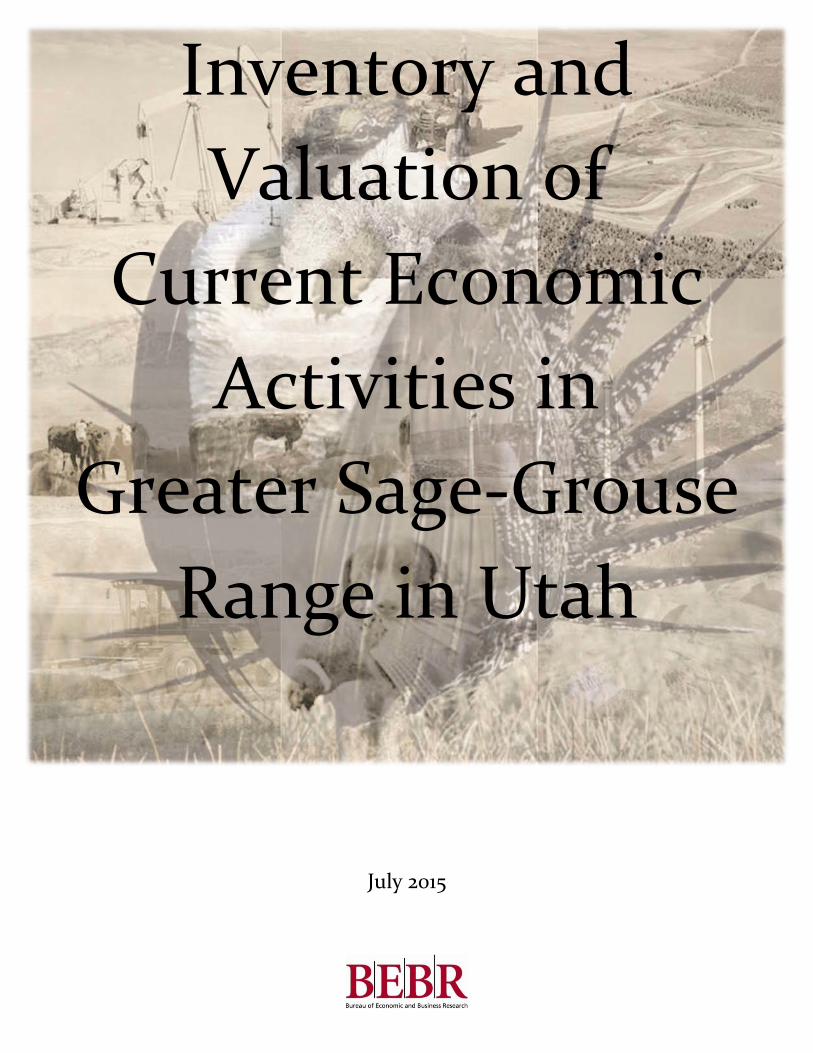
Inventory and Valuation of
Current Economic Activities in
Greater Sage-Grouse Range in Utah
July 2015

PHOTO CREDITS: GREATER SAGE GROUSE: U.S. FOREST SERVICE, WWW.FS.USDA.GOV/DETAIL/R4/HOME/?CID=STELPRD3815825; OIL WELL: UTAH DEPARTMENT OF ENVIRONMENTAL QUALITY, DEQUTAH.BLOGSPOT.COM/2014_12_01_ARCHIVE.HTML; ATV RIDER: RED CLIFFS DESERT RESERVE, WWW.REDCLIFFSDESERTRESERVE.COM/ RAVEN; COAL HOLLOW MINE: ETHAN MILLER/GETTY IMAGES NORTH AMERICA; CATTLE: SALT LAKE TRIBUNE FILE PHOTO; MILFORD WINDMILLS: REUTERS, GEORGE FREY; HARVESTER: ESCALANTE RANCH; HUNTING DOG: PHEASANT GROVE, PHEASANTGROVEUTAH.COM/UTAH-PHEASANT-HUNTS/; HIDDEN TREASURE MINE: CS MINING, WWW.CSMINING.COM/
INVENTORY AND VALUATION OF CURRENT ECONOMIC ACTIVITIES IN GREATER SAGE-GROUSE
RANGE IN UTAH
Prepared for:
Public Lands Policy Coordination Office Office of the Governor
5110 State Office Building Salt Lake City, Utah 84114-1107
Prepared by:
John C. Downen, Levi Pace, Michael T. Hogue Bureau of Economic and Business Research
David Eccles School of Business University of Utah
July 2015

B U R E A U O F E C O N O M I C A N D B U S I N E S S R E S E A R C H v
CONTENTS
List of Tables ..................................................................................................................................................... vi
List of Figures ................................................................................................................................................... vii
Summary ............................................................................................................................................................. ix Oil and Gas .................................................................................................................................................... x Coal.................................................................................................................................................................. x Metals and Industrial Minerals ................................................................................................................... xi Renewable Energy ........................................................................................................................................ xi Grazing ......................................................................................................................................................... xii Farming ......................................................................................................................................................... xii Recreation .................................................................................................................................................... xiii Private Property Values ............................................................................................................................. xiii
1 Overview and Threats .................................................................................................................................... 1 1.1 Endangered Species Act and Listing Process ..................................................................................... 1 1.2 Greater Sage-Grouse in the West ......................................................................................................... 2 1.3 Greater Sage-Grouse in Utah ................................................................................................................ 3
1.3.1 U.S. Fish and Wildlife Service Current and Historical Range ................................................... 4 1.3.2 Sage-Grouse Management Areas Defined by the State of Utah .............................................. 6 1.3.3 Range Definitions for this Study: FWS Current Range, Historical-Only Range,
and SGMAs ........................................................................................................................................... 7 1.3.4 Management by the State of Utah ................................................................................................ 9
1.4 Threats to Greater Sage-Grouse ......................................................................................................... 10 1.4.1 Natural Threats .............................................................................................................................. 10 1.4.2 Human-Caused Threats ................................................................................................................ 12
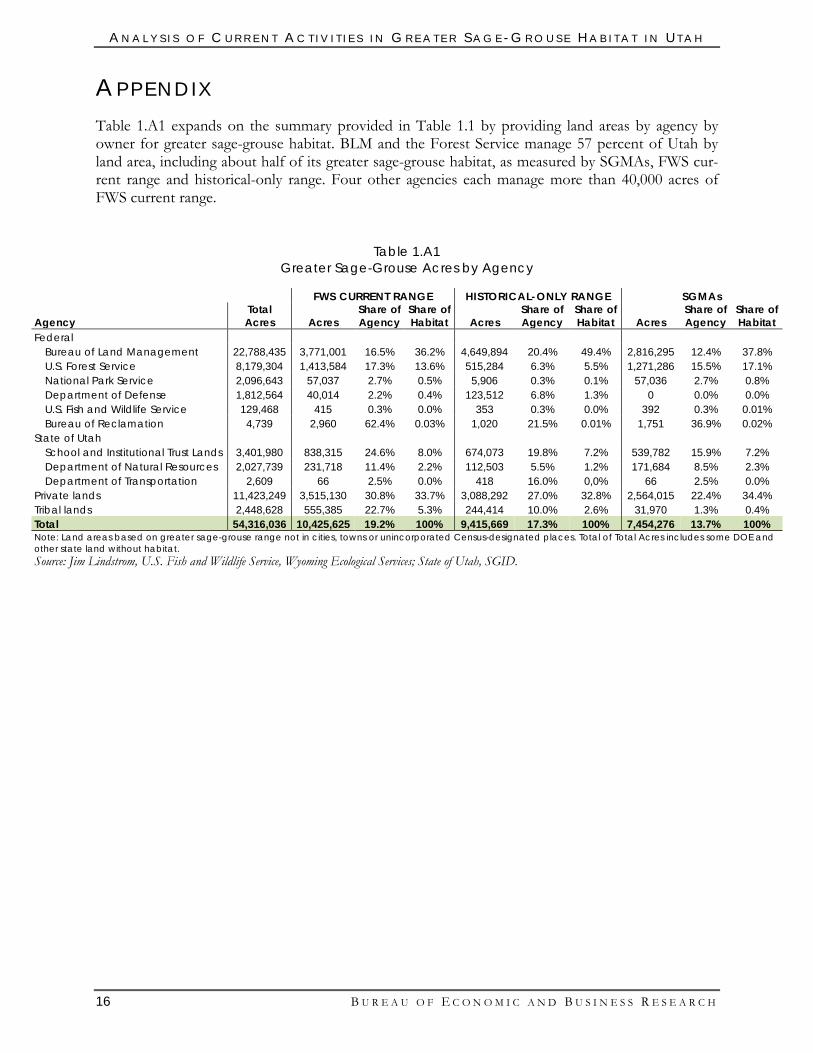
Appendix ...................................................................................................................................................... 16
2 Oil and Natural Gas Production ................................................................................................................ 17 2.1 Methodology .......................................................................................................................................... 17 2.2 Wells Drilled .......................................................................................................................................... 19 2.3 Oil Production Volumes ...................................................................................................................... 21 2.4 Natural Gas Production Volumes ...................................................................................................... 23 2.5 Producing Days ..................................................................................................................................... 25 2.6 Subsequent Work .................................................................................................................................. 27 2.7 Employment .......................................................................................................................................... 28 2.8 Economic Contributions ..................................................................................................................... 30 2.9 Fiscal Contributions.............................................................................................................................. 32 2.10 Oil Shale ............................................................................................................................................... 33
3 Coal ................................................................................................................................................................. 35
4 Metals and Industrial Minerals .................................................................................................................... 37
5 Renewable Energy ........................................................................................................................................ 39
6 Grazing ........................................................................................................................................................... 43
7 Farming .......................................................................................................................................................... 45
A N A L Y S I S O F C U R R E N T A C T I V I T I E S I N G R E A T E R S A G E - G R O U S E H A B I T A T I N U T A H
vi B U R E A U O F E C O N O M I C A N D B U S I N E S S R E S E A R C H
8 Recreation ...................................................................................................................................................... 51 8.1 National Forests .................................................................................................................................... 51 8.2 BLM Lands ............................................................................................................................................ 54 8.3 State Parks .............................................................................................................................................. 55 8.4 Other Lands ........................................................................................................................................... 56 8.5 Hunting and Fishing ............................................................................................................................. 56 8.6 Trail-Based Recreation ......................................................................................................................... 58 Appendix ...................................................................................................................................................... 60
9 ESA Listing and Private Property Values ................................................................................................. 63
References ......................................................................................................................................................... 66
LIST OF TABLES Summary Table 1 Summary of Economic Contributions of Activities in Greater Sage-Grouse
Range in Utah, 2014 ................................................................................................................... xiv Table 1.1 Greater Sage-Grouse Range Acres by Landowner ...................................................................... 8 Table 1.A1 Greater Sage-Grouse Acres by Agency .................................................................................... 16 Table 2.1 Wells Drilled by Greater Sage-Grouse Range, 1980–2014 ....................................................... 20 Table 2.2 Oil Production by Greater Sage-Grouse Range, 1984–2014 ................................................... 22 Table 2.3 Natural Gas Production by Greater Sage-Grouse Range, 1984–2014 ................................... 24 Table 2.4 Producing Days by Greater Sage-Grouse Range, 1984–2014 ................................................. 26 Table 2.5 Subsequent Work by Greater Sage-Grouse Range, 1980–2014 .............................................. 28 Table 2.6 Statewide Employment in Oil and Natural Gas Sectors, 1998–2013 ..................................... 30 Table 2.7 Estimated Economic Contributions of Oil and Gas Activity in Greater Sage-Grouse
Range, 2014 .................................................................................................................................. 31 Table 2.8 Estimated Economic Contributions of Oil and Gas Extraction in Greater Sage-Grouse
Areas, 2014 ................................................................................................................................... 32 Table 2.9 Estimated Economic Contributions of Drilling Oil and Gas Wells in Greater Sage-
Grouse Areas, 2014 ..................................................................................................................... 32 Table 2.10 Estimated Production Values, Tax Revenues, and Royalty Revenues by Sage Grouse
Range During Calendar Year 2014 ........................................................................................... 32 Table 2.11 Estimated Earnings-Related Fiscal Impacts of Oil and Gas Activity in Greater Sage-
Grouse Range, 2014 .................................................................................................................... 33 Table 2.12 Uinta Basin Potential Economic Oil Shale Resource by Greater Sage-Grouse Range ...... 34 Table 3.1 Estimated Economic and Fiscal Effects of Coal Mining in FWS Current Greater
Sage-Grouse Range, 2014 ........................................................................................................... 35 Table 4.1 Estimated Economic Contributions of Other Mining in Greater Sage-Grouse Range,
2014 ............................................................................................................................................... 37 Table 4.2 Estimated Fiscal Impacts of Other Mining in Greater Sage-Grouse Range, 2014 ............... 38 Table 5.1 Estimated Economic Contributions of Renewable Energy Generation in Greater
Sage-Grouse Range, 2014 ........................................................................................................... 39 Table 5.2 Estimated Fiscal Impacts of Renewable Energy Generation in Greater Sage-Grouse
Range, 2014 .................................................................................................................................. 40 Table 6.1 Utilized AUMs in Greater Sage-Grouse Range, 2014 ............................................................... 43 Table 6.2 Estimated Economic Contributions of Cattle and Sheep Grazing in Greater Sage-
Grouse Range in Utah, 2014 ...................................................................................................... 44
A N A L Y S I S O F C U R R E N T A C T I V I T I E S I N G R E A T E R S A G E - G R O U S E H A B I T A T I N U T A H
B U R E A U O F E C O N O M I C A N D B U S I N E S S R E S E A R C H vii
Table 6.3 Estimated Fiscal Impacts of Cattle and Sheep Grazing in Greater Sage-Grouse Range in Utah, 2014 ................................................................................................................................ 44
Table 7.1 Total Agricultural Land Use Acreage in Greater Sage-Grouse Range by Hydrologic Basin .............................................................................................................................................. 45
Table 7.2a Agricultural Land Use Acreage in FWS Current Greater Sage-Grouse Range by Hydrologic Basin ......................................................................................................................... 47
Table 7.2b Share of Agricultural Land Use Acreage in FWS Current Greater Sage-Grouse Range by Hydrologic Basin .................................................................................................................... 47
Table 7.3a Agricultural Land Use Acreage in Historical-only Greater Sage-Grouse Range by Hydrologic Basin ......................................................................................................................... 48
Table 7.3b Share of Agricultural Land Use Acreage in Historical-only Greater Sage-Grouse Range by Hydrologic Basin ........................................................................................................ 49
Table 7.4a Agricultural Land Use Acreage in SGMAs by Hydrologic Basin .......................................... 50 Table 7.4b Share of Agricultural Land Use Acreage in SGMAs by Hydrologic Basin .......................... 50 Table 8.1 Recreation Activity in Greater Sage-Grouse Range for Selected Public Lands in Utah ..... 51 Table 8.2 Summary of Recreation Activity in Greater Sage-Grouse Range in National Forests
in Utah ........................................................................................................................................... 52 Table 8.3 U.S. Forest Service Recreation Sites in Utah .............................................................................. 52 Table 8.4 Acres of Forest Service Lands in Utah by Greater Sage-Grouse Range ................................ 53 Table 8.5 Annual Recreation Visits to National Forests in Utah ............................................................. 53 Table 8.6 Economic Contribution of Spending by National Forest Visitors in Utah ........................... 54 Table 8.7 Summary of BLM Recreation Activity in Greater Sage-Grouse Range in Utah ................... 54 Table 8.8 BLM Recreation Sites in Greater Sage-Grouse Range in Utah ............................................... 54 Table 8.9 FY2013 Recreation Visits on BLM Lands in Utah.................................................................... 55 Table 8.10 Utah State Parks in Greater Sage-Grouse Range ................................................................... 55 Table 8.11 Shares of Hunting and Fishing Activity in Greater Sage-Grouse Range in Utah ............... 57 Table 8.12 Estimated Economic Contributions of Hunting and Fishing in Greater Sage-Grouse
Range in Utah............................................................................................................................... 57 Table 8.13 Estimated Fiscal Impacts from Hunting and Fishing in Greater Sage-Grouse Range
in Utah ........................................................................................................................................... 58 Table 8.14 Trails and Unpaved Roads in Greater Sage-Grouse Range in Utah ..................................... 59 Table 8.A1 Annual Visitor Spending in Greater Sage-Grouse Range of National Forests in Utah
by Trip Type and Spending Category ....................................................................................... 60 Table 8.A2 Utah State Parks in Greater Sage-Grouse Range with 2014 Recreation Visits .................. 61 Table 9.1 Private Lands, Greater Sage-Grouse, and Property Values in Utah ....................................... 64
LIST OF FIGURES Figure 1.1 FWS Greater Sage-Grouse Range, Including Bi-State and Columbia Basin DPSes ............. 3 Figure 1.2 FWS Current Range for Greater Sage-Grouse in Utah ............................................................. 5 Figure 1.3 Historical Range for Greater Sage-Grouse in Utah ................................................................... 6 Figure 1.4 Sage-Grouse Management Areas in Utah .................................................................................... 7 Figure 1.5 Revised Range for Greater Sage-Grouse in Utah ....................................................................... 9 Figure 2.1 Active, Producing and Drilled Oil and Gas Wells in Greater Sage-Grouse Range ............. 18 Figure 2.2 Wells Drilled by Greater Sage-Grouse Range, 1980–2014 ..................................................... 19 Figure 2.3 Oil Production by Greater Sage-Grouse Range, 1984–2014 .................................................. 21 Figure 2.4 Natural Gas Production by Greater Sage-Grouse Range, 1984–2014 .................................. 23
A N A L Y S I S O F C U R R E N T A C T I V I T I E S I N G R E A T E R S A G E - G R O U S E H A B I T A T I N U T A H
viii B U R E A U O F E C O N O M I C A N D B U S I N E S S R E S E A R C H
Figure 2.5 Producing Days by Greater Sage-Grouse Range, 1984–2014 ................................................ 25 Figure 2.6 Subsequent Work by Greater Sage-Grouse Range, 1980–2014 ............................................. 27 Figure 2.7 Statewide Employment in Oil and Natural Gas Sectors, 1990–2013 .................................... 29 Figure 2.8 Utah’s Potential Economic Oil Shale Resources and Greater Sage-Grouse Range ............ 34 Figure 3.1 Mines in Greater Sage-Grouse Range ........................................................................................ 36 Figure 5.1 Renewable Energy Generation in Greater Sage-Grouse Range ............................................. 40 Figure 7.1 Agricultural Land Use, Hydrologic Basins and Greater Sage-Grouse Range ...................... 46
B U R E A U O F E C O N O M I C A N D B U S I N E S S R E S E A R C H ix
SUMMARY The U.S. Fish and Wildlife Service (FWS) is considering whether greater sage-grouse (Centrocercus urophasianus) warrants a range-wide (including Utah) listing under the Endangered Species Act. The Service is under court order to make a decision by September 30, 2015. FWS may return a listing-not-warranted decision, an endangered listing, or a threatened listing. Listed species are then man-aged by FWS. A threatened listing is more flexible than an endangered listing. Listing of the greater sage-grouse would have unknown but potentially significant effects on current and possible future activities in areas designated as critical habitat. Because we do not know what restrictions would come into force with either a threatened or endangered listing, the purpose of this study is to identify and, where possible, put a value on the current economic activities in sage-grouse range. In most cases, we were able to estimate the employment, earnings and gross state product contributions of those activities, as well as some state and local revenue impacts. We do not consider how these activities would be affected by an ESA listing, nor how they affect greater sage-grouse and their habitat. In order to evaluate a range of possible areas that could be affected by a listing, we used three defini-tions. FWS current greater sage-grouse range (“FWS current range”) is that used by FWS in its 2015 Status Review. FWS current range amounts to 10.4 million acres in Utah. “Historical-only range” also comes from FWS and is based on the research of Michael A. Schroeder, research biologist for the Washington State Department of Fish and Wildlife. It excludes those portions of historical range that are also FWS current range. Excluding cities, towns and unincorporated Census-designated places, there are 9.4 million acres of historical-only range in Utah. Finally, we used the Utah Division of Wildlife Resources’ 2013 Sage Grouse Management Areas (“SGMAs”). These are essentially a subset of FWS current range, covering almost 7.5 million acres and including more than 90 percent of known sage-grouse in Utah (UDWR 2013). The Utah population of greater sage-grouse is measured by annual counts of males at leks. During 2010 to 2014, DWR counted an average of 3,682 males (Bernales, Robinson, and Blair 2015). Popu-lation levels display substantial normal fluctuations in recent years and historically. Utah sage-grouse populations occupy habitats that are naturally fragmented based on topography. Some of these habitats have experienced additional loss and fragmentation from both natural and human causes. Wildfire, invasive plants, climate and predation are natural threats that humans may mitigate or compound. Oil, gas and renewable energy development; mining; crop and livestock agri-culture; recreation; urbanization; and infrastructure installation and maintenance are human activities that may further fragment or destroy sage-grouse habitat, but like many natural threats, they are mit-igable. The most significant threats in Utah are wildfire, invasive and encroaching plants, and energy development in FWS current and historical range, and wildfire and invasive and encroaching plants in SGMAs. Secondary concerns are agriculture, urbanization and infrastructure.
A N A L Y S I S O F C U R R E N T A C T I V I T I E S I N G R E A T E R S A G E - G R O U S E H A B I T A T I N U T A H
x B U R E A U O F E C O N O M I C A N D B U S I N E S S R E S E A R C H
OI L A ND GA S In 2014 3,200 wells produced 13.4 million barrels of oil and 91.0 billion cubic feet (bcf) of gas in FWS current greater sage-grouse range. In historical-only range there were 5,042 wells producing 17.1 million barrels of oil and 175.8 bcf of gas. And in state Sage Grouse Management Areas (SGMAs) 143 wells produced 87,800 barrels of oil and 9.7 bcf of gas. There were also 378 new wells drilled (spuds) in FWS current sage-grouse range and 330 spuds in historical-only range. No new wells were drilled in SGMAs. The estimated total economic contribution of oil and gas activity in greater sage-grouse range in 2014 consisted of 5,608 jobs with $440.9 million in earnings from FWS current sage-grouse range, 8,215 jobs with $660.5 million in earnings from historical-only range, and 205 jobs with $17.0 mil-lion in earnings from SGMAs. The estimated total value-added or gross state product contributions from activity in these three sage-grouse areas were $1,688.5 million, $2,342.0 million and $46.2 mil-lion, respectively. In 2014 oil and natural gas production from wells located in historical-only range generated the greatest market value among the three areas, at just under $2 billion. Production within this area generated an estimated $283 million in royalty revenue to all lessors combined, with $74 million of that total received by the state, plus almost $27 million in severance tax revenues, $1.8 million in conservation fees, $20 million in property taxes, and $3.6 million in sales taxes. In contrast, the esti-mated value of production from wells within SGMAs was about $42 million, generating approxi-mately $6.3 million in royalty revenues to all lessors combined, with $1.3 million of that total received by the state, $580,000 in state severance taxes, $40,000 in conservation fees, $430,000 in property taxes, and $80,000 in sales taxes. In the Uinta Basin, under FWS current range there are an estimated 37.8 billion barrels of potentially economic oil in oil shale. Historical-only range could overlie another 19.4 billion barrels. Under SGMAs there are an estimated 0.2 billion barrels of potential economic oil from oil shale.
COA L There are three active coal mines located in FWS current sage-grouse range: Skyline in Carbon County, SUFCO in Sevier, and Coal Hollow in Kane. Together they produced almost 11.3 million tons of coal in 2014, with a value of nearly $372.9 million. The estimated total economic contribution of coal mining in FWS current greater sage-grouse range consists of 2,394 jobs, $132.0 million in earnings, and $433.3 million in GSP. Estimated state and county fiscal impacts associated with these mines totaled $27.6 million in 2014, comprising $10.2 million in income and sales taxes, $13.9 million from the state share of federal royalties, and $3.5 million in property taxes.
A N A L Y S I S O F C U R R E N T A C T I V I T I E S I N G R E A T E R S A G E - G R O U S E H A B I T A T I N U T A H
B U R E A U O F E C O N O M I C A N D B U S I N E S S R E S E A R C H xi
ME TA LS A ND IND USTR I A L MI NE RA LS There are three industrial mineral mines in FWS current sage-grouse range producing phosphate (Simplot, in Uintah County), cement (Holcim Devil’s Slide, in Morgan) and expanded shale (Utelite, in Summit). According to the Utah Geological Survey (2014), in 2013 the Simplot mine produced 3.8 million tons of phosphate, which were processed into about 1.4 million tons of phosphate con-centrate and transported via pipeline to Simplot’s fertilizer plant in Wyoming. The Devil’s Slide quarry and plant produced a portion of 1.0 million tons of cement, and Utelite produced 129,000 tons of expanded shale. Simplot and Devil’s Slide are also located in the state’s SGMAs. In histori-cal-only sage-grouse range there is the Ash Grove Leamington cement quarry and plant in Juab County; the Hidden Treasure copper, magnetite and silver mine in Beaver County; and the United States Gypsum mine in Sevier County. There was no production data available for the United States Gypsum mine, but Ash Grove Leamington produced a portion of 1.0 million tons of cement in 2013 and Hidden Treasure produced approximately 3,000 tons of copper, 14,000 tons of magnetite and 247,000 ounces of silver. The total economic contributions of industrial mineral mining in FWS current sage-grouse range in 2014 were 932 jobs, $35.3 million in earnings, and $85.3 million in GSP. The total economic contri-butions of metal and industrial mineral mining in historic-only sage-grouse range in 2014 amounted to 845 jobs, $32.0 million in earnings, and $77.4 million in GSP. The total economic contributions of industrial mineral mining in SGMAs in 2014 amounted to 826 jobs, $31.3 million in earnings, and $75.6 million in GSP. Mineral mines in FWS current sage-grouse range produced estimated fiscal impacts of $3.3 million in 2014, consisting of almost $2.5 million in state income and sales taxes and over $800,000 in local sales and property taxes. Metal and mineral mines in historical-only sage-grouse range generated al-most $2.5 million in revenues for the state and over $1.0 million in revenues to counties. Activity at the two mines in SGMAs spurred estimated fiscal impacts of nearly $3.0 million: $2.2 million in state income and sales taxes and more than $777,000 in local sales and property taxes.
REN E WA BLE EN E RGY There are currently two existing geothermal electrical generation plants located in greater sage-grouse range: Blundell in Beaver County is in FWS current sage-grouse range and Cove Fort in Mil-lard County is in historical-only range. In 2014 Blundell generated 274,996 MWh of electricity and Cove Fort generated 165,107 MWh according to data from the Energy Information Administration. There are also 44 wind turbines in FWS current range and 51 turbines in historical range. Most of the turbines in FWS current range are part of Phase I of the Milford Wind Corridor in Beaver Coun-ty, with one at the Tooele Army Depot. The turbines in historical-only range are part of Phases I and II of the Milford Wind Corridor in Beaver and Millard counties, nine are at the Spanish Fork Wind Park, and two are are at Camp Williams. In 2014 a combined estimated 203,385 MWh of elec-tricity were generated from turbines located in FWS current sage-grouse range and 189,878 MWh from turbines in historical-only range. The total economic contributions of renewable energy production in FWS current sage-grouse range comprised 138 jobs, $6.8 million in earnings, and $16.8 million in gross state product. The total eco-
A N A L Y S I S O F C U R R E N T A C T I V I T I E S I N G R E A T E R S A G E - G R O U S E H A B I T A T I N U T A H
xii B U R E A U O F E C O N O M I C A N D B U S I N E S S R E S E A R C H
nomic contributions of renewable energy production in historical-only sage-grouse range comprised 103 jobs, $5.1 million in earnings, and $12.5 million in gross state product. For the geothermal plant and windmills in FWS current sage-grouse range, the estimated fiscal im-pacts in 2014 consisted of more than $455,000 of state income and sales taxes and over $2.1 million in local property and sales taxes, for a total fiscal impact of approximately $2.6 million. Geothermal and wind electricity generation in historical-only sage-grouse range in 2014 induced an estimated $361,000 in state income and sales tax revenues and almost $1.1 million in local property and sales tax revenues, for a total fiscal impact of nearly $1.5 million.
GRA ZI NG Just over one-quarter, 25.6 percent, of cattle animal unit months (AUMs) are estimated to be in FWS current sage-grouse range; 22.4 percent of sheep AUMs are. Fifteen percent of cattle AUMs and 20.8 percent of sheep AUMs are in historical-only range. The state’s SGMAs contain an estimated 22.6 percent of cattle AUMs and 17.2 percent of sheep AUMs. Livestock grazing in FWS current sage-grouse range supported an estimated 1,012 jobs, $34.6 mil-lion in earnings, and $52.9 million in gross state product. Grazing in historical-only sage-grouse range provided a total economic contribution of 564 jobs, $18.8 million in earnings, and $28.3 mil-lion in gross state product. Range livestock operations on federal allotments in the state’s SGMAs provided a total economic contribution of 831 jobs, $27.9 million in earnings, and $42.3 million in gross state product. Grazing in FWS current range generated an estimated $2.6 million in state income and sales tax rev-enues and over $300,000 in local sales tax revenues, for a total fiscal impact of nearly $3.0 million. Estimated fiscal impacts from cattle and sheep grazing in historical-only range amounted to $1.6 million, consisting of approximately $1.4 million in state revenues and over $178,000 in local reve-nues. Grazing in the state’s SGMAs generated over $2.1 million in state tax revenues and $246,000 in local revenues, for a total estimated fiscal impact of nearly $2.4 million.
FA RMI NG The most prevalent agricultural land use in FWS current sage-grouse range is pasture,1 claiming over 314,000 acres and accounting for half of the agricultural land use in FWS current range. The other main “uses” are fallow or idle land2 (106,437 acres), alfalfa (81,471 acres), grass hay (75,018 acres) and grain and seeds (28,105 acres). With respect to the total acreage of agricultural land uses in the state, those uses with the greatest share in FWS current sage-grouse range are grass hay (32.3 per-cent), pasture (32.1 percent), fallow or idle land (22.1 percent), safflower (20.8 percent) and oats (17.9 percent).
1 This is based on a water-related land use shapefile and is not related to the grazing allotments shapefile that was used for the grazing analysis. 2 Although this is not an active use of farmland, it is generally a temporary state and the land is likely to be cropped in subsequent years.
A N A L Y S I S O F C U R R E N T A C T I V I T I E S I N G R E A T E R S A G E - G R O U S E H A B I T A T I N U T A H
B U R E A U O F E C O N O M I C A N D B U S I N E S S R E S E A R C H xiii
In historical-only sage-grouse range the most prevalent agricultural land use is pasture, accounting for an estimated 414,232 acres, or 35 percent of the total agricultural acres in this habitat type. The other main uses are alfalfa (251,442 acres), fallow or idle land (226,419 acres), grain and seeds (102,677 acres) and dry land (66,553 acres). The land uses with the greatest shares of their total acre-age in historical range include berries (78.8 percent), beans (75.4 percent), safflower (64.1 percent), other horticulture (57.8 percent) and oats (56.6 percent). Because it covers the most acres of agricul-tural land use, close to 1.2 million, historical-only sage-grouse range also encompasses the largest shares of agricultural uses’ total areas: 10 of the 20 distinct land uses have more than half of their total acreage within historical range. The largest agricultural land uses in SGMAs are pasture, with 178,754 acres; grass hay, with 52,898 acres; fallow or idle land, with 51,496 acres; alfalfa, with 45,715 acres; and grain and seeds, with 18,720 acres. The land uses with the greatest shares of their total acreage in SGMAs include grass hay (22.8 percent), safflower (19.9 percent), pasture (18.3 percent), turf farms (11.8 percent) and fal-low/idle land and oats (both with 10.7 percent).
RE CREA TI ON An estimated 15 percent of recreation visits to national forests, BLM lands, and state parks in Utah from 2009 to 2014 were in the FWS current range of greater sage-grouse, 25 percent when historical range is added. Analysis of specific recreation sites on these public lands provides more conservative estimates of recreation activity in habitat: 8 percent in FWS current range and another 6 percent in historical range outside of FWS current range. SGMAs received 11 percent of visits and contained 6 percent of recreation sites in the state. Spending in Utah for an estimated 1.4 million hunting and fishing trips to FWS current sage-grouse range on public and private lands was approximately $193 million in 2011 (adjusted for inflation to 2014 dollars). For any type of recreation within FWS current range in national forests, visitor spend-ing in Utah amounted to $62 million (in 2014 dollars) based on spending data collected between FY2005 and FY2012. Based on the share of multiuse trails and unpaved roads in Utah that are within FWS current range, 4 percent to 26 percent of trail-based recreation happens in greater sage-grouse habitat. This in-cludes hiking, biking, OHV use, cross-country skiing, and other trail-based activities.
PRI VA TE PROP E RTY VA L UE S FWS current range of the greater sage-grouse occupies 31 percent of Utah’s 11.4 million acres of private property outside of cities and other Census places. Historical-only range and SGMAs are somewhat smaller but still over 20 percent. A preliminary review of aggregate county-level data sug-gests some $5.7 billion in agricultural and non-primary residential property values may be located in FWS current range, 2.5 percent of the total assessed value of privately owned real property in Utah. Historical-only range and SGMAs may contain $5.2 billion and $3.9 billion, respectively, of private property.
A N A L Y S I S O F C U R R E N T A C T I V I T I E S I N G R E A T E R S A G E - G R O U S E H A B I T A T I N U T A H
xiv B U R E A U O F E C O N O M I C A N D B U S I N E S S R E S E A R C H
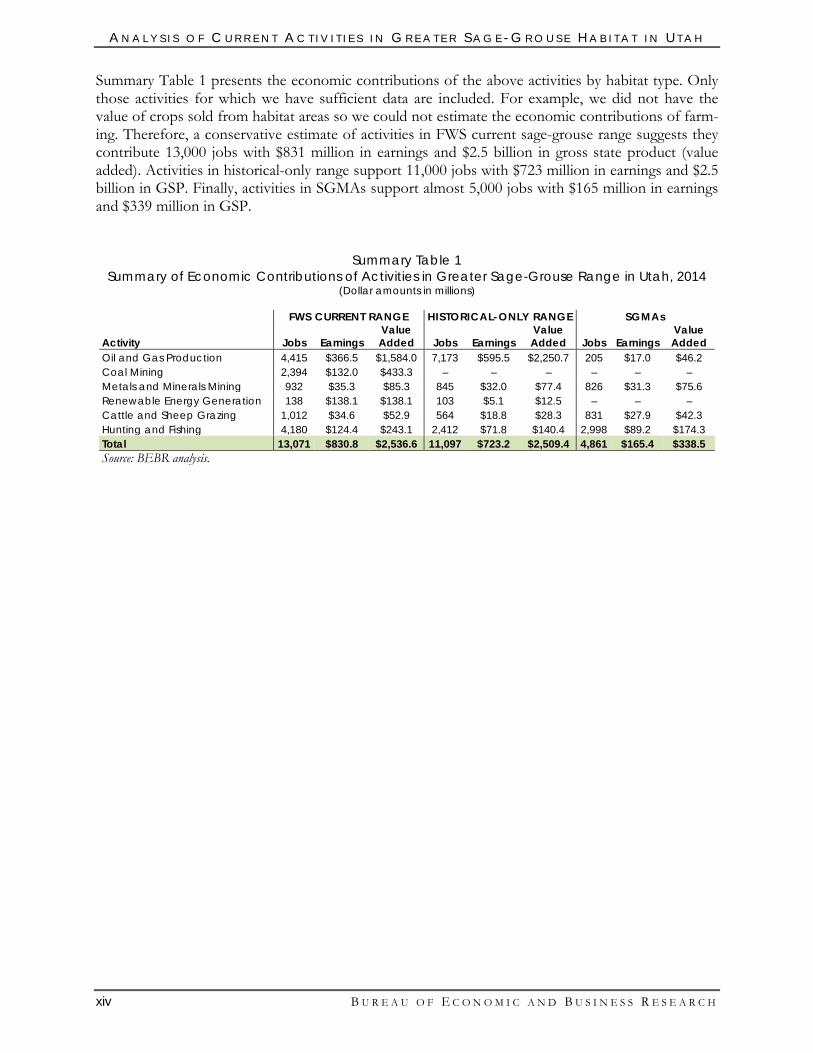
Summary Table 1 presents the economic contributions of the above activities by habitat type. Only those activities for which we have sufficient data are included. For example, we did not have the value of crops sold from habitat areas so we could not estimate the economic contributions of farm-ing. Therefore, a conservative estimate of activities in FWS current sage-grouse range suggests they contribute 13,000 jobs with $831 million in earnings and $2.5 billion in gross state product (value added). Activities in historical-only range support 11,000 jobs with $723 million in earnings and $2.5 billion in GSP. Finally, activities in SGMAs support almost 5,000 jobs with $165 million in earnings and $339 million in GSP.
Summary Table 1 Summary of Economic Contributions of Activities in Greater Sage-Grouse Range in Utah, 2014
(Dollar amounts in millions)
FWS CURRENT RANGE HISTORICAL-ONLY RANGE SGMAs
Activity Jobs Earnings Value Added Jobs Earnings
Value Added Jobs Earnings
Value Added
Oil and Gas Production 4,415 $366.5 $1,584.0 7,173 $595.5 $2,250.7 205 $17.0 $46.2 Coal Mining 2,394 $132.0 $433.3 – – – – – – Metals and Minerals Mining 932 $35.3 $85.3 845 $32.0 $77.4 826 $31.3 $75.6 Renewable Energy Generation 138 $138.1 $138.1 103 $5.1 $12.5 – – – Cattle and Sheep Grazing 1,012 $34.6 $52.9 564 $18.8 $28.3 831 $27.9 $42.3 Hunting and Fishing 4,180 $124.4 $243.1 2,412 $71.8 $140.4 2,998 $89.2 $174.3 Total 13,071 $830.8 $2,536.6 11,097 $723.2 $2,509.4 4,861 $165.4 $338.5 Source: BEBR analysis.
B U R E A U O F E C O N O M I C A N D B U S I N E S S R E S E A R C H 1
OVERVIEW AND THREATS This chapter provides context for the analysis of activities in greater sage-grouse ranges in Utah. We discuss the status of greater sage-grouse range-wide and in Utah following a primer of policies that affect its management. Range definitions used in the remainder of the study are described and mapped. Finally, we review natural and human threats to greater sage-grouse.
1.1 EN DA NGE RE D SP E CI ES A CT A N D L I S T I NG PRO CESS The Endangered Species Act of 1973 (ESA) protects listed plant and animal species on federal, state and private lands.3 A species listed for protection under the ESA may be designated endangered or threatened. An endangered species is one “in danger of extinction throughout all or a significant portion of its range”; a threatened species is one “likely to become an endangered species within the foreseeable future.”4 A threatened listing is more flexible than an endangered listing. The ESA prohibits the take, transport and sale of any endangered species; subject to U.S. Fish and Wildlife Service (FWS) discretion, similar prohibitions apply to threatened species. To take means “to harass, harm, pursue, hunt, shoot, wound, kill, trap, capture, or collect, or to attempt to engage in any such conduct.”5 Harm encompasses an act that results in “significant habitat modification or degradation where it actually kills or injures wildlife by significantly impairing essential behavioral patterns, including breeding, feeding, or sheltering” (National Marine Fisheries Service 1999). Regarding FWS discretion for threatened species, the agency, under the authority of the Secretary of the Interior, “shall issue such regulations as he deems necessary and advisable to provide for the conservation of such species.”6 This language authorizes the so-called “4(d) rule,” which allows flex-ibility regarding responsible land uses that conflict in some respect with the needs of a threatened species. A common type of 4(d) rule is to permit incidental take from agricultural activities covered by an approved conservation plan. The intent of incidental take provisions is to give private land-owners incentives to protect threatened species by making and following conservation plans. The ESA allows the designation of critical habitat for listed species.7 Occupied habitat is protected by the ESA without such a designation. Critical habitat can be outside the occupied range to include potential habitat. Critical habitat protections are relevant where a federal nexus is present, such as project funding or land management. FWS is considering whether an ESA listing is appropriate for the greater sage-grouse in Utah and most other western states. FWS may return a listing-not-warranted decision, an endangered species
3 Within tribal lands, federal support for ESA conservation efforts are by arrangement with the sovereign nations there, and ESA regulations mainly apply where federal funding is used for projects (Sanders 2007). 4 16 U.S.C. 35 § 1532 (6) 5 16 U.S.C. 35 § 1532 (19) 6 16 U.S.C. 35 § 1533 (d) 7 16 U.S.C. 35 § 1532 (5)
1
A N A L Y S I S O F C U R R E N T A C T I V I T I E S I N G R E A T E R S A G E - G R O U S E H A B I T A T I N U T A H
2 B U R E A U O F E C O N O M I C A N D B U S I N E S S R E S E A R C H
listing, or a threatened listing with or without critical habitat or a 4(d) rule. Were a 4(d) rule added to a threatened species listing for greater sage-grouse, the impact in Utah would likely be minimal throughout the 50.7 percent of FWS current habitat that is on federal lands. On the other hand, a critical habitat designation would primarily be relevant on those federal lands. Listed species are managed by FWS, whereas states retain management authority for all other wild-life within their boundaries. FWS invites input and assistance from state agencies as needed to carry out its management plans for listed species.8 The Secretary of the Interior has authority for listing decisions. They are to be based on the status of a species and threats to it, including habitat degradation, species overutilization, disease and preda-tion.9 Consideration of broader economic and social issues and tradeoffs is not required. Governor Gary Herbert has noted that an ESA listing for the greater sage-grouse “would have a significant adverse effect on the economy” (Herbert 2015, p. 3). These may arise from conflicts between habi-tat conservation and a variety of other land uses, including recreation, development and agriculture. If the greater sage-grouse were listed as threatened or endangered, it is likely that some land uses in its habitat in Utah would be curtailed.
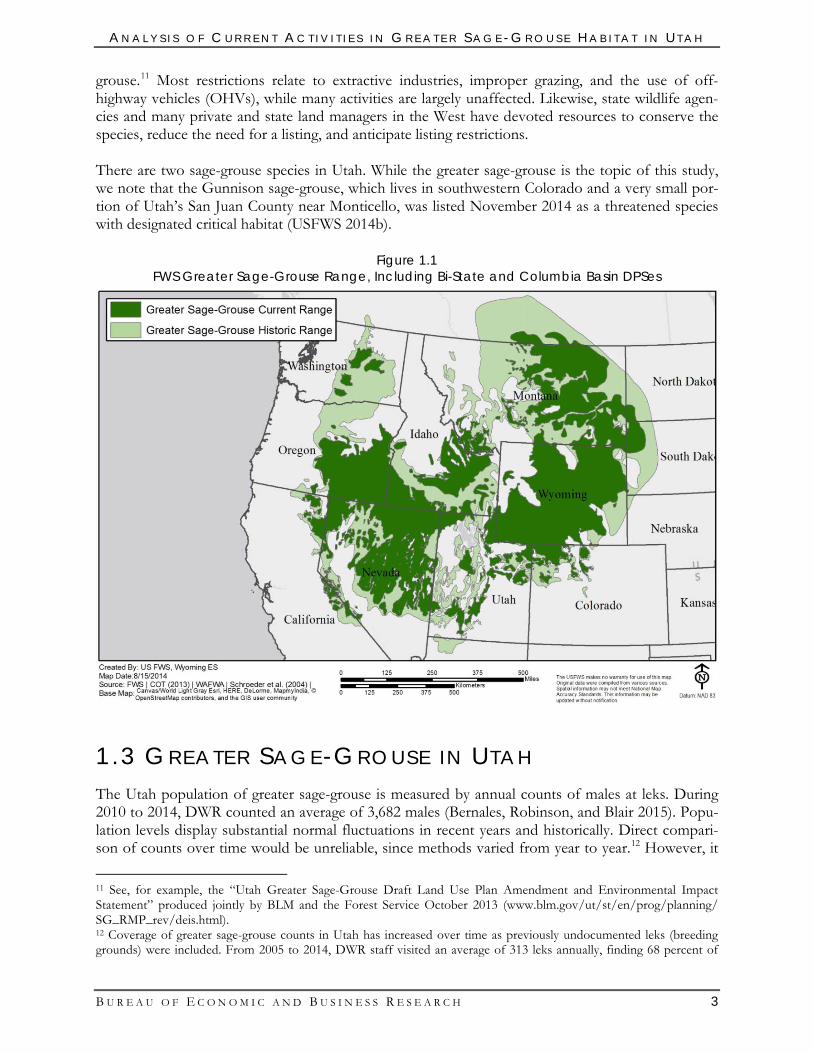
1.2 GREA TE R SA GE-GRO USE I N TH E WE S T The greater sage-grouse is an upland game species that occupies habitat in 11 states, primarily in sagebrush ecosystems (see Figure 1.1) (BLM 2013). Habitat may also include riparian and wet mead-ows during spring and summer and aspen ecosystems in late summer. Sagebrush leaves are the pri-mary source of food for greater sage-grouse in the winter, but grasses, forbs and insects are important parts of the diet at other times.10 An estimated 87 percent or more of greater sage-grouse nests in Colorado, Wyoming, southern Canada and Utah are under sagebrush (Connelly, Rinkes, and Braun 2011). Nests that are not under sagebrush are almost always under some other large bush. Nests under non-sagebrush vegetation generally have lower success rates than those under sage-brush. Prompted by several petitions submitted in the early 2000s, FWS considered an ESA listing for the greater sage-grouse range-wide and determined in 2005 a listing was not warranted (USFWS 2010). A December 2007 decision from the U.S. district court in Idaho required FWS to reconsider its “not warranted” finding. In March 2010, FWS found a range-wide threatened or endangered listing was warranted but precluded by higher-priority listing actions. In September 2011, the D.C. district court approved a settlement agreement that bound FWS to publish a decision regarding greater sage-grouse, either to list the species or to find a listing not warranted, by September 30, 2015 (U.S. Dis-trict Court for the District of Columbia 2011). In response to the FWS process, the Bureau of Land Management and U.S. Forest Service have conducted extensive planning efforts and proposed plan amendments to address the greater sage-
8 16 U.S.C. 35 § 1535 9 16 U.S.C. 35 § 1533 (a) (1) 10 Forbs are plants without a stem, such as ferns, horsetails, and lycopods. Forbs are smaller than shrubs and different from grasses. Source: Natural Resources Conservation Service, plants.usda.gov/growth_habits_def.html.
A N A L Y S I S O F C U R R E N T A C T I V I T I E S I N G R E A T E R S A G E - G R O U S E H A B I T A T I N U T A H
B U R E A U O F E C O N O M I C A N D B U S I N E S S R E S E A R C H 3
grouse.11 Most restrictions relate to extractive industries, improper grazing, and the use of off-highway vehicles (OHVs), while many activities are largely unaffected. Likewise, state wildlife agen-cies and many private and state land managers in the West have devoted resources to conserve the species, reduce the need for a listing, and anticipate listing restrictions. There are two sage-grouse species in Utah. While the greater sage-grouse is the topic of this study, we note that the Gunnison sage-grouse, which lives in southwestern Colorado and a very small por-tion of Utah’s San Juan County near Monticello, was listed November 2014 as a threatened species with designated critical habitat (USFWS 2014b).
Figure 1.1 FWS Greater Sage-Grouse Range, Including Bi-State and Columbia Basin DPSes
1.3 GREA TE R SA GE-GRO USE I N UTA H The Utah population of greater sage-grouse is measured by annual counts of males at leks. During 2010 to 2014, DWR counted an average of 3,682 males (Bernales, Robinson, and Blair 2015). Popu-lation levels display substantial normal fluctuations in recent years and historically. Direct compari-son of counts over time would be unreliable, since methods varied from year to year.12 However, it
11 See, for example, the “Utah Greater Sage-Grouse Draft Land Use Plan Amendment and Environmental Impact Statement” produced jointly by BLM and the Forest Service October 2013 (www.blm.gov/ut/st/en/prog/planning/ SG_RMP_rev/deis.html). 12 Coverage of greater sage-grouse counts in Utah has increased over time as previously undocumented leks (breeding grounds) were included. From 2005 to 2014, DWR staff visited an average of 313 leks annually, finding 68 percent of
A N A L Y S I S O F C U R R E N T A C T I V I T I E S I N G R E A T E R S A G E - G R O U S E H A B I T A T I N U T A H
4 B U R E A U O F E C O N O M I C A N D B U S I N E S S R E S E A R C H
appears greater sage-grouse population levels have been stable in Utah in recent decades (Messmer 2015). Greater sage-grouse range definitions for Utah have been adapted from FWS and Utah Division of Wildlife Resources (DWR) sources for this report. We focus on the following three ranges, each of which is mapped and discussed in some detail.
• Revised current range based on FWS definitions, 10.4 million acres • Revised historical-only range outside of current range based on FWS definitions, 9.4 million
acres • Revised 2013 Sage-Grouse Management Areas (SGMAs) based on DWR boundaries, 7.5
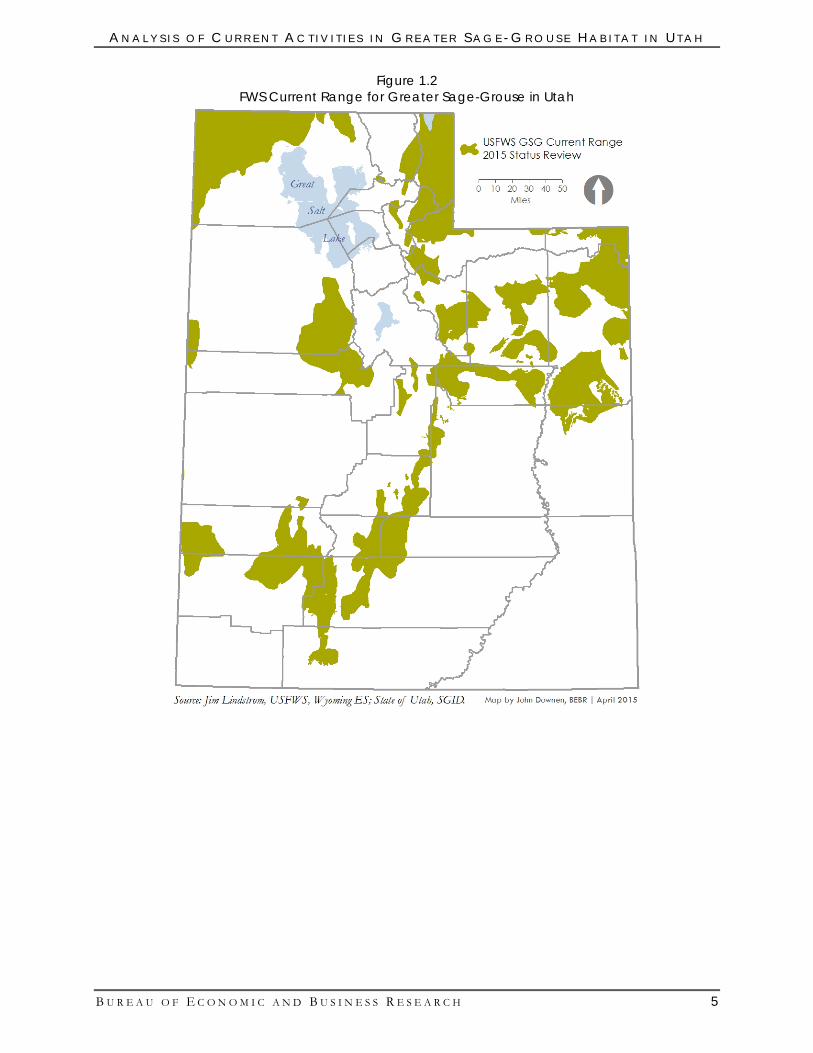
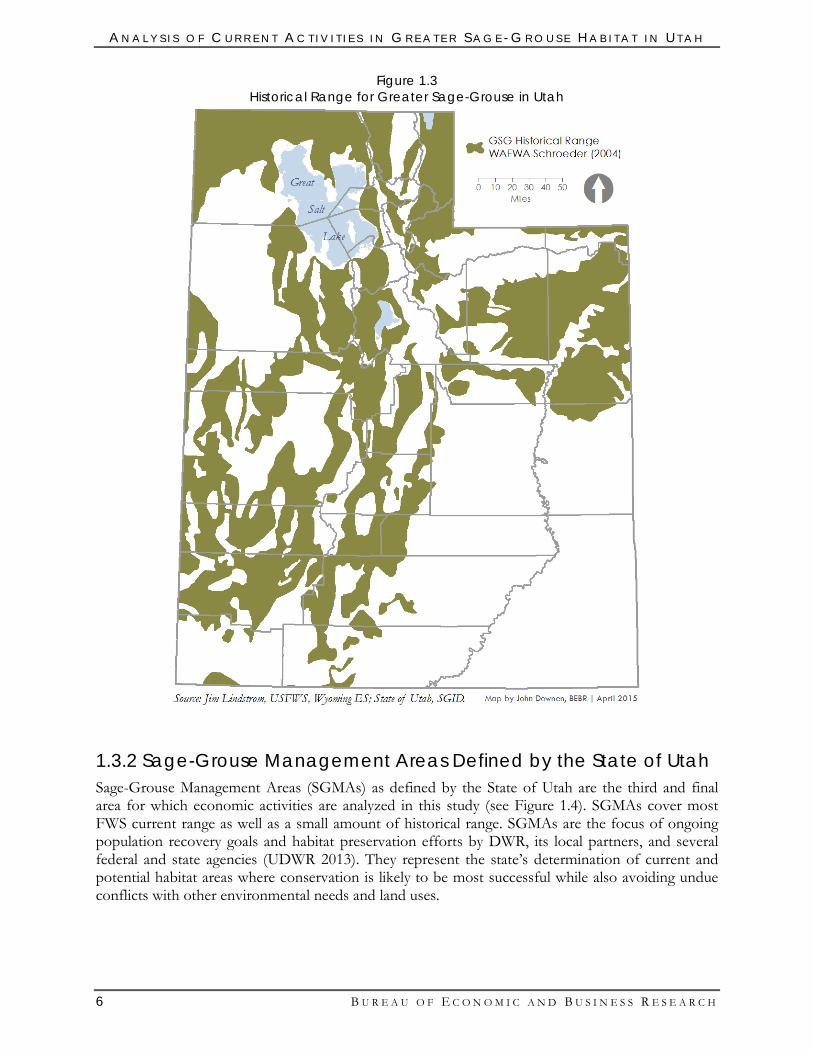
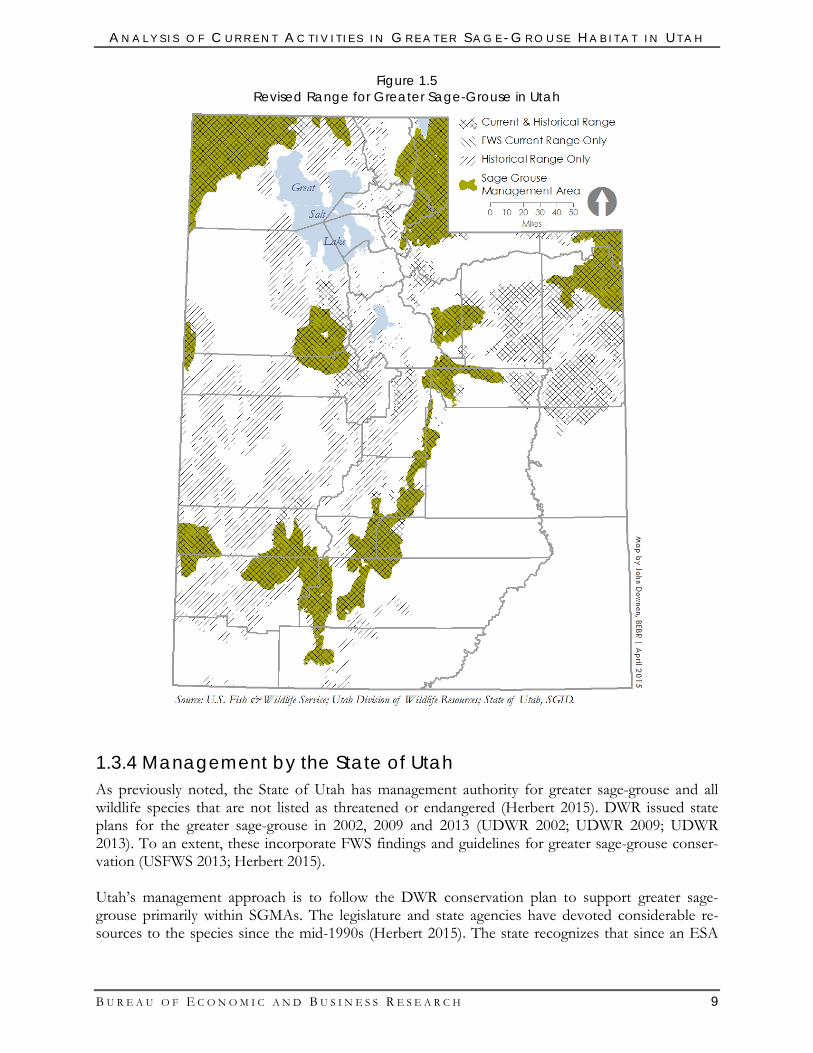
million acres 1.3.1 U.S. Fish and Wildlife Service Current and Historical Range FWS has defined greater sage-grouse habitat in Utah as the 10.6 million acres of current range shown in Figure 1.2. The service also identified 20.2 million acres in Utah that greater sage-grouse likely used as habitat in the past (see Figure 1.3).13 Almost half of this historical range (48 percent, 9.7 million acres) is also current range, as defined by FWS. About 8 percent of total FWS current range, 807,000 acres, does not coincide with historical range. However, this is likely due to the na-ture of the two datasets, the historical boundaries being much less certain. Much of the historical range outside of FWS current range still offers suitable sagebrush ecosystems where greater sage-grouse could live under proper management. Habitat preservation, mitigation projects, and popula-tion recovery efforts may include small or large areas of historical range outside of the FWS current range. Both areas are overlain in Figure 1.5.
them occupied. Compared with the period 1970 to 2004, both the number of annual visits and occupied leks increased by more than 100. The new sites added to DWR’s coverage over the years have been somewhat smaller in terms of ob-served male attendance than those previously documented. Meanwhile, total counts have risen since the 1990s, largely due to improved thoroughness. 13 The Utah Division of Wildlife Resources (DWR), which to date has jurisdiction for greater sage-grouse in Utah, also mapped its habitat in the state, distinguishing occupied and opportunity habitat. FWS and DWR habitat definitions gen-erally correspond. FWS maps were selected for this study since the federal agency will make the ESA listing decision and would begin managing the species were a listing to occur.
A N A L Y S I S O F C U R R E N T A C T I V I T I E S I N G R E A T E R S A G E - G R O U S E H A B I T A T I N U T A H
B U R E A U O F E C O N O M I C A N D B U S I N E S S R E S E A R C H 5
Figure 1.2 FWS Current Range for Greater Sage-Grouse in Utah
A N A L Y S I S O F C U R R E N T A C T I V I T I E S I N G R E A T E R S A G E - G R O U S E H A B I T A T I N U T A H
6 B U R E A U O F E C O N O M I C A N D B U S I N E S S R E S E A R C H
Figure 1.3 Historical Range for Greater Sage-Grouse in Utah
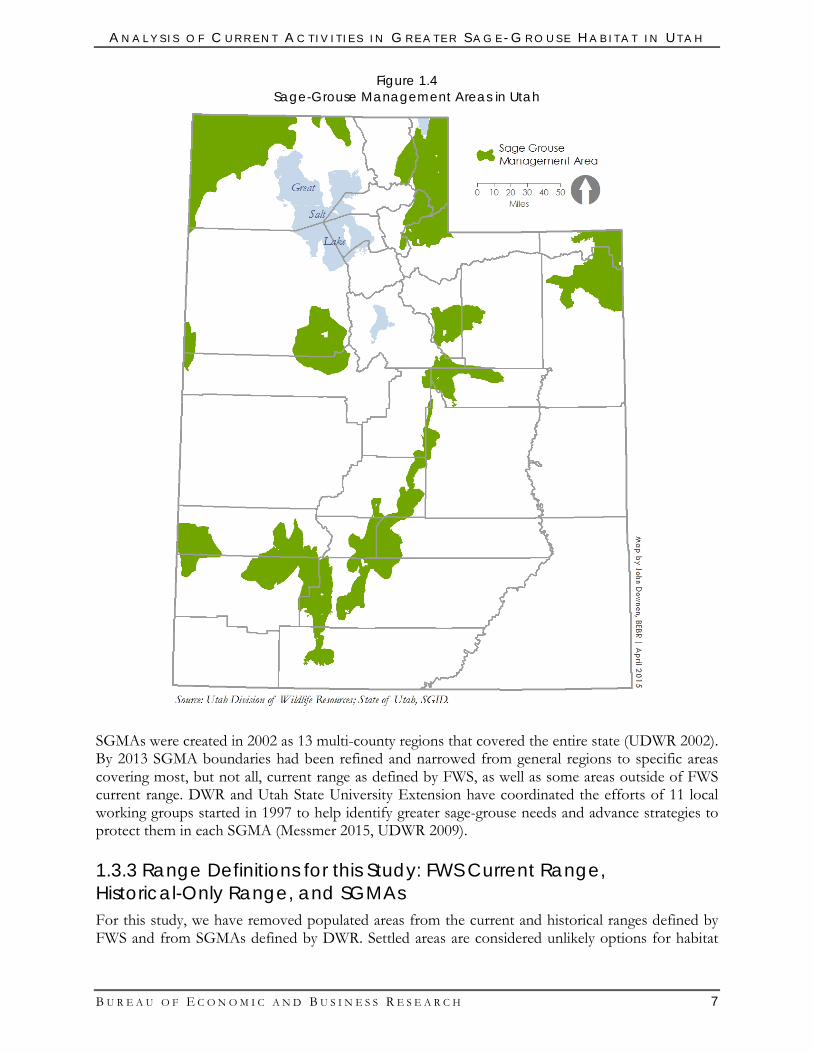
1.3.2 Sage-Grouse Management Areas Defined by the State of Utah Sage-Grouse Management Areas (SGMAs) as defined by the State of Utah are the third and final area for which economic activities are analyzed in this study (see Figure 1.4). SGMAs cover most FWS current range as well as a small amount of historical range. SGMAs are the focus of ongoing population recovery goals and habitat preservation efforts by DWR, its local partners, and several federal and state agencies (UDWR 2013). They represent the state’s determination of current and potential habitat areas where conservation is likely to be most successful while also avoiding undue conflicts with other environmental needs and land uses.
A N A L Y S I S O F C U R R E N T A C T I V I T I E S I N G R E A T E R S A G E - G R O U S E H A B I T A T I N U T A H
B U R E A U O F E C O N O M I C A N D B U S I N E S S R E S E A R C H 7
Figure 1.4 Sage-Grouse Management Areas in Utah
SGMAs were created in 2002 as 13 multi-county regions that covered the entire state (UDWR 2002). By 2013 SGMA boundaries had been refined and narrowed from general regions to specific areas covering most, but not all, current range as defined by FWS, as well as some areas outside of FWS current range. DWR and Utah State University Extension have coordinated the efforts of 11 local working groups started in 1997 to help identify greater sage-grouse needs and advance strategies to protect them in each SGMA (Messmer 2015, UDWR 2009). 1.3.3 Range Definitions for this Study: FWS Current Range, Historical-Only Range, and SGMAs For this study, we have removed populated areas from the current and historical ranges defined by FWS and from SGMAs defined by DWR. Settled areas are considered unlikely options for habitat
A N A L Y S I S O F C U R R E N T A C T I V I T I E S I N G R E A T E R S A G E - G R O U S E H A B I T A T I N U T A H
8 B U R E A U O F E C O N O M I C A N D B U S I N E S S R E S E A R C H
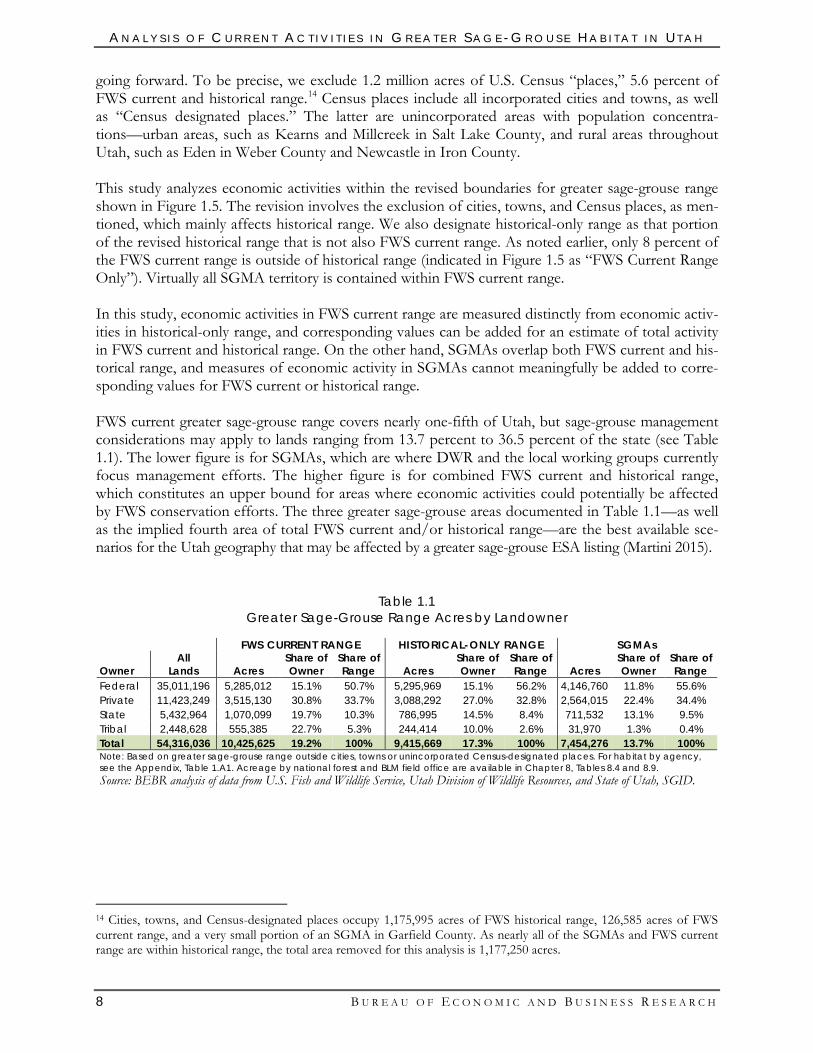
going forward. To be precise, we exclude 1.2 million acres of U.S. Census “places,” 5.6 percent of FWS current and historical range.14 Census places include all incorporated cities and towns, as well as “Census designated places.” The latter are unincorporated areas with population concentra-tions—urban areas, such as Kearns and Millcreek in Salt Lake County, and rural areas throughout Utah, such as Eden in Weber County and Newcastle in Iron County. This study analyzes economic activities within the revised boundaries for greater sage-grouse range shown in Figure 1.5. The revision involves the exclusion of cities, towns, and Census places, as men-tioned, which mainly affects historical range. We also designate historical-only range as that portion of the revised historical range that is not also FWS current range. As noted earlier, only 8 percent of the FWS current range is outside of historical range (indicated in Figure 1.5 as “FWS Current Range Only”). Virtually all SGMA territory is contained within FWS current range. In this study, economic activities in FWS current range are measured distinctly from economic activ-ities in historical-only range, and corresponding values can be added for an estimate of total activity in FWS current and historical range. On the other hand, SGMAs overlap both FWS current and his-torical range, and measures of economic activity in SGMAs cannot meaningfully be added to corre-sponding values for FWS current or historical range. FWS current greater sage-grouse range covers nearly one-fifth of Utah, but sage-grouse management considerations may apply to lands ranging from 13.7 percent to 36.5 percent of the state (see Table 1.1). The lower figure is for SGMAs, which are where DWR and the local working groups currently focus management efforts. The higher figure is for combined FWS current and historical range, which constitutes an upper bound for areas where economic activities could potentially be affected by FWS conservation efforts. The three greater sage-grouse areas documented in Table 1.1—as well as the implied fourth area of total FWS current and/or historical range—are the best available sce-narios for the Utah geography that may be affected by a greater sage-grouse ESA listing (Martini 2015).
Table 1.1 Greater Sage-Grouse Range Acres by Landowner
FWS CURRENT RANGE HISTORICAL-ONLY RANGE SGMAs
Owner All
Lands Acres Share of Owner
Share of Range Acres
Share of Owner
Share of Range Acres
Share of Owner
Share of Range
Federal 35,011,196 5,285,012 15.1% 50.7% 5,295,969 15.1% 56.2% 4,146,760 11.8% 55.6% Private 11,423,249 3,515,130 30.8% 33.7% 3,088,292 27.0% 32.8% 2,564,015 22.4% 34.4% State 5,432,964 1,070,099 19.7% 10.3% 786,995 14.5% 8.4% 711,532 13.1% 9.5% Tribal 2,448,628 555,385 22.7% 5.3% 244,414 10.0% 2.6% 31,970 1.3% 0.4% Total 54,316,036 10,425,625 19.2% 100% 9,415,669 17.3% 100% 7,454,276 13.7% 100% Note: Based on greater sage-grouse range outside cities, towns or unincorporated Census-designated places. For habitat by agency, see the Appendix, Table 1.A1. Acreage by national forest and BLM field office are available in Chapter 8, Tables 8.4 and 8.9. Source: BEBR analysis of data from U.S. Fish and Wildlife Service, Utah Division of Wildlife Resources, and State of Utah, SGID.
14 Cities, towns, and Census-designated places occupy 1,175,995 acres of FWS historical range, 126,585 acres of FWS current range, and a very small portion of an SGMA in Garfield County. As nearly all of the SGMAs and FWS current range are within historical range, the total area removed for this analysis is 1,177,250 acres.
A N A L Y S I S O F C U R R E N T A C T I V I T I E S I N G R E A T E R S A G E - G R O U S E H A B I T A T I N U T A H
B U R E A U O F E C O N O M I C A N D B U S I N E S S R E S E A R C H 9
Figure 1.5 Revised Range for Greater Sage-Grouse in Utah
1.3.4 Management by the State of Utah As previously noted, the State of Utah has management authority for greater sage-grouse and all wildlife species that are not listed as threatened or endangered (Herbert 2015). DWR issued state plans for the greater sage-grouse in 2002, 2009 and 2013 (UDWR 2002; UDWR 2009; UDWR 2013). To an extent, these incorporate FWS findings and guidelines for greater sage-grouse conser-vation (USFWS 2013; Herbert 2015). Utah’s management approach is to follow the DWR conservation plan to support greater sage-grouse primarily within SGMAs. The legislature and state agencies have devoted considerable re-sources to the species since the mid-1990s (Herbert 2015). The state recognizes that since an ESA
A N A L Y S I S O F C U R R E N T A C T I V I T I E S I N G R E A T E R S A G E - G R O U S E H A B I T A T I N U T A H
10 B U R E A U O F E C O N O M I C A N D B U S I N E S S R E S E A R C H
listing became a serious possibility, sufficient state-directed conservation progress could preclude a listing and the resulting loss of state autonomy and flexibility (Sheehan 2014). The state attributes robust populations of greater sage-grouse in 2015 to “proper stewardship” by private, state and fed-eral land managers (Herbert 2015, p. 3). The state expects that “activities and facilities existing within SGMAs prior to the adoption of the Conservation Plan will be allowed to continue” (Herbert 2015, p. 5). The intent is to minimize dis-ruption to property owners: “existing rights established on private, county, city, state and federal lands should be recognized and respected” (p. 6). SGMAs will receive special attention with regards to wildfire suppression, fuels reduction, road and infrastructure planning and construction, and out-door recreation activities and facilities. Oil, gas and mining resources should be tapped, but with ap-propriate measures to avoid, minimize and mitigate impacts on greater sage-grouse populations. Future disturbances are to be located in “areas already disturbed or naturally unsuitable” to the spe-cies (p. 7). State agencies are to advise and coordinate efforts to improve and restore habitat. Ongo-ing research is needed to monitor and improve understanding of the needs of greater sage-grouse in different parts of the state.
1.4 TH REA TS TO GREA TE R SA GE-GRO USE Utah sage-grouse populations occupy habitats that are naturally fragmented based on topography. Some of these habitats have experienced additional loss and fragmentation from both natural and human causes. Wildfire, invasive plants, climate and predation are natural threats that humans may mitigate or compound. Oil, gas and renewable energy development; mining; crop and livestock agri-culture; recreation; urbanization; and infrastructure installation and maintenance are human activities that may further fragment or destroy sage-grouse habitat, but they too are mitigable. The most significant threats in Utah are wildfire, invasive and encroaching plants, and energy devel-opment in FWS current and historical range, and wildfire and invasive and encroaching plants in SGMAs. Secondary concerns are agriculture, urbanization and infrastructure. Other threats dis-cussed may conflict with greater sage-grouse needs under certain circumstances. Further research beyond the scope of this study would be needed to estimate what portion of these activities is af-fected by current conservation approaches or would be affected by new restrictions from a possible listing. It is important to consider the variety and relative importance of influences on the species, including and besides economic activities. 1.4.1 Natural Threats Several threats to Utah’s population of greater sage-grouse can arise without human intervention: wildfire, invasive and encroaching plants, climate, and predation. Land managers and others are able to address these concerns to an extent. Two natural threats to greater sage-grouse not addressed in this section are disease and competition for resources from other wildlife (UDWR 2010). This dis-cussion is offered as a backdrop for the following section on anthropogenic threats. Wildfire Wildfire and the associated spread of invasive plants are the principal threats to greater sage-grouse in the Great Basin region, which includes the western part of Utah (USFWS 2014a; Herbert 2015). Wildfire has been found to reduce lek populations and threaten their persistence (Knick et al. 2011).
A N A L Y S I S O F C U R R E N T A C T I V I T I E S I N G R E A T E R S A G E - G R O U S E H A B I T A T I N U T A H
B U R E A U O F E C O N O M I C A N D B U S I N E S S R E S E A R C H 11
Fire episodes, particularly catastrophic ones, can destroy sagebrush canopy and result in many sage-grouse fatalities, since the species is intolerant to fire (Miller et al. 2011; UDWR 2013). Vegetation recovers best where soil, moisture, topography, seed viability and other conditions are favorable (Knick et al. 2011). Regrowth is hampered by dry climates, large fires, high-intensity burns and inva-sive plants seeding. Landscape restoration projects accelerate recovery. Greater sage-grouse recolonization is not automatic even when native vegetation has recovered. Their return to fire-disturbed habitat is often slow. Typical vegetation recovery times following wild-fire disturbance in the West are one to three years for herbaceous growth, grasses and forbs, com-pared with 25 to 35 years for sagebrush (Knick et al. 2011). Livestock grazing can reduce the threat of fire by depleting and renewing the grass and forb understory (UDWR 2013). Invasive and Encroaching Plants Plants that are not native to a sagebrush ecosystem can degrade greater sage-grouse habitat (Miller et al. 2011). Wildlife communities dependent on sagebrush suffer from the introduction and propaga-tion of invasive species (UDWR 2013). Vegetation treatments by land managers are advisable at early stages where this occurs. As invasive plants spread they “alter the soil and environment in a way that makes reestablishment of the native ecosystem very difficult” (UDWR 2013, p. 14). Development projects create opportunities for the spread of exotic and noxious plants (USFWS 2010) while exist-ing construction and reclamation requirements reduce this threat from mining, drilling, recreation improvements and other developments. The most concerning invasive species in Utah is cheatgrass. Of more than two dozen nonnative weeds, annual grasses, and other plants in Utah, cheatgrass has been the leading concern for greater sage-grouse since its introduction from Eurasia many decades ago (Miller et al. 2011; DWR 2013). An estimated 65 percent of the Great Basin region has condi-tions that make it susceptible to cheatgrass growth, especially following a fire (Miller et al. 2011). Cheatgrass eliminates patches of open space that greater sage-grouse need and absorbs water and nutrients that sagebrush and other native plants require. Becoming extremely flammable when it dries out during the summer, cheatgrass provides fuel for future fires, after which it seeds prolifically to recover and spread further. At somewhat higher elevations, the encroachment of pinyon and juniper conifers also results in loss of large areas of sagebrush habitat (Miller et al. 2011). These trees are native to Utah. Their spread into sagebrush ecosystems stems from fire exclusion and livestock grazing practices going back over a century. Pinyon and juniper woodlands do not provide favorable habitat for the greater sage-grouse, and their spread into sagebrush regions threatens its population levels. Climate Climate change and weather extremes are important influences on sagebrush ecosystems (Miller et al. 2011). A study of 248 hens and their offspring in Utah’s Piute County from 1998 to 2010 showed the presence of adequate moisture was associated with more successful reproduction of greater sage-grouse there (Caudill et al. 2014). Especially when coupled with low levels of precipitation, tempera-tures above historical norms are less likely to sustain enough healthy forage for robust populations of greater sage-grouse (UDWR 2013). Higher temperatures favor invasive species and increase wild-fire incidence, extent and severity (USFWS 2010). Greater sage-grouse are adapted to survive snow, wind and cold, but unusually severe weather can elevate mortality (Hagen 2011). Drought and tem-perature extremes factor into annual population fluctuations and the long-term recovery of greater sage-grouse in the West.
A N A L Y S I S O F C U R R E N T A C T I V I T I E S I N G R E A T E R S A G E - G R O U S E H A B I T A T I N U T A H
12 B U R E A U O F E C O N O M I C A N D B U S I N E S S R E S E A R C H
Predation Certain predators, primarily corvids and red foxes, constitute threats to greater sage-grouse in a few of Utah’s SGMAs (UDWR 2013). Ravens are the principal corvid predator in Utah. The red fox tar-gets nests and young chicks in the Strawberry Valley and other parts of the state (Baxter et al. 2007). Overall, predation has not been a primary threat to greater sage-grouse; exceptions are commonly associated with poor habitat conditions (USFWS 2014a). Range-wide, predators for greater sage-grouse adults, juveniles and eggs include coyotes, badgers, bobcats, red foxes, ground squirrels, eagles, ravens, magpies, northern harriers and falcons (Hagen 2011). The mix and relative importance of predators varies by region. Renesting helps offset egg predation. The risk of predation decreases after the season of breeding, nesting and brood-rearing. Fences and utility poles assist avian predators by providing perches (USFWS 2010). Utah’s conservation plan provides for ongoing predator control by the Utah Department of Agricul-ture and Food (UDWR 2013). Efforts to curb red fox have been more effective than those targeting coyotes, in terms of improving adult survival and reproduction among greater sage-grouse in the state (Baxter et al. 2007; Hagen 2011). Corvid populations are managed by limiting external food sources, especially waste facilities and road kill. Actions to promote vegetation health and sagebrush landscapes increase sage-grouse protection from predators (UDWR 2013). 1.4.2 Human-Caused Threats A variety of land uses may impact the greater sage-grouse and its habitat: oil and gas development, mining, renewable energy, crop and livestock agriculture, recreation, urbanization, and supporting infrastructure. These can affect land, water and air quality. Greater sage-grouse leks are more sensi-tive to human presence than other habitat areas, especially at dawn and dusk during the spring (USFWS 2013; Hagen 2011). For a few weeks following breeding, hens and their offspring in nearby nesting grounds are vulnerable to disturbances. The influence of a range of human activities in greater sage-grouse habitat can be described in terms of intensity, geographic extent, duration and flexibility to accommodate sage-grouse needs. Recrea-tion and grazing can be largely compatible with habitat needs. Grazing can offset the threat of wild-fire, although overgrazing can cause lasting harm to native vegetation. Disturbances from mining and energy developments are often limited to relatively small areas. However, these installations in or near habitat, as well as expanding residential communities there, tend to increase human envi-ronmental disturbances and spawn transportation and communication network extensions. Bringing new lands under cultivation may reduce habitat, but raising crops on existing farmland is rarely a concern. For all activities, people can avoid, minimize and mitigate negative impacts by following best practices, such as avoiding leks, marking fences, consolidating road and utility corridors, restor-ing vegetation following development, and planning the timing of necessary disturbances to reduce interference with the life-cycle of greater sage-grouse through the four seasons. Oil and Gas Development Energy development is the principal threat to greater sage-grouse in the Rocky Mountain region, in particular in FWS current and historical range in northeastern Utah, though not in the state’s SGMAs (USFWS 2014a; Herbert 2015). Energy development disturbances negatively impact popu-lation levels for greater sage-grouse in the vicinity (USFWS 2010). Once a project is complete and the area reclaimed, sage-grouse return gradually. Full population recovery may take two decades or longer.
A N A L Y S I S O F C U R R E N T A C T I V I T I E S I N G R E A T E R S A G E - G R O U S E H A B I T A T I N U T A H
B U R E A U O F E C O N O M I C A N D B U S I N E S S R E S E A R C H 13
Oil and gas development involves well pads, access roads, pipelines and other installations that oc-cupy greater sage-grouse habitat or cause disruption (Knick et al. 2011). Other installations may in-clude electrical lines, pumping stations and storage tanks. Greater sage-grouse mortality may increase from the unintended provision of perches for avian predators. Disturbances from oil and gas devel-opment, including noise and exhaust, are pronounced during drilling but diminish during the subse-quent months, years or decades of normal well operation (Knick et al. 2011). Thus, continued operation in developed oil and gas fields is less concerning than exploring new fields. Greater sage-grouse communities have been known to adapt to habitat fragmentation from oil and gas develop-ment, albeit at somewhat reduced stable population levels. Post-drilling reclamation mitigates con-cerns from erosion and the spread of nonnative plants. Mining Surface and subsurface mining of minerals such as coal and copper can alter sagebrush habitats (USFWS 2010). Habitat loss may result from the storage of tailings and overburden soil and from new staging areas, roads, railroad tracks and structures. Mining may cause noise disturbances and ground shock, vegetation and topography changes, and reduced air and water quality. Mining may reduce adult male attendance at nearby leks for a time. Hen survival rates and overall population levels generally have not been found to suffer (USFWS 2010). However, in the case of extensive surface operations, mining can negatively impact population levels for greater sage-grouse in the vicinity, at least in the short term. Sage-grouse have been found to return to leks and recover their numbers gradually after mines are closed and reclaimed. Renewable Energy Greater sage-grouse can be affected by developments to harness wind, geothermal and other renew-able energy sources. The initial construction of access roads, wind turbines, geothermal wells, pipe-lines, facilities, transmission lines and other infrastructure can alter habitat and disrupt nearby sage-grouse (Knick et al. 2011). Wind turbines may reduce local nesting and brood-rearing success rates (UDWR 2013). In general, the post-installation impacts of ongoing operations at renewable energy facilities themselves are not considered problematic based on the limited research available, but as-sociated transportation and utility network growth can be concerning. For example, a road to service a geothermal site may cause enduring habitat fragmentation. One favorable consideration is that wind and geothermal energy are substitutes for oil and gas development, a well-documented threat to the species (Knick et al. 2011). Livestock Grazing In Utah, livestock grazing is the most prevalent use of lands in greater sage-grouse range (Utah State University Extension 2011). Grazing activity is substantial within most SGMAs (UDWR 2013). Domestic livestock may disturb shrubs, grasses, and forbs on which greater sage-grouse depend (Knick et al. 2011). Grazing can harm vegetation and soils where resiliency and stability are doubtful, resulting in soil damage, invasive plants and disruption of historical wildfire regimes (Miller et al. 2011). Habitat integrity depends on appropriate stocking rates that are responsive to changing envi-ronmental conditions.15 Disturbance to greater sage-grouse habitat from well-managed grazing is often slight. Any deterioration in range conditions from an ongoing livestock presence diffused over
15 Stocking considerations include forage distribution, season duration, herbivory from native animals, demand for do-mestic livestock grazing, past utilization rates, rest-rotation or other range management approaches, precipitation, plant regeneration, and intended landscape conditions (Knick et al. 2011).
A N A L Y S I S O F C U R R E N T A C T I V I T I E S I N G R E A T E R S A G E - G R O U S E H A B I T A T I N U T A H
14 B U R E A U O F E C O N O M I C A N D B U S I N E S S R E S E A R C H
a large area is usually gradual and reversible. However, high livestock concentrations may denude vegetation in small areas over a short period of time, for example near water sources or mineral-nutrient blocks. Fences are a collision hazard to greater sage-grouse, but they can help limit or redi-rect human and animal movements. Livestock grazing can also benefit greater sage-grouse. By depleting and renewing the grass and forb understory, moderate livestock grazing reduces wildfire incidence and spread (Knick et al. 2011). Best practices for rangeland management tend to improve greater sage-grouse habitat and maintain vegetation heterogeneity (UDWR 2013). For example, ranchers’ maintenance of healthy vegetation for their livestock, including forbs and perennial grasses, benefits greater sage-grouse (Utah State University Extension 2011). Water developments and pasture irrigation for grazing may improve sage-grouse brood-rearing habitat. Overgrazing has become relatively uncommon on public lands owing to marked reductions in permitted and authorized animal unit months16 in past decades (Knick et al. 2011). Crop Agriculture Cultivation of new lands usually results in the elimination of sagebrush there, vegetation essential to greater sage-grouse survival (Knick et al. 2011). Cropland shares above 25 percent are associated with an increased likelihood of local sage-grouse extirpation. Historically, prime areas with fertile soils and good water access were preferred for crop cultivation, with less demand for arid and re-mote lands requiring irrigation systems. Fortunately for greater sage-grouse, as much as 90 percent of sagebrush lands in the West remained unsuitable for cultivation as of the mid 1990s due to tem-perature, soil quality, topography and water access. Cropland pesticides have not been identified as a significant threat to greater sage-grouse in Utah (UDWR 2013). Greater sage-grouse generally avoid cultivated croplands and other developed areas (Knick et al. 2011). When sage-grouse do enter farmland to feed on plants outside their normal diet, for example alfalfa, exposure to pesticides is possible. Recreation Recreation and supporting activities can impact greater sage-grouse. An FWS study of 12 sage-grouse populations in Utah identified recreation as a “present and widespread” threat to the species in 11 areas; for the remaining population, the threat was considered to be “present but localized” (USFWS 2013, pp. 16–24). While outdoor recreation is widespread in much of the state’s greater sage-grouse range, the severity of recreation impacts is low in most areas (Messmer 2015). Seasonal closures address recreation impacts where they arise on public lands. Low-impact outdoor recreation activities, such as hiking, biking, climbing, rafting and camping, are generally compatible with greater sage-grouse use of land as habitat. Still, any type of human presence from recreation can disrupt normal sage-grouse behavior (USFWS 2013). In addition, new development and infrastructure from people relocating to greater sage-grouse habitat to gain better access to public lands for recreation constitute an indirect source of habitat loss and disturbance (Knick et al. 2011). Roads, trails and camping facilities to support recreation in greater sage-grouse range tend to frag-ment habitat and create hazards for the birds (USFWS 2013). OHV use is of particular concern among recreation activities (UDWR 2013). Greater sage-grouse are most vulnerable to ATVs and motorcycles when the birds are nesting and to snowmobiles during winter. 16 An animal unit month is the amount of forage needed to feed a cow and calf, a horse, or five sheep for one month. It is the metric used by the Bureau of Land Management to assign the amount of livestock allowed on the land.
A N A L Y S I S O F C U R R E N T A C T I V I T I E S I N G R E A T E R S A G E - G R O U S E H A B I T A T I N U T A H
B U R E A U O F E C O N O M I C A N D B U S I N E S S R E S E A R C H 15
The hunting of greater sage-grouse is a recreational, economic and cultural activity that could threat-en the species if not carefully managed (Reese and Connelly 2011). Western states including Utah have implemented effective restrictions, and the hunting of greater sage-grouse has not been identi-fied as a primary factor determining its population levels (Guttery et al. 2015; UDWR 2009). In re-cent decades, state wildlife agencies have limited greater sage-grouse hunting opportunities by implementing short hunting seasons in the fall and reducing permit issuance and bag and possession limits (Reese and Connelly 2011). Hunting species besides the greater sage-grouse within its habitat may attract a human presence that disturbs the bird (USFWS 2013). Hunting fees collected by DWR help fund sage-grouse conservation efforts. Fishing is not identified as a threat to greater sage-grouse in Utah or other Western states in promi-nent conservation documents and literature reviews (USFWS 2013; Knick et al. 2011; UDWR 2013). Disruptive lek viewing can interfere with normal sage-grouse behavior, but wildlife watching is gen-erally not considered a threat to the species. Urbanization and Infrastructure Urbanization is a potential threat to greater sage-grouse as residential and commercial land uses spread to new areas, prompting the development of supporting infrastructure. Economic considera-tions, recreation opportunities, and proximity to public lands with “natural or wilderness qualities” are common reasons for migration to rural sagebrush habitat (Knick et al. 2011, p. 212). In Utah, greater sage-grouse endangerment from such land development has been minor due to the large share of habitat protected under federal ownership. Dispersed settlement and urbanization reconfigure resource needs in ways that affect large sur-rounding areas (Knick et al. 2011). For example, water, electricity, retail goods and other resources may be delivered through greater sage-grouse habitat. Water diversions may affect moisture levels in basins where greater sage-grouse live. As they connect people and resources, roads and motorized vehicle trails can also have detrimental effects, including collisions with greater sage-grouse, noise disturbance, habitat alteration, erosion, chemical leaching, and the spread of nonnative plants (Knick et al. 2011). Less than 5 percent of sagebrush habitat for sage-grouse in the West is more than 1.5 miles from a mapped primary or sec-ondary road. All but two of the 317 occupied leks in Utah are within one mile of some type of road (Utah AGRC 2015; UDWR 2014). More than half, 55 percent, are within 0.5 mile of a road. Leks are more likely to be located near a local, neighborhood, rural and/or unpaved road than to be lo-cated near major federal, state or local highways and roads.
A N A L Y S I S O F C U R R E N T A C T I V I T I E S I N G R E A T E R S A G E - G R O U S E H A B I T A T I N U T A H
16 B U R E A U O F E C O N O M I C A N D B U S I N E S S R E S E A R C H
APPENDI X Table 1.A1 expands on the summary provided in Table 1.1 by providing land areas by agency by owner for greater sage-grouse habitat. BLM and the Forest Service manage 57 percent of Utah by land area, including about half of its greater sage-grouse habitat, as measured by SGMAs, FWS cur-rent range and historical-only range. Four other agencies each manage more than 40,000 acres of FWS current range.
Table 1.A1 Greater Sage-Grouse Acres by Agency
FWS CURRENT RANGE HISTORICAL-ONLY RANGE SGMAs
Agency Total Acres Acres
Share of Agency
Share of Habitat Acres
Share of Agency
Share of Habitat Acres
Share of Agency
Share of Habitat
Federal
Bureau of Land Management 22,788,435 3,771,001 16.5% 36.2% 4,649,894 20.4% 49.4% 2,816,295 12.4% 37.8%
U.S. Forest Service 8,179,304 1,413,584 17.3% 13.6% 515,284 6.3% 5.5% 1,271,286 15.5% 17.1% National Park Service 2,096,643 57,037 2.7% 0.5% 5,906 0.3% 0.1% 57,036 2.7% 0.8% Department of Defense 1,812,564 40,014 2.2% 0.4% 123,512 6.8% 1.3% 0 0.0% 0.0% U.S. Fish and Wildlife Service 129,468 415 0.3% 0.0% 353 0.3% 0.0% 392 0.3% 0.01% Bureau of Reclamation 4,739 2,960 62.4% 0.03% 1,020 21.5% 0.01% 1,751 36.9% 0.02%
State of Utah
School and Institutional Trust Lands 3,401,980 838,315 24.6% 8.0% 674,073 19.8% 7.2% 539,782 15.9% 7.2% Department of Natural Resources 2,027,739 231,718 11.4% 2.2% 112,503 5.5% 1.2% 171,684 8.5% 2.3% Department of Transportation 2,609 66 2.5% 0.0% 418 16.0% 0,0% 66 2.5% 0.0%
Private lands 11,423,249 3,515,130 30.8% 33.7% 3,088,292 27.0% 32.8% 2,564,015 22.4% 34.4% Tribal lands 2,448,628 555,385 22.7% 5.3% 244,414 10.0% 2.6% 31,970 1.3% 0.4% Total 54,316,036 10,425,625 19.2% 100% 9,415,669 17.3% 100% 7,454,276 13.7% 100% Note: Land areas based on greater sage-grouse range not in cities, towns or unincorporated Census-designated places. Total of Total Acres includes some DOE and other state land without habitat. Source: Jim Lindstrom, U.S. Fish and Wildlife Service, Wyoming Ecological Services; State of Utah, SGID.
A N A L Y S I S O F C U R R E N T A C T I V I T I E S I N G R E A T E R S A G E - G R O U S E H A B I T A T I N U T A H
B U R E A U O F E C O N O M I C A N D B U S I N E S S R E S E A R C H 17
OIL AND NATURAL GAS PRODUCTION This section serves to summarize current and historical oil and natural gas activities within the three ranges defined for this study—FWS current range, that part of historical range not within FWS cur-rent range (“historical-only range”), and Sage Grouse Management Areas (SGMAs). Because all but an insignificant portion of SGMAs lies within FWS current range, activities are also summarized for that part of FWS current range not within SGMAs (“non-SGMA FWS current range”). Finally, ac-tivities are summarized for those areas of Utah not within any of these three ranges (“rest of Utah”). Thus, non-SGMA FWS current range, historical-only range, SGMAs, and rest of Utah constitute non-overlapping areas that, as a group, cover the entire state.17 The activities summarized include the annual counts of new oil and natural gas wells drilled since 1980, counts of major well works since 1980, counts of producing days since 1984, and annual vol-umes of oil and natural gas produced since 1984. The estimated market values, tax revenues, and royalty revenues generated by such activities is summarized for 2014. The number of persons em-ployed by oil and natural gas industries is given for 1998–2013 for the entire state but not for the study areas, as such data were not available. No claims are made regarding the extent to which the oil and natural gas activities presented in this chapter might be affected by state or federal policies regarding the greater sage-grouse.
2.1 ME TH O DO L OGY Data concerning the level of oil and natural gas activities in the study areas listed above are not di-rectly available. For this study, data on oil and natural gas activities by study area were built by BEBR using well-level data obtained from the Utah Division of Oil, Gas and Mining (DOGM). The DOGM data indicate, for each well in the state, the geographical coordinates of the well, when the well was initially drilled, and dates and types of well work subsequent to the initial drilling. The data specifies for each month of the well’s life the number of days during that month in which the well produced oil or natural gas and the volume of oil and natural gas produced during that month. Each well in the state was matched to a study area using the geographical coordinates of the well (Figure 2.1). Oil and natural gas activities were then aggregated by study area and by year (e.g. total oil production among all wells producing within non-SGMA FWS current range during 2014).
17 Although a very small portion of SGMAs lies outside of FWS current range, no oil and gas activities occur on this portion.
2
A N A L Y S I S O F C U R R E N T A C T I V I T I E S I N G R E A T E R S A G E - G R O U S E H A B I T A T I N U T A H
18 B U R E A U O F E C O N O M I C A N D B U S I N E S S R E S E A R C H
Figure 2.1 Active, Producing and Drilled Oil and Gas Wells in Greater Sage-Grouse Range
A N A L Y S I S O F C U R R E N T A C T I V I T I E S I N G R E A T E R S A G E - G R O U S E H A B I T A T I N U T A H
B U R E A U O F E C O N O M I C A N D B U S I N E S S R E S E A R C H 19
2.2 WE L L S DRI LLE D Figure 2.2 shows the number of oil and natural gas wells drilled during each year since 1980 by study area. One can see that the rate of drilling is similar between non-SGMA FWS current range and his-torical-only range, and that drilling rates within SGMAs are very low by comparison. Since SGMAs is a subset of FWS current range, and given the very low rates of drilling within SGMAs, the total of the wells drilled across the four areas is close to, but not quite equal to, the statewide count. The da-ta graphed in Figure 2.2 are presented in Table 2.1.
Figure 2.2 Wells Drilled by Greater Sage-Grouse Range, 1980–2014
Source: BEBR analysis of data published by the Utah Division of Oil, Gas and Mining.
A N A L Y S I S O F C U R R E N T A C T I V I T I E S I N G R E A T E R S A G E - G R O U S E H A B I T A T I N U T A H
20 B U R E A U O F E C O N O M I C A N D B U S I N E S S R E S E A R C H
Table 2.1 Wells Drilled by Greater Sage-Grouse Range, 1980–2014
Year
FWS Current Range SGMAs
FWS Current
not SGMAs
Historical-only
Range Rest of Utah Statewide
1980 56 22 34 47 201 304 1981 112 28 84 119 307 538 1982 95 34 61 78 201 374 1983 108 31 77 91 215 414 1984 117 16 101 95 212 424 1985 73 10 63 57 166 296 1986 20 3 17 31 92 143 1987 19 4 15 23 86 128 1988 16 4 12 17 72 105 1989 17 0 17 20 52 89 1990 43 7 36 11 44 98 1991 24 2 22 93 126 243 1992 45 12 33 138 172 355 1993 34 3 31 28 61 123 1994 38 6 32 66 90 194 1995 55 2 53 89 66 210 1996 125 2 123 61 53 239 1997 141 2 139 112 133 386 1998 132 1 131 156 108 396 1999 61 8 53 85 123 269 2000 134 32 102 206 192 532 2001 158 49 109 255 212 625 2002 74 20 54 163 149 386 2003 117 2 115 260 97 474 2004 211 7 204 314 127 652 2005 281 7 274 404 189 874 2006 435 13 422 403 212 1050 2007 422 5 417 414 285 1121 2008 377 14 363 526 228 1131 2009 140 1 139 233 132 505 2010 331 2 329 372 244 947 2011 309 6 303 433 225 967 2012 273 11 262 521 269 1063 2013 316 2 314 442 234 992 2014 378 0 378 330 181 889
Note: Statewide values are the sum of SGMAs, non-SGMA FWS current range, historical-only range, and rest of Utah, while FWS current range is, by definition, the sum of SGMAs and non-SGMA FWS current range. Source: BEBR analysis of data from the Utah Division of Oil, Gas and Mining.
A N A L Y S I S O F C U R R E N T A C T I V I T I E S I N G R E A T E R S A G E - G R O U S E H A B I T A T I N U T A H
B U R E A U O F E C O N O M I C A N D B U S I N E S S R E S E A R C H 21
2.3 OI L PROD UCTI ON VO LUM E S Figure 2.3 shows, for each study area and each year since 1984, the volumes of oil production from wells located within that area. The data graphed in Figure 2.3 are presented in Table 2.2.
Figure 2.3 Oil Production by Greater Sage-Grouse Range, 1984–2014
Source: BEBR analysis of data published by the Utah Division of Oil, Gas and Mining.
One can see that while current rates of oil production from wells within SGMAs are almost insignif-icant on the scale of statewide production, during the 1980s more than one-third of all the oil pro-duced in the state came from wells within SGMAs. Production from non-SGMA FWS current range and historical-only range have been and continue to be major components of statewide production.
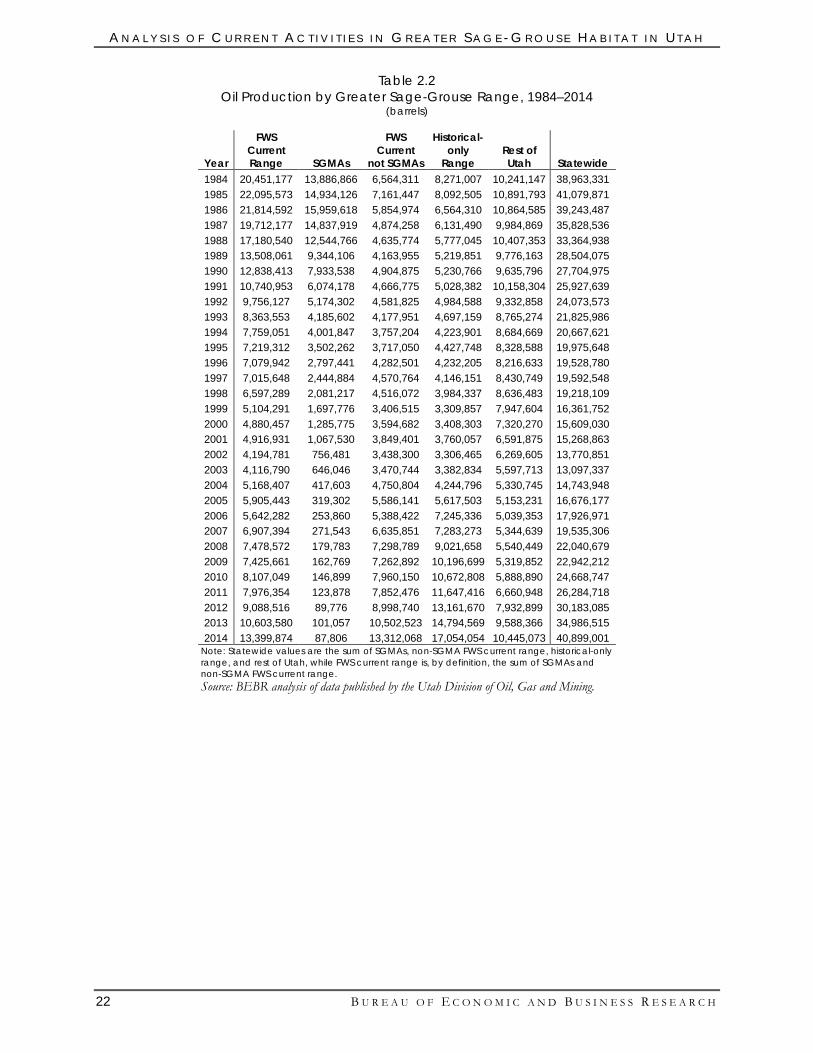
A N A L Y S I S O F C U R R E N T A C T I V I T I E S I N G R E A T E R S A G E - G R O U S E H A B I T A T I N U T A H
22 B U R E A U O F E C O N O M I C A N D B U S I N E S S R E S E A R C H
Table 2.2 Oil Production by Greater Sage-Grouse Range, 1984–2014
(barrels)
Year
FWS Current Range SGMAs
FWS Current
not SGMAs
Historical-only
Range Rest of Utah Statewide
1984 20,451,177 13,886,866 6,564,311 8,271,007 10,241,147 38,963,331 1985 22,095,573 14,934,126 7,161,447 8,092,505 10,891,793 41,079,871 1986 21,814,592 15,959,618 5,854,974 6,564,310 10,864,585 39,243,487 1987 19,712,177 14,837,919 4,874,258 6,131,490 9,984,869 35,828,536 1988 17,180,540 12,544,766 4,635,774 5,777,045 10,407,353 33,364,938 1989 13,508,061 9,344,106 4,163,955 5,219,851 9,776,163 28,504,075 1990 12,838,413 7,933,538 4,904,875 5,230,766 9,635,796 27,704,975 1991 10,740,953 6,074,178 4,666,775 5,028,382 10,158,304 25,927,639 1992 9,756,127 5,174,302 4,581,825 4,984,588 9,332,858 24,073,573 1993 8,363,553 4,185,602 4,177,951 4,697,159 8,765,274 21,825,986 1994 7,759,051 4,001,847 3,757,204 4,223,901 8,684,669 20,667,621 1995 7,219,312 3,502,262 3,717,050 4,427,748 8,328,588 19,975,648 1996 7,079,942 2,797,441 4,282,501 4,232,205 8,216,633 19,528,780 1997 7,015,648 2,444,884 4,570,764 4,146,151 8,430,749 19,592,548 1998 6,597,289 2,081,217 4,516,072 3,984,337 8,636,483 19,218,109 1999 5,104,291 1,697,776 3,406,515 3,309,857 7,947,604 16,361,752 2000 4,880,457 1,285,775 3,594,682 3,408,303 7,320,270 15,609,030 2001 4,916,931 1,067,530 3,849,401 3,760,057 6,591,875 15,268,863 2002 4,194,781 756,481 3,438,300 3,306,465 6,269,605 13,770,851 2003 4,116,790 646,046 3,470,744 3,382,834 5,597,713 13,097,337 2004 5,168,407 417,603 4,750,804 4,244,796 5,330,745 14,743,948 2005 5,905,443 319,302 5,586,141 5,617,503 5,153,231 16,676,177 2006 5,642,282 253,860 5,388,422 7,245,336 5,039,353 17,926,971 2007 6,907,394 271,543 6,635,851 7,283,273 5,344,639 19,535,306 2008 7,478,572 179,783 7,298,789 9,021,658 5,540,449 22,040,679 2009 7,425,661 162,769 7,262,892 10,196,699 5,319,852 22,942,212 2010 8,107,049 146,899 7,960,150 10,672,808 5,888,890 24,668,747 2011 7,976,354 123,878 7,852,476 11,647,416 6,660,948 26,284,718 2012 9,088,516 89,776 8,998,740 13,161,670 7,932,899 30,183,085 2013 10,603,580 101,057 10,502,523 14,794,569 9,588,366 34,986,515 2014 13,399,874 87,806 13,312,068 17,054,054 10,445,073 40,899,001
Note: Statewide values are the sum of SGMAs, non-SGMA FWS current range, historical-only range, and rest of Utah, while FWS current range is, by definition, the sum of SGMAs and non-SGMA FWS current range. Source: BEBR analysis of data published by the Utah Division of Oil, Gas and Mining.
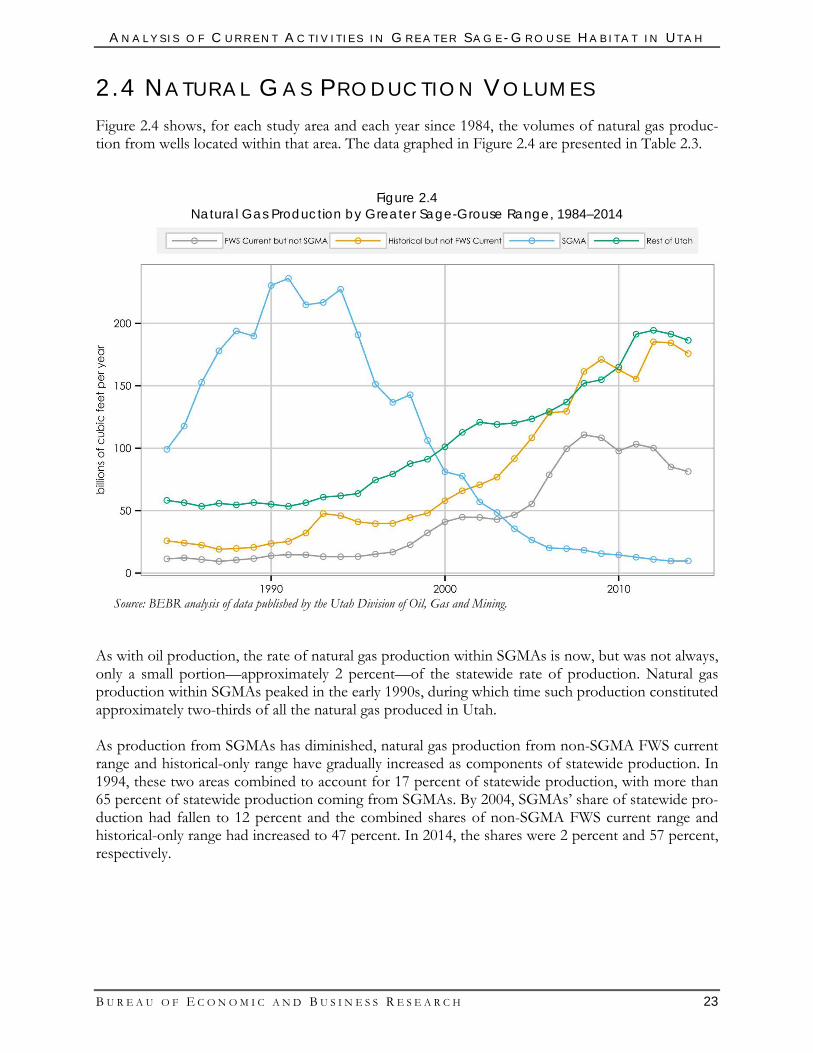
A N A L Y S I S O F C U R R E N T A C T I V I T I E S I N G R E A T E R S A G E - G R O U S E H A B I T A T I N U T A H
B U R E A U O F E C O N O M I C A N D B U S I N E S S R E S E A R C H 23
2.4 NA TURA L GA S PROD UCTI ON VO L UM E S Figure 2.4 shows, for each study area and each year since 1984, the volumes of natural gas produc-tion from wells located within that area. The data graphed in Figure 2.4 are presented in Table 2.3.
Figure 2.4 Natural Gas Production by Greater Sage-Grouse Range, 1984–2014
Source: BEBR analysis of data published by the Utah Division of Oil, Gas and Mining.
As with oil production, the rate of natural gas production within SGMAs is now, but was not always, only a small portion—approximately 2 percent—of the statewide rate of production. Natural gas production within SGMAs peaked in the early 1990s, during which time such production constituted approximately two-thirds of all the natural gas produced in Utah. As production from SGMAs has diminished, natural gas production from non-SGMA FWS current range and historical-only range have gradually increased as components of statewide production. In 1994, these two areas combined to account for 17 percent of statewide production, with more than 65 percent of statewide production coming from SGMAs. By 2004, SGMAs’ share of statewide pro-duction had fallen to 12 percent and the combined shares of non-SGMA FWS current range and historical-only range had increased to 47 percent. In 2014, the shares were 2 percent and 57 percent, respectively.
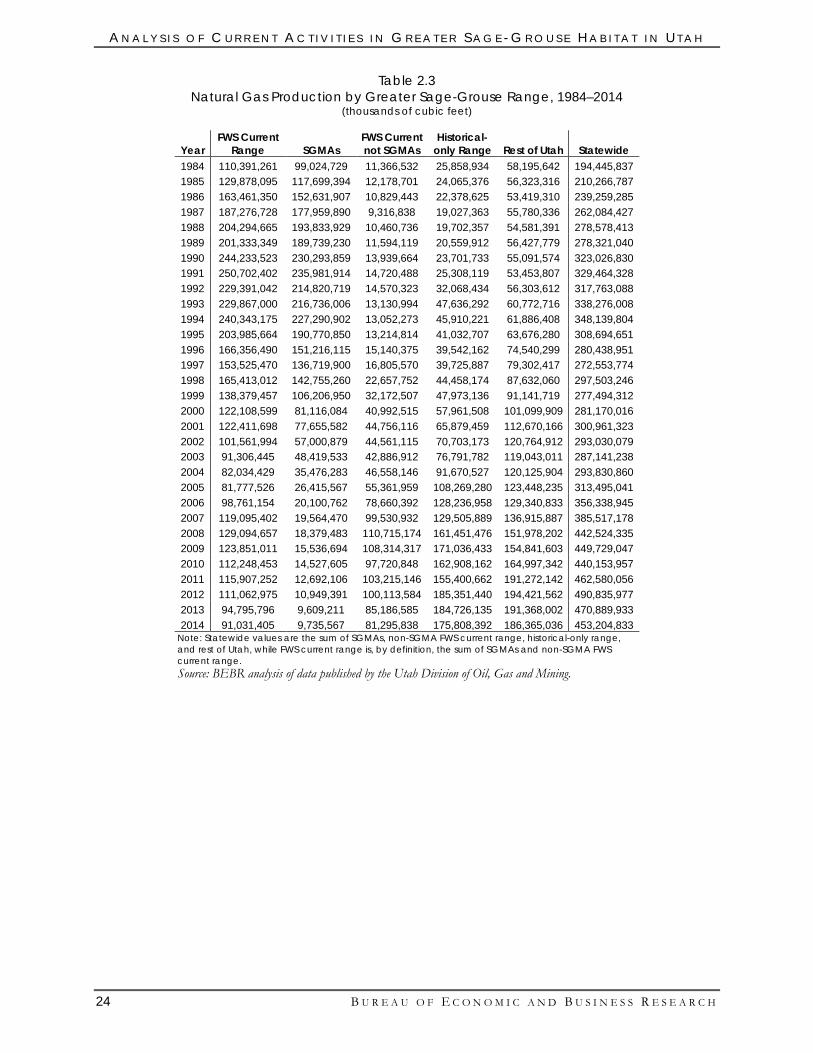
A N A L Y S I S O F C U R R E N T A C T I V I T I E S I N G R E A T E R S A G E - G R O U S E H A B I T A T I N U T A H
24 B U R E A U O F E C O N O M I C A N D B U S I N E S S R E S E A R C H
Table 2.3 Natural Gas Production by Greater Sage-Grouse Range, 1984–2014
(thousands of cubic feet)
Year FWS Current
Range SGMAs FWS Current not SGMAs
Historical-only Range Rest of Utah Statewide
1984 110,391,261 99,024,729 11,366,532 25,858,934 58,195,642 194,445,837 1985 129,878,095 117,699,394 12,178,701 24,065,376 56,323,316 210,266,787 1986 163,461,350 152,631,907 10,829,443 22,378,625 53,419,310 239,259,285 1987 187,276,728 177,959,890 9,316,838 19,027,363 55,780,336 262,084,427 1988 204,294,665 193,833,929 10,460,736 19,702,357 54,581,391 278,578,413 1989 201,333,349 189,739,230 11,594,119 20,559,912 56,427,779 278,321,040 1990 244,233,523 230,293,859 13,939,664 23,701,733 55,091,574 323,026,830 1991 250,702,402 235,981,914 14,720,488 25,308,119 53,453,807 329,464,328 1992 229,391,042 214,820,719 14,570,323 32,068,434 56,303,612 317,763,088 1993 229,867,000 216,736,006 13,130,994 47,636,292 60,772,716 338,276,008 1994 240,343,175 227,290,902 13,052,273 45,910,221 61,886,408 348,139,804 1995 203,985,664 190,770,850 13,214,814 41,032,707 63,676,280 308,694,651 1996 166,356,490 151,216,115 15,140,375 39,542,162 74,540,299 280,438,951 1997 153,525,470 136,719,900 16,805,570 39,725,887 79,302,417 272,553,774 1998 165,413,012 142,755,260 22,657,752 44,458,174 87,632,060 297,503,246 1999 138,379,457 106,206,950 32,172,507 47,973,136 91,141,719 277,494,312 2000 122,108,599 81,116,084 40,992,515 57,961,508 101,099,909 281,170,016 2001 122,411,698 77,655,582 44,756,116 65,879,459 112,670,166 300,961,323 2002 101,561,994 57,000,879 44,561,115 70,703,173 120,764,912 293,030,079 2003 91,306,445 48,419,533 42,886,912 76,791,782 119,043,011 287,141,238 2004 82,034,429 35,476,283 46,558,146 91,670,527 120,125,904 293,830,860 2005 81,777,526 26,415,567 55,361,959 108,269,280 123,448,235 313,495,041 2006 98,761,154 20,100,762 78,660,392 128,236,958 129,340,833 356,338,945 2007 119,095,402 19,564,470 99,530,932 129,505,889 136,915,887 385,517,178 2008 129,094,657 18,379,483 110,715,174 161,451,476 151,978,202 442,524,335 2009 123,851,011 15,536,694 108,314,317 171,036,433 154,841,603 449,729,047 2010 112,248,453 14,527,605 97,720,848 162,908,162 164,997,342 440,153,957 2011 115,907,252 12,692,106 103,215,146 155,400,662 191,272,142 462,580,056 2012 111,062,975 10,949,391 100,113,584 185,351,440 194,421,562 490,835,977 2013 94,795,796 9,609,211 85,186,585 184,726,135 191,368,002 470,889,933 2014 91,031,405 9,735,567 81,295,838 175,808,392 186,365,036 453,204,833
Note: Statewide values are the sum of SGMAs, non-SGMA FWS current range, historical-only range, and rest of Utah, while FWS current range is, by definition, the sum of SGMAs and non-SGMA FWS current range. Source: BEBR analysis of data published by the Utah Division of Oil, Gas and Mining.
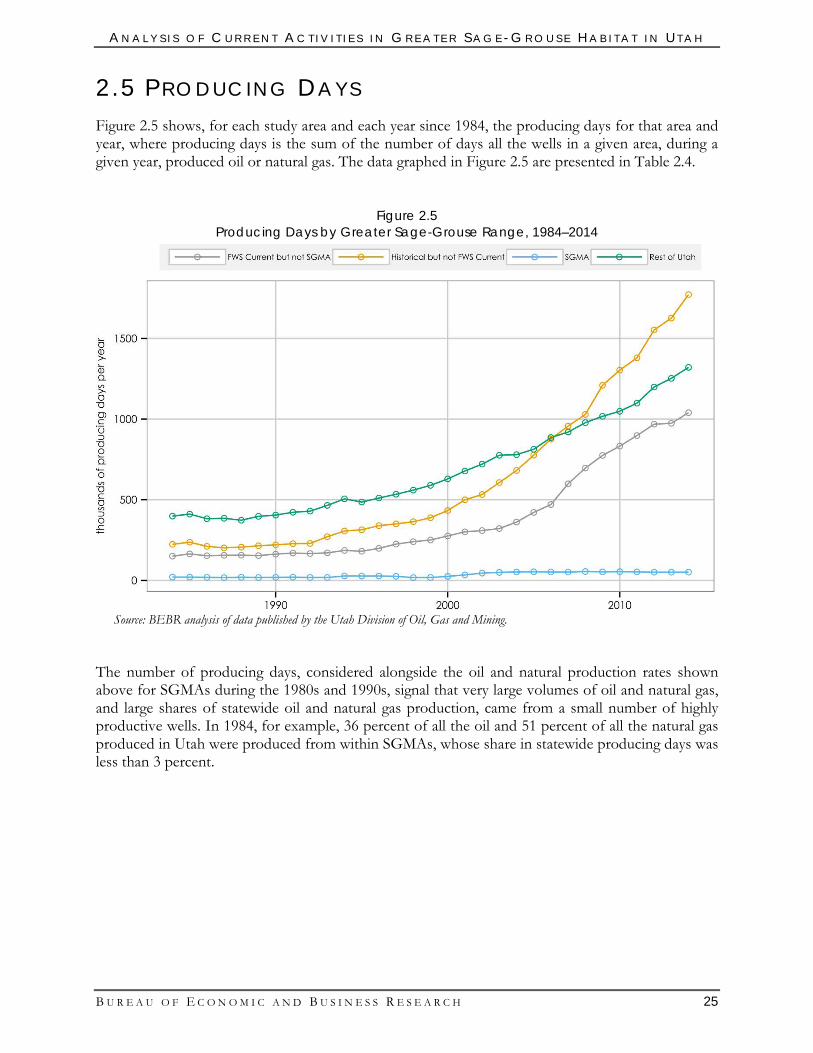
A N A L Y S I S O F C U R R E N T A C T I V I T I E S I N G R E A T E R S A G E - G R O U S E H A B I T A T I N U T A H
B U R E A U O F E C O N O M I C A N D B U S I N E S S R E S E A R C H 25
2.5 PRO D UCI NG DA YS Figure 2.5 shows, for each study area and each year since 1984, the producing days for that area and year, where producing days is the sum of the number of days all the wells in a given area, during a given year, produced oil or natural gas. The data graphed in Figure 2.5 are presented in Table 2.4.
Figure 2.5 Producing Days by Greater Sage-Grouse Range, 1984–2014
Source: BEBR analysis of data published by the Utah Division of Oil, Gas and Mining.
The number of producing days, considered alongside the oil and natural production rates shown above for SGMAs during the 1980s and 1990s, signal that very large volumes of oil and natural gas, and large shares of statewide oil and natural gas production, came from a small number of highly productive wells. In 1984, for example, 36 percent of all the oil and 51 percent of all the natural gas produced in Utah were produced from within SGMAs, whose share in statewide producing days was less than 3 percent.
A N A L Y S I S O F C U R R E N T A C T I V I T I E S I N G R E A T E R S A G E - G R O U S E H A B I T A T I N U T A H
26 B U R E A U O F E C O N O M I C A N D B U S I N E S S R E S E A R C H
Table 2.4 Producing Days by Greater Sage-Grouse Range, 1984–2014
Year
FWS Current Range SGMAs
FWS Current
not SGMAs
Historical-only
Range Rest of Utah Statewide
1984 170,863 20,556 150,307 223,621 398,468 792,952 1985 184,180 20,238 163,942 236,739 410,812 831,731 1986 171,708 18,905 152,803 211,077 382,251 765,036 1987 172,637 16,989 155,648 201,513 384,895 759,045 1988 176,102 19,613 156,489 206,325 373,013 755,440 1989 171,437 17,755 153,682 214,727 396,953 783,117 1990 181,589 18,748 162,841 220,404 404,778 806,771 1991 189,407 20,051 169,356 227,435 422,312 839,154 1992 184,581 18,053 166,528 229,121 429,187 842,889 1993 188,451 18,041 170,410 270,793 464,927 924,171 1994 212,625 27,106 185,519 306,205 505,074 1,023,904 1995 207,435 26,739 180,696 313,663 485,484 1,006,582 1996 225,284 26,778 198,506 339,319 510,410 1,075,013 1997 250,344 25,275 225,069 350,029 534,020 1,134,393 1998 257,134 17,227 239,907 363,802 559,637 1,180,573 1999 268,222 17,944 250,278 388,228 589,148 1,245,598 2000 300,385 24,854 275,531 433,221 629,151 1,362,757 2001 335,153 33,986 301,167 499,365 677,956 1,512,474 2002 353,711 45,030 308,681 532,300 720,661 1,606,672 2003 371,171 49,699 321,472 606,483 775,768 1,753,422 2004 413,744 52,313 361,431 681,191 779,465 1,874,400 2005 474,561 53,142 421,419 776,091 812,852 2,063,504 2006 522,678 52,429 470,249 876,146 885,468 2,284,292 2007 650,043 51,215 598,828 956,567 919,692 2,526,302 2008 751,035 54,939 696,096 1,028,616 977,706 2,757,357 2009 827,315 52,719 774,596 1,209,299 1,017,143 3,053,757 2010 886,126 53,829 832,297 1,302,954 1,048,379 3,237,459 2011 950,491 52,803 897,688 1,379,233 1,098,530 3,428,254 2012 1,018,984 50,659 968,325 1,552,588 1,198,944 3,770,516 2013 1,024,634 50,721 973,913 1,626,139 1,252,636 3,903,409 2014 1,090,134 50,670 1,039,464 1,771,351 1,320,628 4,182,113
Note: Statewide values are the sum of SGMAs, non-SGMA FWS current range, historical-only range, and rest of Utah, while FWS current range is, by definition, the sum of SGMAs and non-SGMA FWS current range. Source: BEBR analysis of data published by the U.S. Bureau of Labor Statistics and the U.S. Bureau of Economic Analysis.
A N A L Y S I S O F C U R R E N T A C T I V I T I E S I N G R E A T E R S A G E - G R O U S E H A B I T A T I N U T A H
B U R E A U O F E C O N O M I C A N D B U S I N E S S R E S E A R C H 27
2.6 SUBSE QUE N T WO RK Figure 2.6 shows, for each study area, the number of subsequent well work events for each year since 1980. Subsequent well work events include operations meant to restore or enhance the productivity of the well, and the plugging and permanent abandonment of the well. The data graphed in Figure 2.6 are presented in Table 2.5.
Figure 2.6 Subsequent Work by Greater Sage-Grouse Range, 1980–2014
Source: BEBR analysis of data published by the Utah Division of Oil, Gas and Mining.
On a per-event basis, subsequent well work events are generally less expensive and shorter in dura-tion than the initial drilling of the well. Where these events may require a few days, the initial drilling generally requires a few weeks or even a few months, depending on well depth. Nevertheless, subse-quent work events are an important indicator of oil and natural gas industry activity within an area. For example, although no oil or natural gas wells were drilled within SGMAs during 2014, there were 12 subsequent work events, 9 of which were the plugging and abandonment of wells.
A N A L Y S I S O F C U R R E N T A C T I V I T I E S I N G R E A T E R S A G E - G R O U S E H A B I T A T I N U T A H
28 B U R E A U O F E C O N O M I C A N D B U S I N E S S R E S E A R C H
Table 2.5 Subsequent Work by Greater Sage-Grouse Range, 1980–2014
Year
FWS Current Range SGMAs
FWS Current
not SGMAs
Historical-only
Range Rest of Utah Statewide
1980 6 3 3 4 10 20 1981 9 6 3 3 20 32 1982 3 2 1 2 14 19 1983 5 4 1 5 19 29 1984 9 7 2 5 9 23 1985 6 2 4 10 26 42 1986 6 4 2 7 29 42 1987 12 5 7 6 25 43 1988 10 1 9 10 29 49 1989 4 2 2 8 16 28 1990 12 1 11 10 21 43 1991 4 2 2 6 15 25 1992 12 5 7 4 20 36 1993 8 5 3 10 18 36 1994 16 5 11 9 21 46 1995 11 4 7 7 44 62 1996 20 7 13 15 41 76 1997 37 13 24 7 67 111 1998 54 17 37 23 51 128 1999 66 4 62 70 61 197 2000 83 6 77 92 72 247 2001 105 4 101 85 40 230 2002 89 5 84 79 54 222 2003 89 11 78 81 48 218 2004 92 10 82 92 75 259 2005 137 1 136 121 91 349 2006 144 9 135 107 81 332 2007 143 19 124 149 75 367 2008 129 5 124 187 113 429 2009 125 7 118 202 106 433 2010 173 6 167 136 117 426 2011 107 8 99 124 80 311 2012 207 3 204 162 134 503 2013 192 9 183 190 111 493 2014 200 12 188 175 96 471
Note: Statewide values are the sum of SGMAs, non-SGMA FWS current range, historical-only range, and rest of Utah, while FWS current range is, by definition, the sum of SGMAs and non-SGMA FWS current range. Source: BEBR analysis of data published by the Utah Division of Oil, Gas and Mining.
2.7 EM P L OYM EN T Figure 2.7 shows historical employment statewide within three oil and natural gas industry sectors. The employment counts refer to average monthly employment by place of work—in this case, Utah. Within each industry, employment counts are given for two measures of employment. The first meas-ure is from the Quarterly Census of Employment and Wages (QCEW), published by the U.S. Bu-reau of Labor Statistics (BLS), and does not include proprietors. The QCEW series provides detailed employment counts by industry by month, quarter and year, where the geographical place that bears the counts is the place where the employment occurs, rather than the place where the employee lives.
A N A L Y S I S O F C U R R E N T A C T I V I T I E S I N G R E A T E R S A G E - G R O U S E H A B I T A T I N U T A H
B U R E A U O F E C O N O M I C A N D B U S I N E S S R E S E A R C H 29
Figure 2.7 Statewide Employment in Oil and Natural Gas Sectors, 1990–2013
Source: BEBR analysis of data published by the U.S. Bureau of Labor Statistics and the U.S. Bureau of Economic Analysis.
A disadvantage of the QCEW measure is that it does not include sole proprietors or certain part-ners. Since in the oil and natural gas industries sole proprietors appear to be a significant component of the workforce, QCEW data may significantly underestimate employment for these sectors. The second measure is derived from the QCEW series by adding to the QCEW employment counts the product of the QCEW counts and an estimate of proprietor employment as a fraction of QCEW employment. This estimate is based on a different employment data series, which is pub-lished by the U.S. Bureau of Economic Analysis (BEA). This data series includes proprietors and partners not assumed to be limited partners but lacks the industry and time detail of the QCEW da-ta, being available only annually and only for more highly aggregated sectors. The QCEW drilling and support sectors fall within the same single BEA sector, for example. For each QCEW sector, and for each year, the QCEW counts are aggregated to the finest level of industry detail available from the BEA counts. The ratio of BEA counts to QCEW counts is then computed and applied to the QCEW counts at the original level of detail.
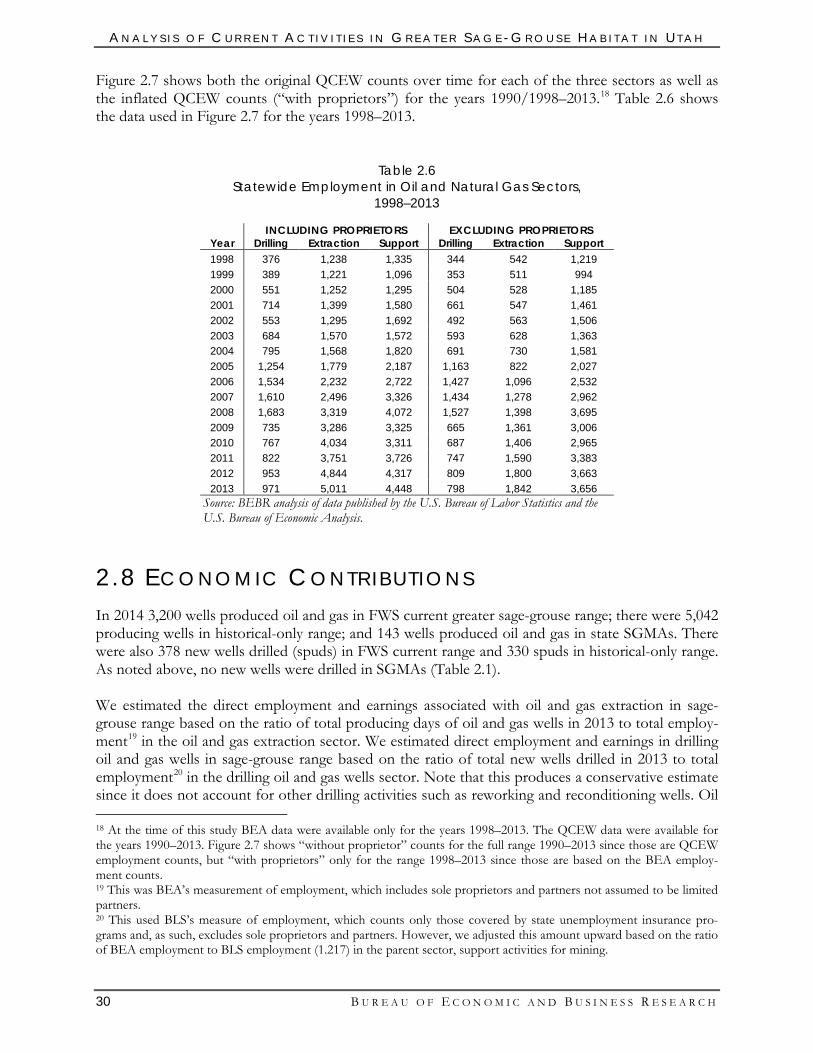
A N A L Y S I S O F C U R R E N T A C T I V I T I E S I N G R E A T E R S A G E - G R O U S E H A B I T A T I N U T A H
30 B U R E A U O F E C O N O M I C A N D B U S I N E S S R E S E A R C H
Figure 2.7 shows both the original QCEW counts over time for each of the three sectors as well as the inflated QCEW counts (“with proprietors”) for the years 1990/1998–2013.18 Table 2.6 shows the data used in Figure 2.7 for the years 1998–2013.
Table 2.6 Statewide Employment in Oil and Natural Gas Sectors,
1998–2013
INCLUDING PROPRIETORS EXCLUDING PROPRIETORS Year Drilling Extraction Support Drilling Extraction Support 1998 376 1,238 1,335 344 542 1,219 1999 389 1,221 1,096 353 511 994 2000 551 1,252 1,295 504 528 1,185 2001 714 1,399 1,580 661 547 1,461 2002 553 1,295 1,692 492 563 1,506 2003 684 1,570 1,572 593 628 1,363 2004 795 1,568 1,820 691 730 1,581 2005 1,254 1,779 2,187 1,163 822 2,027 2006 1,534 2,232 2,722 1,427 1,096 2,532 2007 1,610 2,496 3,326 1,434 1,278 2,962 2008 1,683 3,319 4,072 1,527 1,398 3,695 2009 735 3,286 3,325 665 1,361 3,006 2010 767 4,034 3,311 687 1,406 2,965 2011 822 3,751 3,726 747 1,590 3,383 2012 953 4,844 4,317 809 1,800 3,663 2013 971 5,011 4,448 798 1,842 3,656
Source: BEBR analysis of data published by the U.S. Bureau of Labor Statistics and the U.S. Bureau of Economic Analysis.
2.8 ECO N O MI C CON TR I BUT I ON S In 2014 3,200 wells produced oil and gas in FWS current greater sage-grouse range; there were 5,042 producing wells in historical-only range; and 143 wells produced oil and gas in state SGMAs. There were also 378 new wells drilled (spuds) in FWS current range and 330 spuds in historical-only range. As noted above, no new wells were drilled in SGMAs (Table 2.1). We estimated the direct employment and earnings associated with oil and gas extraction in sage-grouse range based on the ratio of total producing days of oil and gas wells in 2013 to total employ-ment19 in the oil and gas extraction sector. We estimated direct employment and earnings in drilling oil and gas wells in sage-grouse range based on the ratio of total new wells drilled in 2013 to total employment20 in the drilling oil and gas wells sector. Note that this produces a conservative estimate since it does not account for other drilling activities such as reworking and reconditioning wells. Oil 18 At the time of this study BEA data were available only for the years 1998–2013. The QCEW data were available for the years 1990–2013. Figure 2.7 shows “without proprietor” counts for the full range 1990–2013 since those are QCEW employment counts, but “with proprietors” only for the range 1998–2013 since those are based on the BEA employ-ment counts. 19 This was BEA’s measurement of employment, which includes sole proprietors and partners not assumed to be limited partners. 20 This used BLS’s measure of employment, which counts only those covered by state unemployment insurance pro-grams and, as such, excludes sole proprietors and partners. However, we adjusted this amount upward based on the ratio of BEA employment to BLS employment (1.217) in the parent sector, support activities for mining.
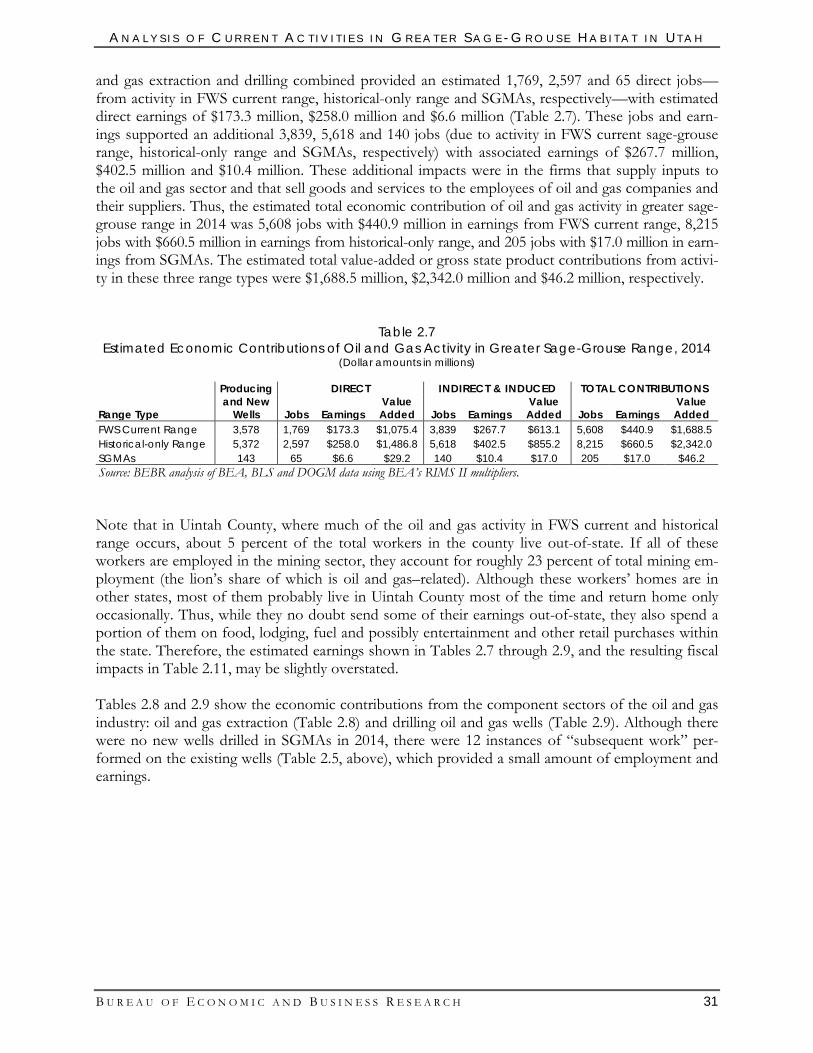
A N A L Y S I S O F C U R R E N T A C T I V I T I E S I N G R E A T E R S A G E - G R O U S E H A B I T A T I N U T A H
B U R E A U O F E C O N O M I C A N D B U S I N E S S R E S E A R C H 31
and gas extraction and drilling combined provided an estimated 1,769, 2,597 and 65 direct jobs—from activity in FWS current range, historical-only range and SGMAs, respectively—with estimated direct earnings of $173.3 million, $258.0 million and $6.6 million (Table 2.7). These jobs and earn-ings supported an additional 3,839, 5,618 and 140 jobs (due to activity in FWS current sage-grouse range, historical-only range and SGMAs, respectively) with associated earnings of $267.7 million, $402.5 million and $10.4 million. These additional impacts were in the firms that supply inputs to the oil and gas sector and that sell goods and services to the employees of oil and gas companies and their suppliers. Thus, the estimated total economic contribution of oil and gas activity in greater sage-grouse range in 2014 was 5,608 jobs with $440.9 million in earnings from FWS current range, 8,215 jobs with $660.5 million in earnings from historical-only range, and 205 jobs with $17.0 million in earn-ings from SGMAs. The estimated total value-added or gross state product contributions from activi-ty in these three range types were $1,688.5 million, $2,342.0 million and $46.2 million, respectively.
Table 2.7 Estimated Economic Contributions of Oil and Gas Activity in Greater Sage-Grouse Range, 2014
(Dollar amounts in millions)
Producing and New
Wells
DIRECT INDIRECT & INDUCED TOTAL CONTRIBUTIONS
Range Type Jobs Earnings Value Added Jobs Earnings
Value Added Jobs Earnings
Value Added
FWS Current Range 3,578 1,769 $173.3 $1,075.4 3,839 $267.7 $613.1 5,608 $440.9 $1,688.5 Historical-only Range 5,372 2,597 $258.0 $1,486.8 5,618 $402.5 $855.2 8,215 $660.5 $2,342.0 SGMAs 143 65 $6.6 $29.2 140 $10.4 $17.0 205 $17.0 $46.2 Source: BEBR analysis of BEA, BLS and DOGM data using BEA’s RIMS II multipliers. Note that in Uintah County, where much of the oil and gas activity in FWS current and historical range occurs, about 5 percent of the total workers in the county live out-of-state. If all of these workers are employed in the mining sector, they account for roughly 23 percent of total mining em-ployment (the lion’s share of which is oil and gas–related). Although these workers’ homes are in other states, most of them probably live in Uintah County most of the time and return home only occasionally. Thus, while they no doubt send some of their earnings out-of-state, they also spend a portion of them on food, lodging, fuel and possibly entertainment and other retail purchases within the state. Therefore, the estimated earnings shown in Tables 2.7 through 2.9, and the resulting fiscal impacts in Table 2.11, may be slightly overstated. Tables 2.8 and 2.9 show the economic contributions from the component sectors of the oil and gas industry: oil and gas extraction (Table 2.8) and drilling oil and gas wells (Table 2.9). Although there were no new wells drilled in SGMAs in 2014, there were 12 instances of “subsequent work” per-formed on the existing wells (Table 2.5, above), which provided a small amount of employment and earnings.
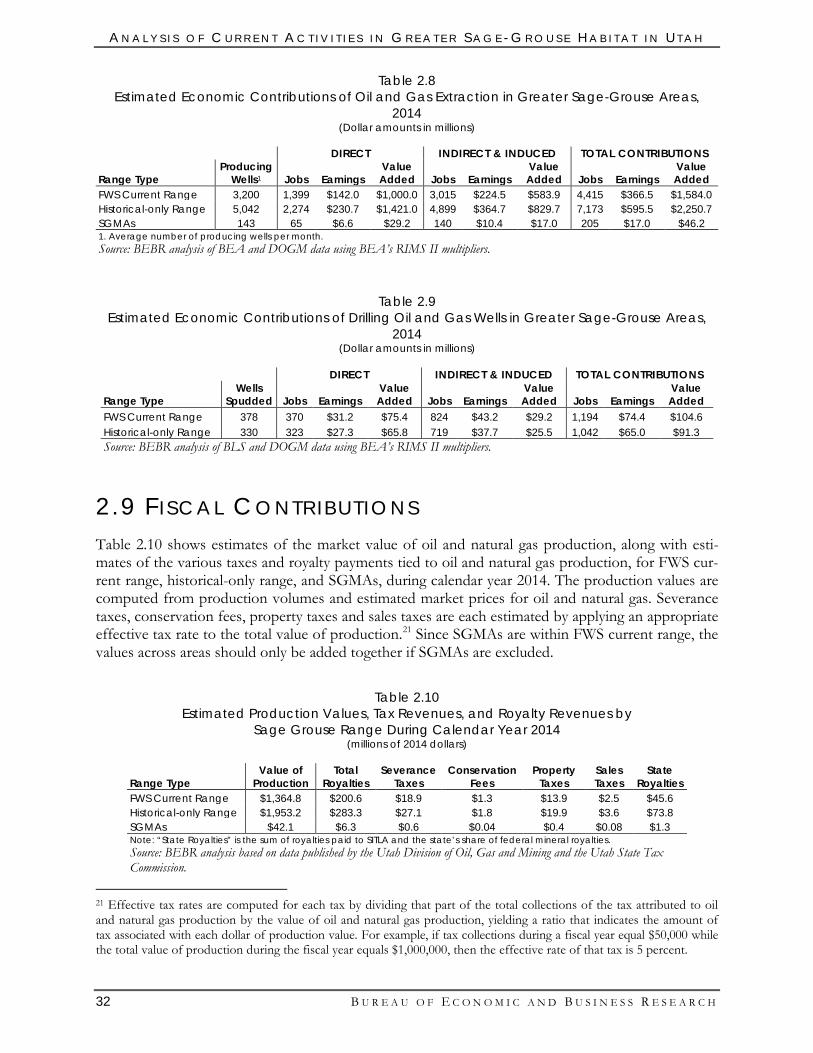
A N A L Y S I S O F C U R R E N T A C T I V I T I E S I N G R E A T E R S A G E - G R O U S E H A B I T A T I N U T A H
32 B U R E A U O F E C O N O M I C A N D B U S I N E S S R E S E A R C H
Table 2.8 Estimated Economic Contributions of Oil and Gas Extraction in Greater Sage-Grouse Areas,
2014 (Dollar amounts in millions)
DIRECT INDIRECT & INDUCED TOTAL CONTRIBUTIONS
Range Type Producing
Wells1 Jobs Earnings Value Added Jobs Earnings
Value Added Jobs Earnings
Value Added
FWS Current Range 3,200 1,399 $142.0 $1,000.0 3,015 $224.5 $583.9 4,415 $366.5 $1,584.0 Historical-only Range 5,042 2,274 $230.7 $1,421.0 4,899 $364.7 $829.7 7,173 $595.5 $2,250.7 SGMAs 143 65 $6.6 $29.2 140 $10.4 $17.0 205 $17.0 $46.2 1. Average number of producing wells per month. Source: BEBR analysis of BEA and DOGM data using BEA’s RIMS II multipliers.
Table 2.9 Estimated Economic Contributions of Drilling Oil and Gas Wells in Greater Sage-Grouse Areas,
2014 (Dollar amounts in millions)
DIRECT INDIRECT & INDUCED TOTAL CONTRIBUTIONS
Range Type Wells
Spudded Jobs Earnings Value Added Jobs Earnings
Value Added Jobs Earnings
Value Added
FWS Current Range 378 370 $31.2 $75.4 824 $43.2 $29.2 1,194 $74.4 $104.6 Historical-only Range 330 323 $27.3 $65.8 719 $37.7 $25.5 1,042 $65.0 $91.3 Source: BEBR analysis of BLS and DOGM data using BEA’s RIMS II multipliers.
2.9 F I SCA L CO N TR I BUT I ONS Table 2.10 shows estimates of the market value of oil and natural gas production, along with esti-mates of the various taxes and royalty payments tied to oil and natural gas production, for FWS cur-rent range, historical-only range, and SGMAs, during calendar year 2014. The production values are computed from production volumes and estimated market prices for oil and natural gas. Severance taxes, conservation fees, property taxes and sales taxes are each estimated by applying an appropriate effective tax rate to the total value of production.21 Since SGMAs are within FWS current range, the values across areas should only be added together if SGMAs are excluded.
Table 2.10 Estimated Production Values, Tax Revenues, and Royalty Revenues by
Sage Grouse Range During Calendar Year 2014 (millions of 2014 dollars)
Range Type Value of
Production Total
Royalties Severance
Taxes Conservation
Fees Property
Taxes Sales Taxes
State Royalties
FWS Current Range $1,364.8 $200.6 $18.9 $1.3 $13.9 $2.5 $45.6 Historical-only Range $1,953.2 $283.3 $27.1 $1.8 $19.9 $3.6 $73.8 SGMAs $42.1 $6.3 $0.6 $0.04 $0.4 $0.08 $1.3 Note: “State Royalties” is the sum of royalties paid to SITLA and the state’s share of federal mineral royalties. Source: BEBR analysis based on data published by the Utah Division of Oil, Gas and Mining and the Utah State Tax Commission.
21 Effective tax rates are computed for each tax by dividing that part of the total collections of the tax attributed to oil and natural gas production by the value of oil and natural gas production, yielding a ratio that indicates the amount of tax associated with each dollar of production value. For example, if tax collections during a fiscal year equal $50,000 while the total value of production during the fiscal year equals $1,000,000, then the effective rate of that tax is 5 percent.
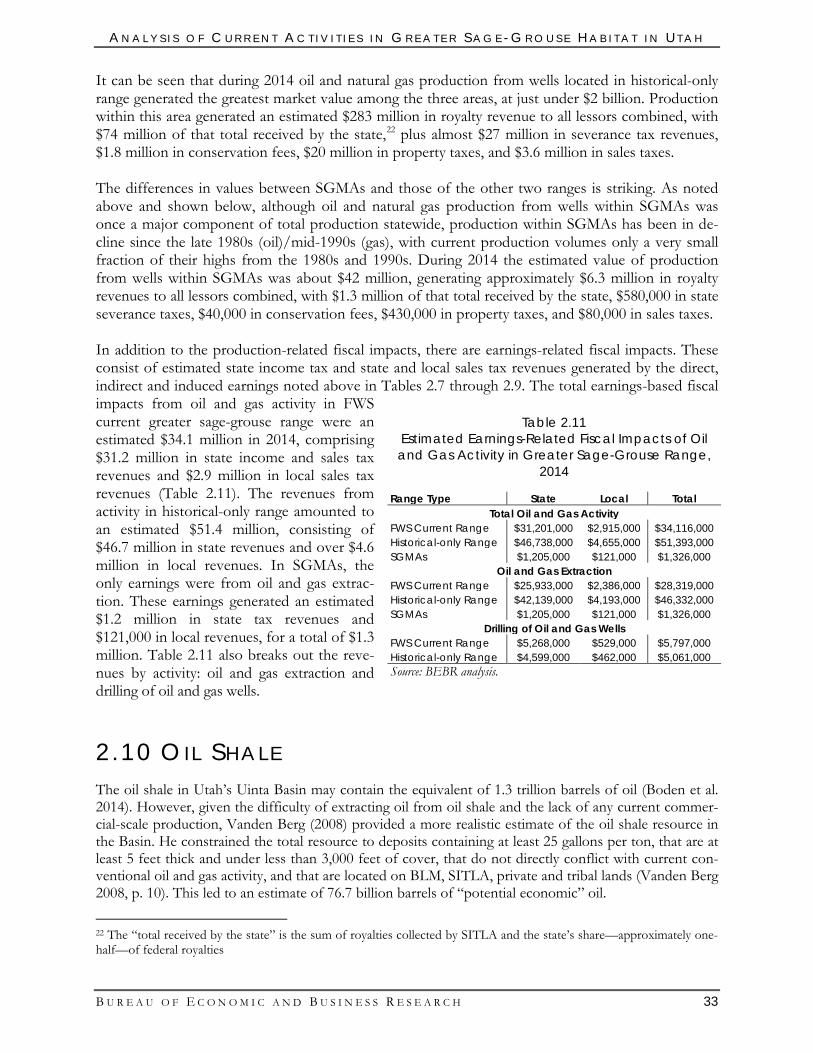
A N A L Y S I S O F C U R R E N T A C T I V I T I E S I N G R E A T E R S A G E - G R O U S E H A B I T A T I N U T A H
B U R E A U O F E C O N O M I C A N D B U S I N E S S R E S E A R C H 33
It can be seen that during 2014 oil and natural gas production from wells located in historical-only range generated the greatest market value among the three areas, at just under $2 billion. Production within this area generated an estimated $283 million in royalty revenue to all lessors combined, with $74 million of that total received by the state,22 plus almost $27 million in severance tax revenues, $1.8 million in conservation fees, $20 million in property taxes, and $3.6 million in sales taxes. The differences in values between SGMAs and those of the other two ranges is striking. As noted above and shown below, although oil and natural gas production from wells within SGMAs was once a major component of total production statewide, production within SGMAs has been in de-cline since the late 1980s (oil)/mid-1990s (gas), with current production volumes only a very small fraction of their highs from the 1980s and 1990s. During 2014 the estimated value of production from wells within SGMAs was about $42 million, generating approximately $6.3 million in royalty revenues to all lessors combined, with $1.3 million of that total received by the state, $580,000 in state severance taxes, $40,000 in conservation fees, $430,000 in property taxes, and $80,000 in sales taxes. In addition to the production-related fiscal impacts, there are earnings-related fiscal impacts. These consist of estimated state income tax and state and local sales tax revenues generated by the direct, indirect and induced earnings noted above in Tables 2.7 through 2.9. The total earnings-based fiscal impacts from oil and gas activity in FWS current greater sage-grouse range were an estimated $34.1 million in 2014, comprising $31.2 million in state income and sales tax revenues and $2.9 million in local sales tax revenues (Table 2.11). The revenues from activity in historical-only range amounted to an estimated $51.4 million, consisting of $46.7 million in state revenues and over $4.6 million in local revenues. In SGMAs, the only earnings were from oil and gas extrac-tion. These earnings generated an estimated $1.2 million in state tax revenues and $121,000 in local revenues, for a total of $1.3 million. Table 2.11 also breaks out the reve-nues by activity: oil and gas extraction and drilling of oil and gas wells.
2.10 OI L SHAL E The oil shale in Utah’s Uinta Basin may contain the equivalent of 1.3 trillion barrels of oil (Boden et al. 2014). However, given the difficulty of extracting oil from oil shale and the lack of any current commer-cial-scale production, Vanden Berg (2008) provided a more realistic estimate of the oil shale resource in the Basin. He constrained the total resource to deposits containing at least 25 gallons per ton, that are at least 5 feet thick and under less than 3,000 feet of cover, that do not directly conflict with current con-ventional oil and gas activity, and that are located on BLM, SITLA, private and tribal lands (Vanden Berg 2008, p. 10). This led to an estimate of 76.7 billion barrels of “potential economic” oil.
22 The “total received by the state” is the sum of royalties collected by SITLA and the state’s share—approximately one-half—of federal royalties
Table 2.11 Estimated Earnings-Related Fiscal Impacts of Oil and Gas Activity in Greater Sage-Grouse Range,
2014
Range Type State Local Total Total Oil and Gas Activity
FWS Current Range $31,201,000 $2,915,000 $34,116,000 Historical-only Range $46,738,000 $4,655,000 $51,393,000 SGMAs $1,205,000 $121,000 $1,326,000
Oil and Gas Extraction FWS Current Range $25,933,000 $2,386,000 $28,319,000 Historical-only Range $42,139,000 $4,193,000 $46,332,000 SGMAs $1,205,000 $121,000 $1,326,000
Drilling of Oil and Gas Wells FWS Current Range $5,268,000 $529,000 $5,797,000 Historical-only Range $4,599,000 $462,000 $5,061,000 Source: BEBR analysis.
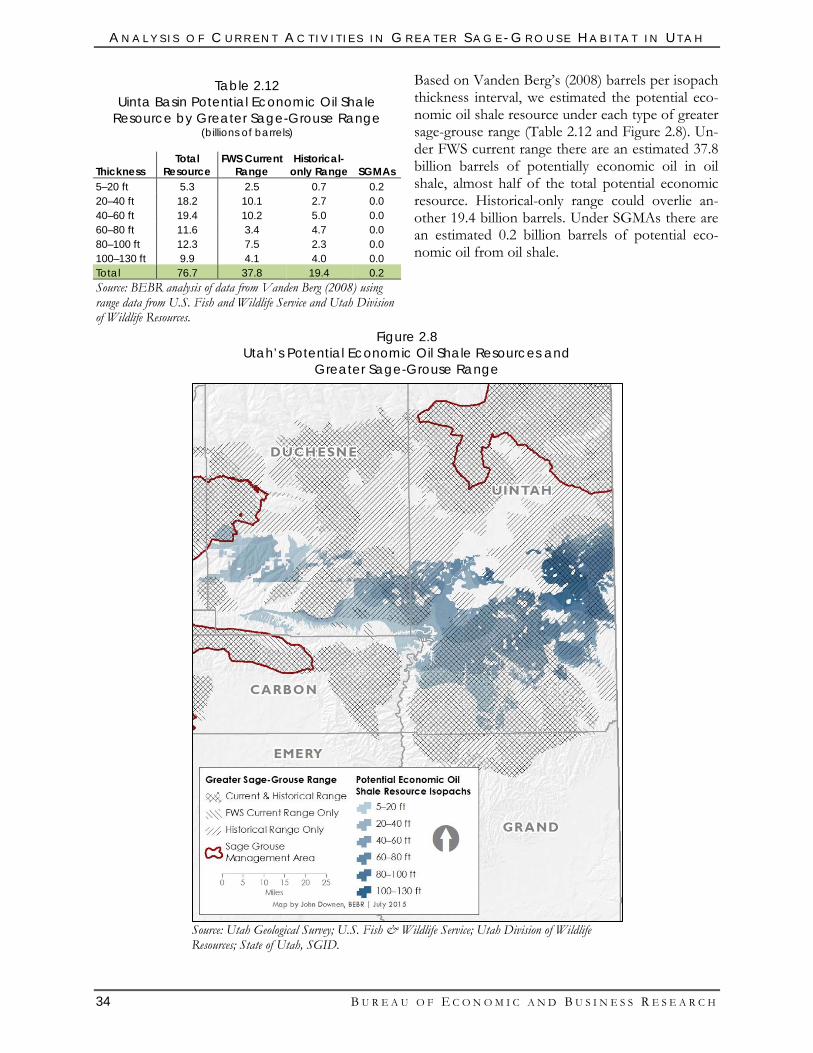
A N A L Y S I S O F C U R R E N T A C T I V I T I E S I N G R E A T E R S A G E - G R O U S E H A B I T A T I N U T A H
34 B U R E A U O F E C O N O M I C A N D B U S I N E S S R E S E A R C H
Based on Vanden Berg’s (2008) barrels per isopach thickness interval, we estimated the potential eco-nomic oil shale resource under each type of greater sage-grouse range (Table 2.12 and Figure 2.8). Un-der FWS current range there are an estimated 37.8 billion barrels of potentially economic oil in oil shale, almost half of the total potential economic resource. Historical-only range could overlie an-other 19.4 billion barrels. Under SGMAs there are an estimated 0.2 billion barrels of potential eco-nomic oil from oil shale.
Figure 2.8 Utah’s Potential Economic Oil Shale Resources and
Greater Sage-Grouse Range
Source: Utah Geological Survey; U.S. Fish & Wildlife Service; Utah Division of Wildlife Resources; State of Utah, SGID.
Table 2.12 Uinta Basin Potential Economic Oil Shale
Resource by Greater Sage-Grouse Range (billions of barrels)
Thickness Total
Resource FWS Current
Range Historical-
only Range SGMAs 5–20 ft 5.3 2.5 0.7 0.2 20–40 ft 18.2 10.1 2.7 0.0 40–60 ft 19.4 10.2 5.0 0.0 60–80 ft 11.6 3.4 4.7 0.0 80–100 ft 12.3 7.5 2.3 0.0 100–130 ft 9.9 4.1 4.0 0.0 Total 76.7 37.8 19.4 0.2 Source: BEBR analysis of data from Vanden Berg (2008) using range data from U.S. Fish and Wildlife Service and Utah Division of Wildlife Resources.
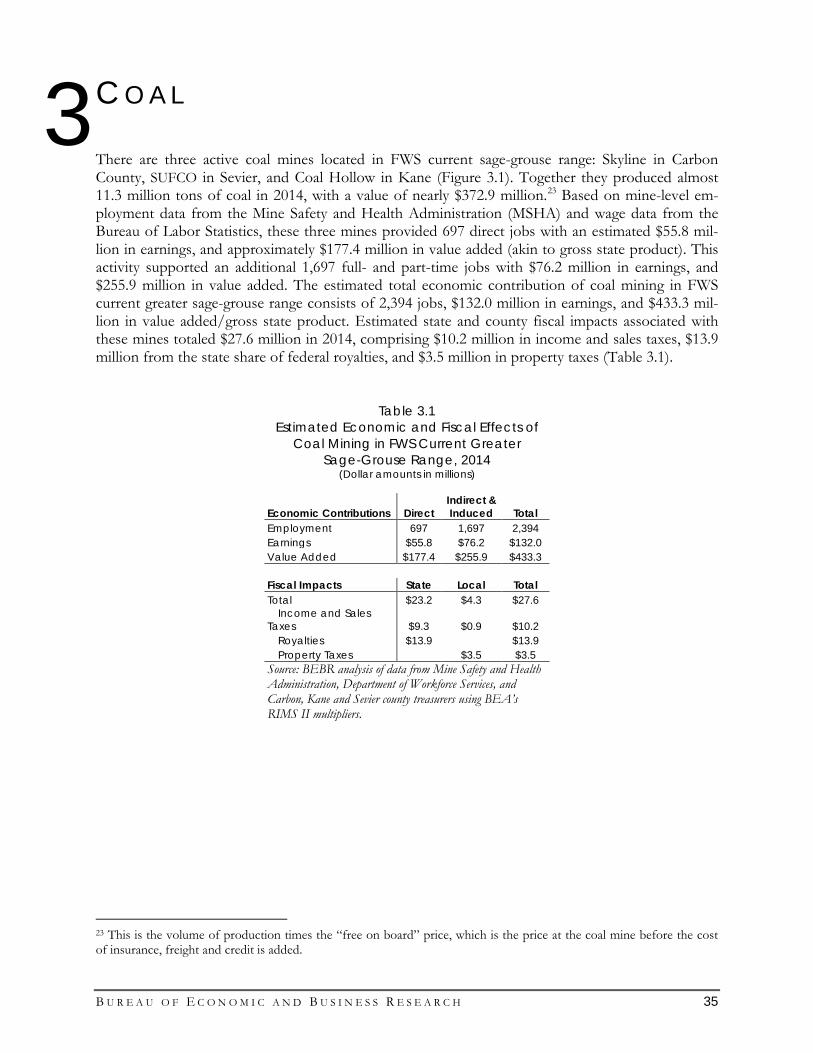
B U R E A U O F E C O N O M I C A N D B U S I N E S S R E S E A R C H 35
COAL There are three active coal mines located in FWS current sage-grouse range: Skyline in Carbon County, SUFCO in Sevier, and Coal Hollow in Kane (Figure 3.1). Together they produced almost 11.3 million tons of coal in 2014, with a value of nearly $372.9 million.23 Based on mine-level em-ployment data from the Mine Safety and Health Administration (MSHA) and wage data from the Bureau of Labor Statistics, these three mines provided 697 direct jobs with an estimated $55.8 mil-lion in earnings, and approximately $177.4 million in value added (akin to gross state product). This activity supported an additional 1,697 full- and part-time jobs with $76.2 million in earnings, and $255.9 million in value added. The estimated total economic contribution of coal mining in FWS current greater sage-grouse range consists of 2,394 jobs, $132.0 million in earnings, and $433.3 mil-lion in value added/gross state product. Estimated state and county fiscal impacts associated with these mines totaled $27.6 million in 2014, comprising $10.2 million in income and sales taxes, $13.9 million from the state share of federal royalties, and $3.5 million in property taxes (Table 3.1).
Table 3.1 Estimated Economic and Fiscal Effects of
Coal Mining in FWS Current Greater Sage-Grouse Range, 2014
(Dollar amounts in millions)
Economic Contributions Direct Indirect & Induced Total
Employment 697 1,697 2,394 Earnings $55.8 $76.2 $132.0 Value Added $177.4 $255.9 $433.3
Fiscal Impacts State Local Total Total $23.2 $4.3 $27.6
Income and Sales Taxes $9.3 $0.9 $10.2
Royalties $13.9
$13.9 Property Taxes $3.5 $3.5
Source: BEBR analysis of data from Mine Safety and Health Administration, Department of Workforce Services, and Carbon, Kane and Sevier county treasurers using BEA’s RIMS II multipliers.
23 This is the volume of production times the “free on board” price, which is the price at the coal mine before the cost of insurance, freight and credit is added.
3
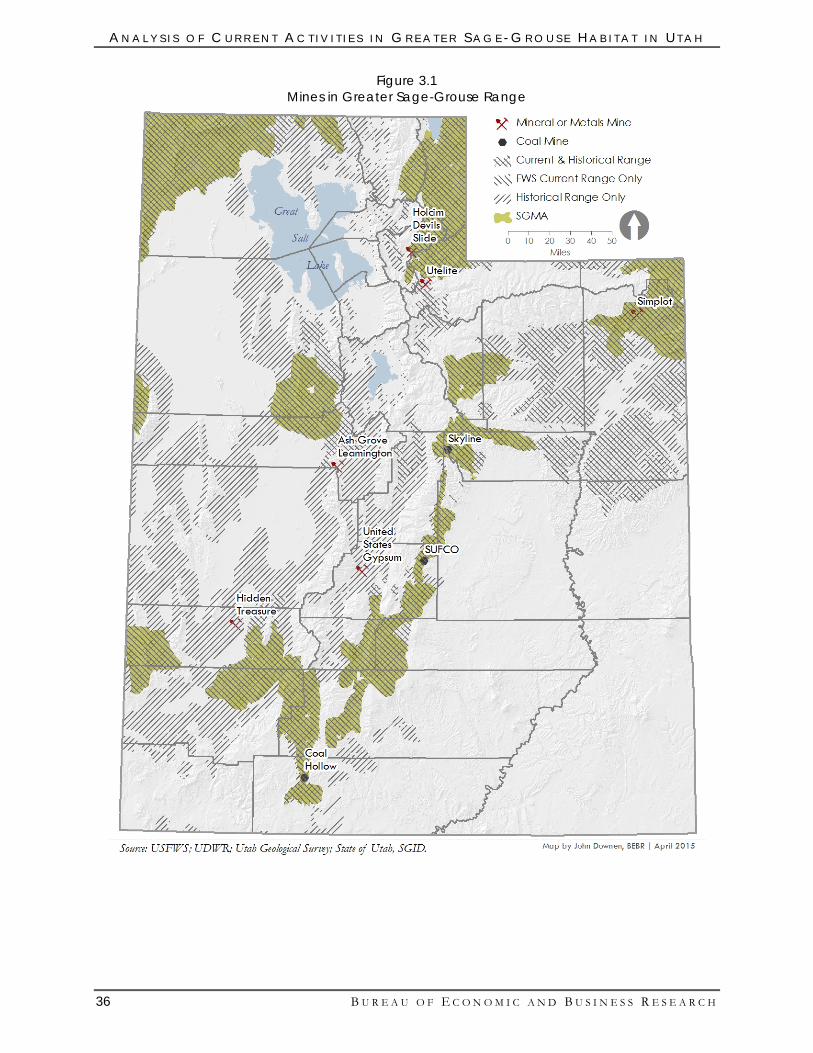
A N A L Y S I S O F C U R R E N T A C T I V I T I E S I N G R E A T E R S A G E - G R O U S E H A B I T A T I N U T A H
36 B U R E A U O F E C O N O M I C A N D B U S I N E S S R E S E A R C H
Figure 3.1 Mines in Greater Sage-Grouse Range
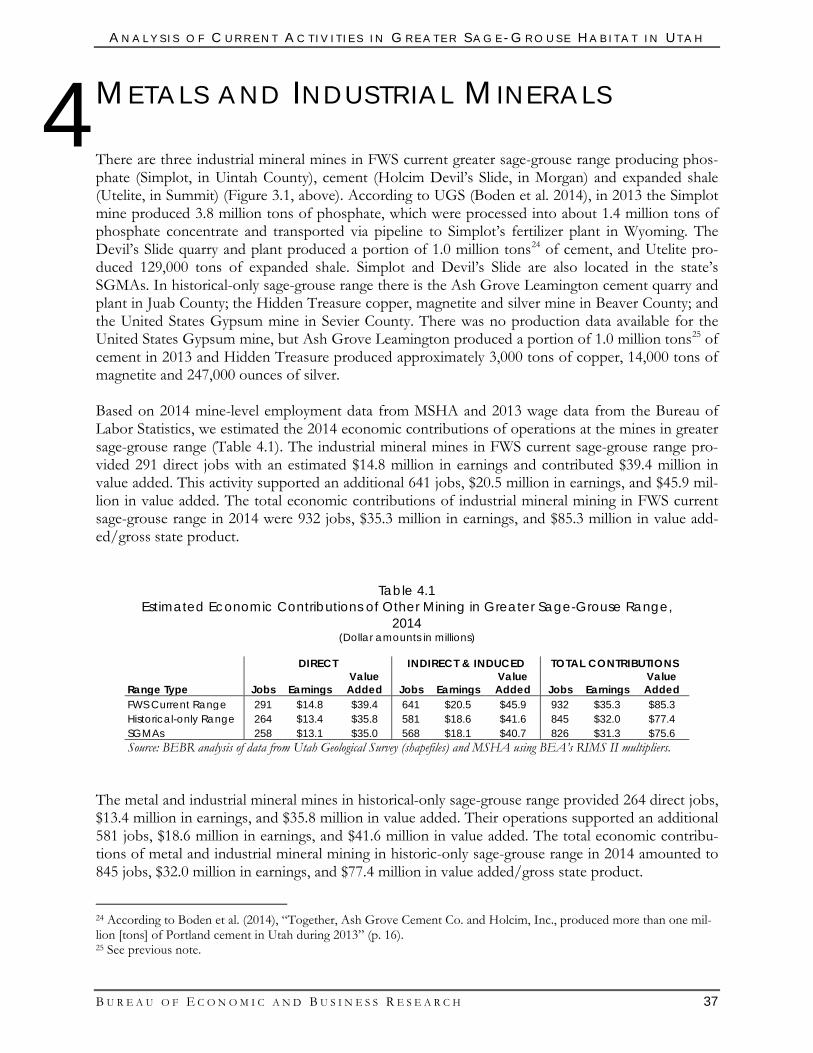
A N A L Y S I S O F C U R R E N T A C T I V I T I E S I N G R E A T E R S A G E - G R O U S E H A B I T A T I N U T A H
B U R E A U O F E C O N O M I C A N D B U S I N E S S R E S E A R C H 37
METALS AND INDUSTRIAL MINERALS There are three industrial mineral mines in FWS current greater sage-grouse range producing phos-phate (Simplot, in Uintah County), cement (Holcim Devil’s Slide, in Morgan) and expanded shale (Utelite, in Summit) (Figure 3.1, above). According to UGS (Boden et al. 2014), in 2013 the Simplot mine produced 3.8 million tons of phosphate, which were processed into about 1.4 million tons of phosphate concentrate and transported via pipeline to Simplot’s fertilizer plant in Wyoming. The Devil’s Slide quarry and plant produced a portion of 1.0 million tons24 of cement, and Utelite pro-duced 129,000 tons of expanded shale. Simplot and Devil’s Slide are also located in the state’s SGMAs. In historical-only sage-grouse range there is the Ash Grove Leamington cement quarry and plant in Juab County; the Hidden Treasure copper, magnetite and silver mine in Beaver County; and the United States Gypsum mine in Sevier County. There was no production data available for the United States Gypsum mine, but Ash Grove Leamington produced a portion of 1.0 million tons25 of cement in 2013 and Hidden Treasure produced approximately 3,000 tons of copper, 14,000 tons of magnetite and 247,000 ounces of silver. Based on 2014 mine-level employment data from MSHA and 2013 wage data from the Bureau of Labor Statistics, we estimated the 2014 economic contributions of operations at the mines in greater sage-grouse range (Table 4.1). The industrial mineral mines in FWS current sage-grouse range pro-vided 291 direct jobs with an estimated $14.8 million in earnings and contributed $39.4 million in value added. This activity supported an additional 641 jobs, $20.5 million in earnings, and $45.9 mil-lion in value added. The total economic contributions of industrial mineral mining in FWS current sage-grouse range in 2014 were 932 jobs, $35.3 million in earnings, and $85.3 million in value add-ed/gross state product.
Table 4.1 Estimated Economic Contributions of Other Mining in Greater Sage-Grouse Range,
2014 (Dollar amounts in millions)
DIRECT INDIRECT & INDUCED TOTAL CONTRIBUTIONS
Range Type Jobs Earnings Value Added Jobs Earnings
Value Added Jobs Earnings
Value Added
FWS Current Range 291 $14.8 $39.4 641 $20.5 $45.9 932 $35.3 $85.3 Historical-only Range 264 $13.4 $35.8 581 $18.6 $41.6 845 $32.0 $77.4 SGMAs 258 $13.1 $35.0 568 $18.1 $40.7 826 $31.3 $75.6 Source: BEBR analysis of data from Utah Geological Survey (shapefiles) and MSHA using BEA’s RIMS II multipliers.
The metal and industrial mineral mines in historical-only sage-grouse range provided 264 direct jobs, $13.4 million in earnings, and $35.8 million in value added. Their operations supported an additional 581 jobs, $18.6 million in earnings, and $41.6 million in value added. The total economic contribu-tions of metal and industrial mineral mining in historic-only sage-grouse range in 2014 amounted to 845 jobs, $32.0 million in earnings, and $77.4 million in value added/gross state product.
24 According to Boden et al. (2014), “Together, Ash Grove Cement Co. and Holcim, Inc., produced more than one mil-lion [tons] of Portland cement in Utah during 2013” (p. 16). 25 See previous note.
4
A N A L Y S I S O F C U R R E N T A C T I V I T I E S I N G R E A T E R S A G E - G R O U S E H A B I T A T I N U T A H
38 B U R E A U O F E C O N O M I C A N D B U S I N E S S R E S E A R C H
The industrial mineral mines in SGMAs provided 258 direct jobs, $13.1 million in earnings, and $35.0 million in value added. These activities supported an additional 568 jobs, $18.1 million in earn-ings, and $40.7 million in value added. The total economic contributions of industrial mineral min-ing in SGMAs in 2014 amounted to 826 jobs, $31.3 million in earnings, and $75.6 million in value added/gross state product. In addition to the economic contributions of these mines, there are also local and state fiscal impacts (Table 4.2). These comprise estimated state income taxes and state and local sales taxes associated with the earnings discussed above, local property taxes on the mines and their facilities, and estimat-ed state severance taxes based on the value of metalliferous minerals produced from the Hidden Treasure mine (in 2013). Metal and mineral mines in historical-only sage-grouse range produced the largest total fiscal impacts, with almost $2.5 mil-lion in revenues for the state and over $1.0 mil-lion in revenues to counties. The large county revenues were due mainly to property taxes paid by the Ash Grove Leamington cement quarry and plant and the Hidden Treasure mine. Min-eral mines in FWS current sage-grouse range produced estimated fiscal impacts of $3.3 mil-lion in 2014, consisting of almost $2.5 million in state income and sales taxes and over $800,000 in local sales and property taxes. Activity at the two mines in SGMAs spurred estimated fiscal impacts of nearly $3.0 million: $2.2 million in state income and sales taxes and $778,000 in local sales and property taxes.
Table 4.2 Estimated Fiscal Impacts of Other Mining in
Greater Sage-Grouse Range, 2014
Range Type State Local Total FWS Current Range $2,495,000 $805,000 $3,300,000 Historical-only Range $2,478,000 $1,043,000 $3,521,000 SGMAs $2,212,000 $778,000 $2,990,000 Source: BEBR analysis, county treasurers of Beaver, Juab, Morgan, Sevier, Summit and Uintah counties.
B U R E A U O F E C O N O M I C A N D B U S I N E S S R E S E A R C H 39
RENEWABLE ENERGY There are currently two geothermal electrical generation plants located in greater sage-grouse range: Blundell in Beaver County is in FWS current sage-grouse range and Cove Fort in Millard County is in historical-only range (Figure 5.1). In 2014 Blundell generated 274,996 megawatt-hours (MWh) of electricity and Cove Fort generated 165,107 MWh according to data from the Energy Information Administration. There are also 44 wind turbines in FWS current range and 51 turbines in historical range. Most of the turbines in FWS current range are part of Phase 1 of the Milford Wind Corridor in Beaver County, with one at the Tooele Army Depot. Forty of the turbines in historical-only range are part of Phases 1 and 2 of the Milford Wind Corridor in Beaver and Millard counties, nine are at the Spanish Fork Wind Park, and two are are at Camp Williams. In 2014 a combined estimated 203,385 MWh of electricity were generated from turbines located in FWS current sage-grouse range and 189,878 MWh from turbines in historical-only range. (Note that this excludes generation by the three turbines on military bases, for which no data were available.) We used monthly total electricity generation from EIA and statewide employment in the electric power generation, transmission and distribution sector (NAICS 2211; from the Utah Department of Workforce Services) to calculate average jobs per MWh of generation and the average wage for the sector. We could then estimate the employment and earnings associated with electricity generated from geothermal and wind sources within greater sage-grouse range. We estimate a total of 33 direct jobs with almost $3.3 million in earnings were attributable to renewable energy production in FWS current sage-grouse range in 2014. This activity supported an additional 105 full- and part-time indi-rect and induced jobs with $3.6 million in earnings. The total economic contributions of renewable energy production in FWS current sage-grouse range comprised 138 jobs, $6.8 million in earnings, and $16.8 million in gross state product. Renewable energy production in historical sage-grouse range provided an estimated 25 direct jobs with $2.5 million in earnings. This activity supported an additional 78 jobs with $2.7 million in earnings. The total economic contributions of renewable en-ergy production in historical-only sage-grouse range comprised 103 jobs, $5.1 million in earnings, and $12.5 million in gross state product (Table 5.1).
Table 5.1 Estimated Economic Contributions of Renewable Energy Generation in
Greater Sage-Grouse Range, 2014 (Dollar amounts in millions)
DIRECT INDIRECT & INDUCED TOTAL CONTRIBUTIONS
Range Type Jobs Earnings Value-Added* Jobs Earnings
Value Added Jobs Earnings
Value Added
FWS Current Range 33 $3.3 $9.6 105 $3.6 $7.1 138 $6.8 $16.8 Historical-only Range 25 $2.5 $7.2 78 $2.7 $5.3 103 $5.1 $12.5 Source: BEBR analysis of data from the Energy Information Administration and Utah Department of Workforce Services using BEA’s RIMS II multipliers.
5
A N A L Y S I S O F C U R R E N T A C T I V I T I E S I N G R E A T E R S A G E - G R O U S E H A B I T A T I N U T A H
40 B U R E A U O F E C O N O M I C A N D B U S I N E S S R E S E A R C H
Figure 5.1 Renewable Energy Generation in Greater Sage-Grouse Range
The state and local fiscal impacts associated with renewable energy generation in sage-grouse range consist of state income taxes and state and local sales taxes generated from the earnings contributions described above, and property taxes paid to the counties where the facilities are located. For the geo-thermal plant and windmills in FWS current
Table 5.2 Estimated Fiscal Impacts of Renewable Energy
Generation in Greater Sage-Grouse Range, 2014
Range Type State Local Total FWS Current Range $456,000 $2,163,000 $2,619,000 Historical-only Range $361,000 $1,099,000 $1,460,000 Source: BEBR analysis and Beaver and Millard county treasurers.
A N A L Y S I S O F C U R R E N T A C T I V I T I E S I N G R E A T E R S A G E - G R O U S E H A B I T A T I N U T A H
B U R E A U O F E C O N O M I C A N D B U S I N E S S R E S E A R C H 41
sage-grouse range, the estimated fiscal impacts in 2014 consisted of $456,000 of state income and sales taxes and over $2.1 million in local property and sales taxes, for a total fiscal impact of approx-imately $2.6 million (Table 5.2). Geothermal and wind electricity generation in historical-only sage-grouse range in 2014 induced an estimated $361,000 in state income and sales tax revenues and near-ly $1.1 million in local property and sales tax revenues, for a total fiscal impact of almost $1.5 million.

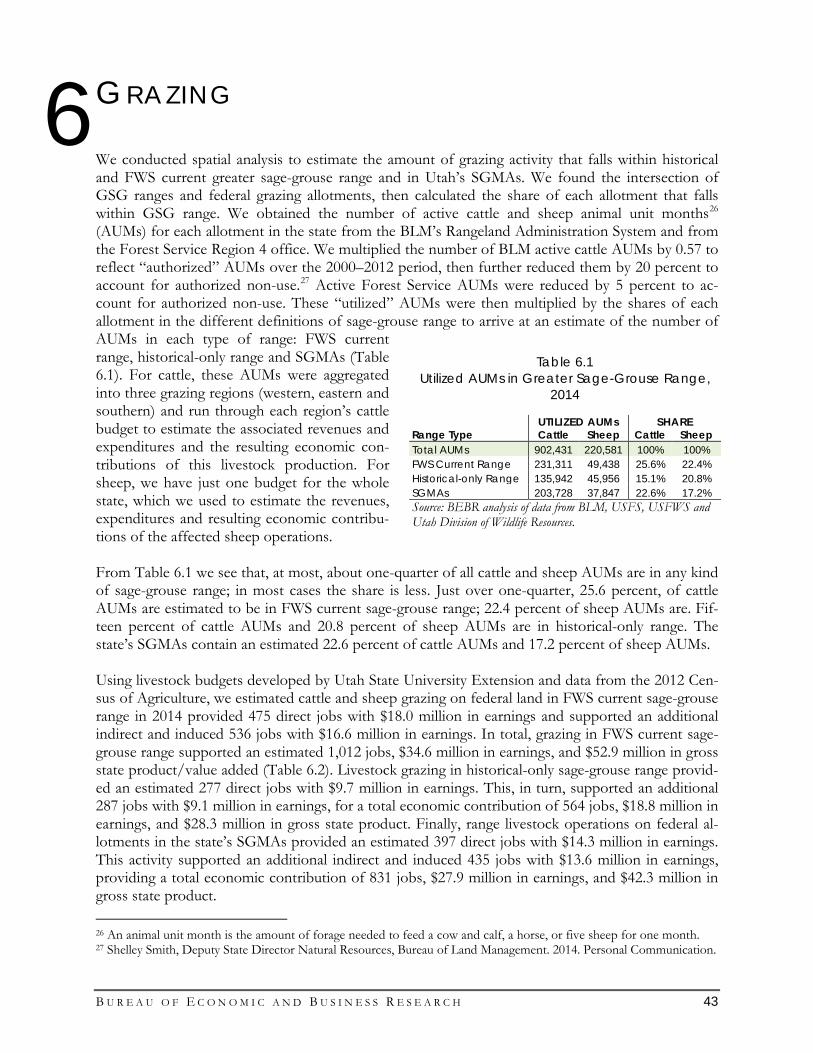
B U R E A U O F E C O N O M I C A N D B U S I N E S S R E S E A R C H 43
GRAZING We conducted spatial analysis to estimate the amount of grazing activity that falls within historical and FWS current greater sage-grouse range and in Utah’s SGMAs. We found the intersection of GSG ranges and federal grazing allotments, then calculated the share of each allotment that falls within GSG range. We obtained the number of active cattle and sheep animal unit months26 (AUMs) for each allotment in the state from the BLM’s Rangeland Administration System and from the Forest Service Region 4 office. We multiplied the number of BLM active cattle AUMs by 0.57 to reflect “authorized” AUMs over the 2000–2012 period, then further reduced them by 20 percent to account for authorized non-use.27 Active Forest Service AUMs were reduced by 5 percent to ac-count for authorized non-use. These “utilized” AUMs were then multiplied by the shares of each allotment in the different definitions of sage-grouse range to arrive at an estimate of the number of AUMs in each type of range: FWS current range, historical-only range and SGMAs (Table 6.1). For cattle, these AUMs were aggregated into three grazing regions (western, eastern and southern) and run through each region’s cattle budget to estimate the associated revenues and expenditures and the resulting economic con-tributions of this livestock production. For sheep, we have just one budget for the whole state, which we used to estimate the revenues, expenditures and resulting economic contribu-tions of the affected sheep operations. From Table 6.1 we see that, at most, about one-quarter of all cattle and sheep AUMs are in any kind of sage-grouse range; in most cases the share is less. Just over one-quarter, 25.6 percent, of cattle AUMs are estimated to be in FWS current sage-grouse range; 22.4 percent of sheep AUMs are. Fif-teen percent of cattle AUMs and 20.8 percent of sheep AUMs are in historical-only range. The state’s SGMAs contain an estimated 22.6 percent of cattle AUMs and 17.2 percent of sheep AUMs. Using livestock budgets developed by Utah State University Extension and data from the 2012 Cen-sus of Agriculture, we estimated cattle and sheep grazing on federal land in FWS current sage-grouse range in 2014 provided 475 direct jobs with $18.0 million in earnings and supported an additional indirect and induced 536 jobs with $16.6 million in earnings. In total, grazing in FWS current sage-grouse range supported an estimated 1,012 jobs, $34.6 million in earnings, and $52.9 million in gross state product/value added (Table 6.2). Livestock grazing in historical-only sage-grouse range provid-ed an estimated 277 direct jobs with $9.7 million in earnings. This, in turn, supported an additional 287 jobs with $9.1 million in earnings, for a total economic contribution of 564 jobs, $18.8 million in earnings, and $28.3 million in gross state product. Finally, range livestock operations on federal al-lotments in the state’s SGMAs provided an estimated 397 direct jobs with $14.3 million in earnings. This activity supported an additional indirect and induced 435 jobs with $13.6 million in earnings, providing a total economic contribution of 831 jobs, $27.9 million in earnings, and $42.3 million in gross state product. 26 An animal unit month is the amount of forage needed to feed a cow and calf, a horse, or five sheep for one month. 27 Shelley Smith, Deputy State Director Natural Resources, Bureau of Land Management. 2014. Personal Communication.
6
Table 6.1 Utilized AUMs in Greater Sage-Grouse Range,
2014
UTILIZED AUMs SHARE
Range Type Cattle Sheep Cattle Sheep Total AUMs 902,431 220,581 100% 100% FWS Current Range 231,311 49,438 25.6% 22.4% Historical-only Range 135,942 45,956 15.1% 20.8% SGMAs 203,728 37,847 22.6% 17.2% Source: BEBR analysis of data from BLM, USFS, USFWS and Utah Division of Wildlife Resources.
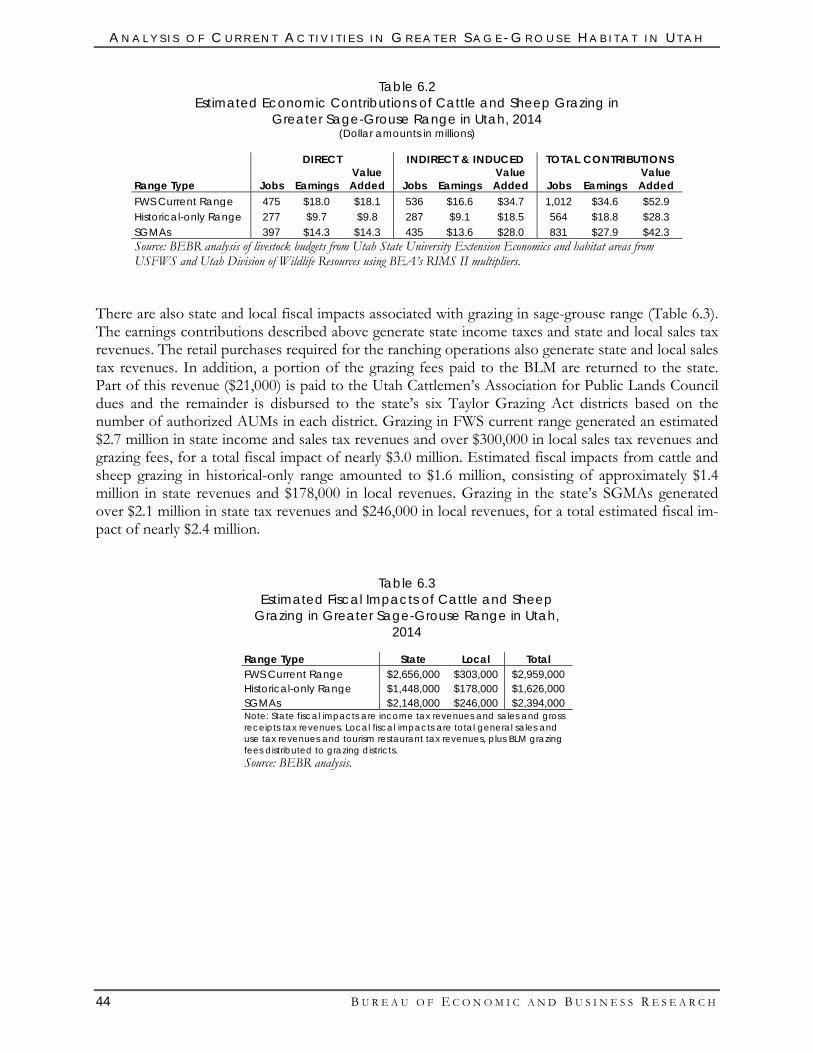
A N A L Y S I S O F C U R R E N T A C T I V I T I E S I N G R E A T E R S A G E - G R O U S E H A B I T A T I N U T A H
44 B U R E A U O F E C O N O M I C A N D B U S I N E S S R E S E A R C H
Table 6.2 Estimated Economic Contributions of Cattle and Sheep Grazing in
Greater Sage-Grouse Range in Utah, 2014 (Dollar amounts in millions)
DIRECT INDIRECT & INDUCED TOTAL CONTRIBUTIONS
Range Type Jobs Earnings Value Added Jobs Earnings
Value Added Jobs Earnings
Value Added
FWS Current Range 475 $18.0 $18.1 536 $16.6 $34.7 1,012 $34.6 $52.9 Historical-only Range 277 $9.7 $9.8 287 $9.1 $18.5 564 $18.8 $28.3 SGMAs 397 $14.3 $14.3 435 $13.6 $28.0 831 $27.9 $42.3 Source: BEBR analysis of livestock budgets from Utah State University Extension Economics and habitat areas from USFWS and Utah Division of Wildlife Resources using BEA’s RIMS II multipliers.
There are also state and local fiscal impacts associated with grazing in sage-grouse range (Table 6.3). The earnings contributions described above generate state income taxes and state and local sales tax revenues. The retail purchases required for the ranching operations also generate state and local sales tax revenues. In addition, a portion of the grazing fees paid to the BLM are returned to the state. Part of this revenue ($21,000) is paid to the Utah Cattlemen’s Association for Public Lands Council dues and the remainder is disbursed to the state’s six Taylor Grazing Act districts based on the number of authorized AUMs in each district. Grazing in FWS current range generated an estimated $2.7 million in state income and sales tax revenues and over $300,000 in local sales tax revenues and grazing fees, for a total fiscal impact of nearly $3.0 million. Estimated fiscal impacts from cattle and sheep grazing in historical-only range amounted to $1.6 million, consisting of approximately $1.4 million in state revenues and $178,000 in local revenues. Grazing in the state’s SGMAs generated over $2.1 million in state tax revenues and $246,000 in local revenues, for a total estimated fiscal im-pact of nearly $2.4 million.
Table 6.3 Estimated Fiscal Impacts of Cattle and Sheep
Grazing in Greater Sage-Grouse Range in Utah, 2014
Range Type State Local Total FWS Current Range $2,656,000 $303,000 $2,959,000 Historical-only Range $1,448,000 $178,000 $1,626,000 SGMAs $2,148,000 $246,000 $2,394,000 Note: State fiscal impacts are income tax revenues and sales and gross receipts tax revenues. Local fiscal impacts are total general sales and use tax revenues and tourism restaurant tax revenues, plus BLM grazing fees distributed to grazing districts. Source: BEBR analysis.
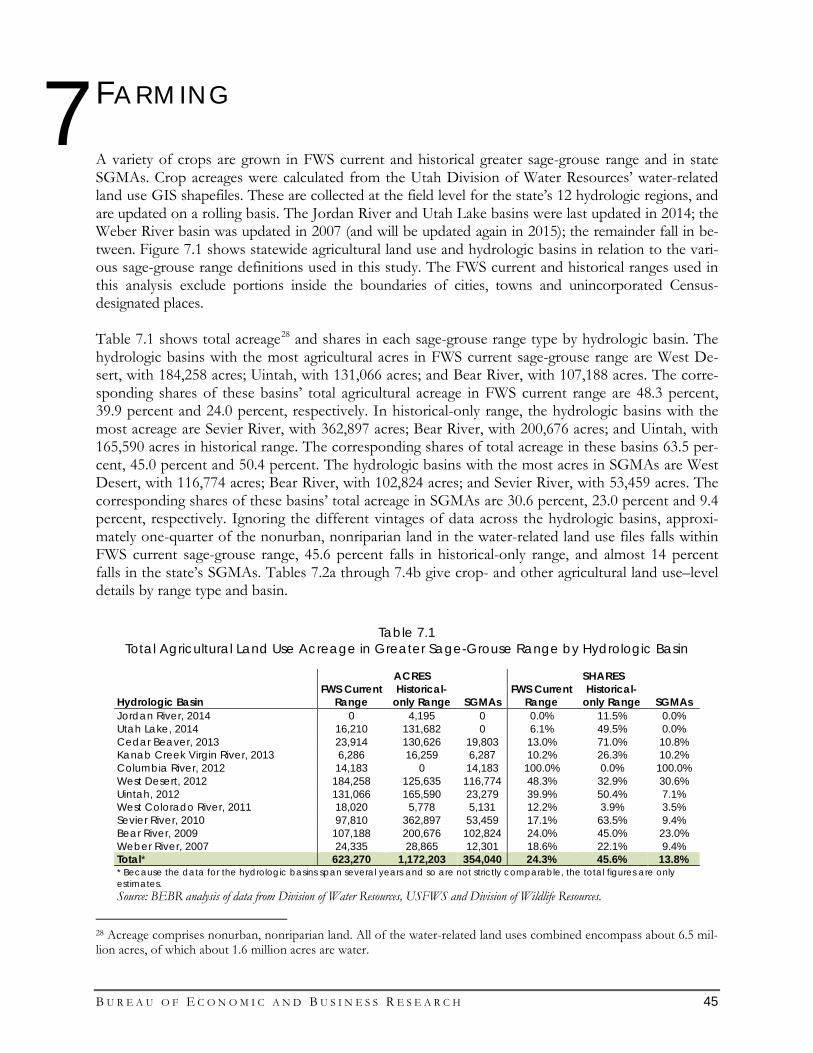
B U R E A U O F E C O N O M I C A N D B U S I N E S S R E S E A R C H 45
FARMING A variety of crops are grown in FWS current and historical greater sage-grouse range and in state SGMAs. Crop acreages were calculated from the Utah Division of Water Resources’ water-related land use GIS shapefiles. These are collected at the field level for the state’s 12 hydrologic regions, and are updated on a rolling basis. The Jordan River and Utah Lake basins were last updated in 2014; the Weber River basin was updated in 2007 (and will be updated again in 2015); the remainder fall in be-tween. Figure 7.1 shows statewide agricultural land use and hydrologic basins in relation to the vari-ous sage-grouse range definitions used in this study. The FWS current and historical ranges used in this analysis exclude portions inside the boundaries of cities, towns and unincorporated Census-designated places. Table 7.1 shows total acreage28 and shares in each sage-grouse range type by hydrologic basin. The hydrologic basins with the most agricultural acres in FWS current sage-grouse range are West De-sert, with 184,258 acres; Uintah, with 131,066 acres; and Bear River, with 107,188 acres. The corre-sponding shares of these basins’ total agricultural acreage in FWS current range are 48.3 percent, 39.9 percent and 24.0 percent, respectively. In historical-only range, the hydrologic basins with the most acreage are Sevier River, with 362,897 acres; Bear River, with 200,676 acres; and Uintah, with 165,590 acres in historical range. The corresponding shares of total acreage in these basins 63.5 per-cent, 45.0 percent and 50.4 percent. The hydrologic basins with the most acres in SGMAs are West Desert, with 116,774 acres; Bear River, with 102,824 acres; and Sevier River, with 53,459 acres. The corresponding shares of these basins’ total acreage in SGMAs are 30.6 percent, 23.0 percent and 9.4 percent, respectively. Ignoring the different vintages of data across the hydrologic basins, approxi-mately one-quarter of the nonurban, nonriparian land in the water-related land use files falls within FWS current sage-grouse range, 45.6 percent falls in historical-only range, and almost 14 percent falls in the state’s SGMAs. Tables 7.2a through 7.4b give crop- and other agricultural land use–level details by range type and basin.
Table 7.1 Total Agricultural Land Use Acreage in Greater Sage-Grouse Range by Hydrologic Basin
ACRES SHARES
Hydrologic Basin FWS Current
Range Historical-
only Range SGMAs FWS Current
Range Historical-
only Range SGMAs Jordan River, 2014 0 4,195 0 0.0% 11.5% 0.0% Utah Lake, 2014 16,210 131,682 0 6.1% 49.5% 0.0% Cedar Beaver, 2013 23,914 130,626 19,803 13.0% 71.0% 10.8% Kanab Creek Virgin River, 2013 6,286 16,259 6,287 10.2% 26.3% 10.2% Columbia River, 2012 14,183 0 14,183 100.0% 0.0% 100.0% West Desert, 2012 184,258 125,635 116,774 48.3% 32.9% 30.6% Uintah, 2012 131,066 165,590 23,279 39.9% 50.4% 7.1% West Colorado River, 2011 18,020 5,778 5,131 12.2% 3.9% 3.5% Sevier River, 2010 97,810 362,897 53,459 17.1% 63.5% 9.4% Bear River, 2009 107,188 200,676 102,824 24.0% 45.0% 23.0% Weber River, 2007 24,335 28,865 12,301 18.6% 22.1% 9.4% Total* 623,270 1,172,203 354,040 24.3% 45.6% 13.8% * Because the data for the hydrologic basins span several years and so are not strictly comparable, the total figures are only estimates. Source: BEBR analysis of data from Division of Water Resources, USFWS and Division of Wildlife Resources.
28 Acreage comprises nonurban, nonriparian land. All of the water-related land uses combined encompass about 6.5 mil-lion acres, of which about 1.6 million acres are water.
7
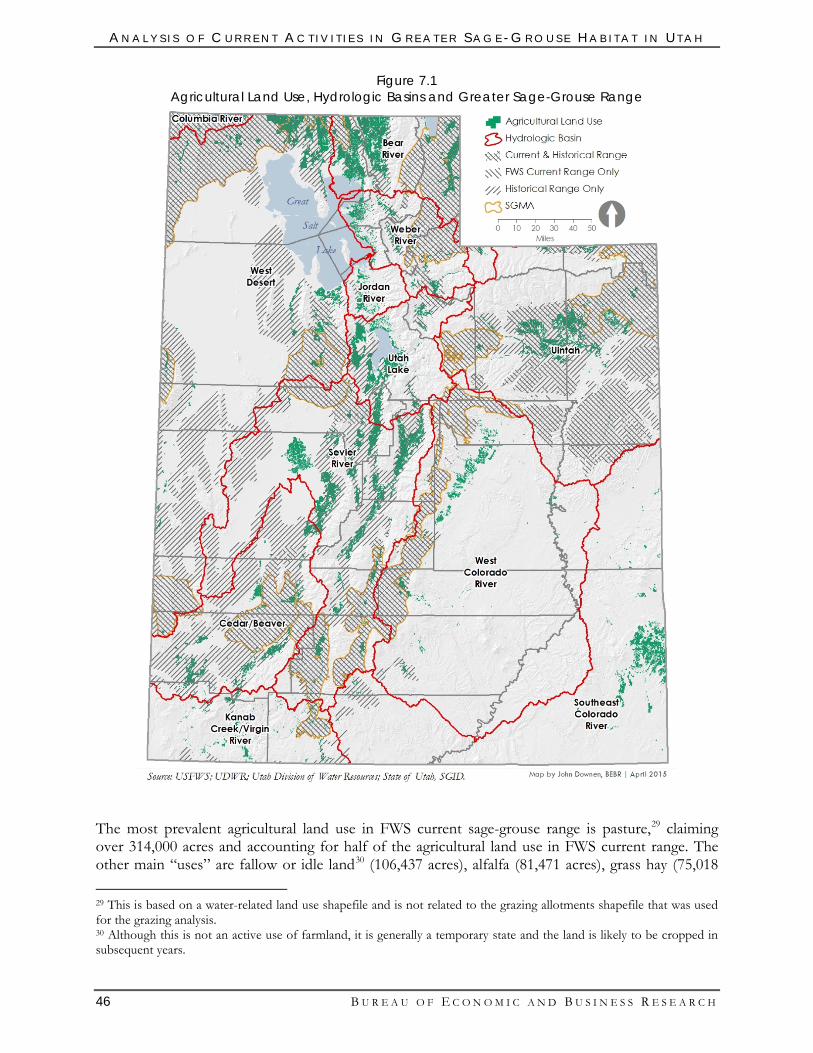
A N A L Y S I S O F C U R R E N T A C T I V I T I E S I N G R E A T E R S A G E - G R O U S E H A B I T A T I N U T A H
46 B U R E A U O F E C O N O M I C A N D B U S I N E S S R E S E A R C H
Figure 7.1 Agricultural Land Use, Hydrologic Basins and Greater Sage-Grouse Range
The most prevalent agricultural land use in FWS current sage-grouse range is pasture,29 claiming over 314,000 acres and accounting for half of the agricultural land use in FWS current range. The other main “uses” are fallow or idle land30 (106,437 acres), alfalfa (81,471 acres), grass hay (75,018 29 This is based on a water-related land use shapefile and is not related to the grazing allotments shapefile that was used for the grazing analysis. 30 Although this is not an active use of farmland, it is generally a temporary state and the land is likely to be cropped in subsequent years.
A N A L Y S I S O F C U R R E N T A C T I V I T I E S I N G R E A T E R S A G E - G R O U S E H A B I T A T I N U T A H
B U R E A U O F E C O N O M I C A N D B U S I N E S S R E S E A R C H 47
acres) and grain and seeds (28,105 acres) (Table 7.2a). Together, these five represent 97 percent of the total agricultural acres in FWS current range. With respect to the total acreage of agricultural land uses in the state, those uses with the greatest share in FWS current sage-grouse range are grass hay (52.1 percent), pasture (32.1 percent), fallow or idle land (22.1 percent), safflower (20.8 percent) and oats (17.9 percent) (Table 7.2b). Roughly one-quarter, 24.3 percent, of the state’s agricultural land is in FWS current range.
Table 7.2a Agricultural Land Use Acreage in FWS Current Greater Sage-Grouse Range by Hydrologic Basin
Land Use
Utah Lake, 2014
Cedar Beaver,
2013
Kanab Creek Virgin River, 2013
Columbia River, 2012
West Desert, 2012
Uintah, 2012
West Colorado
River, 2011
Sevier River, 2010
Bear River, 2009
Weber River, 2007 Total*
Alfalfa 1,589 9,996 265 751 21,326 19,528 6,886 11,071 5,988 4,070 81,471 Corn
787
790 1,501
170
45 3,294
Dry Land 7,645 7,645 Fallow/Idle 1,754 3,627 749 4,283 44,311 28,975 4,866 6,193 9,048 2,631 106,437 Grain/Seeds 152 728 109 179 17,001 722 688 3,982 3,163 1,380 28,105 Grass Hay 1,137 1,257 23 2,519 4,115 14,470 214 8,105 39,019 4,159 75,018 Melon/Pumpkin/Squash
4
2
6
Oats 51 256
412 421 447 1,073
2,660 Orchard
24 8 246
13 291
Other Horticulture 2
5 2 5
12 14
39 Other Vegetables 2
5 1
9
Pasture 3,865 7,127 5,130 6,443 92,881 65,316 4,906 66,934 49,648 12,035 314,286 Potatoes 2
8
3 24
37
Safflower
11
2,968
16 284
3,279 Sorghum 11 136
94
240
Turf Farms
452
452 Vineyard
0.4
0.4
Total 16,210 23,914 6,286 14,183 184,258 131,066 18,020 97,810 107,188 24,335 623,270 * Because the data for the hydrologic basins span several years and so are not strictly comparable, the figures in the Total column are only estimates. Source: BEBR analysis of data from Division of Water Resources and US Fish and Wildlife Service.
Table 7.2b
Share of Agricultural Land Use Acreage in FWS Current Greater Sage-Grouse Range by Hydrologic Basin
Land Use
Utah Lake, 2014
Cedar Beaver,
2013
Kanab Creek Virgin River, 2013
Columbia River, 2012
West Desert, 2012
Uintah, 2012
West Colorado River, 2011
Sevier River, 2010
Bear River, 2009
Weber River, 2007 Total*
Alfalfa 3.9% 15.1% 5.7% 100.0% 61.1% 30.7% 16.4% 8.2% 6.2% 14.4% 15.8% Corn 9.9% 33.9% 20.1% 0.9% 0.6% 4.1% Dry Land 7.3% 6.0% Fallow/Idle 8.4% 7.4% 7.5% 100.0% 42.8% 38.0% 10.5% 6.5% 16.7% 13.8% 22.1% Grain/Seeds 0.7% 8.2% 12.7% 100.0% 39.8% 31.8% 26.3% 11.7% 4.7% 20.9% 14.7% Grass Hay 13.3% 39.7% 1.4% 100.0% 73.6% 51.0% 3.1% 39.6% 71.6% 34.9% 52.1% Melon/Pumpkin/Squash 100.0% 1.2% 0.7% Oats 2.7% 10.4% 0.0% 17.1% 36.8% 25.9% 22.0% 17.9% Orchard 51.4% 5.9% 89.6% 2.6% 3.7% Other Horticulture 0.3% 100.0% 8.9% 17.5% 17.2% 4.0% 2.9% Other Vegetables 1.7% 35.4% 7.3% 0.6% Pasture 7.7% 15.8% 11.9% 100.0% 50.8% 43.9% 11.2% 25.7% 35.8% 21.7% 32.1% Potatoes 6.6% 57.9% 3.8% 8.0% 6.2% Safflower 100.0% 43.8% 20.4% 3.3% 20.8% Sorghum 53.4% 62.4% 14.9% 6.6% Turf Farms 83.3% 11.8% Vineyard 100.0% 1.5% Total 6.1% 13.0% 10.2% 100.0% 48.3% 39.9% 12.2% 17.1% 24.0% 18.6% 24.3% * Because the data for the hydrologic basins span several years and so are not strictly comparable, the figures in the Total column are only estimates. Source: BEBR analysis of data from Division of Water Resources and US Fish and Wildlife Service.
A N A L Y S I S O F C U R R E N T A C T I V I T I E S I N G R E A T E R S A G E - G R O U S E H A B I T A T I N U T A H
48 B U R E A U O F E C O N O M I C A N D B U S I N E S S R E S E A R C H
In historical-only sage-grouse range the most prevalent agricultural land use is pasture, accounting for an estimated 414,232 acres, or 35 percent of the total agricultural acres in this range type. The other main uses are alfalfa (251,442 acres), fallow or idle land (226,419 acres), grain and seeds (102,677 acres) and dry land (66,553 acres) (Table 7.3a). These five land uses account for 90 percent of the total agricultural acres in historical-only sage-grouse range. The land uses with the greatest shares of their total acreage in historical-only range include berries (78.8 percent), beans (75.4 per-cent), safflower (64.1 percent), other horticulture (57.8 percent) and oats (56.6 percent) (Table 7.3b). Because it covers the most acres of agricultural land use, close to 1.2 million, historical-only sage-grouse range also encompasses the largest shares of agricultural uses’ total areas: 10 of the 20 distinct land uses have more than half of their total acreage within historical-only range and almost 46 per-cent of all agricultural land is in historical-only range.
Table 7.3a Agricultural Land Use Acreage in Historical-only Greater Sage-Grouse Range by Hydrologic Basin
Land Use
Jordan River, 2014
Utah Lake, 2014
Cedar Beaver,
2013
Kanab Creek Virgin River,
2013
West Desert, 2012
Uintah, 2012
West Colorado River, 2011
Sevier River, 2010
Bear River, 2009
Weber River, 2007 Total*
Alfalfa 107 18,096 46,635 882 3,934 36,612 1,260 83,831 51,529 8,555 251,442 Beans 111 20 117 247 Berries 2 77 15 94 Corn 22 6,138 5,582 390 604 5,220 12,061 10,067 1,949 42,032 Dry Land 2,022 64,532 66,553 Fallow/Idle 130 8,742 34,772 2,756 39,394 37,961 2,551 63,342 31,880 4,891 226,419 Grain/Seeds 1,839 10,516 7,322 220 18,832 1,047 42 20,860 39,758 2,241 102,677 Grass Hay 40 3,007 1,566 277 106 12,337 1,106 10,690 8,724 2,576 40,428 Melon/Pumpkin/Squash 11 1 90 101 Oats 1,243 1,850 37 1,712 627 19 2,895 8,384 Onions 19 835 44 898 Orchard 2,904 21 28 23 9 11 19 61 3,077 Other Horticulture 481 6 24 19 109 129 769 Other Vegetables 40 9 305 6 266 73 699 Pasture 34 15,878 32,408 11,594 57,332 70,891 791 167,385 49,782 8,138 414,232 Potatoes 18 130 2 52 202 Safflower 70 3,698 63 6,282 0 10,113 Sorghum 19 34 16 520 850 501 65 2,006 Tomatoes 3 3 Turf Farms 0 311 42 21 612 828 12 1,826 Total 4,195 131,682 130,626 16,259 125,635 165,590 5,778 362,897 200,676 28,865 1,172,203 * Because the data for the hydrologic basins span several years and so are not strictly comparable, the figures in the Total column are only estimates. Source: BEBR analysis of data from Division of Water Resources and US Fish and Wildlife Service.
A N A L Y S I S O F C U R R E N T A C T I V I T I E S I N G R E A T E R S A G E - G R O U S E H A B I T A T I N U T A H
B U R E A U O F E C O N O M I C A N D B U S I N E S S R E S E A R C H 49
Table 7.3b Share of Agricultural Land Use Acreage in Historical-only Greater Sage-Grouse Range by Hydrologic Basin
Land Use
Jordan River, 2014
Utah Lake, 2014
Cedar Beaver,
2013
Kanab Creek Virgin River,
2013
West Desert, 2012
Uintah, 2012
West Colorado
River, 2011
Sevier River, 2010
Bear River, 2009
Weber River, 2007 Total*
Alfalfa 4.3% 44.6% 70.2% 18.8% 11.3% 57.6% 3.0% 62.4% 53.5% 30.2% 48.9% Beans 93.4% 68.6% 78.7% 75.4% Berries 9.7% 97.9% 95.9% 78.8% Corn 9.6% 55.7% 70.5% 90.3% 25.9% 70.0% 64.4% 47.9% 27.9% 52.5% Dry Land 9.0% 61.9% 52.5% Fallow/Idle 8.6% 41.7% 70.7% 27.5% 38.1% 49.8% 5.5% 66.3% 58.8% 25.6% 47.1% Grain/Seeds 35.8% 50.8% 82.9% 25.5% 44.0% 46.1% 1.6% 61.3% 58.8% 34.0% 53.6% Grass Hay 15.3% 35.1% 49.5% 16.9% 1.9% 43.5% 16.1% 52.2% 16.0% 21.6% 28.1% Melon/Pumpkin/Squash 3.4% 100.0% 73.4% 13.6% Oats 64.6% 75.3% 14.4% 71.1% 54.9% 1.1% 59.3% 56.6% Onions 100.0% 73.8% 7.3% 51.2% Orchard 52.2% 85.5% 5.5% 48.6% 7.0% 4.2% 2.6% 11.9% 39.2% Other Horticulture 83.5% 32.9% 82.5% 27.7% 32.3% 51.9% 57.8% Other Vegetables 27.7% 65.3% 99.0% 32.3% 39.6% 19.6% 41.5% Pasture 0.8% 31.6% 71.7% 27.0% 31.3% 47.7% 1.8% 64.2% 35.9% 14.7% 42.3% Potatoes 72.0% 100.0% 14.6% 65.0% 33.9% Safflower 31.5% 54.6% 79.6% 72.5% 64.1% Sorghum 8.7% 12.9% 100.0% 82.5% 82.3% 57.7% 53.6% 55.4% Tomatoes 3.5% 3.0% Turf Farms 0.0% 100.0% 20.4% 100.0% 100.0% 95.2% 4.9% 47.6% Total 11.5% 49.5% 71.0% 26.3% 32.9% 50.4% 3.9% 63.5% 45.0% 22.1% 45.6% * Because the data for the hydrologic basins span several years and so are not strictly comparable, the figures in the Total column are only estimates. Source: BEBR analysis of data from Division of Water Resources and US Fish and Wildlife Service.
At 354,000 acres, the state’s SGMAs contain the least amount of agricultural land of the three sage-grouse range types analyzed. The largest agricultural land uses in SGMAs are pasture, with 178,754 acres; grass hay, with 52,898 acres; fallow or idle land, with 51,496 acres; alfalfa, with 45,715 acres; and grain and seeds, with 18,720 acres (Table 7.4a). Together, these five categories account for 98 percent of the agricultural land uses in SGMAs, with pasture alone representing half. The land uses with the greatest shares of their total acreage in SGMAs include grass hay (36.8 percent), safflower (19.9 percent), pasture (18.3 percent), turf farms (11.8 percent) and fallow/idle land and oats (both with 10.7 percent) (Table 7.4b). Just 14 percent of the state’s agricultural land is in SGMAs.
A N A L Y S I S O F C U R R E N T A C T I V I T I E S I N G R E A T E R S A G E - G R O U S E H A B I T A T I N U T A H
50 B U R E A U O F E C O N O M I C A N D B U S I N E S S R E S E A R C H
Table 7.4a Agricultural Land Use Acreage in SGMAs by Hydrologic Basin
Land Use
Cedar Beaver,
2013
Kanab Creek Virgin River,
2013
Columbia River, 2012
West Desert, 2012
Uintah, 2012
West Colorado
River, 2011
Sevier River, 2010
Bear River, 2009
Weber River, 2007 Total
Alfalfa 7,533 265 751 18,249 4,911 114 6,117 5,645 2,131 45,715 Corn 446 605 24 1,075 Fallow/Idle 2,681 749 4,283 24,394 3,152 3,150 2,811 8,982 1,295 51,496 Grain/Seeds 570 109 179 12,714 395 18 538 3,175 1,022 18,720 Grass Hay 1,257 23 2,519 4,020 449 1 4,135 37,865 2,630 52,898 Melon/Pumpkin/Squash 4 2 6 Oats 256 272 63 1,002 1,593 Orchard 15 15 Other Horticulture 5 2 1 14 21 Other Vegetables 1 1 Pasture 6,925 5,130 6,443 53,228 14,268 1,848 38,853 46,836 5,223 178,754 Potatoes 1 24 25 Safflower 11 2,838 284 3,133 Sorghum 136 136 Turf Farms 452 452 Vineyard 0.4 0.4 Total 19,803 6,287 14,183 116,774 23,279 5,131 53,459 102,824 12,301 354,040 * Because the data for the hydrologic basins span several years and so are not strictly comparable, the figures in the Total column are only estimates. Source: BEBR analysis of data from Division of Water Resources and US Fish and Wildlife Service.
Table 7.4b Share of Agricultural Land Use Acreage in SGMAs by Hydrologic Basin
Land Use
Cedar Beaver,
2013
Kanab Creek Virgin River,
2013
Columbia River, 2012
West Desert, 2012
Uintah, 2012
West Colorado
River, 2011
Sevier River, 2010
Bear River, 2009
Weber River, 2007 Total*
Alfalfa 11.3% 5.7% 100.0% 52.3% 7.7% 0.3% 4.6% 5.9% 7.5% 8.9% Corn 5.6% 25.9% 0.3% 1.3% Fallow/Idle 5.4% 7.5% 100.0% 23.6% 4.1% 6.8% 2.9% 16.6% 6.8% 10.7% Grain/Seeds 6.5% 12.7% 100.0% 29.7% 17.4% 0.7% 1.6% 4.7% 15.5% 9.8% Grass Hay 39.7% 1.4% 100.0% 71.9% 1.6% 0.01% 20.2% 69.5% 22.1% 36.8% Melon/Pumpkin/Squash 100.0% 1.2% 0.7% Oats 10.4% 11.3% 5.5% 20.5% 10.7% Orchard 32.4% 0.2% Other Horticulture 100.0% 8.9% 3.9% 4.0% 1.6% Other Vegetables 3.9% 0.04% Pasture 15.3% 11.9% 100.0% 29.1% 9.6% 4.2% 14.9% 33.8% 9.4% 18.3% Potatoes 7.0% 8.0% 4.1% Safflower 100.0% 41.9% 3.3% 19.9% Sorghum 62.4% 3.8% Turf Farms 83.3% 11.8% Vineyard 100.0% 1.5% Total 10.8% 10.2% 100.0% 30.6% 7.1% 3.5% 9.4% 23.0% 9.4% 13.8% * Because the data for the hydrologic basins span several years and so are not strictly comparable, the figures in the Total column are only estimates. Source: BEBR analysis of data from Division of Water Resources and US Fish and Wildlife Service.
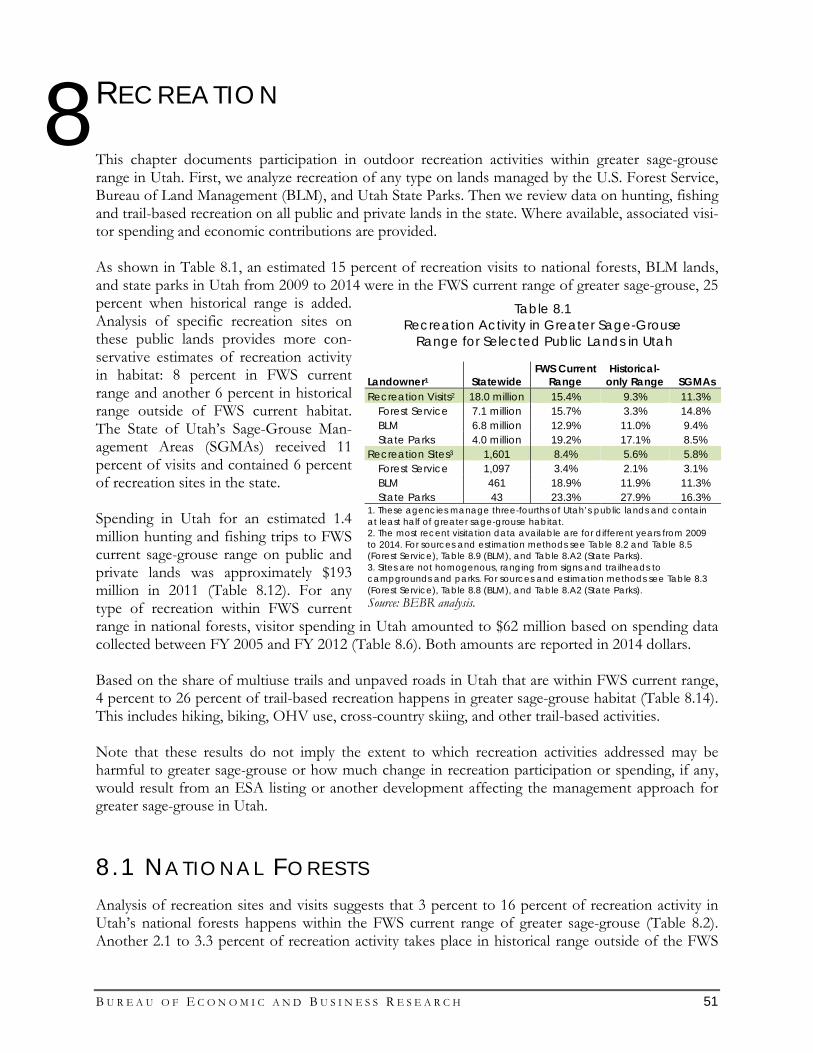
B U R E A U O F E C O N O M I C A N D B U S I N E S S R E S E A R C H 51
RECREATION This chapter documents participation in outdoor recreation activities within greater sage-grouse range in Utah. First, we analyze recreation of any type on lands managed by the U.S. Forest Service, Bureau of Land Management (BLM), and Utah State Parks. Then we review data on hunting, fishing and trail-based recreation on all public and private lands in the state. Where available, associated visi-tor spending and economic contributions are provided. As shown in Table 8.1, an estimated 15 percent of recreation visits to national forests, BLM lands, and state parks in Utah from 2009 to 2014 were in the FWS current range of greater sage-grouse, 25 percent when historical range is added. Analysis of specific recreation sites on these public lands provides more con-servative estimates of recreation activity in habitat: 8 percent in FWS current range and another 6 percent in historical range outside of FWS current habitat. The State of Utah’s Sage-Grouse Man-agement Areas (SGMAs) received 11 percent of visits and contained 6 percent of recreation sites in the state. Spending in Utah for an estimated 1.4 million hunting and fishing trips to FWS current sage-grouse range on public and private lands was approximately $193 million in 2011 (Table 8.12). For any type of recreation within FWS current range in national forests, visitor spending in Utah amounted to $62 million based on spending data collected between FY 2005 and FY 2012 (Table 8.6). Both amounts are reported in 2014 dollars. Based on the share of multiuse trails and unpaved roads in Utah that are within FWS current range, 4 percent to 26 percent of trail-based recreation happens in greater sage-grouse habitat (Table 8.14). This includes hiking, biking, OHV use, cross-country skiing, and other trail-based activities. Note that these results do not imply the extent to which recreation activities addressed may be harmful to greater sage-grouse or how much change in recreation participation or spending, if any, would result from an ESA listing or another development affecting the management approach for greater sage-grouse in Utah.
8.1 NA T I ONAL FO RE STS Analysis of recreation sites and visits suggests that 3 percent to 16 percent of recreation activity in Utah’s national forests happens within the FWS current range of greater sage-grouse (Table 8.2). Another 2.1 to 3.3 percent of recreation activity takes place in historical range outside of the FWS
8
Table 8.1 Recreation Activity in Greater Sage-Grouse
Range for Selected Public Lands in Utah
Landowner1 Statewide FWS Current
Range Historical-
only Range SGMAs Recreation Visits2 18.0 million 15.4% 9.3% 11.3%
Forest Service 7.1 million 15.7% 3.3% 14.8% BLM 6.8 million 12.9% 11.0% 9.4% State Parks 4.0 million 19.2% 17.1% 8.5%
Recreation Sites3 1,601 8.4% 5.6% 5.8% Forest Service 1,097 3.4% 2.1% 3.1% BLM 461 18.9% 11.9% 11.3% State Parks 43 23.3% 27.9% 16.3%
1. These agencies manage three-fourths of Utah’s public lands and contain at least half of greater sage-grouse habitat. 2. The most recent visitation data available are for different years from 2009 to 2014. For sources and estimation methods see Table 8.2 and Table 8.5 (Forest Service), Table 8.9 (BLM), and Table 8.A2 (State Parks). 3. Sites are not homogenous, ranging from signs and trailheads to campgrounds and parks. For sources and estimation methods see Table 8.3 (Forest Service), Table 8.8 (BLM), and Table 8.A2 (State Parks). Source: BEBR analysis.
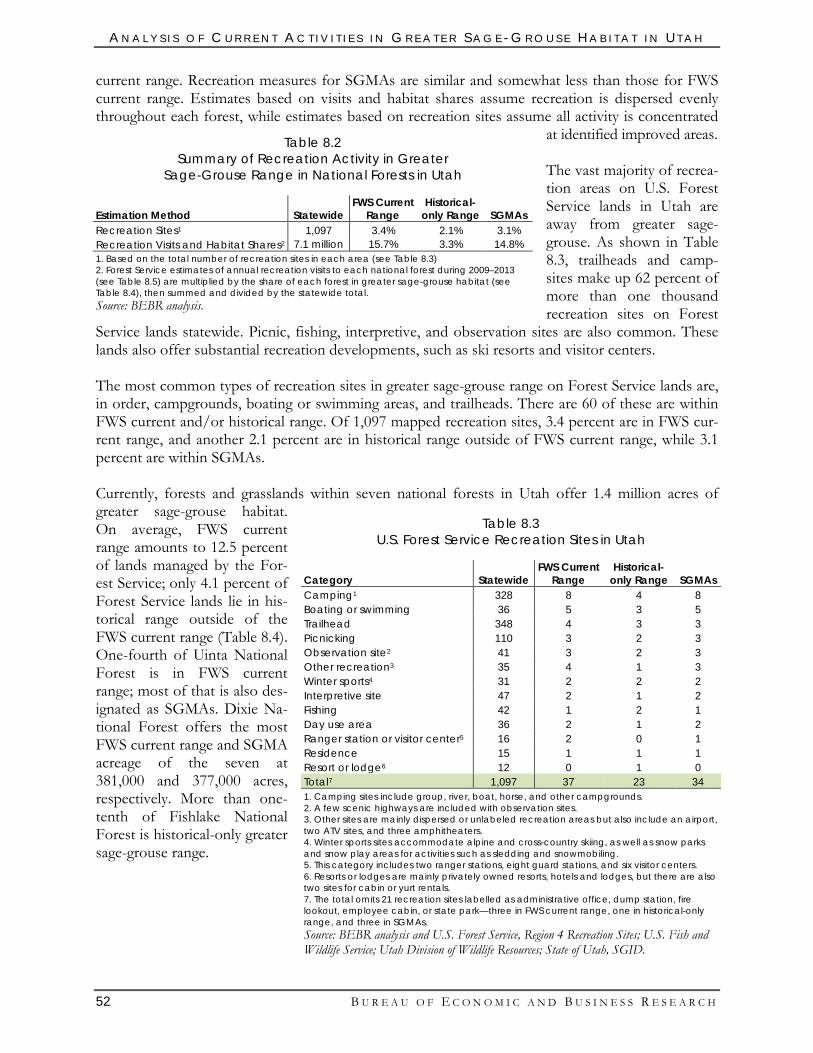
A N A L Y S I S O F C U R R E N T A C T I V I T I E S I N G R E A T E R S A G E - G R O U S E H A B I T A T I N U T A H
52 B U R E A U O F E C O N O M I C A N D B U S I N E S S R E S E A R C H
current range. Recreation measures for SGMAs are similar and somewhat less than those for FWS current range. Estimates based on visits and habitat shares assume recreation is dispersed evenly throughout each forest, while estimates based on recreation sites assume all activity is concentrated
at identified improved areas. The vast majority of recrea-tion areas on U.S. Forest Service lands in Utah are away from greater sage-grouse. As shown in Table 8.3, trailheads and camp-sites make up 62 percent of more than one thousand recreation sites on Forest
Service lands statewide. Picnic, fishing, interpretive, and observation sites are also common. These lands also offer substantial recreation developments, such as ski resorts and visitor centers. The most common types of recreation sites in greater sage-grouse range on Forest Service lands are, in order, campgrounds, boating or swimming areas, and trailheads. There are 60 of these are within FWS current and/or historical range. Of 1,097 mapped recreation sites, 3.4 percent are in FWS cur-rent range, and another 2.1 percent are in historical range outside of FWS current range, while 3.1 percent are within SGMAs. Currently, forests and grasslands within seven national forests in Utah offer 1.4 million acres of greater sage-grouse habitat. On average, FWS current range amounts to 12.5 percent of lands managed by the For-est Service; only 4.1 percent of Forest Service lands lie in his-torical range outside of the FWS current range (Table 8.4). One-fourth of Uinta National Forest is in FWS current range; most of that is also des-ignated as SGMAs. Dixie Na-tional Forest offers the most FWS current range and SGMA acreage of the seven at 381,000 and 377,000 acres, respectively. More than one-tenth of Fishlake National Forest is historical-only greater sage-grouse range.
Table 8.2 Summary of Recreation Activity in Greater
Sage-Grouse Range in National Forests in Utah
Estimation Method Statewide FWS Current
Range Historical-
only Range SGMAs Recreation Sites1 1,097 3.4% 2.1% 3.1% Recreation Visits and Habitat Shares2 7.1 million 15.7% 3.3% 14.8% 1. Based on the total number of recreation sites in each area (see Table 8.3) 2. Forest Service estimates of annual recreation visits to each national forest during 2009–2013 (see Table 8.5) are multiplied by the share of each forest in greater sage-grouse habitat (see Table 8.4), then summed and divided by the statewide total. Source: BEBR analysis.
Table 8.3 U.S. Forest Service Recreation Sites in Utah
Category Statewide FWS Current
Range Historical-
only Range SGMAs Camping1 328 8 4 8 Boating or swimming 36 5 3 5 Trailhead 348 4 3 3 Picnicking 110 3 2 3 Observation site2 41 3 2 3 Other recreation3 35 4 1 3 Winter sports4 31 2 2 2 Interpretive site 47 2 1 2 Fishing 42 1 2 1 Day use area 36 2 1 2 Ranger station or visitor center5 16 2 0 1 Residence 15 1 1 1 Resort or lodge6 12 0 1 0 Total7 1,097 37 23 34 1. Camping sites include group, river, boat, horse, and other campgrounds. 2. A few scenic highways are included with observation sites. 3. Other sites are mainly dispersed or unlabeled recreation areas but also include an airport, two ATV sites, and three amphitheaters. 4. Winter sports sites accommodate alpine and cross-country skiing, as well as snow parks and snow play areas for activities such as sledding and snowmobiling. 5. This category includes two ranger stations, eight guard stations, and six visitor centers. 6. Resorts or lodges are mainly privately owned resorts, hotels and lodges, but there are also two sites for cabin or yurt rentals. 7. The total omits 21 recreation sites labelled as administrative office, dump station, fire lookout, employee cabin, or state park—three in FWS current range, one in historical-only range, and three in SGMAs. Source: BEBR analysis and U.S. Forest Service, Region 4 Recreation Sites; U.S. Fish and Wildlife Service; Utah Division of Wildlife Resources; State of Utah, SGID.
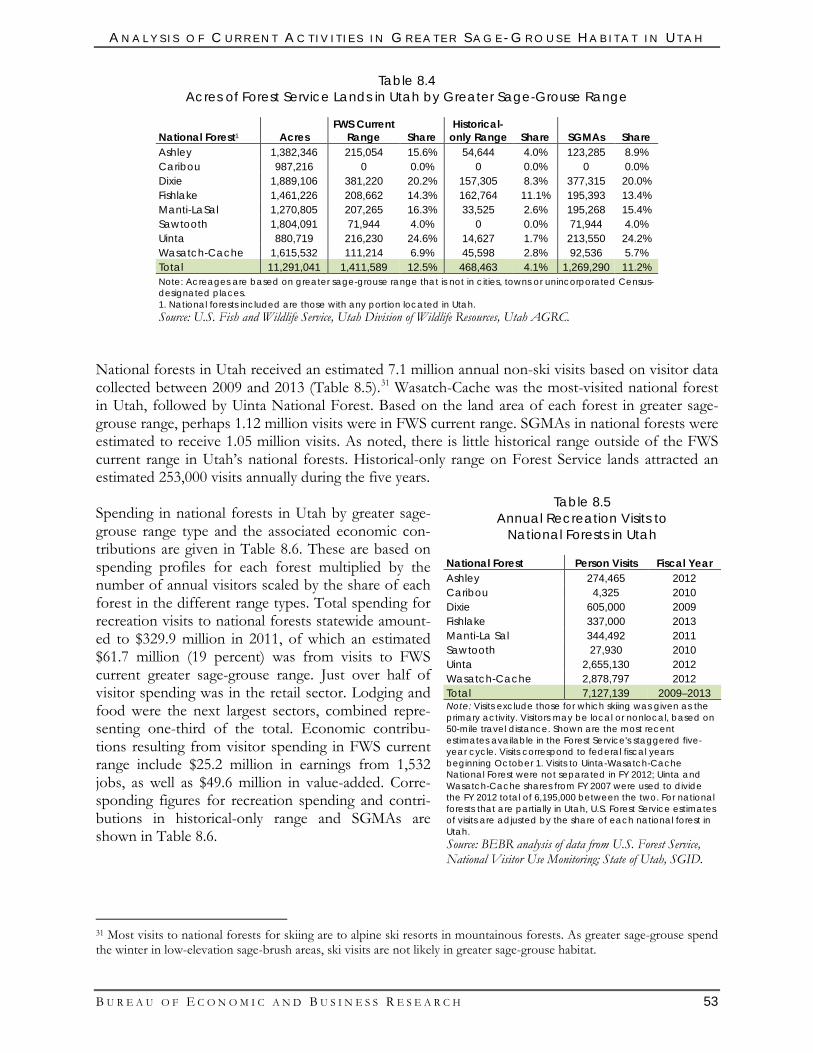
A N A L Y S I S O F C U R R E N T A C T I V I T I E S I N G R E A T E R S A G E - G R O U S E H A B I T A T I N U T A H
B U R E A U O F E C O N O M I C A N D B U S I N E S S R E S E A R C H 53
Table 8.4 Acres of Forest Service Lands in Utah by Greater Sage-Grouse Range
National Forest1 Acres FWS Current
Range Share Historical-
only Range Share SGMAs Share Ashley 1,382,346 215,054 15.6% 54,644 4.0% 123,285 8.9% Caribou 987,216 0 0.0% 0 0.0% 0 0.0% Dixie 1,889,106 381,220 20.2% 157,305 8.3% 377,315 20.0% Fishlake 1,461,226 208,662 14.3% 162,764 11.1% 195,393 13.4% Manti-LaSal 1,270,805 207,265 16.3% 33,525 2.6% 195,268 15.4% Sawtooth 1,804,091 71,944 4.0% 0 0.0% 71,944 4.0% Uinta 880,719 216,230 24.6% 14,627 1.7% 213,550 24.2% Wasatch-Cache 1,615,532 111,214 6.9% 45,598 2.8% 92,536 5.7% Total 11,291,041 1,411,589 12.5% 468,463 4.1% 1,269,290 11.2% Note: Acreages are based on greater sage-grouse range that is not in cities, towns or unincorporated Census-designated places. 1. National forests included are those with any portion located in Utah. Source: U.S. Fish and Wildlife Service, Utah Division of Wildlife Resources, Utah AGRC.
National forests in Utah received an estimated 7.1 million annual non-ski visits based on visitor data collected between 2009 and 2013 (Table 8.5).31 Wasatch-Cache was the most-visited national forest in Utah, followed by Uinta National Forest. Based on the land area of each forest in greater sage-grouse range, perhaps 1.12 million visits were in FWS current range. SGMAs in national forests were estimated to receive 1.05 million visits. As noted, there is little historical range outside of the FWS current range in Utah’s national forests. Historical-only range on Forest Service lands attracted an estimated 253,000 visits annually during the five years. Spending in national forests in Utah by greater sage-grouse range type and the associated economic con-tributions are given in Table 8.6. These are based on spending profiles for each forest multiplied by the number of annual visitors scaled by the share of each forest in the different range types. Total spending for recreation visits to national forests statewide amount-ed to $329.9 million in 2011, of which an estimated $61.7 million (19 percent) was from visits to FWS current greater sage-grouse range. Just over half of visitor spending was in the retail sector. Lodging and food were the next largest sectors, combined repre-senting one-third of the total. Economic contribu-tions resulting from visitor spending in FWS current range include $25.2 million in earnings from 1,532 jobs, as well as $49.6 million in value-added. Corre-sponding figures for recreation spending and contri-butions in historical-only range and SGMAs are shown in Table 8.6.
31 Most visits to national forests for skiing are to alpine ski resorts in mountainous forests. As greater sage-grouse spend the winter in low-elevation sage-brush areas, ski visits are not likely in greater sage-grouse habitat.
Table 8.5 Annual Recreation Visits to
National Forests in Utah
National Forest Person Visits Fiscal Year Ashley 274,465 2012 Caribou 4,325 2010 Dixie 605,000 2009 Fishlake 337,000 2013 Manti-La Sal 344,492 2011 Sawtooth 27,930 2010 Uinta 2,655,130 2012 Wasatch-Cache 2,878,797 2012 Total 7,127,139 2009–2013 Note: Visits exclude those for which skiing was given as the primary activity. Visitors may be local or nonlocal, based on 50-mile travel distance. Shown are the most recent estimates available in the Forest Service's staggered five-year cycle. Visits correspond to federal fiscal years beginning October 1. Visits to Uinta-Wasatch-Cache National Forest were not separated in FY 2012; Uinta and Wasatch-Cache shares from FY 2007 were used to divide the FY 2012 total of 6,195,000 between the two. For national forests that are partially in Utah, U.S. Forest Service estimates of visits are adjusted by the share of each national forest in Utah. Source: BEBR analysis of data from U.S. Forest Service, National Visitor Use Monitoring; State of Utah, SGID.
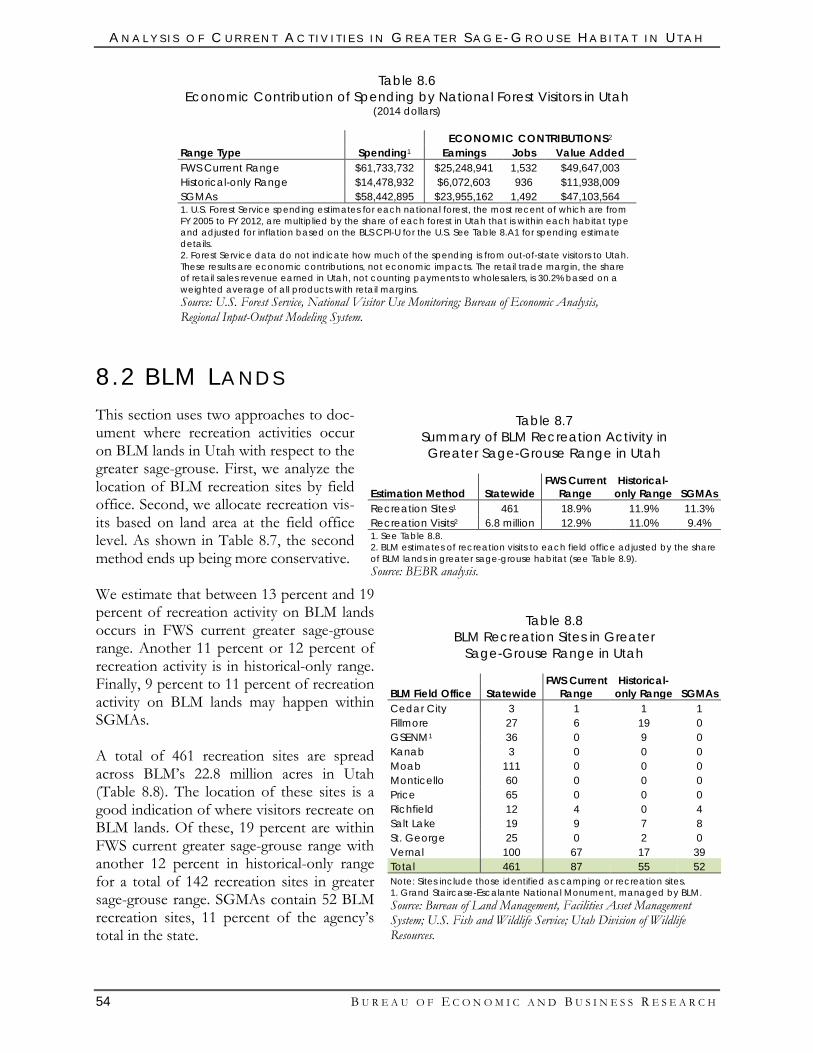
A N A L Y S I S O F C U R R E N T A C T I V I T I E S I N G R E A T E R S A G E - G R O U S E H A B I T A T I N U T A H
54 B U R E A U O F E C O N O M I C A N D B U S I N E S S R E S E A R C H
Table 8.6 Economic Contribution of Spending by National Forest Visitors in Utah
(2014 dollars)
ECONOMIC CONTRIBUTIONS2 Range Type Spending1 Earnings Jobs Value Added FWS Current Range $61,733,732 $25,248,941 1,532 $49,647,003 Historical-only Range $14,478,932 $6,072,603 936 $11,938,009 SGMAs $58,442,895 $23,955,162 1,492 $47,103,564 1. U.S. Forest Service spending estimates for each national forest, the most recent of which are from FY 2005 to FY 2012, are multiplied by the share of each forest in Utah that is within each habitat type and adjusted for inflation based on the BLS CPI-U for the U.S. See Table 8.A1 for spending estimate details. 2. Forest Service data do not indicate how much of the spending is from out-of-state visitors to Utah. These results are economic contributions, not economic impacts. The retail trade margin, the share of retail sales revenue earned in Utah, not counting payments to wholesalers, is 30.2% based on a weighted average of all products with retail margins. Source: U.S. Forest Service, National Visitor Use Monitoring; Bureau of Economic Analysis, Regional Input-Output Modeling System.
8.2 BLM LA ND S This section uses two approaches to doc-ument where recreation activities occur on BLM lands in Utah with respect to the greater sage-grouse. First, we analyze the location of BLM recreation sites by field office. Second, we allocate recreation vis-its based on land area at the field office level. As shown in Table 8.7, the second method ends up being more conservative. We estimate that between 13 percent and 19 percent of recreation activity on BLM lands occurs in FWS current greater sage-grouse range. Another 11 percent or 12 percent of recreation activity is in historical-only range. Finally, 9 percent to 11 percent of recreation activity on BLM lands may happen within SGMAs. A total of 461 recreation sites are spread across BLM’s 22.8 million acres in Utah (Table 8.8). The location of these sites is a good indication of where visitors recreate on BLM lands. Of these, 19 percent are within FWS current greater sage-grouse range with another 12 percent in historical-only range for a total of 142 recreation sites in greater sage-grouse range. SGMAs contain 52 BLM recreation sites, 11 percent of the agency’s total in the state.
Table 8.7 Summary of BLM Recreation Activity in Greater Sage-Grouse Range in Utah
Estimation Method Statewide FWS Current
Range Historical-
only Range SGMAs Recreation Sites1 461 18.9% 11.9% 11.3% Recreation Visits2 6.8 million 12.9% 11.0% 9.4% 1. See Table 8.8. 2. BLM estimates of recreation visits to each field office adjusted by the share of BLM lands in greater sage-grouse habitat (see Table 8.9). Source: BEBR analysis.
Table 8.8 BLM Recreation Sites in Greater
Sage-Grouse Range in Utah
BLM Field Office Statewide FWS Current
Range Historical-
only Range
SGMAs Cedar City 3 1 1 1 Fillmore 27 6 19 0 GSENM1 36 0 9 0 Kanab 3 0 0 0 Moab 111 0 0 0 Monticello 60 0 0 0 Price 65 0 0 0 Richfield 12 4 0 4 Salt Lake 19 9 7 8 St. George 25 0 2 0 Vernal 100 67 17 39 Total 461 87 55 52 Note: Sites include those identified as camping or recreation sites. 1. Grand Staircase-Escalante National Monument, managed by BLM. Source: Bureau of Land Management, Facilities Asset Management System; U.S. Fish and Wildlife Service; Utah Division of Wildlife Resources.
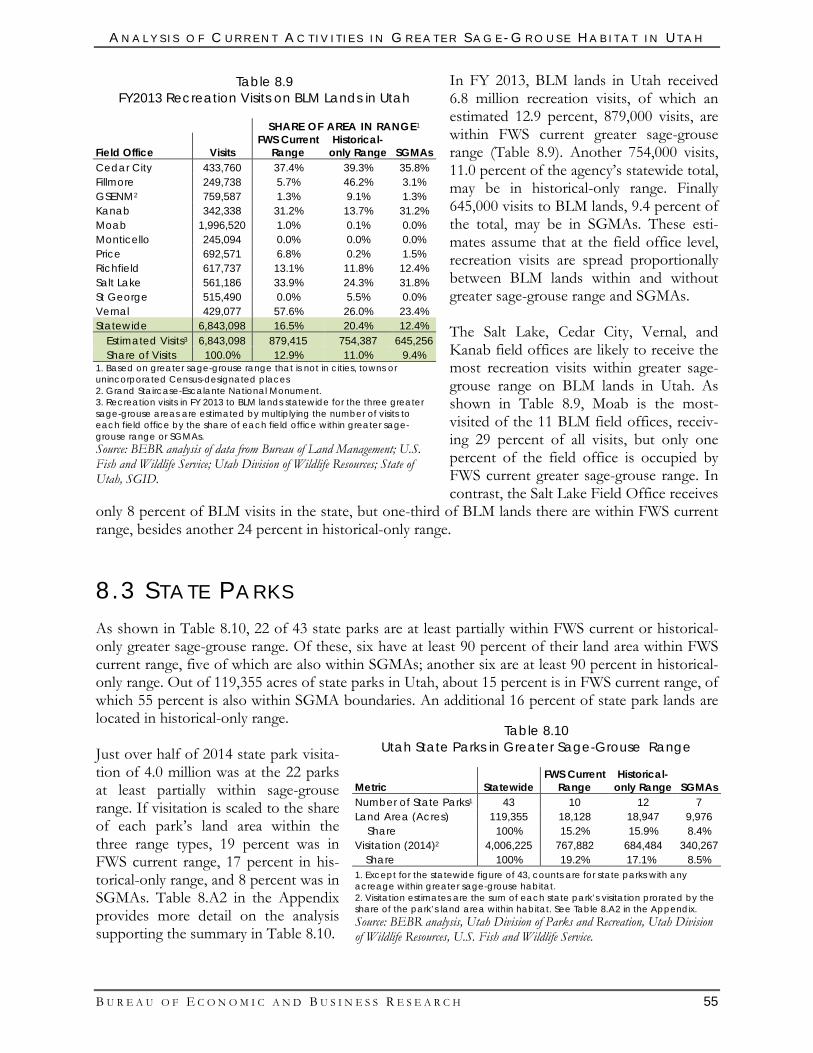
A N A L Y S I S O F C U R R E N T A C T I V I T I E S I N G R E A T E R S A G E - G R O U S E H A B I T A T I N U T A H
B U R E A U O F E C O N O M I C A N D B U S I N E S S R E S E A R C H 55
In FY 2013, BLM lands in Utah received 6.8 million recreation visits, of which an estimated 12.9 percent, 879,000 visits, are within FWS current greater sage-grouse range (Table 8.9). Another 754,000 visits, 11.0 percent of the agency’s statewide total, may be in historical-only range. Finally 645,000 visits to BLM lands, 9.4 percent of the total, may be in SGMAs. These esti-mates assume that at the field office level, recreation visits are spread proportionally between BLM lands within and without greater sage-grouse range and SGMAs. The Salt Lake, Cedar City, Vernal, and Kanab field offices are likely to receive the most recreation visits within greater sage-grouse range on BLM lands in Utah. As shown in Table 8.9, Moab is the most-visited of the 11 BLM field offices, receiv-ing 29 percent of all visits, but only one percent of the field office is occupied by FWS current greater sage-grouse range. In contrast, the Salt Lake Field Office receives
only 8 percent of BLM visits in the state, but one-third of BLM lands there are within FWS current range, besides another 24 percent in historical-only range.
8.3 STA TE PA RKS As shown in Table 8.10, 22 of 43 state parks are at least partially within FWS current or historical-only greater sage-grouse range. Of these, six have at least 90 percent of their land area within FWS current range, five of which are also within SGMAs; another six are at least 90 percent in historical-only range. Out of 119,355 acres of state parks in Utah, about 15 percent is in FWS current range, of which 55 percent is also within SGMA boundaries. An additional 16 percent of state park lands are located in historical-only range. Just over half of 2014 state park visita-tion of 4.0 million was at the 22 parks at least partially within sage-grouse range. If visitation is scaled to the share of each park’s land area within the three range types, 19 percent was in FWS current range, 17 percent in his-torical-only range, and 8 percent was in SGMAs. Table 8.A2 in the Appendix provides more detail on the analysis supporting the summary in Table 8.10.
Table 8.9 FY2013 Recreation Visits on BLM Lands in Utah
SHARE OF AREA IN RANGE1
Field Office Visits FWS Current
Range Historical-
only Range SGMAs Cedar City 433,760 37.4% 39.3% 35.8% Fillmore 249,738 5.7% 46.2% 3.1% GSENM2 759,587 1.3% 9.1% 1.3% Kanab 342,338 31.2% 13.7% 31.2% Moab 1,996,520 1.0% 0.1% 0.0% Monticello 245,094 0.0% 0.0% 0.0% Price 692,571 6.8% 0.2% 1.5% Richfield 617,737 13.1% 11.8% 12.4% Salt Lake 561,186 33.9% 24.3% 31.8% St George 515,490 0.0% 5.5% 0.0% Vernal 429,077 57.6% 26.0% 23.4% Statewide 6,843,098 16.5% 20.4% 12.4%
Estimated Visits3 6,843,098 879,415 754,387 645,256 Share of Visits 100.0% 12.9% 11.0% 9.4%
1. Based on greater sage-grouse range that is not in cities, towns or unincorporated Census-designated places 2. Grand Staircase-Escalante National Monument. 3. Recreation visits in FY 2013 to BLM lands statewide for the three greater sage-grouse areas are estimated by multiplying the number of visits to each field office by the share of each field office within greater sage-grouse range or SGMAs. Source: BEBR analysis of data from Bureau of Land Management; U.S. Fish and Wildlife Service; Utah Division of Wildlife Resources; State of Utah, SGID.
Table 8.10 Utah State Parks in Greater Sage-Grouse Range
Metric Statewide FWS Current
Range Historical-
only Range SGMAs Number of State Parks1 43 10 12 7 Land Area (Acres) 119,355 18,128 18,947 9,976
Share 100% 15.2% 15.9% 8.4% Visitation (2014)2 4,006,225 767,882 684,484 340,267
Share 100% 19.2% 17.1% 8.5% 1. Except for the statewide figure of 43, counts are for state parks with any acreage within greater sage-grouse habitat. 2. Visitation estimates are the sum of each state park’s visitation prorated by the share of the park’s land area within habitat. See Table 8.A2 in the Appendix. Source: BEBR analysis, Utah Division of Parks and Recreation, Utah Division of Wildlife Resources, U.S. Fish and Wildlife Service.
A N A L Y S I S O F C U R R E N T A C T I V I T I E S I N G R E A T E R S A G E - G R O U S E H A B I T A T I N U T A H
56 B U R E A U O F E C O N O M I C A N D B U S I N E S S R E S E A R C H
8.4 OTH E R LA ND S Most outdoor recreation in greater sage-grouse habitat in Utah occurs in the three public land types that have been the focus of this chapter. Lands managed by the Forest Service, BLM and State Parks cover 31 million acres, 57 percent of the state. These agencies manage half of the FWS current range for greater sage-grouse and a somewhat higher share of historical-only range and SGMAs, as well as most the state’s non-urban recreation sites. This study does not separately document recreation activities in greater sage-grouse habitat for pri-vate and tribal lands or lands managed by federal and state agencies besides the Forest Service, BLM, and State Parks. Reasons include management independence, data availability, the absence of large habitat areas, and the limited role of recreation. However, the sections on hunting, fishing, and trail-based activities in Utah’s greater sage-grouse range pertain to all private and public lands in the state. For example, only 3 percent of the lands managed by the National Park Service (NPS) are within FWS current or historical greater sage-grouse range (see Table 1.A1 in Chapter 1).32 The agency manages less than 1 percent of FWS current range in the state. State lands managed by the School and Institutional Trust Lands Administration (SITLA) account for 8 percent of the FWS current range, but their management priority is to generate revenue for the trust, not provide recreational opportunities. Whether for wildlife under state authority or those with ESA listings, tribal lands have a marked degree of independence in terms of wildlife management, restrictions on land use activi-ties, and recreation opportunities. Tribal lands hold 5 percent of the FWS current range for greater sage-grouse in Utah. Department of Defense lands are generally closed to recreation and have less land area and habitat than NPS lands. On the other hand, many people recreate on their own prop-erties or that of friends, nonprofits, and companies. Private lands make up one-third of the FWS current range for greater sage-grouse and one-fifth of SGMAs by land area. Unfortunately, recrea-tion on private lands in Utah is poorly documented.
8.5 HUN T I NG A ND F I SH I NG So far this chapter has analyzed a fairly comprehensive range of recreation activities on three promi-nent types of public lands. Next we evaluate hunting, fishing, and trail-based recreation in greater sage-grouse range statewide, without regard to land ownership. These outdoor activities attract a large number of participants. Data are available to estimate where they take place with regard to greater sage-grouse range and, for hunting and fishing, how they affect Utah’s economy. We do not address boating, water sports, climbing, skydiving, alpine skiing, scenic drives, and a variety of other outdoor activities that may occur in or near sage-grouse habitat. An estimated 493,000 unique people took 5.1 million hunting or fishing trips in Utah during 2011, the most recent results from a survey carried out every five years (USFWS 2013a). Perhaps 1.4 mil-lion of these trips were in the FWS current range of greater sage-grouse, another 0.9 million to his-torical-only range, and 1.0 million to SGMAs that year.33 As hunting and fishing occurs primarily on
32 Out of 13 national monuments and parks, Dinosaur National Monument and small portions of Bryce Canyon Nation-al Park and Zion National Park are in FWS current or historical range. 33 Estimates of hunting and fishing trips to greater sage-grouse range are based on the shares in Table 8.11 from 2011 and 2012 multiplied by the total number of trips given in the 2011 FHWAR survey.
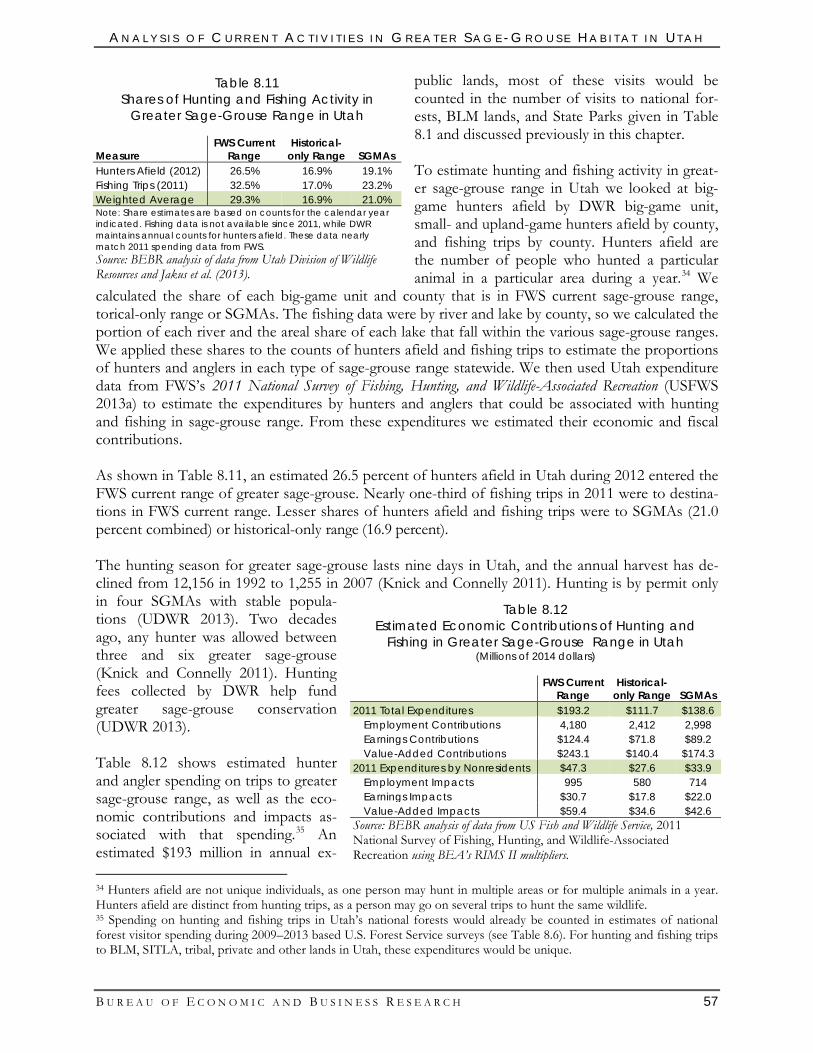
A N A L Y S I S O F C U R R E N T A C T I V I T I E S I N G R E A T E R S A G E - G R O U S E H A B I T A T I N U T A H
B U R E A U O F E C O N O M I C A N D B U S I N E S S R E S E A R C H 57
public lands, most of these visits would be counted in the number of visits to national for-ests, BLM lands, and State Parks given in Table 8.1 and discussed previously in this chapter. To estimate hunting and fishing activity in great-er sage-grouse range in Utah we looked at big-game hunters afield by DWR big-game unit, small- and upland-game hunters afield by county, and fishing trips by county. Hunters afield are the number of people who hunted a particular animal in a particular area during a year.34 We
calculated the share of each big-game unit and county that is in FWS current sage-grouse range, torical-only range or SGMAs. The fishing data were by river and lake by county, so we calculated the portion of each river and the areal share of each lake that fall within the various sage-grouse ranges. We applied these shares to the counts of hunters afield and fishing trips to estimate the proportions of hunters and anglers in each type of sage-grouse range statewide. We then used Utah expenditure data from FWS’s 2011 National Survey of Fishing, Hunting, and Wildlife-Associated Recreation (USFWS 2013a) to estimate the expenditures by hunters and anglers that could be associated with hunting and fishing in sage-grouse range. From these expenditures we estimated their economic and fiscal contributions. As shown in Table 8.11, an estimated 26.5 percent of hunters afield in Utah during 2012 entered the FWS current range of greater sage-grouse. Nearly one-third of fishing trips in 2011 were to destina-tions in FWS current range. Lesser shares of hunters afield and fishing trips were to SGMAs (21.0 percent combined) or historical-only range (16.9 percent). The hunting season for greater sage-grouse lasts nine days in Utah, and the annual harvest has de-clined from 12,156 in 1992 to 1,255 in 2007 (Knick and Connelly 2011). Hunting is by permit only in four SGMAs with stable popula-tions (UDWR 2013). Two decades ago, any hunter was allowed between three and six greater sage-grouse (Knick and Connelly 2011). Hunting fees collected by DWR help fund greater sage-grouse conservation (UDWR 2013). Table 8.12 shows estimated hunter and angler spending on trips to greater sage-grouse range, as well as the eco-nomic contributions and impacts as-sociated with that spending.35 An estimated $193 million in annual ex- 34 Hunters afield are not unique individuals, as one person may hunt in multiple areas or for multiple animals in a year. Hunters afield are distinct from hunting trips, as a person may go on several trips to hunt the same wildlife. 35 Spending on hunting and fishing trips in Utah’s national forests would already be counted in estimates of national forest visitor spending during 2009–2013 based U.S. Forest Service surveys (see Table 8.6). For hunting and fishing trips to BLM, SITLA, tribal, private and other lands in Utah, these expenditures would be unique.
Table 8.11 Shares of Hunting and Fishing Activity in
Greater Sage-Grouse Range in Utah
Measure FWS Current
Range Historical-
only Range SGMAs Hunters Afield (2012) 26.5% 16.9% 19.1% Fishing Trips (2011) 32.5% 17.0% 23.2% Weighted Average 29.3% 16.9% 21.0% Note: Share estimates are based on counts for the calendar year indicated. Fishing data is not available since 2011, while DWR maintains annual counts for hunters afield. These data nearly match 2011 spending data from FWS. Source: BEBR analysis of data from Utah Division of Wildlife Resources and Jakus et al. (2013).
Table 8.12 Estimated Economic Contributions of Hunting and
Fishing in Greater Sage-Grouse Range in Utah (Millions of 2014 dollars)
FWS Current
Range Historical-
only Range SGMAs 2011 Total Expenditures $193.2 $111.7 $138.6
Employment Contributions 4,180 2,412 2,998 Earnings Contributions $124.4 $71.8 $89.2 Value-Added Contributions $243.1 $140.4 $174.3
2011 Expenditures by Nonresidents $47.3 $27.6 $33.9 Employment Impacts 995 580 714 Earnings Impacts $30.7 $17.8 $22.0 Value-Added Impacts $59.4 $34.6 $42.6
Source: BEBR analysis of data from US Fish and Wildlife Service, 2011 National Survey of Fishing, Hunting, and Wildlife-Associated Recreation using BEA’s RIMS II multipliers.
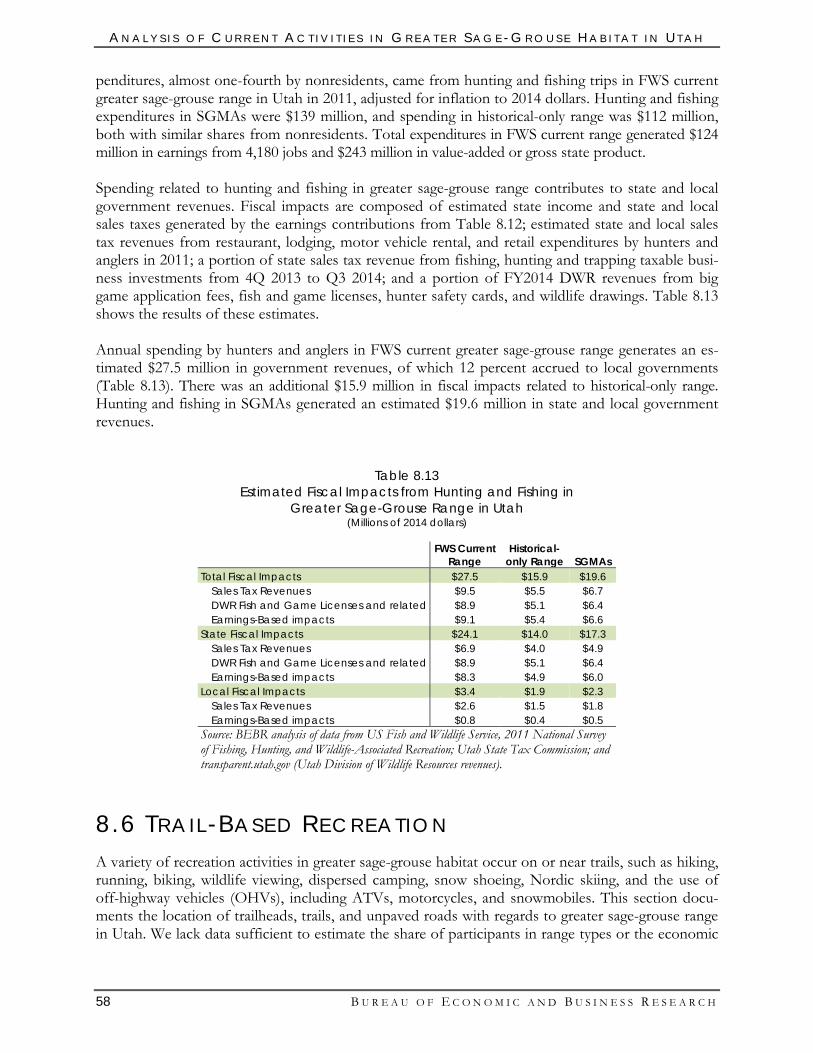
A N A L Y S I S O F C U R R E N T A C T I V I T I E S I N G R E A T E R S A G E - G R O U S E H A B I T A T I N U T A H
58 B U R E A U O F E C O N O M I C A N D B U S I N E S S R E S E A R C H
penditures, almost one-fourth by nonresidents, came from hunting and fishing trips in FWS current greater sage-grouse range in Utah in 2011, adjusted for inflation to 2014 dollars. Hunting and fishing expenditures in SGMAs were $139 million, and spending in historical-only range was $112 million, both with similar shares from nonresidents. Total expenditures in FWS current range generated $124 million in earnings from 4,180 jobs and $243 million in value-added or gross state product. Spending related to hunting and fishing in greater sage-grouse range contributes to state and local government revenues. Fiscal impacts are composed of estimated state income and state and local sales taxes generated by the earnings contributions from Table 8.12; estimated state and local sales tax revenues from restaurant, lodging, motor vehicle rental, and retail expenditures by hunters and anglers in 2011; a portion of state sales tax revenue from fishing, hunting and trapping taxable busi-ness investments from 4Q 2013 to Q3 2014; and a portion of FY2014 DWR revenues from big game application fees, fish and game licenses, hunter safety cards, and wildlife drawings. Table 8.13 shows the results of these estimates. Annual spending by hunters and anglers in FWS current greater sage-grouse range generates an es-timated $27.5 million in government revenues, of which 12 percent accrued to local governments (Table 8.13). There was an additional $15.9 million in fiscal impacts related to historical-only range. Hunting and fishing in SGMAs generated an estimated $19.6 million in state and local government revenues.
Table 8.13 Estimated Fiscal Impacts from Hunting and Fishing in
Greater Sage-Grouse Range in Utah (Millions of 2014 dollars)
FWS Current
Range Historical-
only Range SGMAs Total Fiscal Impacts $27.5 $15.9 $19.6
Sales Tax Revenues $9.5 $5.5 $6.7 DWR Fish and Game Licenses and related $8.9 $5.1 $6.4 Earnings-Based impacts $9.1 $5.4 $6.6
State Fiscal Impacts $24.1 $14.0 $17.3 Sales Tax Revenues $6.9 $4.0 $4.9 DWR Fish and Game Licenses and related $8.9 $5.1 $6.4 Earnings-Based impacts $8.3 $4.9 $6.0
Local Fiscal Impacts $3.4 $1.9 $2.3 Sales Tax Revenues $2.6 $1.5 $1.8 Earnings-Based impacts $0.8 $0.4 $0.5
Source: BEBR analysis of data from US Fish and Wildlife Service, 2011 National Survey of Fishing, Hunting, and Wildlife-Associated Recreation; Utah State Tax Commission; and transparent.utah.gov (Utah Division of Wildlife Resources revenues).
8.6 TRA I L -BASE D RE CREA TI O N A variety of recreation activities in greater sage-grouse habitat occur on or near trails, such as hiking, running, biking, wildlife viewing, dispersed camping, snow shoeing, Nordic skiing, and the use of off-highway vehicles (OHVs), including ATVs, motorcycles, and snowmobiles. This section docu-ments the location of trailheads, trails, and unpaved roads with regards to greater sage-grouse range in Utah. We lack data sufficient to estimate the share of participants in range types or the economic
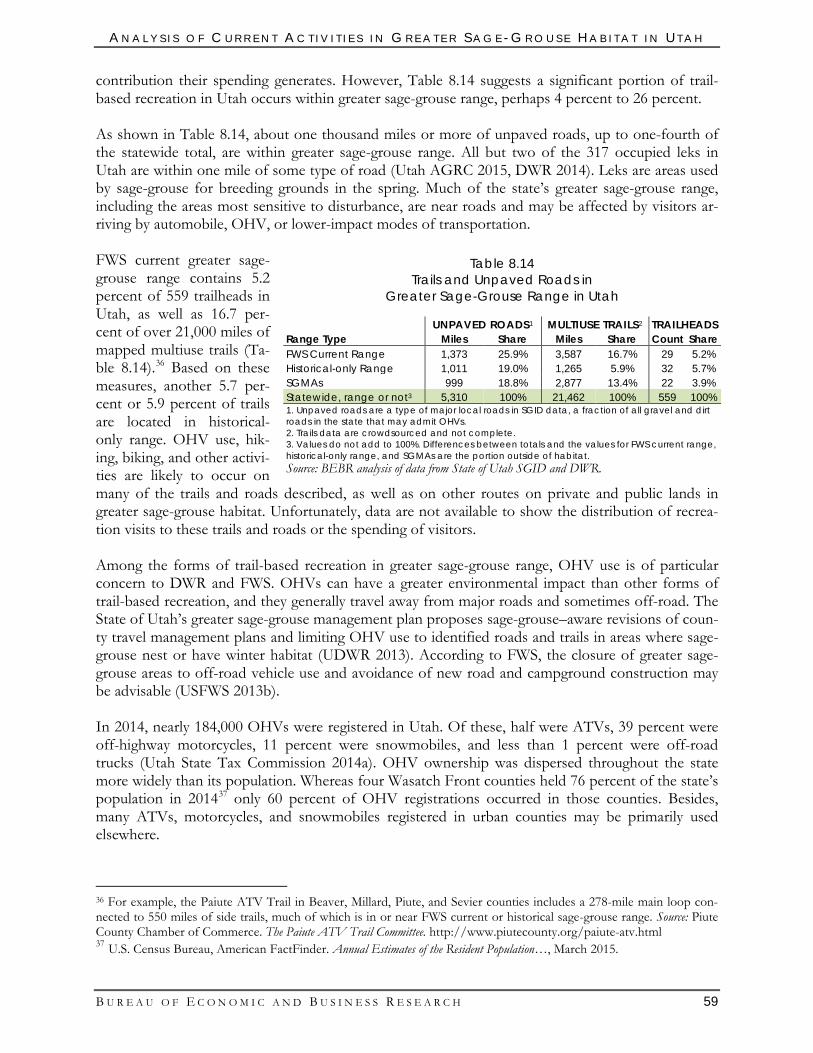
A N A L Y S I S O F C U R R E N T A C T I V I T I E S I N G R E A T E R S A G E - G R O U S E H A B I T A T I N U T A H
B U R E A U O F E C O N O M I C A N D B U S I N E S S R E S E A R C H 59
contribution their spending generates. However, Table 8.14 suggests a significant portion of trail-based recreation in Utah occurs within greater sage-grouse range, perhaps 4 percent to 26 percent. As shown in Table 8.14, about one thousand miles or more of unpaved roads, up to one-fourth of the statewide total, are within greater sage-grouse range. All but two of the 317 occupied leks in Utah are within one mile of some type of road (Utah AGRC 2015, DWR 2014). Leks are areas used by sage-grouse for breeding grounds in the spring. Much of the state’s greater sage-grouse range, including the areas most sensitive to disturbance, are near roads and may be affected by visitors ar-riving by automobile, OHV, or lower-impact modes of transportation. FWS current greater sage-grouse range contains 5.2 percent of 559 trailheads in Utah, as well as 16.7 per-cent of over 21,000 miles of mapped multiuse trails (Ta-ble 8.14).36 Based on these measures, another 5.7 per-cent or 5.9 percent of trails are located in historical-only range. OHV use, hik-ing, biking, and other activi-ties are likely to occur on many of the trails and roads described, as well as on other routes on private and public lands in greater sage-grouse habitat. Unfortunately, data are not available to show the distribution of recrea-tion visits to these trails and roads or the spending of visitors. Among the forms of trail-based recreation in greater sage-grouse range, OHV use is of particular concern to DWR and FWS. OHVs can have a greater environmental impact than other forms of trail-based recreation, and they generally travel away from major roads and sometimes off-road. The State of Utah’s greater sage-grouse management plan proposes sage-grouse–aware revisions of coun-ty travel management plans and limiting OHV use to identified roads and trails in areas where sage-grouse nest or have winter habitat (UDWR 2013). According to FWS, the closure of greater sage-grouse areas to off-road vehicle use and avoidance of new road and campground construction may be advisable (USFWS 2013b). In 2014, nearly 184,000 OHVs were registered in Utah. Of these, half were ATVs, 39 percent were off-highway motorcycles, 11 percent were snowmobiles, and less than 1 percent were off-road trucks (Utah State Tax Commission 2014a). OHV ownership was dispersed throughout the state more widely than its population. Whereas four Wasatch Front counties held 76 percent of the state’s population in 201437 only 60 percent of OHV registrations occurred in those counties. Besides, many ATVs, motorcycles, and snowmobiles registered in urban counties may be primarily used elsewhere.
36 For example, the Paiute ATV Trail in Beaver, Millard, Piute, and Sevier counties includes a 278-mile main loop con-nected to 550 miles of side trails, much of which is in or near FWS current or historical sage-grouse range. Source: Piute County Chamber of Commerce. The Paiute ATV Trail Committee. http://www.piutecounty.org/paiute-atv.html 37 U.S. Census Bureau, American FactFinder. Annual Estimates of the Resident Population…, March 2015.
Table 8.14 Trails and Unpaved Roads in
Greater Sage-Grouse Range in Utah
UNPAVED ROADS1 MULTIUSE TRAILS2 TRAILHEADS Range Type Miles Share Miles Share Count Share FWS Current Range 1,373 25.9% 3,587 16.7% 29 5.2% Historical-only Range 1,011 19.0% 1,265 5.9% 32 5.7% SGMAs 999 18.8% 2,877 13.4% 22 3.9% Statewide, range or not3 5,310 100% 21,462 100% 559 100% 1. Unpaved roads are a type of major local roads in SGID data, a fraction of all gravel and dirt roads in the state that may admit OHVs. 2. Trails data are crowdsourced and not complete. 3. Values do not add to 100%. Differences between totals and the values for FWS current range, historical-only range, and SGMAs are the portion outside of habitat. Source: BEBR analysis of data from State of Utah SGID and DWR.
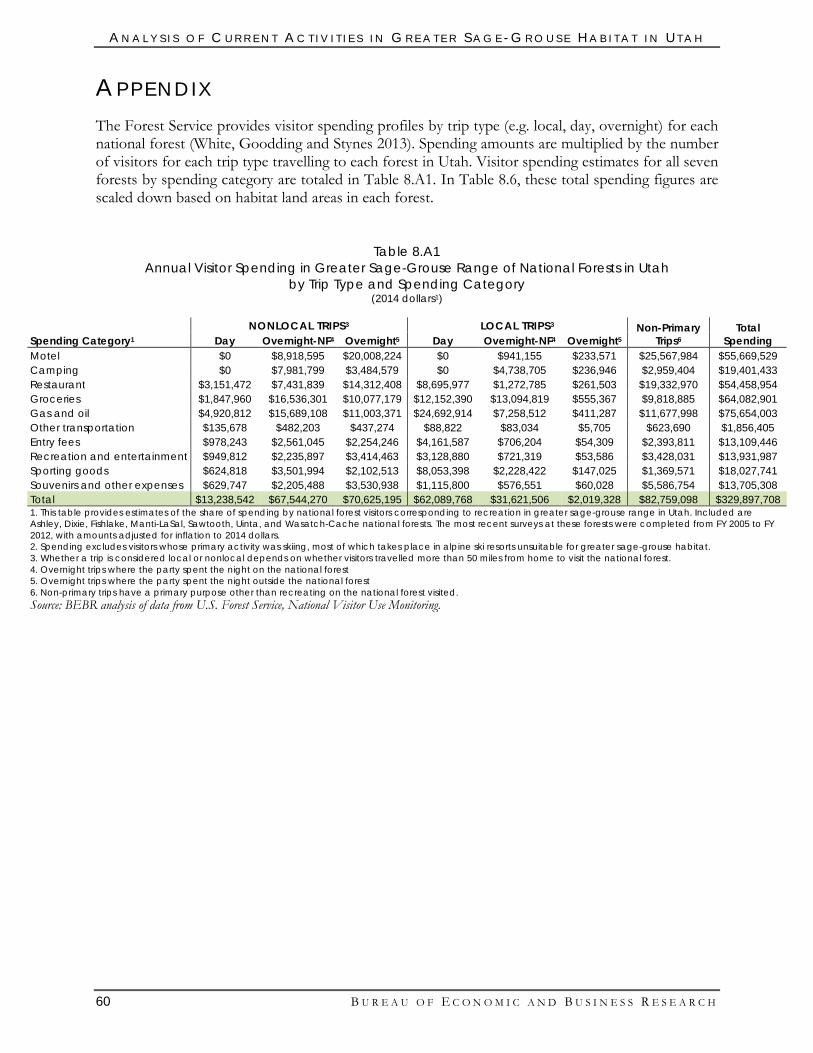
A N A L Y S I S O F C U R R E N T A C T I V I T I E S I N G R E A T E R S A G E - G R O U S E H A B I T A T I N U T A H
60 B U R E A U O F E C O N O M I C A N D B U S I N E S S R E S E A R C H
APPENDI X The Forest Service provides visitor spending profiles by trip type (e.g. local, day, overnight) for each national forest (White, Goodding and Stynes 2013). Spending amounts are multiplied by the number of visitors for each trip type travelling to each forest in Utah. Visitor spending estimates for all seven forests by spending category are totaled in Table 8.A1. In Table 8.6, these total spending figures are scaled down based on habitat land areas in each forest.
Table 8.A1 Annual Visitor Spending in Greater Sage-Grouse Range of National Forests in Utah
by Trip Type and Spending Category (2014 dollars1)
Spending Category1 NONLOCAL TRIPS3 LOCAL TRIPS3 Non-Primary
Trips6 Total
Spending Day Overnight-NF4 Overnight5 Day Overnight-NF4 Overnight5 Motel $0 $8,918,595 $20,008,224 $0 $941,155 $233,571 $25,567,984 $55,669,529 Camping $0 $7,981,799 $3,484,579 $0 $4,738,705 $236,946 $2,959,404 $19,401,433 Restaurant $3,151,472 $7,431,839 $14,312,408 $8,695,977 $1,272,785 $261,503 $19,332,970 $54,458,954 Groceries $1,847,960 $16,536,301 $10,077,179 $12,152,390 $13,094,819 $555,367 $9,818,885 $64,082,901 Gas and oil $4,920,812 $15,689,108 $11,003,371 $24,692,914 $7,258,512 $411,287 $11,677,998 $75,654,003 Other transportation $135,678 $482,203 $437,274 $88,822 $83,034 $5,705 $623,690 $1,856,405 Entry fees $978,243 $2,561,045 $2,254,246 $4,161,587 $706,204 $54,309 $2,393,811 $13,109,446 Recreation and entertainment $949,812 $2,235,897 $3,414,463 $3,128,880 $721,319 $53,586 $3,428,031 $13,931,987 Sporting goods $624,818 $3,501,994 $2,102,513 $8,053,398 $2,228,422 $147,025 $1,369,571 $18,027,741 Souvenirs and other expenses $629,747 $2,205,488 $3,530,938 $1,115,800 $576,551 $60,028 $5,586,754 $13,705,308 Total $13,238,542 $67,544,270 $70,625,195 $62,089,768 $31,621,506 $2,019,328 $82,759,098 $329,897,708 1. This table provides estimates of the share of spending by national forest visitors corresponding to recreation in greater sage-grouse range in Utah. Included are Ashley, Dixie, Fishlake, Manti-LaSal, Sawtooth, Uinta, and Wasatch-Cache national forests. The most recent surveys at these forests were completed from FY 2005 to FY 2012, with amounts adjusted for inflation to 2014 dollars. 2. Spending excludes visitors whose primary activity was skiing, most of which takes place in alpine ski resorts unsuitable for greater sage-grouse habitat. 3. Whether a trip is considered local or nonlocal depends on whether visitors travelled more than 50 miles from home to visit the national forest. 4. Overnight trips where the party spent the night on the national forest 5. Overnight trips where the party spent the night outside the national forest 6. Non-primary trips have a primary purpose other than recreating on the national forest visited. Source: BEBR analysis of data from U.S. Forest Service, National Visitor Use Monitoring.
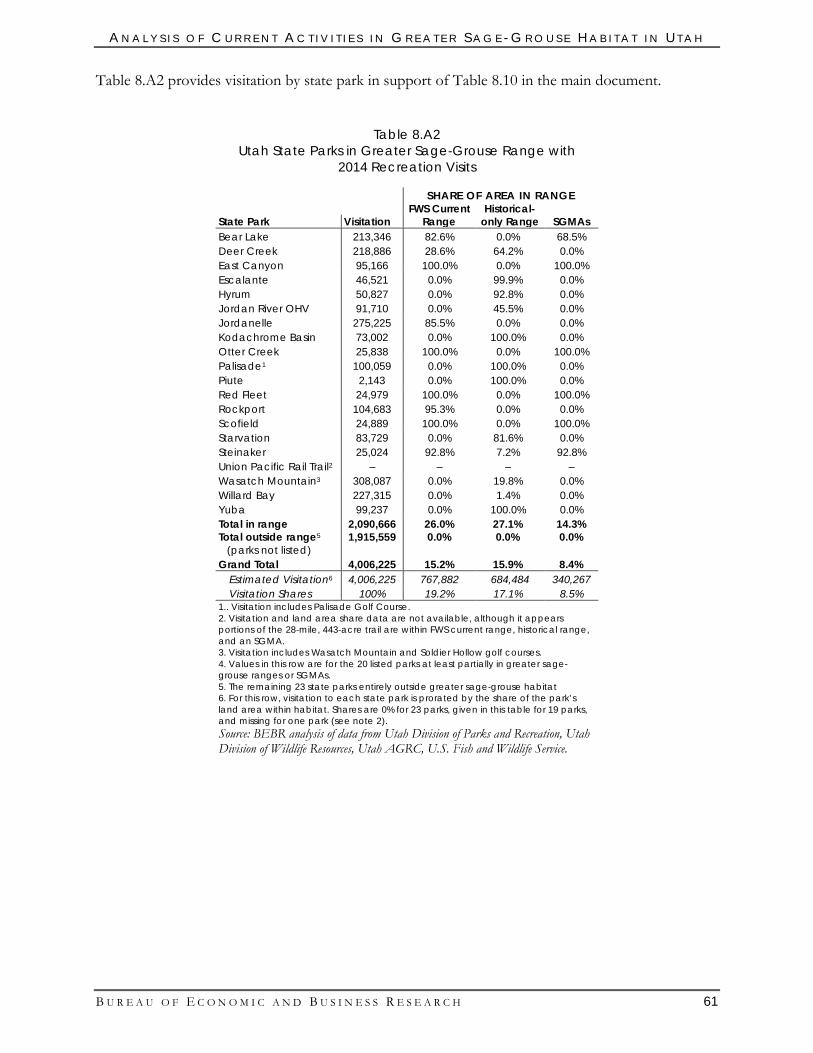
A N A L Y S I S O F C U R R E N T A C T I V I T I E S I N G R E A T E R S A G E - G R O U S E H A B I T A T I N U T A H
B U R E A U O F E C O N O M I C A N D B U S I N E S S R E S E A R C H 61
Table 8.A2 provides visitation by state park in support of Table 8.10 in the main document.
Table 8.A2 Utah State Parks in Greater Sage-Grouse Range with
2014 Recreation Visits
SHARE OF AREA IN RANGE
FWS Current
Range Historical-
only Range SGMAs State Park Visitation Bear Lake 213,346 82.6% 0.0% 68.5% Deer Creek 218,886 28.6% 64.2% 0.0% East Canyon 95,166 100.0% 0.0% 100.0% Escalante 46,521 0.0% 99.9% 0.0% Hyrum 50,827 0.0% 92.8% 0.0% Jordan River OHV 91,710 0.0% 45.5% 0.0% Jordanelle 275,225 85.5% 0.0% 0.0% Kodachrome Basin 73,002 0.0% 100.0% 0.0% Otter Creek 25,838 100.0% 0.0% 100.0% Palisade1 100,059 0.0% 100.0% 0.0% Piute 2,143 0.0% 100.0% 0.0% Red Fleet 24,979 100.0% 0.0% 100.0% Rockport 104,683 95.3% 0.0% 0.0% Scofield 24,889 100.0% 0.0% 100.0% Starvation 83,729 0.0% 81.6% 0.0% Steinaker 25,024 92.8% 7.2% 92.8% Union Pacific Rail Trail2 – – – – Wasatch Mountain3 308,087 0.0% 19.8% 0.0% Willard Bay 227,315 0.0% 1.4% 0.0% Yuba 99,237 0.0% 100.0% 0.0% Total in range 2,090,666 26.0% 27.1% 14.3% Total outside range5
(parks not listed) 1,915,559 0.0% 0.0% 0.0%
Grand Total 4,006,225 15.2% 15.9% 8.4% Estimated Visitation6 4,006,225 767,882 684,484 340,267 Visitation Shares 100% 19.2% 17.1% 8.5%
1.. Visitation includes Palisade Golf Course. 2. Visitation and land area share data are not available, although it appears portions of the 28-mile, 443-acre trail are within FWS current range, historical range, and an SGMA. 3. Visitation includes Wasatch Mountain and Soldier Hollow golf courses. 4. Values in this row are for the 20 listed parks at least partially in greater sage-grouse ranges or SGMAs. 5. The remaining 23 state parks entirely outside greater sage-grouse habitat 6. For this row, visitation to each state park is prorated by the share of the park’s land area within habitat. Shares are 0% for 23 parks, given in this table for 19 parks, and missing for one park (see note 2). Source: BEBR analysis of data from Utah Division of Parks and Recreation, Utah Division of Wildlife Resources, Utah AGRC, U.S. Fish and Wildlife Service.

B U R E A U O F E C O N O M I C A N D B U S I N E S S R E S E A R C H 63
ESA LIST ING AND PRIVATE PROPERTY VALUES
Federal law governs species listed as endangered or threatened and protects their habitats across public and private lands. An ESA listing of the greater sage-grouse has the potential to affect private property values in parts of Utah. For example, across greater sage-grouse range, an ESA listing could interfere with owner choices regarding landscaping and construction or reduce the productivity of lands intended for crop agriculture or oil extraction. FWS current range of the greater sage-grouse occupies 31 percent of Utah’s 11.4 million acres of private property outside of cities and other Census places (see Table 1.1).38 Historical-only range and SGMAs are somewhat smaller but still over 20 percent. A preliminary review of aggregate county-level data suggests some $5.7 billion in agricultural and non-primary residential property values may be located in FWS current range, 2.5 percent of the total assessed value of privately owned real property in Utah. Historical-only range and SGMAs may contain $5.2 billion and $3.9 billion, re-spectively, of private property. The acreage of private property in greater sage-grouse areas varies widely by county (Table 9.1). For example, outside of Census places, no private property in Salt Lake or Washington counties is within FWS current range or SGMAs, while virtually all 367,000 acres of private land outside of Census places in Rich County are within these greater sage-grouse designations. The market value of all real property in Utah was $228.7 billion in 2013, adjusted for inflation to 2014 dollars (Utah State Tax Commission 2014b). These values are concentrated in urban areas away from greater sage-grouse. In the absence of parcel-level valuation data for private properties in or near sage-grouse habitat, we have identified two types of property that commonly occur in greater sage-grouse habitat in the state: agricultural lands39 and residential properties besides primary resi-dences.40 Agricultural and non-primary residential lands are more likely than primary residences or commercial and industrial sites41 to be affected by any future ESA requirements for greater sage-grouse. For ex-ample, farm and cabin resale values would depend on the freedom to carry out agricultural, recrea-tional or other activities. Because primary residences and commercial and industrial properties are generally located in settled areas, their use is unlikely to be affected by an ESA listing. Thus, in Table 9.1, we omit market values for primary residences and commercial and industrial properties.
38 See Section 1.3.3 for a definition of places. 39 Agricultural properties include buildings and lands capable of providing forage or growing crops, including unused lands. These properties may be irrigated, dryland, pasture, orchards, or meadows. 40 Primary residences are properties under one acre where someone lived at least 183 days during the year. “Non-primary residential” in Table 9.1 includes second homes, recreational properties, and undeveloped lands. Most of these are locat-ed outside of cities, towns, and other Census places, with the possible exception of Summit County, where a significant portion of non-primary residential properties are located within established communities. Some agricultural and non-primary residential properties are in cities or other populated areas where greater sage-grouse would not be found. In that regard, taking habitat shares of the property values given in Table 9.1 may overstate values at risk in the event of an ESA listing. On the other hand, some primary residences and commercial or industrial properties are found in rural hab-itat areas, and Table 9.1 is conservative in omitting those. 41 Commercial and industrial properties include stores, offices, factories, warehouses, etc.
9
A N A L Y S I S O F C U R R E N T A C T I V I T I E S I N G R E A T E R S A G E - G R O U S E H A B I T A T I N U T A H
64 B U R E A U O F E C O N O M I C A N D B U S I N E S S R E S E A R C H
The total assessed market value of both agricultural and non-primary residential properties in Utah was $20.3 billion in 2013, given in inflation-adjusted 2014 dollars (Table 9.1). Residential properties besides primary residences were valued at $11.5 billion; agricultural properties were valued at $8.8 billion. Amounts vary widely by county, from a combined $38 million in Juab County, where one-fourth of private lands outside of places were in FWS current range, to a combined $3.1 billion in Summit County, where 62.4 percent of these lands are in FWS current range.42
Table 9.1 Private Lands, Greater Sage-Grouse, and Property Values in Utah
Total Private Lands
(Acres)
Shares of Private Land Area in…
2013 Market Value1 (Millions of 2014 dollars)
County FWS Current
Range Historical-
only Range SGMAs Non-Primary Residential2 Agricultural3
Beaver 202,194 37.6% 26.9% 28.1% $48.1 $141.5 Box Elder 1,805,862 49.5% 28.0% 44.3% $11.5 $265.6 Cache 304,817 20.5% 58.4% 20.1% $150.7 $468.7 Carbon 351,276 60.1% 0.0% 43.7% $74.2 $64.3 Daggett 47,041 68.5% 30.3% 31.6% $84.4 $17.9 Davis 24,065 0.0% 22.9% 0.0% $62.5 $427.6 Duchesne 584,021 39.2% 39.2% 9.3% $147.1 $258.5 Emery 223,813 4.0% 0.2% 2.0% $16.7 $28.6 Garfield 149,987 63.8% 22.7% 63.8% $185.5 $109.4 Grand 95,700 2.5% 0.0% 0.0% $195.7 $122.6 Iron 719,166 9.4% 62.8% 9.4% $421.9 $417.5 Juab 367,859 25.2% 54.4% 7.7% $21.4 $16.3 Kane 251,911 21.1% 13.6% 20.7% $429.7 $230.0 Millard 571,311 0.6% 58.5% 0.0% $32.8 $137.4 Morgan 355,459 52.4% 13.8% 42.3% $50.3 $87.8 Piute 48,017 41.0% 38.8% 41.0% $24.9 $17.9 Rich 367,318 99.6% 0.0% 98.6% $416.1 $135.7 Salt Lake 134,321 0.0% 23.7% 0.0% $2,046.7 $69.9 San Juan 389,166 0.0% 0.0% 0.0% $23.6 $74.5 Sanpete 423,654 22.0% 58.2% 2.8% $186.5 $187.6 Sevier 221,306 18.5% 52.2% 15.1% $50.4 $88.7 Summit 580,614 62.4% 3.9% 43.3% $1,710.2 $1,391.4 Tooele 439,784 32.2% 27.0% 17.2% $15.3 $233.2 Uintah 408,841 61.7% 32.8% 34.5% $50.3 $205.8 Utah 343,053 15.2% 53.2% 13.7% $182.9 $1,887.7 Wasatch 219,945 55.8% 15.5% 30.6% $1,869.6 $260.9 Washington 153,558 0.0% 25.4% 0.0% $2,235.7 $1,281.8 Wayne 51,537 40.0% 0.0% 3.3% $77.5 $63.4 Weber 186,496 16.0% 29.0% 1.4% $671.1 $113.4 Statewide 10,022,090 35.1% 30.8% 25.5% $11,493.1 $8,805.6 Note: Acreage and shares in this table are for private lands outside of U.S. Census places, which con-sist of incorporated municipalities and unincorporated Census-designated places. 1. Market values were estimated by county and central assessors for property tax purposes. The other two real property categories, primary residences and commercial and industrial properties, are not reported here, being less common in sage-grouse habitat. 2. Residential properties in excess of one acre and those not occupied by a primary resident for more than half of 2013. 3. Lands capable of providing forage or growing crops. Source: Utah State Tax Commission (2013) and BEBR analysis of data (shapefiles) from U.S. Fish & Wildlife Service; Utah Division of Wildlife Resources; and State of Utah, SGID.
42 Washington County, at $3.5 billion, has greater property values of both types (agricultural and non-primary residen-tial), but FWS has not identified any private lands as part of current greater sage-grouse range.
A N A L Y S I S O F C U R R E N T A C T I V I T I E S I N G R E A T E R S A G E - G R O U S E H A B I T A T I N U T A H
B U R E A U O F E C O N O M I C A N D B U S I N E S S R E S E A R C H 65
To clarify, this study does not establish the portion of private property values that are within greater sage-grouse range or SGMAs. While this section permits rudimentary judgments, additional research would be needed to construct precise estimates. Additionally, the section makes no representation regarding the amount by which private property values in those areas may be affected by an ESA listing. Research documenting such impacts following ESA listings of other species is lacking, and scenarios for the greater sage-grouse in Utah would be conjectural.

B U R E A U O F E C O N O M I C A N D B U S I N E S S R E S E A R C H 67
REFERENCES Baxter, Rick J., Kevin D. Bunnell, Jerran T. Flinders, and Dean L. Mitchell. 2007. “Impacts of pre-
dation on greater sage-grouse in Strawberry Valley, Utah,” Transactions of the 72nd North Ameri-can Wildlife and Natural Resources Conference. www.wildlifemanagementinstitute.org/PDF/8-Impacts%20of%20Predation....pdf.
Bernales, Heather B., Jason D. Robinson, and Blair Stringham. 2015. Utah Upland Game Annual Re-port 2013–14, Utah Division of Wildlife Resources. wildlife.utah.gov/uplandgame/annual reports.
Boden, Taylor, Michael Vanden Berg, Ken Krahulec, and Andrew Rupke. 2014. Utah’s Extractive Re-source Industries 2013. Utah Geological Survey Circular 118. files.geology.utah.gov/online/c/ c-118.pdf
Bureau of Land Management. 2013. Cedar City Field Office Resource Management Plan: Analysis of the Management Situation; www.blm.gov/epl-front-office/projects/lup/7100/42732/45531/ CCFO_AMS_pdf.
Caudill, Danny, Michael R. Guttery, Brent Bibles, Terry A. Messmer, Gretchen Caudill, Erin Leone, David K. Dahlgren, and Renee Chi. 2014. “Effects of climatic variation and reproductive trade-offs vary by measure of reproductive effort in greater sage-grouse.” Ecosphere 5(12): 154.
Connelly, John W., E. Thomas Rinkes, and Clait E. Braun. 2011. “Characteristics of Greater Sage-Grouse Habitats,” in Greater Sage-Grouse: Ecology and Conservation of a Landscape Species and Its Habitats, edited by Steven T. Knick and John W. Connelly, pp. 69–83. Berkeley, CA: Univer-sity of California Press.
Guttery, Michael R., Terry A. Messmer, Mark W. Brunson, Jason D. Robinson, and David K. Dahlgren. 2015. “Declining populations of greater sage-grouse; hunter motivations when numbers are low.” Animal Conservation (May 2015).
Hagen, Christian A. 2011. “Predation on Greater Sage-Grouse: Facts, Process, and Effects,” in Greater Sage-Grouse: Ecology and Conservation of a Landscape Species and Its Habitats, edited by Ste-ven T. Knick and John W. Connelly, pp. 95–100. Berkeley, CA: University of California Press.
Jakus, Paul, Mary Jo Kealy, John Loomis, Nanette Nelson, Jeff Ostermiller, Cody Stanger, and Nicholas von Stackelberg. 2013. Economic Benefits of Nutrient Reductions in Utah’s Waters, pre-pared for the Utah Division of Water Quality. Utah State University.
Knick, Steven T., and John W. Connelly, eds. 2011. Greater Sage-Grouse: Ecology and Conservation of a Landscape Species and Its Habitats. Berkeley: University of California Press.
Knick, Steven T., Steven E. Hanser, Richard F. Miller, David A. Pyke, Michael J. Wisdom, Sean P. Finn, E. Thomas Rinkes, and Charles J. Henny. 2011. “Ecological Influence and Pathways of Land Use in Sagebrush,” in Greater Sage-Grouse: Ecology and Conservation of a Landscape Species and Its Habitats, edited by Steven T. Knick and John W. Connelly, pp. 203–251. Berkeley, CA: University of California Press.
Martini, Jay, Wildlife Biologist, U.S. Fish and Wildlife Service, Utah Ecological Services Field Office. Personal communication, February 24, 2015.
Messmer, Terry A., Professor, Utah State University, Department of Wildland Resources. Personal communication, July 9 and 12, 2015.
Miller, Richard F., Steven T. Knick, David A. Pyke, Cara W. Meinke, Steven E. Hanser, Michael J. Wisdom, and Ann L. Hild. 2011. “Characteristics of Sagebrush Habitats and Limitations to Long-Term Conservation,” in Greater Sage-Grouse: Ecology and Conservation of a Landscape Species
A N A L Y S I S O F C U R R E N T A C T I V I T I E S I N G R E A T E R S A G E - G R O U S E H A B I T A T I N U T A H
68 B U R E A U O F E C O N O M I C A N D B U S I N E S S R E S E A R C H
and Its Habitats, edited by Steven T. Knick and John W. Connelly, pp. 145–184. Berkeley, CA: University of California Press.
National Marine Fisheries Service. 1999. “Endangered and Threatened Wildlife and Plants; Defini-tion of ‘Harm’,” Federal Register 64:60727–60731, November 8, 1999. www.fws.gov/ endangered/esa-library/pdf/f991108.pdf.
Reese, Kerry P., and John W. Connelly. 2011. “Harvest Management for Greater Sage-Grouse,” in Greater Sage-Grouse: Ecology and Conservation of a Landscape Species and Its Habitats, edited by Ste-ven T. Knick and John W. Connelly, pp. 101–111. Berkeley, CA: University of California Press.
Sanders, Marren. 2007. Implementing the Federal Endangered Species Act in Indian Country, Joint Occasional Papers on Native Affairs: Native Nations Institute for Leadership, Management and Policy and the Harvard Project on American Indian Economic Development. nni.arizona.edu/ resources/pubs/jopna%202007_01_endangered.pdf.
Sheehan, Greg, Director, Utah Division of Wildlife Resources, panelist at Utah’s Sage-Grouse Summit, February 19, 2014, Salt Lake City.
U.S. District Court for the District of Columbia. 2011. WildEarth Guardians v. Salazar: Stipulated Set-tlement Agreement May 10, 2011. Case 1:10-mc-00377-EGS in Endangered Species Act Section 4 Deadline Litigation. ecf.dcd.uscourts.gov/doc1/04513401230.
U.S. Fish and Wildlife Service. 2010. “Endangered and Threatened Wildlife and Plants; 12-Month Findings for Petitions to List the Greater Sage-Grouse (Centrocercus urophasianus) as Threat-ened or Endangered,” Federal Register 75:13910–14014, March 23, 2010. www.gpo.gov/ fdsys/pkg/FR-2010-03-23/pdf/2010-5132.pdf.
——. 2013a. 2011 National Survey of Fishing, Hunting, and Wildlife-Associated Recreation. U.S. Department of the Interior. www.census.gov/prod/2012pubs/fhw11-nat.pdf.
——. 2013b. Greater Sage-grouse (Centrocercus urophasianus) Conservation Objectives: Final Report. www.fws.gov/mountain-prairie/pressrel/2013/03252013_COT.html.
——. 2014a. “Endangered and Threatened Wildlife and Plants; Review of Native Species That Are Candidates for Listing as Threatened or Endangered,” Federal Register 79:72450–72497, De-cember 5, 2014. www.gpo.gov/fdsys/pkg/FR-2014-12-05/pdf/2014-28536.pdf.
——. 2014b. “Endangered and Threatened Wildlife and Plants; Threatened Status for Gunnison Sage-Grouse,” Federal Register 79:69192–69310, November 20, 2014. www.gpo.gov/fdsys/ pkg/FR-2014-11-20/pdf/2014-27109.pdf.
Utah Automated Geographic Reference Center. 2015. Road centerlines. April 1, 2015. gis.utah.gov/ data/sgid-transportation/roads-system.
Utah Division of Wildlife Resources. 2002. Strategic Management Plan for Sage-Grouse; wildlife.utah.gov/ uplandgame/pdf/2002manplan.pdf.
——. 2009. Utah Greater Sage-Grouse Management Plan; wildlife.utah.gov/uplandgame/sage-grouse/ pdf/management_plan_2009.pdf.
——. 2013. Conservation Plan for Greater Sage-Grouse in Utah; wildlife.utah.gov/uplandgame/sage-grouse/pdf/greater_sage_grouse_plan.pdf.
——. 2014. Greater sage-grouse occupied leks; dwrcdc.nr.utah.gov/ucdc/downloadgis/disclaim.htm. Utah State Tax Commission. 2014a. Off-Road Registrations by County and Vehicle Type. Economic and
Statistical Unit. tax.utah.gov/econstats/mv/registrations-2010. ——. 2014b. Utah Property Tax 2013 Annual Statistical Report; propertytax.utah.gov. Utah State University Extension. 2011. Sage-Grouse Habitat in Utah: A Guide for Landowners and Manag-
ers, Utah Sage-grouse Community Based Conservation Program; utahcbcp.org/files/ uploads/LandownerGuideSageGrouse.pdf.
Vanden Berg, Michael D., 2008, Basin-Wide Evaluation of the Uppermost Green River Formation’s Oil-Shale Re-source, Uinta Basin, Utah and Colorado. Utah Geological Survey Special Study 128.
A N A L Y S I S O F C U R R E N T A C T I V I T I E S I N G R E A T E R S A G E - G R O U S E H A B I T A T I N U T A H
B U R E A U O F E C O N O M I C A N D B U S I N E S S R E S E A R C H 69
White, Eric M., Darren B. Goodding, Daniel J. Stynes. 2013. Estimation of National Forest Visitor Spending Averages from National Visitor Use Monitoring: Round 2. U.S. Forest Service. www.fs.fed.us/pnw/pubs/pnw_gtr883.pdf