Embed Size (px)
Citation preview
Inventory control strategies for steel industry supply chain.
BASYOUNI, Ahmed Mostafa.
Available from Sheffield Hallam University Research Archive (SHURA) at:
http://shura.shu.ac.uk/23503/
This document is the author deposited version. You are advised to consult the publisher's version if you wish to cite from it.
Published version
BASYOUNI, Ahmed Mostafa. (2001). Inventory control strategies for steel industry supply chain. Masters, Sheffield Hallam University (United Kingdom)..
Copyright and re-use policy
See http://shura.shu.ac.uk/information.html
Sheffield Hallam University Research Archivehttp://shura.shu.ac.uk

REFERENCE
Fines are charged at 50p per
2 9 JUN 200?

ProQuest Number: 10760400
All rights reserved
INFORMATION TO ALL USERS The quality of this reproduction is dependent upon the quality of the copy submitted.
In the unlikely event that the author did not send a com plete manuscript and there are missing pages, these will be noted. Also, if material had to be removed,
a note will indicate the deletion.
uestProQuest 10760400
Published by ProQuest LLC(2018). Copyright of the Dissertation is held by the Author.
All rights reserved.This work is protected against unauthorized copying under Title 17, United States Code
Microform Edition © ProQuest LLC.
ProQuest LLC.789 East Eisenhower Parkway
P.O. Box 1346 Ann Arbor, Ml 48106- 1346
Inventory Control Strategies for Steel Industry Supply Chain
Ahmed Mostafa Basyouni
A thesis submitted in partial fulfilment of the requirement of Sheffield Hallam University for the degree of
Master of Philosophy
September 2001
'Inventory Control Strategies for Steel Industry Supply Chain*.
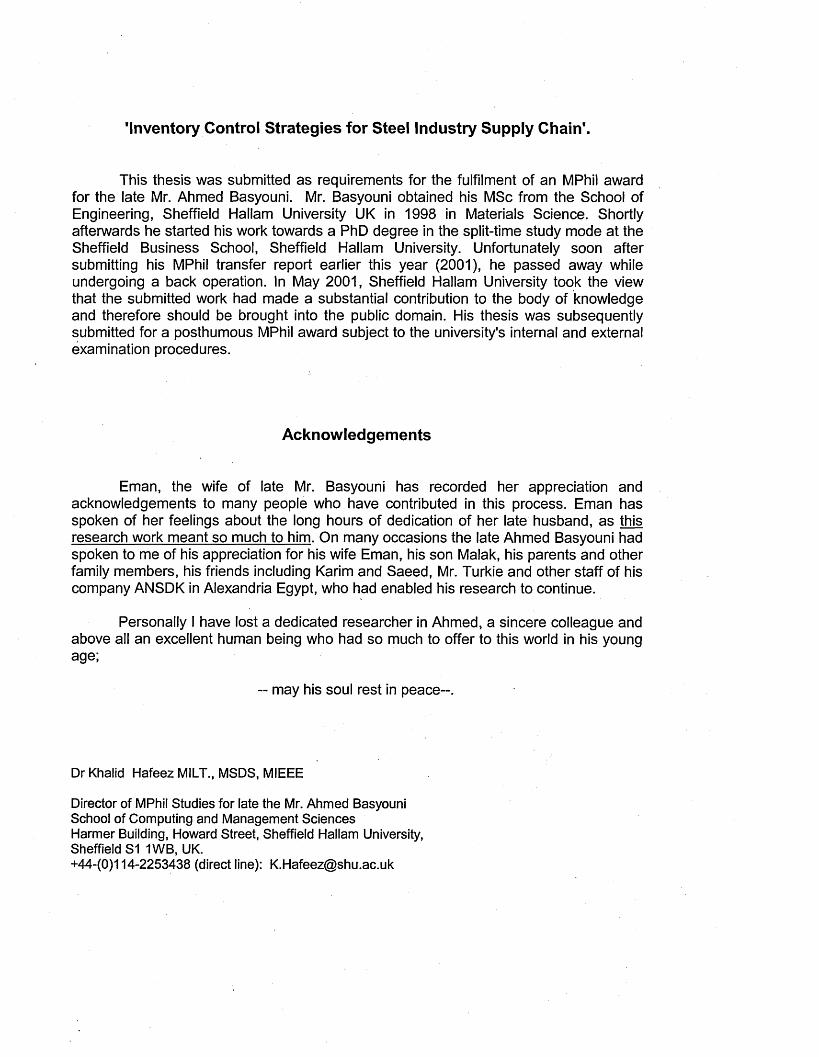
This thesis was submitted as requirements for the fulfilment of an MPhil award for the late Mr. Ahmed Basyouni. Mr. Basyouni obtained his MSc from the School of Engineering, Sheffield Hallam University UK in 1998 in Materials Science. Shortly afterwards he started his work towards a PhD degree in the split-time study mode at the Sheffield Business School, Sheffield Hallam University. Unfortunately soon after submitting his MPhil transfer report earlier this year (2001), he passed away while undergoing a back operation. In May 2001, Sheffield Hallam University took the view that the submitted work had made a substantial contribution to the body of knowledge and therefore should be brought into the public domain. His thesis was subsequently submitted for a posthumous MPhil award subject to the university's internal and external examination procedures.
Acknowledgements
Eman, the wife of late Mr. Basyouni has recorded her appreciation and acknowledgements to many people who have contributed in this process. Eman has spoken of her feelings about the long hours of dedication of her late husband, as this research work meant so much to him. On many occasions the late Ahmed Basyouni had spoken to me of his appreciation for his wife Eman, his son Malak, his parents and other family members, his friends including Karim and Saeed, Mr. Turkie and other staff of his company ANSDK in Alexandria Egypt, who had enabled his research to continue.
Personally I have lost a dedicated researcher in Ahmed, a sincere colleague and above all an excellent human being who had so much to offer to this world in his young age;
-- may his soul rest in peace--.
Dr Khalid Hafeez MILT., MSDS, MIEEE
Director of MPhil Studies for late the Mr. Ahmed Basyouni School of Computing and Management Sciences Harmer Building, Howard Street, Sheffield Hallam University, Sheffield S1 1WB, UK.+44-(0)114-2253438 (direct line): [email protected]
Table of Contents
1. AIMS AND OBJECTIVES 1
1.1 Aims 1
1.2 Objectives 2
1.3 Research Methodology 2
2. LITERATURE REVIEW 4
2.1 Re-bars world steel Market 4
2.2 Middle East steel Market 5
2.3 The Egyptian Re-bar Market 6
2.4 Discussion 9
2.5 Inventory Management 92.5.1 Types of inventory. 92.5.2 Inventory cost 102.5.3 Inventories in business organizations 102.5.4 What has to be monitored and measured? 132.5.5 Spare parts inventory 142.5.6 Discussion 17
2.6 Supply chain management 182.6.1 Supply chain definitions 182.6.2 The seven principles of supply chain management 192.6.3 Some methodologies for investigating supply chain 202.6.4 Discussion 25
3. CASE STUDY 25
3.1 ANSDK Company Profile 25
3.2 Material Flow Diagram of ANSDK Supply Chain 30
3.3 Information Flow Model of Supply Chain of ANSDK 31
3.4 Input-Output Analysis of ANSDK 32
3.5 Process Chart of ANSDK 34
3.6 ANSDK Inventories 383.6.1 Spare parts inventory 40
3.7 ANSDKValue Add 42
3.8 Spread Sheet Model of ANSDK 47
4. CONCLUSION 49
5. MPhil CONTRIBUTION 50
6. Ph.DWORK 51
1. AIMS AND OBJECTIVES
1.1 Aims
Slack (1998) defined inventory, or “stock”, as the stored accumulation of material
resources in a transformation system. In many industries such as steel, value of
inventory is relatively small compared to the costs of the total inputs to the operation.
In ANSDK (our case study) the situation is different where the inventory value is so
high comparing with the total cost of the inputs (as it will shown in 3.8). The project
target to decrease this value as much as possible to improve the company performance.
The supply chain to be investigated the supply reinforced steel bars to the construction
industry. The end customer in the chain is usually a project management team, which
comprises clients, consultant and contractors. The stockholders buy and stock large
quantities. The behavior of the stockholding echelon causes rapid changes in the
demand inflicted on the other members of the chain. The steel market is speculative
and it is believed that the demand for construction products depends not only on the
customer/contractor but also on other factors such as raw material, interest rates and
delivery times. The reinforcement industry is recently been changing its order policy
resulting in more unpredictable behavior. The reason is that stockholder target levels
have been lowered due to economic changes affecting their business environment. As
there is a natural tendency to minimize “buffer” or “safety” inventory in a recession the
risk of running out of the stock increase.
The maintenance (repair/rework) environment in a company is usually characterized
by stochastic demand, stochastic lead-time, and multi-item inventories. Consequently
many current methods for determining optional stocking quantities are based on the
assumption that parameters are known deterministically. Although sensitivity analysis
has been performed on inventory models in stochastic environments, there is need to
adequately address the effectiveness and sensitivity of various inventory models and
related parameters to redesign inventory control strategies for spare-parts.
1
1.2 Objectives
Phase I (Mphil)
• To review supply chain modeling methodology in the steel industry, especially the
spare parts inventory.control system
• To conduct a case study using a number of system dynamics techniques such as
system input-output analysis, flow charting, and material & information flow
analysis.
• To establish value added and non-value added analysis of the case study company
by taking into account relevant labour, machining and energy consumption costs.
• To develop a spread-sheet model to be utilised as a static benchmarking tool by the
management.
Phase II
• To develop conceptual and analytical models for inventory control strategies
• To confirm the validity of proposed models via statistical/computer simulation
analysis and to compare the operational performance of various plants.
• To suggest the dynamic behaviour of the steel industry spare parts supply chain and
re-engineering strategies (e.g. how to move more rapidly towards a Minimum
Reasonable Inventory (MRI) scenario in the presence of capacity constraints,
breakdowns and material supply lead-time bottlenecks).
1.3 Research Methodology
The research work is conducted by adopting system dynamics framework described by
Hafeez et al.(\996) and illustrated in Figure 1.1 It has been successfully used for
modeling and analysing a number of supply chains. Essentially the framework consists
of two overlapping phases, namely qualitative and quantitative. The qualitative phase
is related to acquiring sufficient intuitive and conceptual knowledge to understand the
structure of inventory control strategies whereas the quantitative phase is associated
with the development and analysis of simulation model. The main stages involved in
qualitative phase are system input-output analysis, conceptual modeling, and block
diagram formulation. The first step towards the quantitative model building is to,
2
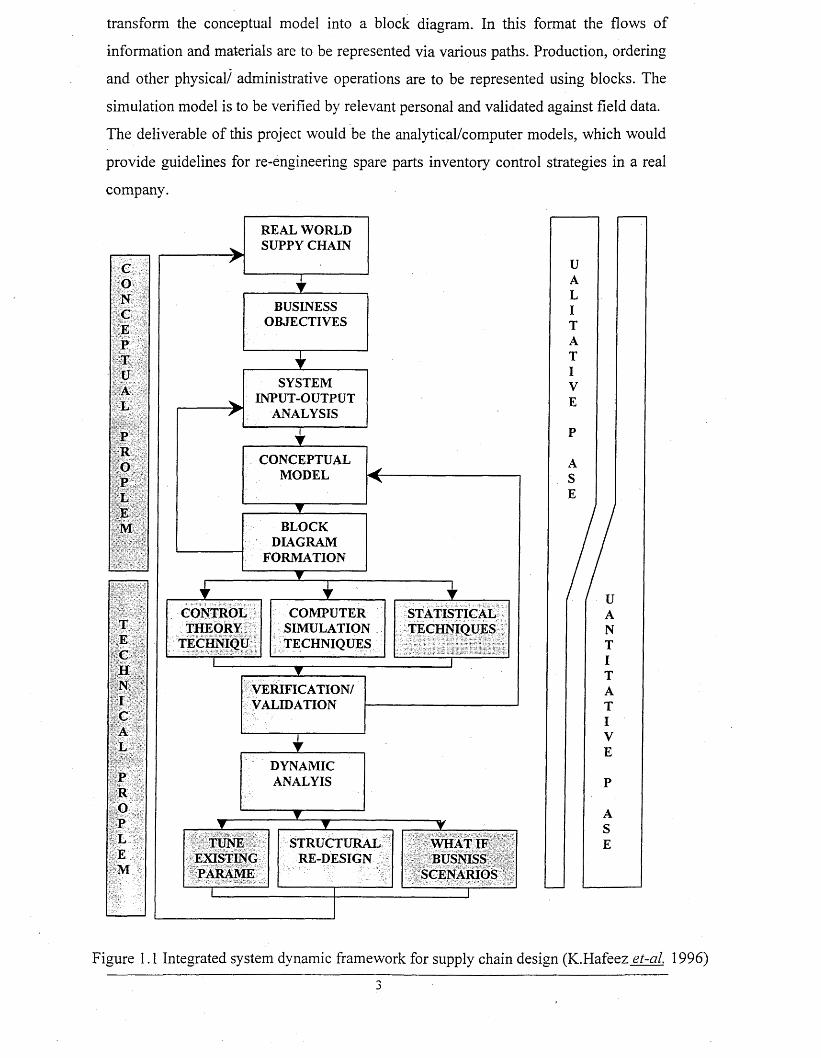
transform the conceptual model into a block diagram. In this format the flows of
information and materials are to be represented via various paths. Production, ordering
and other physical/ administrative operations are to be represented using blocks. The
simulation model is to be verified by relevant personal and validated against field data.
The deliverable of this project would be the analytical/computer models, which would
provide guidelines for re-engineering spare parts inventory control strategies in a real
company.
TUNEEXISTINGPARAME
CONTROLTHEORY
TECHNIQU
COMPUTERSIMULATIONTECHNIQUES
STATISTICALTECHNIQUES
WHAT IF BUSNISS
SCENARIOS
STRUCTURALRE-DESIGN
BUSINESSOBJECTIVES
SYSTEMINPUT-OUTPUT
ANALYSIS
VERIFICATION/VALIDATION
CONCEPTUALMODEL
REAL WORLD SUPPY CHAIN
DYNAMICANALYIS
BLOCKDIAGRAM
FORMATION
C
UALITATIVE
ASE
Figure 1.1 Integrated system dynamic framework for supply chain design (JC.Hafeez et-al 1996)
2. LITERATURE REVIEW
2.1 Re-Bars World Steel Market
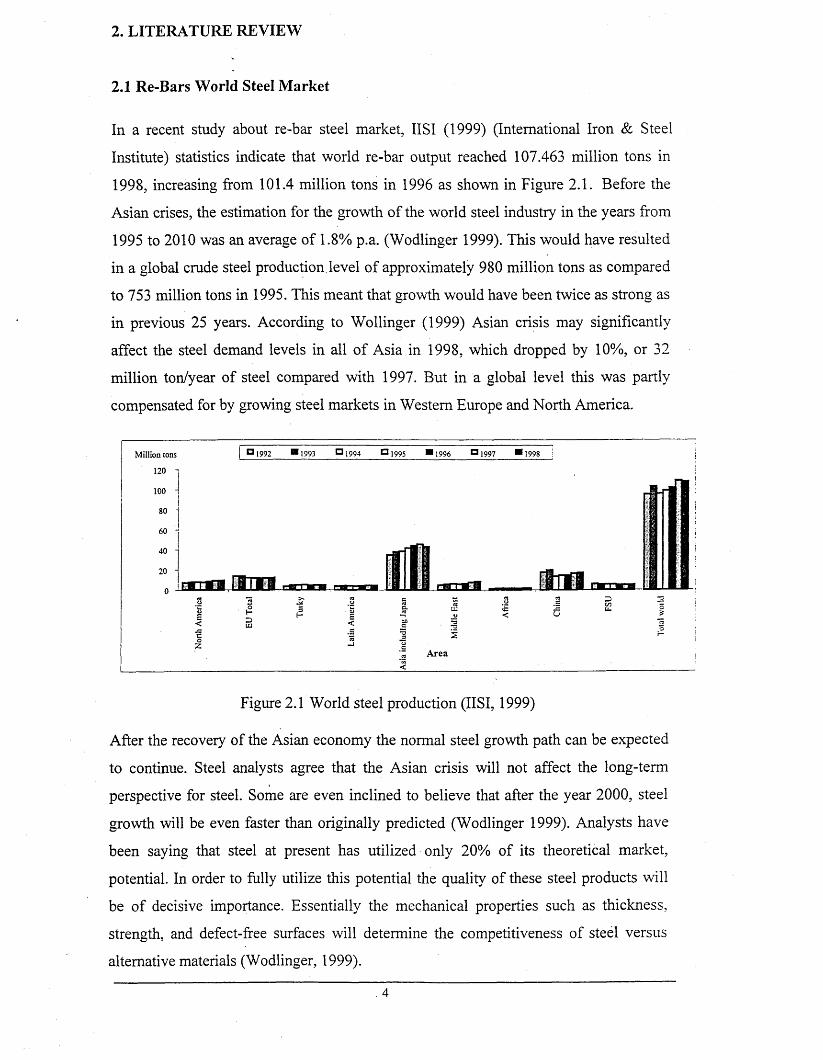
In a recent study about re-bar steel market, IISI (1999) (International Iron & Steel
Institute) statistics indicate that world re-bar output reached 107.463 million tons in
1998, increasing from 101.4 million tons in 1996 as shown in Figure 2.1. Before the
Asian crises, the estimation for the growth of the world steel industry in the years from
1995 to 2010 was an average of 1.8% p.a. (Wodlinger 1999). This would have resulted
in a global crude steel production level of approximately 980 million tons as compared
to 753 million tons in 1995. This meant that growth would have been twice as strong as
in previous 25 years. According to Wollinger (1999) Asian crisis may significantly
affect the steel demand levels in all of Asia in 1998, which dropped by 10%, or 32
million ton/year of steel compared with 1997. But in a global level this was partly
compensated for by growing steel markets in Western Europe and North America.
Million tons
120 -
100 -
I80 H
60
40
20
o -1-1
n 1994 0 1995 11996 □ 1997
rH T P rrn-rma
Area
Figure 2.1 World steel production (IISI, 1999)
After the recovery of the Asian economy the normal steel growth path can be expected
to continue. Steel analysts agree that the Asian crisis will not affect the long-term
perspective for steel. Some are even inclined to believe that after the year 2000, steel
growth will be even faster than originally predicted (Wodlinger 1999). Analysts have
been saying that steel at present has utilized only 20% of its theoretical market,
potential. In order to fully utilize this potential the quality of these steel products will
be of decisive importance. Essentially the mechanical properties such as thickness,
strength, and defect-free surfaces will determine the competitiveness of steel versus
alternative materials (Wodlinger, 1999).
4

M i lion tonsHWorld'Apparent Steel Consumption (M illion tons )
□ World Crude Steel Production (M illion tons )
! 900
800 -
1998 1999 2000 2005
Years
Figure 2.2 Estimated world steel consumption and production till year 2010(Wodlinger, 1999)
2.2 Middle East Steel Market
« - *
Buxton (1999) reported that the Middle East, re-bar production reached 8.11 million
tons in 1998 compared to 6.4 million tons in 1996.This increased was largely driven by
Egypt, where the Egyptian production increased by 1.6 million tons during the last two
years (See Figure 2.3). Lachgar (1999) has pointed out that, up to 1997 there was a
boom in the Middle East production, doubling the output 1991 to 1997. The Middle
East market was considered one of the most expanding markets for steel production, an
industry evolved to replace imports.
thousand tons
8500 -|
8000 j
7500 j
7000 -j
6500 J
6000 !
5500
5000
4500
4000
1992 1993 1994 1995 1996Years
1997 1998
Figure 2.3 Middle East re-bar production volume (Buxton 1999)
5
thousand tons
Saudi Arbia UAEJordan
Country
Figure 2.4 The biggest re-bar producer in the Middle East (Lachgar 1999)
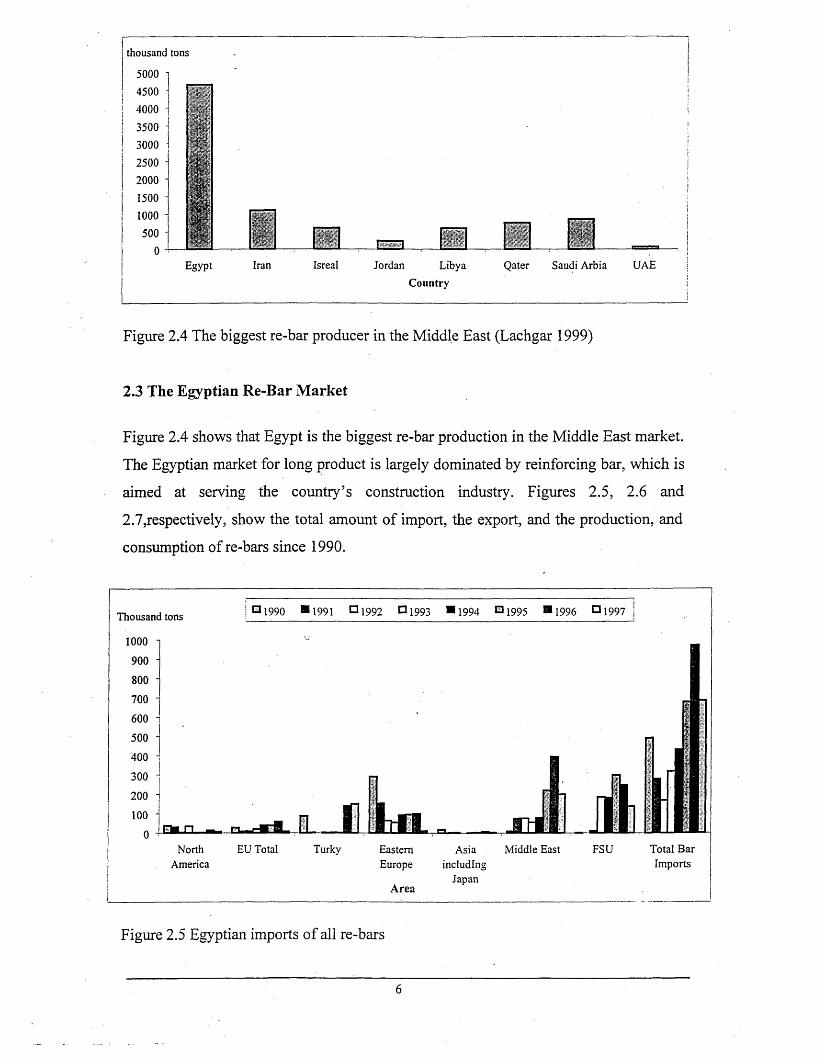
2.3 The Egyptian Re-Bar Market
Figure 2.4 shows that Egypt is the biggest re-bar production in the Middle East market.
The Egyptian market for long product is largely dominated by reinforcing bar, which is
aimed at serving the country’s construction industry. Figures 2.5, 2.6 and
2.7,respectively, show the total amount of import, the export, and the production, and
consumption of re-bars since 1990.
Thousand tons
North EU Total Turky Eastern Asia Middle East FSU Total BarAmerica Europe including Imports
JapanArea
Figure 2.5 Egyptian imports of all re-bars
6
Thousand tons 250 i
200 -s
150 J|
100 I
50 '
0
131990 H 1991 □ 1992 0 1 9 9 3 ■ 1994 131995 ® 1996 3 1997 * 1 9 9 8
Total EU Africa Middle EeastArea
jzi —
Total Others Total Bar Exports
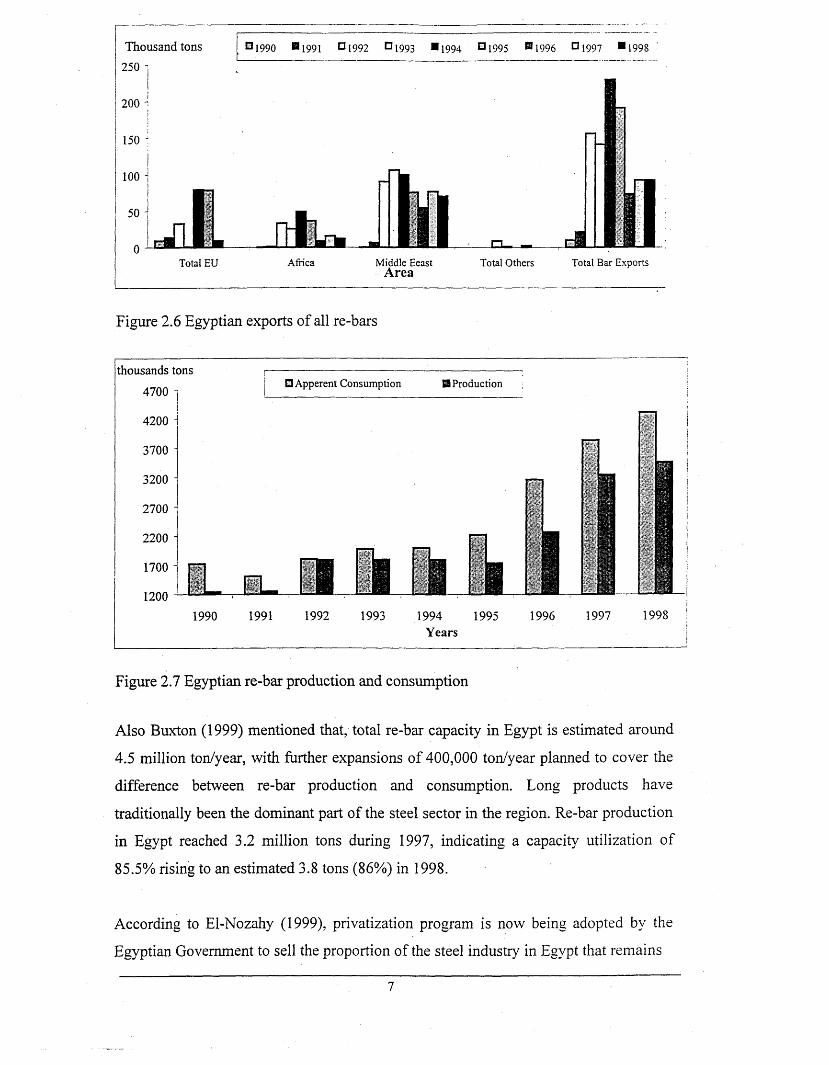
Figure 2.6 Egyptian exports of all re-bars
thousands tons
4700 -
4200 -
3700 -
3200 -
2700 -
2200 *
1700 -
1200 -
[Hf
1990
O Apperent Consumption I Production
1991 1992 1993 1994 1995 1996 1997Years
1998
Figure 2.7 Egyptian re-bar production and consumption
Also Buxton (1999) mentioned that, total re-bar capacity in Egypt is estimated around
4.5 million ton/year, with further expansions of 400,000 ton/year planned to cover the
difference between re-bar production and consumption. Long products have
traditionally been the dominant part of the steel sector in the region. Re-bar production
in Egypt reached 3.2 million tons during 1997, indicating a capacity utilization of
85.5% rising to an estimated 3.8 tons (86%) in 1998.
According to El-Nozahy (1999), privatization program is now being adopted by the
Egyptian Government to sell the proportion of the steel industry in Egypt that remains
7
under the control of HCMI (the state Holding Company Metallurgical Industries). The
Egyptian industry has two main integrated steel producers, one is public and the other
is private sector, there is semi-integrated public sector incorporating three mini- mills
of different sizes, and also a number of independent private sector re-rollers located
throughout the country.
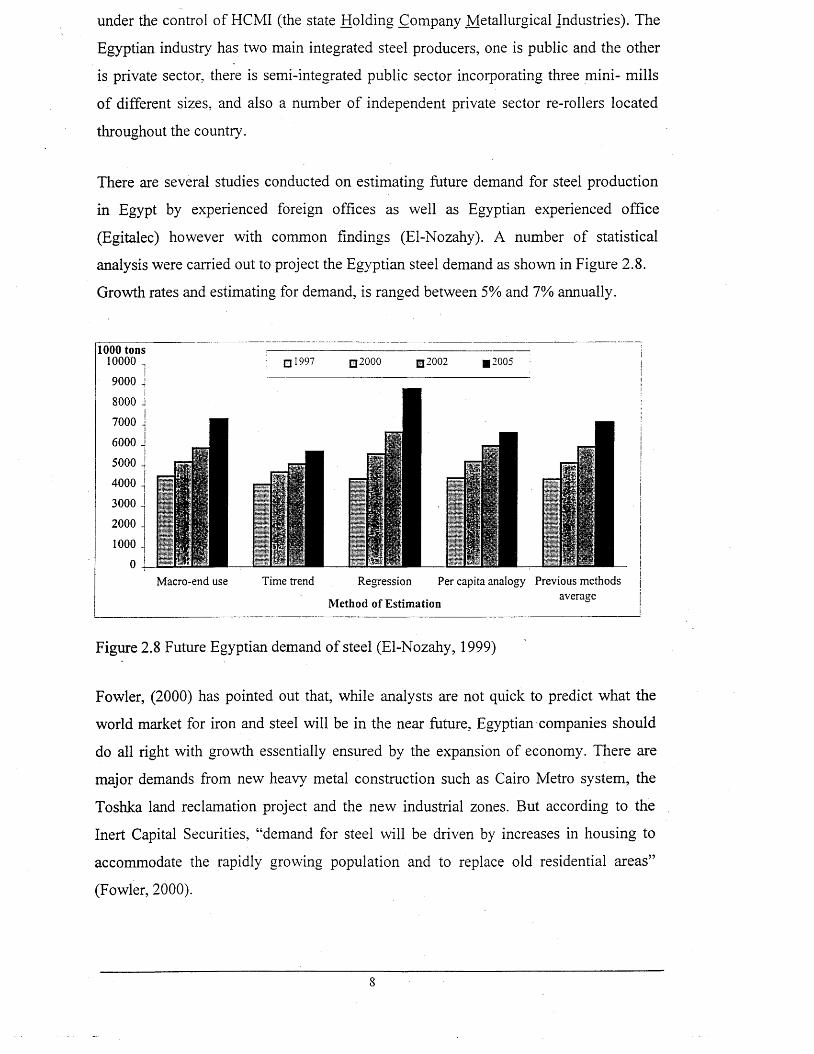
There are several studies conducted on estimating future demand for steel production
in Egypt by experienced foreign offices as well as Egyptian experienced office
(Egitalec) however with common findings (El-Nozahy). A number of statistical
analysis were carried out to project the Egyptian steel demand as shown in Figure 2.8.
Growth rates and estimating for demand, is ranged between 5% and 7% annually.
1000 tons10000 _ □ 1997 □ 2000 □ 2002 12005
6000 .
5000 -
Macro-end use Time trend Regression
Method of Estimation
Per capita analogy Previous methods average
Figure 2.8 Future Egyptian demand of steel (El-Nozahy, 1999)
Fowler, (2000) has pointed out that, while analysts are not quick to predict what the
world market for iron and steel will be in the near future, Egyptian companies should
do all right with growth essentially ensured by the expansion of economy. There are
major demands from new heavy metal construction such as Cairo Metro system, the
Toshka land reclamation project and the new industrial zones. But according to the
Inert Capital Securities, “demand for steel will be driven by increases in housing to
accommodate the rapidly growing population and to replace old residential areas”
(Fowler, 2000).
8
2.4 Discussion
From the world, Middle East, and Egyptian steel market survey, it is clear that there is
severe worldwide competition. In-spite of a negative gap between Egyptian re-bar
production and consumption, we see that the world wide steel production is more than
consumption (see Figure 2.2) which would create a severe competition even in
Egyptian market. Customer satisfaction has become a crucial factor for a company
faced with this worldwide competition. The best way to increase market share is to
offer low cost, high quality products. Supply chain management can be one way of
achieving these performance criteria.
2.5 Inventory Management
Slack (1998) defined inventory, or “stock”, as the stored accumulation of material
resources in a transformation system. In many industries such as steel, value of
' inventory is relatively small compared to the costs of the total inputs to the operation.
In others, for example automotive industry, it will be far high compared to its day-to-
day expenditure on such things as labour, rent and running costs.
2.5.1 Type of inventory
Slack (1998) classified inventories under the following categories:
• Buffer inventory is also called safety inventory, its purpose is to compensate for the
uncertainties inherent in supply and demand.
• Cycle inventory, it occurs because one or more stages in the operation cannot
supply all the items it produces simultaneously.
• Anticipation inventory, it was used to compensate for the differences in the timing
of supply and demand
• Pipe line inventory, it exists because materials cannot be transported
instantaneously between the point of supply and the point of demand.
Also he categorized inventories regarding storage as follows:-
• Raw materials,
• In-process stock,
• Finished products,
• General stores, and
• Spare parts.
9
2.5.2 Inventory cost
Waters (1992) mentioned that most organizations view stock as a strategy to smooth
out business. The strategic issue is how to minimize the stock cost and increase the
customer services. Traditionally, companies satisfy their customer’s demands through
building up high stock levels. Such strategy has an advantage of quick response to the
customer orders. On the other hand, it has an obvious disadvantage of having money
tide up in stock. If the stock is not managed properly, the costs can become excessive
and can reduce the ability of the organization to gain a competitive advantage in the
market place. Holding excessive inventory implies high investment and drains more,
cash. Also, low stocks leads to other implications - that is shortage, which can have
high costs including the cost of losing the business. Waters classifies holding cost as
follows:-
• Unit cost: is the price charged by the suppliers for one unit of an item, or the cost
to the organization of acquiring one item.
• Re-order cost: is the total cost involved in placing a repeated order for the time.
Each stage of order cycle carries fixed and variable cost component.
• Holding costs: is the cost of holding one unit of an item in stock for a period of
time.
• Shortage cost: is the cost of loss of business.
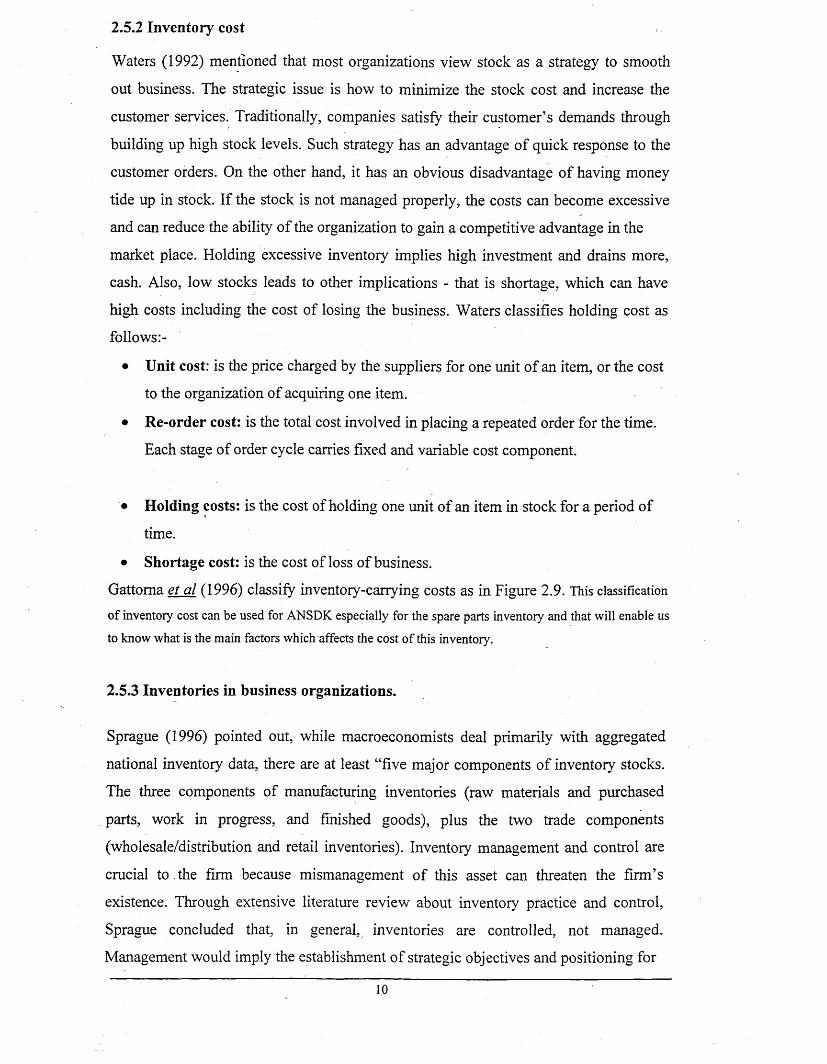
Gattoma et al (1996) classify inventory-carrying costs as in Figure 2.9. This classification
of inventory cost can be used for ANSDK especially for the spare parts inventory and that will enable us
to know what is the main factors which affects the cost of this inventory.
2.5.3 Inventories in business organizations.
Sprague (1996) pointed out, while macroeconomists deal primarily with aggregated
national inventory data, there are at least “five major components of inventory stocks.
The three components of manufacturing inventories (raw materials and purchased
parts, work in progress, and finished goods), plus the two trade components
(wholesale/distribution and retail inventories). Inventory management and control are
crucial to the firm because mismanagement of this asset can threaten the firm’s
existence. Through extensive literature review about inventory practice and control,
Sprague concluded that, in general, inventories are controlled, not managed.
Management would imply the establishment of strategic objectives and positioning for
10
inventories. Control is the detailed set of activities surrounding the order practices of
individual inventories items. So, if inventories are not managed at the strategic level
within the firm, how are they planned and controlled? Throughout the inventory chain
- raw materials and purchased parts to WIP to finished goods to distribution to retail.
Inventories are planned and controlled item by item. For each item in an inventory, two
questions must be answered again and again.
• How much should be ordered?
• When should it be ordered?
A medium-sized firm will typically have hundreds to several thousands of individual
inventory items. The answers of the above two questions are determined every day for
all of these items. The firm’s inventory level is the aggregated result of these individual
decisions made on the thousands of single items. Inventory planning systems at a firm
are comprised of procedures intended to help answer the two questions, how much?
And when? By using standard computer-based production-inventory control software
package, like EOQ/R, MRP, and JIT systems. Small (1998) mentioned that the main
goal of any warehouse should be to eliminate as much inventory as possible. A step
toward achieving that goal is to begin thinking about how to move product out the
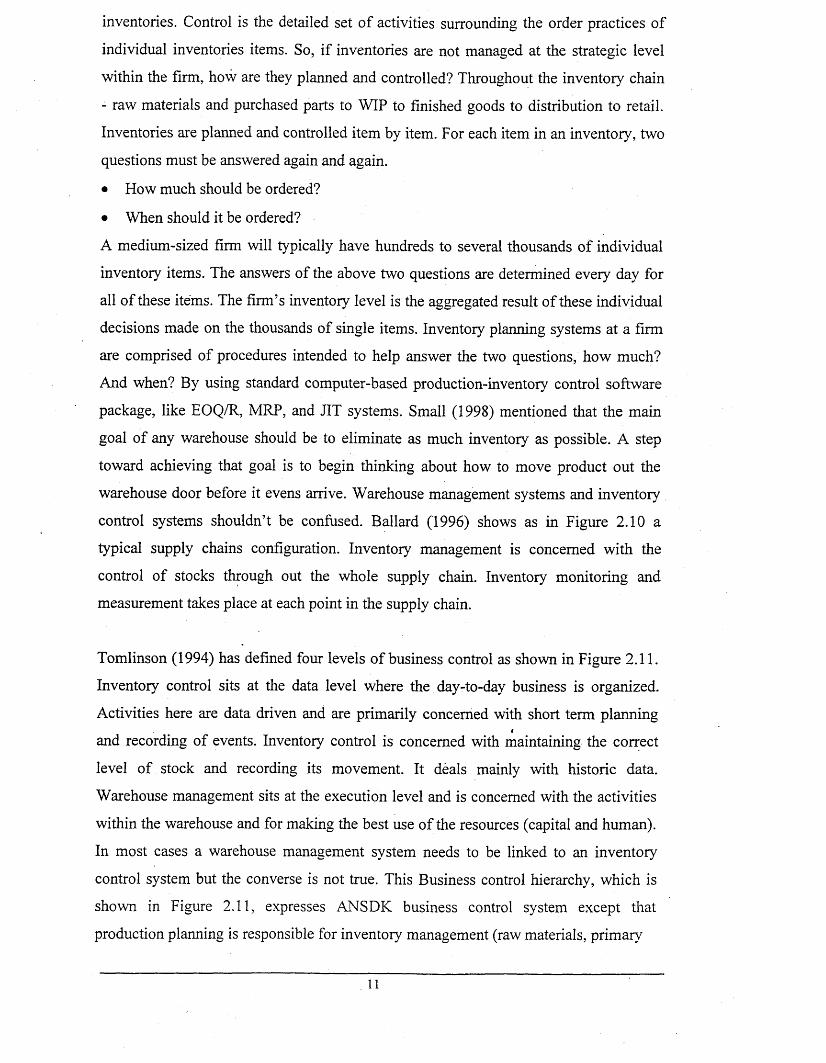
warehouse door before it evens arrive. Warehouse management systems and inventory
control systems shouldn’t be confused. Ballard (1996) shows as in Figure 2.10 a
typical supply chains configuration. Inventory management is concerned with the
control of stocks through out the whole supply chain. Inventory monitoring and
measurement takes place at each point in the supply chain.
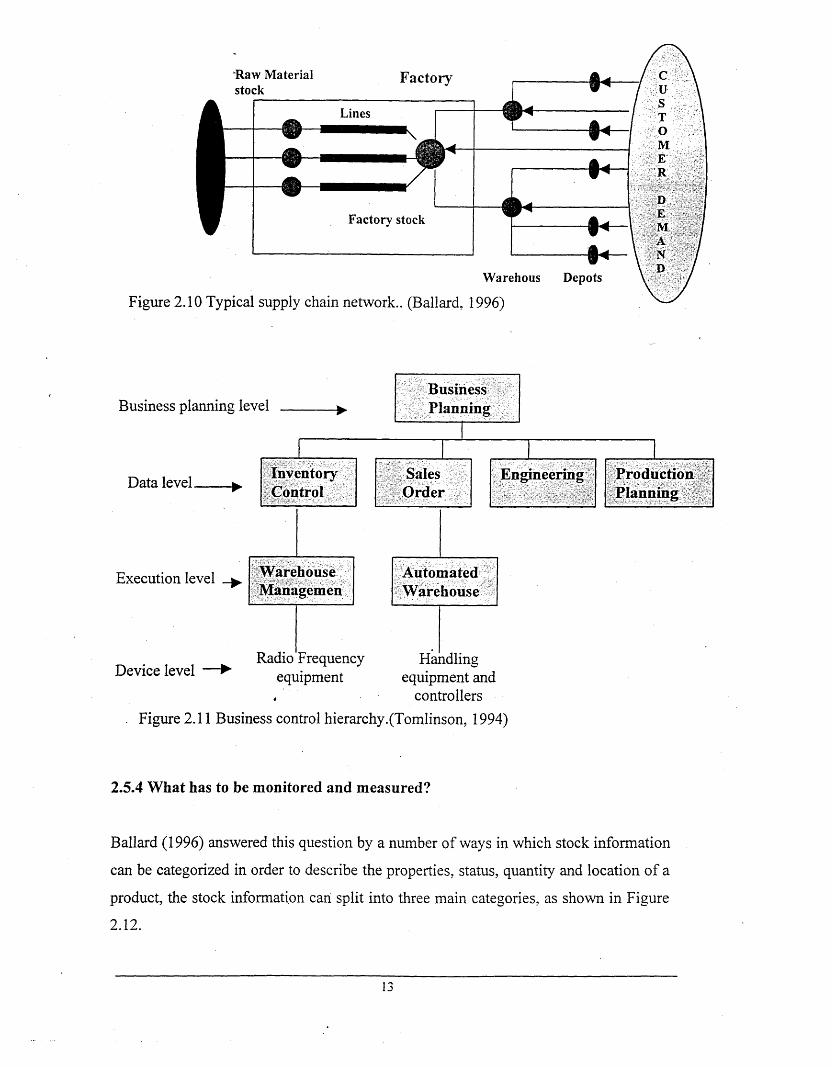
Tomlinson (1994) has defined four levels of business control as shown in Figure 2.11.
Inventory control sits at the data level where the day-to-day business is organized.
Activities here are data driven and are primarily concerned with short term planningi
and recording of events. Inventory control is concerned with maintaining the correct
level of stock and recording its movement. It deals mainly with historic data.
Warehouse management sits at the execution level and is concerned with the activities
within the warehouse and for making the best use of the resources (capital and human).
In most cases a warehouse management system needs to be linked to an inventory
control system but the converse is not true. This Business control hierarchy, which is
shown in Figure 2.11, expresses ANSDK business control system except that
production planning is responsible for inventory management (raw materials, primary
11
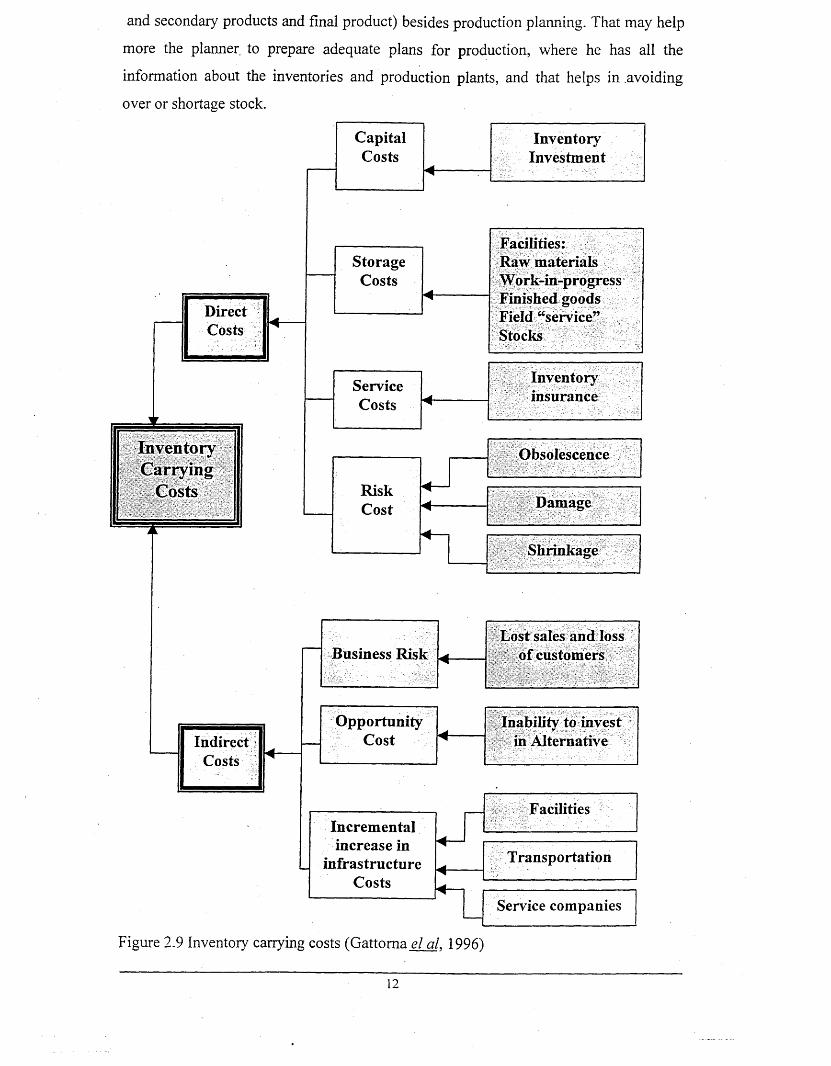
and secondary products and final product) besides production planning. That may help
more the planner to prepare adequate plans for production, where he has all the
information about the inventories and production plants, and that helps in avoiding
over or shortage stock.
ServiceCosts
Service companies
DirectCosts
IndirectCosts
StorageCosts
Obsolescence
Transportation
Shrinkage
Damage
CapitalCosts
Facilities
OpportunityCost
Business Risk
RiskCost
Inventoryinsurance
Inability to invest in Alternative
InventoryInvestment
Lost sales and loss of customers
Incremental increase in
infrastructure Costs
InventoryCarrying
Costs
Facilities:Raw materials Work-in-progress Finished goods Field “service” Stocks
Figure 2.9 Inventory carrying costs (Gattoma el ciL 1996)
12
‘Raw Material stock
Factory
Factory stock
Warehous Depots
Figure 2.10 Typical supply chain network.. (Ballard, 1996)
Business planning level
Data level.
Planning
Execution level
Device levelRadio Frequency Handling
equipment equipment andcontrollers
Figure 2.11 Business control hierarchy.(Tomlinson, 1994)
InventoryControl
SalesOrder
Engineering Production Planning
WarehouseManagemen
AutomatedWarehouse
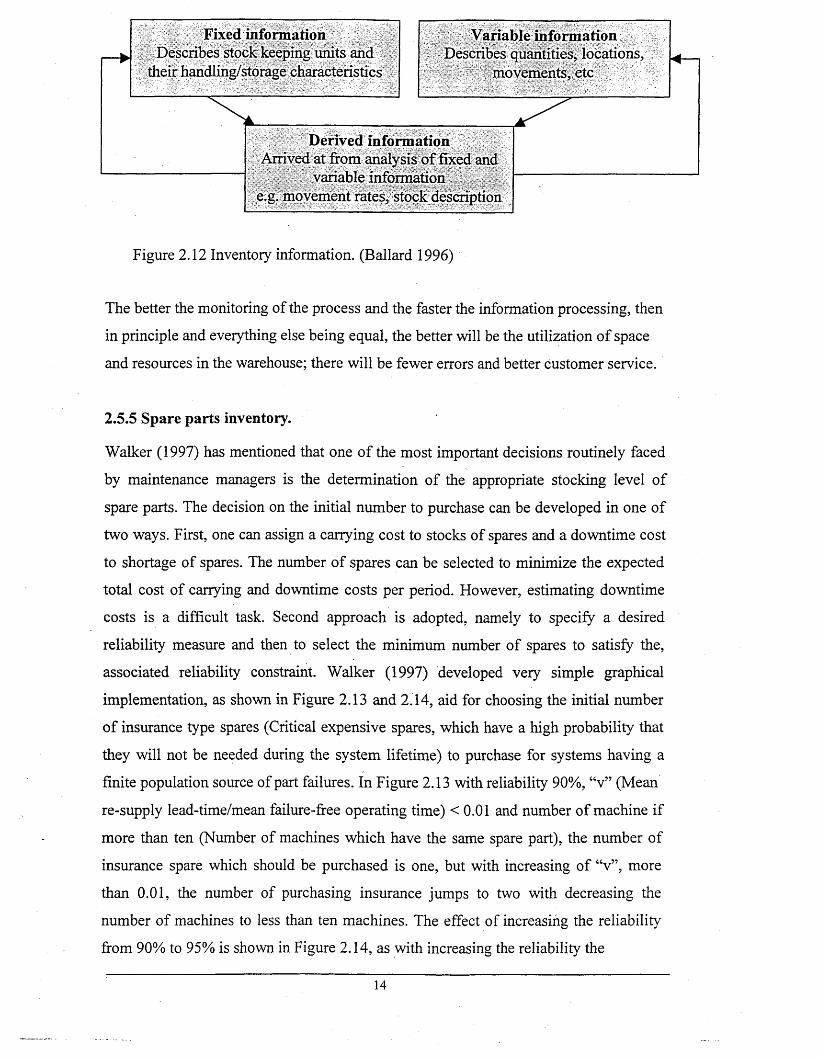
2.5.4 What has to be monitored and measured?
Ballard (1996) answered this question by a number of ways in which stock information
can be categorized in order to describe the properties, status, quantity and location of a
product, the stock information can split into three main categories, as shown in Figure
2 . 12.
13
Variable informationDescribes quantities, locations,
movements, etc
Fixed informationDescribes stock keeping units and
their handling/storage characteristics
Derived informationArrived at from analysis of fixed and
variable information e.g. movement rates, stock description
Figure 2.12 Inventory information. (Ballard 1996)
The better the monitoring of the process and the faster the information processing, then
in principle and everything else being equal, the better will be the utilization of space
and resources in the warehouse; there will be fewer errors and better customer service.
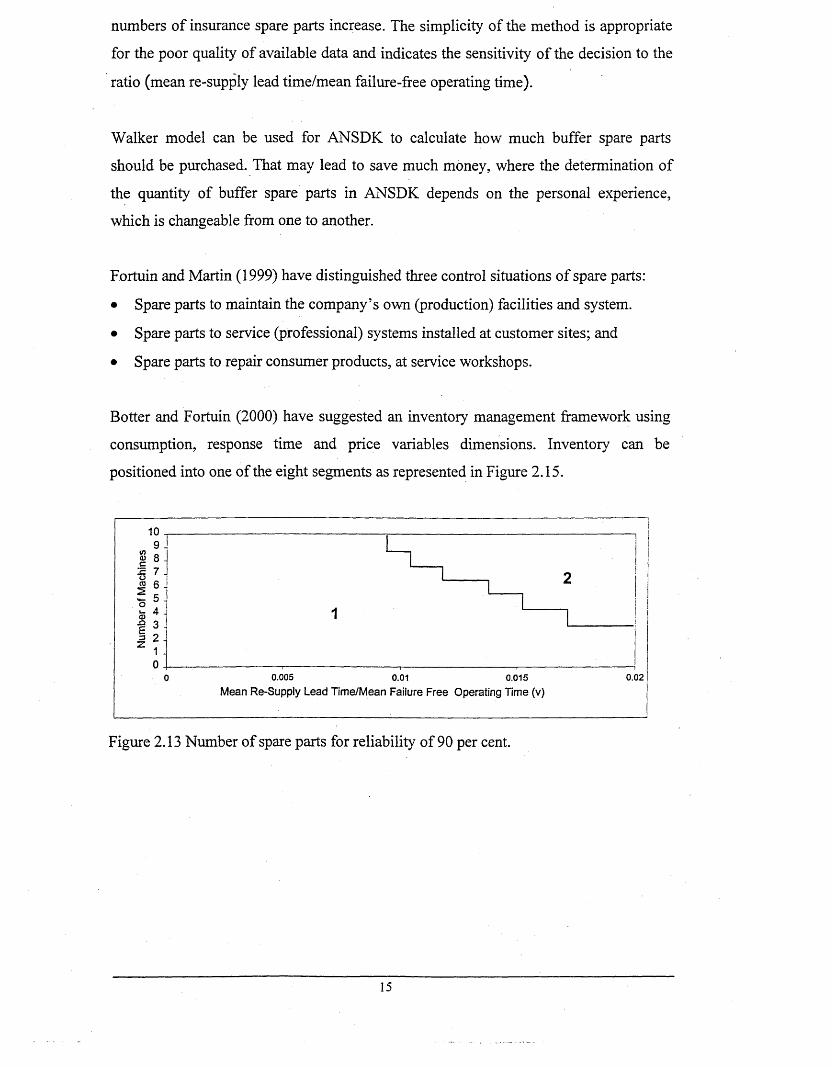
2.5.5 Spare parts inventory.
Walker (1997) has mentioned that one of the most important decisions routinely faced
by maintenance managers is the determination of the appropriate stocking level of
spare parts. The decision on the initial number to purchase can be developed in one of
two ways. First, one can assign a carrying cost to stocks of spares and a downtime cost
to shortage of spares. The number of spares can be selected to minimize the expected
total cost of carrying and downtime costs per period. However, estimating downtime
costs is a difficult task. Second approach is adopted, namely to specify a desired
reliability measure and then to select the minimum number of spares to satisfy the,
associated reliability constraint. Walker (1997) developed very simple graphical
implementation, as shown in Figure 2.13 and 2.14, aid for choosing the initial number
of insurance type spares (Critical expensive spares, which have a high probability that
they will not be needed during the system lifetime) to purchase for systems having a
finite population source of part failures. In Figure 2.13 with reliability 90%, “v” (Mean
re-supply lead-time/mean failure-free operating time) < 0.01 and number of machine if
more than ten (Number of machines which have the same spare part), the number of
insurance spare which should be purchased is one, but with increasing of “v”, more
than 0.01, the number of purchasing insurance jumps to two with decreasing the
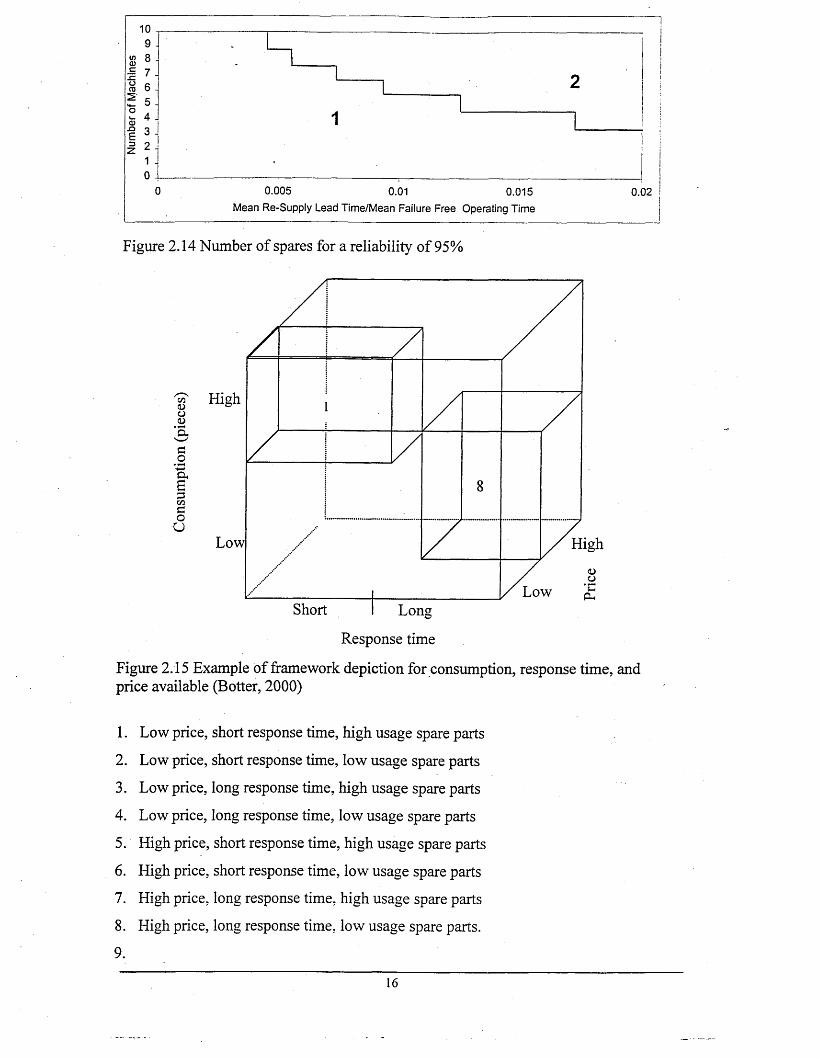
number of machines to less than ten machines. The effect of increasing the reliability
from 90% to 95% is shown in Figure 2.14, as with increasing the reliability the
14
numbers of insurance spare parts increase. The simplicity of the method is appropriate
for the poor quality of available data and indicates the sensitivity of the decision to the
ratio (mean re-supply lead time/mean failure-free operating time).
Walker model can be used for ANSDK to calculate how much buffer spare parts
should be purchased. That may lead to save much money, where the determination of
the quantity of buffer spare parts in ANSDK depends on the personal experience,
which is changeable from one to another.
Fortuin and Martin (1999) have distinguished three control situations of spare parts:
• Spare parts to maintain the company’s own (production) facilities and system.
• Spare parts to service (professional) systems installed at customer sites; and
• Spare parts to repair consumer products, at service workshops.
Botter and Fortuin (2000) have suggested an inventory management framework using
consumption, response time and price variables dimensions. Inventory can be
positioned into one of the eight segments as represented in Figure 2.15.
10 , 9 -
i/i
2
1
o - o 0.005 0.01 0.015 0.02
Mean Re-Suppiy Lead Time/Mean Failure Free Operating Time (v)
Figure 2.13 Number of spare parts for reliability of 90 per cent.
15
Mean Re-Supply Lead Time/Mean Failure Free Operating Time
Figure 2.14 Number of spares for a reliability of 95%
Highoi<DO<L>
a.2S5eoO
Low High
LowShort Long
Response time
Figure 2.15 Example of framework depiction for consumption, response time, and price available (Botter, 2000)
1. Low price, short response time, high usage spare parts
2. Low price, short response time, low usage spare parts
3. Low price, long response time, high usage spare parts
4. Low price, long response time, low usage spare parts
5. High price, short response time, high usage spare parts
6. High price, short response time, low usage spare parts
7. High price, long response time, high usage spare parts
8. High price, long response time, low usage spare parts.
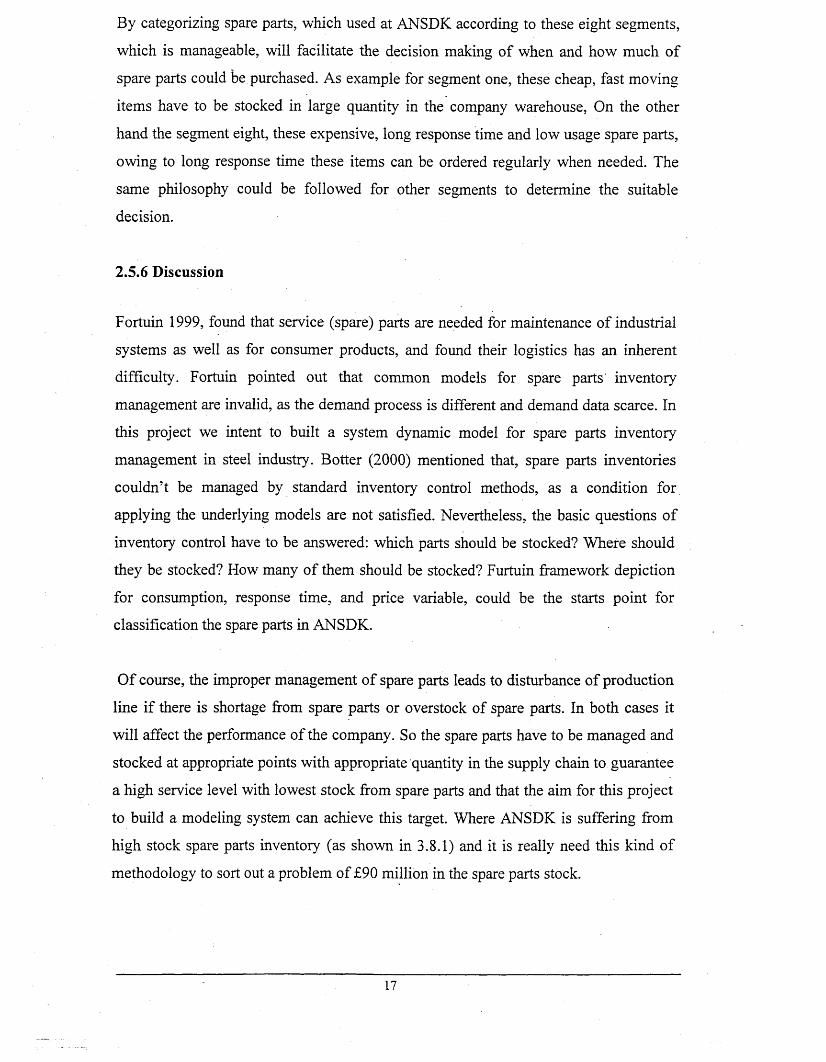
By categorizing spare parts, which used at ANSDK according to these eight segments,
which is manageable, will facilitate the decision making of when and how much of
spare parts could be purchased. As example for segment one, these cheap, fast moving
items have to be stocked in large quantity in the company warehouse, On the other
hand the segment eight, these expensive, long response time and low usage spare parts,
owing to long response time these items can be ordered regularly when needed. The
same philosophy could be followed for other segments to determine the suitable
decision.
2.5.6 Discussion
Fortuin 1999, found that service (spare) parts are needed for maintenance of industrial
systems as well as for consumer products, and found their logistics has an inherent
difficulty. Fortuin pointed out that common models for spare parts inventory
management are invalid, as the demand process is different and demand data scarce. In
this project we intent to built a system dynamic model for spare parts inventory
management in steel industry. Botter (2000) mentioned that, spare parts inventories
couldn’t be managed by standard inventory control methods, as a condition for
applying the underlying models are not satisfied. Nevertheless, the basic questions of
inventory control have to be answered: which parts should be stocked? Where should
they be stocked? How many of them should be stocked? Furtuin framework depiction
for consumption, response time, and price variable, could be the starts point for
classification the spare parts in ANSDK.
Of course, the improper management of spare parts leads to disturbance of production
line if there is shortage from spare parts or overstock of spare parts. In both cases it
will affect the performance of the company. So the spare parts have to be managed and
stocked at appropriate points with appropriate quantity in the supply chain to guarantee
a high service level with lowest stock from spare parts and that the aim for this project
to build a modeling system can achieve this target. Where ANSDK is suffering from
high stock spare parts inventory (as shown in 3.8.1) and it is really need this kind of
methodology to sort out a problem of £90 million in the spare parts stock.
17
2.6 Supply Chain Management
During the last decade, supply chain management has made its impression both in
academic and professional fields (Anderson 1999). Many companies have recognized
the potential impact on their competitiveness and financial performance and have re
deployed their high caliber individuals in supply chain management positions. Supply
chain management is much discussed in today’s business world because it constitutes
the conceptual base for the application of a host of new information and automation
technologies. Used wisely, these new technologies are competitive tools for better
determining demand, scheduling production, managing inventory, and speeding the
order-fulfillment cycle. Therefore it is anticipated that excellence in supply chain
management will lead to more satisfied customers and increased market share.
2.6.1 Supply chain definitions.
Slack (1998) defined supply chain management as the flow of materials and
information through a business from the purchasing activity through the operation and
out to customers, by way of a distribution or service delivery activity. It is defined also
as a loop: it starts at the customer and it ends with the customer through the loop flows
all materials and finished goods, all information, even transactions, it requires looking
at a business as one continual process and further. This process absorbs such traditional
distinct functions as: forecast, purchasing, manufacturing, distribution, sales, and
marketing into a continues flow of business interaction. Stevens (1989) Defined the
supply chain as the connected series of activates which is concerned with planning, co
ordinating and controlling material, parts and finished goods from supplier to
customer. Beamon (1999) defined the supply chain as an integrated process wherein
raw materials are manufactured into final products then delivered to customers (via
distribution, retail, or both). Talluri (2000) defined supply chain management as
coordinating and managing all the activities from raw materials procurement to the
delivery of the final product to the customer. A key ingredient for effective supply
chain is timely planning and information processing across the entire value-added
chain. Lummus et-al (1999) coverd all the previous definitions and gave a summary
definition for the supply chain which stated as all the activities involved in delivering a
product from raw material through to customers, including sourcing raw materials and
18
parts manufacturing and assembly, warehousing and inventory tracking, order entry
and order management, distribution across all channels, delivery to the customer, and
the information system necessary to monitor all of these activities. It links all of the
partners in the chain including departments within an organization and the external
partners including suppliers, carriers, third party companies, and information system
providers.
Slack (1998) outlined the main objectives of supply chain management as follows: -
• To focus-on satisfying end customers
• To formulate and implement strategies based on capturing and retaining end-
customers business.
• To manage the chain efficiently
2.6.2 The seven principles of supply chain management
Anderson (1999) explains that to balance customers’ demands with the need for
profitable growth, many companies have moved aggressively to improve supply chain
management. Their efforts may be summarized as the seven principles of supply chain
management that, working together can enhance revenue, cost control, and asset
utilization as well as customer satisfaction.
Principle 1: Segment customers based on the service needs of distinct groups and adapt
the supply chain to serve these segments profitably.
Principle 2: Customize the logistics network to the service requirements and
profitability of customer segments.
Principle 3: Listen to market signals and aligns demand planning accordingly across
the supply chain, ensuring consistent forecasts and optimal resources allocation.
Principle 4: Differentiate product closer to the customer and speed conversion across
the supply chain.
Principle 5: Manage source of supply strategically to reduce the total cost of owing
materials and services.
Principle 6: Develop a supply chain-wide technology strategy that supports multiple
levels of decision-making and gives clear view of the flow of products, services, and
information.
19
Principle 7: Adopt channel-spanning performance measures to gauge collective
success in reaching the end-user effectively and efficiently.
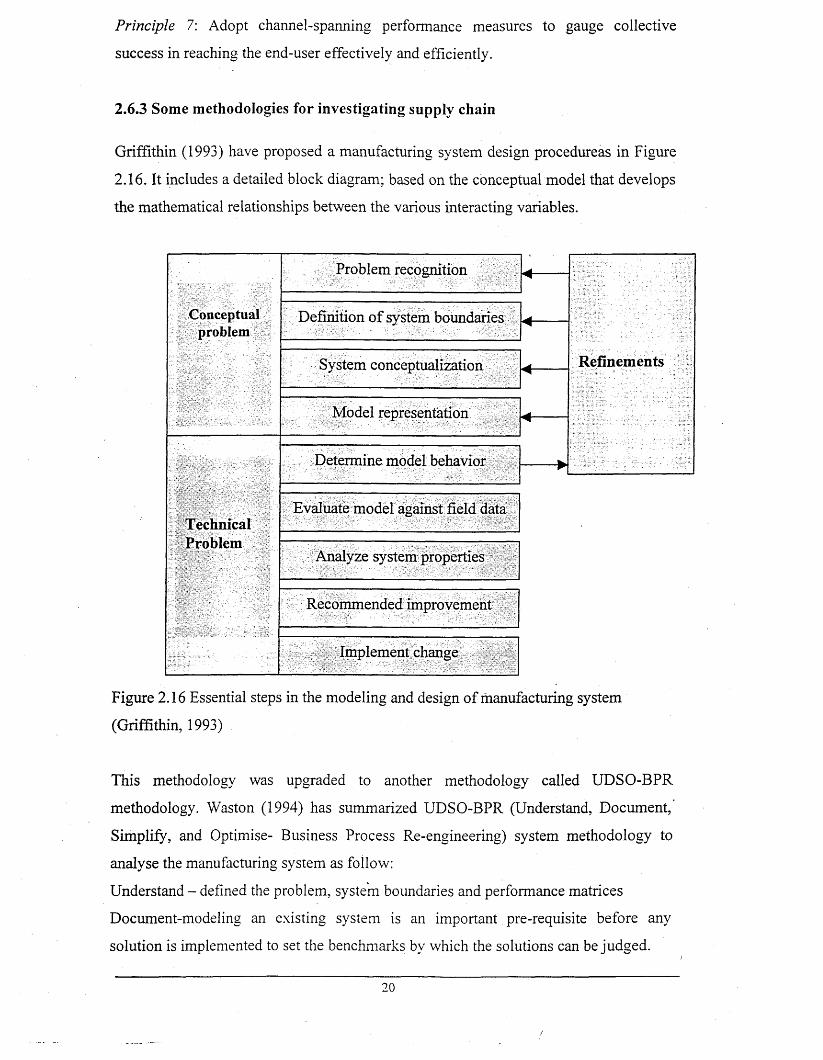
2.6.3 Some methodologies for investigating supply chain
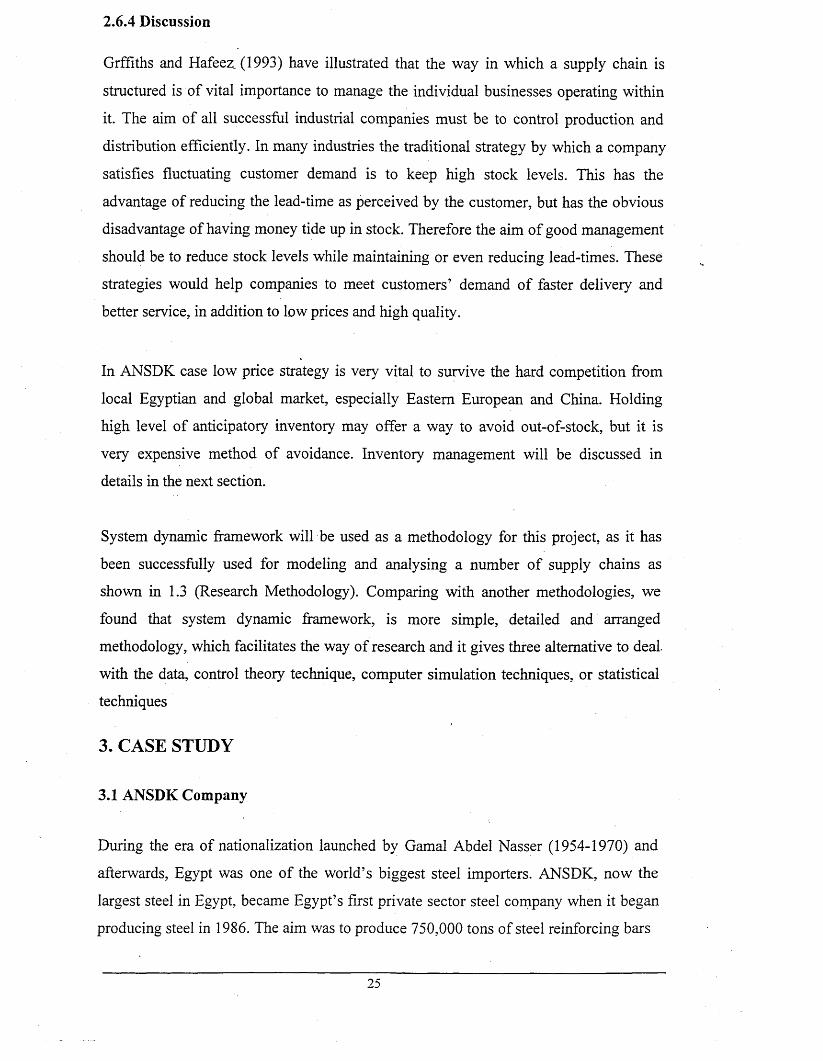
Griffithin (1993) have proposed a manufacturing system design procedureas in Figure
2.16. It includes a detailed block diagram; based on the conceptual model that develops
the mathematical relationships between the various interacting variables.
Conceptualproblem
TechnicalProblem
Problem recognition
Definition of system boundaries
System conceptualization
Model representation
Determine model behavior
Evaluate model against field data
Analyze system properties
Recommended improvement
Implement change
m .'"■'Mm^-■m.
Refinements
Figure 2.16 Essential steps in the modeling and design of manufacturing system
(Griffithin, 1993)
This methodology was upgraded to another methodology called UDSO-BPR
methodology. Waston (1994) has summarized UDSO-BPR (Understand, Document,
Simplify, and Optimise- Business Process Re-engineering) system methodology to
analyse the manufacturing system as follow:
Understand - defined the problem, system boundaries and performance matrices
Document-modeling an existing system is an important pre-requisite before any
solution is implemented to set the benchmarks by which the solutions can be judged.
20
Simplify- eliminates waste in the model from waste time, waste materials, waste
information, and waste capacity.etc. This stage of re-engineering program requires the
formalizing of processes (via the flows within the system), which may have only
previously been putative.
Optimise- once the processes have been identified and streamlined should
“sophisticated” methods of control be applied to ensure their consistency and
reliability. Methods include computer simulation, statistical process control,
experimental design, and network analysis.
This methodology provided a structured and methodical way of analysing the
company’s manufacturing system and decomposing the problems encountered. By
using this methodology for, Aerospace actuation system and electricity transmission
networks, improves the manufacturing system performance include up, to 75%
Reduction in manufacturing lead times, 30% reduction in costs and 75% reduction in
total inventor.
Again this USDO-BPR methodology was up-graded by K. Hafeez eUal (1996) to
system dynamic framework (Figure 1.1). An important aspect of this methodology is to
decompose a supply chain into distinct (preferably naturally existing) autonomous
business units. This helps to simplify the designing task as conceptual and
mathematical models for each unit are developed and analyzed individually.
Aggregation of these models to represent a complete supply chain then follows.
Essentially the framework consists of two over-lapping phases. Qualitative phase is
related to acquiring sufficient intuitive and conceptual, knowledge to understand the
structure and operation of supply chain, whereas, the quantitative phase is associated
with the development and analysis of mathematical and simulation model.
WMC Company (It manufactures and distributes mechanical/electrical equipment for
the construction industry) focused its improvement strategies on integrating its supply
chain in order to maximize the efficiency of all internal and external operations. Lewis
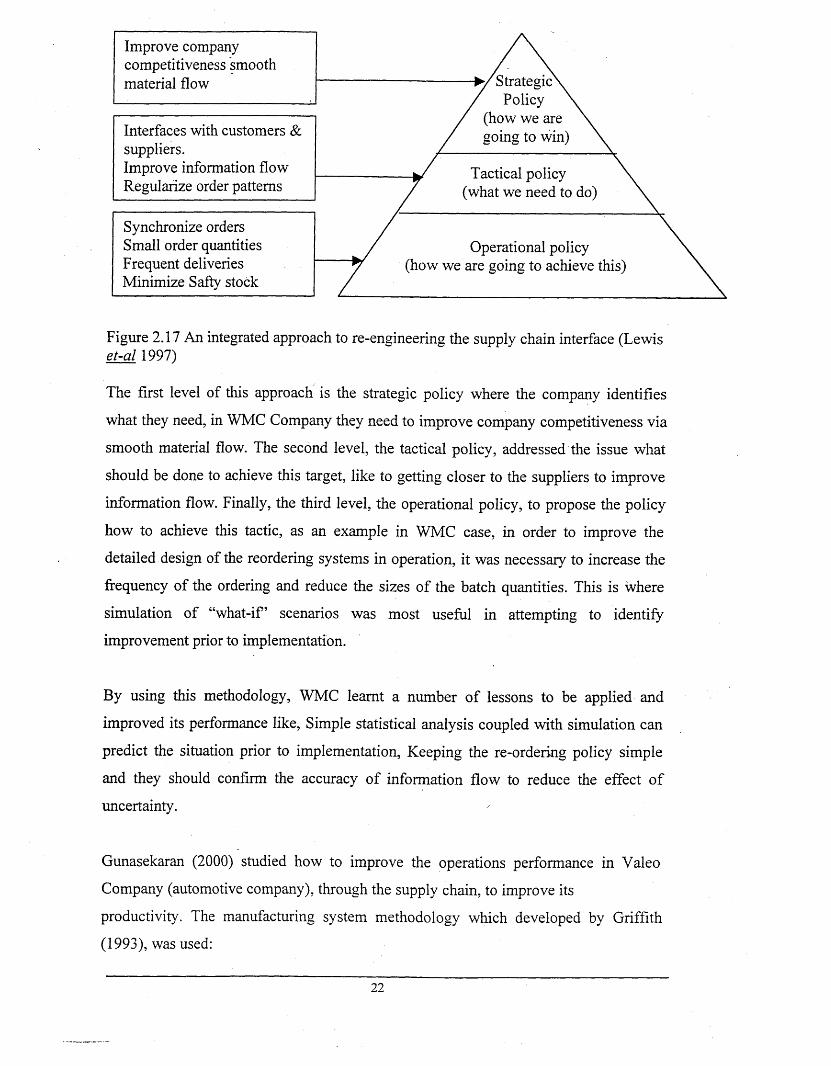
et-al (1997) used an integrated approach, which is shown in Figure 2.17, to re
engineering the supply chain process within the company, to achieve this target.
21
> / Strategic\ / Policy
(how we are going to win)
Tactical policy (what we need to do)
Operational policy (how we are going to achieve this)
Improve company competitiveness smooth material flow
Synchronize orders Small order quantities Frequent deliveries Minimize Safty stock
Interfaces with customers & suppliers.Improve information flow Regularize order patterns
Figure 2.17 An integrated approach to re-engineering the supply chain interface (Lewis et-al 19971
The first level of this approach is the strategic policy where the company identifies
what they need, in WMC Company they need to improve company competitiveness via
smooth material flow. The second level, the tactical policy, addressed the issue what
should be done to achieve this target, like to getting closer to the suppliers to improve
information flow. Finally, the third level, the operational policy, to propose the policy
how to achieve this tactic, as an example in WMC case, in order to improve the
detailed design of the reordering systems in operation, it was necessary to increase the
frequency of the ordering and reduce the sizes of the batch quantities. This is where
simulation of “what-if’ scenarios was most useful in attempting to identify
improvement prior to implementation.
By using this methodology, WMC learnt a number of lessons to be applied and
improved its performance like, Simple statistical analysis coupled with simulation can
predict the situation prior to implementation, Keeping the re-ordering policy simple
and they should confirm the accuracy of information flow to reduce the effect of
uncertainty.
Gunasekaran (2000) studied how to improve the operations performance in Valeo
Company (automotive company), through the supply chain, to improve its
productivity. The manufacturing system methodology which developed by Griffith
(1993), was used:
22
> Monitor the process
> Record performance
> Analyse performance over time
> Propose solutions which include ideas for improvement, and
> Implement solution.
The following tools were used in order to improve productivity:
> Management of inventory
> Design and specification of the process
> Layout of the cells, and
> Design of jobs and work
The result of the improvement methods implemented could be determined through
several ways. The introduction of the flute reduces the cycle time of the wet-setting
process (process step on automotive company) while the development of autonomous
cell improves the output/person calculated. This is based on figures used to determine
the productivity of the factory and on time delivery. They succeeded to make a minor
improvement in set-up time, which led to a considerable reduction in non-value adding
activities in terms of using smaller lot sizes and making the production line “lean “ to
support JIT material flow in a manufacturing cell.
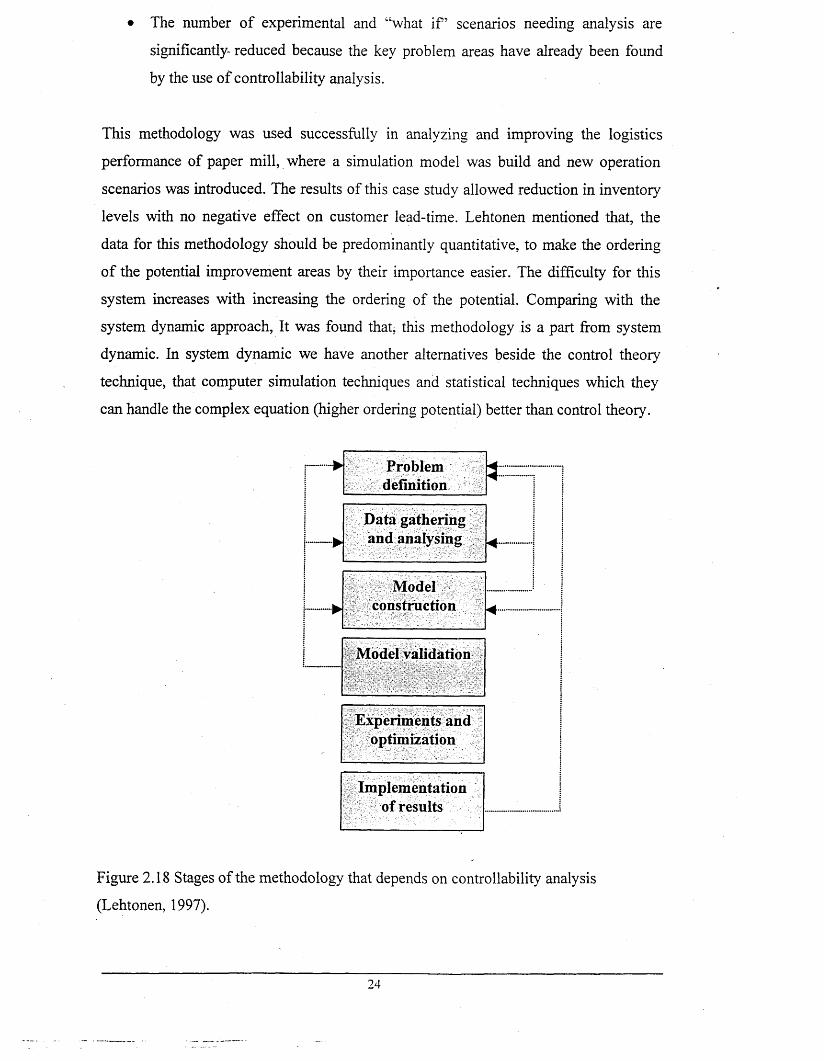
Lehtonen (1997), has developed a method as shown in Figure 2.18, this is based on
controllability analysis theory, which is defined as the ability of a system to reach a
certain state in a finite time span. The aim of this methodology is to reveal the
potential improvement areas and define and analyse the data so that they ready for the
simulation process. The simulation project steps of “problem finding” and the difficult
matter of “data gathering and analysis” are reduced by means of controllability,
analysis. The result of controllability analysis reduce the complexity of simulation
modeling in three ways:
• The model building and coding effort can be reduced, because the simulation
model can be focused directly on the key problem areas.
• The amount of data needed in the analysis can be reduced, because the
multitude of the data can be replaced by approximations using zoom and focus
methods. For example, instead of having all the products in the model, one can
take the products that incur most costs. These approximations are not averages,
but they are data units that represent the problem in the best way.
• The number of experimental and “what i f ’ scenarios needing analysis are
significantly- reduced because the key problem areas have already been found
by the use of controllability analysis.
This methodology was used successfully in analyzing and improving the logistics
performance of paper mill, where a simulation model was build and new operation
scenarios was introduced. The results of this case study allowed reduction in inventory
levels with no negative effect on customer lead-time. Lehtonen mentioned that, the
data for this methodology should be predominantly quantitative, to make the ordering
of the potential improvement areas by their importance easier. The difficulty for this
system increases with increasing the ordering of the potential. Comparing with the
system dynamic approach, It was found that; this methodology is a part from system
dynamic. In system dynamic we have another alternatives beside the control theory
technique, that computer simulation techniques and statistical techniques which they
can handle the complex equation (higher ordering potential) better than control theory.
Problemdefinition
<4-----------4........
Data gathering and analysing
Modelconstruction ^ ........
Model validation
; Experiments and optimization
Implementation of results
Figure 2.18 Stages of the methodology that depends on controllability analysis
(Lehtonen, 1997).
24
2.6.4 Discussion
Grffiths and Hafeez (1993) have illustrated that the way in which a supply chain is
structured is of vital importance to manage the individual businesses operating within
it. The aim of ail successful industrial companies must be to control production and
distribution efficiently. In many industries the traditional strategy by which a company
satisfies fluctuating customer demand is to keep high stock levels. This has the
advantage of reducing the lead-time as perceived by the customer, but has the obvious
disadvantage of having money tide up in stock. Therefore the aim of good management
should be to reduce stock levels while maintaining or even reducing lead-times. These
strategies would help companies to meet customers’ demand of faster delivery and
better service, in addition to low prices and high quality.
In ANSDK case low price strategy is very vital to survive the hard competition from
local Egyptian and global market, especially Eastern European and China. Holding
high level of anticipatory inventory may offer a way to avoid out-of-stock, but it is
very expensive method of avoidance. Inventory management will be discussed in
details in the next section.
System dynamic framework will be used as a methodology for this project, as it has
been successfully used for modeling and analysing a number of supply chains as
shown in 1.3 (Research Methodology). Comparing with another methodologies, we
found that system dynamic framework, is more simple, detailed and arranged
methodology, which facilitates the way of research and it gives three alternative to deal,
with the data, control theory technique, computer simulation techniques, or statistical
techniques
3. CASE STUDY
3.1 ANSDK Company
During the era of nationalization launched by Gamal Abdel Nasser (1954-1970) and
afterwards, Egypt was one of the world’s biggest steel importers. ANSDK, now the
largest steel in Egypt, became Egypt’s first private sector steel company when it began
producing steel in 1986. The aim was to produce 750,000 tons of steel reinforcing bars
a year for the local use. ANSDK started as a joint stock company with 87% of its
shares held by Egyptian investors, 10% held by a Japanese consortium and 3%
contributed by the international Finance Corp. Initial capital was 233 million Egyptian
pounds (£47.65 million). Today, ANSDK has 3158 employees. Currently it is spending
£486.1 million for construction and debt payments on a flat steel-making project. The
new hot rolling plant was completed in April 2000. Financially, the expansion project
has cost the company dearly. Its debt ratio is very high and interest payments on its
debt soared 70% in 1999 to 194 million pounds per year (£39.6 million). The high
debt, combined with low steel prices worldwide, led to a 59% decline in its 1999
earning causing EFG (Egyptian Finance Group) Hermes in February to issue a
“reduce” recommendation on ANSDK’s stock. EFG said it was issuing the
recommendation “despite our expectation that the company will benefit from the
increase in steel prices and our view that the acquisition of 28% of ANSDK by El-Ezz
Steel Re-bars will be positive for both the companies” (Susan Flower 2000).
The plant melts the sponge iron produced in direct reduction plants, in addition to steel
scrap and lime that is produced by lime calcining plant together with the additives
materials. The melting plants consist of 4 electric arc furnaces 80 MT/heat each and
two-ladle furnace for controlling chemical composition. The capacity of the four
electric furnaces is 1,555,200 metric tons/year of molten steel. Three casting machines
at a total capacity of 1,532,000 metric tons/year continuously cast the molten steel.
There are three separate plants for rolling steel billets; two produce steel bars at
production capacity of 920,000 tons/year and the other plant for producing wire rod
through two identical strands at a production capacity of 804,000 tons/year. Figure 3.6
shows the flow of the materials inside ANSDK, starting from raw materials supplier
passing through Direct reduction Plant (DRP), then to Electric Arc Furnaces (EAF) and
Continuous Casting Machine (CCM), finally either to Bar Mill or to Rod Mill depend
on the customer requirements.
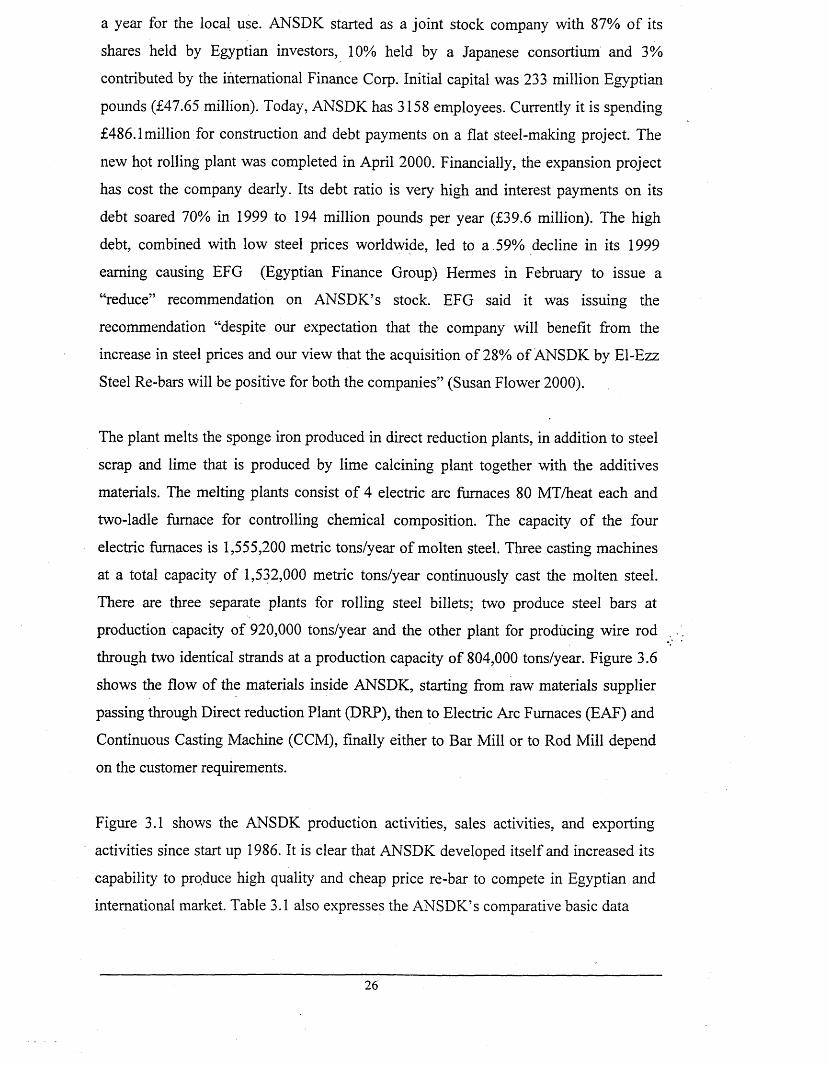
Figure 3.1 shows the ANSDK production activities, sales activities, and exporting
activities since start up 1986. It is clear that ANSDK developed itself and increased its
capability to produce high quality and cheap price re-bar to compete in Egyptian and
international market. Table 3.1 also expresses the ANSDK’s comparative basic data
26
during the last 5 years. And that is clear that the net profit of 1998 decreased by ~ 42%
comparing with 1997, because of steel market as we describe in 2.1, 2.2,and 2.3.
ANSDK reported that 1998 sales volume recorded 1.453 million tons out of which
1.183 million tons directed to the local market sharing by 33% of its needs. In addition
270 thousand tons exported to international market giving £50 million as export
revenues. The increased imported quantities of re-bars especially those of CIS origin at
shrink prices coincided with the international economic depression had its negative
effect on the sales prices locally and internationally. Consequently the company’s sales
revenues stood at £0.3 billion.
Thousand Tons
1.600 1.400 1.200 1.000
800 600 400 200
0
g Production Activities q Sales Activities □ Export Activities
1986 1987 1988 1989 1990 1991 1992 1993 1994 1995 1996 1997 1998 :Year
Figure 3.1 ANSDK production, sales, and exporting activities
Item Unit 1995 1 1996 1997 1998
Production rate In 1000 tons 1234 1119 1244 1516
Sales Quantity In 1000 tons 1280 1128 1266 1453
Export Quantity In 1000 tons . 250 203 328 270
Average price of Export In£/tonFOB | 198 186 185 180
Net Profit In Million £ j 24.6 25.1 24.7 14.5
The productivity/worker Tons j 509 461 484 543
Table 3.1 ANSDK’s activities comparative basic data (ANSDK 1998 annual report)
27
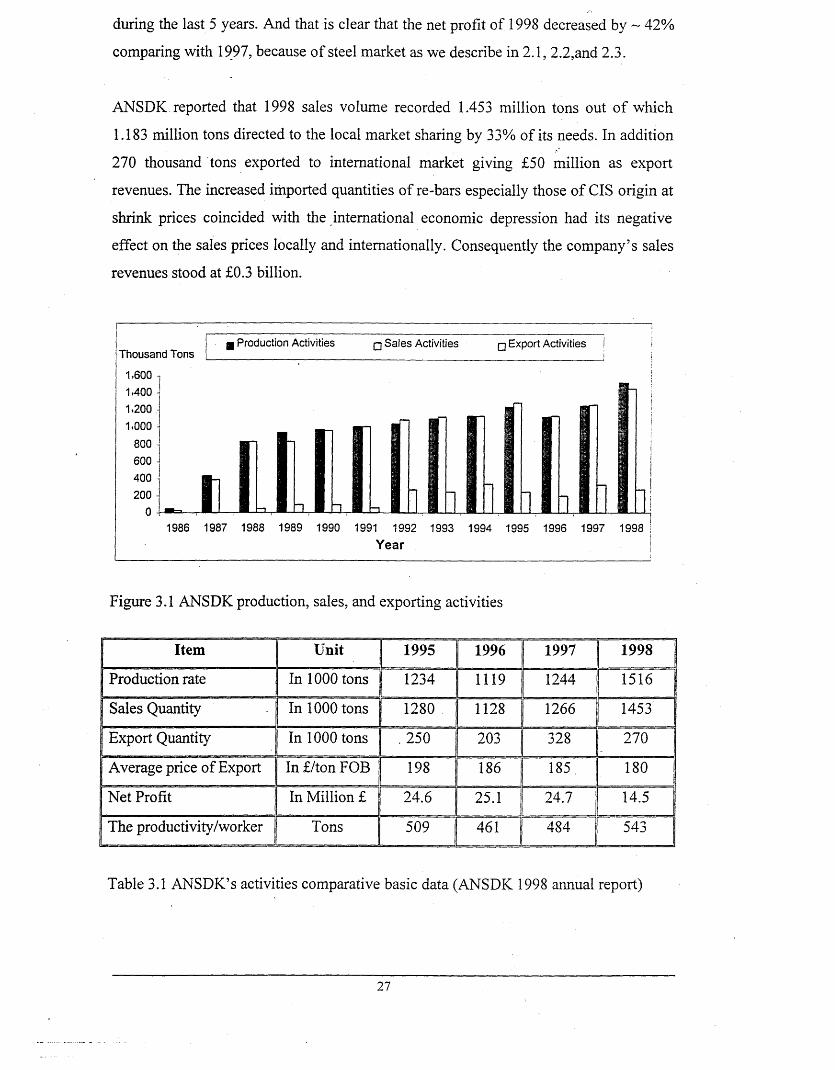
ANSDK is considered the second biggest steel producer in Arab world and the
following Figure 3.2 shows the production and exports of the Major Arab steel
companies during 1997 and 1998. (Lachgar, 1999)
E3 Product 1993 □ Product 1997 H Export 1993 □ Export 1997
HADED AN SDK HADISOLB LISCO SIDER QASCO SO NA SID
Company Name
Figure 3.2 Evaluation of production and exports of the major Arab steel companiesduring 1997 and 1998. (Lachgar, 1999)
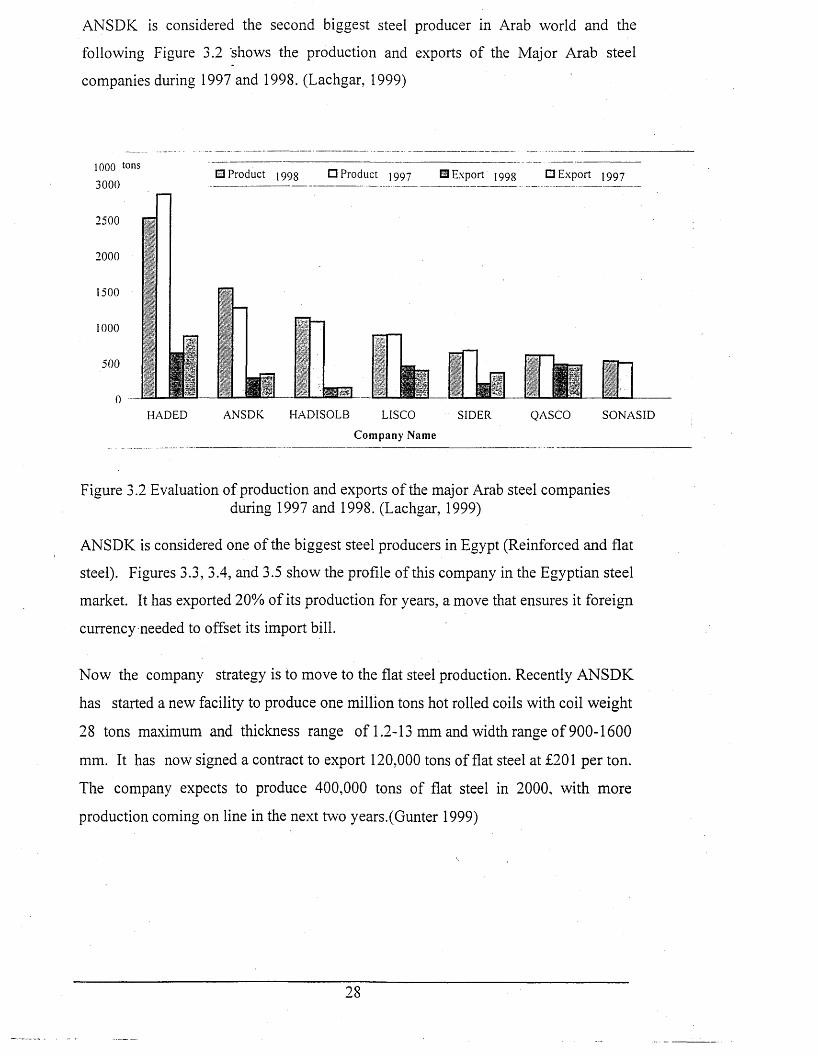
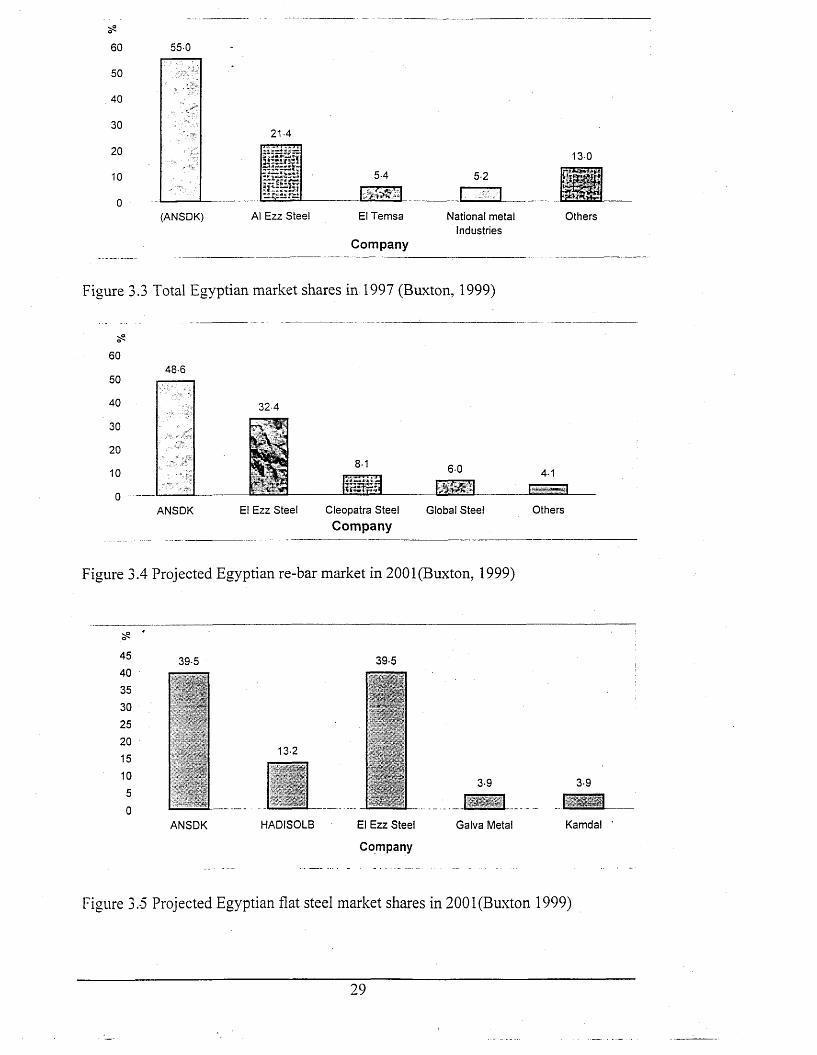
ANSDK is considered one of the biggest steel producers in Egypt (Reinforced and flat
steel). Figures 3.3, 3.4, and 3.5 show the profile of this company in the Egyptian steel
market. It has exported 20% of its production for years, a move that ensures it foreign
currency needed to offset its import bill.
Now the company strategy is to move to the flat steel production. Recently ANSDK
has started a new facility to produce one million tons hot rolled coils with coil weight
28 tons maximum and thickness range of 1.2-13 mm and width range of 900-1600
mm. It has now signed a contract to export 120,000 tons of flat steel at £201 per ton.
The company expects to produce 400,000 tons of flat steel in 2000, with more
production coming on line in the next two years.(Gunter 1999)
28
60
50
40
30
20
10
0
55-0
21-4
13-0
P|tjp£*ir»5-4 5-2
(ANSDK) Al Ezz Steel El Temsa
Com pany
National metal Industries
Others
Figure 3.3 Total Egyptian market shares in 1997 (Buxton, 1999)
5?60
48-650
40
30 ■
20
10
o -------ANSDK
8-1
Tiljjfl6-0
E M 3El Ezz Steel Cleopatra Steel
C om panyGlobal Steel
4-1
Others
Figure 3.4 Projected Egyptian re-bar market in 2001 (Buxton, 1999)
^ '45403530252015105
0
39-5
ANSDK HADISOLB
39-5
*'
■
13-2
El Ezz Steel
Company
3-9
Galva Metal
3-9
Kamdal
Figure 3.-5 Projected Egyptian flat steel market shares in 2001 (Buxton 1999)
29

3.2 Material Flow Diagram of ANSDK Supply Chain
The re-bar industry is part of the construction environment. It produces primarily the
direct reduced iron, which uses with scrap and other additives in producing the steel
billets (semi finished). The billets are used to produce the final product (rod and bars)
which is used in construction industry. Figure 3.7 shows the material flow diagram of
ANSDK.
RawM aterial
PrimaryProduct
Semi-F inished
FinishedProduct
Customer End Users
Internal
o 2
1,610,033Tons
1,551,000Tons
1,516,177Tons
DirectReduced Steel
Iron -jV Billet(DRI)
q >
r i >
d >
Bar & Rod
1,453,000Tons
L ocalM arket
(1 ,1 8 3 ,0 0 0T ons)
InternationalMarket(270,000
Tons)
t >
Buildings,Bridges,H o u ses,etc
ANSDK External Supplier
ANSDK Internal Supplier (ANSDK itself)
Figure. 3.7 M aterial flow diagram o f ANSDK supply chain
30
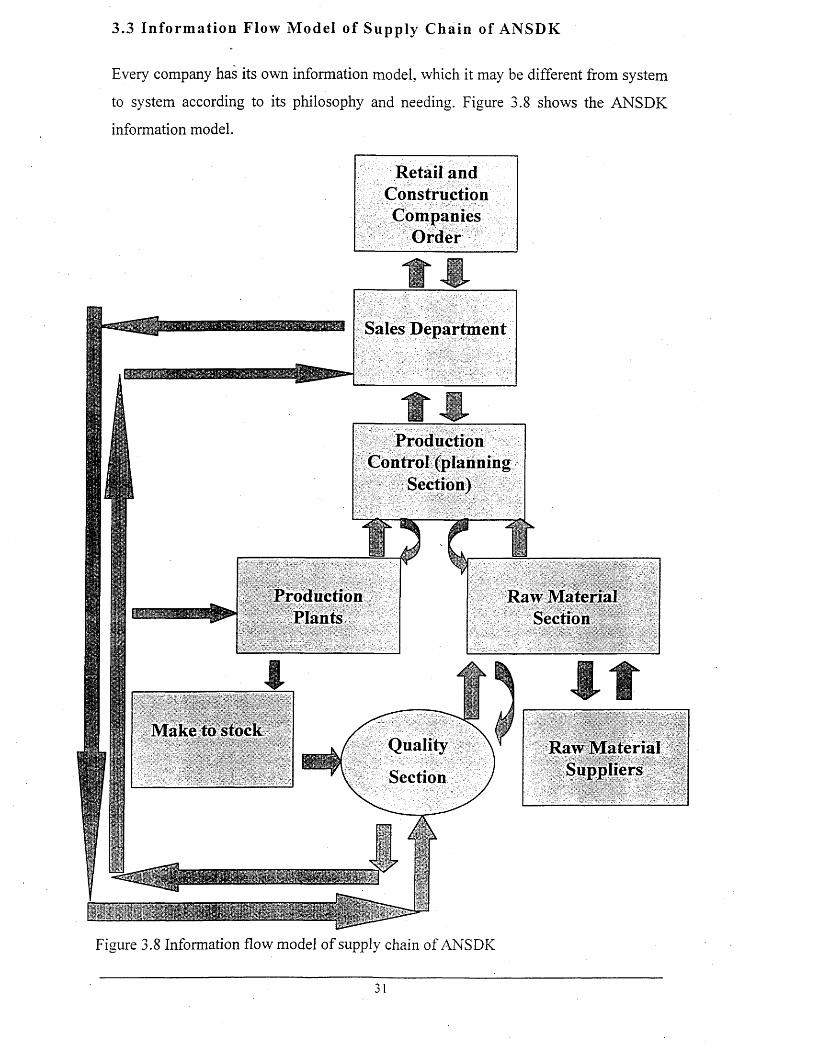
3.3 Information Flow Model of Supply Chain of ANSDK
Every company has its own information model, which it may be different from system
to system according to its philosophy and needing. Figure 3.8 shows the ANSDK
information model.
Retail and Construction Companies
Order
Sales Department
Production Control (planning
Section)
1 Production Raw MaterialPlants Section
Make to stockQuality
Section
ftRaw Material
Suppliers
Figure 3.8 Information flow model of supply chain of ANSDK
31
The inform ation flow chart shows how the steel p lan t p laces an order
for their custom ers; rely on its own p roduction program . 60% o f
custom ers work m ost o f the tim e w ithout stock that is why m ost o f the
order should be placed for im m ediate delivery . On the o ther hand 40%
o f custom ers can places orders in advance depending on construc tion
program s. W hen orders are p laced , the p roduction plan is prepared ,
indicating the required m ateria ls and supplies to achieve th is order.
The m ost im portant operating policy o f the com pany is to cover 100%
of the demand. That is why the com pany m aintains the m axim um level
o f stock, in other word, the com pany produces to stock (75000
tons/m onth Bars and 65,000 tons/m onth Rod). But over p roduction may
affect the operating perform ance, quality and cost.
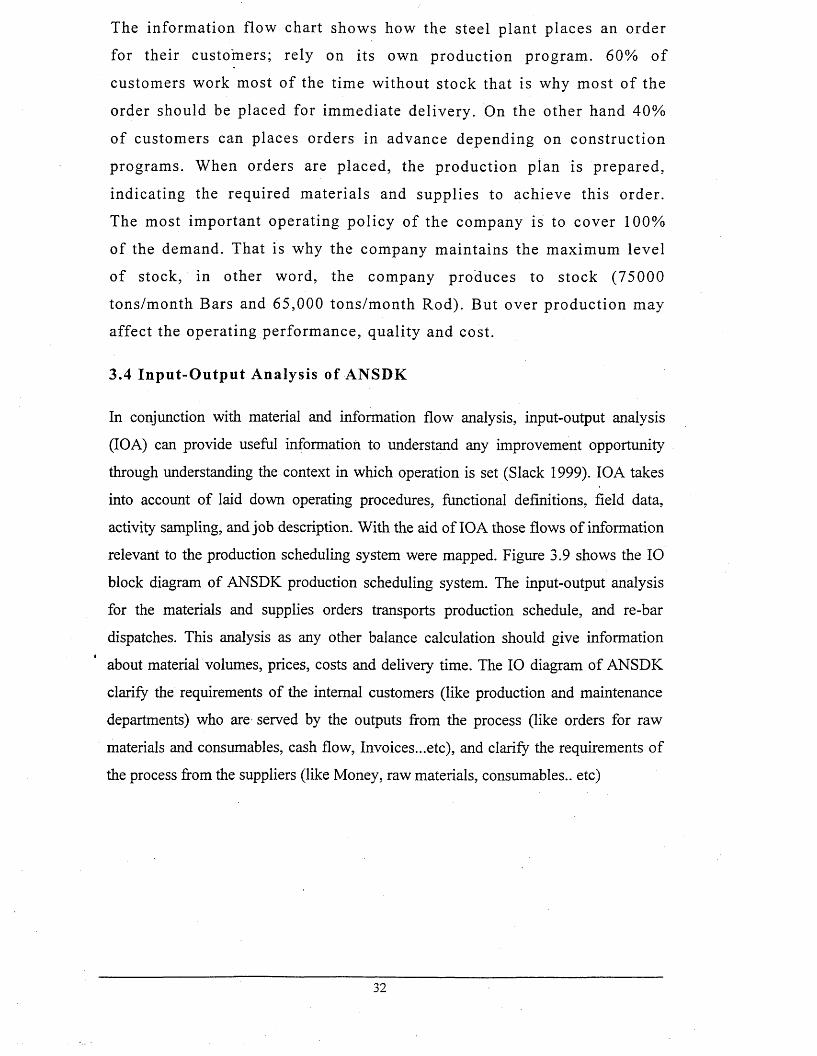
3.4 Input-O utput A nalysis o f ANSDK
In conjunction with material and information flow analysis, input-output analysis
(IOA) can provide useful information to understand any improvement opportunity
through understanding the context in which operation is set (Slack 1999). IOA takes
into account of laid down operating procedures, functional definitions, field data,
activity sampling, and job description. With the aid of IOA those flows of information
relevant to the production scheduling system were mapped. Figure 3.9 shows the IO
block diagram of ANSDK production scheduling system. The input-output analysis
for the materials and supplies orders transports production schedule, and re-bar
dispatches. This analysis as any other balance calculation should give information
about material volumes, prices, costs and delivery time. The IO diagram of ANSDK
clarify the requirements of the internal customers (like production and maintenance
departments) who are served by the outputs from the process (like orders for raw
materials and consumables, cash flow, Invoices...etc), and clarify the requirements of
the process from the suppliers (like Money, raw materials, consumables., etc)
32
Building companies
orders
Retails customers orders
Raw materials (oxide pellets, Scrap,Pg iron &HBI)
Services (security, house keeping, water treatment, some civil and maintenance work)
Utilities (Water, Natural gas, N2 &O2)
■ * , 11
"* /yt ||Bb
M oney
Labour
Consulting Service
Consumables (spare parts, lubricants, power, water...etc.)
Bar and coils for building and retails customers
Order for raw materials
Orders for the services subcontractors
Cash flow
Invoices
Orders for consumables
Figure 3.9 Input-Output analysis of the ANSDK Company
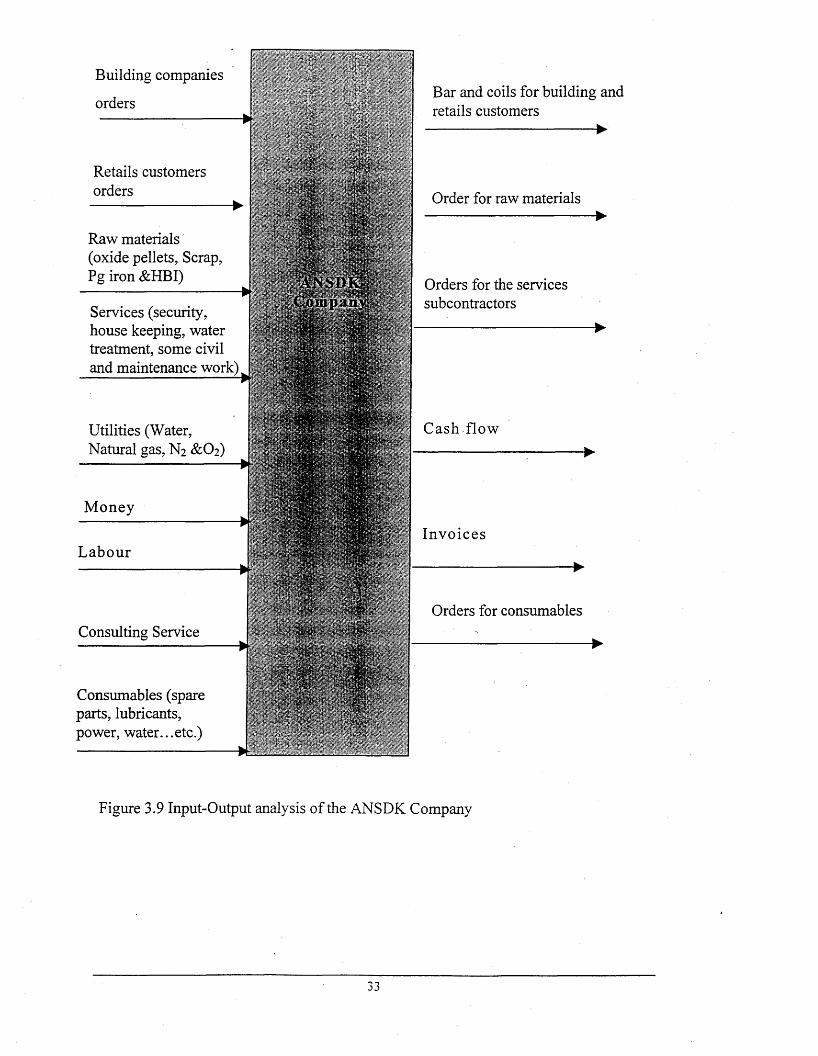
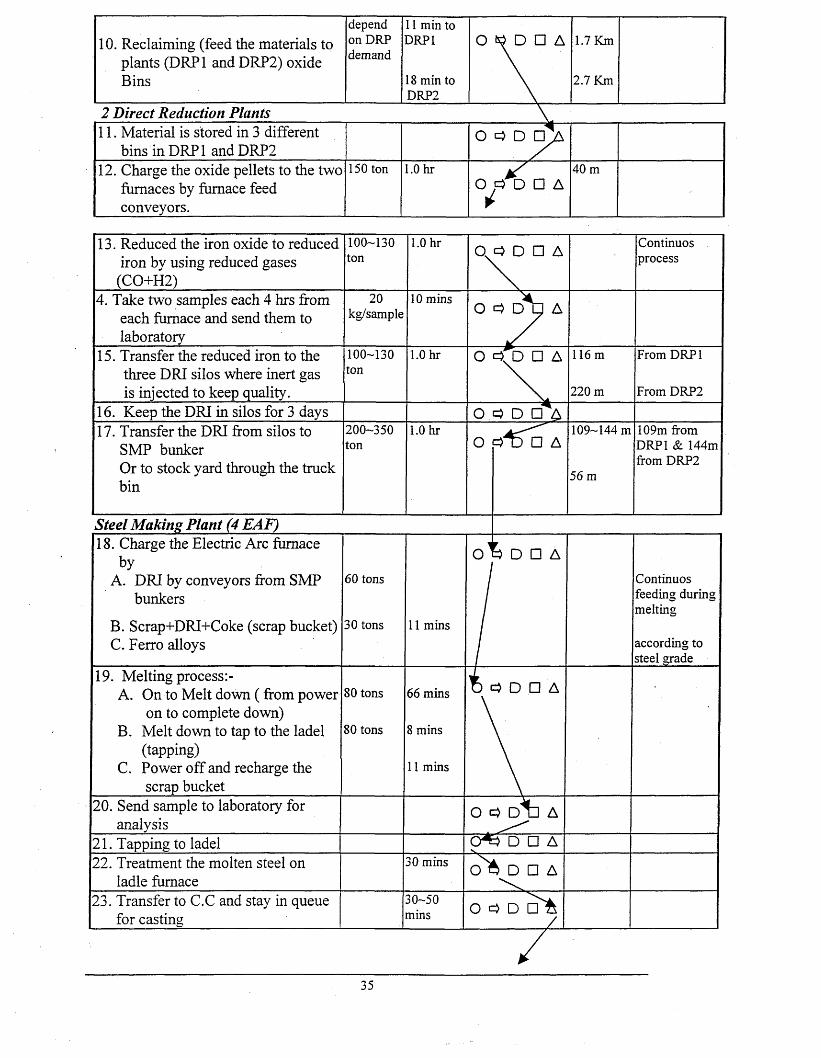
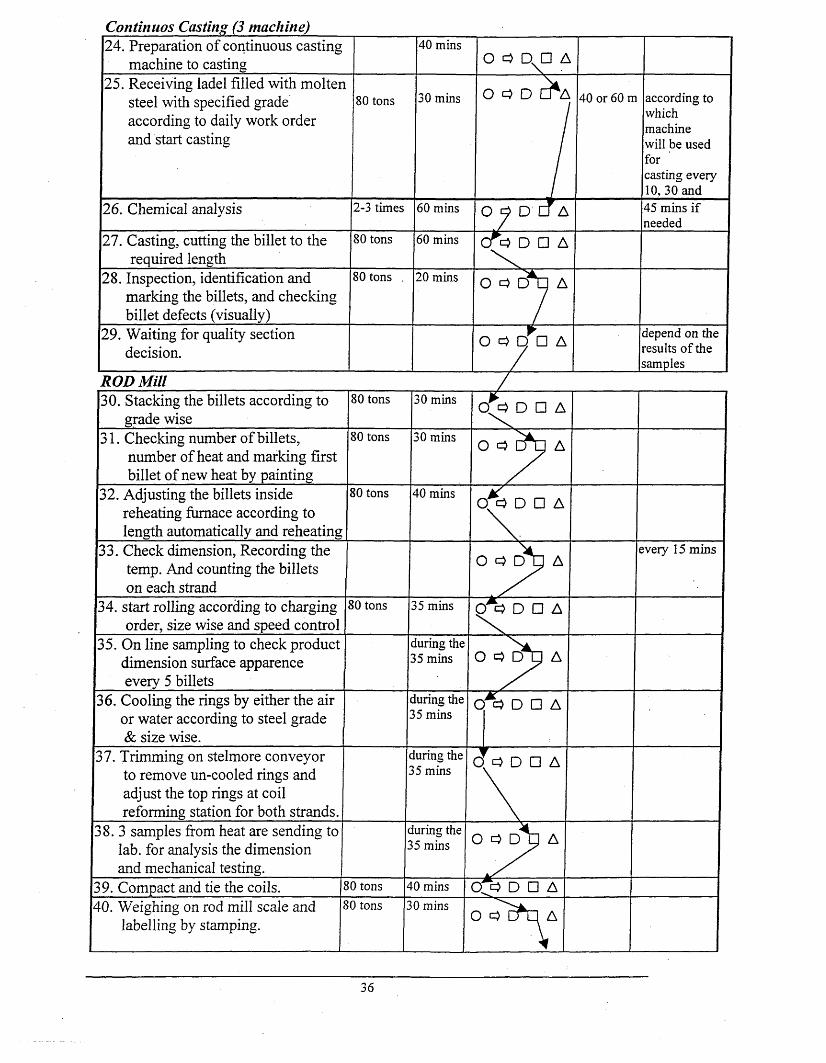
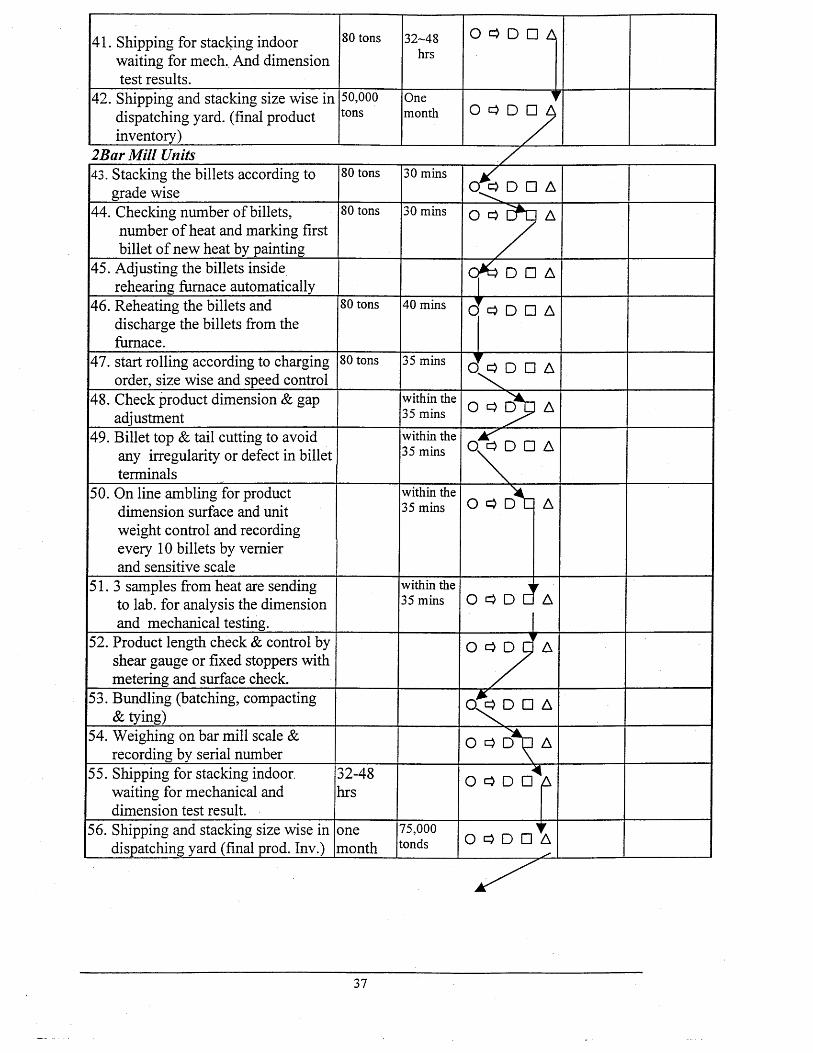
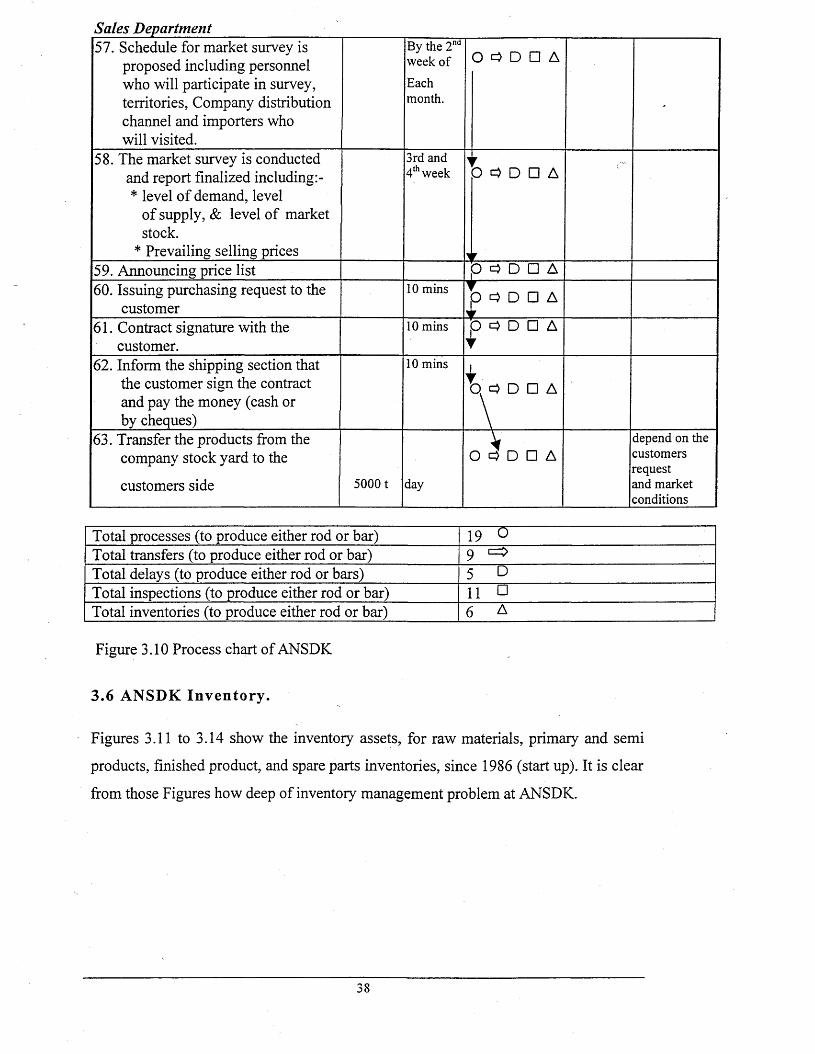
3.5 Process Chart of ANSDK
Input-output diagram gives a useful overview of the process context of improvement
opportunities, A more detailed technique is the process chart. Process chart gives a
detailed understanding of parts of the process where some sort of flow occurs (Slack
1999). Figure 3.10 shows the process chart from raw material section through the
ANSDK process till the final products and end-customers. There are 19 processes, 9
transfers, 5 delays, 11 inspections and 6 inventories through all the process to produce
either rod or bar steel, total time is 74 and 8hrs from the raw material suppliers till the
end customers. The process chart shows two critical areas, first one is inventory,
where produced time /inventory time ratio is 0.94. Most of the inventory time (85%)
is represented by final product inventory, which may stay for period more than one
month depending on the sales rate and market condition. The other area is the delays,
where the produced time/delay time ratio is 1.5, 91% from this delay time is due to
shipment delay at the supplier of raw material port before loading.
Description Q ty Time Activity Dista Remarksn ce
Raw Material Section1. Send a annual plan to oxide pellets
suppliers and shipping company by end of Nov. AD □ A
2. Received confirmation from the supplier and shipping Companies
7 days O O D O A
3. Lay days for loading board 1—15 days O «=>]D □ A4. Loading of Shipment 1-2 days 0^> D □ A5. Send the material to Egypt 15-20 days O d D □ A 15 (from
Sweden), 20 From Brazil
Mineral Jetty6. Check regulations documents
like Medical check, Immigration visa...etc.
1.5 hrsO <=> D 111 A
7. Preparation for unloading operation (open the oxide rooms, and adjust the crane)
0.5 hr O <3 p □ A
8. Unloading operation 140,000Ton
4 days 0^3 D □ A 1 km By conveyors and gantry
9. Stacking the material in stacking yard according to stacking plan (for smooth feeding to DRP1 and DRP2)
within the
unloading 4 days
b 9 D □ A
34
10. Reclaiming (feed the materials todepend on DRP demand
11 min to DRP1 O q D □ A 1.7 Km
plants (DRP1 and DRP2) oxide Bins 18 min to
DRP22.7 Km
2 Direct Reduction Plants11. Material is stored in 3 different
bins in DRP1 and DRP2O O D D A
12. Charge the oxide pellets to the two furnaces by furnace feed conveyors.
150 ton 1.0 hrO q D □ A
>
40 m
13. Reduced the iron oxide to reduced iron by using reduced gases (CO+H2)
100-130ton
1.0 hr Q q D □ A Continuosprocess
4. Take two samples each 4 hrs from each furnace and send them to laboratory
20kg/sample
10 mins O 3 D*d A
15. Transfer the reduced iron to the three DRI silos where inert gas is injected to keep quality.
100-130ton
1.0 hr O q■ D □ A 116 m
220 m
From DRJP1
From DRP2
16. Keep the DRI in silos for 3 days O ,q D ETA17. Transfer the DRI from silos to
SMP bunkerOr to stock yard through the truck bin
200-350ton
1.0 hrO =}i5"cT A
109-144 m
56 m
109m from DRP I & 144m from DRP2
Steel Making Plant (4 EAF)18. Charge the Electric Arc furnace
byA. DRI by conveyors from SMP
bunkers
B. Scrap+DRI+Coke (scrap bucket)C. Ferro alloys
60 tons
30 tons 11 mins
o l
/
=> D □ AContinuos feeding during melting
according to steel grade
19. Melting processA. On to Melt down ( from power
on to complete down)B. Melt down to tap to the ladel
(tapping)C. Power off and recharge the
scrap bucket
80 tons
80 tons
66 mins
8 mins
11 mins
O q D □ A
© ' ^ 0 ^ A20. Send sample to laboratory for analysis
21. Tapping to ladel 0 ^ 7 D □ A22. Treatment the molten steel on
ladle furnace30 mins D □ A
23. Transfer to C.C and stay in queue for casting
30-50mins O 0 D □
35
Continuos Casting (3 machine)24. Preparation of continuous casting
machine to casting40 mins
O c> D □ A
25. Receiving ladel filled with molten steel with specified grade according to daily work order and start casting
80 tons 30 mins O <3 D Q * An 40 or 60 m according to which machine will be used forcasting every 10, 30 and
26. Chemical analysis 2-3 times 60 mins O J D c f A 45 mins if needed
27. Casting, cutting the billet to the required length
80 tons 60 mins CT=> D □ A
28. Inspection, identification and marking the billets, and checking billet defects (visually)
80 tons . 20 mins O 3 c f n A
29. Waiting for quality section decision.
vO O D □ A
depend on the results o f the samples
ROD Mill30. Stacking the billets according to
grade wise80 tons 30 mins O ^ D □ A
31. Checking number of billets,number of heat and marking first billet of new heat by painting
80 tons 30 minsO o c f p A
32. Adjusting the billets inside reheating furnace according to length automatically and reheating
80 tons 40 minsO ^ b D □ A
33. Check dimension, Recording the temp. And counting the billets on each strand
O O D*CJ Aevery 15 mins
34. start rolling according to charging order, size wise and speed control
80 tons 35 mins Q p } D □ A
35. On line sampling to check product dimension surface apparence every 5 billets
during the 35 mins O 0 [ A ] A
36. Cooling the rings by either the air or water according to steel grade & size wise.
during the 35 mins
d % D □ A
37. Trimming on stelmore conveyor to remove un-cooled rings and adjust the top rings at coil reforming station for both strands.
during the 35 mins
O O D □ A
38.3 samples from heat are sending to lab. for analysis the dimension and mechanical testing.
during the 35 mins O 0 D p A
39. Compact and tie the coils. 80 tons 40 mins q 5 > D □ A40. Weighing on rod mill scale and
labelling by stamping.30 tons 30 mins
o c T o ^ q A
36
41. Shipping for stacking indoor waiting for mech.. And dimension test results.
80 tons 32-48hrs
O 3 D □ A
42. Shipping and stacking size wise in dispatching yard, (final product inventory)
50,000tons
Onemonth
vO 3 D
2Bar Mill Units43. Stacking the billets according to
grade wise80 tons 30 mins
.....
c r b D □ A
44. Checking number of billets,number of heat and marking first billet of new heat by painting
80 tons 30 mins o 0 c f a a
45. Adjusting the billets inside rehearing furnace automatically
*6 D □ A
46. Reheating the billets and discharge the billets from the furnace.
80 tons 40 mins 1c 3 D □ A
47. start rolling according to charging order, size wise and speed control
80 tons 35 mins \0
r^ 3 D □ A
48. Check product dimension & gap adjustment
within the 35 mins O 3 A
49. Billet top & tail cutting to avoid any irregularity or defect in billet terminals
within the 35 mins
A '0 3 D □ A
50. On line ambling for product dimension surface and unit weight control and recording every 10 billets by vernier and sensitive scale
within the 35 mins O 3 D C A
51.3 samples from heat are sending to lab. for analysis the dimension and mechanical testing.
within the 35 mins O 3 D C
rA
52. Product length check & control by shear gauge or fixed stoppers with metering and surface check.
O 3 D d A
53. Bundling (batching, compacting & tying)
Ao ^ d □ a
54. Weighing on bar mill scale & recording by serial number
O 3 A
55. Shipping for stacking indoor, waiting for mechanical and dimension test result.
32-48hrs
O 3 D □ A
56. Shipping and stacking size wise in dispatching yard (final prod. Inv.)
onemonth
75,000tonds O 3 D □ A
37
Sales Department57. Schedule for market survey is
proposed including personnel who will participate in survey, territories, Company distribution channel and importers who will visited.
By the 2nd week of
Eachmonth.
O «=> D □ A
-
58. The market survey is conducted and report finalized including* level of demand, level
of supply, & level of market stock.
* Prevailing selling prices
3rd and 4th week O D □ A
yr59. Announcing price list O <=> D □ A60. Issuing purchasing request to the
customer10 mins T
p <=> D □ A
61. Contract signature with the customer.
10 mins <=> D □ A
62. Inform the shipping section that the customer sign the contract and pay the money (cash or by cheques)
10 mins
c* D □ A
63. Transfer the products from the company stock yard to the
customers side 5000 t day
\O Q D □ A
depend on the customers request and market conditions
Total processes (to produce either rod or bar) 19 °Total transfers (to produce either rod or bar) 9 =>Total delays (to produce either rod or bars) 5 DTotal inspections (to produce either rod or bar) 11 □Total inventories (to produce either rod or bar) 6 A
Figure 3.10 Process chart of ANSDK
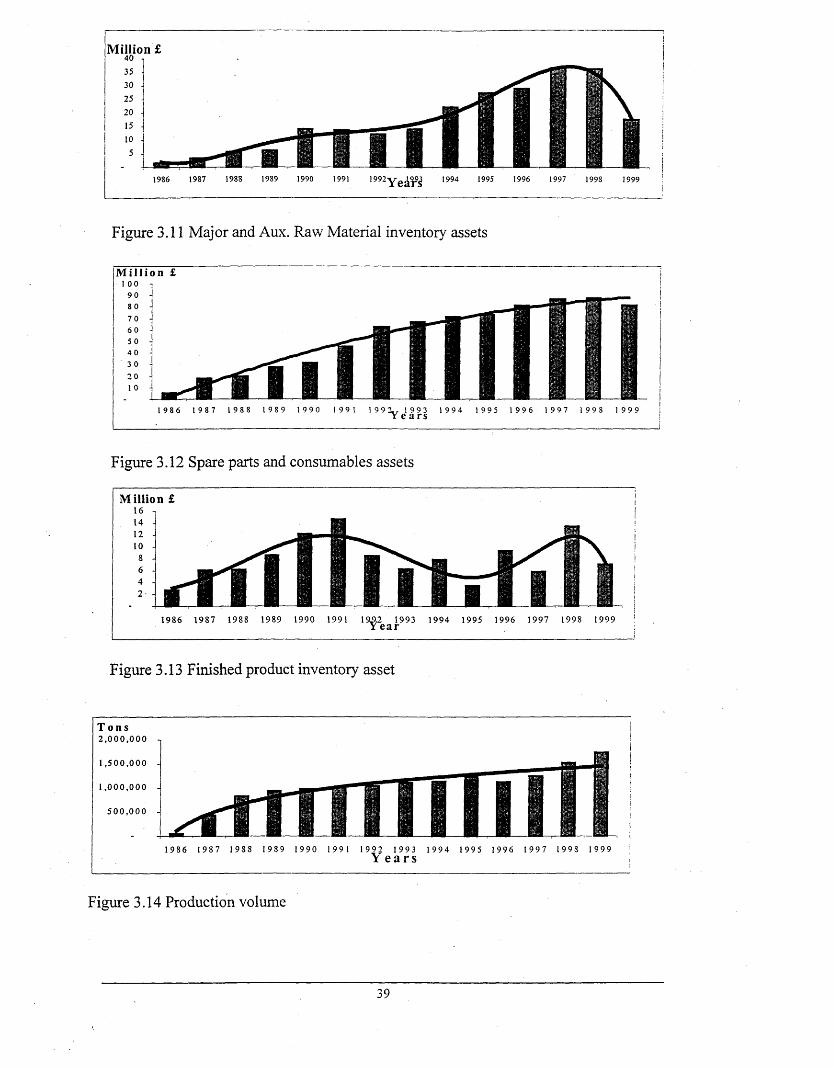
3.6 ANSDK Inventory.
Figures 3.11 to 3.14 show the inventory assets, for raw materials, primary and semi
products, finished product, and spare parts inventories, since 1986 (start up). It is clear
from those Figures how deep of inventory management problem at ANSDK.
Million £
1986 1987 1988 1989 1990 1991 l992V p ^ 1994 1995 1996 1997 1998 1999
Figure 3.11 Major and Aux. Raw Material inventory assets
M i l l i o n £100
1 98 6 1 9 8 7 1 9 8 8 1 9 8 9 1 9 9 0 1 9 9 1 1 9 9 2. . 1 9 9 3 1 9 9 4 1 9 9 S 1 9 9 6 1 9 9 7 1 9 9 8 1 9 9 9r e a r s
Figure 3.12 Spare parts and consumables assets
M il l i o n £
1986 1987 1988 1989 1990 1991 19&2 1993 1994 1995 1996 1997 1998 1999T e a r
Figure 3.13 Finished product inventory asset
Tons2 ,0 0 0 , 0 0 0
1 , 5 0 0 , 0 0 0
1 ,0 0 0 , 0 0 0
5 0 0 ,0 0 0
1 9 8 6 1 9 8 7 1 9 8 8 1 9 8 9 1 9 9 0 1 9 9 1 1 9 9 3 1 9 9 3 1 9 9 4 1 9 9 5 1 9 9 6 1 9 9 7 1 9 9 8 1 9 9 9Y ears
Figure 3.14 Production volume
39
The inventory assets o f raw m ateria ls and spare parts (F igures 3.11 and
3.12) increased yearly but in 1999 both o f them were decreased , w here
raw m aterial stock decreased by 50% and spare parts stock by 7% in
sp ite o f increasing production volum e by 14%. Both raw m ateria ls and
spare parts stocks reached £99 m illion , where the spare parts stock
reached to £81m illion and raw m ateria ls stock reached to £18m illion .
At the same tim e the net p ro fit was decreased from £24 .7m illionon
1997 to £4.9m illion on 1999 (80% ) (See table 3.1). Inven to ries o f raw
m ateria ls and spare parts are 20 tim es m ore than the net p ro fit in 1999
and h a lf o f the total turn over in the same year. On the o ther hand the
sem i-fin ished and fin ished p roduct inven tories (F igures 3.24 and 3.25)
fluc tua ted depending m ainly on the steel m arket. The inven tory o f final
p roduct jum ped by 300% in 1999 com paring w ith 1998, because o f high
price o f ANSDK products (£200/ton) com paring the o ther E gyptian
com petitors who im ported the b ille ts from Eastern Europe w ith cheap
price (£96/ton), consequently produced re-bars w ith low er price
(£160/ton).
Spare parts inventory represents a big problem to ANSDK, w here it
costs ANSDK £81m illion (16 tim es more than the 1999 net p ro fit and
35% turn over o f the same year, in a tim e the company try to reduce its
expenses and product price to survive in a highly fluctuated m arket.
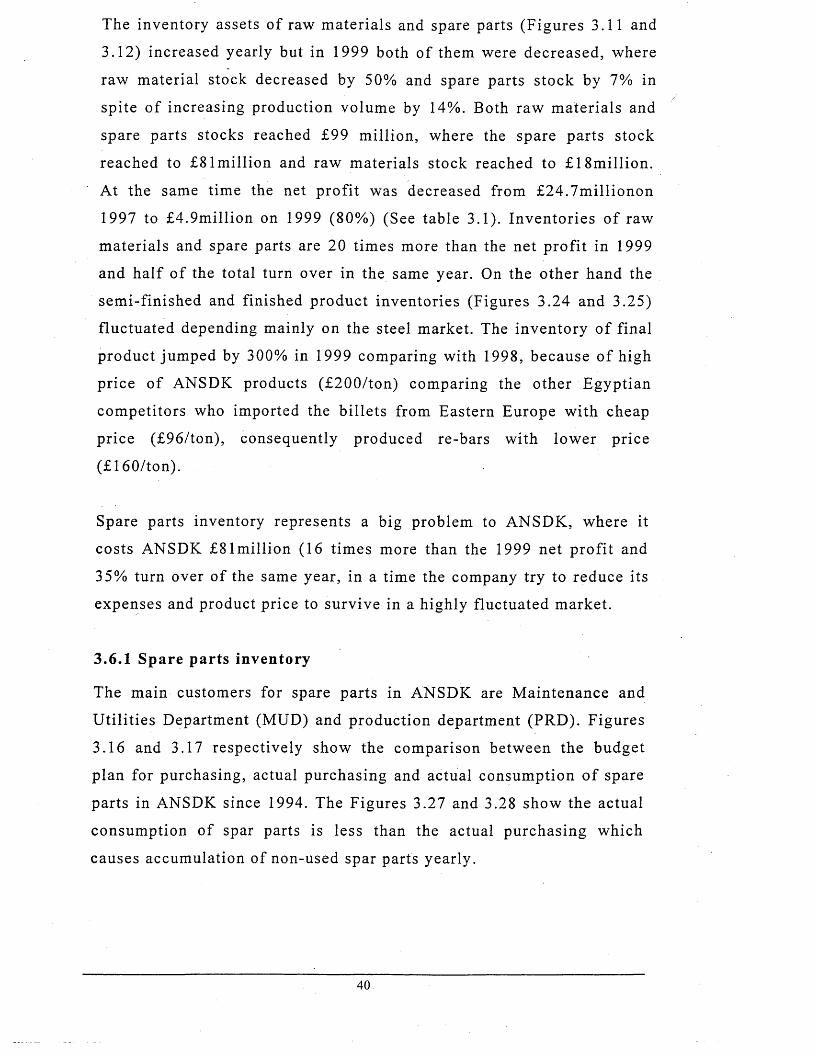
3.6 .1 Spare parts inventory
The m ain custom ers for spare parts in ANSDK are M aintenance and
U tilitie s D epartm ent (MUD) and p roduction departm ent (PRD). F igures
3.16 and 3.17 respectively show the com parison betw een the budget
p lan for purchasing, actual purchasing and actual consum ption o f spare
parts in ANSDK since 1994. The F igures 3.27 and 3.28 show the actual
consum ption o f spar parts is less than the actual purchasing w hich
causes accum ulation o f non-used spar parts yearly .
40
14.000.000
12.000.000 J
10.000.000 -
8,000,000 -
6 ,000,000 -
4.000.000 J
2.000.000 -j
H Consumption □ Purchase Plan □ Actual Purchasing !
1994 1995 1996 1997Year
1998 1999
Figure 3.16 C om parison for the purchase plan, ., actual purchasing and actual consum ption o f spare parts for MUD since 1994
£9.000.000
8.000.000
7,000,000 -!
I Consumption □ Purchase Plan □Actual Purchasing
2 ,000,000
i
-
- [ I1■B .
B - >
> v
-
» '
k ****\ ■'<
1994 1995 1996 1997Year
1998 1999
Figure 3.17 Com parison for the purchase plan, , actual purchasing and actual consum ption o f spare parts for MUD since 1994
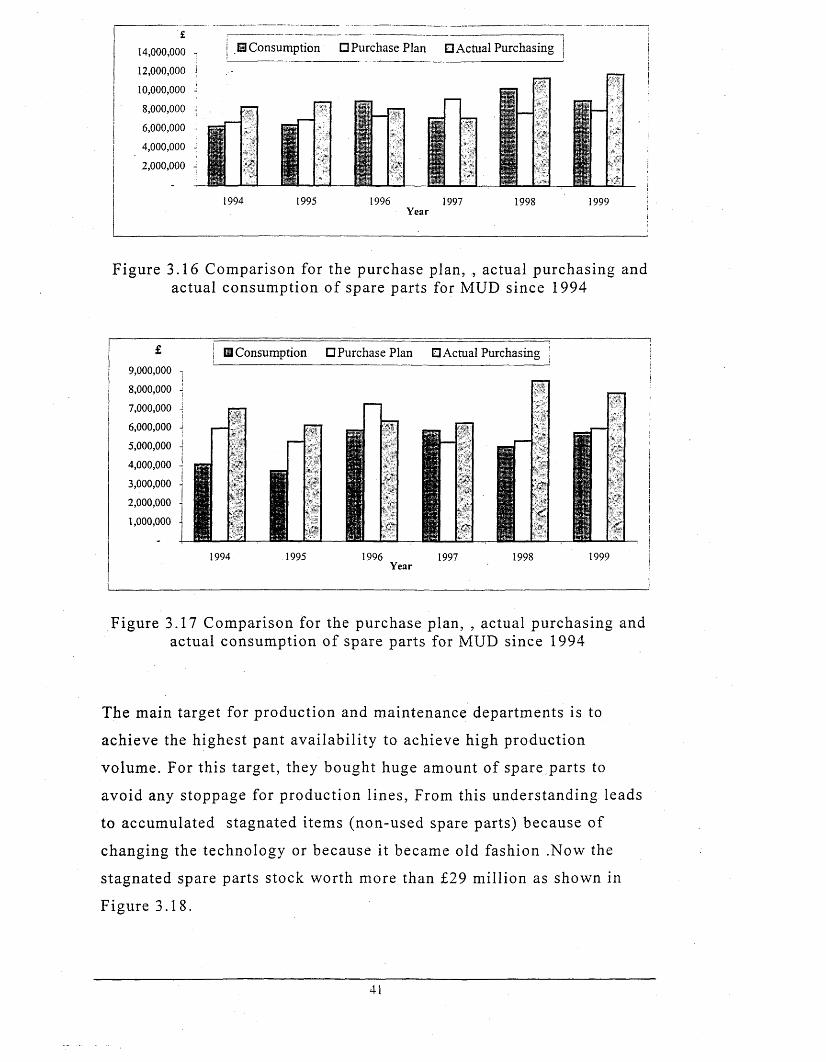
The m ain target for production and m aintenance departm ents is to
achieve the h ighest pant ava ilab ility to achieve high production
volum e. For th is target, they bought huge am ount o f spare parts to
avoid any stoppage for p roduction lines, From this understanding leads
to accum ulated stagnated item s (non-used spare parts) because o f
changing the technology or because it becam e old fashion .Now the
stagnated spare parts stock w orth more than £29 m illion as shown in
F igure 3.18.
41
3,600,000
3,100,000
2,600,000
2 , 100,000
1,600,000
1, 100,000
600,000
100,000
Figure 3.18 Value of stagnated spare parts for ANSDK sections
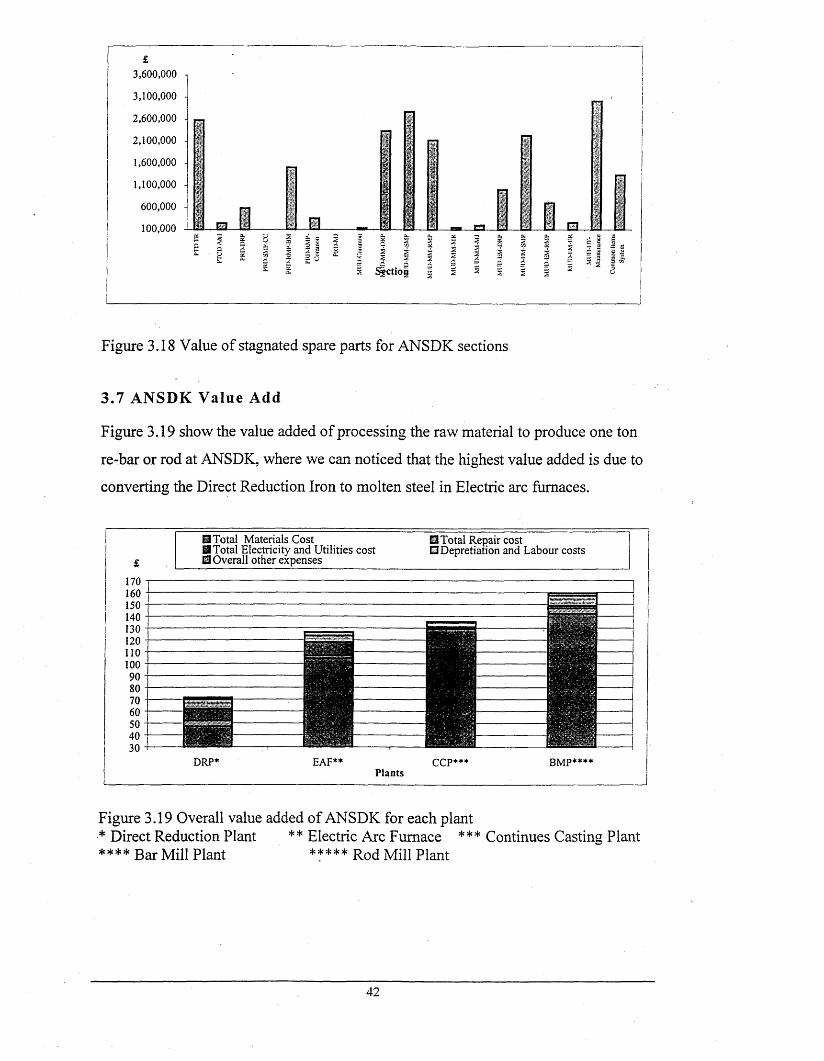
3 .7 ANSDK V alue A dd
Figure 3.19 show the value added of processing the raw material to produce one ton
re-bar or rod at ANSDK, where we can noticed that the highest value added is due to
converting the Direct Reduction Iron to molten steel in Electric arc furnaces.
17016015014013012011010090807060504030
H Total Materials CostlIT otal Electricity and Utilities cost0 Overall other expenses
11 Total Repair cost 0 Depredation and Labour costs
DRP* EAF*"Plants
CCP* BMP****
Figure 3.19 Overall value added of ANSDK for each plant* Direct Reduction Plant ** Electric Arc Furnace *** Continues Casting Plant* * * * Bar Mill Plant ***** r ocj ^ p j
42
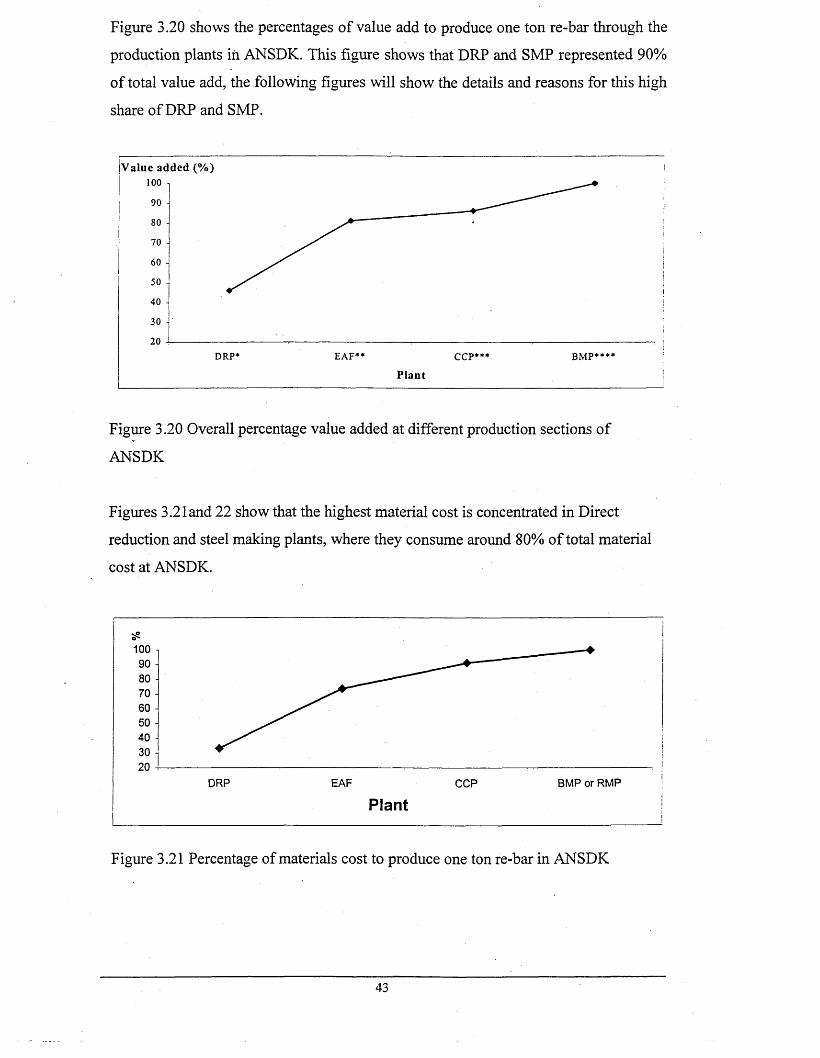
Figure 3.20 shows the percentages of value add to produce one ton re-bar through the
production plants in ANSDK. This figure shows that DRP and SMP represented 90%
of total value add, the following figures will show the details and reasons for this high
share of DRP and SMP.
Value added (% )
40 -
30 -
20 --------------------------------------------------------------- — ,----------------------------------------------------------------------, ,-----------------------------------------------
DRP* EAF** CCP*** B M P****
Plant
Figure 3.20 Overall percentage value added at different production sections of
ANSDK
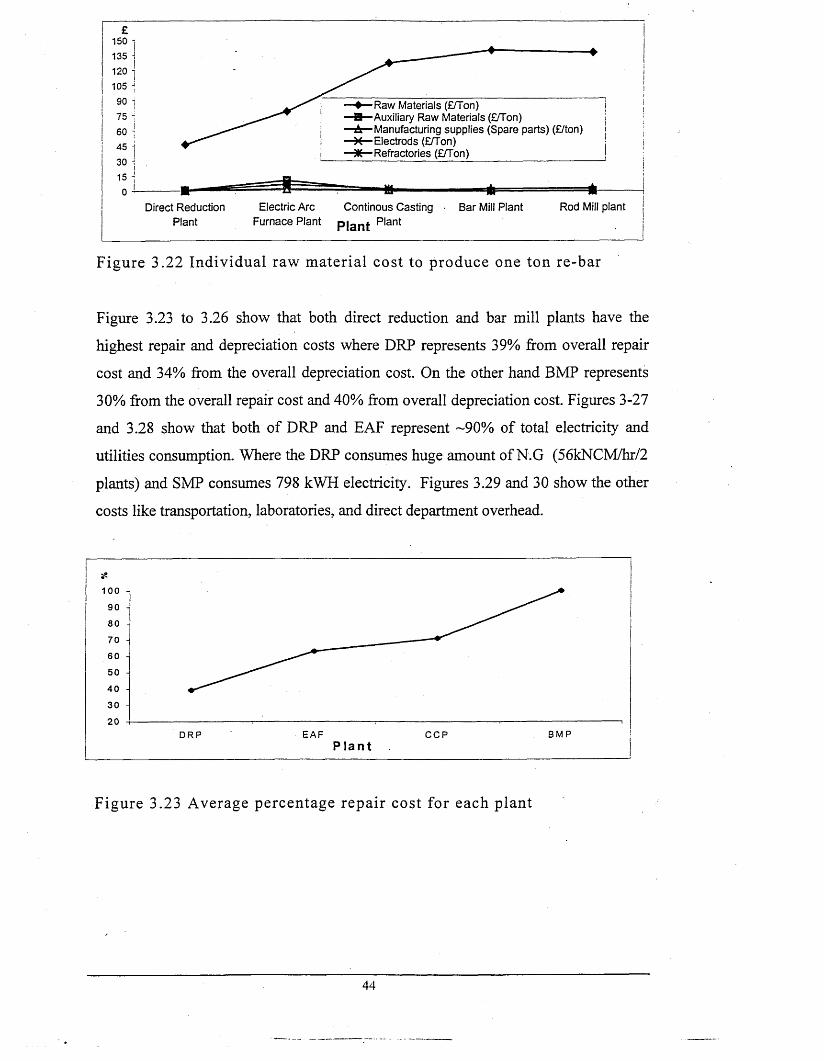
Figures 3.2land 22 show that the highest material cost is concentrated in Direct
reduction and steel making plants, where they consume around 80% of total material
cost at ANSDK.
1009080706050403020
Figure 3.21 Percentage of materials cost to produce one ton re-bar in ANSDK
________________ i________________ jDRP EAF CCP BMP or RMP !
Plant
43
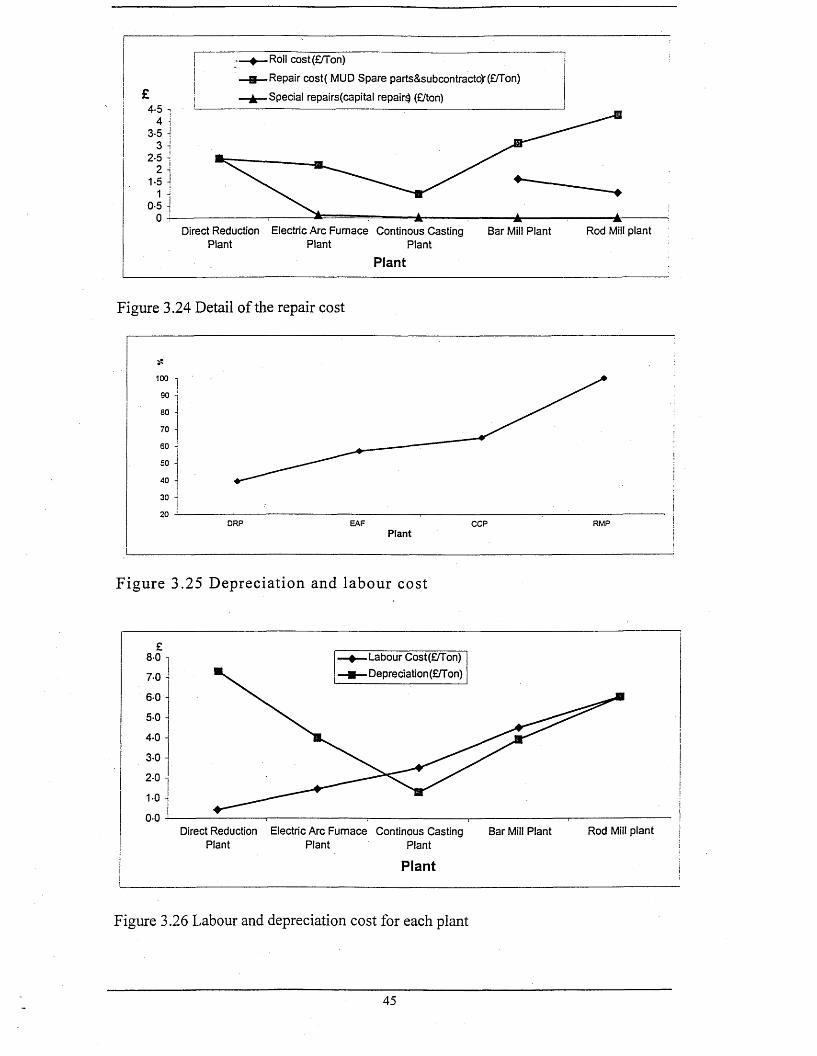
£150
—♦ Raw Materials (£/Ton)—B— Auxiliary Raw Materials (£/Ton)—A Manufacturing supplies (Spare parts) (£/ton)
— Electrods (£/Ton)—X Refractories (£/Ton) _______________
15 -j ta0 J---------- m m - Ml * ■ ■ lit----------
Direct Reduction Electric Arc Continous Casting • Bar Mill Plant Rod Mill plant Plant Furnace Plant p |a n t Plant
Figure 3.22 Indiv idual raw m aterial cost to produce one ton re-bar
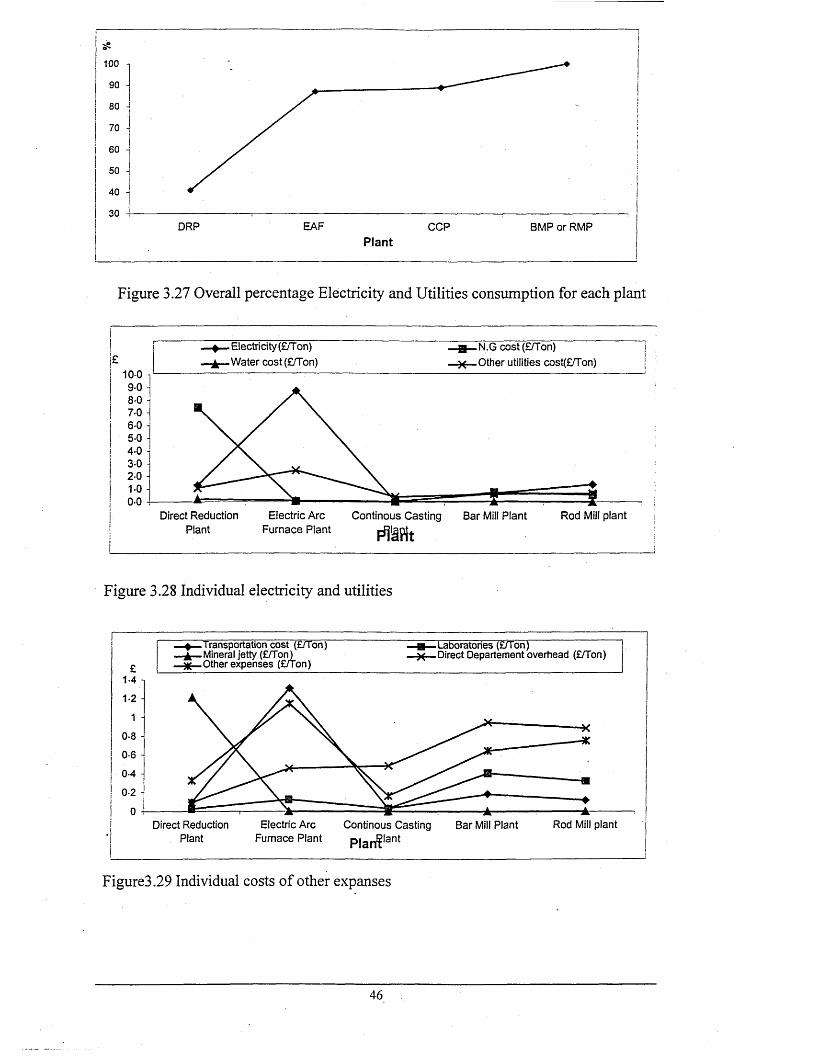
Figure 3.23 to 3.26 show that both direct reduction and bar mill plants have the
highest repair and depreciation costs where DRP represents 39% from overall repair
cost and 34% from the overall depreciation cost. On the other hand BMP represents
30% from the overall repair cost and 40% from overall depreciation cost. Figures 3-27
and 3.28 show that both of DRP and EAF represent -90% of total electricity and
utilities consumption. Where the DRP consumes huge amount of N.G (56kNCM/hr/2
plants) and SMP consumes 798 kWH electricity. Figures 3.29 and 30 show the other
costs like transportation, laboratories, and direct department overhead.
Figure 3.23 Average percentage repair cost for each plant
44
-Roll cost(£/Ton)
-Repair cost( MUD Spare parts&subcontracto^E/Ton)
-Special repairs(capital repair^ (£/ton)
Direct Reduction Electric Arc Furnace Continous Casting Plant Plant Plant
Plant
Bar Mill Plant Rod Mill plant
Figure 3.24 Detail of the repair cost
100 -
90
80
70
60
50 -
40
30
20
PlantCCP
Figure 3.25 D epreciation and labour cost
Labour Cost(£TTon) Depreciation (£/Ton)
8-0
7-0
5-0
4-0
3-0
2-0
0-0Rod Mill plantDirect Reduction Electric Arc Furnace Continous Casting
Plant PlantBar Mill Plant
Plant
PlantiL
Figure 3.26 Labour and depreciation cost for each plant
45
EAF CCP BMP or RMPPlant
Figure 3.27 Overall percentage Electricity and Utilities consumption for each plant
. Electricity (£/Ton) Water cost (£/Ton)
N.G cost(£/Ton)Other utilities cost(£/Ton)
10-09-08-07-06-05-04-03-02-0
0-0Electric Arc
Furnace PlantDirect Reduction
PlantContinous Casting Bar Mill Plant
t f 'iF i t
Rod Mill plant
Figure 3.28 Individual electricity and utilities
Transportation cost (£/Ton) Mineral jetty (£/Ton)Other expenses (£/Ton)
Laboratories (£/Ton)Direct Departement overhead (£/Ton)
1-4
1-2
0-8
0-6
0-4
0-2I
Continous Casting
PlarfflantRod Mill plantDirect Reduction
PlantElectric Arc
Furnace PlantBar Mill Plant
Figure3.29 Individual costs of other expanses
too90
80 -i
70
60 -
50
40 i
30DRP
46
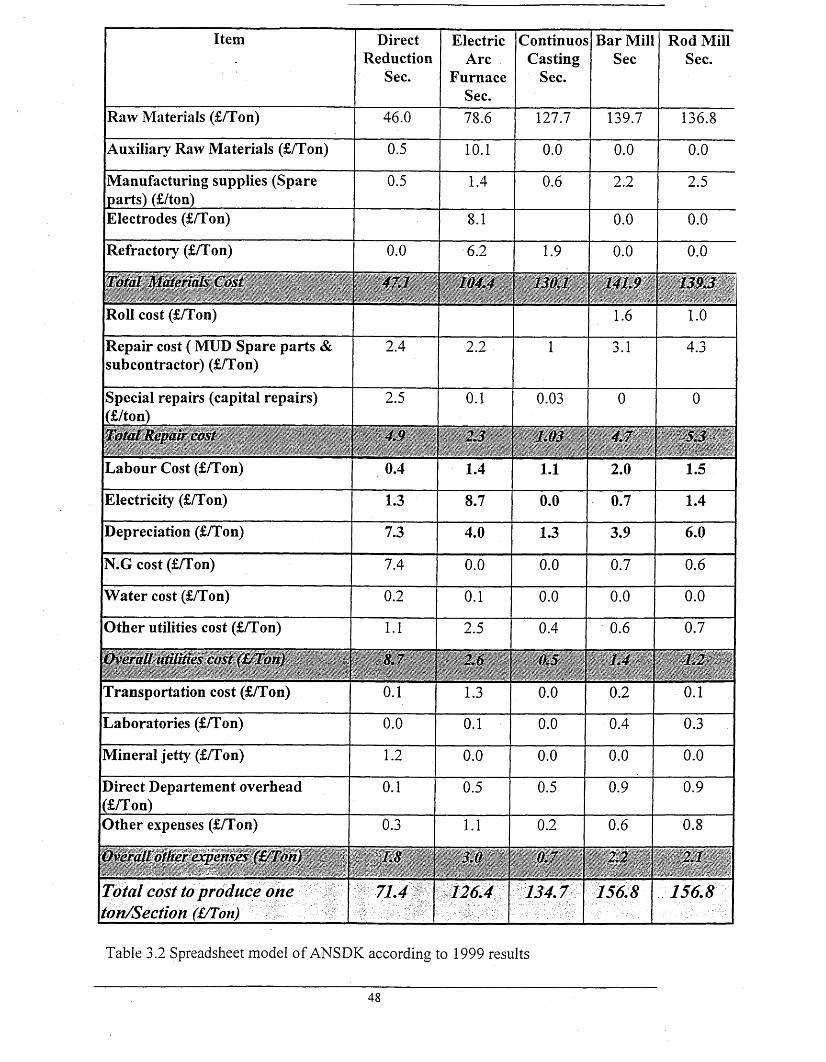
Item DirectReduction
Sec.
ElectricArc
FurnaceSec.
ContinuosCasting
Sec.
Bar Mil Sec
Rod Mill Sec.
Raw Materials (£/Ton) 46.0 78.6 127.7 139.7 136.8
Auxiliary Raw Materials (£/Ton) 0.5 10.1 0.0 0.0 0.0
Manufacturing supplies (Spare parts) (£/ton)
0.5 1.4 0.6 2.2 2.5
Electrodes (£/Ton) 8.1 0.0 0.0
Refractory (£/Ton) 0.0 6.2 1.9 0.0 0.0
Ip te / ftijjken a ls Cdjk 47.1 1Q4.4W ° ' i
141.9 139.3
Roll cost (£/Ton) 1.6 1.0
Repair cost ( MUD Spare parts & subcontractor) (£/Ton)
2.4 2.2 1 3.1 4.3
Special repairs (capital repairs) (£/ton)
2.5 0.1 0.03 0 0
4.9 M 1.03 j j j j j ■ S.S
Labour Cost (£/Ton) 0.4 1.4 1.1 2.0 1.5
Electricity (£/Ton) 1.3 8.7 0.0 0.7 1.4
Depreciation (£/Ton) 7.3 4.0 1.3 3.9 6.0
N.G cost (£/Ton) 7.4 0.0 0.0 0.7 0.6
Water cost (£/Ton) 0.2 0.1 0.0 0.0 0.0
Other utilities cost (£/Ton) 1.1 2.5 0.4 0.6 0.7
WfvurS^^Udes costl&Ton) f — JLZ¥ I '4
Transportation cost (£/Ton) 0.1 1.3 0.0 0.2 0.1
Laboratories (£/Ton) 0.0 0.1 0.0 0.4 0.3
Mineral jetty (£/Ton) 1.2 0.0 0.0 0.0 0.0
Direct Departement overhead (£/Ton)
0.1 0.5 0.5 0.9 0.9
Other expenses (£/Ton) 0.3 1.1 0.2 0.6 0.8
^ f e ( fimSSmS^SSm' ^ ̂ 4 4S // /*
1.8 ■ 0 I SftL 2.2
Total cost to produce one ton/Section (I/Ton)
71.4 12 6 .4 1 3 4 .7 1 5 6 .8 1 5 6 .8
Table 3.2 Spreadsheet model of ANSDK according to 1999 results
48
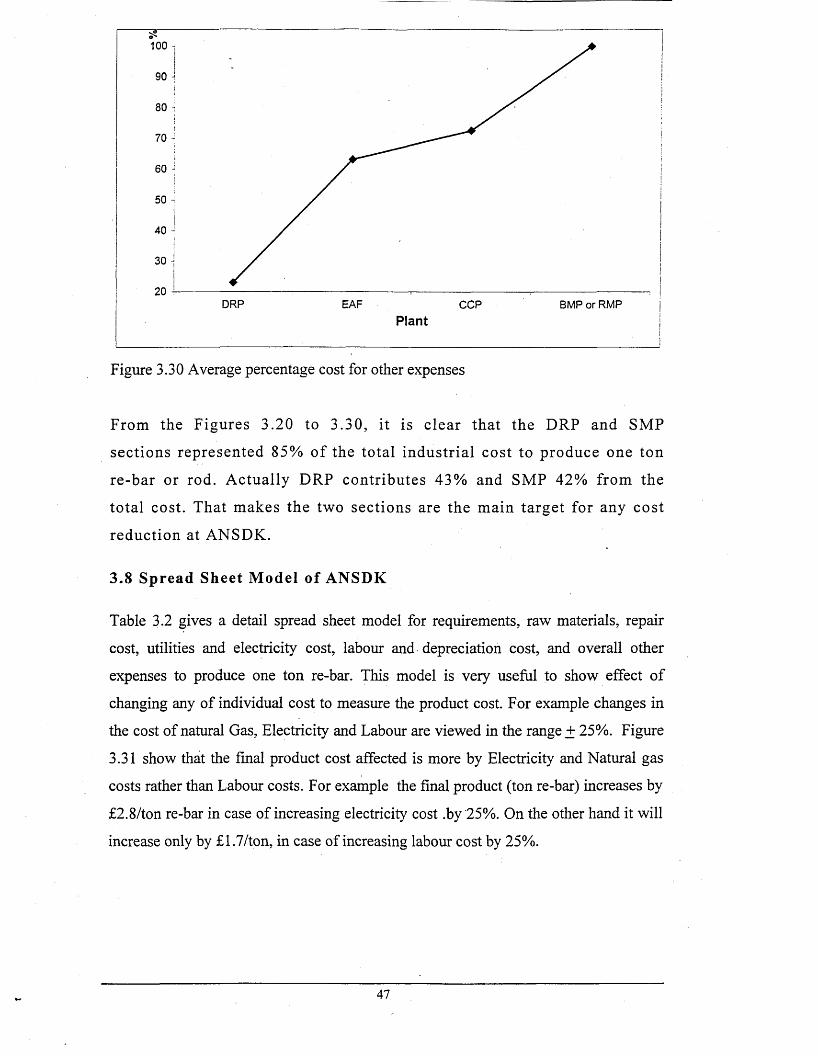
551 0 0 -j
!
90 -{
80 -
70 ^
60 ^
50 -ji I
40 -!|i
30 Jj
20 IDRP EAF CCP BMP or RMP j
P lant |
Figure 3.30 Average percentage cost for other expenses
From the Figures 3.20 to 3.30, it is clear that the DRP and SMP
sections represented 85% o f the to tal industria l cost to produce one ton
re-bar or rod. A ctually DRP contributes 43% and SMP 42% from the
to tal cost. That m akes the two sections are the m ain target for any cost
reduction at ANSDK.
3.8 Spread Sheet M odel o f ANSDK
Table 3.2 gives a detail spread sheet model for requirements, raw materials, repair
cost, utilities and electricity cost, labour and depreciation cost, and overall other
expenses to produce one ton re-bar. This model is very useful to show effect of
changing any of individual cost to measure the product cost. For example changes in
the cost of natural Gas, Electricity and Labour are viewed in the range + 25%. Figure
3.31 show that the final product cost affected is more by Electricity and Natural gas
costs rather than Labour costs. For example the final product (ton re-bar) increases by
£2.8/ton re-bar in case of increasing electricity cost .by 25%. On the other hand it will
increase only by £1.7/ton, in case of increasing labour cost by 25%.
47
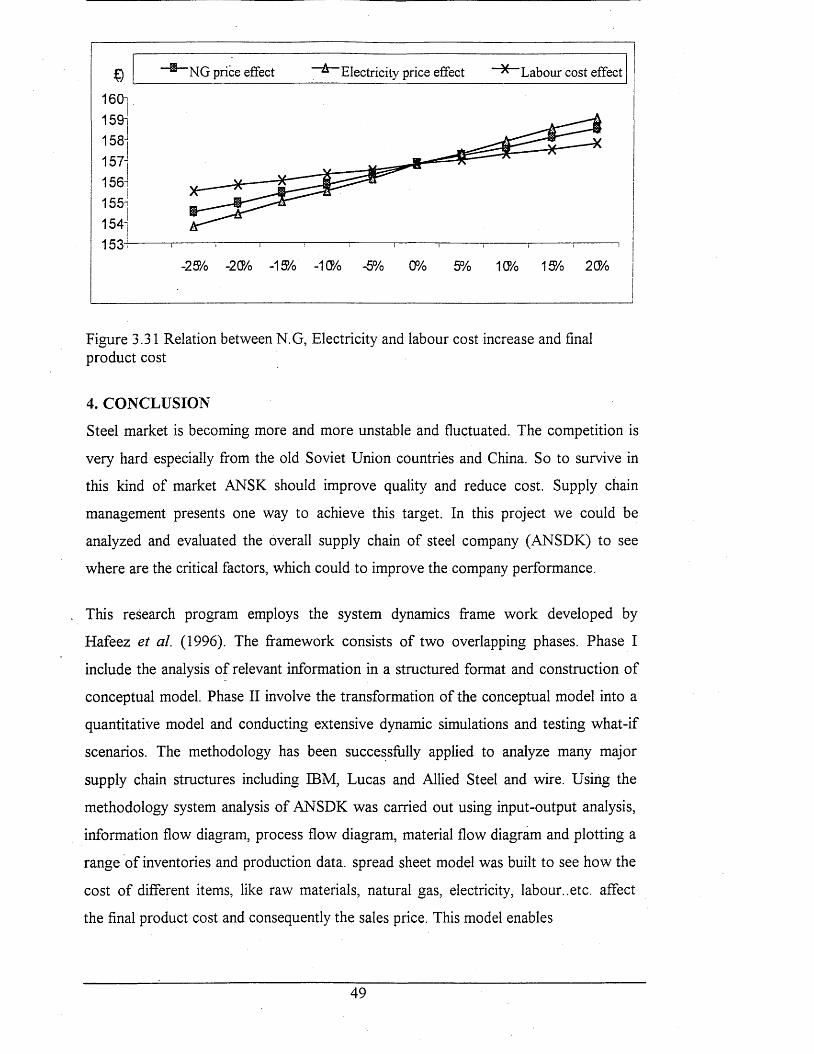
NG price effect ^ Electricity price effect ^ Labour cost effect
16 0 j
159iI158-j
157i
156i
155i
154-j 153+
-25>/o -2(7/o -15>/o -1<J/o -5% 0% 5% 1CP/o 15>/o 20>/o
Figure 3.31 Relation between N.G, Electricity and labour cost increase and final product cost
4. CONCLUSION
Steel market is becoming more and more unstable and fluctuated. The competition is
very hard especially from the old Soviet Union countries and China. So to survive in
this kind of market ANSK should improve quality and reduce cost. Supply chain
management presents one way to achieve this target. In this project we could be
analyzed and evaluated the overall supply chain of steel company (ANSDK) to see
where are the critical factors, which could to improve the company performance.
This research program employs the system dynamics frame work developed by
Hafeez et al. (1996). The framework consists of two overlapping phases. Phase I
include the analysis of relevant information in a structured format and construction of
conceptual model. Phase II involve the transformation of the conceptual model into a
quantitative model and conducting extensive dynamic simulations and testing what-if
scenarios. The methodology has been successfully applied to analyze many major
supply chain structures including IBM, Lucas and Allied Steel and wire. Using the
methodology system analysis of ANSDK was carried out using input-output analysis,
information flow diagram, process flow diagram, material flow diagram and plotting a
range of inventories and production data, spread sheet model was built to see how the
cost of different items, like raw materials, natural gas, electricity, labour..etc. affect
the final product cost and consequently the sales price. This model enables
49
ANSDK to predict what will be the effect on the final product cost in case of
changing any of the manufacturing cost items.
The analysis reveals that inventories contro l (raw m ateria ls, final
p roduct and spare parts) causes a big problem for (ANSDK), where the
inventory assets o f raw m ateria ls and spare parts represents £128
m illion . Spare parts inventory asset i ts e lf reached £90 m illion and raw
m ateria ls stock reached £38m illion. At tim e the net p ro fit was
decreased from £24.7m illionon 1997 to £14 .5m illion on 1998 (41.3% )
(See tab le 3.1). Inventories o f raw m ateria ls and spare parts are 5.2
tim es m ore than the net profit in 1997 and also represent 50% from
to ta l turn over o f the same year. Spare parts inventory alone causes a
big problem to ANSDK, where it costs ANSDK £90m illion(3.6 tim es
m ore than the 1997 net p rofit and 35% from the turn over o f the same
year, at a tim e the com pany try to reduce its expenses and prices to be
survive in a highly fluctuated m arket. Therefore it becom es
increasing ly im portant to study and analyse the spare parts inventory
system to m odify and reduce its cost. A m athem atical model to answ er
the questions o f how much to be ordered and when should it be ordered
m ay provide a very useful scenarios p lann ing tool for the company.
5. MPhil CONTRIBUTION
1. Reviewing supply chain modeling methodology, especially the spare parts
inventory control in steel company.
2. A case study company (ANSDK) was analyzed using a number of system dynamics
techniques such as system input-output analysis, flow charting,, and material &
information flow analysis.
3. Analyzing the inventory data for ANSDK specifically the spare parts inventory.
4. Establishing value-add and non value-add analysis for the ANSDK by taking into
account relevant labour, machining and energy consumption costs.
50
6. Ph.D WORK
Phase II (Ph.D. work) of the project focuses into the following objectives:
• To develop conceptual and analytical models for inventory control strategies
• To confirm the validity of proposed models via statistical/computer simulation
analysis.
• To suggest the dynamic behaviour of the steel industry spare parts supply chain
and re-engineering strategies (e.g. how to move more rapidly towards a Minimum
Reasonable Inventory (MRI) scenario in the presence of capacity constraints,
breakdowns and material supply lead-time bottlenecks).
The time scale for the next 24 months is illustrated in Appendix 4.
6.1 Conceptual M odel
Using the collection data, (kind of data which could be collected for the ANSDK
inventory is shown in Appendix 5) a conceptual model would be constructed to serve
as qualitative tool for spare parts supply chain. The conceptual model is to provide a
cause and effect relationship in decision making
6.2 Com puter Sim ulation M odel
The conceptual model would be translated into a block diagram format. The computer
model will be verified by showing it to relevant people in the company and then
validated by conducting case study
6.3 Sim ulating A lternative Spare Parts Inventory Control S trategies
An extensive computer simulation exercise would be conducted to test the
appropriateness of various inventory control strategies in a supply chain scenario. The
aim is to provide quantitative evidence of the benefit of using a range of inventory
control strategies. Company structure would be examined to establish appropriate
communication, co-ordination and control framework for implementing optimum
inventory control in the supply chain. Appropriate implementation model would be
presented.
51
7. Ph.D. CONTRIBUTION
By using the collection data, conceptual model would be constructed to serve as
qualitative tool for spare parts supply chain, to provide a cause and effect relationship
in decision making. Then this conceptual model could be translated into block
diagram format. The computer model will be verified by showing it to relevant people
in the company and then validated by conducting case study. An extensive computer
simulation exercise would be conducted to test the appropriateness of various
inventory control strategies in a supply chain scenario.
Company structure would be examined to establish appropriate communication, co
ordination and control framework for implementing optimum inventory control in
supply chain.
References
Ahmed M. El-Nozahy “Iron and steel industry in Egypt” Report for investment
national bank of Egypt, May 1999.
David L. Anderson, Frank E. Britt, and Donavon J. Faver “The seven principles of
supply chain Management” Logistic management home page.
Danis R.Towill “Time compression and supply chain management-a guided tour”
Logistic information management, volume 9. No 6, 1996 pp. 41-53
D.R Towill, M.M. Naim, and J.Wikner “Industrial Dynamics simulation models in the
design of the supply chains” International journal of physical distribution & logistics
management, Vol. 22, No.5, 1992
Fortuin, L. And Martin, H.) “Control of service parts” International Journal of
Operations and Production Management, 1999
Gattorna, J.L and Walters D. W “Managing the supply chain” First edition, Macmillan
Business 1996.
Ing Gunter Kneppe “From liquid steel to strip: the latest technologies from one
source” Arab Steel Magazine, Oct. 1999, pp25-33
Jayne C. Lewis, Mohamed M.Naim, and Denis R. Towill “An integrated approach to
re-engineering material and logistics control” International journal of physical
distribution & logistics management, Vol. 27, No.3, 1997, pp 197-209
J. Hammant, S.M. Disney, P. Childerhouse and M.M Naim “Modelling the
consequences of a strategic supply chain initiative of an automotive after market
operation” International journal of physical distribution & logistics management, Vol.
45, 1996, pp. 533-550.
I
Juha-Matti Lehtonen “A methodology for data gathering and analysis in a logistics
simulation project” Integrated Manufacturing systems, 8/6 (1997) 351-358, MCB
university press, ISSN 0957-6061.
John Walker “Base stock level determination for “insurance type” spare” ”
International journal of quality & reliability management, vol. 14 No. 6,1997,
pp.569-574.
K.Hafeez, M. Griffiths, J. Griffiths, M.M Naim “System design of a two-echelon steel
industry supply chain” Int.J. Production Economics 45 (1996) 121-130
Linda G. Sprague and John G.Wacker “Macroeconomic analysis of inventories:
learning from practice” Int.J.Production Economics 45 (1996) 231-237
M. Griffiths, K. Hafeez and M. Naim “Use of statistical techniques in the dynamic
modeling of industrial supply chain” Proc. 30th MATADOR Int. Conf., Manchester,
UK, pp.413-420.
M.L. Lachgar “A view on the reality and prospects of the Arab steel industry” Arab
Steel Magazine, Oct. 1999, pp 15-24
Niel Buxton “ An analysis for the Egyptian Re-bars market” Metal Bulletin
Research, 1999.
Nigel Slack, Stuart Chambers, Christine Harland, Alan Harrison and Rebort
Johnston “Operation Management” Pitman publishing, second edition, 1998.
Reinhard Wodlinger, Karl Baumgartner, Helmuth Neubauer “The steel world after
the Asian crisis” Arab Steel Magazine, Sep. 1999, pp 15-27
Rene Botter and Leonard Fortuin “Stocking strategy for service parts- a case study"
International Journal of operations & Production Management, Vol. 20 No. 6, 2000,
pp. 656-674.
II
R.L Ballard “Methods of inventory monitoring and measurement” Logistics
Information Management, vol.9. No. 3 1996 pp. 11-18
S.M. Disney, M.M. Naim and D.R. Towill “Dynamic simulation modelling for lean
logistics” International journal of physical & logistics management. Vol.27, No.3,
1997, pp. 174-196.
Stefanie Small, and Maureen M.McAndrews ( Keeping inventory moving)
Warehousing management Sep. (1998).
Susan Fowler “Egypt’s heavy metals industries for growth and consolidation”
LUBES, vol. 1, No. 4, April 2000, pp7-10.
Tomlinson, S.J., “Warehouse management and measurement software” , Warehouse
& Distribution Efficiency ’94 Conference, National Materials Handling Center,
Cranfield, Bedford, 1-3 February 1994
Waters, C.D.J “Inventory control and Management” John Willy and Sons LTD 1992
III