Embed Size (px)
Citation preview
October 9, 2013
REPORT #E13-264
Inventory of Commercial Energy Management and Information Systems (EMIS) for M&V Applications
Final Report
Prepared by:
Hannah Kramer, James Russell, Eliot Crowe,
and Joan Effinger - Portland Energy
Conservation, Inc. (PECI)
100 SW Main Street, Suite 1600
Portland, Oregon 97204
Northwest Energy Efficiency Alliance PHONE
503-688-5400 FAX
503-688-5447 EMAIL
Inventory of Commercial EMIS for M&V Applications
Table of Contents
Acknowledgments ....................................................................................................................... i
Executive Summary .................................................................................................................... ii
1. Introduction ................................................................................................................... 1
1.1. Background .......................................................................................................................... 2
1.2. EMIS Defined ....................................................................................................................... 3
1.3. Meter-Level EMIS Applications .......................................................................................... 5
2. Northwest EMIS Needs Assessment .............................................................................. 9
2.1. Needs Assessment Process .................................................................................................... 9
2.2. Needs Assessment Findings ................................................................................................ 10
2.2.1. Current Approaches ................................................................................................... 10
2.2.2. Meter-Level EMIS Pilots in Progress ......................................................................... 10
2.2.3. M&V Capability ........................................................................................................ 11
2.2.4. Future Interests .......................................................................................................... 11
2.2.5. Tool Recommendations ............................................................................................. 12
3. Meter-Level EMIS Inventory ....................................................................................... 13
3.1. Framework Design Process ................................................................................................ 13
3.2. Meter-Level EMIS Research .............................................................................................. 14
3.2.1. Screening ................................................................................................................... 14
3.2.2. Demonstrations .......................................................................................................... 15
3.3. Results................................................................................................................................. 16
3.3.1. Feature List and Descriptions ..................................................................................... 16
3.3.2. Final List of EMIS Included in the Inventory ............................................................. 18
4. Findings ....................................................................................................................... 19
4.1. M&V Methodologies Becoming More Transparent .......................................................... 20
4.2. Some Options Available for Calculating Annual Savings ................................................. 21
4.3. Accounting for Changes ..................................................................................................... 21
4.4. Few Calibrated Simulation Approaches ............................................................................ 22
4.5. Several Options Available for Utilities without Interval Meters....................................... 22
4.6. EMIS Products and Offerings Continue to Evolve ........................................................... 22

Inventory of Commercial EMIS for M&V Applications
5. Conclusions and Recommendations ............................................................................. 25
References ................................................................................................................................ 27
APPENDIX A – Needs Assessment Interview Guide ................................................................ 29
APPENDIX B – Inventory Features Defined............................................................................. 31
APPENDIX C – EMIS Inventory Workbook ............................................................................ 33
Inventory of Commercial EMIS for M&V Applications
Northwest Energy Efficiency Alliance (NEEA) – © 2013 – All Rights Reserved i
Acknowledgments
Prepared by PECI
Hannah Kramer, James Russell, Eliot Crowe, Joan Effinger, Amber Buhl, Lia Webster
Technical Advisory Group
As a part of this project, PECI assembled a Technical Advisory Group (TAG) made up of
individuals from utilities, national laboratories, and other relevant organizations to provide input
and commentary on the inventory design, Energy Management and Information Systems (EMIS)
selection, and usability of the results. PECI and Northwest Energy Efficiency Alliance (NEEA)
would like to thank the TAG members for their time and input:
Mark Rehley, NEEA (Project Sponsor)
John Jennings, NEEA
Amit Kulkarni, National Grid
David Rodenhizer, Seattle City Light
Jackie Goss, Energy Trust of Oregon
Jessica Granderson, Lawrence Berkeley National Laboratory
Bing Tso, SBW Consulting
Lauren Gage, Bonneville Power Administration
Leo Carrillo, Pacific Gas and Electric
Ryan Lambert, Puget Sound Energy
Sandra Henry, ComEd
Inventory of Commercial EMIS for M&V Applications
Northwest Energy Efficiency Alliance (NEEA) – © 2013 – All Rights Reserved ii
Executive Summary
Introduction
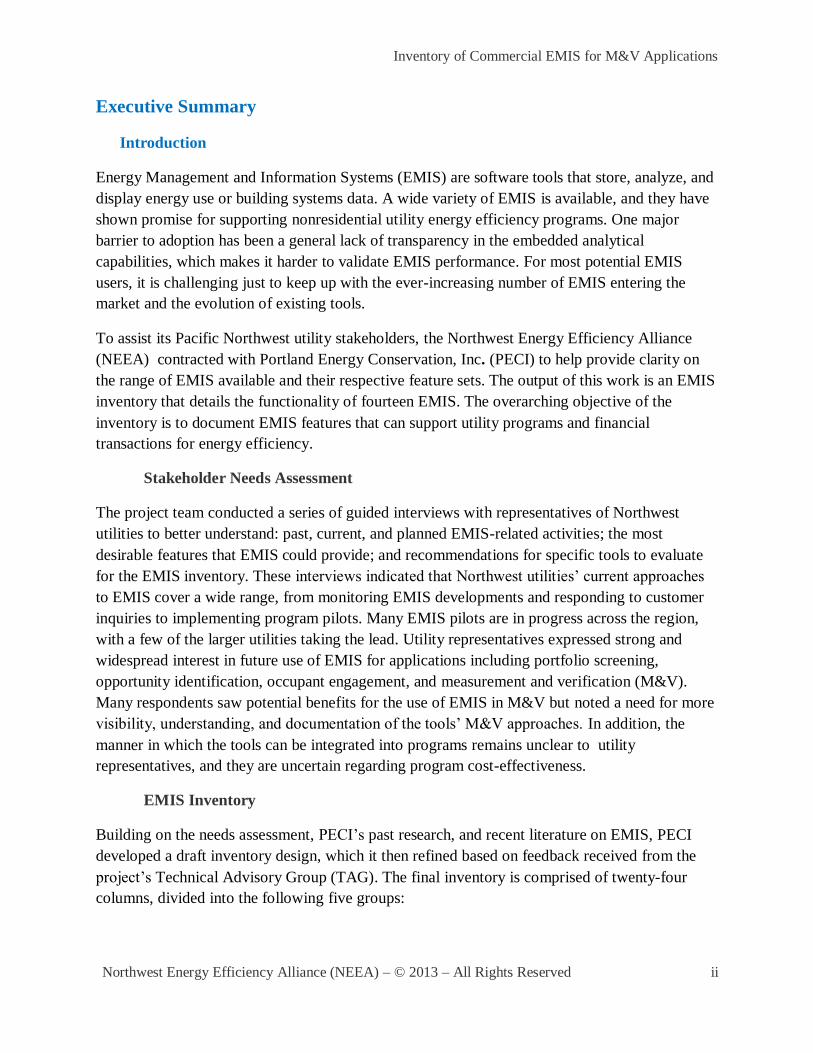
Energy Management and Information Systems (EMIS) are software tools that store, analyze, and
display energy use or building systems data. A wide variety of EMIS is available, and they have
shown promise for supporting nonresidential utility energy efficiency programs. One major
barrier to adoption has been a general lack of transparency in the embedded analytical
capabilities, which makes it harder to validate EMIS performance. For most potential EMIS
users, it is challenging just to keep up with the ever-increasing number of EMIS entering the
market and the evolution of existing tools.
To assist its Pacific Northwest utility stakeholders, the Northwest Energy Efficiency Alliance
(NEEA) contracted with Portland Energy Conservation, Inc. (PECI) to help provide clarity on
the range of EMIS available and their respective feature sets. The output of this work is an EMIS
inventory that details the functionality of fourteen EMIS. The overarching objective of the
inventory is to document EMIS features that can support utility programs and financial
transactions for energy efficiency.
Stakeholder Needs Assessment
The project team conducted a series of guided interviews with representatives of Northwest
utilities to better understand: past, current, and planned EMIS-related activities; the most
desirable features that EMIS could provide; and recommendations for specific tools to evaluate
for the EMIS inventory. These interviews indicated that Northwest utilities’ current approaches
to EMIS cover a wide range, from monitoring EMIS developments and responding to customer
inquiries to implementing program pilots. Many EMIS pilots are in progress across the region,
with a few of the larger utilities taking the lead. Utility representatives expressed strong and
widespread interest in future use of EMIS for applications including portfolio screening,
opportunity identification, occupant engagement, and measurement and verification (M&V).
Many respondents saw potential benefits for the use of EMIS in M&V but noted a need for more
visibility, understanding, and documentation of the tools’ M&V approaches. In addition, the
manner in which the tools can be integrated into programs remains unclear to utility
representatives, and they are uncertain regarding program cost-effectiveness.
EMIS Inventory
Building on the needs assessment, PECI’s past research, and recent literature on EMIS, PECI
developed a draft inventory design, which it then refined based on feedback received from the
project’s Technical Advisory Group (TAG). The final inventory is comprised of twenty-four
columns, divided into the following five groups:
Inventory of Commercial EMIS for M&V Applications
Northwest Energy Efficiency Alliance (NEEA) – © 2013 – All Rights Reserved iii
Product Information: EMIS name, vendor, website
General Features: Data security protocol, end-user audience
M&V Features: Details defining M&V methodology
Technical Features: Other features offered in addition to M&V
Applications: Information on pilots/programs and installations
PECI carefully documented the feature definition and data entry requirements for each of the
columns in the inventory spreadsheet to ensure consistency and to enable comparisons across
EMIS.
PECI developed an initial target list of fifty-one EMIS for consideration, including tools
suggested by NEEA stakeholders and other tools known to the project team or reported in recent
literature. For EMIS to qualify for inclusion in the inventory, PECI set minimum criteria for
M&V capabilities and market presence. Screening the target list against the minimum criteria
reduced the list to approximately twenty tools. Several more tools were removed from the
inventory after the software demonstration showed that the tools did not sufficiently meet the
minimum criteria for inclusion in the inventory.
Findings
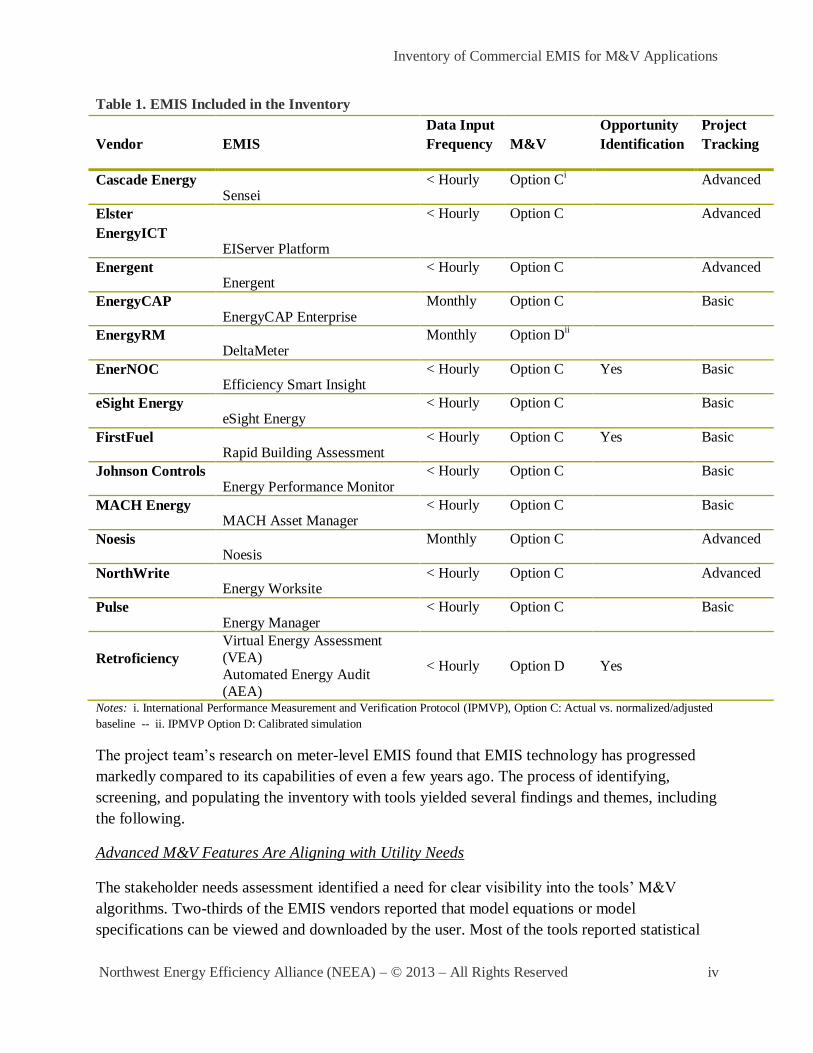
The final inventory is populated with fourteen EMIS, which are shown in the table 1.
Inventory of Commercial EMIS for M&V Applications
Northwest Energy Efficiency Alliance (NEEA) – © 2013 – All Rights Reserved iv
Table 1. EMIS Included in the Inventory
Vendor EMIS
Data Input
Frequency M&V
Opportunity
Identification
Project
Tracking
Cascade Energy Sensei
< Hourly Option Ci Advanced
Elster
EnergyICT EIServer Platform
< Hourly Option C Advanced
Energent Energent
< Hourly Option C Advanced
EnergyCAP EnergyCAP Enterprise
Monthly Option C Basic
EnergyRM DeltaMeter
Monthly Option Dii
EnerNOC Efficiency Smart Insight
< Hourly Option C Yes Basic
eSight Energy eSight Energy
< Hourly Option C Basic
FirstFuel Rapid Building Assessment
< Hourly Option C Yes Basic
Johnson Controls Energy Performance Monitor
< Hourly Option C Basic
MACH Energy MACH Asset Manager
< Hourly Option C Basic
Noesis Noesis
Monthly Option C Advanced
NorthWrite Energy Worksite
< Hourly Option C Advanced
Pulse Energy Manager
< Hourly Option C Basic
Retroficiency
Virtual Energy Assessment
(VEA)
Automated Energy Audit
(AEA)
< Hourly Option D Yes
Notes: i. International Performance Measurement and Verification Protocol (IPMVP), Option C: Actual vs. normalized/adjusted
baseline -- ii. IPMVP Option D: Calibrated simulation
The project team’s research on meter-level EMIS found that EMIS technology has progressed
markedly compared to its capabilities of even a few years ago. The process of identifying,
screening, and populating the inventory with tools yielded several findings and themes, including
the following.
Advanced M&V Features Are Aligning with Utility Needs
The stakeholder needs assessment identified a need for clear visibility into the tools’ M&V
algorithms. Two-thirds of the EMIS vendors reported that model equations or model
specifications can be viewed and downloaded by the user. Most of the tools reported statistical
Inventory of Commercial EMIS for M&V Applications
Northwest Energy Efficiency Alliance (NEEA) – © 2013 – All Rights Reserved v
metrics for “model fit” (i.e., how well the theoretical energy model matched actual energy use) to
tool users.
Almost all of the EMIS in the inventory support an International Performance Measurement and
Verification Protocol (IPMVP) Option C approach to M&V, under which the actual post-
implementation energy usage is compared to an adjusted baseline (“avoided energy use”
approach). This approach typically requires twelve months of post-implementation data to report
on annual savings. However, five of the tools in the inventory reported an ability to perform
“normalized” savings analyses in which the model estimates annual savings using less than a
year of post-implementation energy use data. In addition, seven of the meter-level EMIS vendors
in this inventory reported that they are starting to include methods for accounting for non-project
effects, such as occupancy changes.
Just two of the tools in the inventory support IPMVP Option D calibrated simulation; these tools
implement whole-building simulations informed by meter data. One key benefit of simulations is
that the tools may be used to calculate energy savings for individual measures or end uses.
The inventory includes three examples of EMIS that provide advanced M&V capabilities using
monthly data. One drawback of using monthly data is that the method is not well-suited to
projects with relatively low savings (less than ten percent of whole-building energy use). Since
higher resolution interval data is not available for many commercial buildings, PECI considered
it essential to include monthly tools in the inventory.
EMIS Products and Offerings Continue to Evolve
EMIS have evolved significantly over the previous few years, and this evolution is expected to
continue. As part of this evolution, many EMIS in the inventory now share a common set of
basic features and capabilities, especially around data visualization and benchmarking. Beyond
those basic features, tools in the inventory are differentiating in two key ways. First, the level of
automation and user expertise required varies among tools. Second, an increasing number of
EMIS are offering project tracking capabilities and some ability to disaggregate energy use and
to identify measure opportunities.
Conclusions
The state of the art in EMIS technology has progressed markedly when compared to capabilities
of a few years ago. Utilities have a number of options for EMIS that can support program M&V
(even if smart metering infrastructure is not in place), and that offer other beneficial features in
addition to the software’s M&V capabilities.
The recent evolution of advanced M&V capabilities presents utilities an opportunity to determine
appropriate methods for validating the tools for program applications. This is not simply a case
of validating new tools that can replicate existing programmatic methods; capitalizing on the

Inventory of Commercial EMIS for M&V Applications
Northwest Energy Efficiency Alliance (NEEA) – © 2013 – All Rights Reserved vi
M&V capabilities of EMIS requires the development of whole-building programmatic
approaches that can satisfy the needs of building owners, utilities, and regulators. If meter-level
EMIS features are proven to be robust and the programmatic approaches are cost-effective, this
opens the way for rapid growth of whole-building approaches to energy efficiency.
Inventory of Commercial EMIS for M&V Applications
PECI - 1
1. Introduction
Energy Management and Information Systems (EMIS) are software tools that store, analyze, and
display energy use or building system data. The number of commercially available EMIS has
increased dramatically over the past ten years, as have the analytical and reporting capabilities of
the tools. This evolution has in part been driven by the increased availability of energy use data
at resolutions of one hour or less, due to utility smart meter installations and declining costs of
data acquisition hardware. Tools are now available with features ranging from simple graphical
display of time series data to sophisticated algorithms for identifying performance anomalies and
for measuring energy savings. The market is characterized by a growing pool of EMIS vendors
and varying levels of rigor and analytical approaches employed by the tools.
Utilities have shown interest in using EMIS to expedite energy efficiency projects, reduce costs,
and improve customer engagement, with the ultimate goal of increasing energy savings. While
the potential for these tools to support energy efficiency programs is substantial, utilities in the
US are currently in the pilot or early program phase of development, with no defined program
best practices. Utilities face challenges in finding an effective method for comparing and
evaluating EMIS options given the number and complexity of the offerings available on the
market.
To assist its Pacific Northwest utility stakeholders, the Northwest Energy Efficiency Alliance
(NEEA) contracted with Portland Energy Conservation, Inc. (PECI) to develop an EMIS
inventory. The objective of the inventory is to document EMIS features that could support future
utility programs and energy efficiency financial transactions. The focus is on EMIS with the
ability to measure and verify project energy savings. M&V using EMIS presents a potential
solution to one of the energy efficiency industry’s biggest challenges: making energy savings
reporting more transparent and reliable.
The key tasks under this project were:
A needs assessment to understand NEEA stakeholder perspectives on requirements and
opportunities related to use of EMIS
Design of an EMIS inventory (in the form of a spreadsheet) that captured desirable and
essential EMIS features as determined through the needs assessment
Population of the EMIS inventory, based on the project team’s research and web-based
demonstrations of EMIS
Inventory of Commercial EMIS for M&V Applications
PECI - 2
This report documents the EMIS inventory development process and summarizes the key
findings from the research. The report concludes with recommendations for how NEEA might
further advance the use of EMIS to support Northwest energy efficiency programs and energy
efficiency transactions.
1.1. Background
The Sixth Northwest Conservation and Electric Power Plan (Sixth Power Plan) calls for meeting
eighty-five percent of new energy needs through improved energy efficiency (Northwest Power
and Conservation Council 2010). This aggressive goal is driving utilities to explore more
comprehensive energy efficiency program approaches to achieve deeper savings. Currently,
commercial energy efficiency programs typically apply a “widget-based” approach, wherein
savings are counted for each new piece of efficient technology installed (such as higher
efficiency lighting). While these programs have produced lasting savings, they usually consist of
a single intervention as opposed to a comprehensive whole-building approach, and reporting of
project benefits is rarely based on actual energy measurements. Existing building commissioning
(EBCx) or energy audit programs use a comprehensive approach, but identifying, quantifying,
and verifying energy efficiency opportunities requires considerable time and expense.
For utilities to successfully deploy projects with comprehensive savings on a large scale cost-
effectively, they need technically robust, low-cost and scalable methods for enabling, estimating,
and quantifying project savings. Using monthly data analysis to quantify savings has been
manually applied on projects with high savings (typically more than ten percent). However,
quantifying savings from lower-impact approaches such as operational and maintenance (O&M)
and behavior-based approaches requires higher-resolution data (such as hourly or daily interval
meter data). Research has shown that utilities can detect whole-building savings of around five
percent by using data at intervals of one hour or less to create the energy regressions.1 Higher-
resolution data can also reduce the length of time required to develop annualized savings
estimates (at least nine, but ideally twelve months of post-implementation energy use data is
needed to achieve reasonable accuracy using monthly data).
While analyzing whole-building meter data has the potential to facilitate quantifying project
savings, successful manual interval data analysis is a relatively rare skill that is both time-
consuming and subject to different applications by different analysts. Leveraging EMIS for
whole-building analysis represents a largely untapped opportunity to automate data analysis,
reduce variations in the calculation methodologies, and at the same time reduce costs.
1 Several resources document the relationship between data resolution and savings magnitude that can be identified at the whole
building level, including Effinger, Effinger, and Friedman 2012; Jump 2008; Katipamula, Reddy, and Claridge 1995; and
Katipamula, Reddy, and Claridge 1994.
Inventory of Commercial EMIS for M&V Applications
PECI - 3
1.2. EMIS Defined
EMIS are enabling tools that support users’ efforts to improve the energy efficiency of their
buildings by providing better access to energy and system data and by applying analytics to these
data. Energy efficiency experts have developed several research reports and guides over the last
five years to characterize EMIS features and to develop an overall terminology framework; these
efforts are ongoing (Friedman et al. 2011, Granderson et al. 2011, Granderson et al. 2009).
Where possible, the terminology and feature classifications used in this report align with other
industry efforts.
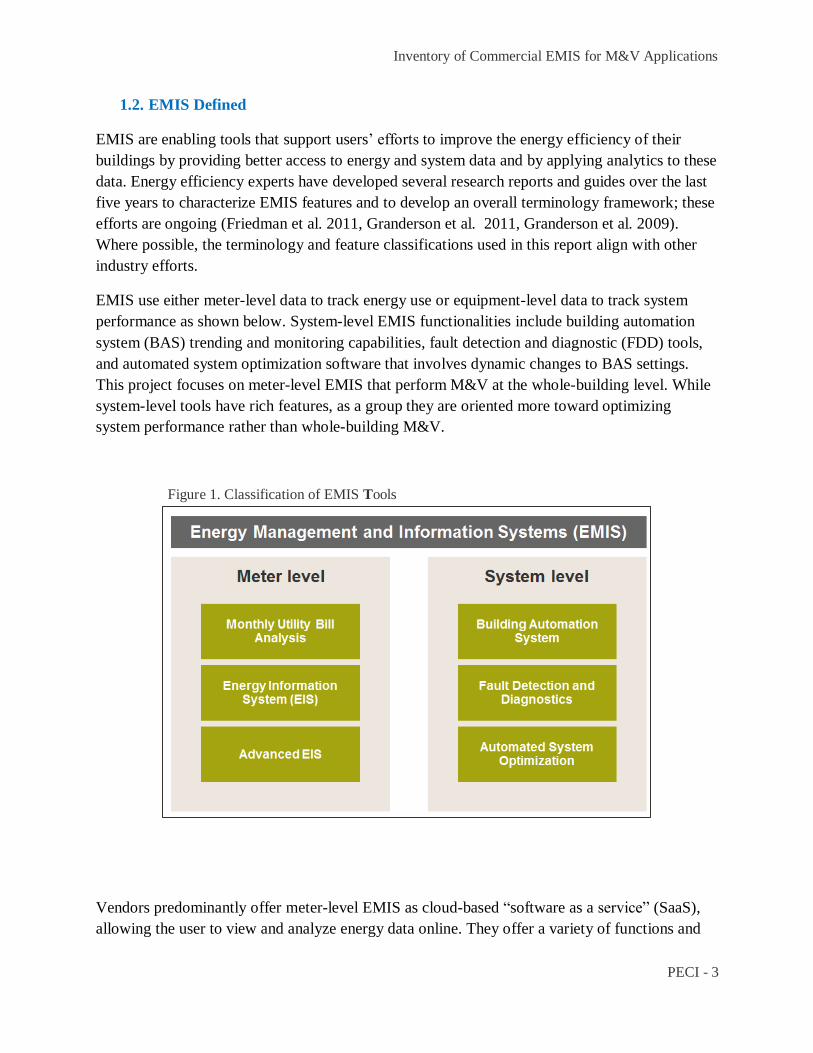
EMIS use either meter-level data to track energy use or equipment-level data to track system
performance as shown below. System-level EMIS functionalities include building automation
system (BAS) trending and monitoring capabilities, fault detection and diagnostic (FDD) tools,
and automated system optimization software that involves dynamic changes to BAS settings.
This project focuses on meter-level EMIS that perform M&V at the whole-building level. While
system-level tools have rich features, as a group they are oriented more toward optimizing
system performance rather than whole-building M&V.
Figure 1. Classification of EMIS Tools
Vendors predominantly offer meter-level EMIS as cloud-based “software as a service” (SaaS),
allowing the user to view and analyze energy data online. They offer a variety of functions and
Inventory of Commercial EMIS for M&V Applications
PECI - 4
features that are driven by their respective target users, typically building owners, property
managers, operators, and in some cases, electric and gas utilities. However, certain core features
are nearly universal. Such core features of meter-level EMIS include:
Data security: The vendor has systems and policies in place to ensure safe storage and
transmittal of data.
Data quality assurance: Flagging and resolution of corrupt or missing data downloaded
from meters.
Data visualization: At a minimum this includes the ability to view energy use profiles
over time in a graphical format. Many tools have additional more advanced data
visualization features.
Data import/export: The ability to upload historical data to the EMIS and also to export
data from the EMIS for further analysis.
Benchmarking: The ability to compare energy use across a portfolio of buildings to
determine the best and worst performers.
Energy cost estimation: At a minimum this includes the ability to estimate energy costs
using an average cost per kWh or cost per therm.
The meter-level column defines three subcategories of EMIS: Monthly utility bill analysis,
Energy Information Systems (EIS), and Advanced EIS. Each of these categories includes the
core features of meter-level EMIS discussed above; they differ in the granularity of data they
support and in the complexity of additional features they provide. Monthly utility bill analysis
tools are primarily distinguished from the other two categories by their use of monthly data,
whereas EIS and Advanced EIS use more granular interval data.
Monthly Utility Bill Analysis: Monthly data is used for high-level analysis of large
opportunities that may be detected in monthly data (such as high gas use during summer
months).
EIS: Provides the capability for the user to analyze energy consumption patterns using a
variety of standard charts and metrics (often called a “dashboard”). EIS enables a trained
user to identify problems more easily and quickly than does monthly utility bill analysis
software.
Advanced EIS: Includes the capabilities of EIS plus one or more advanced functions,
such as load disaggregation and end-use benchmarking, energy efficiency opportunity
identification, and integrated M&V. Advanced EIS may also be able to track ongoing
building performance in comparison with historical baseline models and automatically
alert users when energy use is higher than expected.
Inventory of Commercial EMIS for M&V Applications
PECI - 5
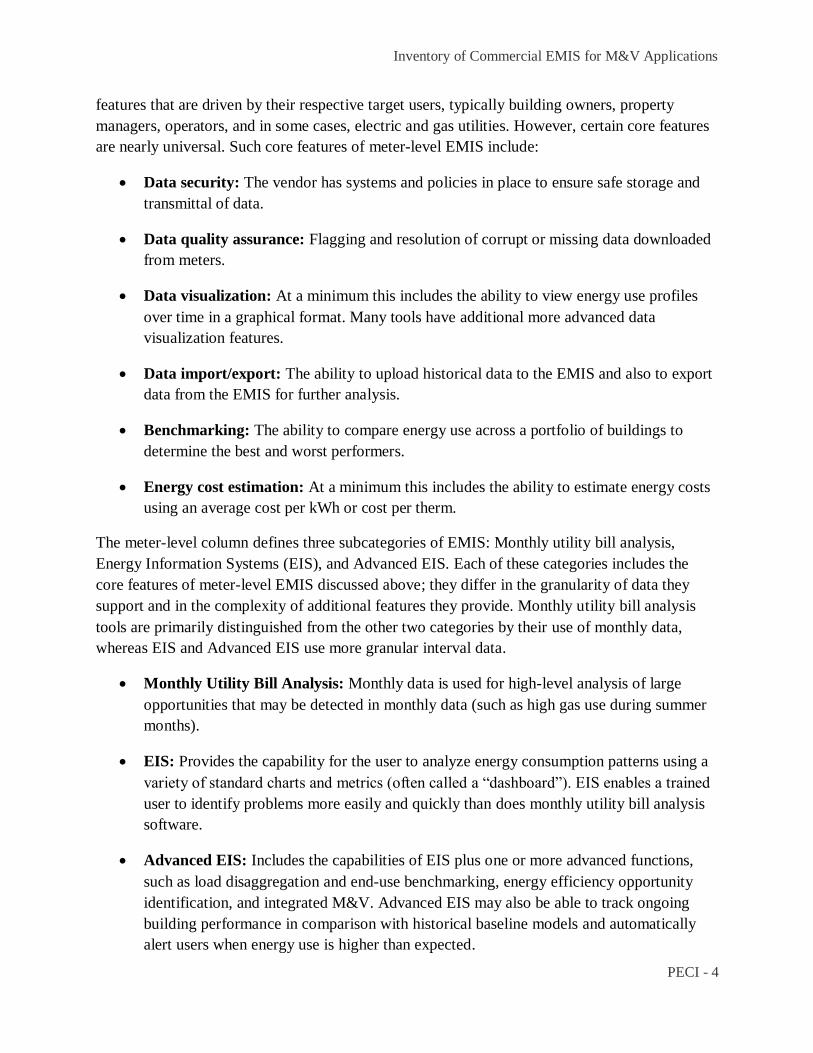
Figure 2 illustrates the distinction between EIS and Advanced EIS, showing the typical features
associated with EIS tools and the features that are considered advanced.
Figure 2. Features Distinguishing EIS from Advanced EIS
Acquiring and analyzing energy data for a meter-level EMIS requires metering hardware, data
storage, and communication devices. Meeting this infrastructure requirement involves either
utility interval meters and a meter data management system or a separate metering and
communication system installed at the site.
1.3. Meter-Level EMIS Applications
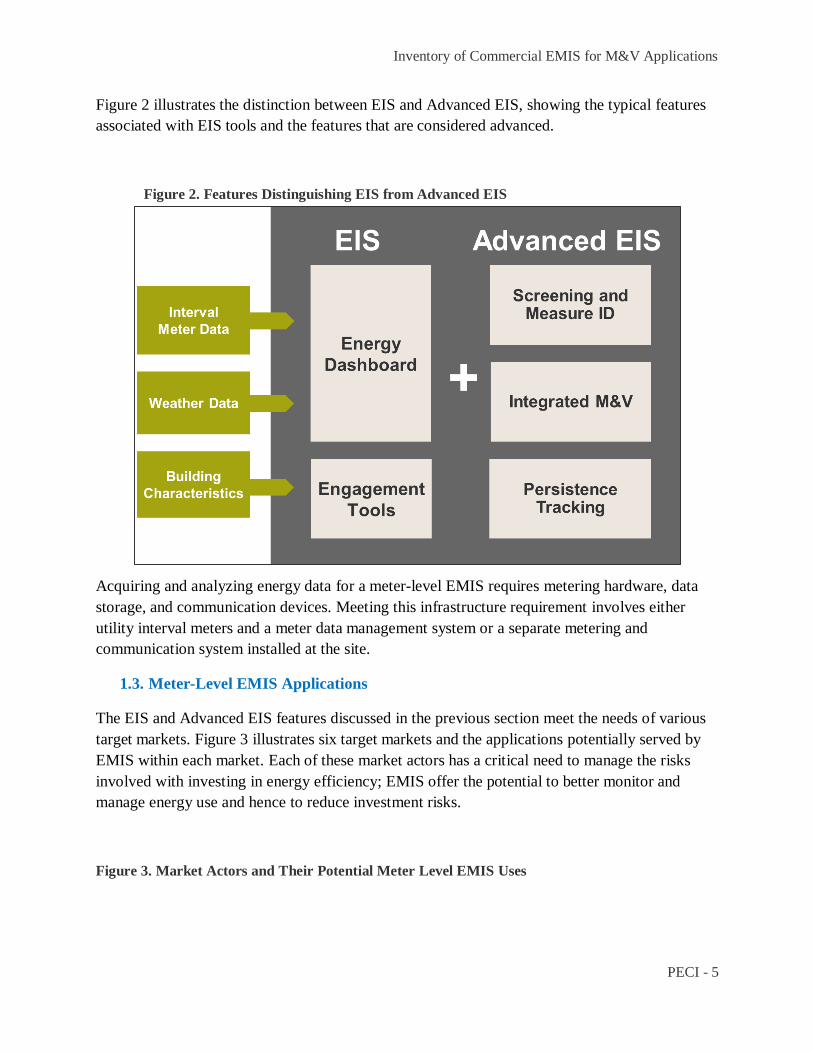
The EIS and Advanced EIS features discussed in the previous section meet the needs of various
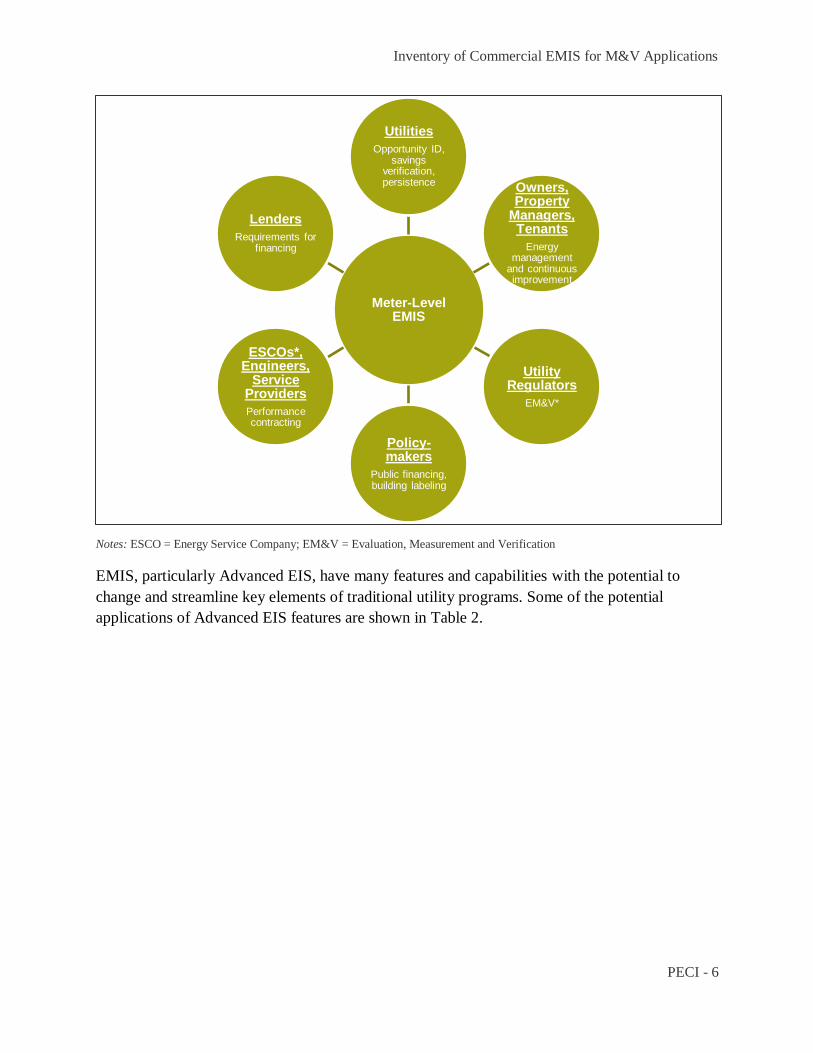
target markets. Figure 3 illustrates six target markets and the applications potentially served by
EMIS within each market. Each of these market actors has a critical need to manage the risks
involved with investing in energy efficiency; EMIS offer the potential to better monitor and
manage energy use and hence to reduce investment risks.
Figure 3. Market Actors and Their Potential Meter Level EMIS Uses
Inventory of Commercial EMIS for M&V Applications
PECI - 6
Notes: ESCO = Energy Service Company; EM&V = Evaluation, Measurement and Verification
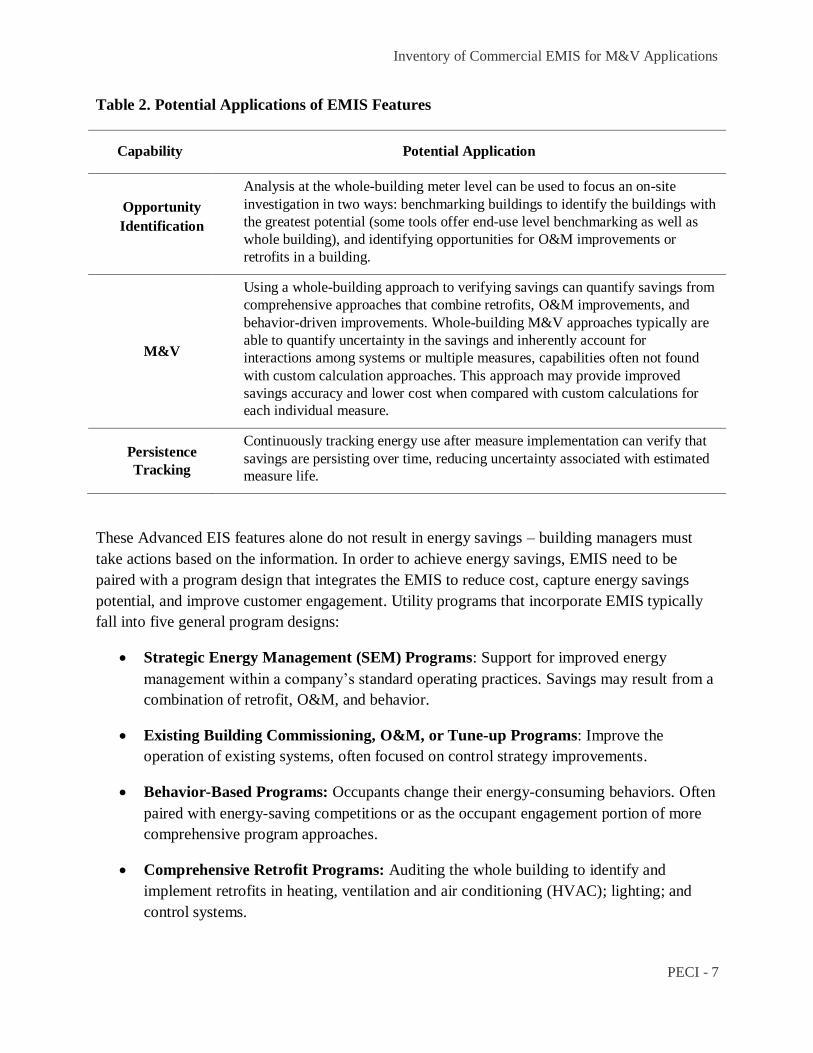
EMIS, particularly Advanced EIS, have many features and capabilities with the potential to
change and streamline key elements of traditional utility programs. Some of the potential
applications of Advanced EIS features are shown in Table 2.
Meter-Level EMIS
Utilities
Opportunity ID, savings
verification, persistence Owners,
Property Managers, Tenants
Energy management
and continuous improvement
Utility Regulators
EM&V*
Policy-makers
Public financing, building labeling
ESCOs*, Engineers,
Service Providers
Performance contracting
Lenders
Requirements for financing
Inventory of Commercial EMIS for M&V Applications
PECI - 7
Table 2. Potential Applications of EMIS Features
Capability Potential Application
Opportunity
Identification
Analysis at the whole-building meter level can be used to focus an on-site
investigation in two ways: benchmarking buildings to identify the buildings with
the greatest potential (some tools offer end-use level benchmarking as well as
whole building), and identifying opportunities for O&M improvements or
retrofits in a building.
M&V
Using a whole-building approach to verifying savings can quantify savings from
comprehensive approaches that combine retrofits, O&M improvements, and
behavior-driven improvements. Whole-building M&V approaches typically are
able to quantify uncertainty in the savings and inherently account for
interactions among systems or multiple measures, capabilities often not found
with custom calculation approaches. This approach may provide improved
savings accuracy and lower cost when compared with custom calculations for
each individual measure.
Persistence
Tracking
Continuously tracking energy use after measure implementation can verify that
savings are persisting over time, reducing uncertainty associated with estimated
measure life.
These Advanced EIS features alone do not result in energy savings – building managers must
take actions based on the information. In order to achieve energy savings, EMIS need to be
paired with a program design that integrates the EMIS to reduce cost, capture energy savings
potential, and improve customer engagement. Utility programs that incorporate EMIS typically
fall into five general program designs:
Strategic Energy Management (SEM) Programs: Support for improved energy
management within a company’s standard operating practices. Savings may result from a
combination of retrofit, O&M, and behavior.
Existing Building Commissioning, O&M, or Tune-up Programs: Improve the
operation of existing systems, often focused on control strategy improvements.
Behavior-Based Programs: Occupants change their energy-consuming behaviors. Often
paired with energy-saving competitions or as the occupant engagement portion of more
comprehensive program approaches.
Comprehensive Retrofit Programs: Auditing the whole building to identify and
implement retrofits in heating, ventilation and air conditioning (HVAC); lighting; and
control systems.

Inventory of Commercial EMIS for M&V Applications
PECI - 8
Marketing-Only Programs: The intent is to engage customers and funnel projects into
existing programs.
The Consortium for Energy Efficiency (CEE) has documented whole-building performance
programs and pilot activities by utilities across the country (CEE 2012). The past three years
have seen a stark increase in EMIS-enabled whole-building pilots and programs.
Inventory of Commercial EMIS for M&V Applications
PECI - 9
2. Northwest EMIS Needs Assessment
To complete this project, PECI first contacted NEEA members to understand their needs related
to meter-level EMIS products and to document existing uses of such products. Early in 2013,
PECI conducted interviews of eleven stakeholders in Northwest energy efficiency programs
from eight NEEA member organizations.
These phone interviews lasted between thirty minutes and one hour. Respondents’ backgrounds
included planning/EM&V (six), engineering (four), and program management (one). They
represented three investor-owned utilities, three other regional energy efficiency organizations,
and two public utilities.
Several themes emerged from the interviews:
Respondents’ current approaches to EMIS cover a wide range, from monitoring EMIS
developments and responding to customer inquiries to proactive piloting.
Many EMIS pilots are in progress across the region, with a handful of larger utilities and
energy efficiency providers taking the lead.
Respondents expressed strong and universal interest in future use of EMIS for
applications including portfolio screening, opportunity identification, occupant
engagement, and M&V.
While many respondents see potential benefits for the use of EMIS in M&V, they
generally see a need for more visibility, understanding, and documentation of the tools’
M&V approaches.
The needs assessment process and results are described below.
2.1. Needs Assessment Process
The project team conducted a needs assessment via guided interviews that allowed freedom to
explore several topic areas within a structured framework. The interview guide (Appendix A)
covered the following topic areas:
Past and current EMIS programs or pilots: A discussion of each interviewee’s
organization’s experience using EMIS in programs or pilots. Those with such experience
discussed the EMIS tool(s) used, how it was used, the end-user of the tool, and any
lessons learned from the experience.
Other EMIS knowledge and experience: Some respondents had experience with EMIS
beyond specific pilots and programs operated by their organizations. For example, some
Inventory of Commercial EMIS for M&V Applications
PECI - 10
had conducted their own market research to identify available tools. PECI asked for their
insights into both the specific tools and the EMIS market in general.
Incorporating EMIS in future plans: This typically constituted the longest and most
wide-ranging part of the discussion, during which respondents were asked if they had
plans to use EMIS in the future, and if so, how. Respondents discussed both programs
and markets in which EMIS could be used as well as EMIS capabilities that might serve
them.
Important questions to answer: Respondents identified key issues that needed to be
resolved relative to EMIS. For example, interviewers asked them to identify specific
EMIS tools about which they wanted to know more, and specific EMIS capabilities that
they wanted to understand.
2.2. Needs Assessment Findings
These interviews directly informed the following assessment of current approaches and future
plans for meter-level EMIS.
2.2.1. Current Approaches
The larger utilities and energy efficiency providers are actively testing multiple EMIS products
and pursuing pilots. Smaller entities reported constraints that prevent them from actively
pursuing EMIS-based approaches, principally limited staff and budget resources and the
capabilities of their metering infrastructure.
Three utilities indicated that their current metering infrastructure did not provide the interval data
necessary for EIS or Advanced EIS, but that it would in five or ten years. They are meanwhile
following industry developments, but are only implementing projects in response to customer
requests. All respondents seemed very conscious of the need to demonstrate cost-effective
applications before going beyond pilot-scale deployments of EMIS.
2.2.2. Meter-Level EMIS Pilots in Progress
Utilities are piloting the use of meter-level EMIS as an enabling tool for energy efficiency and
demand management programs across the Northwest. Pilots involve between one and one
hundred sites and feature different applications of meter-level EMIS with varying degrees of
reliance on the EMIS. Specific pilots described by stakeholders are outlined below:
Avista worked with the University of Idaho to install an EMIS created by Resource
Associates International to view five-minute resolution energy use data for sixty-five
buildings.
Inventory of Commercial EMIS for M&V Applications
PECI - 11
The Bonneville Power Administration (BPA) is supporting an emerging technology study
that has installed Catalyst, a sophisticated rooftop HVAC controller with EMIS features,
at forty-three sites.
With BPA’s support, Snohomish Public Utility District (PUD) conducted a behavior-
based pilot with ten Starbucks stores that used the Lucid Design EMIS to present energy
information to drive behavior change.
BPA and Seattle City Light are using data center-focused EMIS products at three sites in
the Seattle area.
The Energy Trust of Oregon (ETO) has engaged Northwrite/Air Advice and Kite &
Lightning in EMIS-enabled pilots for small and medium business customers.
Snohomish PUD deployed the Pulse Energy EMIS for one of the school districts in its
resource conservation management program.
Northwrite’s EMIS is being used in the hospitals program managed by NEEA.
PacifiCorp reports piloting Advanced EIS products at three sites (industrial, light
manufacturing, and large commercial) both to identify opportunities and for M&V.
Utilities mentioned additional pilots underway that are protected by non-disclosure agreements.
The variety of approaches being explored is indicative of the region’s strong interest in using
EMIS.
2.2.3. M&V Capability
All interviewees saw some role for EMIS in supporting M&V for energy efficiency programs.
They also expressed strong senses of potential challenges, most frequently citing clear visibility
into and validation of a tool’s M&V algorithms to understand the approach and limits of
application. One interviewee from the EM&V perspective stated, “I have to know exactly what’s
being calculated and how… there has to be transparency in how it is being done.” Two other
interviewees noted the necessity for program managers and customers of clearly stating the
uncertainty in energy savings estimates.
2.2.4. Future Interests
Overall, interviewees expressed cautious optimism about the future of EMIS in the region. They
identified many ways that EMIS could help, including portfolio tracking and screening, occupant
engagement, identification of opportunities, M&V, and persistence. No single feature or strategy
emerged from the interviews as most interesting or promising. This may reflect the interviewees’
uncertainty about EMIS capabilities, the small sample size, or perhaps the fact that many tools

Inventory of Commercial EMIS for M&V Applications
PECI - 12
are now reporting many features and benefits. Many interviewees expressed considerable
uncertainty regarding how and where the use of EMIS could be cost-effective.
2.2.5. Tool Recommendations
In addition to their feedback above, the interviewees recommended inclusion of a number of
meter-level EMIS. PECI added these tools to the initial list of tools considered for inclusion in
the EMIS inventory.
Inventory of Commercial EMIS for M&V Applications
PECI - 13
3. Meter-Level EMIS Inventory
PECI next designed an inventory framework to capture information about meter-level EMIS
M&V capabilities and other features identified as important through the needs assessment. Once
the framework was established, PECI identified, screened, and documented EMIS in the
inventory.
3.1. Framework Design Process
PECI intended the inventory design process to deliver a framework that would support a clear
and objective snapshot of EMIS features based on self-reported information from vendors and
web-based demonstrations. To design the inventory, the project team leveraged existing research
and conducted a review of the most recent literature, including:
PECI Emerging Technology Research – PECI’s internal Emerging Technology
research group has evaluated over eighty EMIS tools across the Residential, Grocery,
Commercial, and Industrial markets. The classifications and standard data collection
fields served as the starting point for the NEEA inventory.
California Energy Commission Research – A recent project funded by the California
Energy Commission’s Public Interest Energy Research (PIER) Program studied how
energy and system information is being used to improve building operations. The project
identified current industry best practices in performance tracking. The work concluded
with the development of a practical handbook for selecting the best-fit building
performance tracking management strategy and supporting technology category
(Friedman et al. 2011). This handbook served as the basis for the taxonomy of EMIS
used in this project.
Recent Literature – The project team also reviewed recent literature from Pacific Gas &
Electric (Summers, Chan, and Hilger 2013), Lawrence Berkeley National Laboratory
(Granderson et al. 2009), and the Consortium for Energy Efficiency (CEE 2012, CEE
2011). The team used this literature to identify features and functions to evaluate during
the design of the inventory, to identify possible EMIS tools to include in the inventory,
and also to identify various pilots and programs across the US that are utilizing EMIS.
Through this process, PECI expanded a preliminary feature set identified by stakeholders during
the needs assessment, and refined it into categories consistent with the growing body of research
on EMIS. The project team presented the inventory features to the TAG for review.
Inventory of Commercial EMIS for M&V Applications
PECI - 14
3.2. Meter-Level EMIS Research
The following section describes the process PECI employed to identify, screen, and evaluate
meter-level EMIS to populate the inventory. It outlines the tools included in the pool, why some
tools were eliminated, and the tools ultimately included in the inventory.
3.2.1. Screening
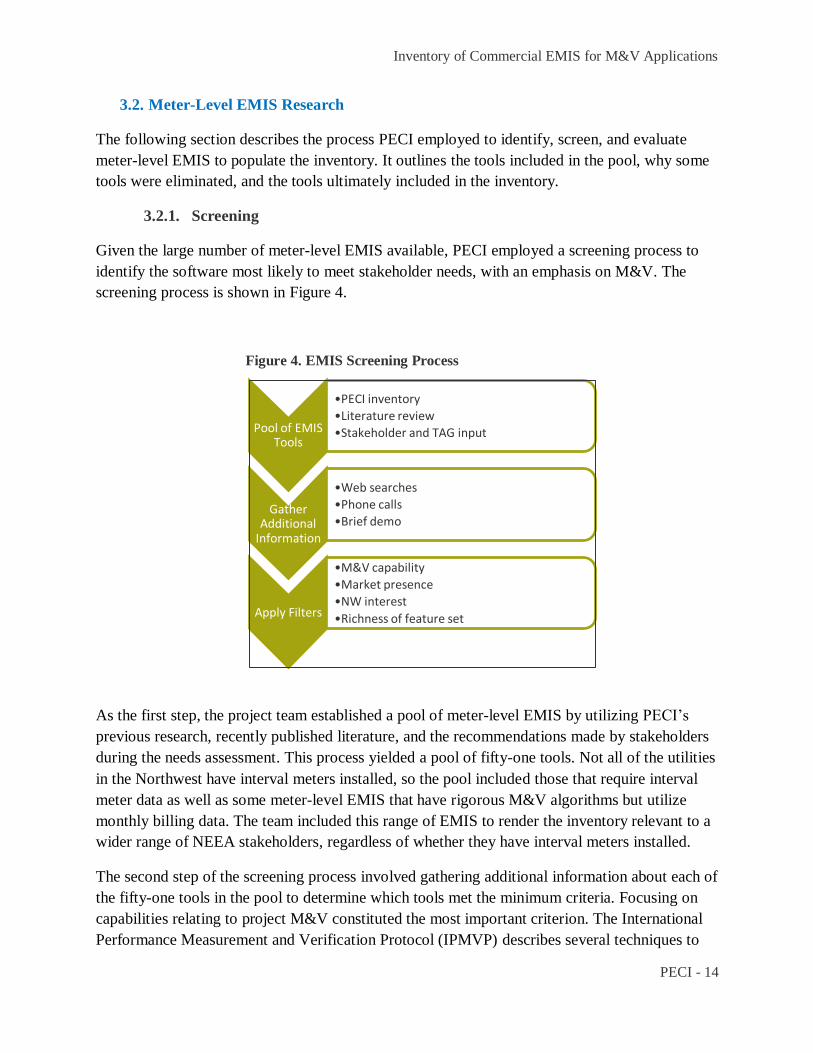
Given the large number of meter-level EMIS available, PECI employed a screening process to
identify the software most likely to meet stakeholder needs, with an emphasis on M&V. The
screening process is shown in Figure 4.
Figure 4. EMIS Screening Process
As the first step, the project team established a pool of meter-level EMIS by utilizing PECI’s
previous research, recently published literature, and the recommendations made by stakeholders
during the needs assessment. This process yielded a pool of fifty-one tools. Not all of the utilities
in the Northwest have interval meters installed, so the pool included those that require interval
meter data as well as some meter-level EMIS that have rigorous M&V algorithms but utilize
monthly billing data. The team included this range of EMIS to render the inventory relevant to a
wider range of NEEA stakeholders, regardless of whether they have interval meters installed.
The second step of the screening process involved gathering additional information about each of
the fifty-one tools in the pool to determine which tools met the minimum criteria. Focusing on
capabilities relating to project M&V constituted the most important criterion. The International
Performance Measurement and Verification Protocol (IPMVP) describes several techniques to
Pool of EMIS Tools
•PECI inventory
•Literature review
•Stakeholder and TAG input
Gather Additional
Information
•Web searches
•Phone calls
•Brief demo
Apply Filters
•M&V capability
•Market presence
•NW interest
•Richness of feature set
Inventory of Commercial EMIS for M&V Applications
PECI - 15
calculate energy savings.2 Aside from benchmarking annual energy use against reference values,
meter-level EMIS supports two M&V approaches:
IPMVP Option C Whole Facility: Uses whole-building energy data and drivers of
building energy use, such as temperature, schedule, occupancy, and day of week, to
construct an empirical model (such as regression, bin analysis, or neural network) of the
building’s baseline energy use.
IPMVP Option D Calibrated Simulation: Uses building simulation software to create a
computer model that predicts building energy performance. Building simulation models
represent the thermodynamic flow of energy through building systems. Energy modeling
requires skilled users to provide numerous inputs about the characteristics of building
systems and operations, and to then calibrate the model to confirm that its energy use
estimations align with actual energy use.
As this project was not intended to provide a comprehensive inventory of all meter-level EMIS,
the inventory focused on capturing information about tools that go beyond the basic M&V
capability of benchmarking annual energy use against reference values. Therefore, PECI set a
minimum M&V capability for a tool to be included in the inventory. The team used the
following screening criteria to determine which tools to review and include in the inventory:
Advanced M&V: The ability to create a predictive model (with at least weather
normalization, but preferably including other independent variables) using either interval
or monthly meter data, or the ability to perform calibrated simulations.
Market presence: Tools with a significant number of installations (i.e., those that aren’t
brand-new to the market).
Regional interest: Tools being used by Northwest utilities either with a significant
Northwest presence or specifically recommended by NEEA’s stakeholders.
Richness of feature set: Tools that include features in which NEEA’s stakeholders are
interested (in addition to M&V capabilities).
The team applied advanced M&V capability as the most important criterion.
3.2.2. Demonstrations
2 IPMVP also describes two types of savings estimates: 1. Avoided Energy Use, which retrospectively measures energy use as
the difference between a baseline model and actual performance, and 2. Normalized Savings, which can be used to estimate
future savings using assumed future values of the independent variables, such as typical meteorological year (TMY) weather
data. PECI did not use these two types of savings estimates in the screening process, but are identified in the inventory.

Inventory of Commercial EMIS for M&V Applications
PECI - 16
To aid in populating the inventory with the fourteen tools, the project team engaged in in-depth
conversations with each vendor and received live web-based demonstrations of each EMIS.
These demonstrations focused on collecting the information needed to report on each feature in
the inventory. Each demonstration lasted about an hour and often included follow-up questions
via email to clarify PECI’s understanding from the demonstration.
Given that the commercial EMIS market is rapidly evolving with new product offerings and
additional features being continuously released, this inventory should be viewed as a snapshot of
current features; it does not report on features the vendors are developing, testing, or have on
their roadmaps for future development.
3.3. Results
The final EMIS inventory (Appendix C) is a Microsoft® Excel® workbook comprising two
worksheets. A “Descriptions” worksheet shows all the inventory features included in the
inventory, with the type of input expected for each feature and a definition of the feature. The
“Inventory” worksheet presents the data collected for each EMIS. Each EMIS feature is
presented in one column and each EMIS is displayed in one row.
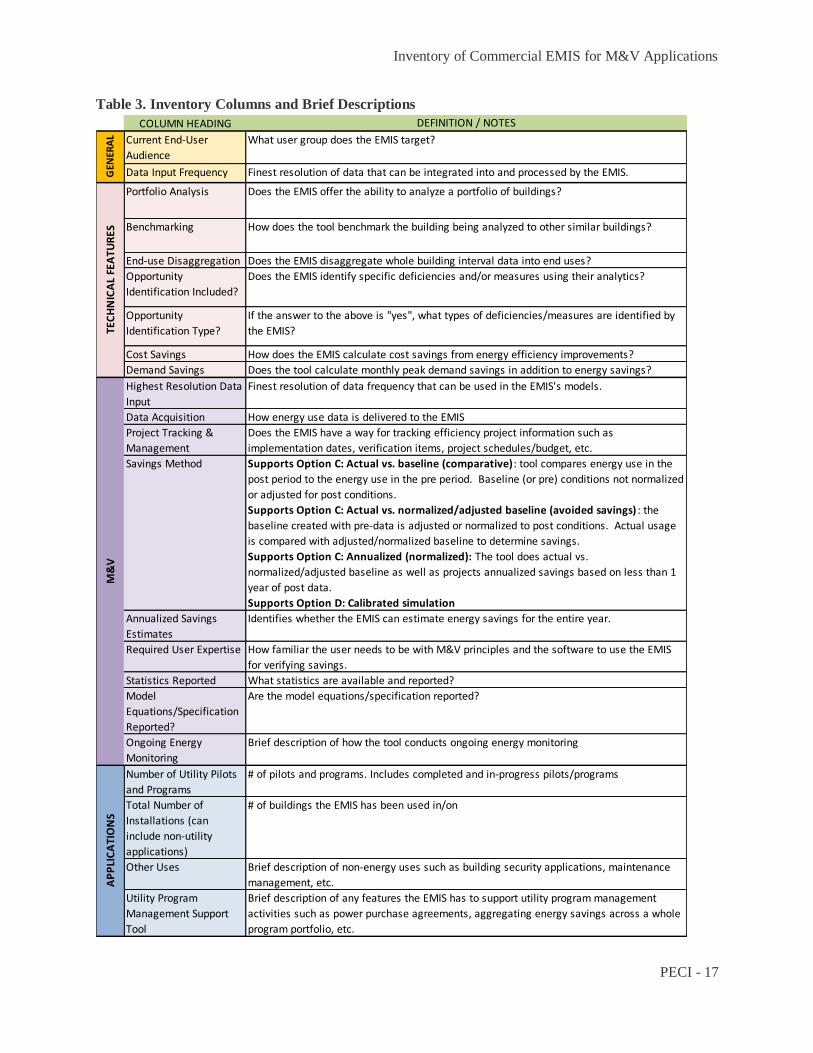
3.3.1. Feature List and Descriptions
The final list of twenty-two features is organized into four sections: general features, technical
features, M&V features, and applications. The inventory structure is shown in Table 3.
Some of the feature columns in the inventory have open data fields, while others have pre-
defined lists of options from which to select. Appendix B provides more detailed descriptions of
options for each feature.
Inventory of Commercial EMIS for M&V Applications
PECI - 17
Table 3. Inventory Columns and Brief Descriptions
COLUMN HEADING DEFINITION / NOTES
Current End-User
Audience
What user group does the EMIS target?
Data Input Frequency Finest resolution of data that can be integrated into and processed by the EMIS.
Portfolio Analysis Does the EMIS offer the ability to analyze a portfolio of buildings?
Benchmarking How does the tool benchmark the building being analyzed to other similar buildings?
End-use Disaggregation Does the EMIS disaggregate whole building interval data into end uses?
Opportunity
Identification Included?
Does the EMIS identify specific deficiencies and/or measures using their analytics?
Opportunity
Identification Type?
If the answer to the above is "yes", what types of deficiencies/measures are identified by
the EMIS?
Cost Savings How does the EMIS calculate cost savings from energy efficiency improvements?
Demand Savings Does the tool calculate monthly peak demand savings in addition to energy savings?
Highest Resolution Data
Input
Finest resolution of data frequency that can be used in the EMIS's models.
Data Acquisition How energy use data is delivered to the EMIS
Project Tracking &
Management
Does the EMIS have a way for tracking efficiency project information such as
implementation dates, verification items, project schedules/budget, etc.
Savings Method Supports Option C: Actual vs. baseline (comparative): tool compares energy use in the
post period to the energy use in the pre period. Baseline (or pre) conditions not normalized
or adjusted for post conditions.
Supports Option C: Actual vs. normalized/adjusted baseline (avoided savings) : the
baseline created with pre-data is adjusted or normalized to post conditions. Actual usage
is compared with adjusted/normalized baseline to determine savings.
Supports Option C: Annualized (normalized): The tool does actual vs.
normalized/adjusted baseline as well as projects annualized savings based on less than 1
year of post data.
Supports Option D: Calibrated simulation
Annualized Savings
Estimates
Identifies whether the EMIS can estimate energy savings for the entire year.
Required User Expertise How familiar the user needs to be with M&V principles and the software to use the EMIS
for verifying savings.
Statistics Reported What statistics are available and reported?
Model
Equations/Specification
Reported?
Are the model equations/specification reported?
Ongoing Energy
Monitoring
Brief description of how the tool conducts ongoing energy monitoring
Number of Utility Pilots
and Programs
# of pilots and programs. Includes completed and in-progress pilots/programs
Total Number of
Installations (can
include non-utility
applications)
# of buildings the EMIS has been used in/on
Other Uses Brief description of non-energy uses such as building security applications, maintenance
management, etc.
Utility Program
Management Support
Tool
Brief description of any features the EMIS has to support utility program management
activities such as power purchase agreements, aggregating energy savings across a whole
program portfolio, etc.
AP
PLI
CA
TIO
NS
M&
VTE
CH
NIC
AL
FEA
TUR
ESG
ENER
AL

Inventory of Commercial EMIS for M&V Applications
PECI - 18
3.3.2. Final List of EMIS Included in the Inventory
Nineteen tools met the primary M&V screening criteria. Five of those tools’ vendors did not
respond to repeated attempts to collect information for the inventory and to schedule a
demonstration. The fourteen remaining tools all satisfied one or more of the additional screening
criteria and were selected for the inventory.
The project team populated the inventory using the information collected during the
demonstrations. The fully-populated inventory is shown in Appendix C and is also available as a
Microsoft Excel spreadsheet.
Inventory of Commercial EMIS for M&V Applications
PECI - 19
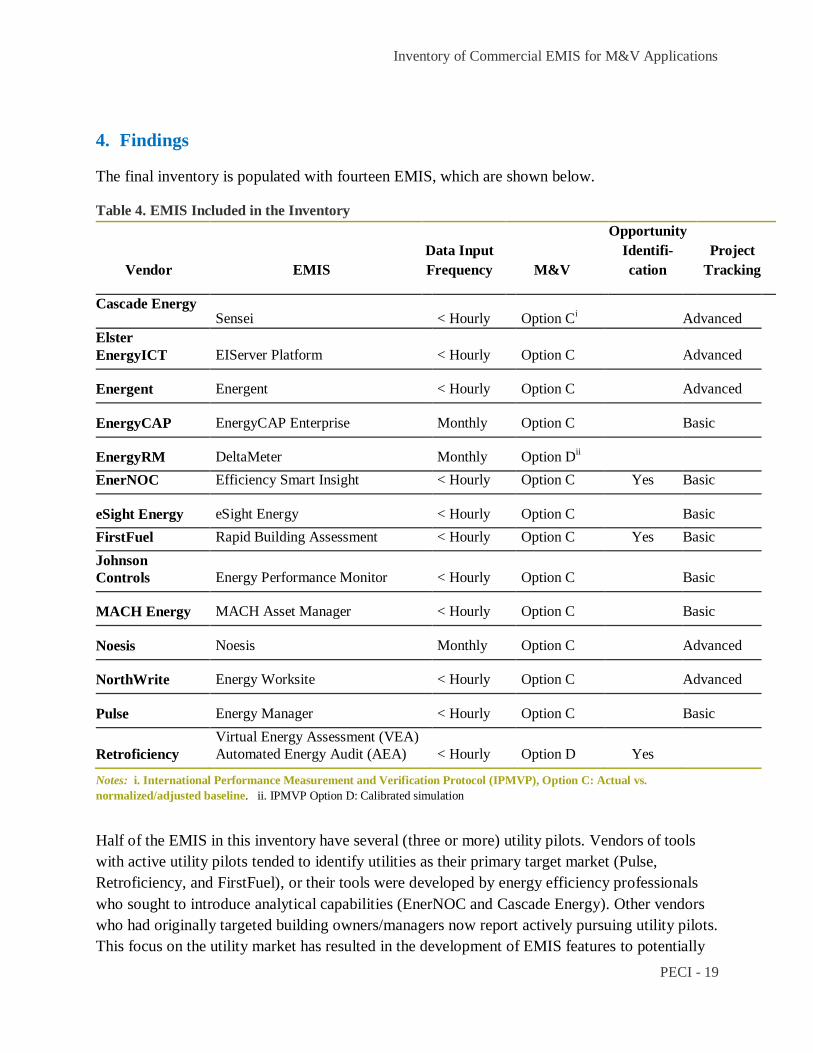
4. Findings
The final inventory is populated with fourteen EMIS, which are shown below.
Table 4. EMIS Included in the Inventory
Vendor EMIS
Data Input
Frequency M&V
Opportunity
Identifi-
cation
Project
Tracking
Cascade Energy Sensei < Hourly Option C
i
Advanced
Elster
EnergyICT EIServer Platform < Hourly Option C
Advanced
Energent Energent < Hourly Option C
Advanced
EnergyCAP EnergyCAP Enterprise Monthly Option C
Basic
EnergyRM DeltaMeter Monthly Option Dii
EnerNOC Efficiency Smart Insight < Hourly Option C Yes Basic
eSight Energy eSight Energy < Hourly Option C
Basic
FirstFuel Rapid Building Assessment < Hourly Option C Yes Basic
Johnson
Controls Energy Performance Monitor < Hourly Option C
Basic
MACH Energy MACH Asset Manager < Hourly Option C
Basic
Noesis Noesis Monthly Option C
Advanced
NorthWrite Energy Worksite < Hourly Option C
Advanced
Pulse Energy Manager < Hourly Option C
Basic
Retroficiency
Virtual Energy Assessment (VEA)
Automated Energy Audit (AEA) < Hourly Option D Yes
Notes: i. International Performance Measurement and Verification Protocol (IPMVP), Option C: Actual vs.
normalized/adjusted baseline. ii. IPMVP Option D: Calibrated simulation
Half of the EMIS in this inventory have several (three or more) utility pilots. Vendors of tools
with active utility pilots tended to identify utilities as their primary target market (Pulse,
Retroficiency, and FirstFuel), or their tools were developed by energy efficiency professionals
who sought to introduce analytical capabilities (EnerNOC and Cascade Energy). Other vendors
who had originally targeted building owners/managers now report actively pursuing utility pilots.
This focus on the utility market has resulted in the development of EMIS features to potentially
Inventory of Commercial EMIS for M&V Applications
PECI - 20
meet utilities’ needs. In particular, the M&V methodologies are becoming more transparent,
some EMIS can calculate annualized savings, and vendors now recognize the need to account for
building-specific changes unrelated to energy projects. In addition, new features are opening up
new possibilities for utility program applications. These findings and others are discussed below.
4.1. M&V Methodologies Becoming More Transparent
Utilities have been wary of using the integrated M&V functionality of EMIS tools due to the
“black box” (i.e., proprietary) nature of their analysis algorithms. Northwest stakeholders plainly
stated a need for clear visibility into the tools’ M&V methodology during the needs assessment.
The inventory shows an unexpected shift in the outlook of the vendors regarding this topic. In
the past, vendors had been reluctant to share information about their M&V methodologies. For
the inventory, eight of fourteen (57%) vendors reported that the model equations or model
specifications can be viewed and downloaded by the user within their tools. Two additional
vendors reported that while they don’t automatically provide their model specifications, they
would be willing to do so for a client who wanted it.
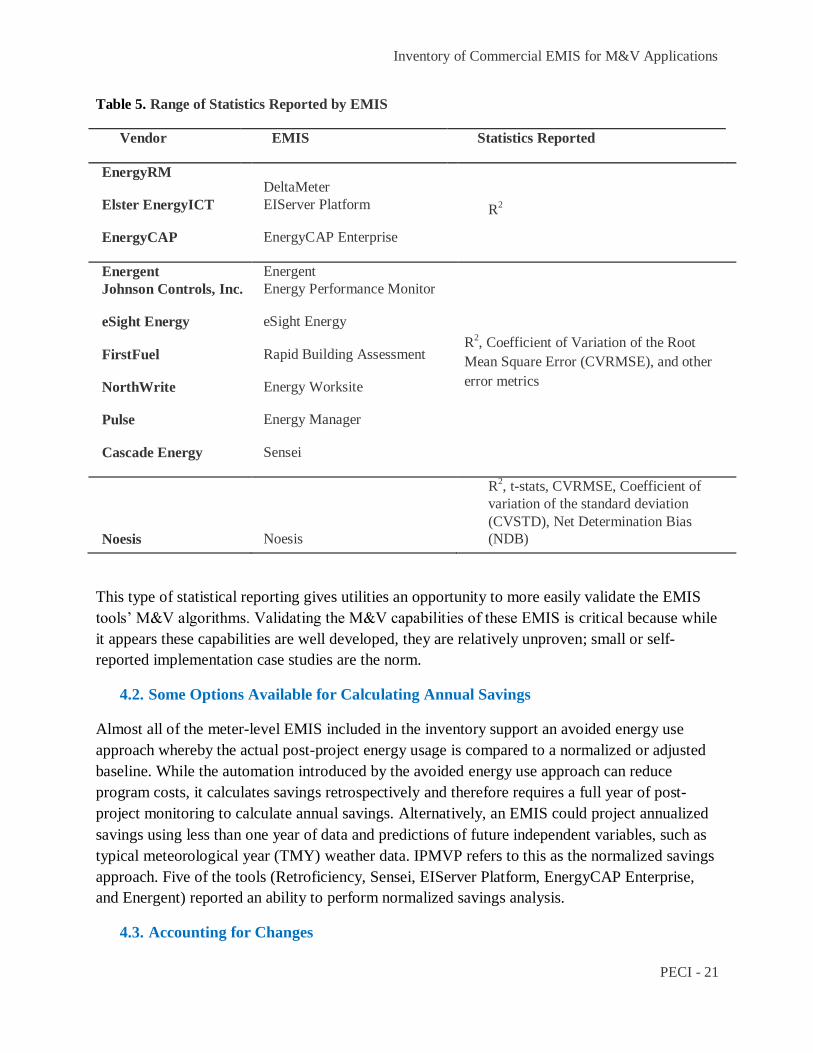
In addition to transparency about their algorithms, many of the EMIS provide some information
regarding how well their models represent actual building energy use. While consistency is
lacking across the tools, most of the tools inventoried report some statistical metric showing how
well their model performs. Table 5 illustrates the range of statistics reported by the EMIS in the
inventory.
Inventory of Commercial EMIS for M&V Applications
PECI - 21
Table 5. Range of Statistics Reported by EMIS
Vendor EMIS Statistics Reported
EnergyRM
Elster EnergyICT
EnergyCAP
DeltaMeter
EIServer Platform
EnergyCAP Enterprise
R2
Energent
Johnson Controls, Inc.
eSight Energy
FirstFuel
NorthWrite
Pulse
Cascade Energy
Energent
Energy Performance Monitor
eSight Energy
Rapid Building Assessment
Energy Worksite
Energy Manager
Sensei
R2, Coefficient of Variation of the Root
Mean Square Error (CVRMSE), and other
error metrics
Noesis Noesis
R2, t-stats, CVRMSE, Coefficient of
variation of the standard deviation
(CVSTD), Net Determination Bias
(NDB)
This type of statistical reporting gives utilities an opportunity to more easily validate the EMIS
tools’ M&V algorithms. Validating the M&V capabilities of these EMIS is critical because while
it appears these capabilities are well developed, they are relatively unproven; small or self-
reported implementation case studies are the norm.
4.2. Some Options Available for Calculating Annual Savings
Almost all of the meter-level EMIS included in the inventory support an avoided energy use
approach whereby the actual post-project energy usage is compared to a normalized or adjusted
baseline. While the automation introduced by the avoided energy use approach can reduce
program costs, it calculates savings retrospectively and therefore requires a full year of post-
project monitoring to calculate annual savings. Alternatively, an EMIS could project annualized
savings using less than one year of data and predictions of future independent variables, such as
typical meteorological year (TMY) weather data. IPMVP refers to this as the normalized savings
approach. Five of the tools (Retroficiency, Sensei, EIServer Platform, EnergyCAP Enterprise,
and Energent) reported an ability to perform normalized savings analysis.
4.3. Accounting for Changes

Inventory of Commercial EMIS for M&V Applications
PECI - 22
The use of buildings is dynamic – tenants move in and out, floor area is added, and space use
changes. These changes occurring in parallel with an energy efficiency project can make it
challenging to distinguish the energy impacts of the project from the non-project changes when
looking at whole-building energy use. Recognizing this, seven of the EMIS vendors in the
inventory reported that their tools offer some functionality for accounting for these types of
changes. These methods range from manual adjustment by an expert user to more
straightforward modifications of schedule, occupancy, or square footage inputs by a user, which
are interpreted by the tool’s M&V algorithms to adjust a baseline model. For example, MACH
Asset Manager allows users to input monthly percent occupancy, and the energy modeling
algorithms can then account for the influence of the occupancy variable. Accounting for these
types of changes is a challenge in M&V, and requires further study in order to understand the
most appropriate methods for accounting for changes.
4.4. Few Calibrated Simulation Approaches
The majority of the tools in the inventory support an IPMVP Option C approach to M&V; two
tools support Option D calibrated simulation – Retroficiency’s AEA and EnergyRM’s
DeltaMeter. DeltaMeter uses a thermodynamic simulation to model equipment characteristics
and AEA uses whole-building simulation, similar to that of eQuest or Energy Plus but with a
simplified set of inputs. Both DeltaMeter and AEA calibrate the model to actual energy
consumption, and determine savings by comparing calibrated post-implementation simulations to
calibrated pre-implementation simulations.
The use of simulations presents some unique opportunities. Simulations allow for pre-
implementation estimates of measure-level energy savings during the audit phase. Such estimates
can be used to construct a business case for implementing an energy efficiency project.
Simulations can also be used to predict the impact of changes in the building use by modeling
those changes within the simulation, which can facilitate non-routine adjustments to baseline
models against which energy savings are estimated. As a result of these opportunities afforded
by simulations, meter-level EMIS using Option D have the potential to support different
programmatic approaches than do the other meter-level EMIS tools.
4.5. Several Options Available for Utilities without Interval Meters
The inventory includes three meter-level EMIS tools that require only monthly input data and
still offer advanced M&V features – DeltaMeter, Noesis, and EnergyCAP Enterprise. These
tools may be well-suited for utilities without interval meters. Due to the low resolution of
monthly billing data, whole-building M&V approaches have typically been applicable only in
cases in which savings were high (greater than ten percent of whole-building energy use).
4.6. EMIS Products and Offerings Continue to Evolve
Inventory of Commercial EMIS for M&V Applications
PECI - 23
The original draft EMIS framework included several columns to confirm the capabilities of the
tools. As the inventory was populated, the team found the following features to be common to all
tools, and thus they were removed from the inventory spreadsheet:
Web-based: Vendor hosts service “in the cloud,” meaning data is sent to the vendor's
servers and users access their data online. All EMIS tools in the inventory are web-based
except for EnergyRM’s DeltaMeter, which is a Microsoft Excel-based tool.
Customizable Interface: User can at a minimum create unique graphs and tables. All
web-based EMIS tools in the inventory could be customized to this minimum degree, and
many had significant customization potential.
Import/Export: Data in a table format can be uploaded to the EMIS or downloaded from
the EMIS either by the user or manually at the request of the EMIS vendor.
Predicted Values Download: Predicted energy use data can be downloaded from the
tool in a table format.
While all of the EMIS vendors discussed features either planned or in development, this project
represents a snapshot in time of current features. EMIS vendors continue to develop tool
capabilities as they work to improve acceptance by various end-users. A few of the newer
capabilities featured in this inventory are project tracking, end-use disaggregation, opportunity
identification, and advanced M&V.
Project tracking: Pulse Energy Manager, eSight Energy, Efficiency Smart Insight, and
MACH Asset Manager have basic project tracking features that allow insertion of simple
notes or a point on time-series charts to indicate times of actions taken. Some vendors
recognize that energy managers need a place to more closely track their actions, and have
developed for their tools (Sensei, Energent, and Energy Worksite) advanced project
tracking features through which users can assign tasks, track progress, calculate
ROI/payback, send reminders, and generally support efficiency project management.
These project tracking features have the potential to address the utilities’ needs to
document actions so that savings can be attributed to program-related efforts.
End use disaggregation and opportunity identification: Retroficiency, FirstFuel,
EnergyRM, and Energent have algorithms to disaggregate meter-level data into discrete
end uses, such as lighting, HVAC, and plug loads. By comparing the disaggregated end
uses to other buildings’ performance levels (such as in a portfolio or in a commercial
building survey), EMIS users can gain insights into areas of potential efficiency
improvements. They can also identify additional opportunities through automated load
shape analysis and regression analysis against occupancy and weather data. This
functionality has the potential to streamline programs seeking to achieve deeper and more
comprehensive savings. Several pilots of the measure identification functionality are

Inventory of Commercial EMIS for M&V Applications
PECI - 24
complete or underway (Summers et al. 2013) and some research has been published on
the accuracy of the tools’ energy disaggregation algorithms.3
Advanced M&V: The EMIS included in this inventory use multivariate analysis,
typically including weather, day/time, and a daily schedule derived from the load profile
as inputs into their analytics. They can also include other variables such as schedule or
occupancy if that data is available. Adding other driving variables to further improve
model results, as well as automating more of the analysis, will continue to contribute to
the evolution of the EMIS market.
Beyond the data visualization or dashboard capabilities, many of the tools now have similar
features and capabilities especially around portfolio analysis, benchmarking, and cost savings.
The tools differ in how they execute these capabilities. Some tools are designed for minimal user
input, meaning users can log in to access a wide range of reports and charts using simple menus
and checkboxes; other tools are designed more for an expert analyst, in which each graph,
screen, and the underlying analytics driving them are shaped by a highly-engaged user who
customizes the interface. In addition to the available features, this variation in the level of
required user experience is also likely to be an important criterion for potential users of EMIS.
3 Reports documenting the accuracy of FirstFuel’s disaggregation algorithms can be found at: http://www.firstfuel.com/how-it-
works
Inventory of Commercial EMIS for M&V Applications
PECI - 25
5. Conclusions and Recommendations
The state of the art in EMIS technology has progressed markedly compared to capabilities of a
few years ago. Not only do several tools on the market offer advanced M&V features, but many
of the tools have functionality to support additional aspects of utility program implementation.
When meter-level EMIS entered the market over ten years ago, the tools with the most advanced
data visualization or dashboard capabilities led the market. Today, those features are more
standard and are required for entry into the market. Utilities have a number of options for EMIS
that can support program M&V (even if they don’t have smart metering infrastructure in place),
and will receive many other attractive features alongside M&V capabilities.
The recent evolution of advanced M&V capabilities presents utilities an opportunity to determine
appropriate methods for validating the tools for program applications. This is not simply a case
of validating new tools that can replicate existing programmatic methods; capitalizing on the
M&V capabilities of EMIS also requires the development of whole-building programmatic
approaches that can satisfy the needs of building owners, utilities, and regulators. If meter-level
EMIS features are proven to be robust and the programmatic approaches are cost-effective, this
opens the way for rapid growth of whole-building approaches to energy efficiency.
As noted earlier, the EMIS analytics documented in the inventory have not been independently
evaluated for accuracy except in a relatively small number of pilot projects. In the absence of
industry standards for EMIS performance, PECI recommends due diligence to ensure that EMIS
meet specific utility requirements. Depending on the type of tool and the programmatic approach
being proposed, software validation could follow multiple paths built around some core
components:
Define the accepted method that will be compared to the EMIS analytics: For
instance, stakeholders could compare the EMIS end-use disaggregation to a detailed
energy audit in the building. M&V could use multivariate regressions that take into
account weather and occupied/unoccupied schedule as an accepted method; however,
using this method requires careful monitoring for acceptable accuracy (for example,
buildings with frequent tenant changes in the baseline period may not be modeled easily).
Determine how close the EMIS analytics results must be to the accepted method:
Setting the bar is a risk-management decision around the acceptable level of confidence
and uncertainty in the savings estimates.
Define the number of sites required for validation: While a large number of sites may
be required to validate the software for many building types or climate zones, even small
pilots will add to the collective knowledge across the country.
Inventory of Commercial EMIS for M&V Applications
PECI - 26
If EMIS validation protocols and program pilots can show that meter-level EMIS features are
robust and that the programmatic approaches are cost-effective, they may open the way for rapid
growth of whole-building approaches to energy efficiency.
The meter-level EMIS and the descriptions of their features in the inventory represent a snapshot
in time of a fast-evolving market. Even after screening for M&V capabilities, PECI finds an
emerging, competitive market. The meter-level EMIS inventoried are now deployed in numerous
buildings. The more widely deployed meter-level EMIS began by marketing their product
directly to owners of large building portfolios, and the market is moving quickly towards utility-
supported deployments.
NEEA can facilitate this process and help to unlock the potential of meter-level EMIS for the
Northwest market. Enabling information-sharing about pilot results provides one means of doing
so; where such information-sharing identifies gaps in understanding, NEEA can work with
members and meter-level EMIS vendors to see that those gaps are filled, either by additional
Northwest pilots or by sharing information with other regions. For example, this study found that
few tools offer systematic approaches to making non-routine adjustments to baseline models – a
capability identified as important by both stakeholders and TAG members. NEEA might first
survey its members to determine whether any of the recent pilots have tackled this issue, and
then work with Northwest stakeholders to design and pilot a standard approach for making non-
routine adjustments in meter-level EMIS-aided M&V approaches. Doing so would give program
designers and EM&V professionals a shared understanding of how to meet this need, and it
would also provide guidance to meter-level EMIS vendors regarding areas of focus for future
development.
In reviewing the existing features of meter-level EMIS tools, this study found a number of
available tools aligned with the interests of Northwest stakeholders. Some program models can
be piloted, proven and scaled up now based on these existing features. Even as this happens, the
growth and evolution of meter-level EMIS tools and their capabilities will continue, as will the
smart metering infrastructure that many tools leverage. That growth will reveal new
opportunities for using those tools to reduce costs and to increase the benefits of energy
efficiency projects and programs.

Inventory of Commercial EMIS for M&V Applications
PECI - 27
References
Effinger, J., M. Effinger, H. Friedman. 2012. Overcoming Barriers to Whole Building M&V in
Commercial Buildings. ACEEE Summer Study.
FirstFuel Software, Inc. 2013. How It Works. Accessed from http://www.firstfuel.com/how-it-works
Friedman (Kramer), H., E. Crowe, E. Sibley, M. Effinger. 2011. The Building Performance Tracking
Handbook. Portland, OR: Portland Energy Conservation, Inc. (PECI). California Commissioning
Collaborative.
Granderson, J., M.A. Piette, B. Rosenblum, L. Hu, et al. 2011. Energy Information Handbook:
Applications for Energy Efficient Building Operations. Lawrence Berkeley National Laboratory.
LBNL-5272E.
Granderson, J., M.A. Piette, G. Ghatikar, P. Price. 2009. Building Energy Information Systems: State of
the Technology and User Case Studies. Lawrence Berkeley National Laboratory. LBNL-2899E.
Jump, D. Quantum Energy Services & Technologies, Inc. 2008. Verification of Savings Project Existing
Methods Report. California Commissioning Collaborative.
Katipamula, S., T.A. Reddy, D.E. Claridge. 1994. Effect of Time Resolution on Statistical Modeling of
Cooling Energy Use in Large Commercial Buildings. ASHRAE Transactions.
Katipamula, S., T.A. Reddy, D.E. Claridge. 1995. Effect of Time Resolution on Statistical Modeling of
Cooling Energy Use in Large Commercial Buildings. ASHRAE V. 101, PT.2.
Kramer, H., J. Effinger, E. Crowe. 2012. Energy Management and Information System Software
Technology Assessment: Considerations for Evaluating Baselining and Savings Estimation
Functionality. Portland, OR: Portland Energy Conservation, Inc. (PECI). PG&E ET Project
Number: ET 12PGE1311.
Northwest Power and Conservation Council. 2010. Sixth Northwest Conservation and Electric Power
Plan. http://www.nwcouncil.org/energy/powerplan/6/plan/
Russell, J., A. Buhl. 2013. Pulse Energy: Dashboard with Energy Manager – Phase B Report. Portland,
OR: Portland Energy Conservation, Inc. (PECI). PG&E ET Project Number: ET 11PGE3162.
Inventory of Commercial EMIS for M&V Applications
PECI - 28
Consortium for Energy Efficiency. 2012. Summary of Commercial Whole Building Performance
Programs: Continuous Energy Improvement and Energy Management and Information Systems. Boston,
MA: Consortium for Energy Efficiency.
Consortium for Energy Efficiency. 2011. Summary of Commercial Whole Building Performance
Programs: Continuous Energy Improvement and Energy Management and Information Systems. Boston,
MA: Consortium for Energy Efficiency.
Summers, H., D. Chan, C. Hilger. 2013. FirstFuel Scaled Field Placement. San Francisco, CA: Enovity.
PG&E ET Project Number: ET 12PGE3341.
Inventory of Commercial EMIS for M&V Applications
PECI - 29
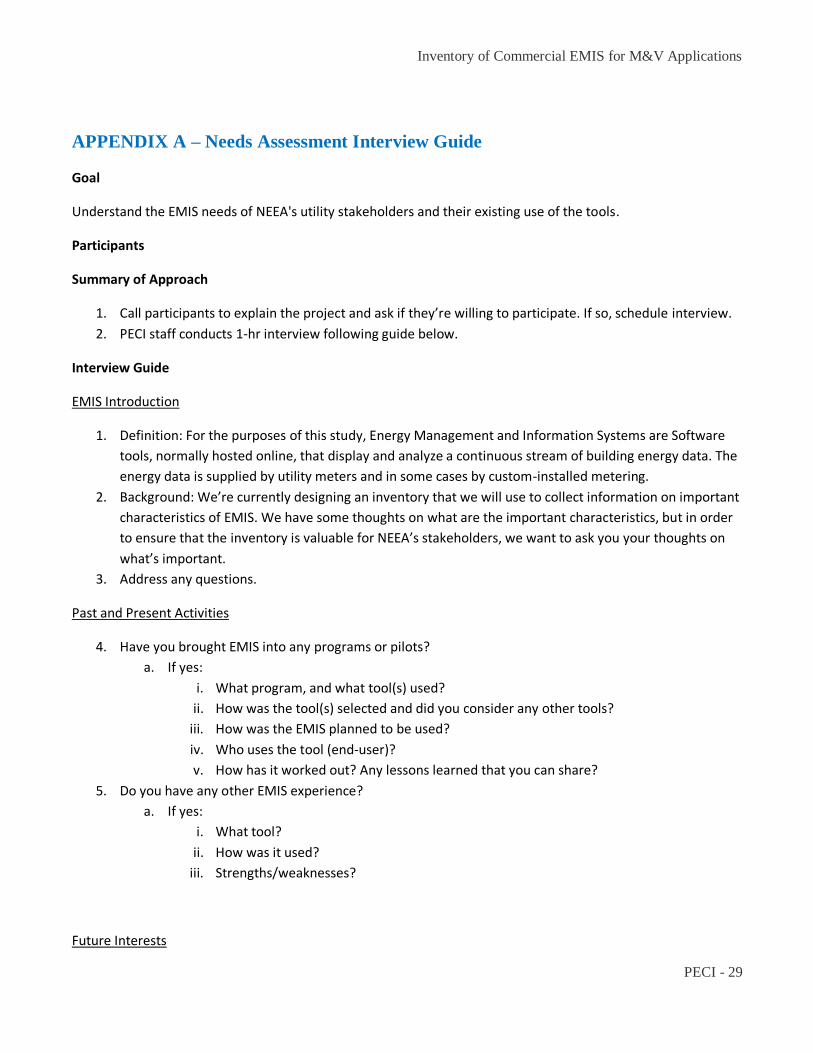
APPENDIX A – Needs Assessment Interview Guide
Goal
Understand the EMIS needs of NEEA's utility stakeholders and their existing use of the tools.
Participants
Summary of Approach
1. Call participants to explain the project and ask if they’re willing to participate. If so, schedule interview.
2. PECI staff conducts 1-hr interview following guide below.
Interview Guide
EMIS Introduction
1. Definition: For the purposes of this study, Energy Management and Information Systems are Software
tools, normally hosted online, that display and analyze a continuous stream of building energy data. The
energy data is supplied by utility meters and in some cases by custom-installed metering.
2. Background: We’re currently designing an inventory that we will use to collect information on important
characteristics of EMIS. We have some thoughts on what are the important characteristics, but in order
to ensure that the inventory is valuable for NEEA’s stakeholders, we want to ask you your thoughts on
what’s important.
3. Address any questions.
Past and Present Activities
4. Have you brought EMIS into any programs or pilots?
a. If yes:
i. What program, and what tool(s) used?
ii. How was the tool(s) selected and did you consider any other tools?
iii. How was the EMIS planned to be used?
iv. Who uses the tool (end-user)?
v. How has it worked out? Any lessons learned that you can share?
5. Do you have any other EMIS experience?
a. If yes:
i. What tool?
ii. How was it used?
iii. Strengths/weaknesses?
Future Interests

Inventory of Commercial EMIS for M&V Applications
PECI - 30
6. Are you interested in using EMIS more in the future?
7. For the inventory, are there any specific tools you’d like us to look at?
a. Why are you interested in these particular tools?
8. Are there specific things that you want to know about tools?
a. ‘Must-have’ features?
b. Desirable features?
c. What do you think is the biggest hurdle EMIS need to overcome?
9. Are there specific types of programs or target markets where you think EMIS would be most useful?
10. What types of applications do you see for EMIS in the future?
a. Customer engagement?
b. Opportunity identification?
c. M&V: Many EMIS not only collect the data (such as weather and interval data) needed for M&V
but also have built-in algorithms to conduct Measurement and Verification of savings. Are you
interested in using an EMIS with built-in savings quantification algorithms to conduct M&V? ?
i. EMIS M&V approaches tend to follow IPMVP Option C or D – Option C is whole building
quantification of savings and Option D uses a calibrated simulation model – do you have
a preference for either of these, or some other approach?
ii. Does the tool need to be compatible with smart meter data (hourly or sub-hourly
interval data)?
iii. One advantage of using EMIS for M&V is that they can quantify the level of uncertainty
in savings estimates. An example of uncertainty is: a project saves 100 kWh ± 5%. The
±5% is the uncertainty. What level of uncertainty is considered acceptable for your
organization?
d. Persistence? For example, automated alerts or reports.
Closing
11. Address any remaining questions
12. Leave contact information for additional input, as desired by interviewee
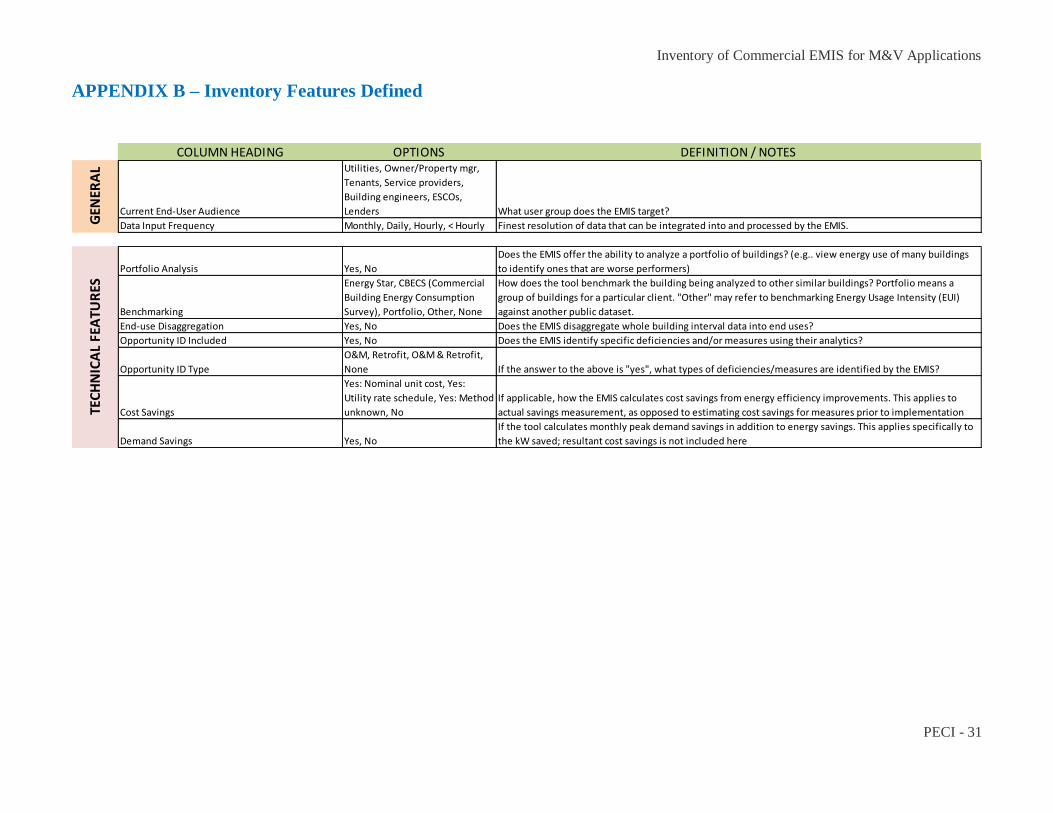
Inventory of Commercial EMIS for M&V Applications
PECI - 31
APPENDIX B – Inventory Features Defined
COLUMN HEADING OPTIONS DEFINITION / NOTES
Current End-User Audience
Utilities, Owner/Property mgr,
Tenants, Service providers,
Building engineers, ESCOs,
Lenders What user group does the EMIS target?
Data Input Frequency Monthly, Daily, Hourly, < Hourly Finest resolution of data that can be integrated into and processed by the EMIS.
Portfolio Analysis Yes, No
Does the EMIS offer the ability to analyze a portfolio of buildings? (e.g.. view energy use of many buildings
to identify ones that are worse performers)
Benchmarking
Energy Star, CBECS (Commercial
Building Energy Consumption
Survey), Portfolio, Other, None
How does the tool benchmark the building being analyzed to other similar buildings? Portfolio means a
group of buildings for a particular client. "Other" may refer to benchmarking Energy Usage Intensity (EUI)
against another public dataset.
End-use Disaggregation Yes, No Does the EMIS disaggregate whole building interval data into end uses?
Opportunity ID Included Yes, No Does the EMIS identify specific deficiencies and/or measures using their analytics?
Opportunity ID Type
O&M, Retrofit, O&M & Retrofit,
None If the answer to the above is "yes", what types of deficiencies/measures are identified by the EMIS?
Cost Savings
Yes: Nominal unit cost, Yes:
Utility rate schedule, Yes: Method
unknown, No
If applicable, how the EMIS calculates cost savings from energy efficiency improvements. This applies to
actual savings measurement, as opposed to estimating cost savings for measures prior to implementation
Demand Savings Yes, No
If the tool calculates monthly peak demand savings in addition to energy savings. This applies specifically to
the kW saved; resultant cost savings is not included here
TEC
HN
ICA
L FE
ATU
RES
GEN
ERA
L
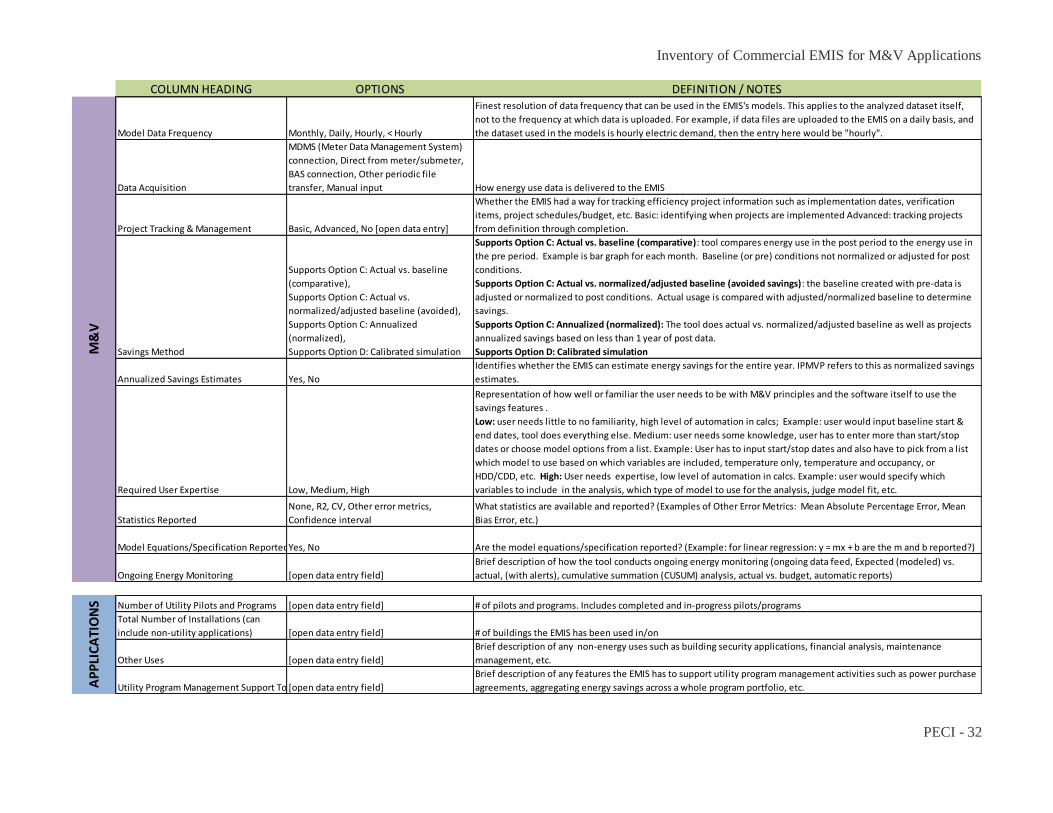
Inventory of Commercial EMIS for M&V Applications
PECI - 32
COLUMN HEADING OPTIONS DEFINITION / NOTES
Model Data Frequency Monthly, Daily, Hourly, < Hourly
Finest resolution of data frequency that can be used in the EMIS's models. This applies to the analyzed dataset itself,
not to the frequency at which data is uploaded. For example, if data files are uploaded to the EMIS on a daily basis, and
the dataset used in the models is hourly electric demand, then the entry here would be "hourly".
Data Acquisition
MDMS (Meter Data Management System)
connection, Direct from meter/submeter,
BAS connection, Other periodic file
transfer, Manual input How energy use data is delivered to the EMIS
Project Tracking & Management Basic, Advanced, No [open data entry]
Whether the EMIS had a way for tracking efficiency project information such as implementation dates, verification
items, project schedules/budget, etc. Basic: identifying when projects are implemented Advanced: tracking projects
from definition through completion.
Savings Method
Supports Option C: Actual vs. baseline
(comparative),
Supports Option C: Actual vs.
normalized/adjusted baseline (avoided),
Supports Option C: Annualized
(normalized),
Supports Option D: Calibrated simulation
Supports Option C: Actual vs. baseline (comparative): tool compares energy use in the post period to the energy use in
the pre period. Example is bar graph for each month. Baseline (or pre) conditions not normalized or adjusted for post
conditions.
Supports Option C: Actual vs. normalized/adjusted baseline (avoided savings): the baseline created with pre-data is
adjusted or normalized to post conditions. Actual usage is compared with adjusted/normalized baseline to determine
savings.
Supports Option C: Annualized (normalized): The tool does actual vs. normalized/adjusted baseline as well as projects
annualized savings based on less than 1 year of post data.
Supports Option D: Calibrated simulation
Annualized Savings Estimates Yes, No
Identifies whether the EMIS can estimate energy savings for the entire year. IPMVP refers to this as normalized savings
estimates.
Required User Expertise Low, Medium, High
Representation of how well or familiar the user needs to be with M&V principles and the software itself to use the
savings features .
Low: user needs little to no familiarity, high level of automation in calcs; Example: user would input baseline start &
end dates, tool does everything else. Medium: user needs some knowledge, user has to enter more than start/stop
dates or choose model options from a list. Example: User has to input start/stop dates and also have to pick from a list
which model to use based on which variables are included, temperature only, temperature and occupancy, or
HDD/CDD, etc. High: User needs expertise, low level of automation in calcs. Example: user would specify which
variables to include in the analysis, which type of model to use for the analysis, judge model fit, etc.
Statistics Reported
None, R2, CV, Other error metrics,
Confidence interval
What statistics are available and reported? (Examples of Other Error Metrics: Mean Absolute Percentage Error, Mean
Bias Error, etc.)
Model Equations/Specification ReportedYes, No Are the model equations/specification reported? (Example: for linear regression: y = mx + b are the m and b reported?)
Ongoing Energy Monitoring [open data entry field]
Brief description of how the tool conducts ongoing energy monitoring (ongoing data feed, Expected (modeled) vs.
actual, (with alerts), cumulative summation (CUSUM) analysis, actual vs. budget, automatic reports)
Number of Utility Pilots and Programs [open data entry field] # of pilots and programs. Includes completed and in-progress pilots/programs
Total Number of Installations (can
include non-utility applications) [open data entry field] # of buildings the EMIS has been used in/on
Other Uses [open data entry field]
Brief description of any non-energy uses such as building security applications, financial analysis, maintenance
management, etc.
Utility Program Management Support Tool[open data entry field]
Brief description of any features the EMIS has to support utility program management activities such as power purchase
agreements, aggregating energy savings across a whole program portfolio, etc.
M&
VA
PP
LIC
ATI
ON
S
Inventory of Commercial EMIS for M&V Applications
PECI - 33
APPENDIX C – EMIS Inventory Workbook
Click here to open the EMIS Inventory Workbook