Embed Size (px)
Citation preview

Inverse Problems in Solar Imaging Spectroscopy
- Future Applications
G.J. HurfordSpace Sciences Lab
University of California, Berkeley
Vienna 20 July 2009

Outline
• Physics-based arguments to show that the algorithms discussed by previous speakers are relevant to field as a whole (as opposed to just a specific mission.)
• Illustrate this with 3 future applications of the double inversion techniques.

Role of RHESSI Inversion Algorithms
• Convert Fourier-based imaging data as a function of energy to spatial maps of physical parameters
– Convert incomplete visibility data to maps– At each spatial location, convert spectral data
into physical parameters

Why does solar hard x-ray imaging use visibilities ?
• High energy physics two diagnostics for accelerated solar electrons– Hard x-rays– Radio
• Solar observations require ~ arcsecond resolution• Focusing optics is not feasible in this x-ray regime
Use collimation techniques• Solar range of angular scales + need for sensitivity
Bigrid collimators Basic x-ray imaging observable is visibilities


High Resolution Radio Imaging
– At radio wavelengths• Diffraction Antenna diameter needed for
~arcsecond imaging is prohibitively large
e.g. 100m diameter antenna has only 140 arcsec resolutionat 5 GHz but need ~4 arcsec.
use interferometry

Measuring Fourier Components:The Radio Interferometer Analog
• Mathematical equivalence between information in a correlated radio signal and a modulated x-ray signal
• In both cases, observed amplitude and phase measure a Fourier component of source distribution

Interferometry – RMC Comparison
Interferometry RMC’sSpatial period wavelength / baseline Grid pitch / separation
uv points N(N-1)/2 (antennas)
VLA 351
N (RMCs)
RHESSI 9
Synthesis Earth rotation (24 h) S/c rotation (4 s)
Visibility-based imaging is required for imaging high energy solar electrons
In both cases, basic observables are visibilities (u,v,f)

• Diagnostics require spectroscopy • Inhomogeneous source structure
imaging spectroscopy

Summary
• FACTORS– Physics of emission processes hard x-rays and radio observations– Angular Size scales of solar phenomena– Physics of detection processes visibility-based imaging– Emission processes convolve physical parameters with energy– Spatial non-uniformity of solar phenomena
Visibility-based imaging spectroscopy is fundamental to the study of high-energy solar electrons
Spatial reconstructionSpectral deconvolution

Future Applications (1)BETTER IMAGING + POLARIMETRY
• RHESSI imaging was limited by measurements at only 9 spatial frequencies
uv plane
• No imaging polarimetry• No information on directivity of electrons
– (e.g. electron beams?)
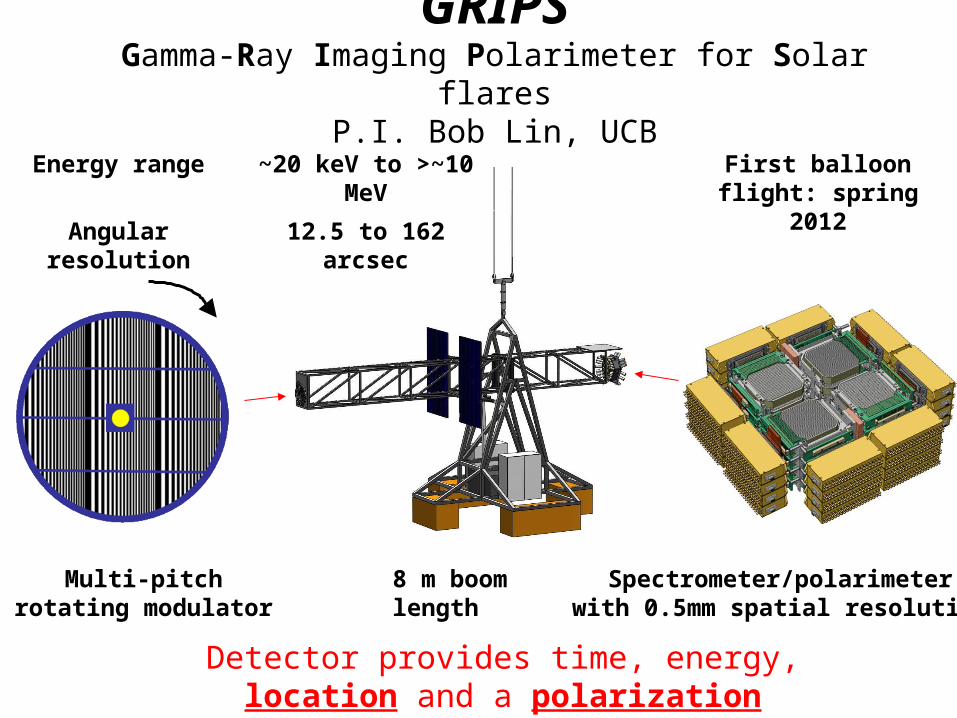
GRIPSGamma-Ray Imaging Polarimeter for Solar flares
P.I. Bob Lin, UCB
Multi-pitch rotating modulator
Spectrometer/polarimeterwith 0.5mm spatial resolution
Energy range ~20 keV to >~10 MeV
Angular resolution 12.5 to 162 arcsec
First balloon flight: spring 2012
8 m boom length
Detector provides time, energy, location and a polarization signature of each photon

Two Perspectives on GRIPS Imaging
• Each photon identifies a set of ‘probability stripes’ on Sun from which it could have originated
• Observations of many photons image
1 3 10
30 100 1000
Time sequence of counts beneath each mask location/orientation measures one visibility
Continuous set of gid pitches measures solid annulus in uv plane
uv plane
Radial profile of PSF

GRIPS
• RHESSI algorithms can be applied directly
• Much better image quality
• Polarization adds new dimension to spectral deconvolution
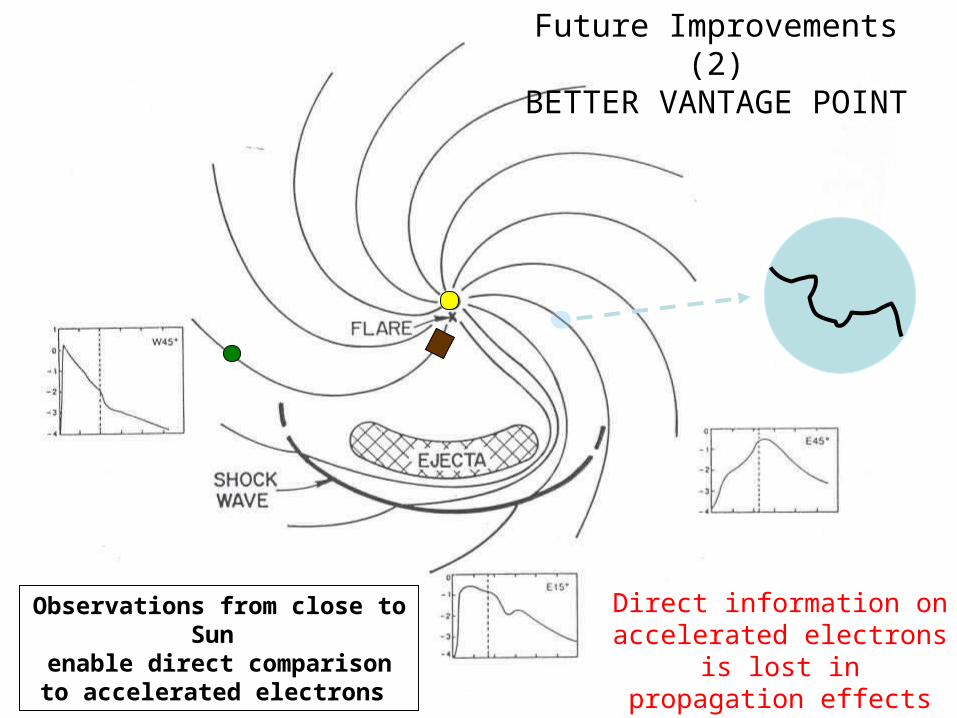
Direct information on accelerated electrons is lost
in propagation effects
Future Improvements (2)BETTER VANTAGE POINT
Observations from close to Sun enable direct comparison to
accelerated electrons

Solar Orbiter ESA
2017 launch
0.22 au perihelion
Magnetic coupling of Sun to heliosphere

How do you measure visibilities with a stationary collimator?
• Grids are stationary
• Top and bottom grids have slightly different pitch
• Location and amplitude of Moire pattern visibility
• Grids are moving
• Top and bottom grids have identical pitch
• Time and amplitude of count rate variations visibility

2 subcollimators with grids phase shifted by ¼ pitch (plus an integrated flux measurement)
amplitude and phase of Fourier component.

Telescope Tube
Rear Grids
CZT Detectors
Electronics Box
Front GridsSpectrometer/Telescope
for Imaging X-rays
(STIX)
P.I. Arnold Benz, ETHZ

Solar Orbiter / STIX
• Algorithms directly applicable
• Challenges:– Sparse coverage in UV plane – limited image quality– Robustness of algorithms
• (automated analysis of 2000 images/hour x 5+ years)

Future Applications (3)MICROWAVE IMAGING SPECTROSCOPY
• Surface brightness (=brightness temperature) spectra
accelerated electron spectral parameters, ambient density and/or magnetic field
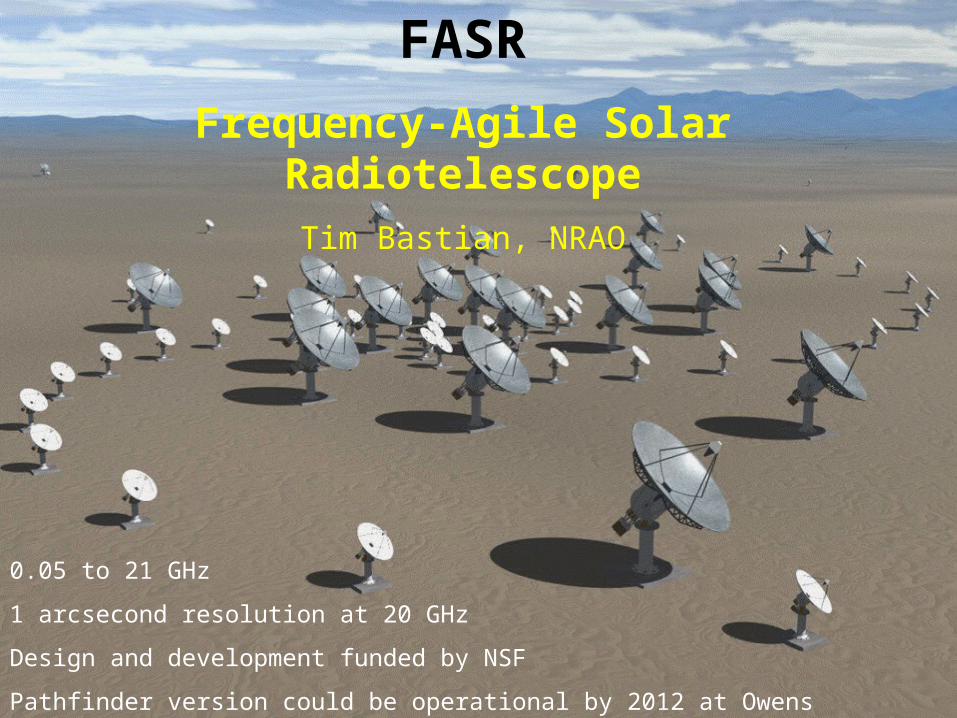
FASR
Frequency-Agile Solar Radiotelescope
Tim Bastian, NRAO
0.05 to 21 GHz
1 arcsecond resolution at 20 GHz
Design and development funded by NSF
Pathfinder version could be operational by 2012 at Owens Valley, California

Incoherent Microwave Burst Spectra
Free-free Gyrosynchrotron (Thermal and nonthermal)Brightness Temperature spectra contain diagnostic information on magnetic fields, plasma & accelerated electron parameters.
• Shape depends on mechanism
• Position in Tb – Frequency plane depends on physical parameters
(BUT dependence is non linear)
Observational confirmation

Radio imaging• No need to deconvolve detector frequency response.• N antennas N(N-1)/2 pairs• Cannot exploit earth rotation for burst sources
limited number of observed visibilities
uv plane

Frequency-synthesis• Angular resolution = antenna separation
wavelength
• For each antenna pair, each frequency measures a different Fourier componentMany more visibilities
uv plane
Couples spectral deconvolution to spatial deconvolution

Implications for Algorithms
• New deconvolution algorithms required
• Spectral deconvolution is coupled to spatial deconvolution
• Non-linear relation between physical parameters and spectrum

Summary
• Visibility-based imaging/spectroscopy of hard x-rays and microwaves is the key observational tool for studying accelerated electrons at the Sun.
• The success of the next generation of solar microwave and x-ray telescopes is critically dependent on the solution of spatial/spectral inverse problems.


![A parsimonious Begriffsschrift [concept notation] for animals James R Hurford](https://img.pdfslide.net/doc/110x75/56649e8a5503460f94b901a6/a-parsimonious-begriffsschrift-concept-notation-for-animals-james-r-hurford.jpg)