Embed Size (px)
Citation preview
Shipley, T.H., Ogawa, Y., Blum, P., and Bahr, J.M. (Eds.), 1997Proceedings of the Ocean Drilling Program, Scientific Results, Vol. 156
16. INTERPRETATION OF SITE 948 LOGGING-WHILE-DRILLING DATA: MINERALOGICAL INVERSION OF LOG DATA CONSTRAINED BY SAMPLE ANALYSES1
María José Jurado2 and Belén Alonso3
ABSTRACT
This study is an original application of the log inversion methods on logging-while-drilling (LWD) measurements to clay min-eral estimation in an unusual geologic setting: the Barbados accretionary prism. LWD was used for the first time by the OceanDrilling Program during Leg 156 at Sites 947 (Hole 947A) and 948 (Hole 948A). At Site 948 the décollement zone was loggedand cored. Hole 948C, located close to Hole 948A, was cored and logged with open-hole (conventional) logging tools. A modelof the main mineralogical components identified at Hole 948C has been obtained from the inversion of LWD data from Hole948A, using a methodology that is commonly applied on conventional logs. Density (RHOB), photoelectric factor (PEF), neutronporosity (TNPH), spectral natural gamma ray (SGR), and the spectral natural gamma ray Th/K ratio (Th/K) LWD data were usedin the inversion. Hole 948C core sample analyses indicative of a clay-dominated “complex lithology” have been used to constrainthe model and to test the quality of the results obtained. The inversion of log data provides a good approximation to the actualmineralogy, and the relative abundance of clay, and the main clay types. The deviation observed between the model and Hole948C sample analyses results can be mostly explained by the presence of minerals not included in the inversion model. Theporosity values calculated are close to shipboard “bulk water content” values. This model shows that the application of conven-tional log inversion techniques on a limited set of LWD data to quantitatively estimate trends in mineralogical changes can yieldsatisfactory results. The inversion model gives a good approach to the results obtained from X-ray diffraction for Hole 948C UnitsII and III sediments (420−580 mbsf) and constitutes the first inversion model for the composition of sediments obtained from thefirst LWD data of the Barbados accretionary prism. LWD data can be used to model mineralogical composition and porosity.
ncc aeidcech
co
aib fcoy-
le-
is.IIA
d-use inbeer-al-
alel re-bo-lso
t arets
Nrehee-
a-orR,ety
e
e
INTRODUCTION
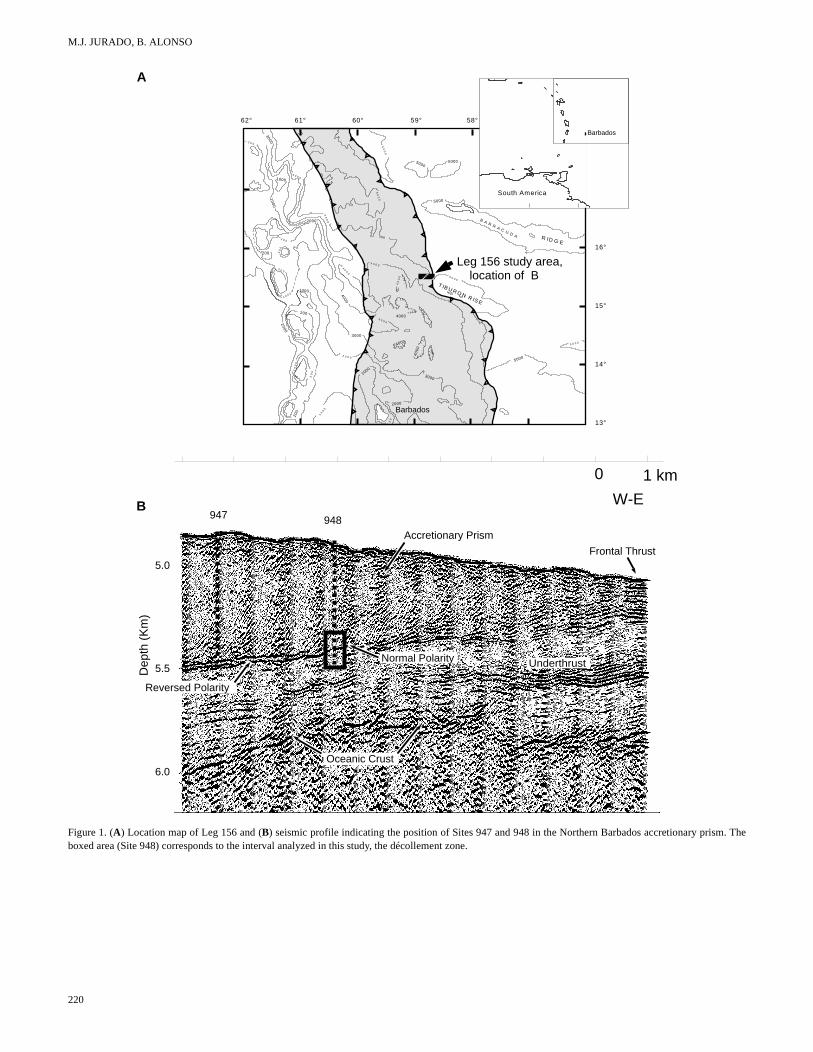
Logging-while-drilling (LWD) data are the most complete recordof the physical properties and the geology of Ocean Drilling Program(ODP) Leg 156 (northern Barbados Ridge accretionary prism) Sites947 and 948 (Fig. 1). The northern Barbados Ridge accretionaryprism is a convergent margin that is actively accreting oceanic pelag-ic/hemipelagic sediments (Moore et al., 1995), and it has been inten-sively studied by drilling during previous Deep Sea Drilling Project(DSDP) and ODP Legs 78 and 110, respectively (Mascle, Moore, etal., 1988; Moore et al., 1988). The most striking feature recorded byLeg 156 logs is the décollement, the boundary between the accretioary prism sediments and the underthrusting plate, that was sufully cored and logged at Site 948 (Shipley, Ogawa, Blum, et1995). At Hole 948C hemipelagic clayey sediments from Unit II Unit III (Shipley, Ogawa, Blum, et al., 1995) were cored betw420.8 and 592.72 mbsf in the décollement zone. Lower to mMiocene claystone underlain by lower Miocene and upper Oligovariegated claystone with muddy turbidites and redeposited were recovered (Shipley, Ogawa, Blum, et al., 1995).
Clay mineralogical changes are relevant to the study of the dément zone, as has been stated in previous studies in the area (MMoore, et al., 1988; Moore et al., 1988; Underwood and Deng, Ch1, this volume). The focus of this work has been to test the possof modeling the mineralogies recovered on cores at Hole 948CLWD data, by using a conventional log inversion methodology as monly applied on open-hole logs. Our results provide a mineralog
1Shipley, T.H., Ogawa, Y., Blum, P., and Bahr, J.M. (Eds.), 1997. Proc. ODP, Sci.Results,156: College Station, TX (Ocean Drilling Program).
2Geophysikalisches Institut, Universität Fridericiana Karlsruhe, Hertzstrass76187 Karlsruhe, Germany. [email protected]
3Instituto de Ciencias del Mar, CSIC, Paseo Joan de Borbó s/n, 08039 BarcSpain.
3UHYLRXV�&KDSWHU3UHYLRXV�&KDSWHU 7DEOH�RI�&7DEOH�RI�&
-ess-
al.,ndendlenealk
lle-ascle,pterilityromm-po-
rosity inversion model for the mineralogies encountered in the décolment zone.
The study has involved both sample analysis and log analysFrom Site 948 both core sample analyses (Hole 948C; Subunits through IIF; Subunits IIIA and IIIB) and continuous LWD data (Hole948A) have been used (Shipley, Ogawa, Blum, et al., 1995).
Inversion of mixed mineralogies is one of the most complex stuies that can be undertaken from the analysis of logging data. Becalog response accounts for both sediment composition and fluids,addition to the estimation of mineral components, porosity has to included as part of the system. The results obtained from the invsion of LWD data indicate that even in this case, which can be quified as being of extreme complexity from the point of view of the loganalysis, it is possible to obtain a good approximation to the actucomposition of the sediments by inversion techniques. Our modcould be constrained and calibrated to sample data. Our modelingsults are to a great extent comparable and compatible with the laratory analyses available. Besides this, the sources of misfit can abe constrained and explained by the presence of components thanot included in the model, given the limited set of log measuremenand also by the log data quality.
LOGGING DATA
Schlumberger CDR (Compensated Dual Resistivity) and CD(Compensated Density Neutron) (Schlumberger, 1992) tools weused to acquire LWD data at Sites 947 and 948 during Leg 156. Tprinciples of these tools and further details on the acquisition are dscribed in Shipboard Scientific Party (1995). The set of LWD mesurements obtained includes density (RHOB), photoelectric fact(PEF), neutron porosity (TNPH), spectral natural gamma ray (SGCGR, Th, U, K), deep (ATR) and shallow resistivity (PSR), and thrate of penetration (ROPE). LWD results in overall good data quali
16,
lona,
219RQWHQWVRQWHQWV 1H[W�&KDSWHU1H[W�&KDSWHU
M.J. JURADO, B. ALONSO
Leg 156 study area,location of B
Oceanic Crust
5.5
5.0
6.0
Dep
th (
Km
)
947
Reversed Polarity
Normal Polarity
Frontal Thrust
Underthrust
Accretionary Prism948
B
10
00
20
0
50005000
50
00
5 0 0 0
T IB U R O N R IS E
B A R R A C U D A R ID G E
5000
4 0 0 0
40
00
50
00
3000
4 0 0 01000
2 0 0
10
00
50
002000
2 0 0
200 20
0
10
00
2000
3000
2 0 0 0
3 0 0 0
4000
1000
3000
4000
1000
20
Barbados
40
00
5 0 0 0
5000
40
00
4000
200
200
2000
2 0 0
1 0 0 0
13°
14°
15°
16°
62° 61° 60° 59° 58°
South America
Barbados
5000
A
W-E
0 1 km
Figure 1. (A) Location map of Leg 156 and (B) seismic profile indicating the position of Sites 947 and 948 in the Northern Barbados accretionary prism. Theboxed area (Site 948) corresponds to the interval analyzed in this study, the décollement zone.
220
MINERAL INVERSION OF LOG DATA
Table 1. Sample analysis results from discrete Leg 156 Hole 948C samples.
Note: — = no data, wt% = weight percent.
Core, sectionDepth(mbsf)
Lithologicsubunit
CaCO3(wt%)
Sand(%)
Silt(%)
Clay(%)
Smectite(%)
Illite(%)
Kaolinite(%)
Chlorite(%)
156-948C-1H-1 .36 IA 12.7 19.88 27.70 52.42 — — — —1H-2 2.83 IA 24.0 15.38 26.08 58.54 — — — —2X-3 25.25 IIA 4.7 1.61 20.94 77.45 59 11 17 123X-5 437.11 IIA 5.8 .00 17.24 82.76 40 14 25 204X-1 441.15 IIA 3.6 .00 10.30 89.70 45 12 25 194X-6 447.72 IIB 9.5 .00 17.02 82.98 40 12 28 205X-3 453.27 IIB 4.0 .00 6.62 93.38 46 11 25 185X-5 456.02 IIB 7.1 .00 8.37 91.63 51 8 25 166X-1 460.50 IIB 4.6 .00 13.11 86.89 45 10 26 186X-5 465.63 IIC 4.9 .00 10.06 89.94 40 12 30 187X-1 469.14 IIC 6.1 .00 9.26 90.74 48 10 30 117X-5 475.24 IIC 4.5 .00 11.33 88.67 70 7 17 68X-1 479.44 IIC 3.9 .00 12.41 87.59 54 10 24 128X-6 486.99 IID 4.4 .00 17.29 82.71 58 9 21 119X-5 494.75 IID 3.7 .00 11.50 88.50 59 9 20 129X-CC 496.82 IID 3.7 1.16 17.51 81.33 61 9 19 1110X-2 499.77 IIE 3.3 1.35 12.79 85.86 52 12 24 1210X-2 500.85 IIE 4.7 1.39 15.55 83.06 40 8 41 1111X-3 510.89 IIF 4.9 .00 10.37 89.63 35 8 39 1711X-5 514.00 IIF 5.8 .00 40.15 59.85 38 14 34 1412X-5 523.93 IIIB 3.3 .00 49.97 50.03 35 16 34 1612X-5 524.53 IIIB 3.7 .00 17.15 82.85 67 9 17 713X-3 530.61 IIIB 31.0 .87 32.22 66.92 29 10 39 2213X-3 530.69 IIIB 30.0 23.56 60.97 15.47 31 21 28 2014X-CC 545.33 IIIB 4.8 .00 33.26 66.74 42 15 30 1314X-CC 545.41 IIIB 5.1 .00 36.18 63.82 — — — —15X-1 546.54 IIIB 35.1 .00 35.64 64.36 29 9 43 1815X-3 548.88 IIIB 6.7 .00 21.37 78.63 35 16 36 1216X-6 562.32 IIIB 4.3 .00 7.87 92.13 42 16 28 1416X-6 562.47 IIIB 4.6 .00 35.31 64.69 33 15 36 1617X-4 570.04 IIIB 33.6 .00 66.30 33.70 35 10 34 2117X-7 573.14 IIIB 34.0 .00 14.42 85.58 22 8 53 1617X-76 573.27 IIIB 35.2 4.10 72.33 23.57 35 10 40 1618X-3 576.34 IIIB 32.0 .00 52.76 47.24 31 15 40 1518X-3 576.69 IIIB 3.8 .00 7.38 92.62 21 15 40 2418X-3 576.83 IIIB 9.0 .00 45.59 54.41 34 13 32 2119X-4 587.31 IIIB 51.9 .00 54.03 45.97 — — — —19X-CC 592.37 IIIB 29.3 .00 20.70 79.30 — — — —
4sc
egt
ae
a
-
d
are
ain andgical, the-ain
cho-entsdardugh
tsd asnse.
ts bylancen isl si-tical
zedonctraled
ngicalcoreed for<1-
according to data quality control report (LDEO, unpubl. data), per-formed at Lamont-Doherty Earth Observatory by the Borehole Re-search Group. Nevertheless, the rate of penetration log (ROPE) indi-cates that logging speed was too high for accurate natural gamma rayspectral data acquisition and resulted in localized bad readings andlow values. LWD data were depth shifted to the seafloor –4950 mHole 948A.
Open-hole (conventional) logs were also acquired at Hole 9but because of tool sticking and the overall bad hole conditioncountered, the quality of the wireline logs is poor. Hole 948C spenatural gamma-ray (NGT) data were corrected for borehole sizdrilling fluid and acoustic data (sonic log) for cycle skipping. Irrelar borehole affected most measurements, especially the densiThe open-hole logs are of less quality than the LWD measuremand have not been included in this study.
METHODOLOGY
The approach used for mineralogy inversion from boreholedata is based on the principle that the log responses may be relthe sum of proportions of the mineralogical components consideach multiplied by the appropriate response coefficients in a syof linear equations that can be solved simultaneously. The equfor each log take the form
c1v1 + c2v2 +......cnvn = L,
where n is the number of components, vi the proportion of component i, ci the log response of component i, and L the log responseEach log provides a single equation. This matrix formulation is aear model introduced by Savre (1963) and further develope
for
8C, en-tral andu-
y log.ents
logted tored,
stemtions
. lin- by
Burke et al. (1967). More extensive details on this methodologygiven by Doveton (1994).
This approach provides generally satisfactory results if the mcomponents are known, the appropriate set of logs is availableadequate coefficients are chosen. In our case, the main mineralocomponents (n) are known from Hole 948C core sample analysesset of LWD “lithology” logs available (L) is limited, and both the coefficients (c) and the proportions of each component (v) are the munknowns addressed and tested. The coefficients were initially sen from published standard values or ranges for the componconsidered. The coefficients have been adjusted within the stanranges, in accordance with the modeling results obtained, throsuccessive iterations.
A large number of lithological and/or mineralogical componenrequires a large number of logs. Pore-fluids have been includeone more component in so far as they contribute to the log respoWhen the number of logs is less than the number of componenone, the equations satisfy the unknowns because of material bathe proportions of the components sum to one. A unique solutioobtained from the appropriate matrix algorithm by a conventionamultaneous equation technique. Further discussion on the theoreaspects of this approach is given in Doveton and Cable (1979).
The full set of Hole 948A LWD measurements has been analyalthough only density (RHOB), photoelectric factor (PEF), neutrporosity (TNPH), spectral natural gamma ray (SGR), and the spenatural gamma-ray Th/K ratio (Th/K) data were quantitatively usin the final inversion.
The inversion of mineral components from log data, includiclay mineralogies, required good constraints on the mineralogcomponents. The constraints for the model come from 3 sets of analysis results: the results obtained on discrete samples analyztexture and composition (Table 1), clay mineralogy results (for
221
M.J. JURADO, B. ALONSO
The inversion of mineral components from log data, includingclay mineralogies, required good constraints on the mineralogicalcomponents. The constraints for the model come from 3 sets of coreanalysis results: the results obtained on discrete samples analyzed fortexture and composition (Table 1), clay mineralogy results (for <1-µm fraction) obtained by Underwood and Deng (Chapter 1, this vol-ume), and shipboard analyses (Shipley, Ogawa, Blum, et al., 1995).
Thirty-eight samples were analyzed for carbonate content, tex-ture, sand fraction composition, and clay mineralogy in order to char-acterize sediment types, and relative abundance. Carbonate contentswere determined using a Bernard calcimeter (Vatan, 1967) and areexpressed as weight percent (wt%) CaCO3 (assuming all carbonate aspure calcite). Sediment texture was determined by settling-tube tech-niques for the coarse-grained fraction (>50 µm), and Sedigraph5000D techniques for the silt and clay fractions (<50 µm) (Giro andMaldonado, 1985). Sand fraction (>63 µm) composition was exam-ined with a binocular microscope to estimate abundance of differentcomponents, counting about 250− 300 grains per sample.
The clay mineralogy was determined in the fraction <2 µm. Thisfraction was collected by decantation, and orientated aggregates weremade on glass slides. The X-ray diffractograms were made on an un-treated sample, a glycolate sample, and a sample heated for 2 hr at550° C. X-ray diffractograms were obtained with a Siemens d-500 X-ray diffractometer. Peaks were scanned from 2θ of 4° to 50°, with astep-scan range of 1.2θ− 2.0θ, an angular increment of 0.05/2θ, andcounting rate of 3 s/step. Diffractograms were visually interpretedwith the aid of a computerized search-and-match routine based on the“Joint Committee on Powder Diffraction Standards” fields (Interna-tional Centre for Diffraction Data, 1994).
The clay minerals identified by their characteristic basal-reflec-tion maxima include smectite (001), illite (001), kaolinite (002), and
Figure 2. X-ray diffractograms: A. Positions and intensities of basalreflections for smectite, illite, and kaolinite. B. Kaolinite (3.58°) and chlo-rite (3.54°) reflections in the slow scan.
222
chlorite (004) (Fig. 2). The two latter minerals are differentiated bythe relative intensities; at 3.58° for kaolinite and 3.54° for chlorite re-flections in the slow scan situated these peaks are between 24° and26° (Biscaye, 1964). The relative proportions of clay minerals wereestimated following the methodology proposed by Rius et al. (1989),a simple standardless method to directly determine calibration con-stants using only diffracted intensities and calculated phase-absorp-tion coefficients by a least-squares procedure. This quantitative clayanalysis has been successfully used to analyze marine sediments(Palanques et al., 1990; Alonso et al., 1996).
According to the sample analyses results and shipboard mineral-ogy results (Shipley, Ogawa, Blum, et al., 1995), the components tobe considered were quartz, plagioclase, carbonate, smectite, illite,chlorite, and kaolinite, which can be regarded as the components of a“complex lithology”.
CORE LOG INTEGRATION: RESULTS OF SAMPLE ANALYSES AND CORRELATION
WITH LOG RESPONSE
Sample analyses results for mineral composition, texture and claytypes are shown in Table 1. The correspondence between these re-sults and borehole log data was examined by means of a correlationmatrix (Table 2).
The sample analyses results correspond to core samples fromUnits I, II, and III as defined in Shipley, Ogawa, Blum, et al. (1995)and are listed in Table 1 and shown graphically in Figures 3 and 4.
Composition and Texture
The particle-size distributions of selected samples from beneathand above the décollement, the depth interval included in the model,were determined for 36 samples ranging from late Miocene to lateOligocene in age. Composition and texture of samples from Unit IIcorrespond predominantly to fine-grained size: terrigenous clay (usu-ally >90% clay) and terrigenous silty clay (77%− 90% clay). Carbon-ate content is low (3.7%–13%) and its vertical distribution is uniform.Higher carbonate contents are found within Subunit IIB (Shipley,Ogawa, Blum, et al., 1995).
Sharp sediment texture changes are recognized within Unit III,and frequent fluctuations in composition and sediment texture occurwithin Subunit IIIB. Sediments range in composition and texturefrom most abundant terrigenous mud (30%− 50% clay; 17%− 49%silt) to terrigenous clay (>85% clay) of low carbonate content (3%),less frequent biogenic mud (67% clay, 32% silt), and biogenic sandysilt (60%− 72% silt; 23% sand) with a relatively high carbonate con-tent (30%− 35%). Carbonate content within Subunit IIIB is locallyhigh, and vertical distribution is irregular, showing considerable fluc-tuations ranging from 4% to 51%.
Two samples from Unit I, the uppermost cored interval (156-948C-1H-01, 0.36 mbsf and 156-948C-1H− 02, 2.83 mbsf), corre-spond to silty clay (<58% of clay) containing major proportions of(biogenic) sands (15%− 20%). These sediments are characterized bya high carbonate content (24%) and the abundance of biogenic com-ponents (90%). This depth interval and these results have not been in-cluded in the inversion model.
Clay Mineralogy
Clay is the most abundant textural component identified in thesamples throughout the section (Table 1). Mineralogy analyses on theclay-size fraction of the samples yield the relative content (%) of thefour clay minerals that have been identified: smectite, illite, kaoliniteand chlorite.
The smectite content ranges from 38% to 72%, the average valuefor Unit II being 53%. Maximum values correspond to clay sediment
MINERAL INVERSION OF LOG DATA
49225
2
873
8
Table 2. Correlation matrix of log data and textural-mineral components from Table 1.
Note: SGR = natural radioactivity, CGR = computed natural radioactivity, Th/K = natural spectral thorium/uranium ratio, RHOB = density, PEF = photoelectric factor, TNPH = neu-tron porosity.
SGR CGR Th/K RHOB PEF TNPH CaCO3 Sand Silt Clay Smectite Illite Kaolinite Chlorite
SGR 1 .6366 .3697 .6202 .4953 –.3346 .4466 .2383 .5731 –.5550 –.5195 .5662 .4595 .1722CGR .6366 1 .2292 .3910 .4290– .4740 .1384 .1463 .4100 –.3923 –.1172 .3242 .1600 –.187Th/K .3697 .2292 1 –.1523 –.2582 –.2439 .0459 –.0326 .2296 –.1918 –.2125 .0745 .4174 –.219RHOB .6202 .3910 –.1523 1 .8941 –.0062 .4234 .1954 .3849 –.3847 –.2708 .2797 .1665 .231PEF .4953 .4290 –.2582 .8941 1 .0747 .2411 .0915 .2077– .2035 –.2829 .2975 .1502 .266TNPH –.3346 –.4740 –.2439 –.0062 .0747 1 –.3311 –.0836 –.4725 .4257 .2533 –.1626 –.2803 –.112CaCO3 .4466 .1384 .0459 .4234 .2411 ––.3311 1 .4142 .6688 –.6738 –.5385 .0965 .4630 .5523Sand .2383 .1463 –.0826 .1954 .0915 –.0836 .4142 1 .4620 –.6354 –.2186 .5449 –.0197 .214Silt .5731 .4100 .2296 .3849 .2077 –.4725 .6688 .4620 1 –.9779 –.5268 .4841 .3961 .3757Clay –.5550 –.3923 –.1918 –.3847 –.2035 .4257 –.6738 –.6354 –.9779 1 .5086 –.5541 –.3388 –.372Smectite –.5195 –.1172 –.2125 –.2708 –.2829 .2533 –.5385 –.2186 –.5268 .5086 1 .5061 –.8793 –.75Illite .5662 .3242 .0745 .2797 .2975 –.1626 .0965 .5449 .4841 –.5541 –.5061 1 .1758 .318Kaolinite .4595 .1600 .4174 .1665 .1502 –.2803 .4630 –.0197 .3961 –.3388 –.8793 .1758 1 .463Chlorite .1722 –.1874 –.2199 .2312 .2662 –.1125 .5523 .2142 .3757 –.3728 –.7573 .318 .4638 1
me
e
s
Owie
og o
o
io
m
nth
ested
-be-ex-areer-e
ng.GR
re- be-
am-col-e, theand
ur-lowey,te-
enela-very
m-logdif-henti-es.a,
ype.lu-laycmitym-
uralnt
Kaolinite values range from 13% to 41% within Unit II. The high-est values correspond to the base of Unit II (34%−41%). Kaolinitecontent ranges from 17% to 54% within Unit III.
High kaolinite content (~40%) corresponds to moderate CaCo3content (4.7%, 4.9%) within Unit II, but high CaCO3 (>30%) locallywithin Unit III.
Chlorite content ranges from 6% to 20% within Unit II. Verticaldistribution is regular and the average value is 14%. Within Unit IIIvalues are relatively higher; the average value is 18% and the distri-bution is even more variable.
Correlation of Sediment Composition with Log Response
A qualitative analysis of the some of the log curves displayed inFigure 3 reveals the main geological features of the décollezone. Moderate variations in gamma-ray values, and locally in dty and photoelectric factor values, correlate with slight changesediment composition within Unit II. These were the basis for idfying six lithostratigraphic subunits that are recognizable onLWD data (Fig.3; Shipley, Ogawa, Blum, et al., 1995). The mstriking change in all log values occurs at 513 mbsf and correspto the boundary between Unit II and Unit III, the boundary betwthe accretionary prism sediments and the underthrust sedimentother sharp break in compositional changes can be located at520 mbsf, where a Th/K spike is remarkable. A deflection in thevalues within Unit III at 525 mbsf, recognizable in the SGR, RHTNPH, PEF, and Th/K logs corresponds to the boundary betSubunit IIIA and Subunit IIIB. Subunit IIIA is dominated by vargated claystones and Subunit IIIB by calcareous turbidites, siltyrigenous turbidites and hemipelagic claystones. Compositiontextural changes recognized within Subunit IIIB have a good cspondence with changing log values and a “spiky” shape recoable on natural-gamma ray neutron and photoelectric factor logs3). Carbonate-rich intervals result in higher density values and lnatural radioactivity (low K content) than the sediments within whthe interbeddings occur. The vertical resolution obtained withCDN tool for density log (15−5 cm) is within the range required fthe identification of these levels within Subunit IIIB.
In addition to these main features, more subtle composittrends that could be recorded by the LWD measurements haveanalyzed by combining the log data and the results obtainedsample analyses.
The results of sample analyses from the décollement zone werequantitatively compared with log measurements by means of a clation matrix (Table 1). Even considering the scattering of the sples and an unavoidable possible depth misfit between the saand the log measurements, this analysis is useful to constrainsensitive the different log measurements are to the correspocompositional changes and also to choose appropriate logs for version.
entnsi-s innti-theostondseen. An-about logB,een-
ter-andrre-niz-
(Fig.werichther
nal beenfrom
orre-am-ples
howdinge in-
The correlation coefficients calculated show interesting featur(Table 2). SGR displays a better correlation than CGR (compunatural radioactivity without uranium spectra) to all the mineral components. This feature is surprising in the case of the correlation tween the gamma ray logs (SGR or CGR) and the clay minerals (cept for chlorite) and suggests that the different clay minerals characterized by different uranium contents. Although CGR is genally preferred for clay typing, we selected SGR for inclusion in thinversion model because of its observed correlation in this settiPositive correlations were also observed between RHOB and S(also CGR) and between RHOB and PEF.
Correlations between mineral components include a positive corlation between carbonate and silt (0.66) and negative correlationstween carbonate and total clay (−0.67) and smectite (−0.53). For clayminerals, smectite shows a negative correlation with kaolinite (−0.87)and chlorite (−0.75).
MINERALOGY INVERSION FROM LOG DATA
On the basis of the results of shipboard and shore-based core sple analyses, the main mineral components represented in the délement zone are well constrained. Smectite, illite, chlorite, kaolinitcarbonate, quartz, and plagioclase are the main components ofsediments at Site 948 between 420.8 and 592.7 mbsf (Units II III).
Textural analyses indicate that the clay fraction is the main textal component (>70%). Carbonate content is on average far be10% for most of the section (Fisher and Underwood, 1995; ShiplOgawa, Blum, et al., 1995, p. 108; Table 1, this paper). Carbonarich samples (>20%) correspond to Subunits IA, IIA, IIB, and IIIB.The most carbonate-rich interval corresponds to the upper Oligoccalcareous turbidites within Subunit IIIB correspond. Quartz and pgioclase are also represented, although plagioclase content is low within Unit III (Shipley, Ogawa, Blum, et al., 1995, p. 108).
The limited set of logs available and the number of mineral coponents, and thus of unknowns to be modeled in the inversion of data, yields an underdetermined system. The importance of the ferent mineral components was evaluated in order to simplify tproblem and reduce the number of unknowns. The clay types idefied in sample analyses produce radically different log responsThe log response can vary strongly depending on Fe-Mg-Al, Ca-Nand K contents of the clays, and these can vary for a same clay tThe amount of compositional water in clays also has a crucial infence on log values. Standard log density (RHOB) values for the cminerals considered (Tables 1, 2) can range from 2.12 to 2.77 g/3
and photoelectric effect (PEF) from 1.83 to 6.30. Thus, the variabilof log values between chlorite and smectite is greater than, for exaple, between smectite and calcite, or quartz and plagioclase. Natradioactivity properties and Th, K and U contents are also differe
223
M.J. JURADO, B. ALONSO
lagioclaserosity
inversionic factor
Figure 3. Site 948 décollement zone, between 420.8 and 580 mbsf. Mineralogy-porosity inversion performed on Hole 948A LWD data: quartz and p(Q/Pl), smectite (SMEC), illite (ILLI), kaolinite (KAOL), chlorite (CHLO), and porosity (POR). Computed percentages of mineral components and powere obtained applying Table 3 coefficients. To the right of the mineralogy inversion results are the logging data on which the mineralogy-porosity was performed: density (RHOB), natural radioactivity (SGR), natural spectral thorium-uranium ratio (Th/K), neutron porosity (TNPH), and photoelectr(PEF) logs, and the rate of penetration (ROPE) log for quality control of LWD data.
224
MINERAL INVERSION OF LOG DATA
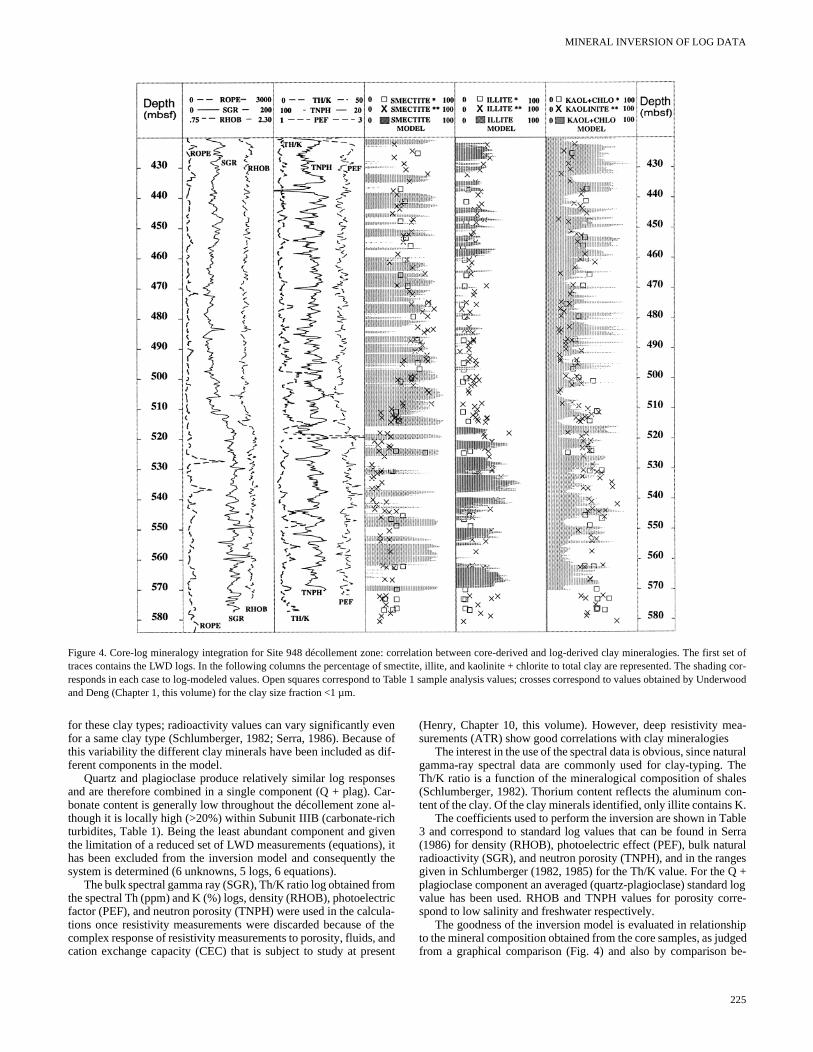
rwood
Figure 4. Core-log mineralogy integration for Site 948 décollement zone: correlation between core-derived and log-derived clay mineralogies. The first set oftraces contains the LWD logs. In the following columns the percentage of smectite, illite, and kaolinite + chlorite to total clay are represented. The shading cor-responds in each case to log-modeled values. Open squares correspond to Table 1 sample analysis values; crosses correspond to values obtained by Undeand Deng (Chapter 1, this volume) for the clay size fraction <1 µm.
e
o
u
a-
ralhesn-.lerrals
+ logre-
ipede-
for these clay types; radioactivity values can vary significantly evenfor a same clay type (Schlumberger, 1982; Serra, 1986). Because ofthis variability the different clay minerals have been included as dif-ferent components in the model.
Quartz and plagioclase produce relatively similar log responsesand are therefore combined in a single component (Q + plag). Car-bonate content is generally low throughout the décollement zonthough it is locally high (>20%) within Subunit IIIB (carbonate-ricturbidites, Table 1). Being the least abundant component and gthe limitation of a reduced set of LWD measurements (equationshas been excluded from the inversion model and consequentlysystem is determined (6 unknowns, 5 logs, 6 equations).
The bulk spectral gamma ray (SGR), Th/K ratio log obtained frthe spectral Th (ppm) and K (%) logs, density (RHOB), photoelecfactor (PEF), and neutron porosity (TNPH) were used in the calctions once resistivity measurements were discarded because ocomplex response of resistivity measurements to porosity, fluids,cation exchange capacity (CEC) that is subject to study at pre
al-hiven), it the
mtricla-
f theandsent
(Henry, Chapter 10, this volume). However, deep resistivity mesurements (ATR) show good correlations with clay mineralogies
The interest in the use of the spectral data is obvious, since natugamma-ray spectral data are commonly used for clay-typing. TTh/K ratio is a function of the mineralogical composition of shale(Schlumberger, 1982). Thorium content reflects the aluminum cotent of the clay. Of the clay minerals identified, only illite contains K
The coefficients used to perform the inversion are shown in Tab3 and correspond to standard log values that can be found in Se(1986) for density (RHOB), photoelectric effect (PEF), bulk naturaradioactivity (SGR), and neutron porosity (TNPH), and in the rangegiven in Schlumberger (1982, 1985) for the Th/K value. For the Qplagioclase component an averaged (quartz-plagioclase) standardvalue has been used. RHOB and TNPH values for porosity corspond to low salinity and freshwater respectively.
The goodness of the inversion model is evaluated in relationshto the mineral composition obtained from the core samples, as judgfrom a graphical comparison (Fig. 4) and also by comparison b
225
M.J. JURADO, B. ALONSO
c
feu
a
niew
Weo
a
jorralst ofwere
-rvalesery
ht-nduted in
of
ionhat
ig. re-
s ob- and
tesid-woereighcon-d.ter-ard al.,itialug- Ourt”
nditeon-ve
edol
on
talon-y
in-
-was-e
uc-.
tween the average values obtained from sample analysis and from theinversion of the log data (Table 4).
Even though the inversion model reproduces the trends and rela-tive abundances of the components considered, some sources or errorare known beforehand. Most of these problems are related specifical-ly to log acquisition during Leg 156 and could be reduced in futureLWD acquisition. Logging speeds were far above those recommend-ed for natural gamma ray spectral data acquisition and this affects theaccuracy of the measurements.
Some of the logs used show strong correlation (Table 2). More in-dependent log measurements would be desirable. For example, PEFmeasurement is strongly correlated (.8941) with RHOB and probablydoes not add significant independent information to better discrimi-nate between mineralogical components.
The results of bulk mineralogy-porosity inversion are displayed inFigure 3. In Figure 4, the results obtained for the different clays con-tent are compared with Hole 948C (420.8−592.72 mbsf) core sampleanalysis results from Table 1, and from Underwood and Deng (Chap-ter 1, this volume). In order to compare with core sample analysis re-sults on clay mineralogy, the scores obtained from the bulk mineral-ogy-porosity calculation were converted to percentage of total clay.Kaolinite + chlorite, calculated separately, are plotted together asKAOL + CHLO in Figure 4.
DISCUSSION OF THE INVERSION MODEL
The results obtained (Figs. 3, 4) indicate a good agreement be-tween sample analysis results and results obtained from mineralogymodeling from a limited set of log data.
The core sample analysis results of Underwood and Deng (Chap-ter 1, this volume) and those from Table 1 are taken as the “true”erence to which the model is compared (Fig. 4; Table 4). We renize that there may be inaccuracies as a result of both limitationsample analysis methods and discrepancies between core-meaand log-measured depths.
The solution obtained from the inversion of log data is not per(Fig. 4; Table 4), but it yields a good approximation to the meascore sample mineralogy when using standard log values, log vawithin the standard ranges (Schlumberger 1985; Serra 1986) or aged standard log values (Q + plagioclase) for the minerals considin the system (Table 2). Different choices for the matrix coefficiewithin the standard values ranges, would yield slightly different meral-porosity proportions. Our results are a first attempt but this modology needs further testing and refinement that will be gained the study of other cases in the future.
Some uncertainty arises also regarding the accuracy of the Lmeasurements that might have been affected by fast logging spThe magnitude of this effect for the different logs will be better cstrained by the acquisition of new LWD data. Nevertheless, thesults obtained suggest that most log measurements were not drically affected.
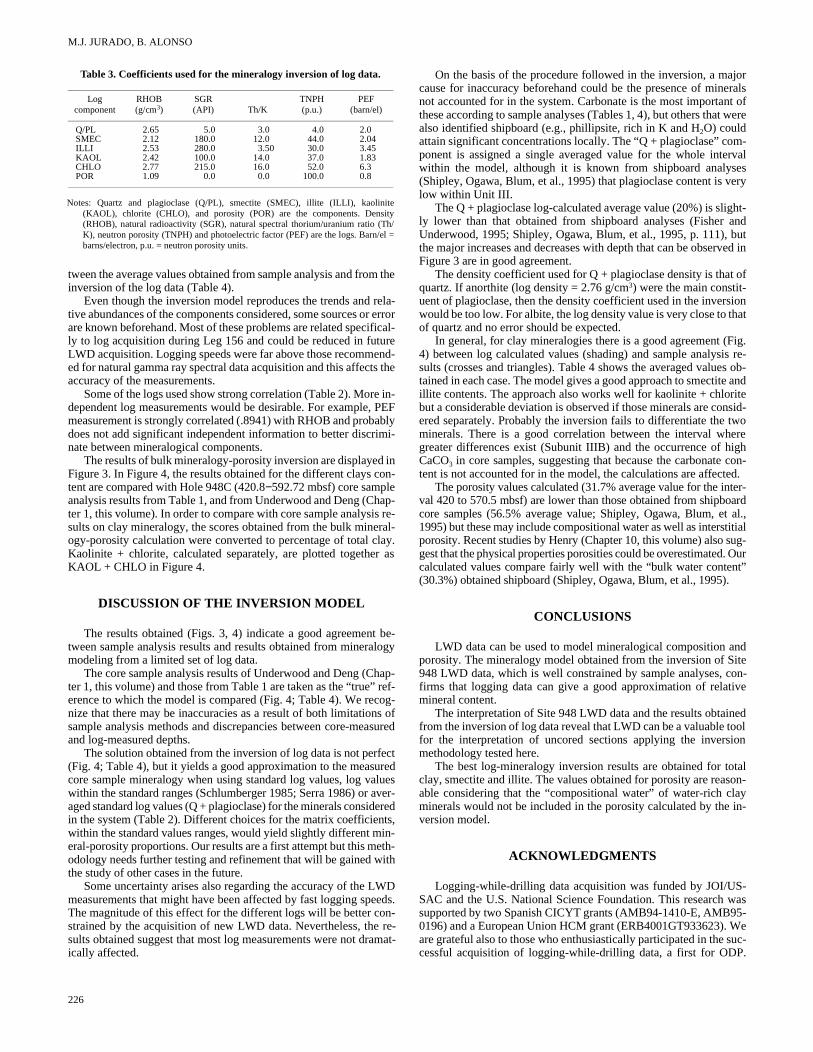
Table 3. Coefficients used for the mineralogy inversion of log data.
Notes: Quartz and plagioclase (Q/PL), smectite (SMEC), illite (ILLI), kaolinite(KAOL), chlorite (CHLO), and porosity (POR) are the components. Density(RHOB), natural radioactivity (SGR), natural spectral thorium/uranium ratio (Th/K), neutron porosity (TNPH) and photoelectric factor (PEF) are the logs. Barn/el =barns/electron, p.u. = neutron porosity units.
Logcomponent
RHOB(g/cm3)
SGR(API) Th/K
TNPH(p.u.)
PEF(barn/el)
Q/PL 2.65 5.0 3.0 4.0 2.0SMEC 2.12 180.0 12.0 44.0 2.04ILLI 2.53 280.0 3.50 30.0 3.45KAOL 2.42 100.0 14.0 37.0 1.83CHLO 2.77 215.0 16.0 52.0 6.3POR 1.09 0.0 0.0 100.0 0.8
226
ref-og-s ofsured
ctredluesver-eredts,n-th-ith
Deds.n- re-mat-
On the basis of the procedure followed in the inversion, a macause for inaccuracy beforehand could be the presence of minenot accounted for in the system. Carbonate is the most importanthese according to sample analyses (Tables 1, 4), but others that also identified shipboard (e.g., phillipsite, rich in K and H2O) couldattain significant concentrations locally. The “Q + plagioclase” component is assigned a single averaged value for the whole intewithin the model, although it is known from shipboard analys(Shipley, Ogawa, Blum, et al., 1995) that plagioclase content is vlow within Unit III.
The Q + plagioclase log-calculated average value (20%) is sligly lower than that obtained from shipboard analyses (Fisher aUnderwood, 1995; Shipley, Ogawa, Blum, et al., 1995, p. 111), bthe major increases and decreases with depth that can be observFigure 3 are in good agreement.
The density coefficient used for Q + plagioclase density is thatquartz. If anorthite (log density = 2.76 g/cm3) were the main constit-uent of plagioclase, then the density coefficient used in the inverswould be too low. For albite, the log density value is very close to tof quartz and no error should be expected.
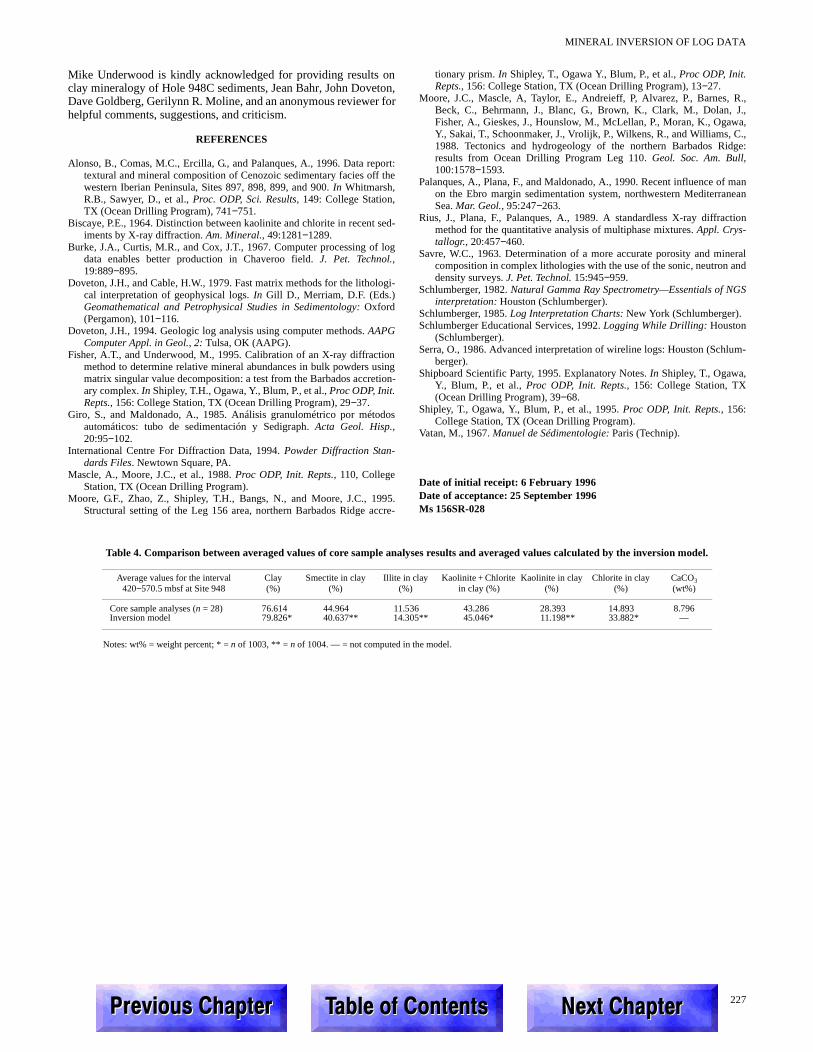
In general, for clay mineralogies there is a good agreement (F4) between log calculated values (shading) and sample analysissults (crosses and triangles). Table 4 shows the averaged valuetained in each case. The model gives a good approach to smectiteillite contents. The approach also works well for kaolinite + chloribut a considerable deviation is observed if those minerals are conered separately. Probably the inversion fails to differentiate the tminerals. There is a good correlation between the interval whgreater differences exist (Subunit IIIB) and the occurrence of hCaCO3 in core samples, suggesting that because the carbonate tent is not accounted for in the model, the calculations are affecte
The porosity values calculated (31.7% average value for the inval 420 to 570.5 mbsf) are lower than those obtained from shipbocore samples (56.5% average value; Shipley, Ogawa, Blum, et1995) but these may include compositional water as well as interstporosity. Recent studies by Henry (Chapter 10, this volume) also sgest that the physical properties porosities could be overestimated.calculated values compare fairly well with the “bulk water conten(30.3%) obtained shipboard (Shipley, Ogawa, Blum, et al., 1995).
CONCLUSIONS
LWD data can be used to model mineralogical composition aporosity. The mineralogy model obtained from the inversion of S948 LWD data, which is well constrained by sample analyses, cfirms that logging data can give a good approximation of relatimineral content.
The interpretation of Site 948 LWD data and the results obtainfrom the inversion of log data reveal that LWD can be a valuable tofor the interpretation of uncored sections applying the inversimethodology tested here.
The best log-mineralogy inversion results are obtained for toclay, smectite and illite. The values obtained for porosity are reasable considering that the “compositional water” of water-rich claminerals would not be included in the porosity calculated by the version model.
ACKNOWLEDGMENTS
Logging-while-drilling data acquisition was funded by JOI/USSAC and the U.S. National Science Foundation. This research supported by two Spanish CICYT grants (AMB94-1410-E, AMB950196) and a European Union HCM grant (ERB4001GT933623). Ware grateful also to those who enthusiastically participated in the scessful acquisition of logging-while-drilling data, a first for ODP
MINERAL INVERSION OF LOG DATA
d
9c
,
,
:
ann
n
ald
Mike Underwood is kindly acknowledged for providing results onclay mineralogy of Hole 948C sediments, Jean Bahr, John Doveton,Dave Goldberg, Gerilynn R. Moline, and an anonymous reviewer forhelpful comments, suggestions, and criticism.
REFERENCES
Alonso, B., Comas, M.C., Ercilla, G., and Palanques, A., 1996. Data report:textural and mineral composition of Cenozoic sedimentary facies off thewestern Iberian Peninsula, Sites 897, 898, 899, and 900. In Whitmarsh,R.B., Sawyer, D., et al., Proc. ODP, Sci. Results, 149: College Station,TX (Ocean Drilling Program), 741−751.
Biscaye, P.E., 1964. Distinction between kaolinite and chlorite in recent sed-iments by X-ray diffraction. Am. Mineral., 49:1281−1289.
Burke, J.A., Curtis, M.R., and Cox, J.T., 1967. Computer processing of logdata enables better production in Chaveroo field. J. Pet. Technol.,19:889−895.
Doveton, J.H., and Cable, H.W., 1979. Fast matrix methods for the lithologi-cal interpretation of geophysical logs. In Gill D., Merriam, D.F. (Eds.)Geomathematical and Petrophysical Studies in Sedimentology: Oxford(Pergamon), 101−116.
Doveton, J.H., 1994. Geologic log analysis using computer methods. AAPGComputer Appl. in Geol., 2: Tulsa, OK (AAPG).
Fisher, A.T., and Underwood, M., 1995. Calibration of an X-ray diffractionmethod to determine relative mineral abundances in bulk powders usingmatrix singular value decomposition: a test from the Barbados accretion-ary complex. In Shipley, T.H., Ogawa, Y., Blum, P., et al., Proc ODP, Init.Repts., 156: College Station, TX (Ocean Drilling Program), 29−37.
Giro, S., and Maldonado, A., 1985. Análisis granulométrico por métoautomáticos: tubo de sedimentación y Sedigraph. Acta Geol. Hisp.,20:95−102.
International Centre For Diffraction Data, 1994. Powder Diffraction Stan-dards Files. Newtown Square, PA.
Mascle, A., Moore, J.C., et al., 1988. Proc ODP, Init. Repts., 110, CollegeStation, TX (Ocean Drilling Program).
Moore, G.F., Zhao, Z., Shipley, T.H., Bangs, N., and Moore, J.C., 1Structural setting of the Leg 156 area, northern Barbados Ridge a
3UHYLRXV�&KDSWHU3UHYLRXV�&KDSWHU 7DEOH�RI�&7DEOH�RI�&
os
95.cre-
tionary prism. In Shipley, T., Ogawa Y., Blum, P., et al., Proc ODP, Init.Repts., 156: College Station, TX (Ocean Drilling Program), 13−27.
Moore, J.C., Mascle, A, Taylor, E., Andreieff, P, Alvarez, P., Barnes, R.Beck, C., Behrmann, J., Blanc, G., Brown, K., Clark, M., Dolan, J.,Fisher, A., Gieskes, J., Hounslow, M., McLellan, P., Moran, K., OgawaY., Sakai, T., Schoonmaker, J., Vrolijk, P., Wilkens, R., and Williams, C.,1988. Tectonics and hydrogeology of the northern Barbados Ridgeresults from Ocean Drilling Program Leg 110. Geol. Soc. Am. Bull,100:1578−1593.
Palanques, A., Plana, F., and Maldonado, A., 1990. Recent influence of mon the Ebro margin sedimentation system, northwestern MediterraneaSea. Mar. Geol., 95:247−263.
Rius, J., Plana, F., Palanques, A., 1989. A standardless X-ray diffractiomethod for the quantitative analysis of multiphase mixtures. Appl. Crys-tallogr., 20:457−460.
Savre, W.C., 1963. Determination of a more accurate porosity and minercomposition in complex lithologies with the use of the sonic, neutron andensity surveys. J. Pet. Technol. 15:945−959.
Schlumberger, 1982. Natural Gamma Ray Spectrometry—Essentials of NGSinterpretation: Houston (Schlumberger).
Schlumberger, 1985. Log Interpretation Charts: New York (Schlumberger).Schlumberger Educational Services, 1992. Logging While Drilling: Houston
(Schlumberger).Serra, O., 1986. Advanced interpretation of wireline logs: Houston (Schlum-
berger).Shipboard Scientific Party, 1995. Explanatory Notes. In Shipley, T., Ogawa,
Y., Blum, P., et al., Proc ODP, Init. Repts., 156: College Station, TX(Ocean Drilling Program), 39−68.
Shipley, T., Ogawa, Y., Blum, P., et al., 1995. Proc ODP, Init. Repts., 156:College Station, TX (Ocean Drilling Program).
Vatan, M., 1967. Manuel de Sédimentologie: Paris (Technip).
Date of initial receipt: 6 February 1996Date of acceptance: 25 September 1996Ms 156SR-028
Table 4. Comparison between averaged values of core sample analyses results and averaged values calculated by the inversion model.
Notes: wt% = weight percent; * = n of 1003, ** = n of 1004. — = not computed in the model.
Average values for the interval420−570.5 mbsf at Site 948
Clay(%)
Smectite in clay(%)
Illite in clay(%)
Kaolinite + Chlorite in clay (%)
Kaolinite in clay(%)
Chlorite in clay(%)
CaCO3(wt%)
Core sample analyses (n = 28) 76.614 44.964 11.536 43.286 28.393 14.893 8.796Inversion model 79.826* 40.637** 14.305** 45.046* 11.198** 33.882* —
227RQWHQWVRQWHQWV 1H[W�&KDSWHU1H[W�&KDSWHU