Embed Size (px)
Citation preview
Investec Bank LimitedInvestor PresentationInvestor Presentation
May 2013
Contents
1. Introduction2. South Africa – Macroeconomic environment and banking sector overview3. Investec overview4. Investec financial overview
2
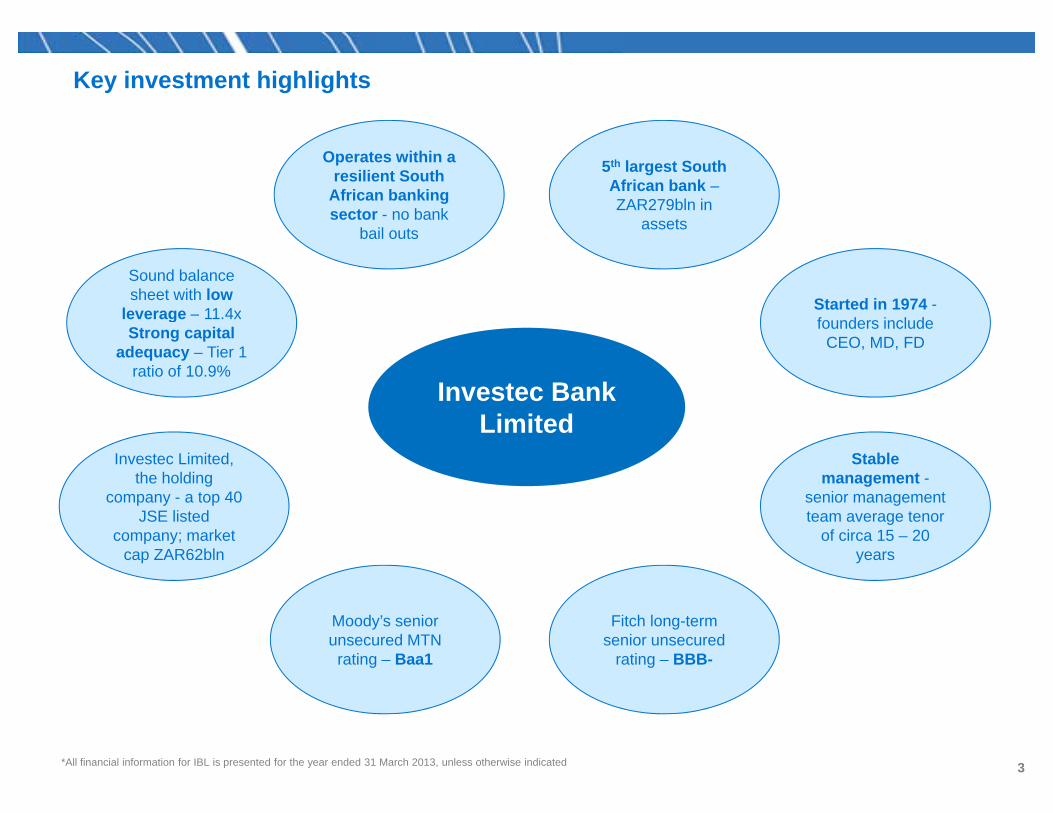
Key investment highlights
5th largest South African bank –ZAR279bln in
t
Operates within a resilient South
African banking sector - no bank
Sound balance sheet with low
leverage 11 4x Started in 1974 -
assetssector no bank bail outs
Investec Bank
leverage – 11.4xStrong capital
adequacy – Tier 1 ratio of 10.9%
founders include CEO, MD, FD
LimitedStable
management -senior management
Investec Limited, the holding
company - a top 40 senior management team average tenor
of circa 15 – 20 years
company a top 40 JSE listed
company; market cap ZAR62bln
Moody’s senior unsecured MTN rating – Baa1
Fitch long-term senior unsecured
rating – BBB-
*All financial information for IBL is presented for the year ended 31 March 2013, unless otherwise indicated 3
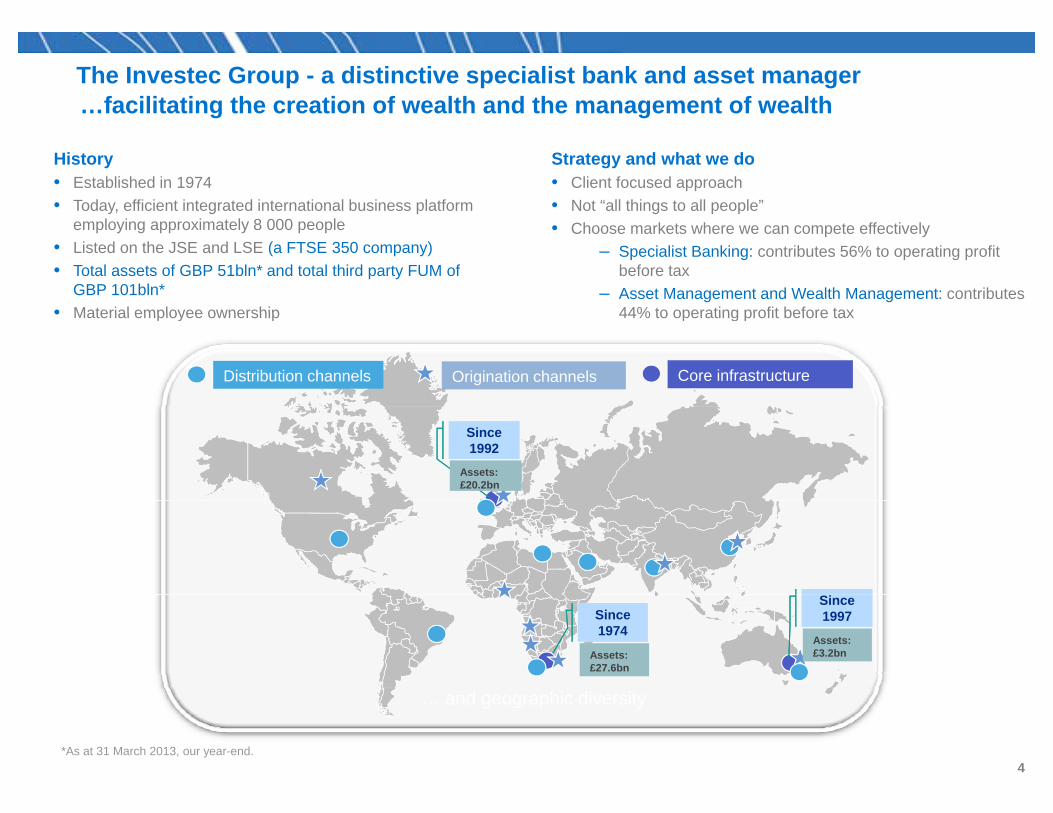
The Investec Group - a distinctive specialist bank and asset manager…facilitating the creation of wealth and the management of wealth
History• Established in 1974• Today, efficient integrated international business platform
l i i t l 8 000 l
Strategy and what we do• Client focused approach • Not “all things to all people”
employing approximately 8 000 people• Listed on the JSE and LSE (a FTSE 350 company)• Total assets of GBP 51bln* and total third party FUM of
GBP 101bln*• Material employee ownership
• Choose markets where we can compete effectively– Specialist Banking: contributes 56% to operating profit
before tax– Asset Management and Wealth Management: contributes
44% to operating profit before tax• Material employee ownership 44% to operating profit before tax
Core infrastructureDistribution channels Origination channels
Since1992
Assets: £20.2bn
Since 1974
Since1997
Assets: £27.6bn
Assets: £3.2bn
*As at 31 March 2013, our year-end.
… and geographic diversity
4
Contents
1. Introduction2. South Africa – Macroeconomic environment and banking sector overview3. Investec overview4. Investec financial overview
5
Economic landscape
• Republic of South Africa issuer / long-term rating - Baa1(M) neg / BBB(F) stable / BBB(S&P) neg
• The economy will continue to expand at a moderate pace in 2013 – Consumer spending has been a key driver of growth but a high level of unemployment, slower growth in real Co su e spe d g as bee a ey d e o g o t but a g e e o u e p oy e t, s o e g o t ea
disposable income, and unsecured lending pressures will prevent an acceleration– Fixed investment by state owned enterprises (upgrading and expanding of infrastructure) will continue to be
supportive of growth, but the private sector‘s fixed investment could be slower on account of weak demand and domestic (and global) uncertainties
– External demand expected to improve in 2013H2 External demand expected to improve in 2013H2
• Monetary policy will remain accommodative for a protracted period in order to underpin domestic demand, specifically in view of external constraints on growth
– Cost-push pressures and ZAR depreciation could temporarily cause a breach of the upper end of the inflation target band of 3% to 6% in 2013Q3target band of 3% to 6% in 2013Q3
– Flexible mandate of the South African Reserve Bank allows it to maintain a growth bias reflected in a negative real policy rate
• Fiscal consolidation has been implemented gradually in order to sustain government’s debt level at below 41% of GDP by FY2015 / 2016 while simultaneously not undermining growthby FY2015 / 2016, while simultaneously not undermining growth
• The ZAR has become more sensitive to local factors in view of the large deficit on the current account of the balance of payments
• The banking system remains healthy and unsecured lending does not pose a systemic risk
• Challenges– Labour relations and pending wage negotiations in the mining sector
Electricity supply– Electricity supply– Satisfactory solution to land reform still to be negotiated– Risk of social instability in view of lack of delivery of promised services
6
South Africa macroeconomic dynamicsMacro Economic Forecasts GDP growth (%)g ( )
4
5
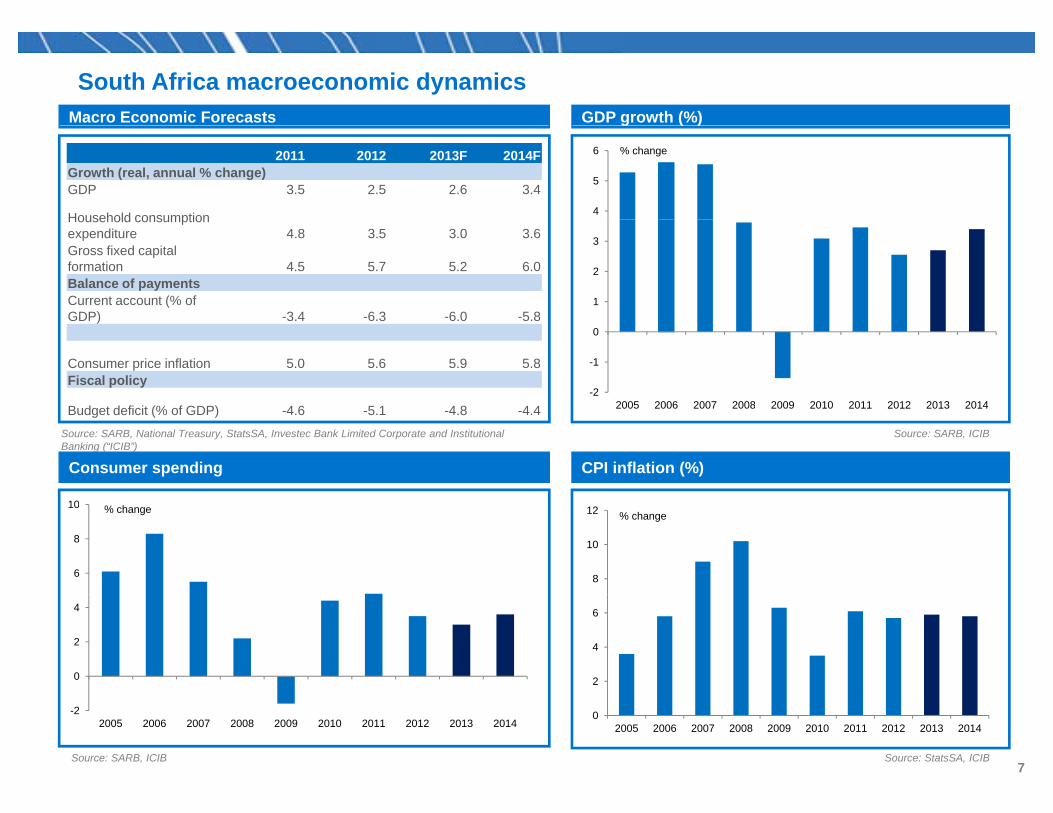
6 % change2011 2012 2013F 2014FGrowth (real, annual % change)GDP 3.5 2.5 2.6 3.4
Household consumption
1
2
3
Household consumption expenditure 4.8 3.5 3.0 3.6Gross fixed capital formation 4.5 5.7 5.2 6.0Balance of paymentsCurrent account (% of GDP) 3 4 6 3 6 0 5 8
-2
-1
0
2005 2006 2007 2008 2009 2010 2011 2012 2013 2014
GDP) -3.4 -6.3 -6.0 -5.8
Consumer price inflation 5.0 5.6 5.9 5.8Fiscal policy
B d t d fi it (% f GDP) 4 6 5 1 4 8 4 4
Consumer spending CPI inflation (%)
Source: SARB, National Treasury, StatsSA, Investec Bank Limited Corporate and Institutional Banking (“ICIB”)
Source: SARB, ICIB
2005 2006 2007 2008 2009 2010 2011 2012 2013 2014
10
Budget deficit (% of GDP) -4.6 -5.1 -4.8 -4.4
6
8
10 % change
8
10
12 % change
0
2
4
2
4
6
Source: SARB, ICIB Source: StatsSA, ICIB
-22005 2006 2007 2008 2009 2010 2011 2012 2013 2014
02005 2006 2007 2008 2009 2010 2011 2012 2013 2014
7

South Africa macroeconomic dynamicsCurrent account balance (% of GDP) ZAR vs PPPCurrent account balance (% of GDP) ZAR vs PPP
-2
-1
0
10
11
12
13
6
-5
-4
-3
6
7
8
9
10
-8
-7
-6
2005 2006 2007 2008 2009 2010 2011 2012 2013 2014
Source: SARB, ICIB Source: Bloomberg, ICIB
5
6
PPP USDZAR
Net government debt (foreign and domestic) as % of GDP
45
50
Source: SARB, ICIB Source: Bloomberg, ICIB
Government debt as % of GDP - BRICS countries
80
90
20
25
30
35
40
45
40
50
60
70
80
0
5
10
15
20
0
10
20
30
40
2001 2002 2003 2004 2005 2006 2007 2008 2009 2010 2011 2012 2013
Source: National Treasury
Domestic Foreign
2001 2002 2003 2004 2005 2006 2007 2008 2009 2010 2011 2012 2013
South Africa Brazil China India Russia
Source: SARB, National Treasury
8
South African Banking sector
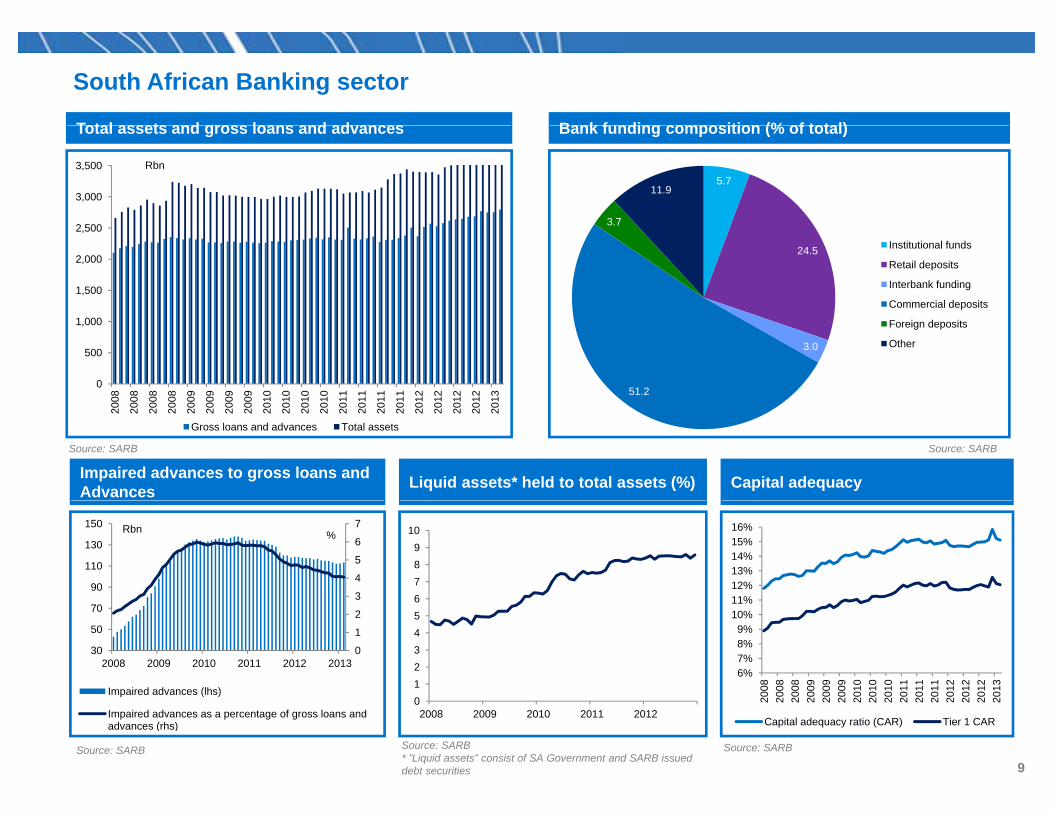
Total assets and gross loans and advances Bank funding composition (% of total)Total assets and gross loans and advances Bank funding composition (% of total)
5.7
3 7
11.93,000
3,500 Rbn
24.5
3.7
Institutional funds
Retail deposits
Interbank funding
Commercial deposits1,500
2,000
2,500
3.0
51.2
Foreign deposits
Other
0
500
1,000
008
008
008
008
009
009
009
009
010
010
010
010
011
011
011
011
012
012
012
012
013
Capital adequacyImpaired advances to gross loans and Advances Liquid assets* held to total assets (%)
Source: SARB Source: SARB
20 20 20 20 20 20 20 20 20 20 20 20 20 20 20 20 20 20 20 20 20
Gross loans and advances Total assets
789
10
3
4
5
6
7
90
110
130
150%Rbn
12%13%14%15%16%
123456
0
1
2
3
30
50
70
2008 2009 2010 2011 2012 2013
I i d d (lh )
6%7%8%9%
10%11%
08 08 08 09 09 09 10 10 10 11 11 11 12 12 12 13
Source: SARB* ”Liquid assets” consist of SA Government and SARB issued debt securities
Source: SARB Source: SARB
02008 2009 2010 2011 2012
Impaired advances (lhs)
Impaired advances as a percentage of gross loans and advances (rhs)
200
200
200
200
200
200
201
201
201
201
201
201
201
201
201
201
Capital adequacy ratio (CAR) Tier 1 CAR
9
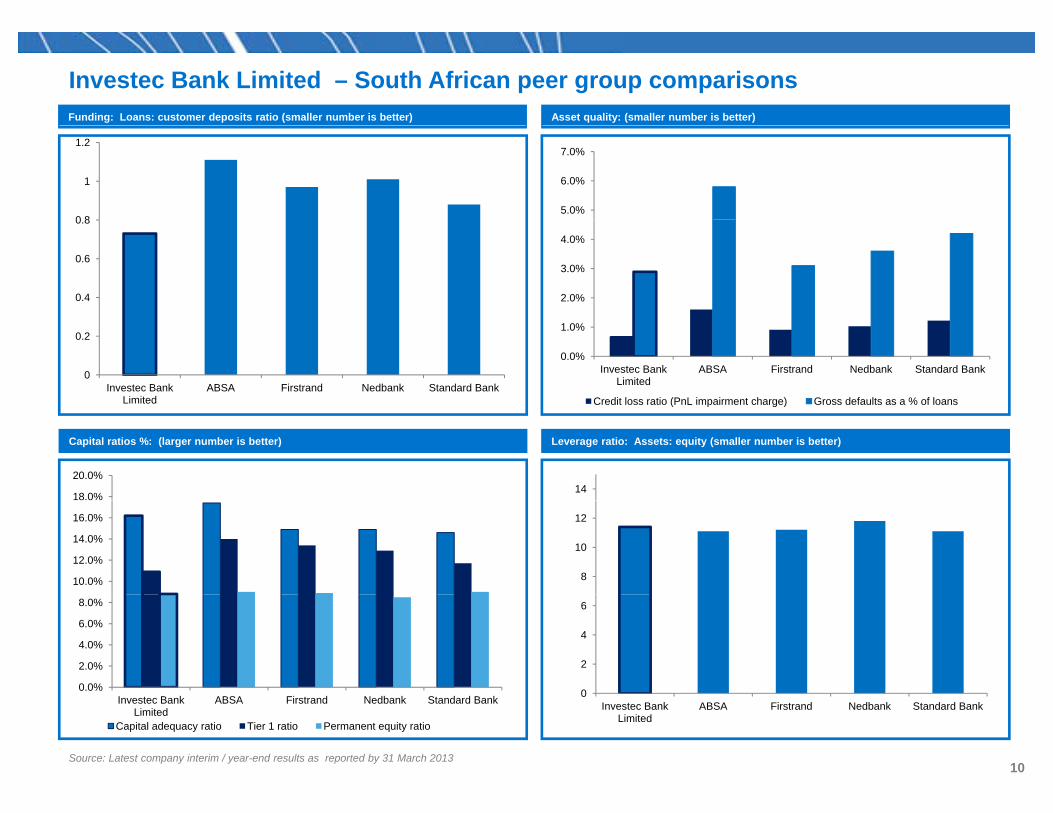
Investec Bank Limited – South African peer group comparisonsFunding: Loans: customer deposits ratio (smaller number is better) Asset quality: (smaller number is better)
0 8
1
1.2
5.0%
6.0%
7.0%
0.4
0.6
0.8
2.0%
3.0%
4.0%
0
0.2
Investec Bank Limited
ABSA Firstrand Nedbank Standard Bank
0.0%
1.0%
Investec Bank Limited
ABSA Firstrand Nedbank Standard Bank
Credit loss ratio (PnL impairment charge) Gross defaults as a % of loans
Leverage ratio: Assets: equity (smaller number is better)Capital ratios %: (larger number is better)
1418.0%
20.0%
( p g )
8
10
12
10.0%
12.0%
14.0%
16.0%
2
4
6
0 0%
2.0%
4.0%
6.0%
8.0%
Source: Latest company interim / year-end results as reported by 31 March 2013
0Investec Bank
LimitedABSA Firstrand Nedbank Standard Bank
0.0%Investec Bank
LimitedABSA Firstrand Nedbank Standard Bank
Capital adequacy ratio Tier 1 ratio Permanent equity ratio
10
Contents
1. Introduction2. South Africa – Macroeconomic environment and banking sector overview3. Investec overview4. Investec financial overview
11
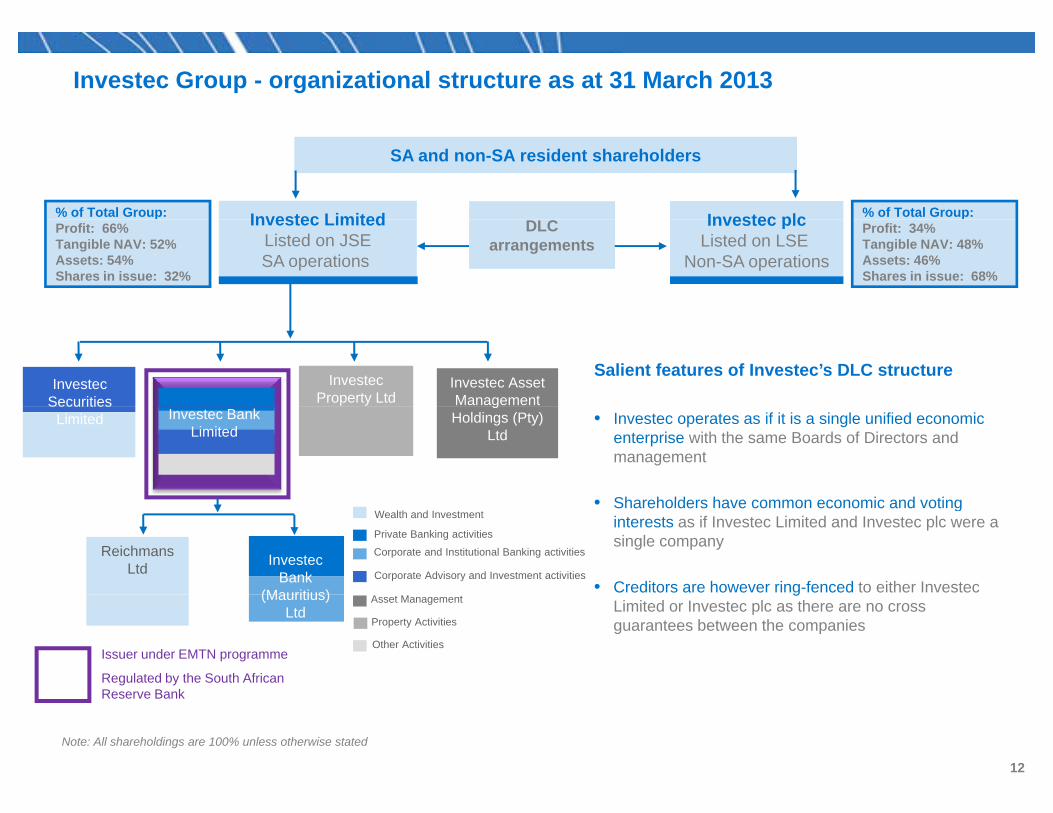
Investec Group - organizational structure as at 31 March 2013
Investec plc
SA and non-SA resident shareholders
Investec Limited % of Total Group:% of Total Group: Investec plcListed on LSE
Non-SA operations
DLC arrangements
Investec LimitedListed on JSESA operations
pProfit: 34%Tangible NAV: 48%Assets: 46%Shares in issue: 68%
pProfit: 66%Tangible NAV: 52%Assets: 54%Shares in issue: 32%
Investec Asset Management
Investec Property Ltd
Investec Securities
Salient features of Investec’s DLC structure
Investec Bank Limited
gHoldings (Pty)
LtdLimited • Investec operates as if it is a single unified economic
enterprise with the same Boards of Directors and management
• Shareholders have common economic and voting
Private Banking activities
Corporate Advisory and Investment activities
Corporate and Institutional Banking activities
Wealth and Investment
Investec Bank
(Mauritius)
Reichmans Ltd
• Shareholders have common economic and voting interests as if Investec Limited and Investec plc were a single company
• Creditors are however ring-fenced to either Investec
Other Activities
Asset Management(Mauritius) Ltd
Property Activities
Issuer under EMTN programme
Regulated by the South African
gLimited or Investec plc as there are no cross guarantees between the companies
Note: All shareholdings are 100% unless otherwise stated
Reserve Bank
12
Investec Bank Limited overview
Shareholding structure for Investec Limited – 31 Mar 2013Investec Bank Limited key facts
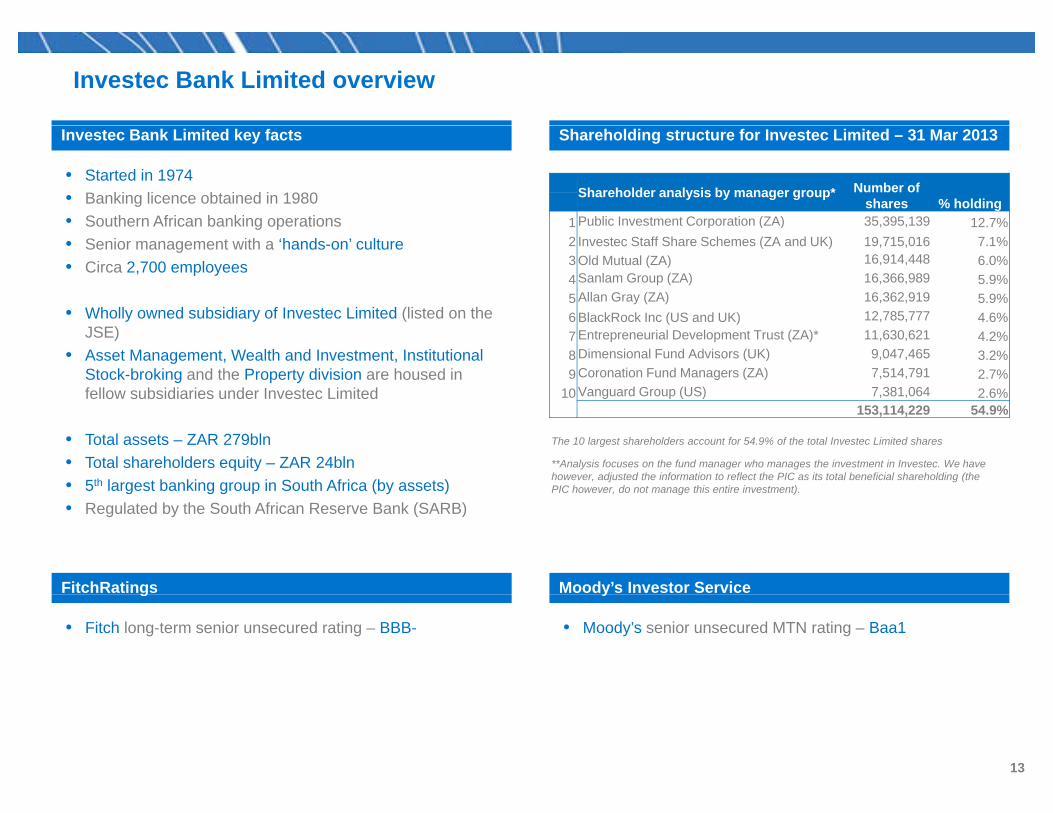
• Started in 1974• Banking licence obtained in 1980• Southern African banking operations
Shareholder analysis by manager group* Number of shares % holding
1 Public Investment Corporation (ZA) 35 395 139 12 7%• Southern African banking operations• Senior management with a ‘hands-on’ culture• Circa 2,700 employees
• Wholly owned subsidiary of Investec Limited (listed on the
1 Public Investment Corporation (ZA) 35,395,139 12.7%2 Investec Staff Share Schemes (ZA and UK) 19,715,016 7.1%3 Old Mutual (ZA) 16,914,448 6.0%4 Sanlam Group (ZA) 16,366,989 5.9%5 Allan Gray (ZA) 16,362,919 5.9%6 Bl kR k I (US d UK) 12 785 777 4 6%• Wholly owned subsidiary of Investec Limited (listed on the
JSE)• Asset Management, Wealth and Investment, Institutional
Stock-broking and the Property division are housed in fellow subsidiaries under Investec Limited
6 BlackRock Inc (US and UK) 12,785,777 4.6%7 Entrepreneurial Development Trust (ZA)* 11,630,621 4.2%8 Dimensional Fund Advisors (UK) 9,047,465 3.2%9 Coronation Fund Managers (ZA) 7,514,791 2.7%
10 Vanguard Group (US) 7,381,064 2.6%153 114 229 54 9%
**Analysis focuses on the fund manager who manages the investment in Investec. We have however, adjusted the information to reflect the PIC as its total beneficial shareholding (the PIC however, do not manage this entire investment).
The 10 largest shareholders account for 54.9% of the total Investec Limited shares• Total assets – ZAR 279bln• Total shareholders equity – ZAR 24bln• 5th largest banking group in South Africa (by assets)
153,114,229 54.9%
• Regulated by the South African Reserve Bank (SARB)
Moody’s Investor ServiceFitchRatings yg
• Fitch long-term senior unsecured rating – BBB- • Moody’s senior unsecured MTN rating – Baa1
13
Investec Bank Limited overview – a specialist bank
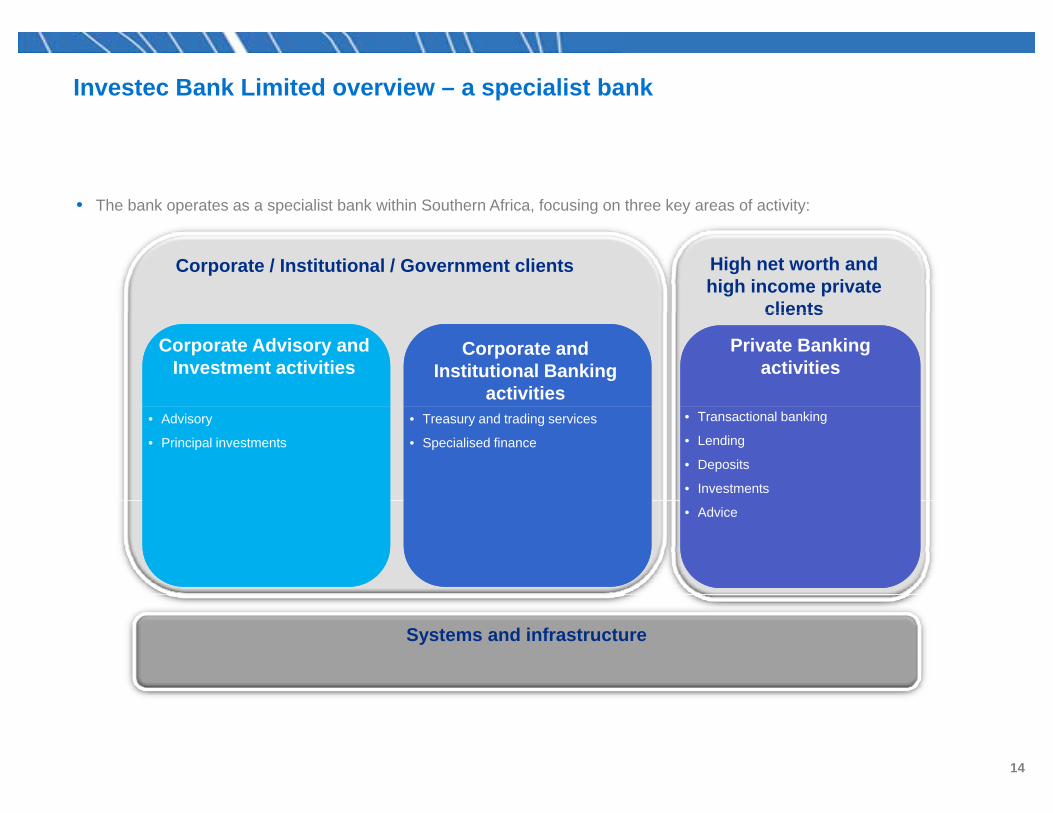
• The bank operates as a specialist bank within Southern Africa, focusing on three key areas of activity:
Corporate / Institutional / Government clients High net worth and high income private
clients
Private Banking activities
clients
Corporate Advisory and Investment activities
Corporate and Institutional Banking
activities• Transactional banking
• Lending
• Deposits
• Investments
• Advisory
• Principal investments
• Treasury and trading services
• Specialised finance
• Advice
Systems and infrastructure
14
Investec Bank Limited – strategic objectives
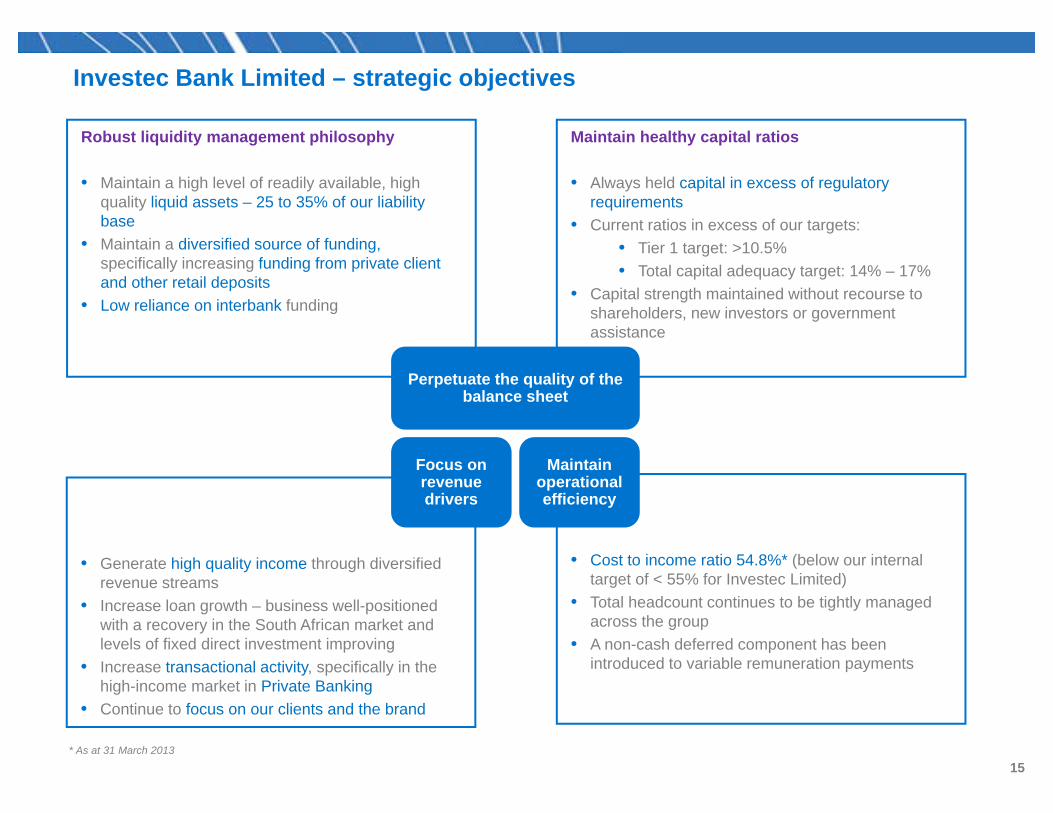
Robust liquidity management philosophy
• Maintain a high level of readily available, high quality liquid assets – 25 to 35% of our liability base
Maintain healthy capital ratios
• Always held capital in excess of regulatory requirementsC t ti i f t tbase
• Maintain a diversified source of funding, specifically increasing funding from private client and other retail deposits
• Low reliance on interbank funding
• Current ratios in excess of our targets:• Tier 1 target: >10.5%• Total capital adequacy target: 14% – 17%
• Capital strength maintained without recourse to shareholders new investors or governmentg shareholders, new investors or government assistance
Perpetuate the quality of the balance sheet
Focus on revenue drivers
Maintain operational efficiency
• Generate high quality income through diversified revenue streams
• Cost to income ratio 54.8%* (below our internal target of < 55% for Investec Limited)
drivers efficiency
• Increase loan growth – business well-positioned with a recovery in the South African market and levels of fixed direct investment improving
• Increase transactional activity, specifically in the high-income market in Private Banking
• Total headcount continues to be tightly managed across the group
• A non-cash deferred component has been introduced to variable remuneration payments
high income market in Private Banking• Continue to focus on our clients and the brand
* As at 31 March 2013
15

Contents
1. Introduction2. South Africa – Macroeconomic environment and banking sector overview3. Investec overview4. Investec financial overview
16

Investec Bank Limited – well diversified balance sheet
Composition of assets: total of ZAR267,701mln* Total assets and risk-weighted assets (RWA)
Basel Standardised Approach: RWA comprise 78% of total assets
73% 76%73% 76% 72%
78%80%90%
250 000
300,000
ZAR’mln2.1%
8.7%2.2%
3.4%6.3%
Cash and balances at central banksLoans and advances to banks
N i d b k 73%
20%30%40%50%60%70%
100,000
150,000
200,000
250,000 2.9%
12.6%
Non-sovereign and non-bank cash placementsReverse repos
South Africa sovereign debt securitiesBank debt securities
0%10%20%
-
50,000
2008 2009 2010 2011 2012 2013
Total assets (LHS)Total risk-weighted assets (LHS)RWA t f t t l t (RHS)
7.8%
2.3%51.6%
Other debt securities
Core loans and advances
Investment portfolio
Other assets
Customer deposits: total at 31 Mar 2013 of ZAR185,311mlnComposition of liabilities: total of ZAR255,765mln
RWA as a percentage of total assets (RHS)
ZAR’mln
Other assets
Deposits by banks
100 000
150,000
200,000 7.0%
7.1%
1.6%
1.1%4.9%
5.8%
Reverse repos
Customer accounts (deposits)
-
50,000
100,000
2007 2008 2009 2010 2011 2012 2013
Debt securities in issue
Liabilities arising on own originated securitised assets
Subordinated liabilities
* Excluding intergroup loans
2007 2008 2009 2010 2011 2012 2013
Net core loans and advances Customer accounts (deposits) 72.5% Other liabilities
17

Investec Bank Limited – strong capital position with low leverage
• Investec has been successful in maintaining a strong capital base– FY2013: total capital adequacy ratio of 16.2% and tier 1 ratio of 10.9%– Basel III: now reporting in terms of Basel III – has had minimal impact on our capital ratios
• Average total leverage ratio of c.12.4x over past 7 years
Shareholders’ equity and capital adequacy
Basel I
Leverage
Basel II Basel III
15.2
12.5 12.311.7 11 4
12.011 412 0
14.0
16.0
times
20.0%
25.0%
20,000
25,000 R’mln
11.4 11.4
7.7 7.5 7.9
6.86.1 6.0 5.9
6 0
8.0
10.0
12.0
10.0%
15.0%
10,000
15,000
,
2.0
4.0
6.0
0.0%
5.0%
-
5,000
2004 2005 2006 2007 2008 2009 2010 2011 2012 2013
Total shareholders' equity (LHS) Capital adequacy ratio (RHS)-2007 2008 2009 2010 2011 2012 2013
Total gearing/leverage ratio Core loans to equity ratio
Total shareholders equity (LHS) Capital adequacy ratio (RHS)
Tier 1 ratio (RHS)
18
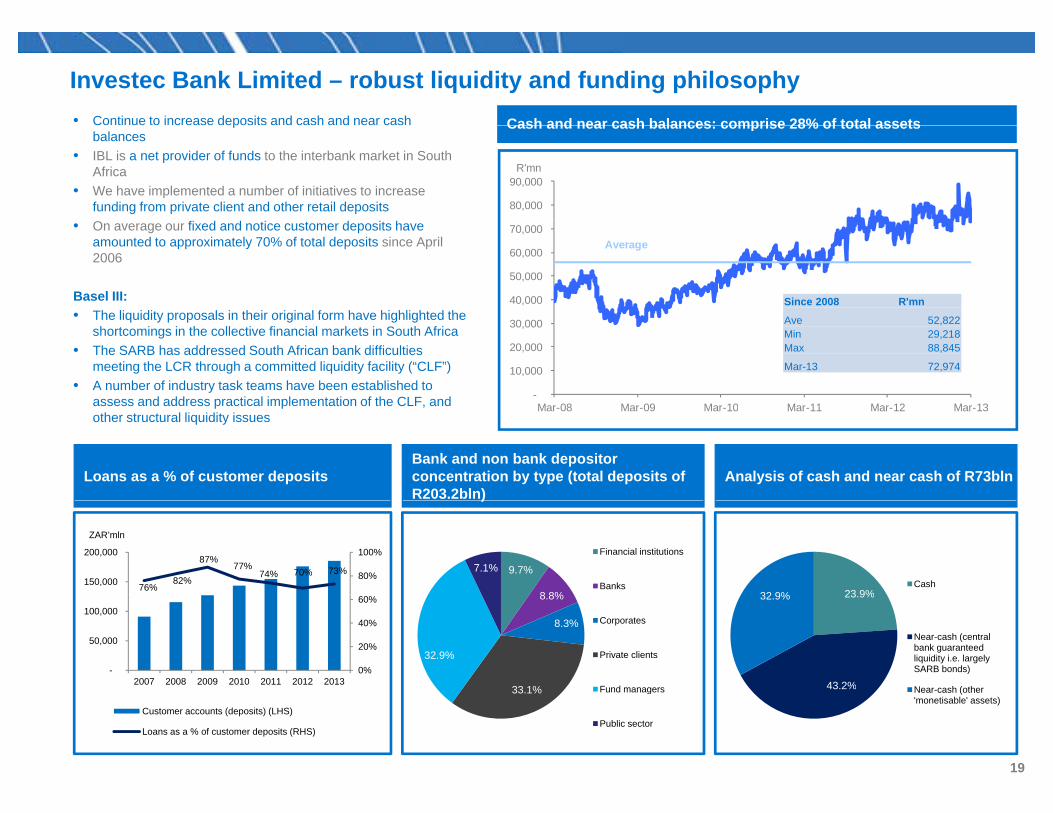
Investec Bank Limited – robust liquidity and funding philosophyCash and near cash balances: comprise 28% of total assets• Continue to increase deposits and cash and near cash
80,000
90,000 R'mn
Cash and near cash balances: comprise 28% of total assets pbalances
• IBL is a net provider of funds to the interbank market in South Africa
• We have implemented a number of initiatives to increase funding from private client and other retail deposits
40,000
50,000
60,000
70,000 Average
• On average our fixed and notice customer deposits have amounted to approximately 70% of total deposits since April 2006
Basel III:• The liquidity proposals in their original form have highlighted the
Since 2008 R'mn
-
10,000
20,000
30,000
Mar 08 Mar 09 Mar 10 Mar 11 Mar 12 Mar 13
• The liquidity proposals in their original form have highlighted the shortcomings in the collective financial markets in South Africa
• The SARB has addressed South African bank difficulties meeting the LCR through a committed liquidity facility (“CLF”)
• A number of industry task teams have been established to assess and address practical implementation of the CLF, and
Ave 52,822Min 29,218Max 88,845
Mar-13 72,974
Mar-08 Mar-09 Mar-10 Mar-11 Mar-12 Mar-13p p ,other structural liquidity issues
Bank and non bank depositor concentration by type (total deposits of R203.2bln)
Loans as a % of customer deposits Analysis of cash and near cash of R73bln)
9.7%
8 8%
7.1%Financial institutions
Banks76%82%
87%77%
74% 70% 73% 80%
100%
150,000
200,000
ZAR’mln
23 9%32 9%Cash
Min R’bn
8.8%
8.3%
33 1%
32.9%
Corporates
Private clients
Fund managers
0%
20%
40%
60%
-
50,000
100,000
2007 2008 2009 2010 2011 2012 2013
23.9%
43.2%
32.9%
Near-cash (central bank guaranteed liquidity i.e. largely SARB bonds)
Near cash (other33.1% Fund managers
Public sectorCustomer accounts (deposits) (LHS)
Loans as a % of customer deposits (RHS)
43.2% Near-cash (other 'monetisable' assets)
19
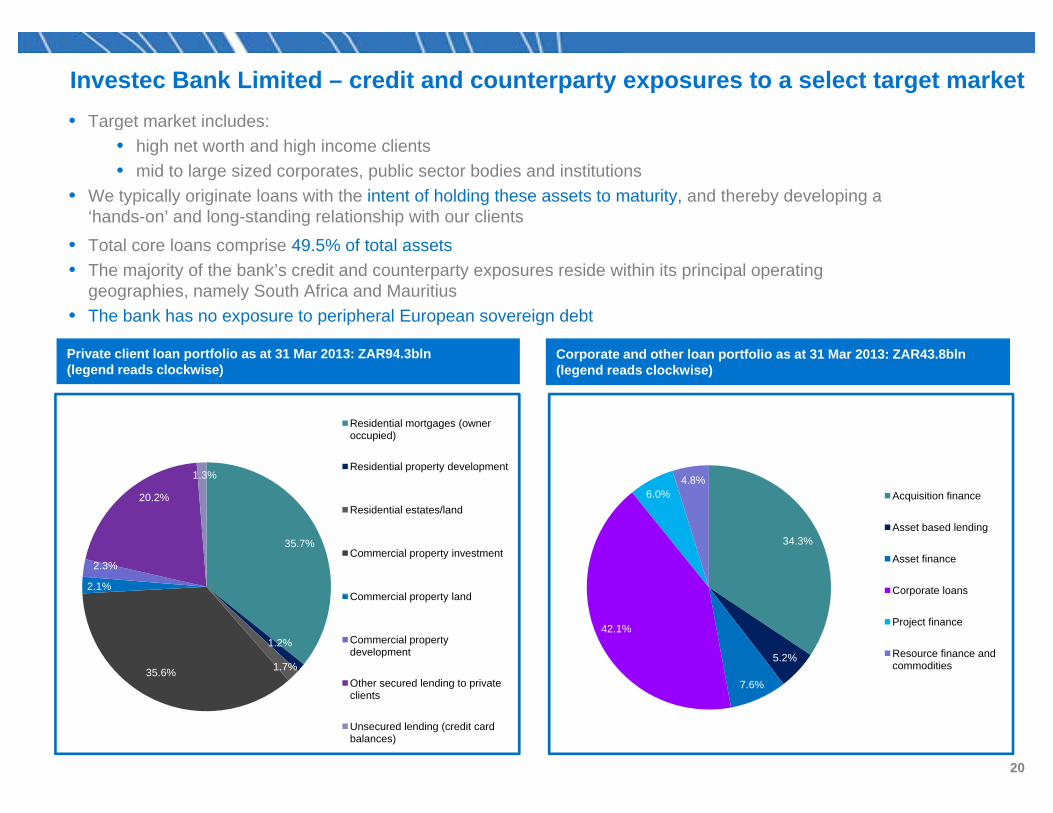
Investec Bank Limited – credit and counterparty exposures to a select target market • Target market includes:Target market includes:
• high net worth and high income clients• mid to large sized corporates, public sector bodies and institutions
• We typically originate loans with the intent of holding these assets to maturity, and thereby developing a ‘hands-on’ and long-standing relationship with our clientshands on and long standing relationship with our clients
• Total core loans comprise 49.5% of total assets• The majority of the bank’s credit and counterparty exposures reside within its principal operating
geographies, namely South Africa and Mauritius• The bank has no exposure to peripheral European sovereign debt• The bank has no exposure to peripheral European sovereign debt
Private client loan portfolio as at 31 Mar 2013: ZAR94.3bln (legend reads clockwise)
Corporate and other loan portfolio as at 31 Mar 2013: ZAR43.8bln(legend reads clockwise)
6.0%4.8%
Acquisition finance20.2%
1.3%
Residential mortgages (owner occupied)
Residential property development
34.3%
q
Asset based lending
Asset finance
Corporate loans
35.7%
2.1%
2.3%
20.2%Residential estates/land
Commercial property investment
C i l t l d
5.2%
7.6%
42.1%
p
Project finance
Resource finance and commodities
1.2%
1.7%35.6%
Commercial property land
Commercial property development
Other secured lending to private 7.6%g pclients
Unsecured lending (credit card balances)
20
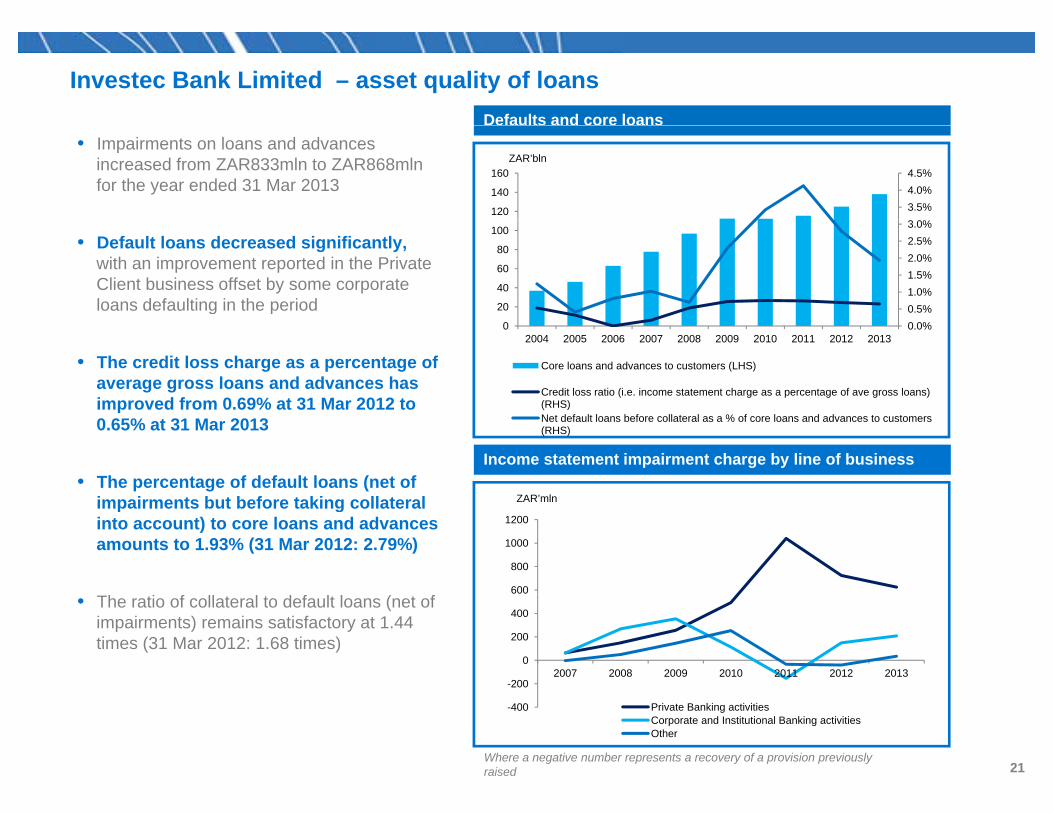
Defaults and core loans
Investec Bank Limited – asset quality of loans
• Impairments on loans and advances increased from ZAR833mln to ZAR868mln for the year ended 31 Mar 2013
3.5%4.0%4.5%
120
140
160ZAR’bln
• Default loans decreased significantly, with an improvement reported in the Private Client business offset by some corporate loans defaulting in the period 0.5%
1.0%1.5%2.0%2.5%3.0%
20
40
60
80
100
g p
• The credit loss charge as a percentage of average gross loans and advances has improved from 0 69% at 31 Mar 2012 to
0.0%02004 2005 2006 2007 2008 2009 2010 2011 2012 2013
Core loans and advances to customers (LHS)
Credit loss ratio (i.e. income statement charge as a percentage of ave gross loans) (RHS)improved from 0.69% at 31 Mar 2012 to
0.65% at 31 Mar 2013
• The percentage of default loans (net of impairments but before taking collateral
Income statement impairment charge by line of business
(RHS)Net default loans before collateral as a % of core loans and advances to customers (RHS)
ZAR’mlnimpairments but before taking collateral into account) to core loans and advances amounts to 1.93% (31 Mar 2012: 2.79%)
600
800
1000
1200
ZAR mln
• The ratio of collateral to default loans (net of impairments) remains satisfactory at 1.44 times (31 Mar 2012: 1.68 times)
-200
0
200
400
2007 2008 2009 2010 2011 2012 2013
Where a negative number represents a recovery of a provision previously raised
-400 Private Banking activitiesCorporate and Institutional Banking activitiesOther
21
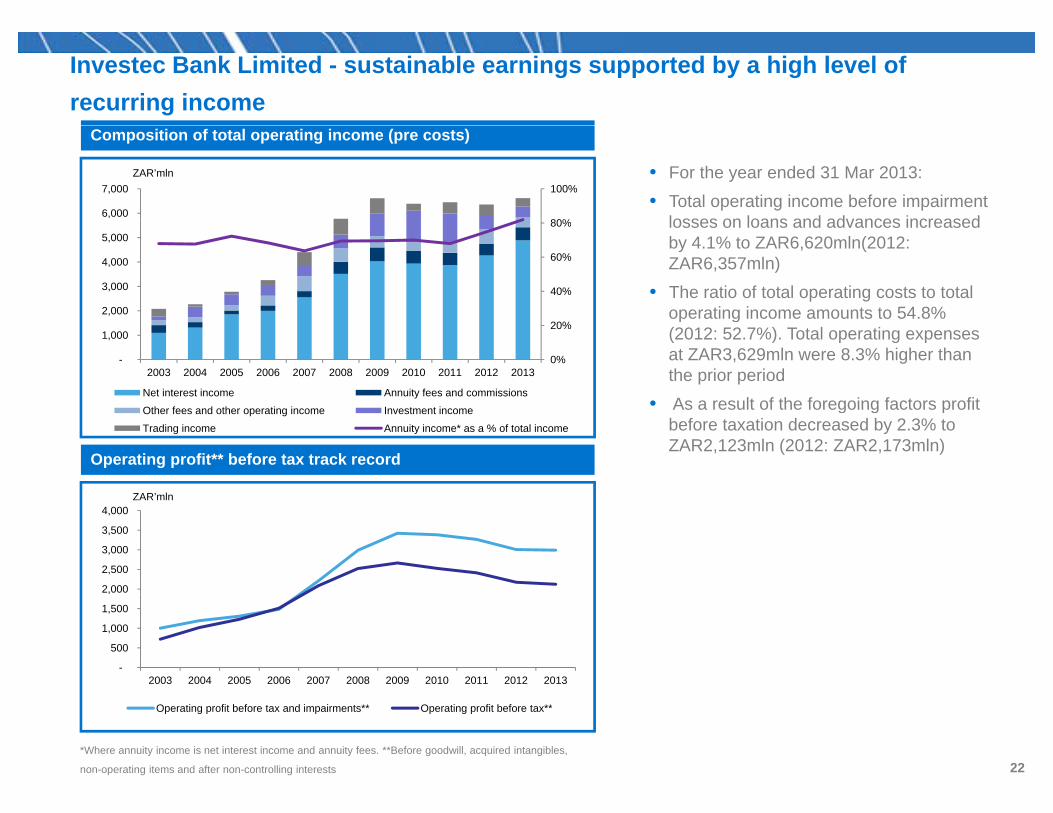
Investec Bank Limited - sustainable earnings supported by a high level ofrecurring income
Composition of total operating income (pre costs)
80%
100%
6,000
7,000 ZAR’mln • For the year ended 31 Mar 2013:
• Total operating income before impairment losses on loans and advances increased
40%
60%
80%
2 000
3,000
4,000
5,000 losses on loans and advances increased by 4.1% to ZAR6,620mln(2012: ZAR6,357mln)
• The ratio of total operating costs to total operating income amounts to 54 8%
0%
20%
-
1,000
2,000
2003 2004 2005 2006 2007 2008 2009 2010 2011 2012 2013
Net interest income Annuity fees and commissions
Oth f d th ti i I t t i
operating income amounts to 54.8% (2012: 52.7%). Total operating expenses at ZAR3,629mln were 8.3% higher than the prior period
• As a result of the foregoing factors profit
Operating profit** before tax track record
Other fees and other operating income Investment income
Trading income Annuity income* as a % of total income
ZAR’mln
As a result of the foregoing factors profit before taxation decreased by 2.3% to ZAR2,123mln (2012: ZAR2,173mln)
2,000
2,500
3,000
3,500
4,000
-
500
1,000
1,500
2003 2004 2005 2006 2007 2008 2009 2010 2011 2012 2013
Operating profit before tax and impairments** Operating profit before tax**
*Where annuity income is net interest income and annuity fees. **Before goodwill, acquired intangibles,
non-operating items and after non-controlling interests 22
AppendicesAppendices
23

IBL: salient financial features
31 March 2013 31 March 2012%
changeTotal operating income before impairment losses on loans and advances (ZAR'mln) 6,620 6,357 4.1% Operating costs (ZAR'mln) 3,629 3,351 8.3% Operating profit before taxation (ZAR'mln) 2,123 2,173 (2.3%)Headline earnings attributable to ordinary shareholders (ZAR'mln) 1,741 1,812 (3.9%)Cost to income ratio 54.8% 52.7%Total capital resources (including subordinated liabilities) (ZAR'mln) 36,005 29,642 21.5%Total capital resources (including subordinated liabilities) (ZAR mln) 36,005 29,642 21.5% Total equity (ZAR'mln) 23,509 20,933 12.3% Total assets (ZAR'mln) 279,274 255,952 9.1% Net core loans and advances (ZAR'mln) 138,105 124,917 10.6% Customer accounts (deposits) (ZAR'mln) 185,311 176,094 5.2% Cash and near cash balances (ZAR'mln) 72,974 69,077 5.6% Capital adequacy ratio 16.2% 16.1%Tier 1 ratio 10.9% 11.4%Defaults (net of impairments) as a % of net core loans and advances to customers 1.93% 2.79%Net defaults as a % of net core loans and advancesNet defaults as a % of net core loans and advances - -Credit loss ratio (i.e. income statement impairment charge as a % of average core loans and advances) 0.65% 0.69%Total gearing/leverage ratio (i.e. total assets excluding intergroup loans to equity) 11.4x 12.0x Loans to customers as a % of customer deposits 73.2% 69.6%
24
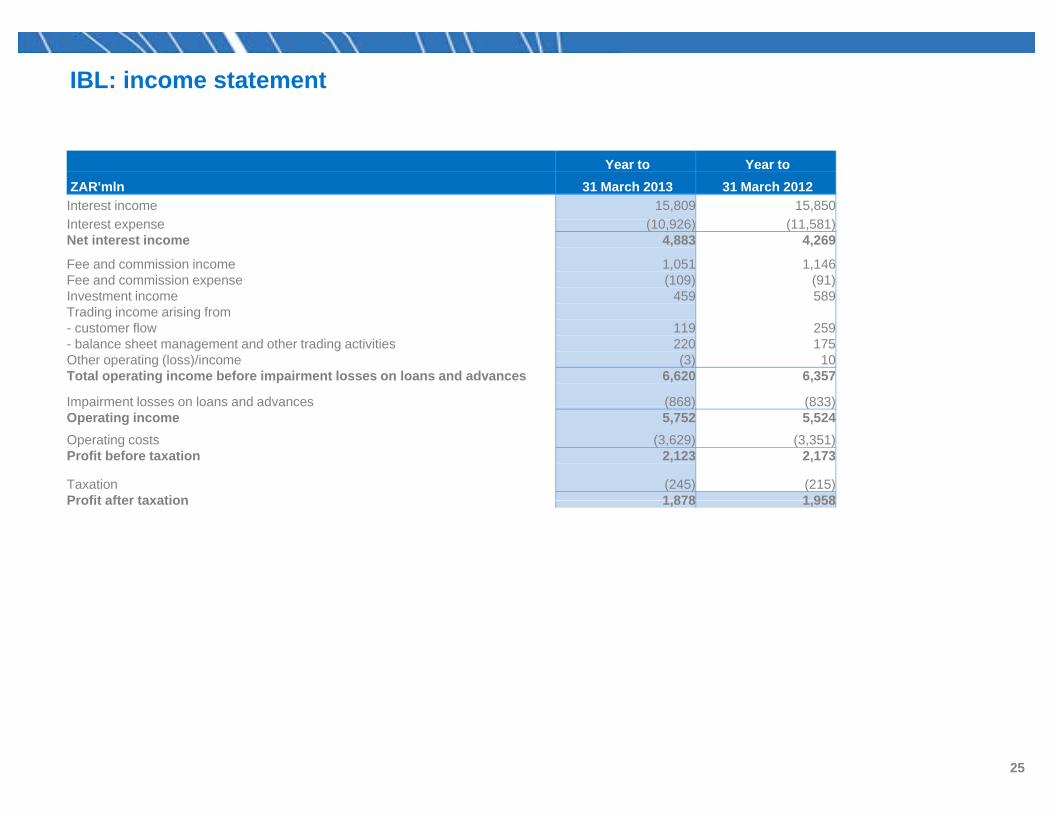
IBL: income statement
Year to Year to ZAR'mln 31 March 2013 31 March 2012 Interest income 15,809 15,850 I (10 926) (11 581)Interest expense (10,926) (11,581)Net interest income 4,883 4,269
Fee and commission income 1,051 1,146 Fee and commission expense (109) (91)Investment income 459 589 Trading income arising fromTrading income arising from- customer flow 119 259 - balance sheet management and other trading activities 220 175 Other operating (loss)/income (3) 10 Total operating income before impairment losses on loans and advances 6,620 6,357
Impairment losses on loans and advances (868) (833)p ( ) ( )Operating income 5,752 5,524 Operating costs (3,629) (3,351)Profit before taxation 2,123 2,173
Taxation (245) (215)Profit after taxation 1 878 1 958Profit after taxation 1,878 1,958
25

IBL: balance sheet
ZAR'mln 31 March 2013 31 March 2012 AssetsCash and balances at central banks 5,677 9,303 Loans and advances to banks 23,278 19,191 Non-sovereign and non-bank cash placements 5,875 7,885 Reverse repurchase agreements and cash collateral on securities borrowed 7,668 5,098 Sovereign debt securities 33,730 30,222 Bank debt securities 20,969 27,695 Other debt securities 6,258 6,284 Derivative financial instruments 12,161 10,595 Securities arising from trading activities 1,357 1,628 Investment portfolio 9,102 6,036 Loans and advances to customers 135,726 122,615 Own originated loans and advances to customers securitised 2,379 2,302 Other loans and advances 672 669Other loans and advances 672 669 Other securitised assets 1,168 1,057 Interest in associated undertakings 45 38 Deferred taxation assets 55 46 Other assets 1,166 1,074 Property and equipment 224 308 Investment properties 1 5 Intangible assets 90 96 gLoans to group companies 11,673 3,805
279,274 255,952
LiabilitiesDeposits by banks 17,861 13,933 Derivative financial instruments 9,232 8,570 Other trading liabilities 1,063 172 Repurchase agreements and cash collateral on securities lent 18,188 18,174 Customer accounts (deposits) 185,311 176,094 Debt securities in issue 4,091 1,738 Liabilities arising on securitisation of own originated loans and advances 2,933 2,933 Liabilities arising on securitisation of other assets 588 492 Current taxation liabilities 1,142 1,113 Deferred taxation liabilities 61 9 Other liabilities 2 799 3 082Other liabilities 2,799 3,082
243,269 226,310 Subordinated liabilities 12,496 8,709
255,765 235,019
EquityOrdinary share capital 32 29 Share premium 14,885 13,527
26
p , ,Other reserves 175 (119)Retained income 8,417 7,496 Total equity 23,509 20,933
Total liabilities and equity 279,274 255,952
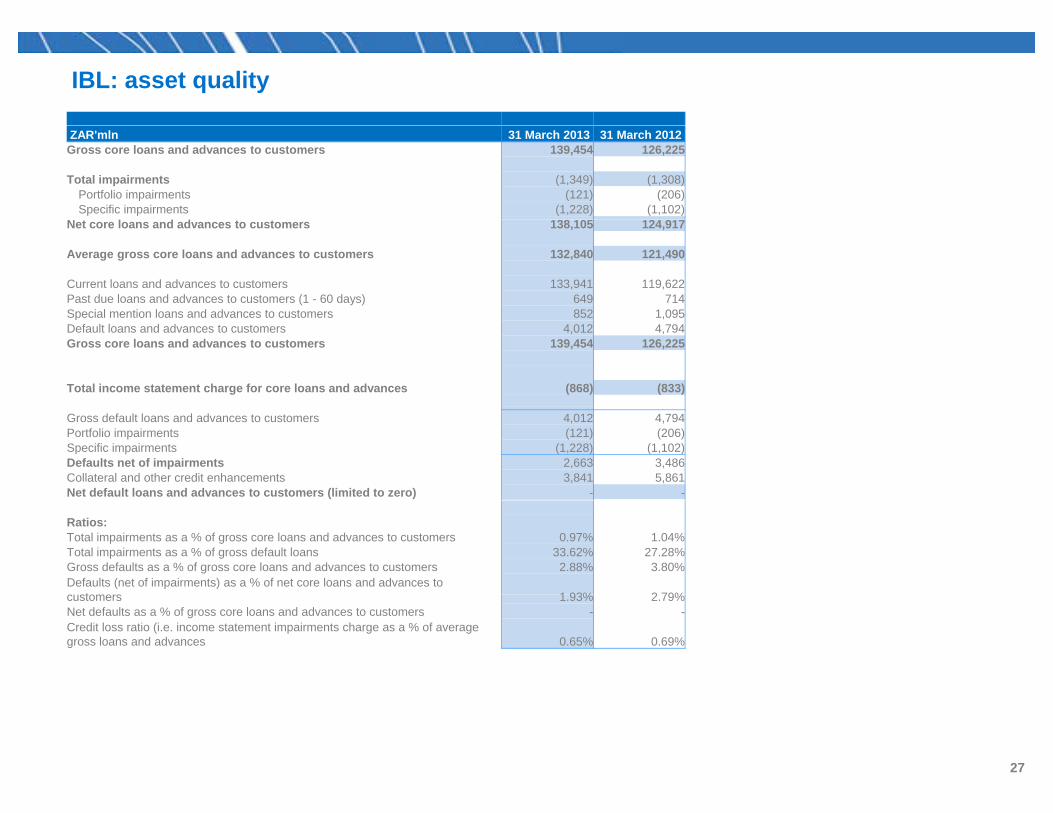
IBL: asset quality
ZAR'mln 31 March 2013 31 March 2012 Gross core loans and advances to customers 139,454 126,225
Total impairments (1,349) (1,308)Portfolio impairments (121) (206)Specific impairments (1,228) (1,102)
Net core loans and advances to customers 138,105 124,917
Average gross core loans and advances to customers 132,840 121,490
Current loans and advances to customers 133,941 119,622 Past due loans and advances to customers (1 - 60 days) 649 714 Special mention loans and advances to customers 852 1 095Special mention loans and advances to customers 852 1,095 Default loans and advances to customers 4,012 4,794 Gross core loans and advances to customers 139,454 126,225
Total income statement charge for core loans and advances (868) (833)
Gross default loans and advances to customers 4,012 4,794 Portfolio impairments (121) (206)Specific impairments (1,228) (1,102)Defaults net of impairments 2,663 3,486 Collateral and other credit enhancements 3,841 5,861 Net default loans and advances to customers (limited to zero) - -
Ratios:Total impairments as a % of gross core loans and advances to customers 0.97% 1.04%Total impairments as a % of gross default loans 33.62% 27.28%Gross defaults as a % of gross core loans and advances to customers 2.88% 3.80%Defaults (net of impairments) as a % of net core loans and advances to
t 1 93% 2 79%customers 1.93% 2.79%Net defaults as a % of gross core loans and advances to customers - -Credit loss ratio (i.e. income statement impairments charge as a % of average gross loans and advances 0.65% 0.69%
27
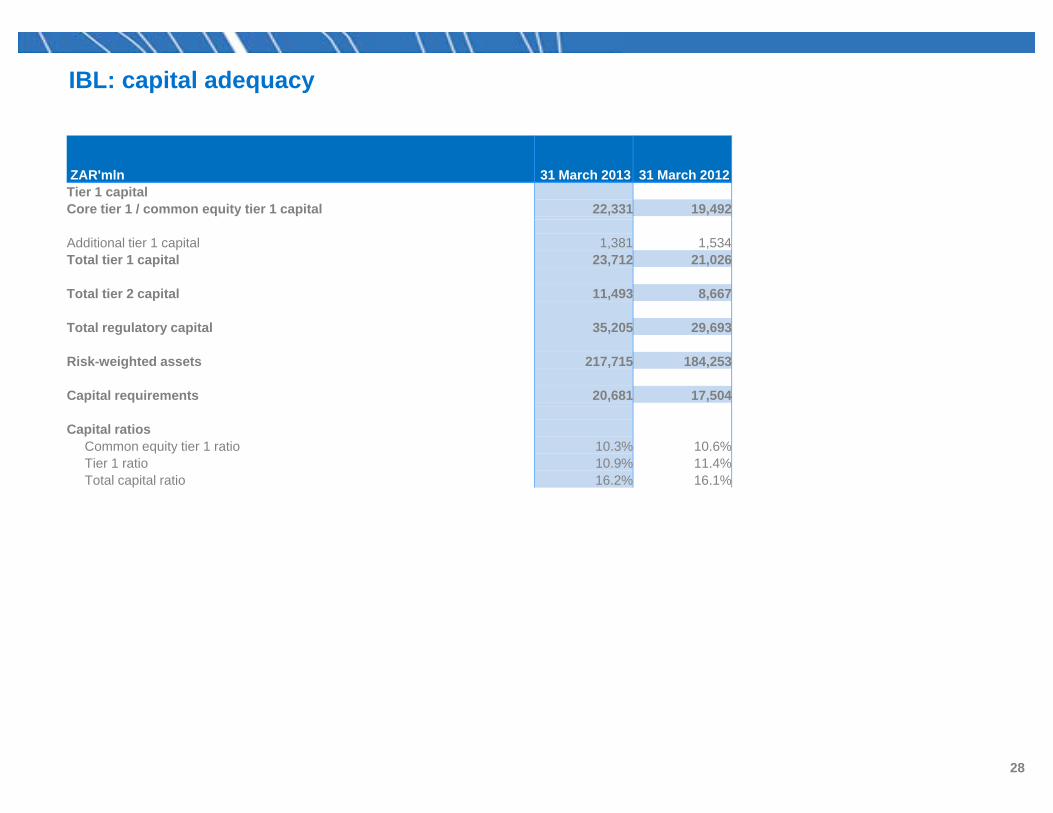
IBL: capital adequacy
ZAR'mln 31 March 2013 31 March 2012 Tier 1 capitalCore tier 1 / common equity tier 1 capital 22,331 19,492
Additional tier 1 capital 1,381 1,534Total tier 1 capital 23,712 21,026
Total tier 2 capital 11,493 8,667
Total regulatory capital 35,205 29,693
Risk-weighted assets 217,715 184,253
Capital requirements 20,681 17,504
Capital ratiosCommon equity tier 1 ratio 10.3% 10.6%Tier 1 ratio 10.9% 11.4%Total capital ratio 16.2% 16.1%
28
Disclaimer
These materials may not be copied, published, distributed or transmitted and may not be reproduced in any manner whatsoever. These materials do not constitute or form part of any offer to sell or any solicitation of an offer to buy any securities in any jurisdiction. Investec Bank Limited (the “Company”) does not warrant or assume any legal liability or responsibility for the accuracy, completeness or usefulness of the materials disclosed herein. Under no circumstances will the Company be liable for any loss or damage, including (without limitation) direct, indirect, incidental, special or consequential damages caused by the use of the materials contained herein.
This presentation may contain forward looking statements, including statements about the Company beliefs and expectations. These statements are based on the Company's current plans, estimates and projections, as well as its expectations of external conditions and events. Forward-looking statements involve inherent risks, uncertainties and assumptions and speak only as of theestimates and projections, as well as its expectations of external conditions and events. Forward looking statements involve inherent risks, uncertainties and assumptions and speak only as of the date they are made. As a result of these risks, uncertainties and assumptions, undue reliance should not be placed on these forward-looking statements and on historical trends. A number of important factors, including factors outside the control of the Company, could cause actual results or outcomes to differ materially from those expressed in any forward-looking statements. The Company is not obliged to, and does not intend to, update or revise any forward-looking statements made in this presentation whether as a result of new information, future events or otherwise.
By attending this presentation or by reading the presentation slides you agree to be bound as follows. This communication has been prepared by and is the sole responsibility of the Company, which is the subject of this communication. This presentation has not been reviewed, approved or endorsed by any adviser retained by the Company. This communication is provided for information purposes only. The information and opinions herein are believed to be reliable and have been obtained from sources believed to be reliable, but such information and opinions have not been verified and no representation or warranty, express or implied, is made with respect to the fairness, correctness, accuracy, reasonableness or completeness of the information and opinions and no reliance should be placed on it. The Company is under no obligation to update, modify or amend this communication or to otherwise notify the recipient if any information, opinion, projection, forecast or estimate set forth herein, changes or subsequently becomes inaccurate.
This presentation may be amended and supplemented and may not be relied upon for the purpose of entering into any transaction. This presentation and its contents are confidential and proprietary to the Company, and no part of it may be reproduced, redistributed, passed on, or the contents otherwise divulged, directly or indirectly, to any other person (excluding the relevant person’s professional advisers) or published in whole or in part for any purpose without the prior written consent of the Company. If this presentation has been received in error it must be returned immediately to the Companyto the Company.
This presentation is not directed to, or intended for distribution to or use by, any person or entity that is a citizen or resident or located in any locality, state, country or other jurisdiction where such distribution, publication, availability or use would be contrary to law or regulation or which would require any registration or licensing within such jurisdiction. Neither this presentation nor any copy hereof may be sent, or taken or distributed in the United States, Australia, Canada, Romania, or to any "U.S. person" (as such term is defined in Regulation S ("Regulation S") under the U.S. Securities Act of 1933, as amended (the "Securities Act").
The recipient is strongly advised to seek their own independent advice in relation to any investment, financial, legal, tax, accounting or regulatory issues discussed herein. Analyses and opinionsThe recipient is strongly advised to seek their own independent advice in relation to any investment, financial, legal, tax, accounting or regulatory issues discussed herein. Analyses and opinions contained herein may be based on assumptions that if altered can change the analyses or opinions expressed. Nothing contained herein shall constitute any representation or warranty as to future performance of any financial instrument, credit, currency, rate or other market or economic measure. Furthermore, past performance is not necessarily indicative of future results. None of the Company, its advisers, representatives, connected persons or any other person accepts any liability or responsibility whatsoever for any loss, whether direct or indirect, incidental or consequential, arising from the use of this presentation or its contents. The information contained herein is subject to change without notice and such information may change materially.
29
![Finale 2000a - [Gershwin Sax Med 11 x 17.MUS] · 2016. 4. 23. · B?? bbb bbb bbb bb b b bbb b b bb bb b b bbb bbb bbb bbb bbb bbb bbb bbb bbb bbb bbb bbb bbb 1 2 3 1 2 Eng. Hrn](https://img.pdfslide.net/doc/110x75/60fc438ee202e771cc70576b/finale-2000a-gershwin-sax-med-11-x-17mus-2016-4-23-b-bbb-bbb-bbb-bb.jpg)