Embed Size (px)
Citation preview
Investec Bank Limited
The information in this presentation relates to the financial year ended 31 March
2021, unless otherwise indicated.
Page 2
Contents
Investec group overview 3
Investec Bank Limited (IBL) overview 14
IBL operating fundamentals 18
IBL peer analysis 31
IBL Appendices 35
1
2
3
4
Page
5
An overview of the Investec
group
Commentary on the group’s financial performance represents the continuing operations (excluding the consolidated results
for Ninety One, formerly Investec Asset Management, for the period 1 April 2019 to 13 March 2020; including the equity
accounted earnings from 13 March 2020 (date of demerger)).
Page 4*Including temporary employees and contractors
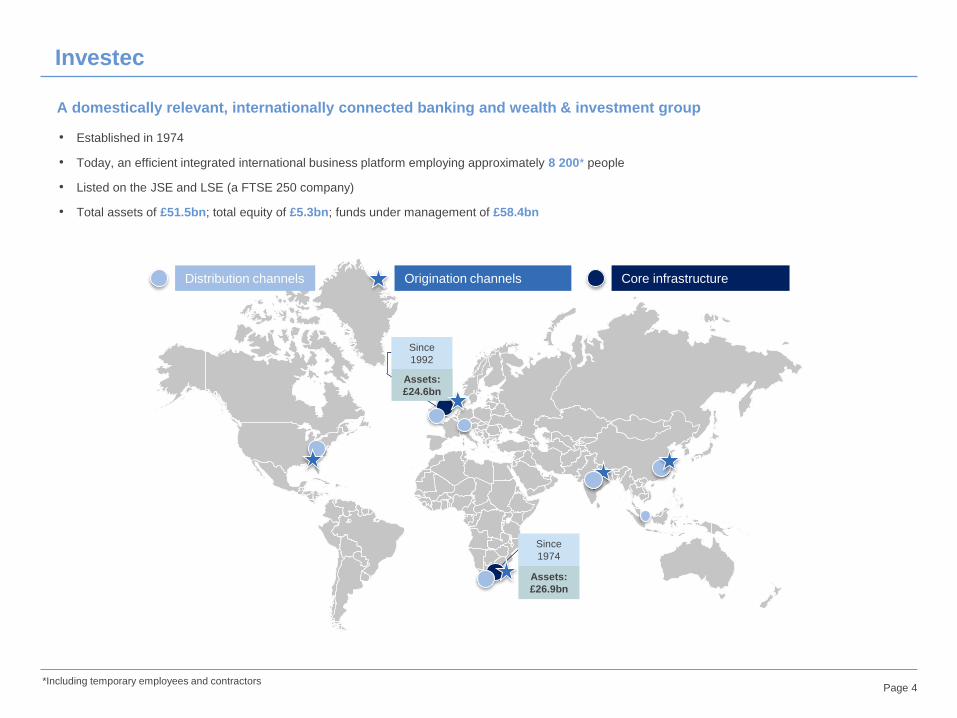
Investec
• Established in 1974
• Today, an efficient integrated international business platform employing approximately 8 200* people
• Listed on the JSE and LSE (a FTSE 250 company)
• Total assets of £51.5bn; total equity of £5.3bn; funds under management of £58.4bn
A domestically relevant, internationally connected banking and wealth & investment group
Assets:
£24.6bn
Assets:
£26.9bn
Core infrastructureDistribution channels Origination channels
Since
1992
Since
1974
Page 5
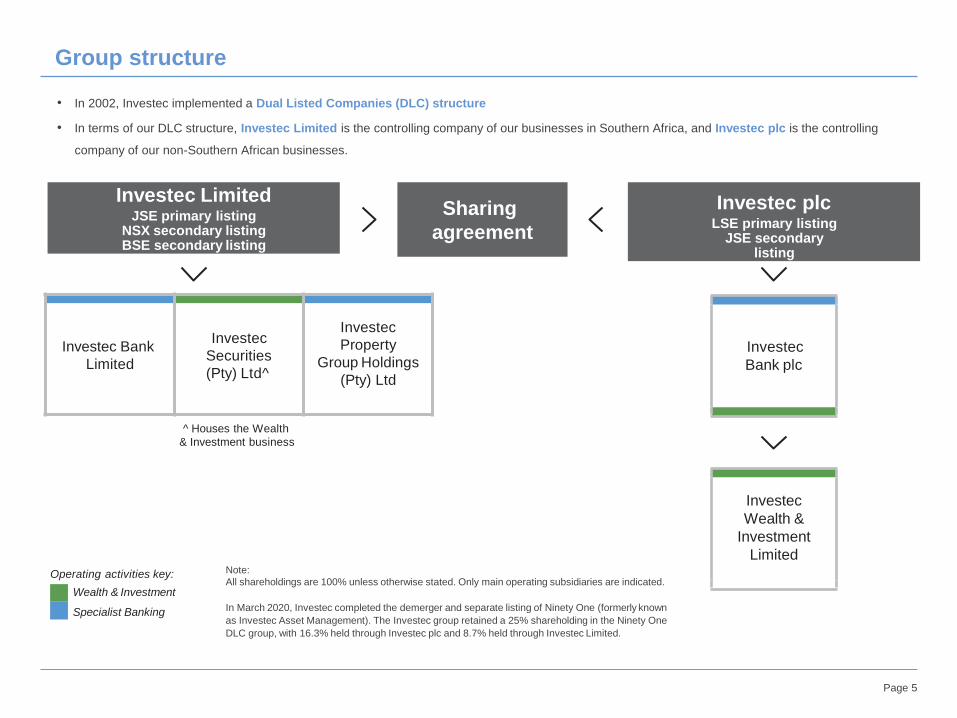
Group structure
Operating activities key:
Wealth & Investment
Specialist Banking
Note:
All shareholdings are 100% unless otherwise stated. Only main operating subsidiaries are indicated.
In March 2020, Investec completed the demerger and separate listing of Ninety One (formerly known
as Investec Asset Management). The Investec group retained a 25% shareholding in the Ninety One
DLC group, with 16.3% held through Investec plc and 8.7% held through Investec Limited.
Investec LimitedJSE primary listing
NSX secondary listing BSE secondary listing
Sharing
agreement
Investec plcLSE primary listing
JSE secondarylisting
Investec Bank
Limited
Investec
Securities
(Pty) Ltd^
Investec
Property
Group Holdings
(Pty) Ltd
Investec
Bank plc
Investec
Wealth &
Investment
Limited
^ Houses the Wealth
& Investment business
• In 2002, Investec implemented a Dual Listed Companies (DLC) structure
• In terms of our DLC structure, Investec Limited is the controlling company of our businesses in Southern Africa, and Investec plc is the controlling
company of our non-Southern African businesses.
Page 6
0%
10%
20%
30%
40%
50%
60%
70%
80%
90%
100%
Mar-17 Mar-18 Mar-19 Mar-20 Mar-21
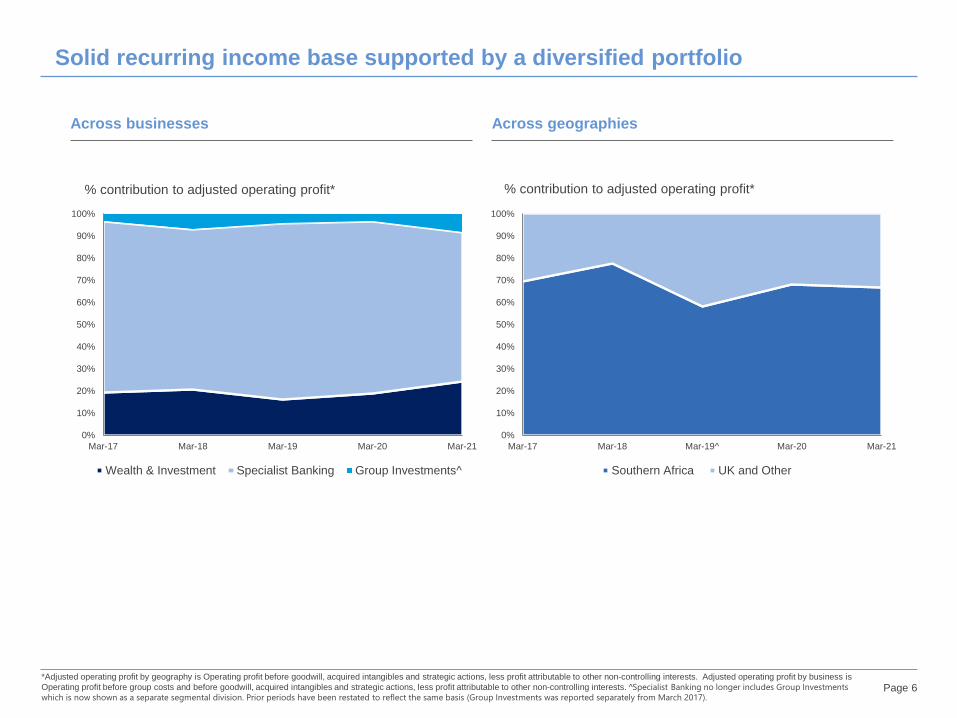
% contribution to adjusted operating profit*
Wealth & Investment Specialist Banking Group Investments^
0%
10%
20%
30%
40%
50%
60%
70%
80%
90%
100%
Mar-17 Mar-18 Mar-19^ Mar-20 Mar-21
% contribution to adjusted operating profit*
Southern Africa UK and Other
Across businesses Across geographies
*Adjusted operating profit by geography is Operating profit before goodwill, acquired intangibles and strategic actions, less profit attributable to other non-controlling interests. Adjusted operating profit by business is
Operating profit before group costs and before goodwill, acquired intangibles and strategic actions, less profit attributable to other non-controlling interests. ^Specialist Banking no longer includes Group Investments
which is now shown as a separate segmental division. Prior periods have been restated to reflect the same basis (Group Investments was reported separately from March 2017).
Solid recurring income base supported by a diversified portfolio
Page 7
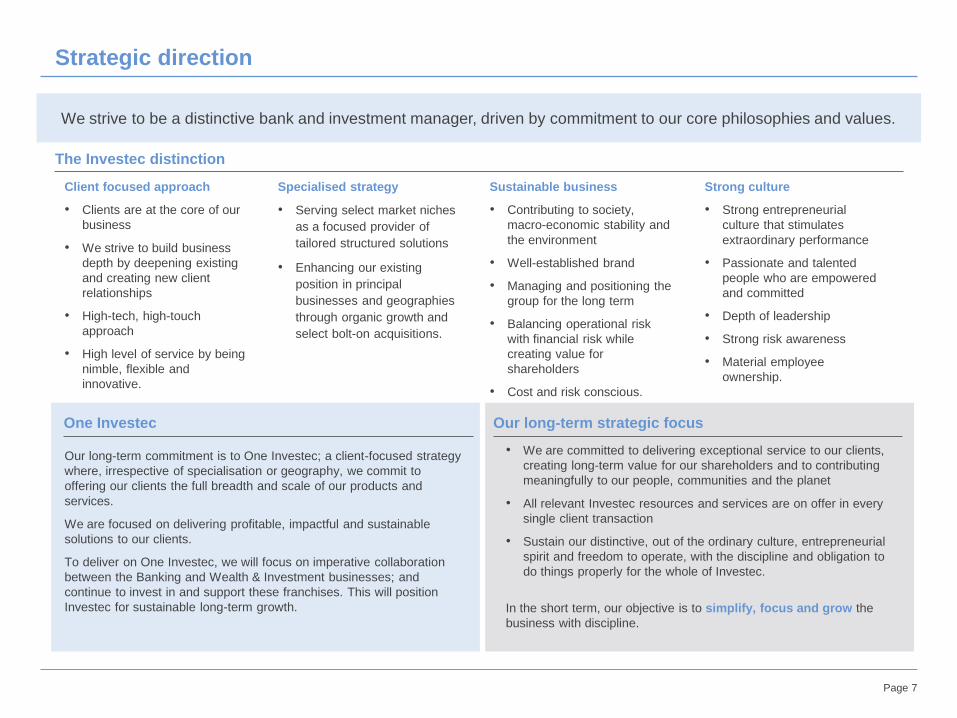
Client focused approach
• Clients are at the core of our
business
• We strive to build business
depth by deepening existing
and creating new client
relationships
• High-tech, high-touch
approach
• High level of service by being
nimble, flexible and
innovative.
Specialised strategy
• Serving select market niches
as a focused provider of
tailored structured solutions
• Enhancing our existing
position in principal
businesses and geographies
through organic growth and
select bolt-on acquisitions.
Sustainable business
• Contributing to society,
macro-economic stability and
the environment
• Well-established brand
• Managing and positioning the
group for the long term
• Balancing operational risk
with financial risk while
creating value for
shareholders
• Cost and risk conscious.
Strong culture
• Strong entrepreneurial
culture that stimulates
extraordinary performance
• Passionate and talented
people who are empowered
and committed
• Depth of leadership
• Strong risk awareness
• Material employee
ownership.
Strategic direction
We strive to be a distinctive bank and investment manager, driven by commitment to our core philosophies and values.
The Investec distinction
• We are committed to delivering exceptional service to our clients,
creating long-term value for our shareholders and to contributing
meaningfully to our people, communities and the planet
• All relevant Investec resources and services are on offer in every
single client transaction
• Sustain our distinctive, out of the ordinary culture, entrepreneurial
spirit and freedom to operate, with the discipline and obligation to
do things properly for the whole of Investec.
In the short term, our objective is to simplify, focus and grow the
business with discipline.
One Investec
Our long-term commitment is to One Investec; a client-focused strategy
where, irrespective of specialisation or geography, we commit to
offering our clients the full breadth and scale of our products and
services.
We are focused on delivering profitable, impactful and sustainable
solutions to our clients.
To deliver on One Investec, we will focus on imperative collaboration
between the Banking and Wealth & Investment businesses; and
continue to invest in and support these franchises. This will position
Investec for sustainable long-term growth.
Our long-term strategic focus
Page 8
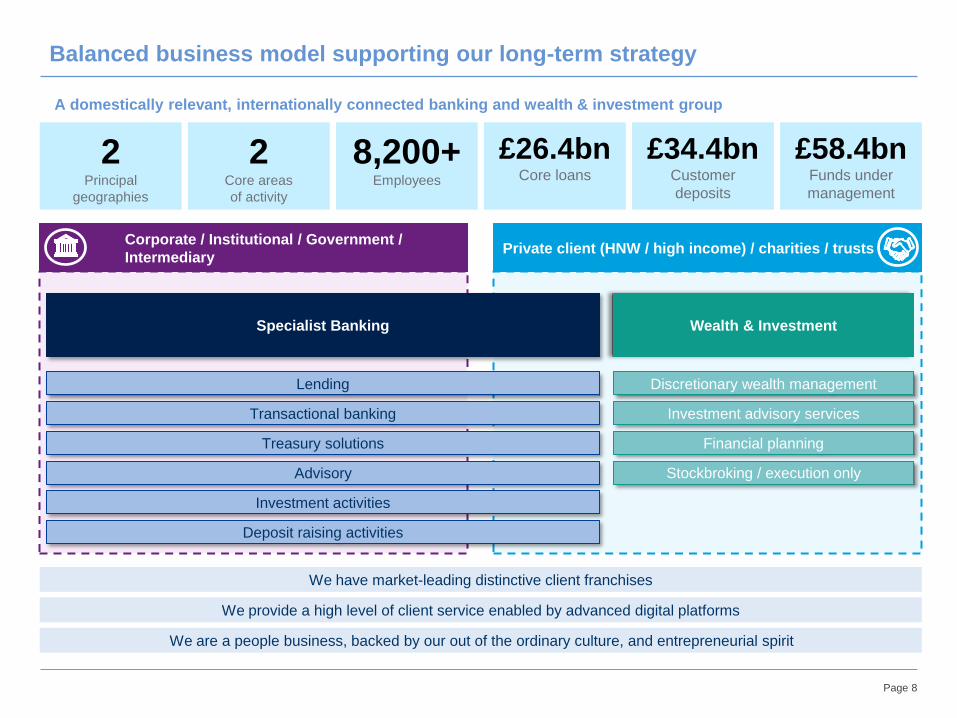
A domestically relevant, internationally connected banking and wealth & investment group
Balanced business model supporting our long-term strategy
Specialist Banking Wealth & Investment
Corporate / Institutional / Government /
IntermediaryPrivate client (HNW / high income) / charities / trusts
Lending
Transactional banking
Advisory
Treasury solutions
Investment activities
Deposit raising activities
Discretionary wealth management
Investment advisory services
Financial planning
Stockbroking / execution only
£26.4bnCore loans
8,200+Employees
2Core areas
of activity
2Principal
geographies
£58.4bnFunds under
management
£34.4bnCustomer
deposits
We have market-leading distinctive client franchises
We provide a high level of client service enabled by advanced digital platforms
We are a people business, backed by our out of the ordinary culture, and entrepreneurial spirit
Page 9
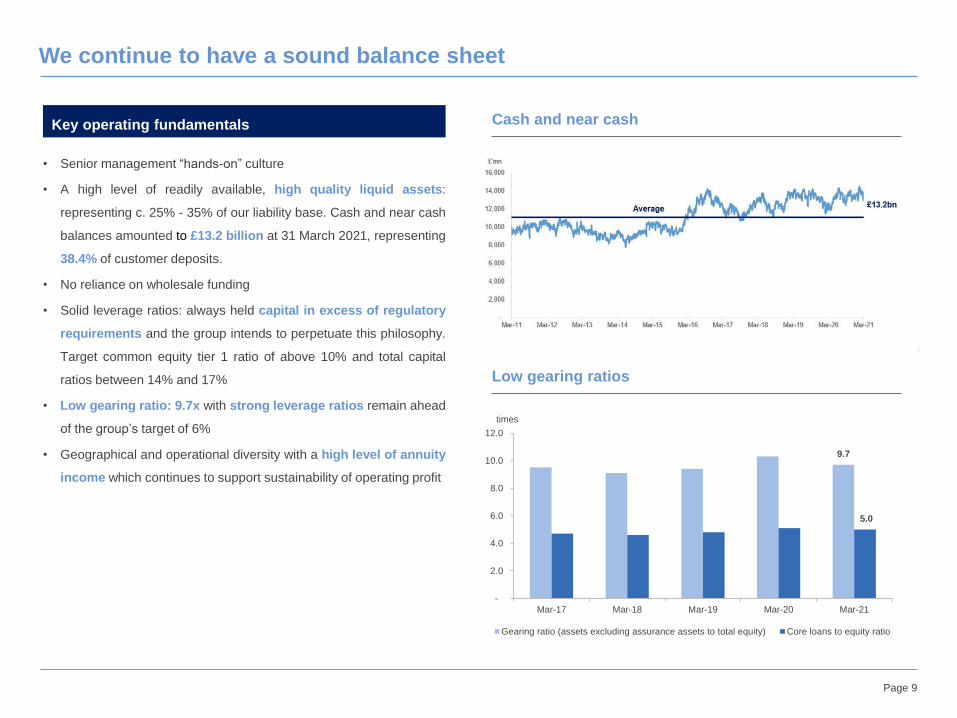
We continue to have a sound balance sheet
Cash and near cash
Low gearing ratios
• Senior management “hands-on” culture
• A high level of readily available, high quality liquid assets:
representing c. 25% - 35% of our liability base. Cash and near cash
balances amounted to £13.2 billion at 31 March 2021, representing
38.4% of customer deposits.
• No reliance on wholesale funding
• Solid leverage ratios: always held capital in excess of regulatory
requirements and the group intends to perpetuate this philosophy.
Target common equity tier 1 ratio of above 10% and total capital
ratios between 14% and 17%
• Low gearing ratio: 9.7x with strong leverage ratios remain ahead
of the group’s target of 6%
• Geographical and operational diversity with a high level of annuity
income which continues to support sustainability of operating profit
Key operating fundamentals
9.7
5.0
-
2.0
4.0
6.0
8.0
10.0
12.0
Mar-17 Mar-18 Mar-19 Mar-20 Mar-21
times
Gearing ratio (assets excluding assurance assets to total equity) Core loans to equity ratio
Page 10
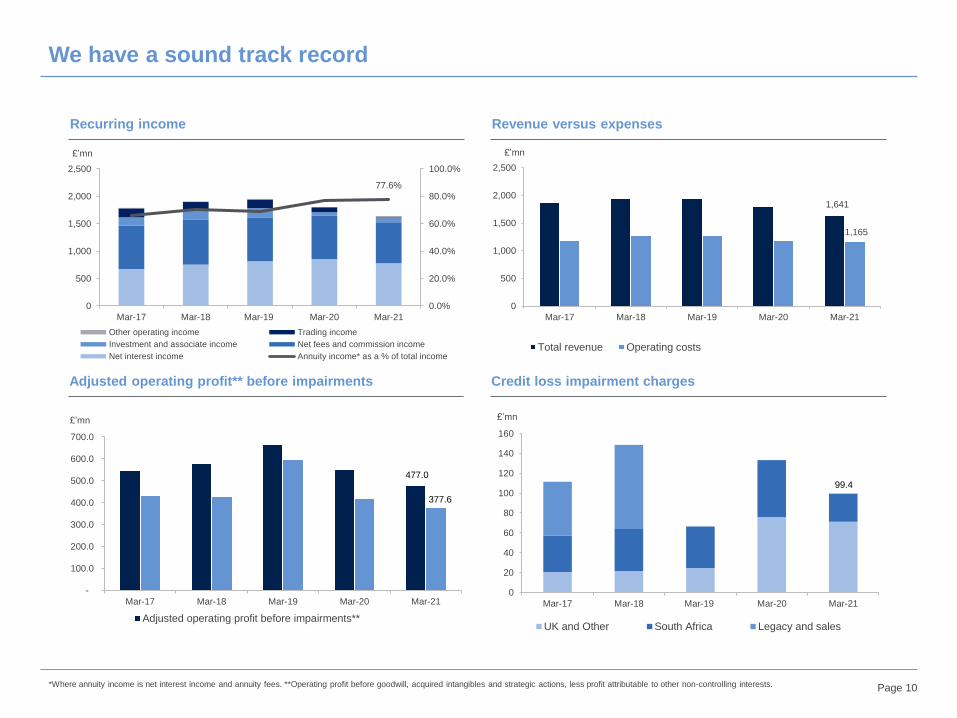
77.6%
0.0%
20.0%
40.0%
60.0%
80.0%
100.0%
0
500
1,000
1,500
2,000
2,500
Mar-17 Mar-18 Mar-19 Mar-20 Mar-21
£’mn
Other operating income Trading income
Investment and associate income Net fees and commission income
Net interest income Annuity income* as a % of total income
Recurring income Revenue versus expenses
Adjusted operating profit** before impairments Credit loss impairment charges
*Where annuity income is net interest income and annuity fees. **Operating profit before goodwill, acquired intangibles and strategic actions, less profit attributable to other non-controlling interests.
1,641
1,165
0
500
1,000
1,500
2,000
2,500
Mar-17 Mar-18 Mar-19 Mar-20 Mar-21
£’mn
Total revenue Operating costs
477.0
377.6
-
100.0
200.0
300.0
400.0
500.0
600.0
700.0
Mar-17 Mar-18 Mar-19 Mar-20 Mar-21
£’mn
Adjusted operating profit before impairments**
0
20
40
60
80
100
120
140
160
Mar-17 Mar-18 Mar-19 Mar-20 Mar-21
£’mn
UK and Other South Africa Legacy and sales
We have a sound track record
99.4

Page 11
Funds under management Net core loans and deposits
Total equity and capital resources Asset quality
0
10,000
20,000
30,000
40,000
50,000
60,000
70,000
Mar-17 Mar-18 Mar-19 Mar-20 Mar-21
£’bn
UK and Other Southern Africa
FY21: Total net inflows of £1.1bn
34.4
26.475.60%
0%
20%
40%
60%
80%
100%
120%
10
15
20
25
30
35
40
Mar-17 Mar-18 Mar-19 Mar-20 Mar-21
£’bn
Customer accounts (LHS)Net core loans (LHS)Loans and advances to customer deposits (RHS)
5,333
6,814
0
1,000
2,000
3,000
4,000
5,000
6,000
7,000
8,000
Mar-17 Mar-18 Mar-19 Mar-20 Mar-21
£’mn
Total equity (including preference shares and non-controlling interests)
Total capital resources (including subordinated liabilities)
Deposits: an increase of 6.9% since 31 March 2020
Net core loans: an increase of 6.1% since 31 March 2020
We have a sound track record (cont.)
26.4
0.35%
2.10%
0%
1%
2%
3%
4%
5%
20
21
22
23
24
25
26
27
Mar-17 Mar-18 Mar-19 Mar-20 Mar-21
£’bn
Net core loans (LHS)
Credit loss ratio (RHS)
Stage 3 loans net of ECL as a % of net core loans subject to ECL (RHS)
FY20 and FY21 impacted by COVID-19
58.4

Page 12
Living our purpose to create enduring worth, living in, not off, society
Investec’s sustainability principles:
▪ Creating long-term value for all our stakeholders
▪ Do no harm: ethical conduct and ESG screening
▪ Committed to a clean carbon transition
▪ Providing profitable, impactful and sustainable products and
services
▪ Maximising impact: through a focus on the Sustainable
Development Goals (SDGs)
Two core SDG priorities
Secondary SDG priorities
Addressing climate and inequality issues is
fundamental to the success of our business
Included in the FTSE
UK 100 ESG Select
Index (out of 641
companies)
1 of 43 banks and financial
services in the Global ESG
Leaders Index (total of 439)
components)
Top 20% in the Global
Sustainability Leaders Index
(inclusion since 2012)
Top 20% of the ISS ESG
global universe and Top 14%
of diversified financial services
Top 15% in the global
diversified financial
services sector (inclusion
since 2006)
Top 30 in the FTSE/JSE
Responsible Investment
Index
Top 2% scoring AAA in
the financial services
sector by MSCI ESG
Research
Score B against an
industry average of B
(formerly Carbon
Disclosure Project)
1 of 5 finalists for the ESG
Sustainability Professional
Award
Well positioned in ESG rankings and ratings
Refer to our website for more information on Sustainability and ESG at Investec

Page 13
Actions taken in the past year
ENVIRONMENT
Took action to address climate issues
• Achieved net-zero direct emissions for the second year as part of our commitment to ongoing
carbon neutrality in our Scope 1 and Scope 2 emissions.
• Received shareholder support for climate commitments and published our first TCFD standalone
report
SOCIAL
Continued to make progress on diversity and
equality
• Improved our gender diversity performance at senior leadership level
• Maintained our Level 1 rating under the Financial Sector Code in South Africa and signed up to the
UK Race at Work Charter
• Contributed £3.2mn in COVID-19 relief to communities
GOVERNANCE
Strengthened our sustainability governance
• Established an ESG Executive Committee to align sustainability activities across the organisation
• Implemented a more robust ESG screening process
• Created a framework to link Executive Directors remuneration to ESG KPIs
STRATEGY
Embedded sustainability into business strategy
• Launched several sustainability products and services including the first European mid-market
ESG-linked subscription lines, the UK’s first retail ESG-linked Deposit Plan and Investec Wealth &
Investment’s launch of a Global Sustainability Equity Fund
• Created a Sustainable Finance Framework
COMMITMENT
Deepened our commitment by signing up to
several international memberships
• UN Environment Programme Finance Initiative (UNEP FI)
• UN Principles for Responsible Banking (UN PRB)
• UN Principles for Responsible Investment (UN PRI)
Refer to our website for more information on Sustainability and ESG at Investec
An overview of
Investec Bank Limited (IBL)
The information in this presentation relates to the financial year ended 31 March 2021, unless
otherwise indicated.
Page 15
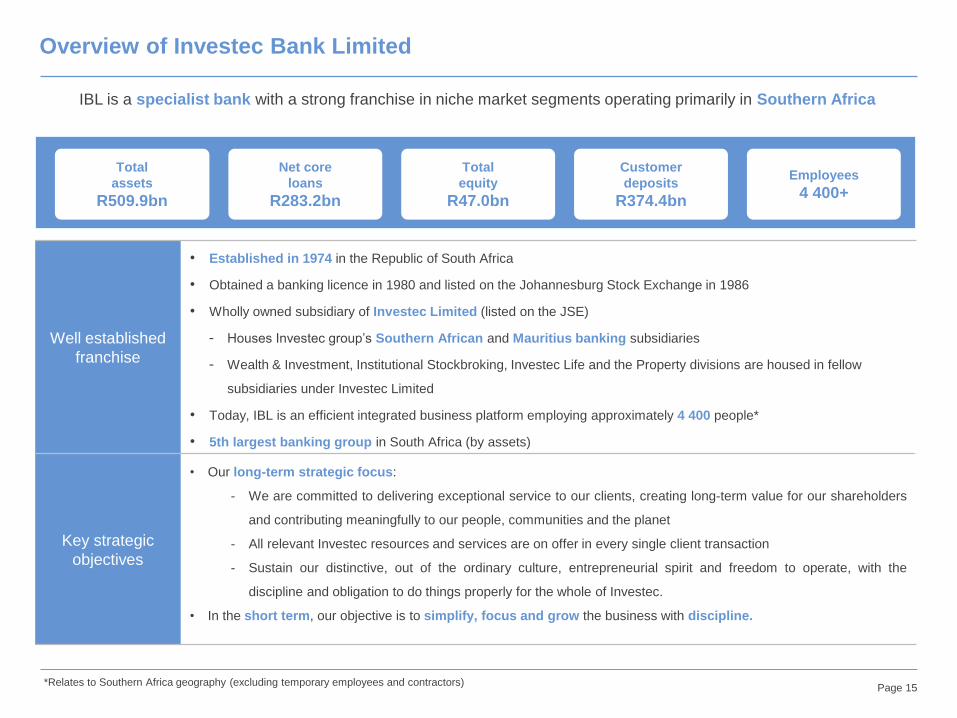
Well established
franchise
• Established in 1974 in the Republic of South Africa
• Obtained a banking licence in 1980 and listed on the Johannesburg Stock Exchange in 1986
• Wholly owned subsidiary of Investec Limited (listed on the JSE)
- Houses Investec group’s Southern African and Mauritius banking subsidiaries
- Wealth & Investment, Institutional Stockbroking, Investec Life and the Property divisions are housed in fellow
subsidiaries under Investec Limited
• Today, IBL is an efficient integrated business platform employing approximately 4 400 people*
• 5th largest banking group in South Africa (by assets)
Key strategic
objectives
• Our long-term strategic focus:
- We are committed to delivering exceptional service to our clients, creating long-term value for our shareholders
and contributing meaningfully to our people, communities and the planet
- All relevant Investec resources and services are on offer in every single client transaction
- Sustain our distinctive, out of the ordinary culture, entrepreneurial spirit and freedom to operate, with the
discipline and obligation to do things properly for the whole of Investec.
• In the short term, our objective is to simplify, focus and grow the business with discipline.
IBL is a specialist bank with a strong franchise in niche market segments operating primarily in Southern Africa
Overview of Investec Bank Limited
Total
assets
R509.9bn
Total
equity
R47.0bn
Employees
4 400+
Customer
deposits
R374.4bn
Net core
loans
R283.2bn
*Relates to Southern Africa geography (excluding temporary employees and contractors)
Page 16
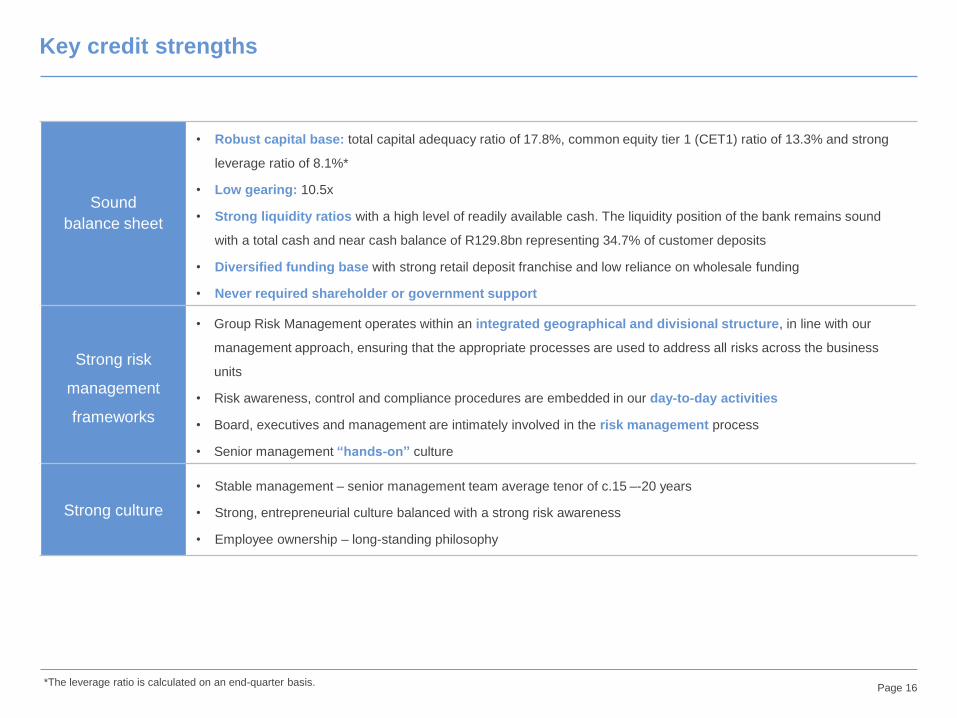
Sound
balance sheet
• Robust capital base: total capital adequacy ratio of 17.8%, common equity tier 1 (CET1) ratio of 13.3% and strong
leverage ratio of 8.1%*
• Low gearing: 10.5x
• Strong liquidity ratios with a high level of readily available cash. The liquidity position of the bank remains sound
with a total cash and near cash balance of R129.8bn representing 34.7% of customer deposits
• Diversified funding base with strong retail deposit franchise and low reliance on wholesale funding
• Never required shareholder or government support
Strong risk
management
frameworks
• Group Risk Management operates within an integrated geographical and divisional structure, in line with our
management approach, ensuring that the appropriate processes are used to address all risks across the business
units
• Risk awareness, control and compliance procedures are embedded in our day-to-day activities
• Board, executives and management are intimately involved in the risk management process
• Senior management “hands-on” culture
Strong culture
• Stable management – senior management team average tenor of c.15 –-20 years
• Strong, entrepreneurial culture balanced with a strong risk awareness
• Employee ownership – long-standing philosophy
Key credit strengths
*The leverage ratio is calculated on an end-quarter basis.
Page 17All shareholdings are 100% unless otherwise stated. Only main operating subsidiaries are indicated.
^Houses the Wealth & Investment business
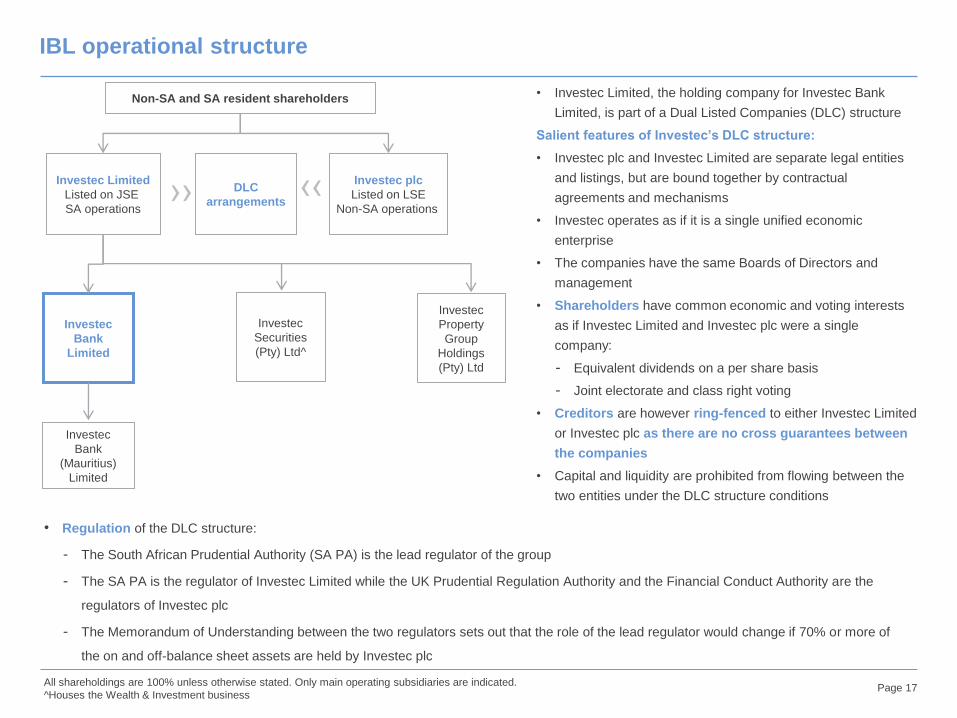
IBL operational structure
Investec
Property
Group
Holdings
(Pty) Ltd
Investec
Securities
(Pty) Ltd^
Non-SA and SA resident shareholders
Investec
Bank
(Mauritius)
Limited
Investec
Bank
Limited
Investec Limited
Listed on JSE
SA operations
DLC
arrangements
Investec plc
Listed on LSE
Non-SA operations››
››• Regulation of the DLC structure:
- The South African Prudential Authority (SA PA) is the lead regulator of the group
- The SA PA is the regulator of Investec Limited while the UK Prudential Regulation Authority and the Financial Conduct Authority are the
regulators of Investec plc
- The Memorandum of Understanding between the two regulators sets out that the role of the lead regulator would change if 70% or more of
the on and off-balance sheet assets are held by Investec plc
• Investec Limited, the holding company for Investec Bank
Limited, is part of a Dual Listed Companies (DLC) structure
Salient features of Investec’s DLC structure:
• Investec plc and Investec Limited are separate legal entities
and listings, but are bound together by contractual
agreements and mechanisms
• Investec operates as if it is a single unified economic
enterprise
• The companies have the same Boards of Directors and
management
• Shareholders have common economic and voting interests
as if Investec Limited and Investec plc were a single
company:
- Equivalent dividends on a per share basis
- Joint electorate and class right voting
• Creditors are however ring-fenced to either Investec Limited
or Investec plc as there are no cross guarantees between
the companies
• Capital and liquidity are prohibited from flowing between the
two entities under the DLC structure conditions
IBL operating fundamentalsBusiness performance was resilient despite an
operating environment characterised by stop-start
economies as countries grappled with the impact of
COVID-19.
We have seen good momentum since December 2020
with stronger activity levels and growth in lending
books across the bank, good client acquisition and
point-of-sale activity from private clients as well as
increased corporate trading activity. Our clients have a
track record of resilience in difficult operating
environments as reflected in our low impairments and
credit loss ratio.
Despite a greater sense of optimism spurred on by
declining COVID-19 infections and the vaccine roll out
programme in South Africa, the emerging third wave
remains a key risk to the business and the economy.

Page 19*Where annuity income is net interest income plus net annuity fees and commissions
53.7%
0.0%
10.0%
20.0%
30.0%
40.0%
50.0%
60.0%
0
2,000
4,000
6,000
8,000
10,000
12,000
14,000
2017 2018 2019 2020 2021
R’mn
Operating income before expected credit loss impairment charges (LHS)
Operating costs (LHS)
Cost to income ratio (RHS)
85.4%
0.0%
10.0%
20.0%
30.0%
40.0%
50.0%
60.0%
70.0%
80.0%
90.0%
0
2,000
4,000
6,000
8,000
10,000
12,000
14,000
2017 2018 2019 2020 2021
R’mn
Trading income Investment and associate income
Other fees and other operating income Annuity fees and commissions
Net interest income Annuity income* as a % of total income
• A diversified business model continues to support a large recurring income base comprising net interest income and net annuity fees and
commissions, currently 85.4% of operating income (up from 74.8% in 2012).
• Total operating income before expected credit loss impairment charges for the financial year ended 31 March 2021 decreased 4.4% year on
year due to the combined impact of lower non-interest revenue and subdued lending and transactional activity, particularly in 1H21. In addition,
investment income declined as a result of lower realisations, dividend income and negative fair value adjustments.
• We maintained a disciplined approach to cost control. Operating costs decreased 2.5% year on year reflecting lower discretionary spending
and effective cost containment. Taken together with the decreased revenue, the cost to income ratio for the financial year ended 31 March 2021
increased to 53.7% (31 March 2020: 52.6%)
Revenue supported by resilient franchises
Annuity income* Revenue versus expenses
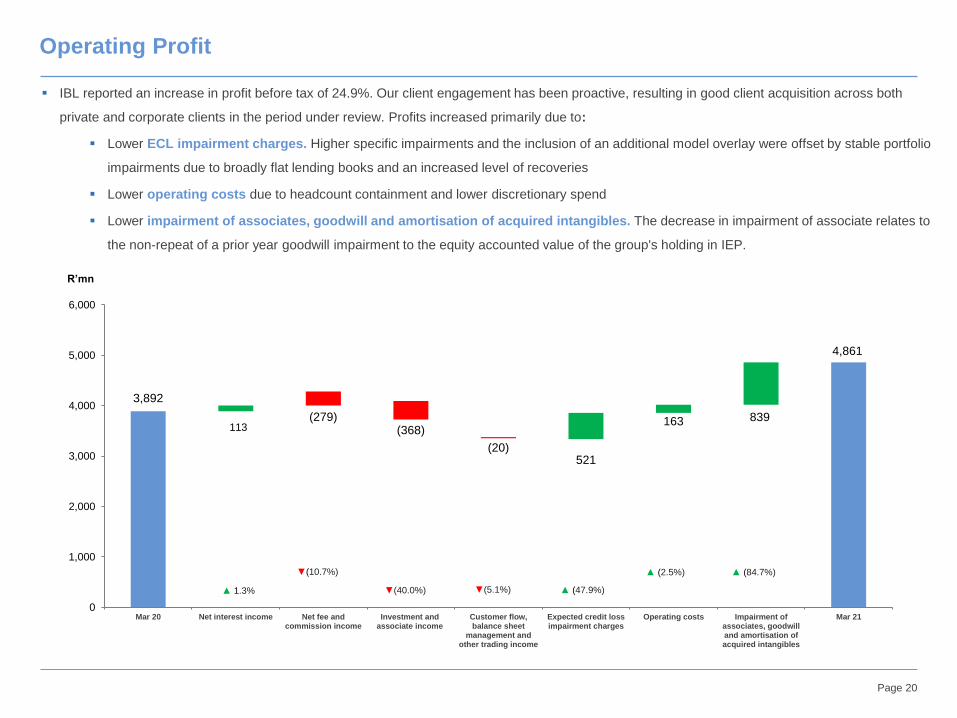
Page 20
3,892
4,861
113 (279)
(368)
(20)521
163 839
0
1,000
2,000
3,000
4,000
5,000
6,000
Mar 20 Net interest income Net fee andcommission income
Investment andassociate income
Customer flow,balance sheet
management andother trading income
Expected credit lossimpairment charges
Operating costs Impairment ofassociates, goodwilland amortisation ofacquired intangibles
Mar 21
R’mn
▲ 1.3% ▼(40.0%) ▲ (47.9%)▼(5.1%)
▲ (2.5%)▼(10.7%)
▪ IBL reported an increase in profit before tax of 24.9%. Our client engagement has been proactive, resulting in good client acquisition across both
private and corporate clients in the period under review. Profits increased primarily due to:
▪ Lower ECL impairment charges. Higher specific impairments and the inclusion of an additional model overlay were offset by stable portfolio
impairments due to broadly flat lending books and an increased level of recoveries
▪ Lower operating costs due to headcount containment and lower discretionary spend
▪ Lower impairment of associates, goodwill and amortisation of acquired intangibles. The decrease in impairment of associate relates to
the non-repeat of a prior year goodwill impairment to the equity accounted value of the group's holding in IEP.
Operating Profit
▲ (84.7%)
Page 21
Sound capital base and capital ratios
Total capital resources Total risk-weighted assets: lower RWA intensity
0
10,000
20,000
30,000
40,000
50,000
60,000
70,000
2017 2018 2019 2020 2021
R’mn
Subordinated liabilities
Perpetual preference shares (dividend at 75% of Prime)
Shareholders' equity (excluding perpeutal preference shares)
0%
10%
20%
30%
40%
50%
60%
70%
80%
0
100,000
200,000
300,000
400,000
500,000
600,000
2017 2018 2019 2020 2021
R’mn
Total assets (LHS)
Total risk-weighted assets (LHS)
RWA as a percentage of total assets (RHS)
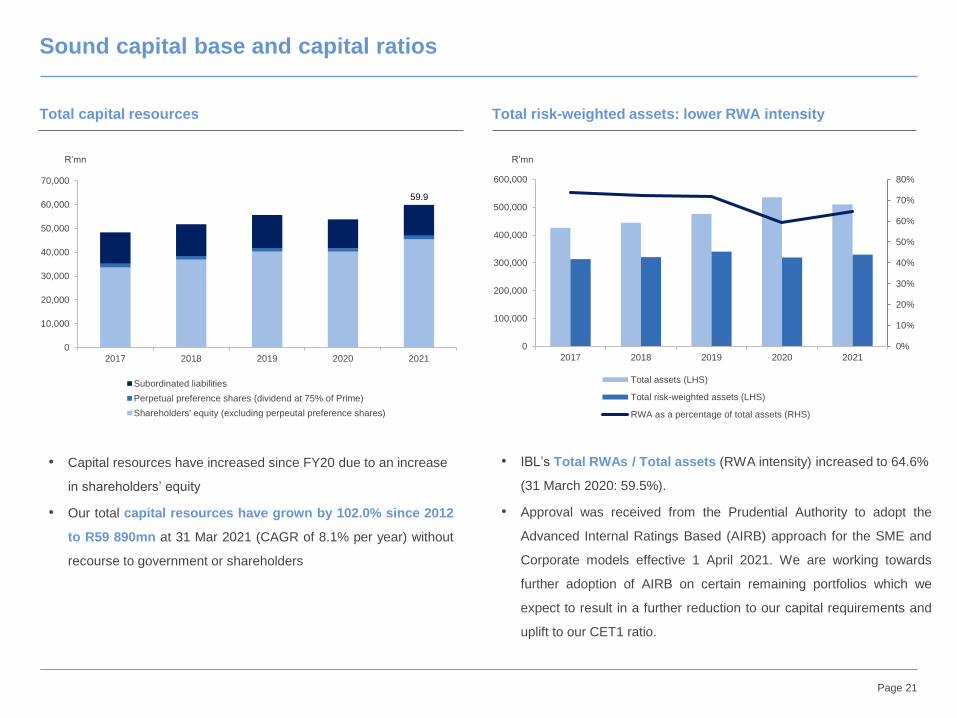
• Capital resources have increased since FY20 due to an increase
in shareholders’ equity
• Our total capital resources have grown by 102.0% since 2012
to R59 890mn at 31 Mar 2021 (CAGR of 8.1% per year) without
recourse to government or shareholders
• IBL’s Total RWAs / Total assets (RWA intensity) increased to 64.6%
(31 March 2020: 59.5%).
• Approval was received from the Prudential Authority to adopt the
Advanced Internal Ratings Based (AIRB) approach for the SME and
Corporate models effective 1 April 2021. We are working towards
further adoption of AIRB on certain remaining portfolios which we
expect to result in a further reduction to our capital requirements and
uplift to our CET1 ratio.
59.9

Page 22
FIRB
A summary of ratios 31 Mar 21^ 31 Mar 20
Common equity tier 1 (as reported) 13.3% 12.1%
Common equity tier 1 (fully loaded) # 13.3% 12.1%
Tier 1 (as reported) 13.7% 12.3%
Total capital adequacy ratio (as reported) 17.8% 16.4%
Leverage ratio** 8.1% 6.9%
Leverage ratio** (fully loaded) # 8.1% 6.8%
Sound capital base and capital ratios (cont.)
• IBL maintained a sound capital position with a CET1 ratio of 13.3% and a total capital adequacy ratio of 17.8%.
• Leverage ratios remains robust.
• Approval was received from the Prudential Authority to adopt the Advanced Internal Ratings Based (AIRB) approach for the SME and Corporate
models effective 1 April 2021. We are working towards further adoption of AIRB on certain remaining portfolios.
*Since 2013 capital information is based on Basel III capital requirements as currently applicable in South Africa. Comparative information is disclosed on a Basel II basis.
The leverage ratio has only been disclosed since 2014, historic information has been estimated.
Basel capital ratios* Capital development
17.8
13.3
8.1
0
2
4
6
8
10
12
14
16
18
20
2017 2018 2019 2020 2021
%
Total capital adequacy ratio Common equity Tier 1 ratio Leverage ratio** The leverage ratios are calculated on an end-quarter basis.
Investec Bank Limited's capital information includes unappropriated profits. If unappropriated profits are
excluded from capital information, Investec Bank Limited's CET 1 ratio would be 48bps lower (31 March
2020: 15bps lower).
# The key difference between the ‘reported’ basis and the ‘fully loaded’ basis is primarily relating to capital
instruments that previously qualified as regulatory capital, but do not fully qualify under South African
Prudential Authority regulations. These instruments continue to be recognised on a reducing basis in the
‘reported’ figures until 2022.
Page 23
Consistent asset growth, gearing ratios remain low
Total assets composition
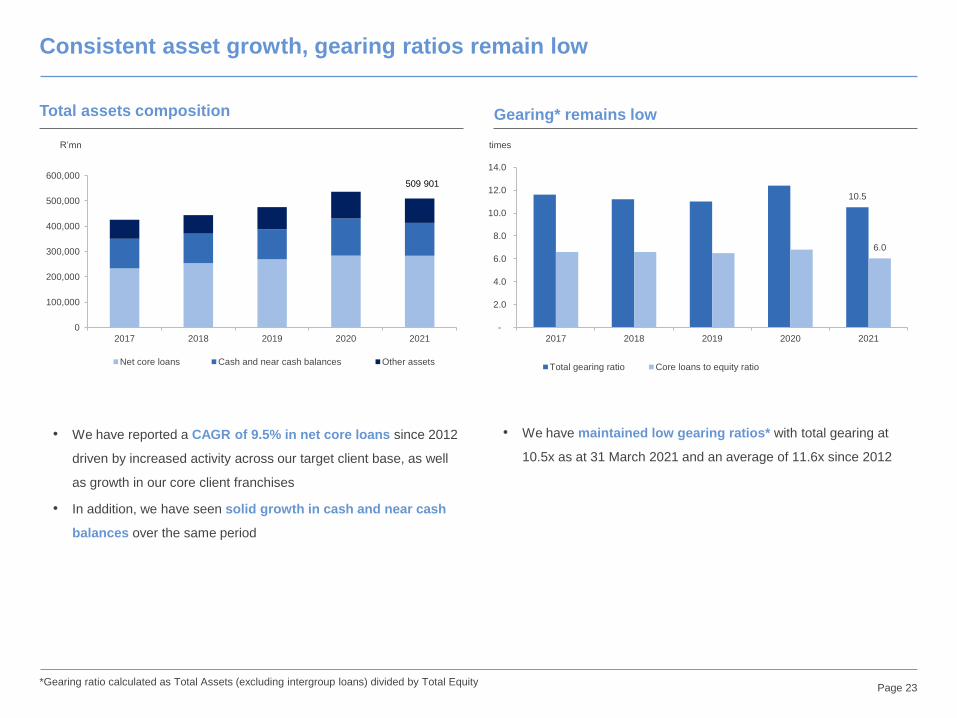
• We have reported a CAGR of 9.5% in net core loans since 2012
driven by increased activity across our target client base, as well
as growth in our core client franchises
• In addition, we have seen solid growth in cash and near cash
balances over the same period
• We have maintained low gearing ratios* with total gearing at
10.5x as at 31 March 2021 and an average of 11.6x since 2012
Gearing* remains low
0
100,000
200,000
300,000
400,000
500,000
600,000
2017 2018 2019 2020 2021
R’mn
Net core loans Cash and near cash balances Other assets
509 901
10.5
6.0
-
2.0
4.0
6.0
8.0
10.0
12.0
14.0
2017 2018 2019 2020 2021
times
Total gearing ratio Core loans to equity ratio
*Gearing ratio calculated as Total Assets (excluding intergroup loans) divided by Total Equity
Page 24
Substantial surplus liquidity
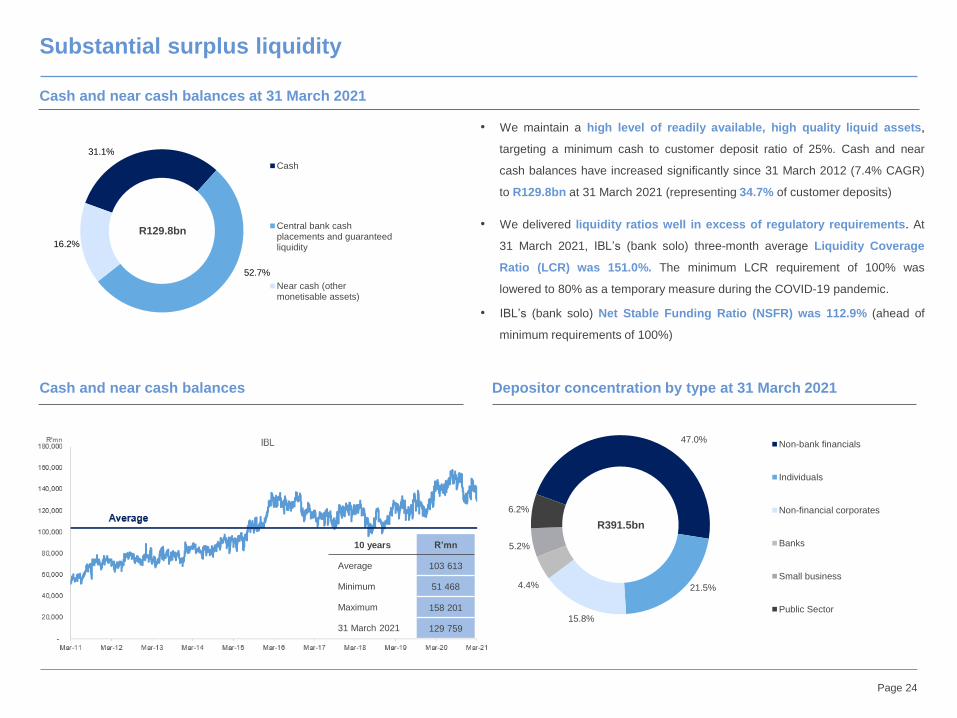
• We maintain a high level of readily available, high quality liquid assets,
targeting a minimum cash to customer deposit ratio of 25%. Cash and near
cash balances have increased significantly since 31 March 2012 (7.4% CAGR)
to R129.8bn at 31 March 2021 (representing 34.7% of customer deposits)
• We delivered liquidity ratios well in excess of regulatory requirements. At
31 March 2021, IBL’s (bank solo) three-month average Liquidity Coverage
Ratio (LCR) was 151.0%. The minimum LCR requirement of 100% was
lowered to 80% as a temporary measure during the COVID-19 pandemic.
• IBL’s (bank solo) Net Stable Funding Ratio (NSFR) was 112.9% (ahead of
minimum requirements of 100%)
Cash and near cash balances at 31 March 2021
Cash and near cash balances Depositor concentration by type at 31 March 2021
31.1%
52.7%
16.2%
Cash
Central bank cashplacements and guaranteedliquidity
Near cash (othermonetisable assets)
R129.8bn
47.0%
21.5%
15.8%
4.4%
5.2%
6.2%
Non-bank financials
Individuals
Non-financial corporates
Banks
Small business
Public Sector
R391.5bn
10 years R’mn
Average 103 613
Minimum 51 468
Maximum 158 201
31 March 2021 129 759

Page 25
Healthy loan to deposit ratio, stable customer deposit base
Fully self funded from customer deposits: healthy loan to
deposit ratio Total deposits: stable customer deposit base
283,240
374,369
73.5%
60.0%
65.0%
70.0%
75.0%
80.0%
85.0%
90.0%
95.0%
100.0%
0
50,000
100,000
150,000
200,000
250,000
300,000
350,000
400,000
2017 2018 2019 2020 2021
R’mn
Net core loans and advances (LHS) Customer accounts (deposits) (LHS)
Loans as a % of customer deposits (RHS)
17,144
374,369
0
50,000
100,000
150,000
200,000
250,000
300,000
350,000
400,000
2017 2018 2019 2020 2021
R’mn
Bank deposits Customer accounts (deposits)
• Customer deposits have grown by 112.6% (c.8.7% CAGR p.a.)
since 2012 to R374.4bn at 31 March 2021
• Loans and advances as a percentage of customer deposits
amounts to 73.5%
• We also have strong relationships with our institutional clients and
our wholesale funding is diversified by product and tenor
• Fixed and notice customer deposits have continued to display
a strong ‘stickiness’ with continued willingness from clients to
reinvest in our suite of term and notice products
Page 26
Diversified funding strategy
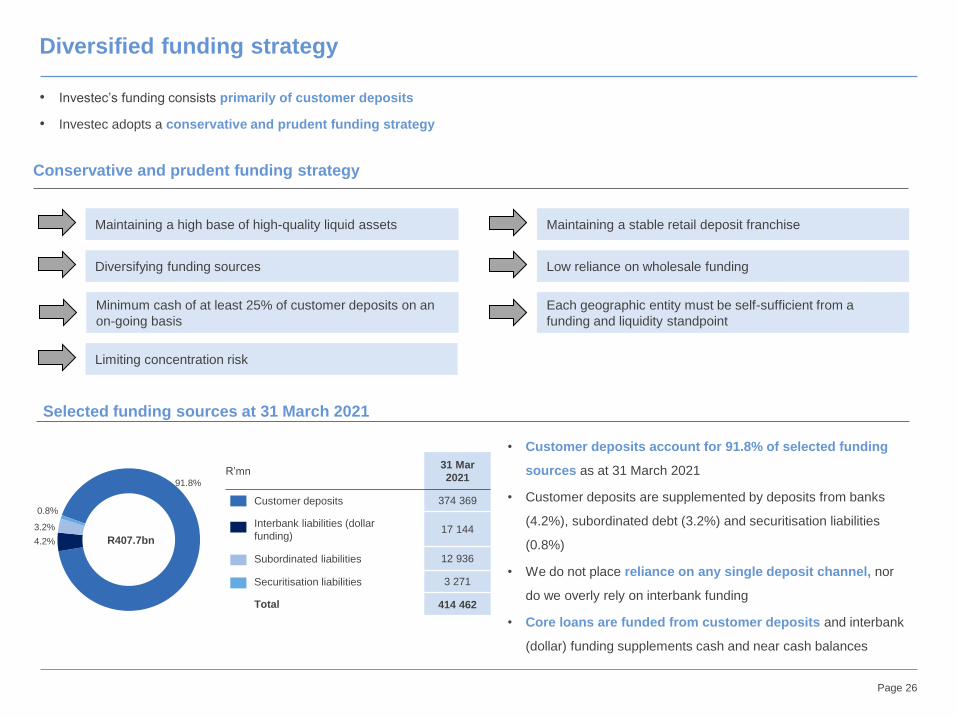
• Investec’s funding consists primarily of customer deposits
• Investec adopts a conservative and prudent funding strategy
Maintaining a high base of high-quality liquid assets
Diversifying funding sources
Limiting concentration risk
Low reliance on wholesale funding
Maintaining a stable retail deposit franchise
R’mn31 Mar
2021
Customer deposits 374 369
Interbank liabilities (dollar
funding)17 144
Subordinated liabilities 12 936
Securitisation liabilities 3 271
Total 414 462
91.8%
4.2%
3.2%
0.8%
R407.7bn
Conservative and prudent funding strategy
Selected funding sources at 31 March 2021
Minimum cash of at least 25% of customer deposits on an
on-going basis
Each geographic entity must be self-sufficient from a
funding and liquidity standpoint
• Customer deposits account for 91.8% of selected funding
sources as at 31 March 2021
• Customer deposits are supplemented by deposits from banks
(4.2%), subordinated debt (3.2%) and securitisation liabilities
(0.8%)
• We do not place reliance on any single deposit channel, nor
do we overly rely on interbank funding
• Core loans are funded from customer deposits and interbank
(dollar) funding supplements cash and near cash balances
Page 27
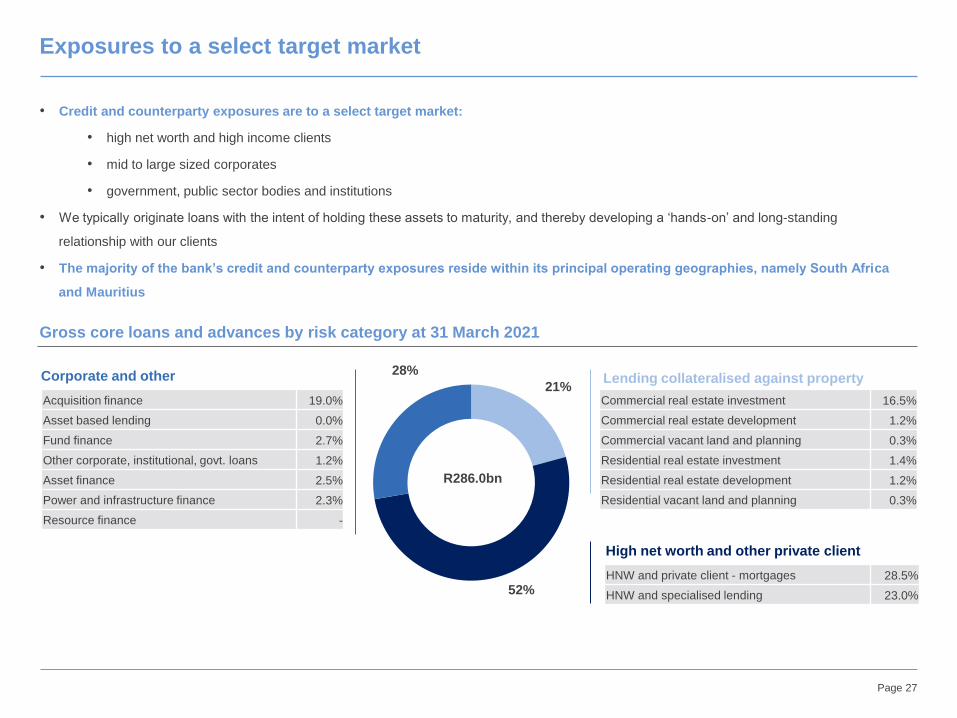
Exposures to a select target market
• Credit and counterparty exposures are to a select target market:
• high net worth and high income clients
• mid to large sized corporates
• government, public sector bodies and institutions
• We typically originate loans with the intent of holding these assets to maturity, and thereby developing a ‘hands-on’ and long-standing
relationship with our clients
• The majority of the bank’s credit and counterparty exposures reside within its principal operating geographies, namely South Africa
and Mauritius
Gross core loans and advances by risk category at 31 March 2021
21%
52%
28%
R286.0bn
Lending collateralised against property
High net worth and other private client
Corporate and other
Commercial real estate investment 16.5%
Commercial real estate development 1.2%
Commercial vacant land and planning 0.3%
Residential real estate investment 1.4%
Residential real estate development 1.2%
Residential vacant land and planning 0.3%
HNW and private client - mortgages 28.5%
HNW and specialised lending 23.0%
Acquisition finance 19.0%
Asset based lending 0.0%
Fund finance 2.7%
Other corporate, institutional, govt. loans 1.2%
Asset finance 2.5%
Power and infrastructure finance 2.3%
Resource finance -

Page 28
Solid asset quality despite COVID-19 related impairment charges
Core loans and asset quality
283,240
0.18%
2.10%
0.0%
0.5%
1.0%
1.5%
2.0%
2.5%
0
50,000
100,000
150,000
200,000
250,000
300,000
2017 2018 2019 2020 2021
R’mn
Net core loans (LHS)
Credit loss ratio (RHS)
Net default loans before collateral as a % of net core loans / Stage 3 net of ECL as a % ofnet core loans subject to ECL (RHS)
▪ Credit quality metrics on core loans and advances for the
financial year ending 31 March 2021 are as follows:
▪ The total income statement expected credit loss
(ECL) impairment charges for the financial year
ending 31 March 2021 decreased to R567 million
(2020: R1 088 million). Higher specific
impairments and the inclusion of an additional
model overlay were offset by stable portfolio
impairments due to broadly flat lending books and
an increased level of recoveries.
▪ The credit loss ratio* was 0.18% at 31 March
2021 (31 March 2020: 0.37%), which is below our
through-the-cycle range of 30bps – 40bps and well
below industry averages.
▪ Since 31 March 2020 Stage 3 gross core loans
subject to ECL increased by R2 830 million to
R7 183 million.
▪ Stage 3 net of ECL as a % of net core loans
subject to ECL was 2.1% for 31 March 2021 (31
March 2020: 0.9%).
*Expected credit loss (ECL) impairment charges on gross core loans as a % of average gross core loans subject to ECL

Page 29
10,768
3,585
15,111
4,353
14,969
7,183
-
2,000
4,000
6,000
8,000
10,000
12,000
14,000
16,000
18,000
20,000
Stage 2 Stage 3
2019 2020 2021
Provision build due to COVID-19 under IFRS 9
ECL coverage ratio FY 2019 FY 2020 FY 2021
Stage 1 0.20% 0.40% 0.38%
Stage 2 4.10% 2.80% 2.80%
Stage 3 47.20% 43.20% 18.50%
▪ Additional provisions taken due to COVID-19 under IFRS 9 due to
a deterioration of the macroeconomic scenarios applied
▪ Stage 1 provisions decreased 6.8% from R1 056mn at 31 March
2020 to R984mn at 31 March 2021. As a result, Stage 1 ECL
coverage ratio decreased from 0.40% to 0.38%
▪ Stage 2 provisions decreased 1.7% from R423mn at 31 March
2020 to R416mn at 31 March 2021. Stage 2 ECL coverage ratio
remained flat at 2.80%.
▪ Stage 3 provisions decreased 29.4% from R1 880mn at 31 March
2020 to R1 328mn at 31 March 2021. Stage 3 ECL coverage ratio
decreased from 43.20% to 18.50%
Gross core loans by Stage
4.0% 5.3% 1.3% 1.5%as % of
gross core
loans
▪ In line with regulatory and accounting bodies guidance,
exposures that have been granted COVID-19 relief measures
such as payment holidays are not automatically considered to
have been subject to a significant increase in credit risk and
therefore do not alone result in a transfer across stages
▪ Stage 2 exposures decreased from 5.3% at 31 March 2020 to
5.2% at 31 March 2021, reflecting improvement in the economic
scenarios.
▪ Stage 3 totalled R7 183mn or 2.5% of gross core loans subject to
ECL at 31 March 2021 (31 March 2020: 1.5%).
5381,056 984
441
423 416
1,691
1,880
1,328
0
500
1,000
1,500
2,000
2,500
3,000
3,500
4,000
FY 2019 FY 2020 FY 2021
Stage 3
Stage 2
Stage 1
Asset quality metrics
R’mn
R’mn
5.2% 2.5%
Page 30
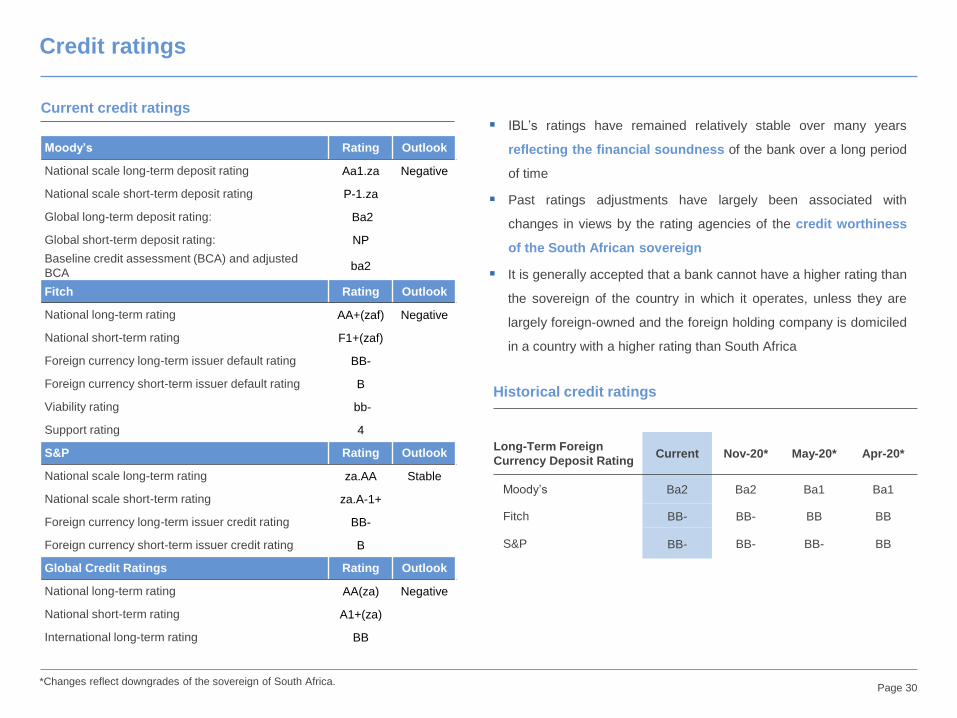
▪ IBL’s ratings have remained relatively stable over many years
reflecting the financial soundness of the bank over a long period
of time
▪ Past ratings adjustments have largely been associated with
changes in views by the rating agencies of the credit worthiness
of the South African sovereign
▪ It is generally accepted that a bank cannot have a higher rating than
the sovereign of the country in which it operates, unless they are
largely foreign-owned and the foreign holding company is domiciled
in a country with a higher rating than South Africa
Moody’s Rating Outlook
National scale long-term deposit rating Aa1.za Negative
National scale short-term deposit rating P-1.za
Global long-term deposit rating: Ba2
Global short-term deposit rating: NP
Baseline credit assessment (BCA) and adjusted
BCAba2
Fitch Rating Outlook
National long-term rating AA+(zaf) Negative
National short-term rating F1+(zaf)
Foreign currency long-term issuer default rating BB-
Foreign currency short-term issuer default rating B
Viability rating bb-
Support rating 4
S&P Rating Outlook
National scale long-term rating za.AA Stable
National scale short-term rating za.A-1+
Foreign currency long-term issuer credit rating BB-
Foreign currency short-term issuer credit rating B
Global Credit Ratings Rating Outlook
National long-term rating AA(za) Negative
National short-term rating A1+(za)
International long-term rating BB
Credit ratings
Current credit ratings
Historical credit ratings
Long-Term Foreign
Currency Deposit RatingCurrent Nov-20* May-20* Apr-20*
Moody’s Ba2 Ba2 Ba1 Ba1
Fitch BB- BB- BB BB
S&P BB- BB- BB- BB
*Changes reflect downgrades of the sovereign of South Africa.
IBL peer analysis

Page 32
Long-Term Deposit Rating S&P Fitch Moody's Global Credit Ratings
Foreign
currency*
National
scale
Foreign
currency*
National
scale
Viability
ratings
Support
ratingGlobal
National
scale
Baseline
credit
assessment
International National
Absa Bank Limited n/a za.AA BB- AA+(zaf) bb- 4 Ba2 Aa1.za ba2 BB AA(za)
FirstRand Bank Limited BB- za.AA BB- AA+(zaf) bb- 4 Ba2 Aa1.za ba2 BB AA+(za)
Nedbank Limited BB- za.AA BB- AA+(zaf) bb- 4 Ba2 Aa1.za ba2 BB AA(za)
Standard Bank of South
Africa Limitedn/a n/a BB- AA+(zaf) bb- 4 Ba2 Aa1.za Ba2 BB AA+(za)
Investec Bank Limited BB- za.AA BB- AA+(zaf) bb- 4 Ba2 Aa1.za ba2 BB AA(za)
Rating definitions:
Short-term ratings should be used for investments less than a one-year time horizon and long-term ratings for periods greater than a year. Foreign
currency ratings should be used when one is considering foreign denominated investments. Investments in Rand should be assessed against local
currency and national ratings, (zaf) being Fitch’s notation and .za for Moody’s, Standard & Poor’s and Global Credit Ratings notation for South
African ratings.
Comparative ratings have been sourced from the respective company websites and recent press releases as at 20 May 2021 and may be subject to changes for which we
cannot be held accountable. It is advisable to discuss the ratings of the various companies with the companies themselves as this information merely reflects our interpretation
thereof. *Impacted by the rating downgrades of the South African Sovereign.
Peer group companies
Short-Term Deposit Rating S&P Fitch Moody’sGlobal Credit
Ratings
Foreign
currency*
National
scale
Foreign
currency*
National
scaleGlobal
National
scaleNational
Absa Bank Limited n/a za.A-1+ B F1+(zaf) NP P-1.za A1+(za)
FirstRand Bank Limited B za.A-1+ B F1+(zaf) NP P-1.za A1+(za)
Nedbank Limited B za.A-1+ B F1+(zaf) NP P-1.za A1+(za)
Standard Bank of South
Africa Limitedn/a n/a B F1+(zaf) NP P-1.za A1+(za)
Investec Bank Limited B za.A-1+ B F1+(zaf) NP P-1.za A1+(za)
Page 33
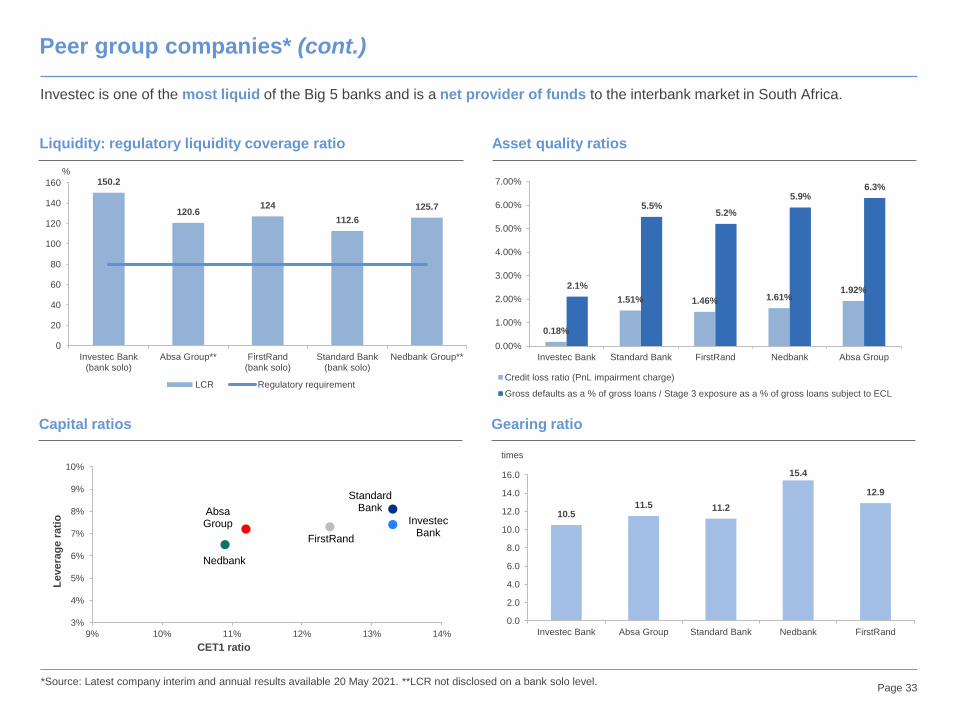
150.2
120.6124
112.6
125.7
0
20
40
60
80
100
120
140
160
Investec Bank(bank solo)
Absa Group** FirstRand(bank solo)
Standard Bank(bank solo)
Nedbank Group**
LCR Regulatory requirement
10.511.5 11.2
15.4
12.9
0.0
2.0
4.0
6.0
8.0
10.0
12.0
14.0
16.0
Investec Bank Absa Group Standard Bank Nedbank FirstRand
0.18%
1.51% 1.46% 1.61%1.92%2.1%
5.5%5.2%
5.9%6.3%
0.00%
1.00%
2.00%
3.00%
4.00%
5.00%
6.00%
7.00%
Investec Bank Standard Bank FirstRand Nedbank Absa Group
Credit loss ratio (PnL impairment charge)
Gross defaults as a % of gross loans / Stage 3 exposure as a % of gross loans subject to ECL
Absa Group
FirstRand
Nedbank
Standard Bank
Investec Bank
3%
4%
5%
6%
7%
8%
9%
10%
9% 10% 11% 12% 13% 14%
Le
vera
ge
rati
o
CET1 ratio
Peer group companies* (cont.)
Liquidity: regulatory liquidity coverage ratio Asset quality ratios
Capital ratios Gearing ratio
Investec is one of the most liquid of the Big 5 banks and is a net provider of funds to the interbank market in South Africa.
*Source: Latest company interim and annual results available 20 May 2021. **LCR not disclosed on a bank solo level.
%
times

Page 34
Definitions and/or explanations of certain ratios:
• A capital ratio is a measure of a bank's available capital expressed as a percentage of a bank's risk-weighted assets. It is based on regulatory
qualifying capital (including common equity tier 1, additional tier 1 and tier 2 capital) as a percentage of risk-weighted assets. Assets are risk-
weighted either according to the Standardised Approach in terms of Basel or the Advanced Approach.
• The leverage ratio is calculated as total tier 1 capital (according to regulatory definitions) divided by total assets (exposure measure). This ratio
effectively assumes all assets are 100% risk weighted and is a more conservative measure than the capital adequacy ratio. Regulators are
expecting that this ratio should exceed 5%.
• The gearing ratio is calculated as total assets divided by total equity (according to accounting definitions).
• The credit loss ratio is calculated as the expected credit loss (ECL) impairment charges on gross core loans as a % of average gross core loans
subject to ECL.
• Stage 3/Default loans largely comprise loans that are impaired and/or over 90 days in arrears.
Peer group companies (cont.)
Investec Bank Limited
Appendices
Page 36
South Africa
Base case Average 2021-2026
Macro drivers (%)
Financial year ending2022 2023 2024 2025 2026
Extreme
up caseUp case
Base
case
Lite down
case
Severe
down
case
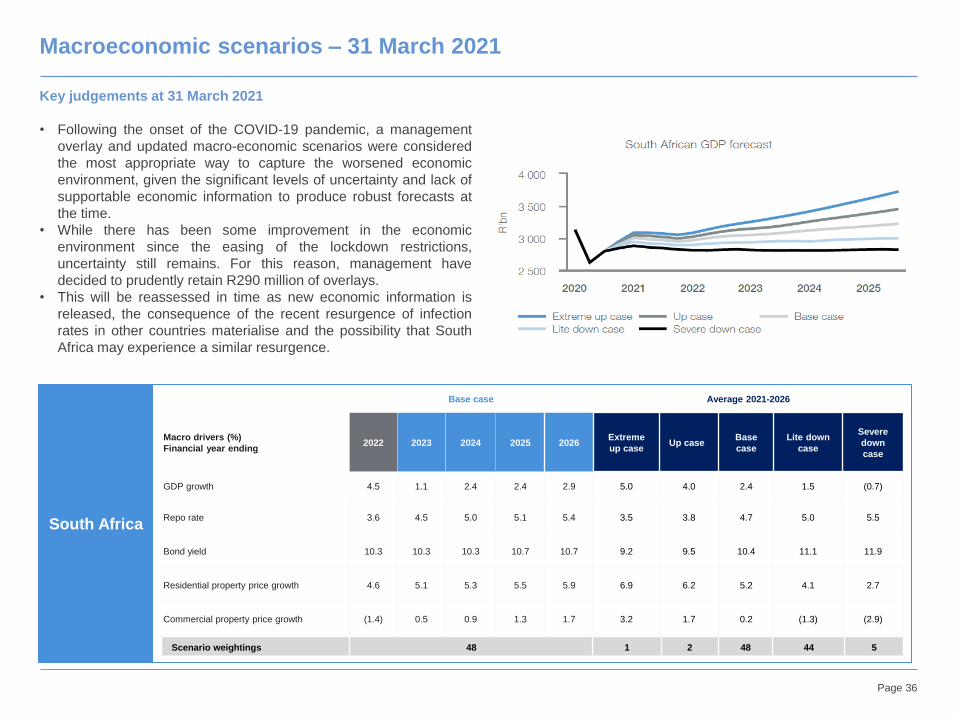
GDP growth 4.5 1.1 2.4 2.4 2.9 5.0 4.0 2.4 1.5 (0.7)
Repo rate 3.6 4.5 5.0 5.1 5.4 3.5 3.8 4.7 5.0 5.5
Bond yield 10.3 10.3 10.3 10.7 10.7 9.2 9.5 10.4 11.1 11.9
Residential property price growth 4.6 5.1 5.3 5.5 5.9 6.9 6.2 5.2 4.1 2.7
Commercial property price growth (1.4) 0.5 0.9 1.3 1.7 3.2 1.7 0.2 (1.3) (2.9)
Scenario weightings 48 1 2 48 44 5
Macroeconomic scenarios – 31 March 2021
Key judgements at 31 March 2021
• Following the onset of the COVID-19 pandemic, a management
overlay and updated macro-economic scenarios were considered
the most appropriate way to capture the worsened economic
environment, given the significant levels of uncertainty and lack of
supportable economic information to produce robust forecasts at
the time.
• While there has been some improvement in the economic
environment since the easing of the lockdown restrictions,
uncertainty still remains. For this reason, management have
decided to prudently retain R290 million of overlays.
• This will be reassessed in time as new economic information is
released, the consequence of the recent resurgence of infection
rates in other countries materialise and the possibility that South
Africa may experience a similar resurgence.
Page 37
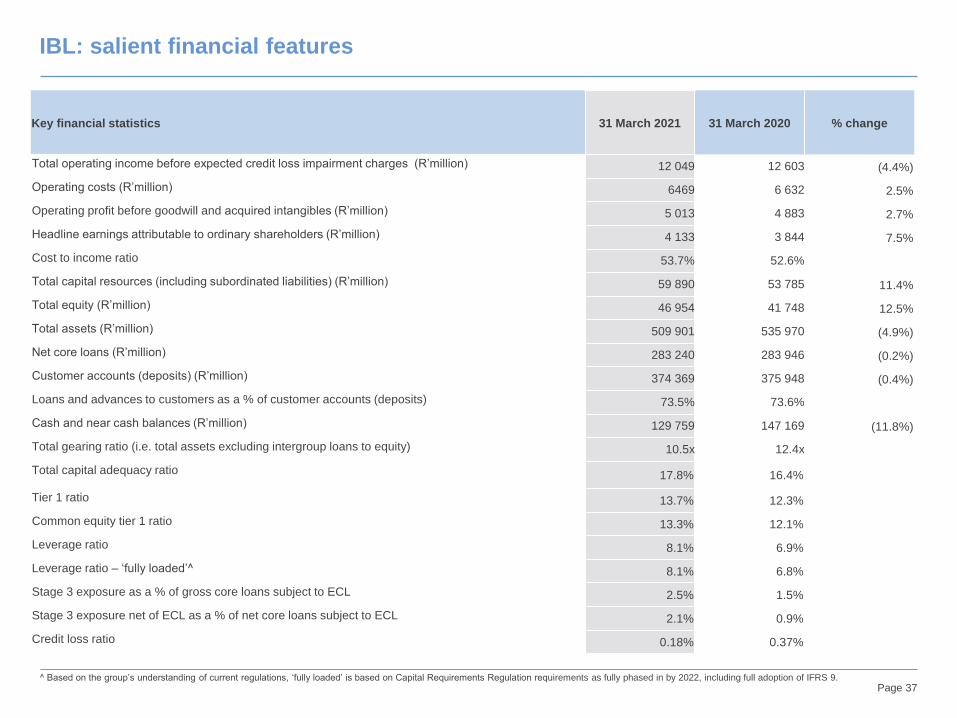
Key financial statistics 31 March 2021 31 March 2020 % change
Total operating income before expected credit loss impairment charges (R’million) 12 049 12 603 (4.4%)
Operating costs (R’million) 6469 6 632 2.5%
Operating profit before goodwill and acquired intangibles (R’million) 5 013 4 883 2.7%
Headline earnings attributable to ordinary shareholders (R’million) 4 133 3 844 7.5%
Cost to income ratio 53.7% 52.6%
Total capital resources (including subordinated liabilities) (R’million) 59 890 53 785 11.4%
Total equity (R’million) 46 954 41 748 12.5%
Total assets (R’million) 509 901 535 970 (4.9%)
Net core loans (R’million) 283 240 283 946 (0.2%)
Customer accounts (deposits) (R’million) 374 369 375 948 (0.4%)
Loans and advances to customers as a % of customer accounts (deposits) 73.5% 73.6%
Cash and near cash balances (R’million) 129 759 147 169 (11.8%)
Total gearing ratio (i.e. total assets excluding intergroup loans to equity) 10.5x 12.4x
Total capital adequacy ratio 17.8% 16.4%
Tier 1 ratio 13.7% 12.3%
Common equity tier 1 ratio 13.3% 12.1%
Leverage ratio 8.1% 6.9%
Leverage ratio – ‘fully loaded’^ 8.1% 6.8%
Stage 3 exposure as a % of gross core loans subject to ECL 2.5% 1.5%
Stage 3 exposure net of ECL as a % of net core loans subject to ECL 2.1% 0.9%
Credit loss ratio 0.18% 0.37%
Based on the group’s understanding of current regulations, ‘fully loaded’ is based on Capital Requirements Regulation requirements as fully phased in by 2022, including full adoption of IFRS 9.
IBL: salient financial features
Page 38
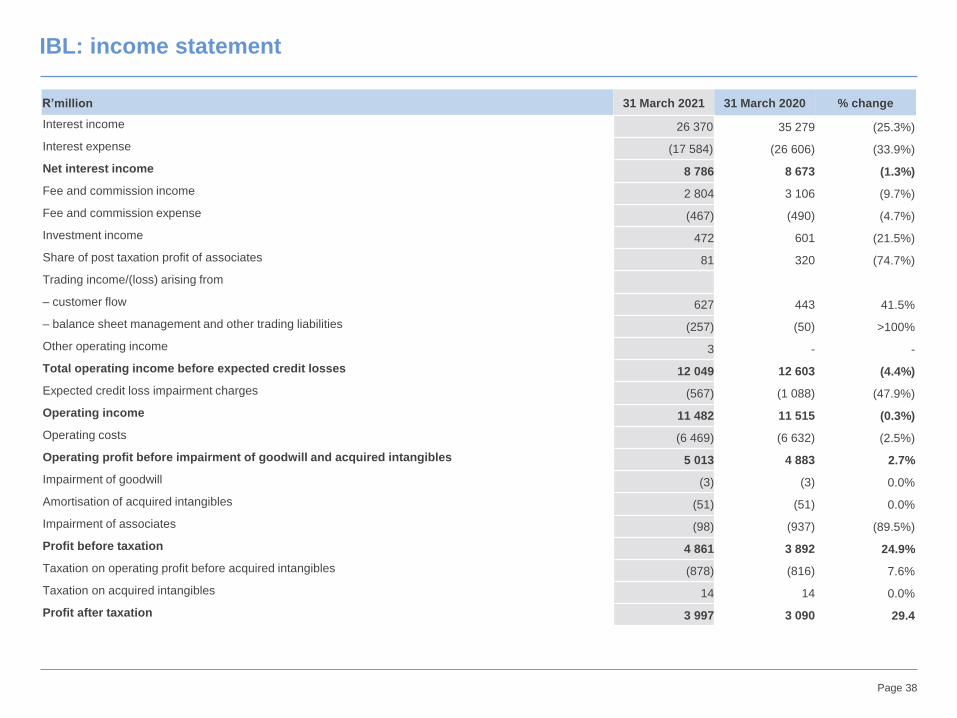
R’million 31 March 2021 31 March 2020 % change
Interest income 26 370 35 279 (25.3%)
Interest expense (17 584) (26 606) (33.9%)
Net interest income 8 786 8 673 (1.3%)
Fee and commission income 2 804 3 106 (9.7%)
Fee and commission expense (467) (490) (4.7%)
Investment income 472 601 (21.5%)
Share of post taxation profit of associates 81 320 (74.7%)
Trading income/(loss) arising from
– customer flow 627 443 41.5%
– balance sheet management and other trading liabilities (257) (50) >100%
Other operating income 3 - -
Total operating income before expected credit losses 12 049 12 603 (4.4%)
Expected credit loss impairment charges (567) (1 088) (47.9%)
Operating income 11 482 11 515 (0.3%)
Operating costs (6 469) (6 632) (2.5%)
Operating profit before impairment of goodwill and acquired intangibles 5 013 4 883 2.7%
Impairment of goodwill (3) (3) 0.0%
Amortisation of acquired intangibles (51) (51) 0.0%
Impairment of associates (98) (937) (89.5%)
Profit before taxation 4 861 3 892 24.9%
Taxation on operating profit before acquired intangibles (878) (816) 7.6%
Taxation on acquired intangibles 14 14 0.0%
Profit after taxation 3 997 3 090 29.4
IBL: income statement
Page 39
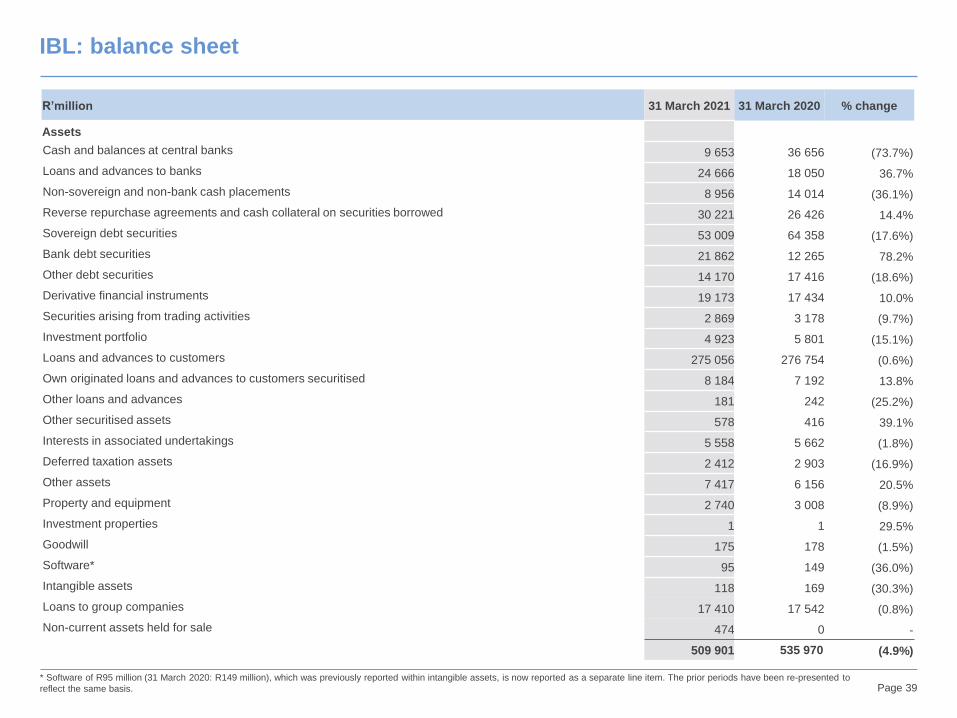
R’million 31 March 2021 31 March 2020 % change
Assets
Cash and balances at central banks 9 653 36 656 (73.7%)
Loans and advances to banks 24 666 18 050 36.7%
Non-sovereign and non-bank cash placements 8 956 14 014 (36.1%)
Reverse repurchase agreements and cash collateral on securities borrowed 30 221 26 426 14.4%
Sovereign debt securities 53 009 64 358 (17.6%)
Bank debt securities 21 862 12 265 78.2%
Other debt securities 14 170 17 416 (18.6%)
Derivative financial instruments 19 173 17 434 10.0%
Securities arising from trading activities 2 869 3 178 (9.7%)
Investment portfolio 4 923 5 801 (15.1%)
Loans and advances to customers 275 056 276 754 (0.6%)
Own originated loans and advances to customers securitised 8 184 7 192 13.8%
Other loans and advances 181 242 (25.2%)
Other securitised assets 578 416 39.1%
Interests in associated undertakings 5 558 5 662 (1.8%)
Deferred taxation assets 2 412 2 903 (16.9%)
Other assets 7 417 6 156 20.5%
Property and equipment 2 740 3 008 (8.9%)
Investment properties 1 1 29.5%
Goodwill 175 178 (1.5%)
Software* 95 149 (36.0%)
Intangible assets 118 169 (30.3%)
Loans to group companies 17 410 17 542 (0.8%)
Non-current assets held for sale 474 0 -
509 901 535 970 (4.9%)
IBL: balance sheet
* Software of R95 million (31 March 2020: R149 million), which was previously reported within intangible assets, is now reported as a separate line item. The prior periods have been re-presented to
reflect the same basis.

Page 40
R’million 31 March 2021 31 March 2020 % change
Liabilities
Deposits by banks 17 144 37 277 (54.0%)
Derivative financial instruments 23 011 22 097 4.1%
Other trading liabilities 3 388 4 521 (25.1%)
Repurchase agreements and cash collateral on securities lent 16 593 26 626 (37.7%)
Customer accounts (deposits) 374 369 375 948 (0.4%)
Debt securities in issue 2 126 3 258 (34.7%)
Liabilities arising on securitisation of own originated loans and advances 3 271 1 699 (92.5%)
Current taxation liabilities 684 315 117.1%
Deferred taxation liabilities 32 47 (31.9%)
Other liabilities 7 421 7 590 (2.2%)
Loans from group companies 1 972 2 807 (29.7%)
450 011 482 185 (6.7%)
Subordinated liabilities 12936 12 037 7.5%
462 947 494 222 (6.3%)
Equity
Ordinary share capital 32 32 0.0%
Share premium 14 250 14 250 0.0%
Other reserves 411 (787) >(100)%
Retained income 29 597 26 259 12.7%
Ordinary shareholder’s equity 44 290 39 754 11.4%
Perpetual preference shares in issue* 1 481 1 534 (3.5%)
Shareholder's equity excluding non-controlling interests 45 771 41 288 10.9%
Other Additional Tier 1 securities in issue 1183 460 >100%
Total equity 46 954 41 748 12.5%
Total liabilities and equity 509 901 535 970 (4.9%)
IBL: balance sheet (cont.)
* Perpetual preference share premium of R1 481 million (31 March 2020: R1 534 million), which was previously reported within share premium, is now reported within perpetual preference shares in
issue. The prior periods have been re-presented to reflect the same basis.
Page 41
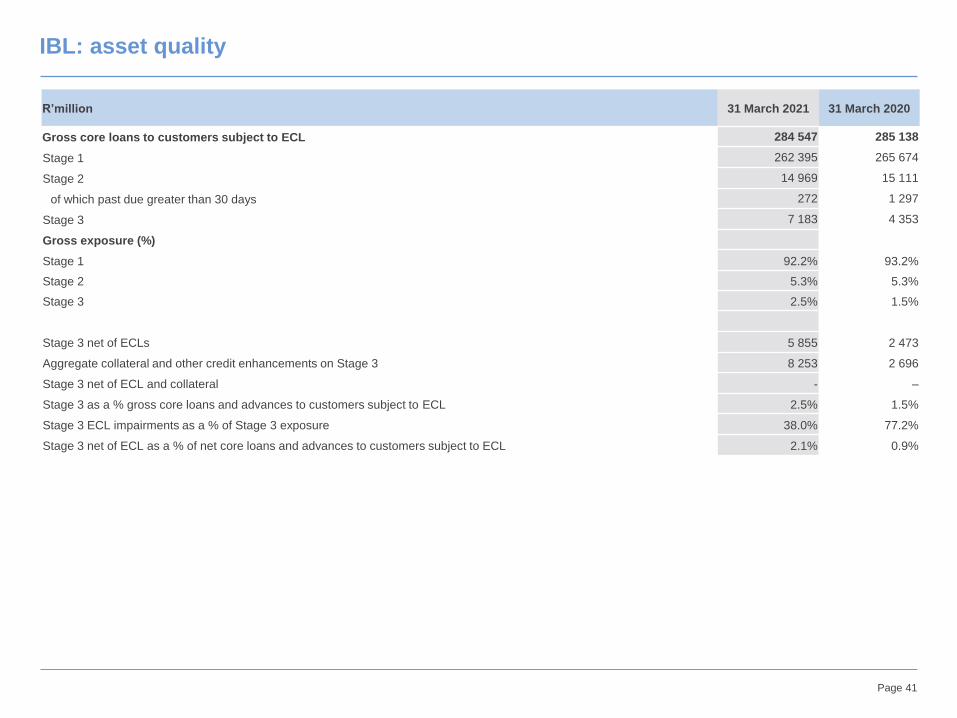
R’million 31 March 2021 31 March 2020
Gross core loans to customers subject to ECL 284 547 285 138
Stage 1 262 395 265 674
Stage 2 14 969 15 111
of which past due greater than 30 days 272 1 297
Stage 3 7 183 4 353
Gross exposure (%)
Stage 1 92.2% 93.2%
Stage 2 5.3% 5.3%
Stage 3 2.5% 1.5%
Stage 3 net of ECLs 5 855 2 473
Aggregate collateral and other credit enhancements on Stage 3 8 253 2 696
Stage 3 net of ECL and collateral - –
Stage 3 as a % gross core loans and advances to customers subject to ECL 2.5% 1.5%
Stage 3 ECL impairments as a % of Stage 3 exposure 38.0% 77.2%
Stage 3 net of ECL as a % of net core loans and advances to customers subject to ECL 2.1% 0.9%
IBL: asset quality
Page 42
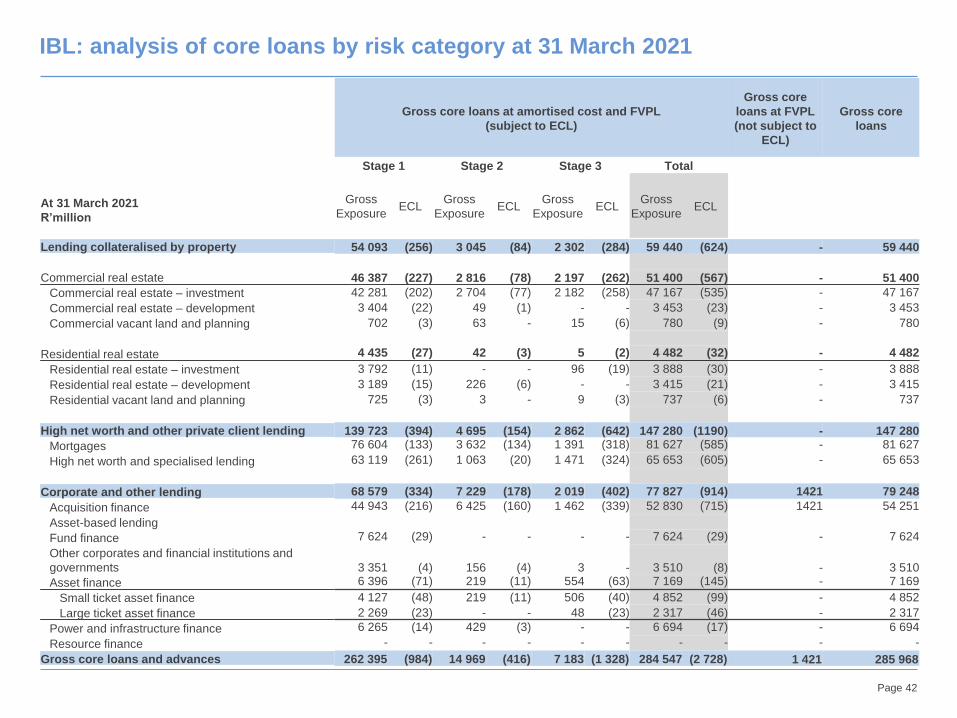
IBL: analysis of core loans by risk category at 31 March 2021
Gross core loans at amortised cost and FVPL
(subject to ECL)
Gross core
loans at FVPL
(not subject to
ECL)
Gross core
loans
Stage 1 Stage 2 Stage 3 Total
At 31 March 2021
R’million
Gross
ExposureECL
Gross
ExposureECL
Gross
ExposureECL
Gross
ExposureECL
Lending collateralised by property 54 093 (256) 3 045 (84) 2 302 (284) 59 440 (624) - 59 440
Commercial real estate 46 387 (227) 2 816 (78) 2 197 (262) 51 400 (567) - 51 400
Commercial real estate – investment 42 281 (202) 2 704 (77) 2 182 (258) 47 167 (535) - 47 167
Commercial real estate – development 3 404 (22) 49 (1) - - 3 453 (23) - 3 453
Commercial vacant land and planning 702 (3) 63 - 15 (6) 780 (9) - 780
Residential real estate 4 435 (27) 42 (3) 5 (2) 4 482 (32) - 4 482
Residential real estate – investment 3 792 (11) - - 96 (19) 3 888 (30) - 3 888
Residential real estate – development 3 189 (15) 226 (6) - - 3 415 (21) - 3 415
Residential vacant land and planning 725 (3) 3 - 9 (3) 737 (6) - 737
High net worth and other private client lending 139 723 (394) 4 695 (154) 2 862 (642) 147 280 (1190) - 147 280
Mortgages 76 604 (133) 3 632 (134) 1 391 (318) 81 627 (585) - 81 627
High net worth and specialised lending 63 119 (261) 1 063 (20) 1 471 (324) 65 653 (605) - 65 653
Corporate and other lending 68 579 (334) 7 229 (178) 2 019 (402) 77 827 (914) 1421 79 248
Acquisition finance 44 943 (216) 6 425 (160) 1 462 (339) 52 830 (715) 1421 54 251
Asset-based lending
Fund finance 7 624 (29) - - - - 7 624 (29) - 7 624
Other corporates and financial institutions and
governments 3 351 (4) 156 (4) 3 - 3 510 (8) - 3 510
Asset finance 6 396 (71) 219 (11) 554 (63) 7 169 (145) - 7 169
Small ticket asset finance 4 127 (48) 219 (11) 506 (40) 4 852 (99) - 4 852
Large ticket asset finance 2 269 (23) - - 48 (23) 2 317 (46) - 2 317
Power and infrastructure finance 6 265 (14) 429 (3) - - 6 694 (17) - 6 694
Resource finance - - - - - - - - - -
Gross core loans and advances 262 395 (984) 14 969 (416) 7 183 (1 328) 284 547 (2 728) 1 421 285 968
Page 43
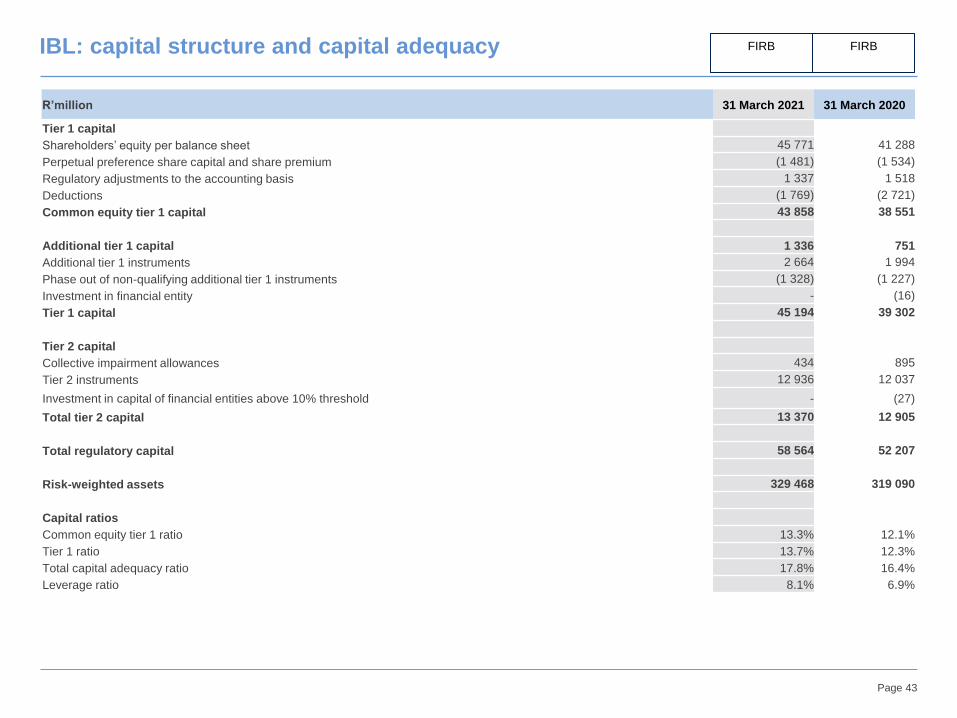
R’million 31 March 2021 31 March 2020
Tier 1 capital
Shareholders’ equity per balance sheet 45 771 41 288
Perpetual preference share capital and share premium (1 481) (1 534)
Regulatory adjustments to the accounting basis 1 337 1 518
Deductions (1 769) (2 721)
Common equity tier 1 capital 43 858 38 551
Additional tier 1 capital 1 336 751
Additional tier 1 instruments 2 664 1 994
Phase out of non-qualifying additional tier 1 instruments (1 328) (1 227)
Investment in financial entity - (16)
Tier 1 capital 45 194 39 302
Tier 2 capital
Collective impairment allowances 434 895
Tier 2 instruments 12 936 12 037
Investment in capital of financial entities above 10% threshold - (27)
Total tier 2 capital 13 370 12 905
Total regulatory capital 58 564 52 207
Risk-weighted assets 329 468 319 090
Capital ratios
Common equity tier 1 ratio 13.3% 12.1%
Tier 1 ratio 13.7% 12.3%
Total capital adequacy ratio 17.8% 16.4%
Leverage ratio 8.1% 6.9%
IBL: capital structure and capital adequacy FIRB FIRB
Page 44
Legal disclaimer
IMPORTANT NOTICE
THE INFORMATION, STATEMENTS AND OPINIONS CONTAINED IN THIS DOCUMENT DO NOT CONSTITUTE A PUBLIC OFFER UNDER
ANY APPLICABLE LEGISLATION OR AN OFFER TO SELL OR SOLICITATION OF ANY OFFER TO BUY ANY SECURITIES OR FINANCIAL
INSTRUMENTS OR ANY ADVICE OR RECOMMENDATION WITH RESPECT TO SUCH SECURITIES OR OTHER FINANCIAL INSTRUMENTS.
FORWARD-LOOKING STATEMENTS
THIS DOCUMENT CONTAINS CERTAIN FORWARD-LOOKING STATEMENTS WITHIN THE MEANING OF SECTION 21e OF THE US
SECURITIES EXCHANGE ACT OF 1934, AS AMENDED, AND SECTION 27a OF THE US SECURITIES ACT OF 1933, AS AMENDED, WITH
RESPECT TO CERTAIN OF THE GROUP’S’s PLANS AND ITS CURRENT GOALS AND EXPECTATIONS RELATING TO ITS FUTURE
FINANCIAL CONDITION AND PERFORMANCE. INVESTEC CAUTIONS READERS THAT NO FORWARD-LOOKING STATEMENT IS A
GUARANTEE OF FUTURE PERFORMANCE AND THAT ACTUAL RESULTS COULD DIFFER MATERIALLY FROM THOSE CONTAINED IN
THE FORWARD-LOOKING STATEMENTS. THESE FORWARD-LOOKING STATEMENTS CAN BE IDENTIFIED BY THE FACT THAT THEY DO
NOT RELATE ONLY TO HISTORICAL OR CURRENT FACTS. FORWARD-LOOKING STATEMENTS SOMETIMES USE WORDS SUCH AS
“may”, “will”, “seek”, “continue”, “aim”, “anticipate”, “target”, “expect”, “estimate”, “intend”, “plan”, “goal”, “believe” OR OTHER WORDS OF SIMILAR
MEANING. EXAMPLES OF FORWARD-LOOKING STATEMENTS INCLUDE, AMONG OTHERS, STATEMENTS REGARDING THE GROUP’S
FUTURE FINANCIAL POSITION, INCOME GROWTH, ASSETS, IMPAIRMENT CHARGES, BUSINESS STRATEGY, CAPITAL RATIOS,
LEVERAGE, PAYMENT OF DIVIDENDS, PROJECTED LEVELS OF GROWTH IN THE BANKING AND FINANCIAL MARKETS, PROJECTED
COSTS, ESTIMATES OF CAPITAL EXPENDITURES AND PLANS AND OBJECTIVES FOR FUTURE OPERATIONS AND OTHER
STATEMENTS THAT ARE NOT HISTORICAL FACT. BY THEIR NATURE, FORWARD-LOOKING STATEMENTS INVOLVE RISK AND
UNCERTAINTY BECAUSE THEY RELATE TO FUTURE EVENTS AND CIRCUMSTANCES, INCLUDING, BUT NOT LIMITED TO, UK
DOMESTIC, EUROZONE AND GLOBAL ECONOMIC AND BUSINESS CONDITIONS, THE EFFECTS OF CONTINUED VOLATILITY IN CREDIT
MARKETS, MARKET RELATED RISKS SUCH AS CHANGES IN INTEREST RATES AND EXCHANGE RATES, EFFECTS OF CHANGES IN
VALUATION OF CREDIT MARKET EXPOSURES, CHANGES IN VALUATION OF ISSUED NOTES, THE POLICIES AND ACTIONS OF
GOVERNMENTAL AND REGULATORY AUTHORITIES (INCLUDING REQUIREMENTS REGARDING CAPITAL AND GROUP STRUCTURES
AND THE POTENTIAL FOR ONE OR MORE COUNTRIES EXITING THE EURO), CHANGES IN LEGISLATION, THE FURTHER
DEVELOPMENT OF STANDARDS AND INTERPRETATIONS UNDER IFRS APPLICABLE TO PAST, CURRENT AND FUTURE PERIODS,
EVOLVING PRACTICES WITH REGARD TO THE INTERPRETATION AND APPLICATION OF STANDARDS UNDER IFRS, THE OUTCOME OF
CURRENT AND FUTURE LITIGATION, THE SUCCESS OF FUTURE ACQUISITIONS AND OTHER STRATEGIC TRANSACTIONS AND THE
IMPACT OF COMPETITION – A NUMBER OF SUCH FACTORS BEING BEYOND THE GROUP’S CONTROL. AS A RESULT, THE GROUP’S
ACTUAL FUTURE RESULTS MAY DIFFER MATERIALLY FROM THE PLANS, GOALS, AND EXPECTATIONS SET FORTH IN THE GROUP’S
FORWARD-LOOKING STATEMENTS.