Embed Size (px)
Citation preview

Investigating incentive strategies to increase employee engagement at an engineering services
entity
LP Pretorius
orcid.org 0000-0002-1871-068X
Mini-dissertation accepted in partial fulfilment of the
requirements for the degree Master in Business Administration at the North-West University
Supervisor: Prof RA Lotriet Graduation: June 2021 Student number: 22078576
NWU BUSINESS SCHOOL
Declaration Regarding Plagiarism
I (full names & surname): Lourens Petrus Pretorius
Student number: 22078576
Declare the following:
1. I understand what plagiarism entails and am aware of the University's policy in this
regard.
2. I declare that this assignment is my own, original work. Where someone else's work
was used (whether from a printed source, the internet or any other source) due
acknowledgement was given and reference was made according to departmental
requirements.
3. I did not copy and paste any information directly from an electronic source (e.g., a
web page, electronic journal article or CD ROM) into this document.
4. I did not make use of another student's previous work and submitted it as my own.
5. I did not allow and will not allow anyone to copy my work with the intention of
presenting it as his/her own work.
07/03/2021
Signature Date

- ii -
ABSTRACT
The feasibility of a points-based reward incentive scheme with game-like activities was
proposed in this study to increase employee engagement. This was done by investigating
conventional incentive and reward schemes. A unique incentive scheme aims to increase
the engagement and motivation at an engineering services entity. A literature review was
conducted to determine the various factors that influence employee motivation and
engagement and to what measure it affects employee performance. Management of
diversity was researched regarding the multigenerational workforce currently employed by
the company. The literature indicated that there is a positive relationship between employee
motivation, engagement and rewards in addition to their typical salary. The empirical
investigation confirmed through statistical analysis of the data obtained through a
questionnaire that the constructs listed in the literature indicated a positive relationship
between motivation and engagement. Thus, employees who are motivated in the workplace
tend to be more engaged. The respondents, on average, revealed that they would be willing
to participate in a corporate points-based reward scheme with game-like activities. In
addition, a reward scheme structure was subsequently proposed according to the needs of
the multigenerational workforce.
Keywords: motivation, engagement, generations, incentive schemes, gamification,
engineering service entity, reward scheme

- iii -
ACKNOWLEDGEMENTS
Firstly, I would like to thank my Heavenly Father for the strength and perseverance
throughout this study.
Secondly, to my loving parents and grandparents, thank you for all your support, love and
motivation throughout the study. Thank you for always believing in me and sacrificing so
much to make this study possible.
Thirdly, my wife, Marlene, thank you for all your love, support and keeping me motivated
throughout this study. Thank you for all the encouragement and patience.
Prof Ronnie, thank you for all your guidance and advice during this study and always willing
to assist after a long day.
Dr Erika Fourie, thank you very much for the statistical analysis and advice, thank you for
always providing me with a professional service.
To Mrs Antoinette Bisschoff, thank you for the professional service provided regarding my
linguistic correctness and technical acumen regarding this document.
Furthermore, I am truly grateful to my MBA group for the friendship that developed during
this study. The Blue Collars will always have a special place in my life.

- iv -
TABLE OF CONTENTS
NWU BUSINESS SCHOOL ................................................................................................ ii
ABSTRACT ........................................................................................................................ ii
ACKNOWLEDGEMENTS .................................................................................................. iii
LIST OF FIGURES ............................................................................................................ ix
LIST OF TABLES ............................................................................................................... x
APPENDICES ................................................................................................................... xi
LIST OF ACRONYMS ...................................................................................................... xii
1. CHAPTER 1: NATURE AND SCOPE OF THE STUDY .................................... 1
1.1 INTRODUCTION ............................................................................................... 1
1.2 BACKGROUND TO THE STUDY ..................................................................... 1
1.3 PROBLEM STATEMENT .................................................................................. 2
1.4 OBJECTIVES .................................................................................................... 3
1.4.1. Primary objective: .............................................................................................. 3
1.4.2. Secondary objectives: ....................................................................................... 3
1.5 SCOPE OF THE STUDY .................................................................................. 4
1.5.1. Delimitations (Scope) ........................................................................................ 4
1.6 RESEARCH METHODOLOGY ......................................................................... 4
1.6.1. Literature review................................................................................................ 4
1.6.2. Empirical investigation....................................................................................... 5
1.6.2.1. Research design ............................................................................................... 5
1.6.2.2. Target population .............................................................................................. 5
1.6.2.3. Sample type ...................................................................................................... 5
1.6.2.4. Data collection .................................................................................................. 6
1.6.2.5. Measuring instrument ........................................................................................ 6
1.6.2.6. Data analysis .................................................................................................... 7
1.7 ETHICAL CONSIDERATIONS .......................................................................... 8
1.8 SIGNIFICANCE OF THE STUDY ...................................................................... 8
1.9 CHAPTER LAYOUT .......................................................................................... 8
1.10 CHAPTER SUMMARY ...................................................................................... 9
2. CHAPTER 2: LITERATURE REVIEW ............................................................ 10
2.1 INTRODUCTION ............................................................................................. 10
2.2 EMPLOYEE MOTIVATION ............................................................................. 11

- v -
2.2.1 Background ..................................................................................................... 11
2.2.2 Intrinsic motivation .......................................................................................... 12
2.2.3 Extrinsic motivation ......................................................................................... 12
2.2.4 Self-Determination Theory .............................................................................. 13
2.2.5 Employee motivation in context ....................................................................... 15
2.3 WORK ENGAGEMENT ................................................................................... 16
2.3.1 Background ..................................................................................................... 16
2.3.2 Categories of employee engagement .............................................................. 17
2.3.2.1 Engaged.......................................................................................................... 17
2.3.2.2 Not engaged ................................................................................................... 17
2.3.2.3 Disengaged ..................................................................................................... 17
2.3.3 Measuring employee engagement .................................................................. 17
2.3.4 Employee engagement in context ................................................................... 19
2.4 STRATEGIES THAT IMPACT MOTIVATION AND ENGAGEMENT ............... 20
2.4.1 Conventional incentive strategies .................................................................... 20
2.4.1.1 Reward systems .............................................................................................. 20
2.4.1.2 Monetary vs non-monetary incentives ............................................................. 21
2.4.1.3 Conventional monetary incentives ................................................................... 22
2.4.2 Alternative incentive strategies ........................................................................ 23
2.4.2.1 Loyalty programs ............................................................................................. 23
2.4.2.2 Gamification .................................................................................................... 24
2.4.2.3 Other methods of employee incentives (rewards)............................................ 25
2.4.3 Incentive strategies in context ......................................................................... 25
2.5 MULTIGENERATIONAL WORKFORCE ......................................................... 26
2.5.1 Background ..................................................................................................... 26
2.5.2 Millennials ....................................................................................................... 27
2.5.3 Generation X ................................................................................................... 27
2.5.4 Baby Boomers ................................................................................................ 27
2.5.5 Multigenerational workforce in context ............................................................ 28
2.6 CHAPTER SUMMARY .................................................................................... 28
3. CHAPTER 3: RESEARCH METHODOLOGY ................................................. 29
3.1 INTRODUCTION ............................................................................................. 29
3.2 RESEARCH APPROACH ............................................................................... 29
3.3 RESEARCH PHILOSOPHY ............................................................................ 29

- vi -
3.4 RESEARCH DESIGN...................................................................................... 30
3.4.1 Population and sample .................................................................................... 30
3.4.2 Data quality ..................................................................................................... 31
3.4.2.1 Validity of quantitative data ............................................................................. 31
3.4.2.2 Reliability of quantitative data .......................................................................... 31
3.4.3 Measuring instrument ...................................................................................... 32
3.4.3.1 Biographical information .................................................................................. 32
3.4.3.2 Work Extrinsic and Intrinsic Motivation Scale (WEIMS) ................................... 33
3.4.3.3 Utrecht Work Engagement Scale (UWES) ...................................................... 34
3.4.3.4 Employee incentive preference ....................................................................... 35
3.5 EMPIRICAL STUDY PROCEDURE ................................................................ 36
3.5.1 Initial arrangements ......................................................................................... 36
3.5.2 Ethical considerations ..................................................................................... 36
3.5.3 Administration of the questionnaire ................................................................. 36
3.5.4 Data capturing and feedback........................................................................... 37
3.6 STATISTICAL ANALYSIS ............................................................................... 37
3.6.1 Descriptive statistics ........................................................................................ 37
3.6.2 Inferential statistics .......................................................................................... 37
3.7 CHAPTER SUMMARY .................................................................................... 38
4. CHAPTER 4: EMPIRICAL INVESTIGATION .................................................. 39
4.1 INTRODUCTION ............................................................................................. 39
4.2 MEASURING INSTRUMENT .......................................................................... 39
4.3 RESPONSE RATE .......................................................................................... 40
4.4 SECTION A: DEMOGRAPHICAL INFORMATION .......................................... 40
4.4.1 Age of respondents ......................................................................................... 40
4.4.2 Duration of employment .................................................................................. 41
4.4.3 Qualification of respondents ............................................................................ 42
4.4.4 Respective departments of respondents ......................................................... 43
4.5 EVALUATION OF DATA QUALITY ................................................................. 45
4.5.1 Evaluation of reliability..................................................................................... 45
4.6 DESCRIPTIVE STATISTICS ........................................................................... 46
4.6.1 Section B: Employee motivation ...................................................................... 46
4.6.2 Section C: Employee engagement .................................................................. 50
4.6.3 Section D: Incentive strategy ........................................................................... 52

- vii -
4.6.3.1 Point-based reward scheme ............................................................................ 52
4.6.3.2 Gamification .................................................................................................... 54
4.6.4 Summary of descriptive statistics .................................................................... 55
4.7 INFERENTIAL STATISTICS ........................................................................... 56
4.7.1 Differences between means ............................................................................ 56
4.7.1.1 Effect size between motivation and employee age .......................................... 56
4.7.1.2 Effect size between engagement and employee age ...................................... 57
4.7.2 Spearman’s rho correlation ............................................................................. 58
4.7.2.1 Relationship between the types of motivation and those who are part of a
reward scheme................................................................................................ 58
4.7.2.2 Relationship between the types of motivation and those willing to be part of a
corporate reward scheme ................................................................................ 59
4.7.2.3 Relationship between the types of motivation and those willing to be part of a
Gamification strategy ...................................................................................... 60
4.7.3 Structure of the incentive strategy ................................................................... 60
4.7.4 Summary of inferential statistics ...................................................................... 61
4.8 CHAPTER SUMMARY .................................................................................... 63
5. CHAPTER 5: CONCLUSIONS AND RECOMMENDATIONS ......................... 64
5.1 INTRODUCTION ............................................................................................. 64
5.2 MAIN FINDINGS FROM THE STUDY ............................................................. 64
5.2.1 Demographical information ............................................................................. 64
5.2.2 Employee motivation ....................................................................................... 65
5.2.3 Employee engagement ................................................................................... 66
5.2.4 Employee incentives ....................................................................................... 66
5.2.5 Findings regarding the study framework .......................................................... 67
5.3 EVALUATION OF THE STUDY ...................................................................... 68
5.3.1 Primary objective ............................................................................................. 68
5.3.2 Secondary objectives ...................................................................................... 69
5.4 LIMITATIONS OF THE STUDY ....................................................................... 72
5.5 RECOMMENDATIONS ................................................................................... 73
5.5.1 Recommendations for the organisation ........................................................... 73
5.5.2 Recommendations for future research ............................................................ 74
5.6 CHAPTER SUMMARY .................................................................................... 75
LIST OF REFERENCES .................................................................................................. 76

- viii -
APPENDIXES .................................................................................................................. 88

- ix -
LIST OF FIGURES
Figure 2.1: Conceptual framework .................................................................................... 10
Figure 2.2: Self-Determination Continuum (adapted from Ryan and Deci, (2000)) ........... 14
Figure 4.1: Respondents by age (generation) ................................................................... 41
Figure 4.2: Respondents duration of employment ............................................................ 42
Figure 4.3: Qualifications of respondents.......................................................................... 43
Figure 4.4: Respective employee departments ................................................................. 44
Figure 4.5: Mean values of the WEIMS ............................................................................ 47
Figure 4.6: Mean values of the UWES .............................................................................. 50
Figure 4.7: Preferred incentive methods ........................................................................... 54
Figure 5.1: Study framework............................................................................................. 67

- x -
LIST OF TABLES
Table 2.1: Workforce age breakdown according to Stats SA (Adapted from Stats SA, 2020)
........................................................................................................................ 26
Table 3.1: WEIMS subscales and related questions (Tremblay et al., 2009) .................... 33
Table 3.2: Alpha Coefficients ............................................................................................ 34
Table 3.3: UWES subscales and related questions .......................................................... 35
Table 4.1: Respective employee departments .................................................................. 44
Table 4.2: Reliability of measuring instruments ................................................................ 45
Table 4.3: Mean values of the WEIMS ............................................................................. 46
Table 4.4: Sample group motivation index ........................................................................ 48
Table 4.5: Results of the WEIMS ...................................................................................... 49
Table 4.6: Mean values of the UWES ............................................................................... 50
Table 4.7: Results of the UWES ....................................................................................... 51
Table 4.8: Respondents who actively try to reach their goals ........................................... 52
Table 4.9: Respondent's willingness to participate in a corporate reward scheme ............ 53
Table 4.10: Preferred incentive methods .......................................................................... 53
Table 4.11: Gamification ................................................................................................... 55
Table 4.12: Effect size between motivation and employee age ......................................... 57
Table 4.13: Effect size between engagement and employee age ..................................... 57
Table 4.14: Correlation between engagement and the motivation index ........................... 58
Table 4.15: Correlation between motivation and those who are part of a reward scheme. 59
Table 4.16: Correlation between motivation and those willing to be part of a corporate reward
scheme ............................................................................................................ 59
Table 4.17: Correlation between motivation and those willing to partake in Gamification . 60
Table 4.18: Age effect on rewards preference .................................................................. 61

- xi -
APPENDICES
APPENDIX A: Participant consent letter ........................................................................... 89
APPENDIX B: Company consent letter ............................................................................ 92
APPENDIX C: Data collection instrument(-s) permission letter ......................................... 94
APPENDIX D: Data collection instrument(-s) .................................................................... 96
APPENDIX E: Statistical Analysis................................................................................... 102
APPENDIX F: Ethics Number ............................................................................. ……….104
APPENDIX G: Language Editing .................................................................................... 106

- xii -
LIST OF ACRONYMS
GWA Gallup Workplace Audit
HR Human Resources
KPI Key Performance Indicators
SCS Statistic Consultation Services
SDT Self-Determination Theory
UWES Utrecht Work Engagement Scale
WEIMS Work Extrinsic and Intrinsic Motivation Scale
W-SDI Self-determination index

- 1 -
1. CHAPTER 1: NATURE AND SCOPE OF THE STUDY
1.1 INTRODUCTION
This study focuses on employee motivation and engagement and investigates whether
incentive strategies like Gamification and a points-based reward scheme would be feasible
within an organisation. This chapter describes the background to the study and the problem
statement. The research objectives will be listed, and subsequently, the research
methodology proposed to achieve the objectives set.
1.2 BACKGROUND TO THE STUDY
The business environment is currently operating in a competitive modern era where factors
such as advanced technologies, globalisation, various types of industries with upcoming
competitors are dealt with regularly. To maintain a competitive advantage, minimise
employee turnover and improve profitability, employees in an organisation must remain
motivated, engaged and creative (De Vito et al., 2018; Singh, 2016).
Motivation can be described as the mental willpower, behaviour and determination of an
employee when faced with obstacles in the workplace with specific objectives (Abner &
Samuel, 2019). There is an increasing trend in employees that are uninterested, with low
motivational levels and conducting personal work during working hours (Casimir, 2020).
Management and leadership will be responsible for encouraging the employees by creating
a positive and productive work environment, as well as to strategise on new innovative ideas
to sustain high motivational levels (De Vito et al., 2018).
There may be a way to motivate the workforce to do more than what is asked through
alternative incentive strategies such as a points-based reward program and Gamification
over the conventional methods for example, commission, leave, training, promotions and
acknowledgement. This study will focus on non-conventional alternative ways to incentivise
employees to motivate them to obtain additional business opportunities. The company that
will be investigated in this study operates predominately as a sales and engineering services
unit within Southern Africa and has a strong footprint in the engineering, automotive, mining,
food and beverage and paper sectors. The business growth is predominantly dependent on
the sales team and customer services to obtain new opportunities and maintain current
clients.

- 2 -
The current incentive scheme of the organisation comprises an annual bonus which is
constructed as follow:
• 50% based on group-level performance
• 25% based on local business unit performance
• 25% based on employee performance
Depending on the employee’s position within the company, their annual bonus will range
from 15% to 25% of their annual basic salary. This, however, means that the difference
between employees who achieve their performance goals and those who do not, essentially
receive the same amount of bonus each year. This can be very unmotivating to some
employees who try their utmost best to achieve their goals.
1.3 PROBLEM STATEMENT
From the preceding background, it is evident that sufficient employee motivation and
retention is critical to success in the modern age of business strategies (Aguenza & Som,
2012). To avoid low employee motivation and engagement, companies should investigate
alternative approaches to motivate employees by utilising non-conventional incentive
strategies over conventional methods. Conventional methods can include but are not limited
to, the following: annual bonus and leave, health benefits and company discount (Cerasoli
et al., 2014).
Employee rewards are a crucial part of any organisation, and human performance could be
improved through motivation (Muogbo, 2013). The reward system of a company will
influence both the employer and the employee and should be updated and continuously
improved. The preferred reward of an employee can change from day-to-day according to
the needs of the employee. For example, additional renumeration could be preferable in one
month, while additional leave is preferred the next month (Chintalloo & Mahadeo, 2013).
There may be a way that organisations can continuously motivate employees through
alternative methods, rather than commission or additional company discount to keep them
continually motivated. For example, loyalty programs are primarily aimed towards economic
benefits utilising points that can be redeemed by clients of the service (Hamari & Koivisto,
2015). Gamification is a new trend that indicated that people are more engaged in their
activities when exposed to a game-like environment (Ergle, 2015). There is also evidence

- 3 -
that Gamification has excellent potential to increase intrinsic needs of an employee and
when strategically aligned with employee motivation, can increase day-to-day employee
engagement (Perryer et al., 2016; Xi & Hamari, 2019).
Therefore, this study will investigate whether a points-based rewards scheme with game-
like activities will be feasible within an engineering services entity to increase employee
engagement and motivation.
1.4 OBJECTIVES
The research objectives related to this study are divided into primary and secondary
objectives.
1.4.1. Primary objective:
The primary objective of this study is to ascertain whether a points-based reward incentive
scheme with game-like activities would be feasible within the company investigated to
encourage employees to be more engaged and motivated in their daily objectives.
1.4.2. Secondary objectives:
To achieve the primary objective, the following secondary objectives were derived.
• To determine the current motivational and engagement levels within the company.
• To investigate the relationship between employee engagement and motivation.
• To investigate reward schemes and Gamification as incentive strategies based on the
literature.
• To determine whether the company would be open to a corporate reward scheme and
Gamification.
• To investigate reward preferences according to employee age.
• To determine the relationship between employee motivation levels and participants who
actively try and meet their goals with reward schemes like Vitality and eBucks?
• To propose a feasible points-based reward scheme with game-like activities.

- 4 -
1.5 SCOPE OF THE STUDY
This study aims to determine whether a points-based reward incentive scheme with game-
like work activities will be feasible within a South African engineering services entity. This
could aid in improved employee engagement and motivation within the company and
subsequently, employee performance.
1.5.1. Delimitations (Scope)
The study will be limited to the current staff of the company regarding the South African
operations. Their objective opinions regarding their current motivation, engagement and
incentive preferences will be required for this study. The study will also be limited to a points-
based reward scheme, Gamification and conventional incentive strategies found in the
literature and practised by the company.
1.6 RESEARCH METHODOLOGY
This section will contain the methodology that will be followed to conduct this research study
and will mainly consist of two sections namely a literature overview regarding previous
research and an empirical study.
1.6.1. Literature review
A comprehensive literature review of this study was conducted using relevant academic
journals, articles, thesis and books. The university librarian conducted a complete database
search to obtain previous research on the relevant topic. The literature was further obtained
by also consulting the following databases:
• EbscoHost: International journals on Academic Search Premier
• ProQuest: International dissertations in full text
• ScienceDirect: Peer-reviewed articles
• Internet: Google Scholar

- 5 -
1.6.2. Empirical investigation
1.6.2.1. Research design
This study aimed to determine whether a points-based reward scheme with game-like
activities would be a feasible incentive strategy over the current incentive scheme to
motivate employees to be more engaged in their work activities. A quantitative approach will
be followed in this study. It can be defined as the process of conducting a study that starts
with an idea or research questions/objectives that would later be evaluated using a set of
structured questionnaires (Choy, 2014). A survey was utilised at a single point in time to
obtain the data from the employees. This method of study conforms to the definition of
descriptive cross-sectional research design (Aggarwal & Ranganathan, 2019).
The conclusions drawn from the study were used to propose an incentive strategy to the
company to motivate and engage the employees, and in turn, this strategy also boosts
employee performance. However, because of the narrow scope of this study,
generalisations were not inferred to operationalise the results to a wider audience.
1.6.2.2. Target population
The study will be limited to the current employees of the company in question. The study
population will include the employees over all the business units in the company, including
finance, engineering, customer services, Human Resources (HR) and field services.
All the participants were briefed on the study’s purpose. They were assured that the results
will remain anonymous, whereafter they were requested to complete the questionnaire
honestly. They were also required to complete a consent form to adhere to the ethical
requirements for this investigation.
1.6.2.3. Sample type
In this study, a convenience sample type will be used to obtain the required data from the
participants. A convenience sample includes participants that are the most accessible; this
method will not be able to produce generalisable results (McCombes, 2020).
The target sample was all the employees working for the company in South Africa over all
business units. The company has approximately 219 employees in sub-Saharan Africa,
including Zambia and Mozambique. Only South African employees were targeted, and the

- 6 -
sample ranged from professional to semi-skilled employees. The sample was targeted to
participate via an online questionnaire.
1.6.2.4. Data collection
The study was mainly focused on a quantitative point of view, and it was predominantly be
collected using a dichotomous scale in the form of "yes" and "no" and a 7-point Likert rating
scale questionnaire as follow:
• 1 (Very Strongly Disagree)
• 2 (Strongly Disagree)
• 3 (Disagree)
• 4 (Neither)
• 5 (Agree)
• 6 (Strongly Agree)
• 7 (Very Strongly Agree)
All the respondents were required to complete the same questionnaire. The data was
collected using an online questionnaire tool (SurveyMonkey) and emailed to the participants
to participate.
1.6.2.5. Measuring instrument
Validity and reliability
Validity and reliability are two crucial factors when evaluating measuring instruments of a
study. Validity can be defined as to what degree a concept is accurately measured in a
quantitative study (Leung, 2015). For example, a study intended to measure employee
ethics that measures motivation would not be valid. Reliability can be defined as the
repeatability of the study; in other words, how consistent are the results of the study
(Taherdoost, 2016). When employee motivation is measured in a survey, it should return a
degree of consistent results when repeated. Reliability is measured using Cronbach's alpha
coefficient and is the most widely used method (Bonett & Wright, 2015). The Cronbach's
alpha coefficient should, however, be a minimum of .70 (Taherdoost, 2016). For this study,
no pilot study was conducted to verify the measuring instruments as the entire population
will be targeted and previously validated questionnaires used.

- 7 -
Measuring instrument
In this empirical investigation, a total of three questionnaires were used to determine the
feasibility of a corporate reward scheme with game-like activities. Firstly, the population
demographics were obtained in the first section that will include the participant's age group,
education, years of employment and department within the company. This information was
used to profile the respondents without asking for sensitive information. The respondent
profiles were used to identify the opportunities within the company.
The following three questionnaires were used to determine the current motivation and
engagement levels within the company and also to determine the preferred incentive
methods to propose a feasible strategy.
• The first questionnaire measured motivational work levels and developed by
Tremblay et al. The scale is divided into six sub-levels of motivation, namely, Intrinsic
Motivation, Integrated Regulations, Identified Regulations, Introjected Regulations,
External Regulations, and Amotivation (Tremblay et al., 2009). The scale consists out
of 18 questions is scored from 1 to 7 from very strongly disagree to very strongly
agree.
• The second questionnaire used in this study is the Utrecht Work Engagement Scale
(UWES), which measured the work engagement levels of the participants (Seppälä
et al., 2009). This scale is divided into three dimensions, namely, Dedication, Vigour
and Absorption. A total of 17 questions is used to measure the three dimensions and
is scored from 1 to 7 from very strongly disagree to very strongly agree.
• The third questionnaire measured the preferred incentive methods and likelihood to
participate in alternative methods to justify the feasibility for a corporate reward
scheme with game-like activities.
1.6.2.6. Data analysis
The Statistic Consultation Service (SCS) of North-West University was consulted to analyse
the quantitative data obtained from the questionnaires. This was done using statistical
software programs, for example, IBM SPSS 26 or SAS. The results were interpreted in detail
to draw conclusions for the study (Heale & Twycross, 2015). Descriptive and inferential
statistics were used to determine the effect and correlation between the constructs of the
questionnaire.
- 8 -
1.7 ETHICAL CONSIDERATIONS
The ethical factors regarding this study were assessed, and the participants and company
involved in this study will remain anonymous. The questionnaire will be distributed to the
participants via email link to the Google forms or SurveyMonkey site where they would
complete the questions. Nature and objectives will be well explained in the email body and
assured that they would remain anonymous.
1.8 SIGNIFICANCE OF THE STUDY
The outcome of this study will indicate whether it is beneficial for organisations to motivate
their employees using a points-based reward scheme with game-like activities that do not
necessarily include any monetary value. This could enable companies to motivate
employees and simultaneously grow business opportunities. The employees could be
incentivised according to their preference and needs as a result of their additional efforts.
The employee turnover could also reduce as a result of more engaged employees, and
overall morale would increase in the workplace. A points-based reward scheme would also
allow employees to be continuously reviewed instead of once per annum.
1.9 CHAPTER LAYOUT
The study comprises the following chapters.
Chapter 1: Nature and scope of the study This chapter describes the introduction, a brief research background, research objectives
(primary and secondary) as well as the scope of the study.
Chapter 2: Literature review This chapter describes all the relevant fields of literature required to conduct this study. Chapter 3: Research methodology Chapter 3 describes the research methodology used to obtain the required results from the
study. Aspects of the research design include the measuring instruments, data analysis and
procedures.

- 9 -
Chapter 4: Empirical investigation
This chapter will contain the results and discussions regarding the outcome of the study.
Chapter 5: Conclusion and recommendations This chapter contains the conclusions reached from the empirical study and any
recommendations regarding the study outcome to the company management team and
future research.
1.10 CHAPTER SUMMARY
This chapter provided the necessary introduction, background, problem statement and
research method to be utilised in this study. The following chapter will contain the literature
review regarding employee motivation and engagement and how incentives schemes could
improve employee performance.

- 10 -
2. CHAPTER 2: LITERATURE REVIEW
2.1 INTRODUCTION
The purpose of the literature review is to examine previous research conducted regarding
the key concepts used in this study. The review firstly examines employee motivation and
the relevant factors involved. The Work Extrinsic and Intrinsic Motivation Scale (WEIMS)
developed by Trembley is used in this study to determine the motivational levels of the
participants in an engineering entity. Secondly, the various factors regarding employee
engagement are discussed, and the importance of highly engaged personnel, the Utrecht
Work Engagement Scale (UWES) are used to determine the current engagement factors of
the sample population. Thirdly, conventional and alternative incentive strategies are
examined as the core focus of this study. The main focus is to determine whether a points-
based reward scheme with game-like activities could be used to increase employee
motivation and engagement. Lastly, the multigenerational workforce is examined to
determine the motivational and engagement factors regarding the three largest generations
within the current workforce. This includes the younger Millennial generation, the older
Generation X and the retiring Baby Boomers. The following Figure indicates the conceptual
framework of the study.
(Source: Own compilation)
Figure 2.1: Conceptual framework
Extrinsic
Motivation
Employee
performance
Employee
Motivation
Employee
Engagement
Intrinsic
Motivation
Incentive
Strategy

- 11 -
2.2 EMPLOYEE MOTIVATION
In any business environment, employee motivation can be considered crucial to the success
and performance of any organisation, being either public or private, large or small and have
a direct impact on employee performance (Abbah, 2014; Abner & Samuel, 2019;
Ogbonnaya et al., 2017). Therefore, it is crucial for organisations and its managing members
to fully understand what drives and motivates their employees if they wish to maximise
organisational performance (Lee & Raschke, 2016).
2.2.1 Background
In the literature, different variations that define motivation could be found. The main factors
identified established that motivation as a vital driving force that engages individuals in any
activity as well as the associated commitment, energy and creativity levels (Maduka &
Okafor, 2014; Robescu & Lancu, 2016; Shahzadi et al., 2014; Singh, 2016).
Early motivational theories date back to the mid-20th century with the most popular one being
the Hierarchy of Needs developed by Abraham Maslow. His theory of needs identified the
factors that motivate individuals and presented them in a hierarchy form. The theory
primarily suggests that one must first meet the basic level needs such as food and shelter
before moving to the higher-level needs such as creativity, love and morality (Kanfer & Chen,
2016).
A more recent and relevant motivational theory to this study was proposed by Edward Deci
and Richard Ryan in the 1970s and is known as the Self-Determination Theory (SDT). This
primarily focuses on the choices one makes and examines the degree to which human
behaviour is self-determined and self-motivated. Within this theory, it states that elevated
motivational levels would be obtained when an individual achieves the need for autonomy,
competence and relatedness (Vasconcellos et al., 2020).
Since the SDT applies to actions that individuals find pleasing, stimulating and exciting,
activities that do not include these factors would result in low motivation and would not likely
be performed optimally unless there is some form of extrinsic reason involved. Work
activities can often fall outside this framework and would require extrinsic motivational
factors (Tremblay et al., 2009). Unmotivated employees would likely spend little to no effort

- 12 -
to achieve their work objectives, provide substandard work quality and prone to change jobs
that would result in increased employee turnover (Ganta, 2014).
On the contrary, extremely motivated employees will result in higher employee performance,
increase work quality and willing to be more engaged in their work environment. The
literature indicated that motivation could be considered a critical aspect regarding employee
performance, and studies have shown that employee motivation directly impacts
organisational productivity and growth (Kiradoo, 2014). Humans require some form of
motivation or inspiration to achieve organisational or personal goals (Parijat & Bagga, 2014).
These goals can be achieved through intrinsic or extrinsic motivation and have become a
very debatable topic amongst researchers and employers to find the optimal way to motivate
their employees to perform well in their workplace.
The following section will describe the internal and external motivational factors in more
detail.
2.2.2 Intrinsic motivation
Intrinsic motivation can simply be described as inspirations that come from within. It can also
be referred to as actions that bring purposeful and personal enjoyment to one's self and
provide enough reason to persist with the associated action (Cerasoli et al., 2014; Ganta,
2014). Intrinsic motivation can also be considered as mainly internal and not associated with
any external goals (Hamari & Koivisto, 2015).
It was found in the literature by Singh (2016) that people who are motivated intrinsically are
more driven to perform actions than people who are motivated extrinsically. Ganta (2014)
has indicated that intrinsic motivation plays a crucial part in any organisation and a critical
factor in innovation and employee performance.
2.2.3 Extrinsic motivation
Extrinsic motivation can be referred to as external factors that influence individuals from the
outside (Ganta, 2014; Hamari & Koivisto, 2015; Robescu & Iancu, 2016). A lot of external
motivators have been identified in the literature such as work promotion, competition,
material achievements, recognition and monetary rewards. These factors only encourage
employees to work harder due to the compensation they could receive from performing at

- 13 -
their work duties. Additional factors were also listed as extrinsic motivators, such as career
advancement and job security (Singh, 2016).
2.2.4 Self-Determination Theory
As discussed previously, this theory suggests that humans require the following three basic
psychological needs to sustain interest, development and wellbeing (Ryan & Deci, 2017):
• Autonomy
Autonomy relates to the need to self-regulate one's experiences and actions. When
acting with autonomy, behaviours are engaged wholeheartedly, and an individual will
experience the freedom of choice during task performance.
• Competence
Competence refers to the intrinsic feeling or desire to be effective and successful in
one's work without feeling inferior in terms of effectiveness (Mills & Allen, 2020).
• Relatedness
Relatedness, on the other hand, refers to an individual's need to feel a sense of
connectedness with others and feelings of belonging within a group of people (Butz
& Stupnisky, 2017).
Figure 2.2 below describes the SDT as a continuum as proposed by Ryan & Deci (2000),
where Amotivation (AMO) and intrinsic motivation are the two extremes. Tremblay et al.
(2009) also noted from the theory that the continuum should not be seen as developmental,
where individuals continuously progress through the various stages. Instead, a new
behaviour may be internalised along the continuum at any point depending on organisational
factors and previous experiences.

- 14 -
Figure 2.2: Self-Determination Continuum (adapted from Ryan and Deci, (2000))
The SDT differentiates between intrinsic motivation and extrinsic motivation, and different
types of extrinsic motivational levels are controlled by external factors (Ryan & Deci, 2017).
At the low end of the continuum, Amotivation refers to an individual's lack of desire to engage
in an activity and can be described in simple terms as the absence of any intrinsic and
extrinsic motivation (Mills & Allen, 2020). In the centre, lies the extrinsic motivational factors
that range from the lowest self-determination stage to the highest. With the first being
External Regulation (ER), and can be described as where individuals perform activities
purely to obtain a reward (Legault, 2016). The second, Introjected Regulation (INTRO),
refers to the behaviour of internal pressure, in other words, behaviour through contingencies
of self-worth, for example, self-esteem or guilt (Tremblay et al., 2009). The third stage,
Identified Regulation (IDEN) refers to the act of engaging in activities due to the nature,
meaning and value of the activity that can be seen as one's own (Legault, 2016). Finally, the
last stage, integrated regulation (INTEG) refers to employees that engage/identify with
activities to the extent of one's self-identity (Mills & Allen, 2020). The last stage of the
continuum includes intrinsic motivation where individuals or employees perform activities
due to the inherently enjoyable and satisfying nature of the act (Vasconcellos et al., 2020).
Ultimately, with each progressive stage along the continuum, employees will experience
increasing levels of ownership and personal acceptance. This will range from the lower self-
determined levels (Amotivation) to the more self-determined (intrinsic) motivational levels
and would result in good employee performance and wellbeing (MacIntyre et al., 2018).
- 15 -
Most researchers prefer to use a single score to determine the motivation levels of
employees. This can be described by the self-determination index (W-SDI) (Tremblay et al.,
2009). This score can be useful to identify individuals based on where they are along the
continuum of the SDT.
2.2.5 Employee motivation in context
According to the expectancy theory, employees would be more motivated when they believe
that their work efforts will result in desired rewards and positive outcomes (De Vito et al.,
2018). This study aims to investigate reward strategies to obtain a higher motivated
workforce. Literature has shown that reward systems consist of both intrinsic and extrinsic
reward factors needed for optimal employee performance (Hassan & Ndegwa, 2019).
Reward systems and motivation has been a popular research topic and a concern for
organisations in the uncertain business environment, especially to retain talented
employees (Riaz et al., 2018). Riaz et al., (2018) also found in their study that there exists a
strong relationship between employee motivation, performance and reward systems. Thus,
reward systems would incorporate both intrinsic and extrinsic rewards that will address the
psychological needs of employees. This would be achieved using financial rewards such as
salary and commission as well as non-financial rewards such as flexible working hours,
recognition and promotion (Hassan & Ndegwa, 2019; Riaz et al., 2018).
Based on the literature, employees that experience motivation more towards the right side
of the SDT continuum (autonomous) will result in higher motivational levels and tend to
perform better in the working environment. To ensure that employees experience the
required motivation, organisations could adopt various strategies to obtain the necessary
results. As discussed previously, intrinsic motivation can be obtained by working activities
that are fun, interesting and challenging. When these feelings are not obtained, incentive
contingencies could aid extrinsic motivation (Legault, 2016). However, organisations should
be aware that each employee has their own specific needs and requirements and factors
such as gender, age group, education and duration of employment would impact the level
of motivation (Shahzadi et al., 2014). Employee engagement also plays a crucial role in the
performance of employees. The following section will summarise the concepts found in the
literature regarding employee engagement.
- 16 -
2.3 WORK ENGAGEMENT
In the literature, different researchers have defined employee engagement in various ways.
However, the term can be defined as an employee who can be seen as an ambassador of
the company, one who consistently produces results and driven in their work (Chandani et
al., 2016).
2.3.1 Background
William Kahn first conceptualised work engagement in the 1990s, where he indicated that
employees are emotionally, physically and cognitively involved in their work activities (Knight
et al., 2017). Kahn also found that any individual's experience in the work role will differ from
one another according to their surroundings and work experience related to the work role
(Joo et al., 2016).
Some researchers reported employee engagement as the opposite of burnout due to the
associated dimensions that include inefficacy, cynicism and exhaustion (Nimon & Shuck,
2020). The opposite of these negative burnout dimensions can be considered as the core
dimensions of engagement and describes feelings of positivity, fulfilment and satisfaction
(Martin, 2017). These dimensions can be characterised as vigour, dedication, and
absorption. Vigour can be described as the individual's energy levels, willingness to work
and personal investment in the job function. Dedication describes the individual's feeling of
enthusiasm and pride towards one's work function and absorption as a sense of
concentration and difficulty to detach oneself (Schaufeli, 2018).
There were three different levels of employee engagement found in the literature namely,
engaged, not engaged and disengaged and can directly relate to the success off an
organisation (Chandani et al., 2016; and Ogbonnaya et al., 2017). These three levels are
further described by Chandani and Ogbonnaya below.

- 17 -
2.3.2 Categories of employee engagement
2.3.2.1 Engaged
Employees who are engaged in their work, show passion towards their work activities and
the goals of the company. They work with pride and indicate strength and actively use their
talents in their work activities.
2.3.2.2 Not engaged
Employees who are not engaged will participate in the goals of the company, however, with
little energy or passion. They prefer to be told what to do and do not work independently.
When they finish tasks, they will rather wait to be delegated than to use their own initiative.
2.3.2.3 Disengaged
Disengaged employees are unhappy in their workplace and show no dedication to the goals
of the company. They have a great sense of negativity and produce little results in the
company.
The majority of adults spend their time working, and yet, a mere 20% are highly engaged in
their work (Ergle, 2015). Employee engagement consists of non-material and material
incentives, where both indicate great importance to employee performance (Rakhmanova
& Kryukov, 2019). Incentives and rewards have a strong ability to produce highly engaged
employees and will be discussed further in the next section (Chandani et al., 2016).
2.3.3 Measuring employee engagement
There were several instruments identified in the literature that can successfully measure
employee engagement. According to a study conducted by (Shrotryia & Dhanda, 2019), they
identified the ten most popular instruments based on the number of citations and usage by
scholars and practitioners. The top five instruments identified are as follow:

- 18 -
• Gallup Workplace Audit (GWA)
Researchers of The Gallup Organization developed the GAW by conducting
qualitative research on focus groups across a wide variety of industries. The model
was mainly designed for attitudinal outcomes and to identify factors within
management's control that are antecedents to these outcomes. The GWA comprise
of 12 questions to measure employee perceptions of their work structures (Jadhav &
Bhise).
• Utrecht Work Engagement Scale (UWES)
The UWES was developed and introduced by Schaufeli and Bakker in 2003, this
scale measures engagement based on three subscales namely, vigour, dedication
and absorption in the form of a 17 question Likert-scale questionnaire (Khodakarami
et al., 2018).
• Psychological Engagement Measure
The authors based their instrument on the concept of employee engagement having
three dimensions, namely, psychological safety, psychological meaningfulness and
psychological availability. The instrument comprises of a 13-item questionnaire that
was developed to measure three aspects of engagement, namely, cognitive, physical
and emotion (Shrotryia & Dhanda, 2019).
• Job and Organisational Engagement Scale
This instrument was initially developed by Saks in 2006 and designed to measure the
extent to which an individual is psychologically present in a specific organisational
role (Khodakarami et al., 2018).
• Job Engagement Measure
This instrument was developed to measure an individual's physical, cognitive, and
emotional energy regarding work activities (Byrne et al., 2016). This instrument
utilises an 8-item questionnaire on a five-point scale.

- 19 -
Based on research regarding the instruments mentioned above, the Utrecht Work
Engagement Scale resulted in the most commonly used instrument and selected for this
study. The UWES has been validated in several countries, including China, Japan, South
Africa and the Netherlands (Boikanyo, 2012). The literature indicated that there are many
ways to measure employee engagement and that there are various stages of engagement
of an individual. The following section will describe the necessity of employee engagement
in the context of this study.
2.3.4 Employee engagement in context
Work engagement can be considered essential in any business or organisation. Highly
engaged employees will subsequently result in increased job satisfaction, performance and
ultimately organisational productivity (Singh et al., 2016). Several factors could influence the
engagement levels of employees in the workplace. The literature indicated that many
researchers had studied these driving factors, and according to a study conducted by (Barik
& Kochar, 2017), who based their research on summarising these factors, have identified
the following key driving factors:
• Reward System
• Job enhancement
• Effective management
• Scope of advancement & self-development
• Security of employment
• Decision-making authority
From the factors mentioned above and being the core focus of this study, reward systems
will be considered necessary in this study.
From the literature, various researchers investigated and reported the effect and importance
of an effective reward system within organisations on employee engagement. Barik and
Kochar (2017), reported that a reward system should be efficient and effective to achieve
organisational goals and to retain and engage employees. Osborne and Hammoud (2017)
reported that an effective reward system and recognition directly impact employee
engagement and work performance.

- 20 -
From the literature, it is evident that employee engagement can be considered as a vital
component that could aid to organisational success and sustainability. The following section
will describe various conventional and non-conventional strategies that could be
implemented to improve employee engagement and motivation.
2.4 STRATEGIES THAT IMPACT MOTIVATION AND ENGAGEMENT
2.4.1 Conventional incentive strategies
Incentives can be defined as any promise of some form of a reward based on performance
and mainly motivate employees by influencing their behaviour to produce high standard and
quality work. Common examples of performance-enhancing incentives include awards,
additional paid leave, promotions, praise and recognitions (Cerasoli et al., 2014). Through
incentivising employees, they strive to perform better to achieve greater rewards in addition
to their regular salary (Ganta, 2014). Incentives are significant to employees, whether they
are intrinsically or extrinsically. An employee can be intrinsically rewarded using satisfaction
or pride when an objective is reached and satisfied. In contrast, employees can be
extrinsically rewarded in the form of pay or benefits at the end of the month (Shahzadi et al.,
2014). On the contrary, many employees would prefer recognition from their employers to
perform better. A strategy can also act as a recognition system to employees who excel in
their work objectives, enabling them to obtain intrinsic motivation from feeling satisfied and
recognised.
2.4.1.1 Reward systems
A reward system comprises more than just a basic salary alone, and it can be regarded as
intrinsic, extrinsic, monetary and non-monetary (Victor & Hoole, 2017). It will encourage
continuous improvement of performance that could lead to enhanced organisational and
individual growth and will also aid to improve the overall morale (Noor et al., 2020).
In the world of business, employees want to be rewarded appropriately for their performance
and loyalty to their respective companies to fulfil their desires (Khan et al., 2020). A reward
system mainly consists of procedures and strategies to recognise employees for their
involvement, skills and potential (Noor et al., 2020). Such a system is usually created within
organisational policies, reward beliefs and strategies.

- 21 -
Incentives have been identified as a critical factor when it comes to an employee working
efficiency and motivation. From a strategic point of view, an incentive or reward scheme
must be developed to ensure that organisational sustainability could be achieved and to
maintain a competitive advantage (Rakhmanova & Kryukov, 2019). This could be reached
by encouraging employees to be more aware of their performance and that of the
organisation and to strive for better performance subsequently.
Incentive strategies should, however, be a set of actions created to ensure employees are
encouraged to achieve the desired reasonable level of performance. Robescu and Iancu
(2016) reported that a meta-analysis on the effects of incentives on performance indicated
an average increase performance of 22% using such schemes. Other researchers have also
concluded from their studies that incentive strategies have influenced the performance and
satisfaction of their employees (Sattar et al., 2015). Nohria et al. (2008) indicated through
an internal survey that employee satisfaction and engagement have improved using a pay-
per-performance reward system, it enabled the best performers opportunities for
advancement. (Nohria et al., 2008).
There are also downsides to incentive schemes that involve performance-based pay that
could cause lousy behaviour amongst employees and additional work-related stress
(Ogbonnaya et al., 2017). In the following section, the most common monetary incentive
schemes are discussed.
2.4.1.2 Monetary vs non-monetary incentives
Monetary (financial) rewards or incentives may not necessarily be enough to satisfy an
employee to be more motivated and engaged in the working environment, as discussed in
Chapter 2.2.2 and 2.2.3 regarding intrinsic and extrinsic motivation (Mamdani & Minhaj,
2016). In some cases, depending on individual needs, a combination of both monetary and
non-monetary would be required. Monetary incentives could be considered as extrinsic
rewards and include any financial gain such as salary, bonus and allowances (Khan et al.,
2020). Non-monetary incentives can be considered as intrinsic motivation and include
factors such as leave, flexible working hours and excellent working environment. Non-
monetary incentives do not provide any direct financial gain to employees and mainly include
the feeling of being praised or acknowledged for doing a job well done (Noor et al., 2020).
Both will have an impact on the motivational and engagement levels of employees and
subsequently their desire to perform well in the working environment. According to a survey

- 22 -
regarding 235 managers, the most used incentive methods to motivate employees in the
organisational environment include the following, from the most popular to the least
(Mamdani & Minhaj, 2016):
• Employee acknowledgement
• Gift vouchers
• Special events
• Cash rewards
• Merchandise incentives
• Email/print communications
• Training programs
• Work/life benefits
• Variable salary
• Group travel
• Individual travel
• Sweepstakes
In the following section, additional conventional monetary incentive strategies will be
discussed.
2.4.1.3 Conventional monetary incentives
The most common methods of monetary incentive strategies include the following:
• None
Employees do not receive any form of additional compensation above their typical
monthly salary. With incentives being an essential factor in organisational
performance, the disappointment from no further benefits would most likely result in
high employee turnover rates and poor performance (Chepkemoi, 2018; and Yousaf
et al., 2014). The idea that an employee would be rewarded additionally by any
means would boost their overall morale in the working environment.
- 23 -
• Profit-related pay (company performance-profit sharing)
Employees will receive a percentage of their annual cost to company based on the
company performance over the year. When a company did not indicate enough profit,
the employees would not receive any additional compensation. A study by
Ogbonnaya et al. (2017) found that profit-related pay incentives did not have any
positive effects on employee performance, but rather impacted employee
commitment in a negative manner.
• Performance-related pay (individual performance)
This form of incentive is based on the performance of the individual during the year,
and according to the company policy and employee package, the employee will be
rewarded accordingly. They may feel pressured to perform better to obtain extra
compensation for their efforts. Performance-related pay plays a crucial role in
employee motivation and can be linked directly to the efforts of employees in the
workplace (Ikäheimo et al., 2018). It will thus be the responsibility of the employee to
increase their performance and efforts to receive additional compensation.
2.4.2 Alternative incentive strategies
There were various alternative methods found in the literature that other business
environments use to improve employee motivation and engagement. These methods are
listed below.
2.4.2.1 Loyalty programs
Loyalty programs are widely used in the retail, travel and consumer industry and involve
factors such as reward cards, tiered service levels and support contracts (Bruneau et al.,
2018). Loyalty programs aim to engage customers in long-term relationships where
consumers would be able to earn and spend their loyalty points (Chang & Wong, 2018).
Most of the loyalty programs are aimed towards economic benefits using points to be
redeemed by clients of the service (Hamari & Koivisto, 2015). A few examples of such
programs within South Africa include eBucks from FNB, Vitality from Discovery medical
services and Pick and Pay smart shopper. For example, Discovery medical services will
reward their clients when they exercise regularly, purchase healthy food items and go for
regular health check-ups. Clients can then spend their earned points on cheaper flight

- 24 -
tickets, fitness devices and cashback on healthy food items, while the medical provider
ensures that their clients are in better overall health. This will subsequently result in an
organisational advantage to Discovery because fewer people are in the hospital or
experiencing health-related problems that could be avoided by living healthy.
2.4.2.2 Gamification
With monetary incentives being a pivotal contributor to extrinsic motivation, a trending
strategy to motivate and engage employees, intrinsically was found to be through game-like
activities in the working environment. This strategy can be described as Gamification, and
the concept entails the transformation of working activities into gaming experiences
(Stoyanova & Iliev, 2017). This will subsequently motivate employees to be more engaged
in their workplace activities (Hamari & Koivisto, 2015; Klevers et al., 2015; Ruhi, 2015).
Studies have shown in various scenarios that Gamification has successfully increased the
motivation of users and increased their engagement in working activities (Morschheuser et
al., 2017).
Every human being has participated in some form of game-like activities throughout their
lives, being sports, video games or board games. The literature suggests that by playing
games, people tend to get competitive, more engaged and willing to take extra steps in the
activity being exercised with the objective to win (Ergle, 2015). Ruhi (2015), indicated
through their research into Gamification, that organisations could have advantages by
driving Gamification strategies. Klevers et al. (2015) also reported that Gamification could
be a useful strategy to motivate employees to drive performance in business activities.
Rivers (2016), found that Gamification had a significant impact on social engagement,
overall engagement and affective engagement. Additionally, it also reduced employee
turnover and increased the overall morale within organisations.
As discussed in Chapter 2.2, there are two types of motivational factors, namely intrinsic
and extrinsic. Gamification has the potential to simultaneously drive the behaviour of both
employee motivational factors (Hamari & Koivisto, 2015; and Huotari & Hamari, 2017).
Gamification can subsequently be used in the organisational environment as an alternative
motivational strategy by implementing game-like experiences for the employees to motivate
them to be more engaged in their work activities. This strategy could have the potential to
create a more motivated and engaged workforce.

- 25 -
2.4.2.3 Other methods of employee incentives (rewards)
There are many other unique ways to incentivise employees. Companies could provide
employees with gifts, based on their performance (Du, 2020). Examples of these could
include company-branded coffee mugs, music subscriptions to gift cards. Additional
incentives could also have pets at work-days or holiday packages (Gard, 2019). One article
mentioned that companies could incentivise according to employee performance rating.
Higher performing employees will benefit from more generous incentives such as unlimited
paid off-days, while less performing employees will benefit from recognition (Salcido, 2020).
There are many creative ideas on how to increase the overall morale within the work
environment. However, this would also be subjected to the type of company and culture.
Large corporations would differ from small start-ups and mainly where strict rules apply.
2.4.3 Incentive strategies in context
There is a growing demand in the modern organisational working environment for alternative
strategies to motivate and engage employees that do not necessarily include cash rewards
or gift cards (Conmy & Melvin, 2019).
Mamdani and Minhaj (2016) found that greater levels of incentives resulted in improved
employee performance and also their commitment towards their respective companies.
Their study revealed that both non-monetary and monetary incentives impacted the
motivational levels of employees. It was also found in the literature that there is a need for
proper reward systems to improve the performance of employees and not to rely solely on
basic salary structures (Chandani et al., 2016). According to a report, a manufacturing firm
used 23% of its after-tax profit to incentivise employees for their efforts to reach their annual
goals and subsequently created a positive and driven workforce (Barik & Kochar, 2017). It
is crucial that organisations understand and can predict the behaviour of their employees
when implementing incentive strategies (Norberg, 2017). It might be necessary to combine
a loyalty program and to gamify some of the operational activities to obtain optimal results.
The current workforce consists of a combination of different age groups that could require
other incentive methods or combinations thereof to be more motivated and engaged in the
working environment. The following section will describe the three largest generations found
in the workforce.

- 26 -
2.5 MULTIGENERATIONAL WORKFORCE
2.5.1 Background
Businesses of the modern world are facing a unique challenge since the current workforce
comprises of various employee generations. Employee age diversity can be considered an
essential component regarding diversity management and thus regarded as crucial for this
study (Gordon, 2018). Organisations have a workforce that comprises of three different
generation groups namely the young Millennials (born after 1982), the older Generation X
(born between 1961 and 1981) and the retiring Baby Boomers (born between 1943 and
1960) (Calk & Patrick, 2017). The younger Millennial generation can already be considered
as the largest generation joining the workforce. For this study, Generation Z was not
considered relevant. Organisations will have a competitive advantage by leveraging their
employee's skills and knowledge by providing them with a motivating work environment
(Canedo et al., 2017).
Although there was no specific consensus found in the literature pertaining the precise birth
years for each generation, the following data was obtained from Stats SA regarding the
largest and most relevant age groups for this study within the South African workforce.
Table 2.1: Workforce age breakdown according to Stats SA (Adapted from Stats SA, 2020)
Generation Age Group Percentage
Millennials 25-34 31.64%
Generation X 35-54 57.79%
Baby Boomers 55-64 10.56%
With the above-mentioned taken into consideration, it is evident that the older generation is
slowly entering retirement while the Millennial group is constantly growing. Each of the
employee generations mentioned above could have different motivational factors associated
with their specific generation and upbringing. The following section will describe the three
largest generations in the workforce and their motivational factors.

- 27 -
2.5.2 Millennials
The Millennial generation is currently entering the workforce at an increasing tempo as the
older generations start to exit the work environment. This brings new and challenging factors
to management. Millennials have a strong desire for success, praise and tend to be more
motivated using career development (Alonso‐Almeida & Llach, 2019). They want a life
outside of their work environment, and they are not likely to sacrifice their happiness for the
sake of the company. They are motivated through praise, recognition, rewards and require
a collaborative team-based work environment rather than a predictable salary, retirement
and benefits (Calk & Patrick, 2017). According to Alonso-Almeida (2019), Millennials were
found to be extrinsically motivated, rather than intrinsically.
On the contrary, Gerard (2019) found that Millennials have a strong desire for meaningful
work that relates more with intrinsic motivation. However, they also face strong external
pressures. Millennials are a very optimistic generation and work well in teams, indicating
great spirit to get things done (Gursoy et al., 2013). They are also quickly bored with the
absence of diversity in their workplace and require a variety of objectives. As a result of low
motivation, Millennials are prone to switch between jobs very easily (Pînzaru et al., 2016).
2.5.3 Generation X
Generation X, being the parents of the Millennials, were found to be more intrinsically
motivated than other generations, and want their work and personal life to balance (Kraus,
2017). Due to the older age of Generation X to the Millennials, they prefer flexible working
hours and a competitive salary rather than recognition or praise (Valickas & Jakštaitė, 2017).
They may be motivated using funded holiday packages, adequately paid leave and job
security to focus on their family and kids (Nnambooze & Parumasur, 2016).
2.5.4 Baby Boomers
Boomers are the oldest amongst the generations noted in this study and nearing retirement.
They are established in their professions and generally in high positions and viewed as
workaholics (Clark, 2017). They strive for work-related challenges, and they are perceived
to be interested in material success. They are also very loyal and willing to wait their turn for
any promotions (Gursoy et al., 2013). Baby Boomers are primarily motivated by means of
great health benefits and better retirement plans (Nnambooze & Parumasur, 2016).

- 28 -
2.5.5 Multigenerational workforce in context
In order to ensure that all the generations are highly motivated, employers must understand
the dynamics and needs of the employees within the workforce. This will ensure that
individual and organisational effectiveness and performance could be impacted positively
(Basic, 2018). By developing a strategic reward program that could positively impact the
motivation and engagement of a multigenerational workforce, organisations could have a
significant competitive advantage and positive growth (Fahy & Moylan, 2019). It will thus be
the responsibility of the management team and leaders to fully understand the various
factors that influence the different generations to enjoy the benefit associated.
2.6 CHAPTER SUMMARY
One of the questions that arise from the literature is whether monetary methods are
preferred over non-monetary methods to motivate employees, and what alternatives would
be preferred (Robescu & Iancu, 2016). Employees will be more motivated to perform their
work activities when they believe that their efforts will ultimately result in some reward (De
Vito et al., 2018). Loyalty programs are actively being used in the healthcare and banking
services and indicated a great potential to retain customers. It enables the user of the service
to redeem points collected using exercising and living healthy in the medical-health industry
and signing loans and home/vehicle finance in the banking sector. This strategy could be
implemented in the business sector where employees could obtain points-based on their
Key Performance Indicators (KPI) performance and redeem these points whenever they feel
the need to do so.
The literature review provided a base of knowledge that will be used to determine whether
a points-based reward scheme with game-like activities would be a feasible incentive
strategy to motivate employees to be more engaged in their work activities. The following
Chapter describes the methodology used regarding the empirical study.

- 29 -
3. CHAPTER 3: EMPIRICAL RESEARCH METHODOLOGY
3.1 INTRODUCTION
This study aimed to determine the feasibility of a points-based reward scheme with game-
like activities in an engineering services entity. The results from the proposed strategy could
result in a more engaged and motivated workforce within the company. This chapter
provides detail regarding the structured methodology followed during the empirical research.
This includes the research approach, design and methods of analysis that were used within
this study.
3.2 RESEARCH APPROACH
Research approach defers to the plan or procedure that will be followed in a research study.
This includes the steps from the initial assumptions to the data analysis and interpretation
(Creswell, 2014). For this study, a quantitative research approach was utilised, as mentioned
in Chapter 1, whereby data will be collected, analysed and evaluated to satisfy the primary
and secondary research objectives. To satisfy the quantitative research approach regarding
numerical data analysis and observations, a questionnaire was utilised, and responses
quantified using a 7-point Likert-scale. The data obtained from the questionnaires were
tested regarding the validity and reliability of the responses. The study was purely
exploratory in nature, and the data obtained were statistically analysed and presented to
conclude the findings.
3.3 RESEARCH PHILOSOPHY
Research philosophy can be described as a method that is unique to each researcher, and
when applied, will allow researchers to generate new ideas into knowledge regarding their
respective field of research (Moon et al., 2019). This includes the beliefs and assumptions
regarding the development of knowledge. The four primary dimensions of scientific research
philosophy identified in the literature include positivist research, interpretivist research,
pragmatist research and realistic research philosophy (Žukauskas et al., 2018). For this
study, interpretivist research was a more appropriate approach due to the author trying to
understand what methods of rewards will motivate and engage employees within an
engineering service entity. Similarly, the definition of interpretivism suggests that research
into a specific field will allow the researcher to gain insight and interpret the meaning of

- 30 -
human behaviour, rather than to predict causes and effects (Edirisingha, 2012). It was
important for this study to understand the motivation and engagement levels within this
organisation to propose a new method to increase overall performance and enhance
workplace enjoyment.
3.4 RESEARCH DESIGN
Research design can be described as the method or strategy to which the research method
will be executed to solve the research problem (Sovacool et al., 2018). The research design
also stipulates the data collection framework that will be used after the research problem
has been defined.
A quantitative research design approach was used to obtain the data for this study, and to
draw the final conclusions. A structured survey was utilised at a single point in time to obtain
the data from the employees. This method of study conforms to the definition of descriptive
cross-sectional research design (Aggarwal & Ranganathan, 2019).
3.4.1 Population and sample
The research population can simply be defined as a group of people that a researcher wants
to generalise the results of the study from, and the sample as the group selected to
participate (Serhan, 2020). For this study, the sample population comprised all employees
within the South African operations of the company. The company originated in the early
1900s and started its operations in South Africa soon after. The head office in South Africa
is situated in Gauteng with a vast distribution network across the country.
The sample includes the employees across all business units from finance, engineering,
customer services, HR and field services technicians. The company employs approximately
219 employees in sub-Saharan Africa, including Zambia and Mozambique. Only about 119
employees are employed permanently in the South African operation. All employees were
allowed to participate in this study and aimed to measure the current motivation and
engagement levels as well as the preferred incentive methods.

- 31 -
3.4.2 Data quality
Data quality can be determined by two fundamental features, namely, reliability and validity
(Mohajan, 2017).
3.4.2.1 Validity of quantitative data
Data validity can be defined as the construct an instrument intends to measure and how well
it does so, it also describes the degree to which the data is relevant, meaningful and logical
to the study (Cypress, 2017; Mohajan, 2017). The two types of validity are known as internal
and external. External validity refers to the process of generalising the findings of a study to
different groups of people. This means that the data could be obtained in other settings than
the one assessed within this study. Internal validity is mainly dependent on the amount of
error in measurements and addresses the reasons involved, including exposure to disease
or other unanticipated occurrences (Singh, 2017).
There are three approaches that could be followed when assessing internal validity, namely
content validity, criterion validity, and construct validity (Pallant, 2017). Content validity
refers to suitability with which a measure has sampled data from the intended domain of
content and can be tested using a pilot study. Criterion validity, on the other hand, relates to
the correlation between two similar measurement instruments intended to measure similar
constructs. Finally, construct validity involves the correlation between the theoretical aspects
regarding the concepts and the instrument and the results where it was used. A common
way of measuring construct validity is known as factor analysis and involves the statistical
relationship between a set of items within a questionnaire (Knekta et al., 2019).
Due to the small sample size (low response rate) and the nature of this study, no factor
analyses were performed to assess construct validity and no generalisations will be made
regarding the outcome of this study.
3.4.2.2 Reliability of quantitative data
Reliability can be described as a measure of the repeatability, stability and consistency of
the results obtained when an instrument is applied to record data (Mohajan, 2017). In simple
terms, data reliability ultimately assess the consistency of results over time (Hayashi Jr et
al., 2019).

- 32 -
Two of the most frequently used indicators of reliability are test-retest reliability and internal
consistency (Pallant, 2017). The test-retest reliability can be referred to as the temporal
stability of data and mainly assess the results from a questionnaire when the same
participants partake in a study on two different occasions. When the results indicate a high
correlation between the two tests, it indicates a high reliability of the scale. The second
indicator, known as internal consistency refers to the degree to which an instrument can
consistently measure a single construct within a questionnaire (Cronbach, 1951). There are
two methods that can be used to calculate the internal consistency reliability of a
questionnaire, namely, the split-half and coefficient alpha (Pallant, 2017). The split-half
method randomly splits responses into two sets, the scores subsequently added, and the
correlation between the two sets indicate reliability. The coefficient alpha method splits all
the possible responses into halves, and the average correlation between these halves
indicate the reliability of the construct; this is known as the Cronbach’s alpha coefficient
(Tavakol & Dennick, 2011). Subsequently, this study utilised Cronbach’s alpha index to
determine the reliability of the data. The Cronbach’s alpha coefficient ranges from 0 to 1,
with the latter indicating higher reliability (Pallant, 2017). A more widely accepted value
should, however, be greater than 0.70 (Taherdoost, 2016). Due to the nature of the
convenience sample and the use of previously validated questionnaires, a pilot study was
not conducted to test the reliability.
3.4.3 Measuring instrument
The questionnaires used in this study consisted of the sections described below to
determine the required data regarding the biographical information of the respondents and
their current motivation and engagement. Their incentive preferences were also obtained
regarding a self-constructed questionnaire.
3.4.3.1 Biographical information
To profile the respondents, a biographical questionnaire (see Appendix D, Section A) was
developed and used to capture the participant's age group, education, years of employment
and department within the company. This information was subsequently used in conjunction
with the rest of the questionnaire to conclude on possible relationships.

- 33 -
3.4.3.2 Work Extrinsic and Intrinsic Motivation Scale (WEIMS)
As discussed in Chapter 2.2, motivation can be considered as a vital driving force that
engages individuals in any activity as well as the associated commitment, energy and
creativity levels (Maduka & Okafor, 2014; Robescu & Lancu, 2016; Shahzadi et al., 2014;
and Singh, 2016). It was thus necessary for this study to determine the current motivational
levels within the organisation to propose an alternative strategy to improve the motivational
levels.
The Work Extrinsic and Intrinsic Motivation Scale (WEIMS) is an 18-question measure (See
Appendix D, Section B) based on the Self-Determination Theory proposed by Ryan and
Deci, (2000), as discussed in Chapter 2.2.4. The WEIMS was subsequently developed by
Tremblay et al., in 2009, to measure the amount of motivation employees experience in the
workplace. This instrument is divided into six sections to measure the respective constructs
of motivation (Tremblay et al., 2009). These constructs of the WEIMS include Amovitation
(three-items), External Regulation (three-items), Introjected Regulation (three-items),
Identified Regulation (three-items), Integrated Regulation (three-items) and Intrinsic
Motivation (three-items).
The questionnaire can be found in Appendix D, Section B and the related constructs
questions summarised in the table below. The participants were required to answer the
questions by means of a 7-point Likert-scale that range between 1 (very strongly disagree)
to 7 (very strongly agree) according to their work motivation levels.
Table 3.1: WEIMS subscales and related questions (Tremblay et al., 2009)
Constructs Related Items
Intrinsic Motivation B4, B8, B15
Integrated Regulation B5, B10, B18
Identified Regulation B1, B7, B14
Introjected Regulation B6, B11, B13
External Regulation B2, B9, B16
Amotivation B3, B12, B17

- 34 -
A study conducted by Pekelharing (2018) regarding the relationship between leadership
styles, motivation and engagement that utilised the WEIMS within a South African context,
resulted in the following alpha coefficients:
Table 3.2: Alpha Coefficients
Constructs Alpha Coefficients
Amovitation 0.778
External Regulation 0.685
Introjected Regulation 0.778
Identified Regulation 0.745
Integrated Regulation 0.787
Intrinsic Motivation 0.787
Since the WEIMS was already validated in various countries, including different cultures and
used within the organisational setting, the scale rendered appropriate for this study. As
discussed in Chapter 2.2.4, the motivation level of the sample respondents or individuals
can be calculated by a single score that will indicate the level of self-determination (Tremblay
et al., 2009). This formula to calculate the score is:
W–SDI = (+3 X IM) + (+2 X INTEG) + (1 X IDEN) + (-1 X INTRO) + (-2 X EXT) + (-3 X AMO)
A score with a negative value indicates that the sample or individual is non-self-determined,
and a positive score indicates more self-determined.
3.4.3.3 Utrecht Work Engagement Scale (UWES)
As discussed in Chapter 2.3.3, there are various instruments available that could be utilised
to measure work engagement levels. A study conducted by Shrotryia and Dhanda in 2019,
listed the top five most used instruments based on the number of citations. These included
the Gallup Workplace Audit (GWA), the Utrecht Work Engagement Scale (UWES), the
Psychological Engagement Measure (PEM), the Job and Organisational Engagement Scale
(JOES) and the Job Engagement Measure (JEM). As discussed in Chapter 2.3, work
engagement refers to the extent to which employees are emotionally, physically and
cognitively involved in their work activities. Based on the most common instrument and the
one used in this study, the UWES characterise these factors using vigour, dedication and
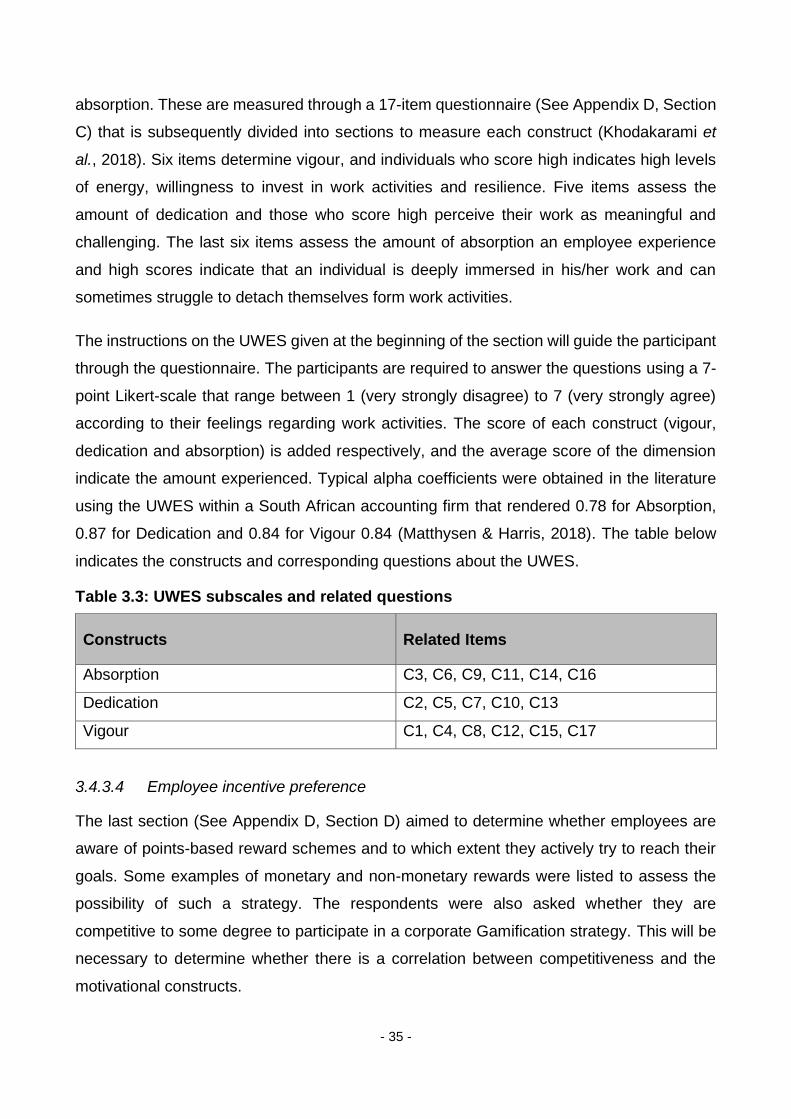
- 35 -
absorption. These are measured through a 17-item questionnaire (See Appendix D, Section
C) that is subsequently divided into sections to measure each construct (Khodakarami et
al., 2018). Six items determine vigour, and individuals who score high indicates high levels
of energy, willingness to invest in work activities and resilience. Five items assess the
amount of dedication and those who score high perceive their work as meaningful and
challenging. The last six items assess the amount of absorption an employee experience
and high scores indicate that an individual is deeply immersed in his/her work and can
sometimes struggle to detach themselves form work activities.
The instructions on the UWES given at the beginning of the section will guide the participant
through the questionnaire. The participants are required to answer the questions using a 7-
point Likert-scale that range between 1 (very strongly disagree) to 7 (very strongly agree)
according to their feelings regarding work activities. The score of each construct (vigour,
dedication and absorption) is added respectively, and the average score of the dimension
indicate the amount experienced. Typical alpha coefficients were obtained in the literature
using the UWES within a South African accounting firm that rendered 0.78 for Absorption,
0.87 for Dedication and 0.84 for Vigour 0.84 (Matthysen & Harris, 2018). The table below
indicates the constructs and corresponding questions about the UWES.
Table 3.3: UWES subscales and related questions
Constructs Related Items
Absorption C3, C6, C9, C11, C14, C16
Dedication C2, C5, C7, C10, C13
Vigour C1, C4, C8, C12, C15, C17
3.4.3.4 Employee incentive preference
The last section (See Appendix D, Section D) aimed to determine whether employees are
aware of points-based reward schemes and to which extent they actively try to reach their
goals. Some examples of monetary and non-monetary rewards were listed to assess the
possibility of such a strategy. The respondents were also asked whether they are
competitive to some degree to participate in a corporate Gamification strategy. This will be
necessary to determine whether there is a correlation between competitiveness and the
motivational constructs.

- 36 -
The results of this section will be used to propose a new incentive strategy aimed to increase
the overall employee motivation and engagement. Due to this unique section in the
measuring instrument, the validity and reliability cannot be confirmed and will be used to aid
with the strategy design.
3.5 EMPIRICAL STUDY PROCEDURE
The following steps were executed as a requirement to obtain the data for this study.
3.5.1 Initial arrangements
It was required to firstly meet with the HR manager of the company investigated to discuss
the purpose and objectives of the study and to obtain permission to distribute the
questionnaire amongst the employees (see Appendix B). Permission was subsequently
granted, and the data capturing could commence.
3.5.2 Ethical considerations
The ethical factors regarding this study were addressed, the participants and the company’s
identity will remain anonymous for confidentiality reasons. The questionnaire was distributed
to the participants via email link to the SurveyMonkey webpage where they completed the
questionnaire. The nature and objectives of the study were explained in the email body in
the form of a cover letter, and all participants were assured that they would remain
anonymous.
3.5.3 Administration of the questionnaire
To aid maximum participation, a cover letter was compiled (see Appendix A) and attached
to the questionnaire. In this letter, the purpose of the study was described and what was
expected from the participants. It was also indicated that all respondents would remain
anonymous, and the data will remain confidential.
The administration of the questionnaire remained the responsibility of the researcher, and
any queries were attended to.

- 37 -
3.5.4 Data capturing and feedback
The questionnaire was distributed to the South African employees using an electronic survey
by utilising an online platform named SurveyMonkey. Online data capturing was required
due to human contact restrictions due to the COVID-19 pandemic. The data was captured
and exported to an Excel spreadsheet to aid statistical analysis. Feedback regarding the
outcome of the study will be provided to the senior management of the organisation.
3.6 STATISTICAL ANALYSIS
The statistical data analysis was completed with the support of the Statistical Consultation
Services of the University. For this study, IBM SPSS was used to analyse the data obtained
from the questionnaires.
3.6.1 Descriptive statistics
Descriptive statistics can be defined as a statistical method by which a large set of
information can be summarised in a simple manner (Mishra et al., 2019). Three common
types of descriptive statistics include the measure of frequency, central tendency and
variation. The frequencies, means and standard deviation about the constructs of the
questionnaire were subsequently summarised and discussed in this section.
3.6.2 Inferential statistics
Inferential statistics is another method for analysing data and can subsequently be used to
identify differences between two sets of data or groups (Thomas, 2019). This was
subsequently used to report and discuss the results obtained regarding the difference
between means and correlations from various factors. Due to the sample being selected at
non-random (convenience sample), the p-values were not interpreted and only reported for
completeness sake. Thus, the interpretations were based on the effect sizes.
Effect size can be considered as a guide to the extent to which findings have practical
significance within the sample population (Hojat & Xu, 2004). Effect sizes can thus be used
to quantify the estimated significance of an effect between two constructs of a questionnaire,
regardless of the sample size (Hanel & Mehler, 2019). These size estimates can be
calculated for various statistical indices, namely, mean differences (t-test), correlation
coefficient, and the difference between two constructs. The value obtained can range
between being negative or positive. However, positive values are more common in practice.

- 38 -
There are three different categories developed by Cohen (1987), that can be used to
interpret the effect size, namely small (d > 0.2), medium (d > 0.5), and large (d > 0.5) (Aarts
et al., 2014).
Spearman’s rho correlations were calculated and interpreted in this study to measure the
statistical difference between constructs. This coefficient can be described as a non-
parametric statistical measure to determine the strength between two ranked variables (Xiao
et al., 2016). This relationship (correlation) is symbolised by the letter r and quantified with
a number that varies between -1 and +1. When the correlation returns a value of 0, it implies
that there is no correlation and one a perfect correlation. A negative value suggests that the
variables are inversely related (Akoglu, 2018).
3.7 CHAPTER SUMMARY
This chapter described the methodology utilised to complete this study. The sample
population was discussed, and the measuring instruments used in order to determine the
current employee motivation and engagement levels. This data will be used in conjunction
with the preferred incentive methods to assess whether Gamification and a points-based
corporate reward strategy could be feasible within the organisation. The statistical data
analysis procedure was provided, along with the reliability factors. The following chapter
contains the results from the statistical analysis.

- 39 -
4. CHAPTER 4: EMPIRICAL INVESTIGATION
4.1 INTRODUCTION
The previous chapter described the framework of the research methodology used regarding
the empirical investigation of this study. This chapter contains the results obtained from the
empirical investigation regarding the constructs discussed in the previous chapter. The data
regarding the questionnaires will be presented, the reliability established, and the results
from the descriptive and inferential statistics.
4.2 MEASURING INSTRUMENT
As discussed in Chapter 3.4.3, the measuring instrument used in this study is divided into
four sections and can be found in Appendix D. The following summarises the measuring
instrument:
• Section A: Demographic information
This section comprises four questions to obtain necessary information regarding the
respondents. This includes factors such as the participant's age group, education, years
of employment and department within the company.
• Section B: Work Extrinsic and Intrinsic Motivation Scale
In this section, the motivational constructs of the employee will be measured according
to the scale developed by Tremblay et al. (2009) using an 18-item questionnaire.
• Section C: Utrecht Work Engagement Scale
The Utrecht Work Engagement Scale is a 17-item questionnaire that measures the
employees level of engagement in their working environment (Khodakarami et al.,
2018).
• Section D: Incentives
To determine the feasibility of a corporate points-based reward scheme with game-like
activities, the respondents were required to complete a 7-item questionnaire. This
section aimed to measure whether the respondents would be willing to participate in
such a scheme as well as their preferred incentive methods.

- 40 -
4.3 RESPONSE RATE
The questionnaire was sent out to the entire company consisting of 181 employees within
the South African operation. A total of 78 questionnaires were received, representing a
response rate of 43.09%. The main contributing factor to the low response rate of this study
was due to the COVID-19 pandemic, where the majority of employees were required to work
from home and some not having access to emails, especially the technical and warehousing
employees. According to a study conducted by Young et al., (2020), regarding typical
response rates with emailed questionnaires, reported a rate of 36%. Thus, the response rate
of 43.09%, can be regarded as valid under the current circumstances. Due to the small
sample size, no factor analyses were performed to assess construct validity.
4.4 DEMOGRAPHICAL INFORMATION
In this section, the results from the demographical questionnaire (see Appendix D, Section
A) are presented and described. This includes factors such as the participant's age group,
education, years of employment and department within the company.
4.4.1 Age of respondents
Regarding the age of the respondents, there was almost an equal split of respondents
between the ages of 18 to 38 (n = 38) and 39 to 59 (n = 37), the remainder were of the age
of 60 to 77 (n = 3). According to Chapter 2 (in Section 2.5), individuals between 18 and 38
years of age, are classified as Millennials. Millennials accounted for 49% of the respondents.
Similarly, individuals between 39 and 59 can be classified as Generation X employees and
accounted for the second-largest group of 47%. Finally, the smaller group, the Baby
Boomers, accounted for the remainder 4%. The figure below depicts the age groups of the
respondents.

- 41 -
Figure 4.1: Respondents by age (generation)
(Source: Own compilation)
4.4.2 Duration of employment
Regarding the duration of employment of the respondents, an equal number indicated that
their duration of employment is 0-3 years (n = 13) and 4-6 years (n = 13). The second
highest number of respondents indicated that their years of employment are 7-10 years (n
= 16), with another thirteen indicating that that have been working 11-15 years (n = 13) and
the highest number indicating that their duration of employment is 16 or more (n = 23). The
figure below depicts the years of employment of the respondents.
49%
47%
4%
Respondent Age
18-38 (Millennials)
39-59 (Generation X)
60-77 (Baby Boomers)
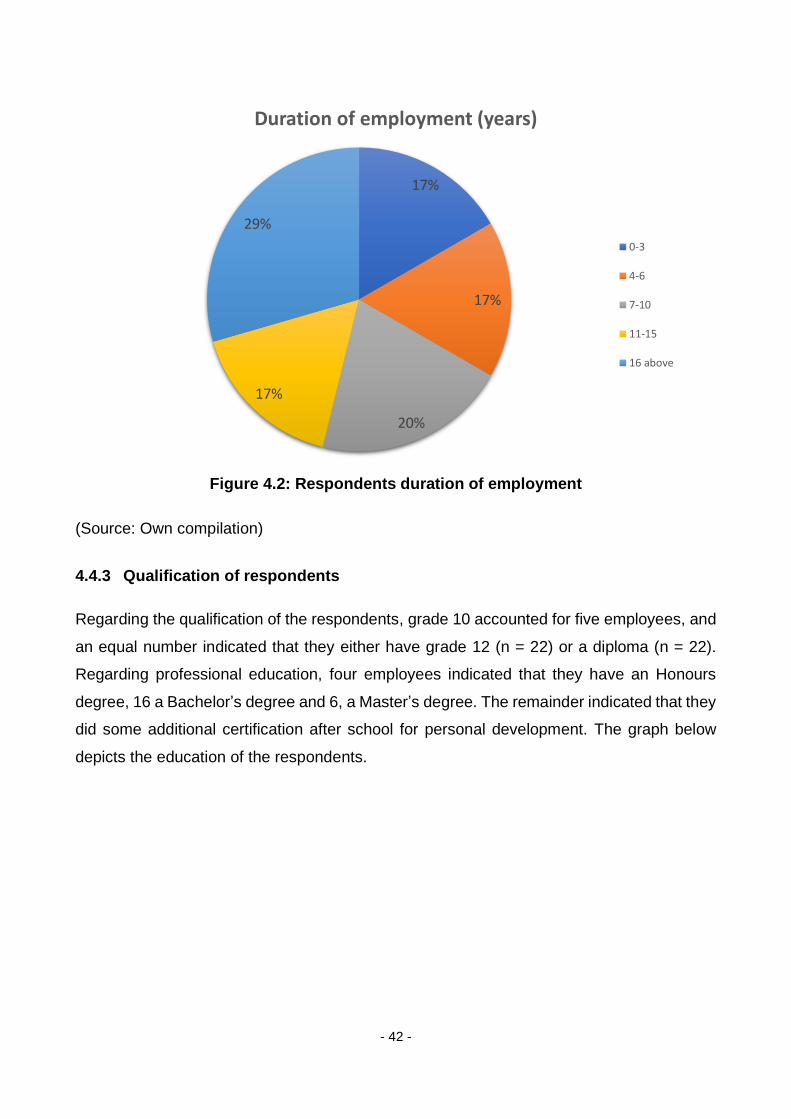
- 42 -
Figure 4.2: Respondents duration of employment
(Source: Own compilation)
4.4.3 Qualification of respondents
Regarding the qualification of the respondents, grade 10 accounted for five employees, and
an equal number indicated that they either have grade 12 (n = 22) or a diploma (n = 22).
Regarding professional education, four employees indicated that they have an Honours
degree, 16 a Bachelor’s degree and 6, a Master’s degree. The remainder indicated that they
did some additional certification after school for personal development. The graph below
depicts the education of the respondents.
17%
17%
20%
17%
29%
Duration of employment (years)
0-3
4-6
7-10
11-15
16 above

- 43 -
Figure 4.3: Qualifications of respondents
(Source: Own compilation)
4.4.4 Respective departments of respondents
As described in Chapter 3.3.1, the company consist of various departments. The majority of
the customer-facing respondents indicated that they are within the Sales division (n = 21)
and customer services department (n = 14) of the company. The smallest number of
respondents are working in the HR and Finance department (n = 6), with the second smallest
being logistics and warehousing (n = 7). The technical departments, engineering (n = 17)
and technicians (n = 13) rendered the second-largest group of respondents within the
company. The table below summarises the number of respondents from their respective
departments.
0 5 10 15 20 25
Other: explain briefly
Masters degree
Honours degree
Bachelor’s degree
Diploma
Grade 12
Grade 10
Frequency
Qu
alif
icat
ion
Qualification

- 44 -
Table 4.1: Respective employee departments
Department Frequency
Customer Services 14
Engineering 17
HR & Finance 6
Sales 21
Technical 13
Warehouse and logistics 7
(Source: Own compilation) The figure below visually depicts the data from Table 4.1.
Figure 4.4: Respective employee departments
(Source: Own compilation)
This subsequently concludes the demographic section of the respondents. The following
section describes the evaluation of the data obtained in this study.
0 5 10 15 20 25
Customer Services
Engineering
HR & Finance
Sales
Technical
Warehouse and logistics
Frequency
Dep
artm
ent
Department

- 45 -
4.5 EVALUATION OF DATA QUALITY
4.5.1 Evaluation of reliability
To evaluate the reliability of the data regarding the employee motivation and engagement
questionnaires, the Cronbach’s alpha index was subsequently applied to the respective
constructs, and the results tabulated below.
Table 4.2: Reliability of measuring instruments
Constructs for WEIMS and UWES Number
of items
Cronbach’s
alpha
WEIMS: Work Extrinsic and Intrinsic Motivation Scale 18 0.88
Intrinsic Motivation 3 0.87
Integrated Regulation 3 0.77
Identified Regulation 3 0.78
Introjected Regulation 3 0.79
External Regulation 3 0.72
Amotivation 3 0.63
UWES: Utrecht Work Engagement Scale 17 0.94
Vigour 6 0.86
Dedication 5 0.86
Absorption 6 0.82
(Source: Own compilation)
From the table above, it is evident that all the reported Cronbach Alpha values were above
the guideline value of 0,7, except for Amotivation in the WEIMS. However, values between
0.6 and 0.7 still indicate acceptable levels of reliability (Ursachi et al., 2015).

- 46 -
4.6 DESCRIPTIVE STATISTICS
4.6.1 Employee motivation
The results of the WEIMS are presented in Table 4.5 and the recorded mean and standard
deviation in Table 4.3. The constructs, as described in Chapter 2.2.4 regarding the Self-
Determination Theory, were subsequently determined using the following:
• Intrinsic Motivation = Mean (B4, B8, B15)
• Integrated Regulation = Mean (B5, B10, B18)
• Identified Regulation = Mean (B1, B7, B14)
• Introjected Regulation = Mean (B6, B11, B13)
• External Regulation = Mean (B2, B9, B16)
• Amotivation = Mean (B3, B12, B17)
Table 4.3: Mean values of the WEIMS
Constructs Mean Standard Deviation
Intrinsic Motivation 5.61 1.17
Integrated Regulation 5.09 1.02
Identified Regulation 4.95 1.08
Introjected Regulation 5.52 1.09
External Regulation 5.00 0.99
Amotivation 3.35 0.94
(Source: Own compilation)
The following figure visualises the results obtained from the WEIMS.

- 47 -
Figure 4.5: Mean values of the WEIMS
(Source: Own compilation)
From the data provided in Table 4.3 and Figure 4.5 above, it is evident that the highest
construct to why the respondents are presently involved in their work was Intrinsic Motivation
with a mean value of 5.61. This suggests that the sample found their work activities as
inherently satisfying and interesting. The second highest construct was Introjected
Regulation with a mean value of 5.52. This means that the sample is also motivated through
contingencies of self-worth, for example, self-esteem or guilt. The third highest construct
resulted in Integrated Regulation with a mean value of 5.09, which indicated that the sample
engaged and identified with activities to the extent to their self-identity. External Regulation
and Identified Regulation were slightly lower with respective mean values of 5 and 4.95. This
suggests that the sample was also motivated purely just to obtain a reward and because
they found some value in their work activities. It was also noted that to some extent, the
sample indicated moderate levels of Amotivation; which means that some lack any form of
intrinsic and extrinsic motivation. The data indicated that the sample group was slightly more
towards the right of the Self-Determination continuum as discussed in Chapter 2.2.4, this
suggests that the employees are more self-determined.
3.35
5
5.52
4.95 5.09
5.61
0
1
2
3
4
5
6
Amotivation ExternalRegulation
IntrojectedRegulation
IdentifiedRegulation
IntegratedRegulation
IntrinsicMotivation
Mean values of the WEIMS

- 48 -
From the literature described in Chapter 2.2.4, the level of self-determination can be
presented by a single score known as the self-determination index (W-SDI) (Tremblay et al.,
2009). This score was subsequently calculated for the sample group to determine the overall
level of self-determination. The results are tabulated below and indicated that the minimum
level of self-determination was negative 13.33. This indicated that some employees are less
self-determined (toward the left of the continuum, see Figure 4.5). The maximum score was
obtained at 17.33 which indicated that others are more intrinsically motivated; the mean
value of 6.38 (SD = 5.79) indicated that the overall sample is more toward the right of the
continuum of self-determination.
Table 4.4: Sample group motivation index
N Minimum Maximum Mean Standard Deviation
Motivation Index 73 -13.33 17.33 6.38 5.79
(Source: Own compilation)
From the table below (see Table 4.5), the highest mean was reported for question B15
(mean = 5.68, SD = 1.35) indicating that respondents on average strongly agreed that they
are presently involved in their current work for the satisfaction they experience when they
are successful at doing difficult tasks. The lowest was reported for question B3 (mean =
2.60, SD = 1.10) indicating respondents on average disagreed that they do not seem to be
able to manage the important tasks related to their jobs.

- 49 -
Table 4.5: Results of the WEIMS
I am presently involved in my work...
Ve
ry S
tro
ng
ly
Dis
ag
ree
Str
on
gly
Dis
ag
ree
Dis
ag
ree
Neit
he
r
Ag
ree
Str
on
gly
Ag
ree
Ve
ry S
tro
ng
ly
Ag
ree
To
tal
Me
an
Sta
nd
ard
Dev
iati
on
B1 …Because this is the type of job I chose to do to attain a certain lifestyle
2 5 10 8 27 16 5 73 4.66 1.46
B2 …For the income it provides me
1 3 6 7 34 15 7 73 4.96 1.27
B3
…I ask myself this question, I do not seem to be able to manage the important tasks related to this work
9 28 25 7 3 0 1 73 2.60 1.10
B4 …Because I derive much pleasure from learning new things
3 0 2 3 22 26 17 73 5.56 1.34
B5 …Because it has become a fundamental part of who I am 2 2 4 4 30 24 7 73 5.16 1.29
B6 …Because I want to succeed at this job, if not I would be very ashamed of myself
1 3 4 4 18 29 14 73 5.44 1.36
B7 …Because I chose this type of work to attain my career goals
1 1 5 9 30 22 5 73 5.08 1.15
B8 …For the satisfaction, I experience from taking on interesting challenges
2 1 2 1 22 32 13 73 5.58 1.24
B9 …Because it allows me to earn money
1 2 4 6 33 17 10 73 5.18 1.24
B10 …Because it is part of the way in which I have chosen to live my life
0 0 9 11 31 15 7 73 5.00 1.12
B11 …Because I want to be very good at this work, otherwise I would be very disappointed
0 1 6 3 25 18 20 73 5.55 1.25
B12 …I do not know why we are provided with unrealistic working conditions
3 13 20 19 15 2 1 73 3.55 1.27
B13 …Because I want to be a "winner" in life
2 0 1 7 22 22 19 73 5.59 1.27
B14 …Because it is the type of job I have chosen to attain certain important objectives
2 1 4 8 28 24 6 73 5.12 1.25
B15
…For the satisfaction, I experience when I am successful at doing difficult tasks
3 0 2 2 18 28 20 73 5.68 1.35
B16 …Because this type of work provides me with security
0 5 5 9 33 17 4 73 4.88 1.21
B17 …I do not know, too much is expected of us
4 8 14 18 24 4 1 73 3.90 1.35
B18 …Because this job is a part of my life 1 3 3 10 26 22 8 73 5.12 1.28
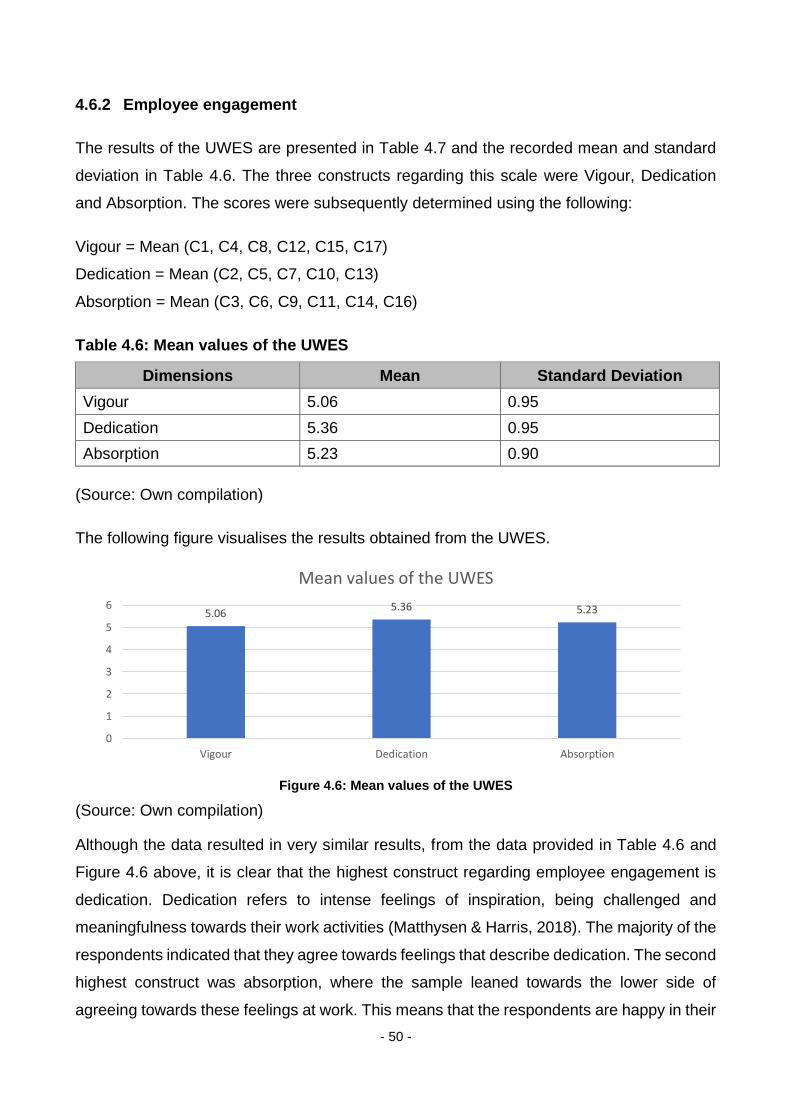
- 50 -
4.6.2 Employee engagement
The results of the UWES are presented in Table 4.7 and the recorded mean and standard
deviation in Table 4.6. The three constructs regarding this scale were Vigour, Dedication
and Absorption. The scores were subsequently determined using the following:
Vigour = Mean (C1, C4, C8, C12, C15, C17)
Dedication = Mean (C2, C5, C7, C10, C13)
Absorption = Mean (C3, C6, C9, C11, C14, C16)
Table 4.6: Mean values of the UWES
Dimensions Mean Standard Deviation
Vigour 5.06 0.95
Dedication 5.36 0.95
Absorption 5.23 0.90
(Source: Own compilation)
The following figure visualises the results obtained from the UWES.
Figure 4.6: Mean values of the UWES
(Source: Own compilation)
Although the data resulted in very similar results, from the data provided in Table 4.6 and
Figure 4.6 above, it is clear that the highest construct regarding employee engagement is
dedication. Dedication refers to intense feelings of inspiration, being challenged and
meaningfulness towards their work activities (Matthysen & Harris, 2018). The majority of the
respondents indicated that they agree towards feelings that describe dedication. The second
highest construct was absorption, where the sample leaned towards the lower side of
agreeing towards these feelings at work. This means that the respondents are happy in their
5.065.36 5.23
0
1
2
3
4
5
6
Vigour Dedication Absorption
Mean values of the UWES

- 51 -
workplace and agree that they struggle to detach themselves from work. The lowest
construct was found to be vigour, where the respondents agreed that they have energy and
stamina in the workplace.
From the following table, the highest mean was reported for question C3 (mean = 5.82, SD
= 1.09) indicating that respondents on average strongly agreed that time flies when they are
working. The lowest was reported for question C1 (mean = 4.57, SD = 1.17) indicating
respondents on average agreed that they are bursting with energy at work. The following
table summarises the results of the UWES.
Table 4.7: Results of the UWES
Ve
ry S
tro
ng
ly
Dis
ag
ree
Str
on
gly
Dis
ag
ree
Dis
ag
ree
Neit
he
r
Ag
ree
Str
on
gly
Ag
ree
Ve
ry S
tro
ng
ly
Ag
ree
To
tal
Me
an
Sta
nd
ard
Dev
iati
on
C1 At my work, I feel bursting
with energy 1 5 5 15 34 11 1 72 4.57 1.17
C2 I find the work that I do full of
meaning and purpose 1 2 4 4 29 29 7 72 5.24 1.20
C3 Time flies when I am working 1 0 1 4 17 29 20 72 5.82 1.09
C4 At my job, I feel strong and
vigorous (full of energy) 1 2 7 7 33 15 7 72 4.97 1.26
C5 I am enthusiastic about my
job 1 0 5 5 22 28 11 72 5.43 1.18
C6 When I am working, I forget everything else around me
1 1 12 12 18 22 6 72 4.88 1.35
C7 My job inspires me 1 1 7 6 28 21 8 72 5.14 1.25
C8 When I get up in the morning,
I feel like going to work 3 3 7 14 28 13 4 72 4.61 1.38
C9 I feel happy when I am
working intensely 1 1 2 5 34 25 4 72 5.24 1.03
C10 I am proud of the work that I
do 1 0 2 2 21 29 17 72 5.74 1.09
C11 I am immersed in my work 1 0 2 2 25 25 17 72 5.68 1.10
C12 I can continue working for very long periods at a time
1 3 7 6 18 21 16 72 5.28 1.48
C13 To me, my job is challenging 1 1 4 7 25 26 8 72 5.28 1.19
C14 I get carried away when I am
working 1 0 9 11 20 24 7 72 5.07 1.27
C15 At my job, I am very resilient,
mentally 1 0 2 6 31 26 6 72 5.33 1.01
C16 It is difficult to detach myself
from my job 1 4 15 5 24 16 7 72 4.71 1.48
C17 At my work, I always
persevere, even when things do not go well
1 0 2 0 28 29 12 72 5.63 1.01

- 52 -
4.6.3 Incentive strategy
As discussed in Chapter 2.4, incentives can be defined as any promise of some form of a
reward based on performance and mainly motivate employees by influencing their behaviour
to produce high standard and quality work (Cerasoli et al., 2014). The following section will
determine whether the respondents will be willing to participate in a corporate points-based
reward scheme with game-like activities as well as their preferred incentive methods.
4.6.3.1 Point-based reward scheme
A reward system comprises more than just a basic salary alone. It can be regarded as
intrinsic, extrinsic, monetary and non-monetary (Victor & Hoole, 2017). Many organisations
offer their customers great rewards for being loyal to their company or brand. This could
subsequently result in higher customer satisfaction towards the company and aid the
company profitability and market share.
From the questionnaire, 97.77% of the respondents indicated that they are familiar with
reward schemes like FNB eBucks and Discovery Vitality and 69% of the respondents
indicated that they are members of such reward schemes. These respondents (n=49), on
average (mean = 4.57, SD = 1.46) indicated they sometimes try to meet their goals. The
following table contains the descriptive data from the questionnaire.
Table 4.8: Respondents who actively try to reach their goals
Nev
er
Alm
os
t
Nev
er
Rare
ly
So
me
tim
es
Oft
en
Ve
ry O
fte
n
Alw
ay
s
To
tal
Me
an
Sta
nd
ard
Dev
iati
on
Do you actively try to reach
your goals? 2 1 7 15 10 9 5 49 4.57 1.46
(Source: Own compilation)
On average, the respondents indicated that they would, however, be willing to participate in
a corporate points-based reward scheme within the organisation. The table below
summarises the respondent’s willingness.
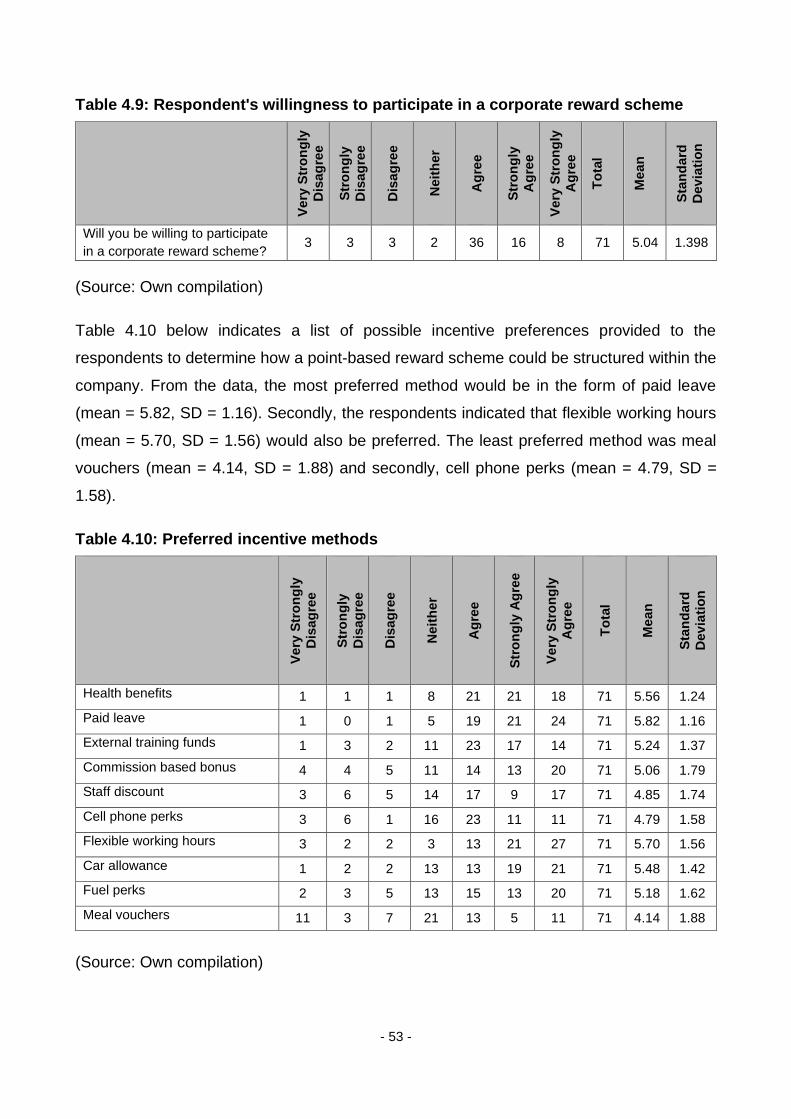
- 53 -
Table 4.9: Respondent's willingness to participate in a corporate reward scheme
Ve
ry S
tro
ng
ly
Dis
ag
ree
Str
on
gly
Dis
ag
ree
Dis
ag
ree
Neit
he
r
Ag
ree
Str
on
gly
Ag
ree
Ve
ry S
tro
ng
ly
Ag
ree
To
tal
Me
an
Sta
nd
ard
Dev
iati
on
Will you be willing to participate
in a corporate reward scheme? 3 3 3 2 36 16 8 71 5.04 1.398
(Source: Own compilation)
Table 4.10 below indicates a list of possible incentive preferences provided to the
respondents to determine how a point-based reward scheme could be structured within the
company. From the data, the most preferred method would be in the form of paid leave
(mean = 5.82, SD = 1.16). Secondly, the respondents indicated that flexible working hours
(mean = 5.70, SD = 1.56) would also be preferred. The least preferred method was meal
vouchers (mean = 4.14, SD = 1.88) and secondly, cell phone perks (mean = 4.79, SD =
1.58).
Table 4.10: Preferred incentive methods
Ve
ry S
tro
ng
ly
Dis
ag
ree
Str
on
gly
Dis
ag
ree
Dis
ag
ree
Neit
he
r
Ag
ree
Str
on
gly
Ag
ree
Ve
ry S
tro
ng
ly
Ag
ree
To
tal
Me
an
Sta
nd
ard
Dev
iati
on
Health benefits 1 1 1 8 21 21 18 71 5.56 1.24
Paid leave 1 0 1 5 19 21 24 71 5.82 1.16
External training funds 1 3 2 11 23 17 14 71 5.24 1.37
Commission based bonus 4 4 5 11 14 13 20 71 5.06 1.79
Staff discount 3 6 5 14 17 9 17 71 4.85 1.74
Cell phone perks 3 6 1 16 23 11 11 71 4.79 1.58
Flexible working hours 3 2 2 3 13 21 27 71 5.70 1.56
Car allowance 1 2 2 13 13 19 21 71 5.48 1.42
Fuel perks 2 3 5 13 15 13 20 71 5.18 1.62
Meal vouchers 11 3 7 21 13 5 11 71 4.14 1.88
(Source: Own compilation)
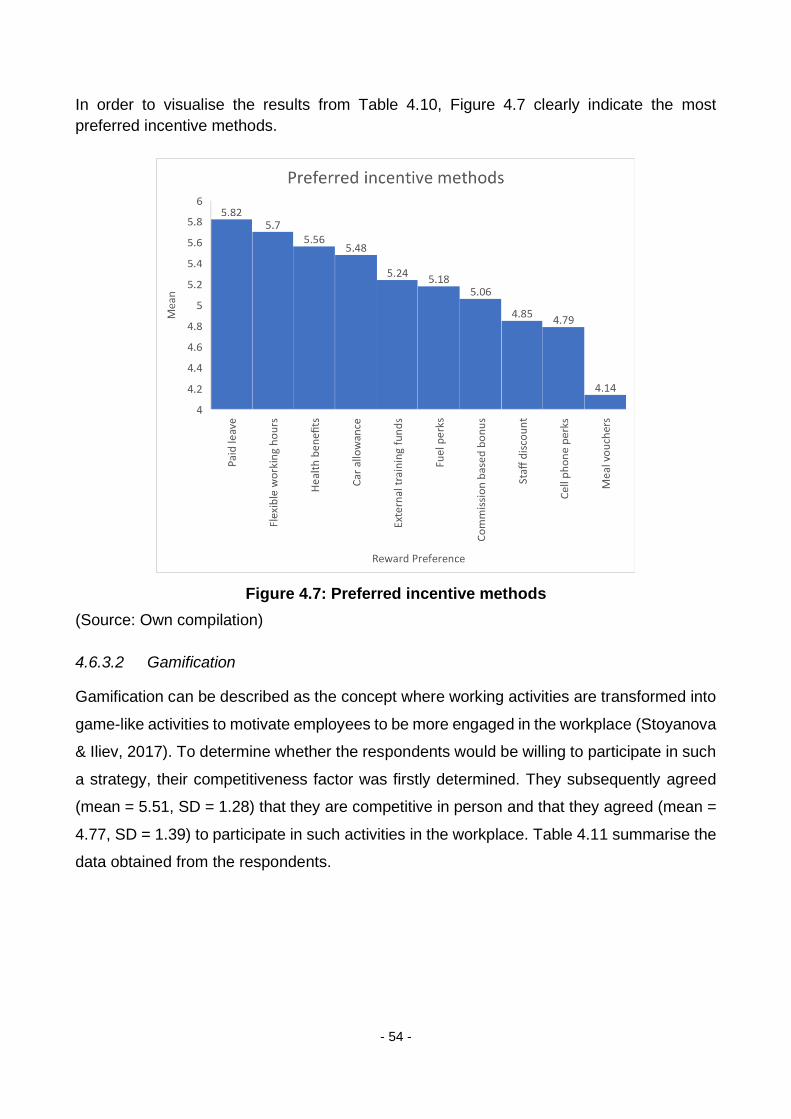
- 54 -
In order to visualise the results from Table 4.10, Figure 4.7 clearly indicate the most
preferred incentive methods.
Figure 4.7: Preferred incentive methods
(Source: Own compilation)
4.6.3.2 Gamification
Gamification can be described as the concept where working activities are transformed into
game-like activities to motivate employees to be more engaged in the workplace (Stoyanova
& Iliev, 2017). To determine whether the respondents would be willing to participate in such
a strategy, their competitiveness factor was firstly determined. They subsequently agreed
(mean = 5.51, SD = 1.28) that they are competitive in person and that they agreed (mean =
4.77, SD = 1.39) to participate in such activities in the workplace. Table 4.11 summarise the
data obtained from the respondents.
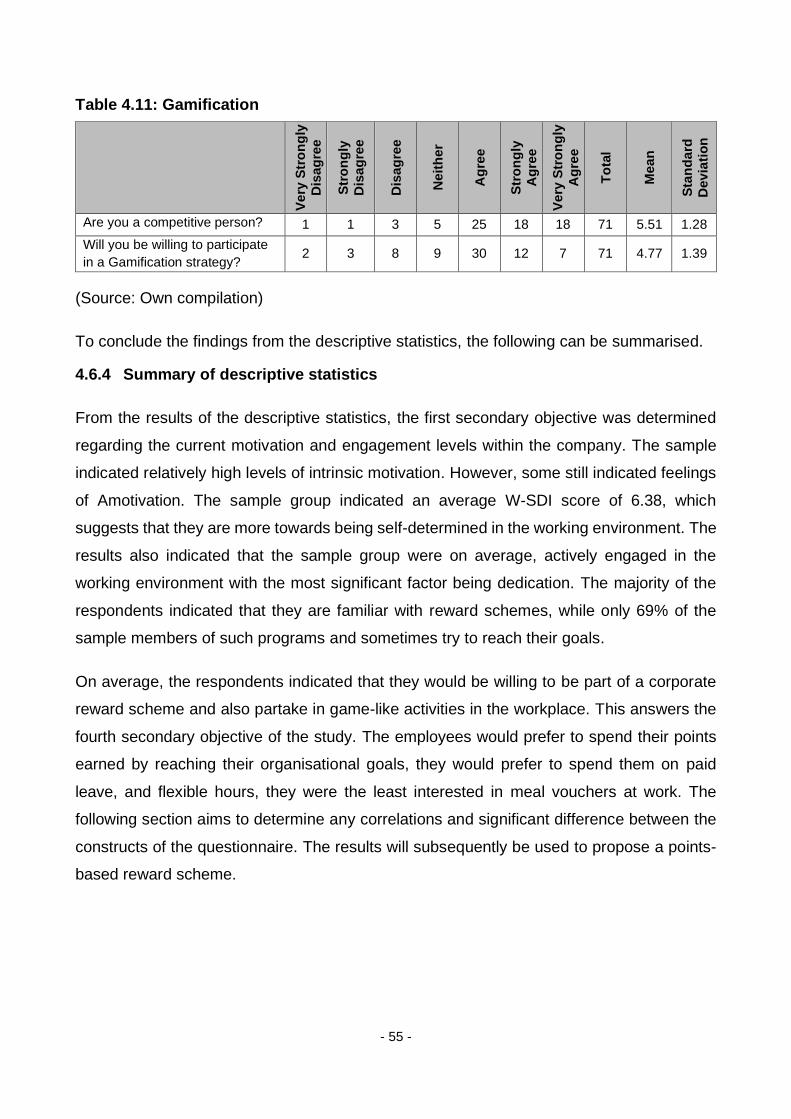
- 55 -
Table 4.11: Gamification
Ve
ry S
tro
ng
ly
Dis
ag
ree
Str
on
gly
Dis
ag
ree
Dis
ag
ree
Neit
he
r
Ag
ree
Str
on
gly
Ag
ree
Ve
ry S
tro
ng
ly
Ag
ree
To
tal
Me
an
Sta
nd
ard
Dev
iati
on
Are you a competitive person? 1 1 3 5 25 18 18 71 5.51 1.28
Will you be willing to participate
in a Gamification strategy? 2 3 8 9 30 12 7 71 4.77 1.39
(Source: Own compilation)
To conclude the findings from the descriptive statistics, the following can be summarised.
4.6.4 Summary of descriptive statistics
From the results of the descriptive statistics, the first secondary objective was determined
regarding the current motivation and engagement levels within the company. The sample
indicated relatively high levels of intrinsic motivation. However, some still indicated feelings
of Amotivation. The sample group indicated an average W-SDI score of 6.38, which
suggests that they are more towards being self-determined in the working environment. The
results also indicated that the sample group were on average, actively engaged in the
working environment with the most significant factor being dedication. The majority of the
respondents indicated that they are familiar with reward schemes, while only 69% of the
sample members of such programs and sometimes try to reach their goals.
On average, the respondents indicated that they would be willing to be part of a corporate
reward scheme and also partake in game-like activities in the workplace. This answers the
fourth secondary objective of the study. The employees would prefer to spend their points
earned by reaching their organisational goals, they would prefer to spend them on paid
leave, and flexible hours, they were the least interested in meal vouchers at work. The
following section aims to determine any correlations and significant difference between the
constructs of the questionnaire. The results will subsequently be used to propose a points-
based reward scheme.

- 56 -
4.7 INFERENTIAL STATISTICS
Inferential statistics were used to determine whether there are correlations and significant
effects between employee motivation and engagement, and how the employees wish to be
rewarded. This information could then be used to propose a points-based reward strategy
with game-like activities. As discussed in Chapter 3.5.2, the effect size can be used for
various statistical indices, namely, mean differences and correlation coefficient and was
subsequently used to determine any practical significance.
4.7.1 Differences between means
Cohen’s recommended cut-off points regarding interpretations of differences between
means and effect size are as follow (Khalilzadeh & Tasci, 2017):
• Small effect (no practical significant relationship) = 0.2
• Medium effect (medium practical significant relationship) = 0.5
• Large effect (large practical significant relationship) = 0.8
4.7.1.1 Effect size between motivation and employee age
As discussed in Chapter 2.5, employers must understand the dynamics and needs of the
employees within the workforce in terms of their age groups (generations). This will aid with
the development of a strategic reward program that could positively impact the motivation
and engagement of the multigenerational workforce (Fahy & Moylan, 2019).
In Chapter 4.2.2, the age distribution of the employees within the company was discussed
and resulted in 49% Millennials (18-38), 47% Generation X (39-59) and 4% Baby Boomers
(60-77). To ensure sufficient group sizes for analysis, the Baby Boomers and Generation X
samples were combined to form a single group called the “older generation”.
The table below indicates the effect regarding the Self-determination factors and employee
age groups. The most significant reported effect size indicated that a difference leans
towards being practically visible (d = 0.35) between the means of the Millennials and the
older generations with regards to the amount of Amotivation experienced. The Millennials
leaned towards disagreeing (mean = 3.18, SD = 0.86) regarding Amotivation while the older
generations leaned towards being indecisive (mean = 3.53, SD = 1.00). The significance
between the remained of the self-determination factors, and the generation groups indicated
practically small differences.

- 57 -
Table 4.12: Effect size between motivation and employee age
WEIMS Age
Group N Mean
Std. Deviation
Sig. (2-tailed) Effect size
Intrinsic Motivation 18-38 37 5.631 1.259
0.864 0.04 39-77 36 5.583 1.085
Integrated Regulation
18-38 37 5.126 1.120 0.798 0.05
39-77 36 5.065 0.911
Identified Regulation
18-38 37 5.099 1.206 0.246 0.24
39-77 36 4.806 0.920
Introjected Regulation
18-38 37 5.432 1.251 0.465 0.15
39-77 36 5.620 0.909
External Regulation 18-38 37 5.108 0.994
0.372 0.21 39-77 36 4.898 1.001
Amotivation 18-38 37 3.180 0.859
0.117 0.35 39-77 36 3.528 1.006
(Source: Own compilation)
4.7.1.2 Effect size between engagement and employee age
Similarly, the effect between employee generations and the three engagement constructs
can be determined to establish whether there are any significant differences. The table
below indicates the results obtained. The most significant difference reported was the level
of Vigour at 0.33, where Millennials indicated lower (mean = 4.88, SD = 1.11) levels of
energy and resilience towards their work activities in comparison with the older generations
(mean = 5.25, SD = 0.73). The levels of dedication and absorption indicated small significant
differences.
Table 4.13: Effect size between engagement and employee age
UWES Age
Group N Mean Std. Deviation Sig. (2-tailed) Effect size
Vigour 18-38 36 4.884 1.107
0.108 0.33 39-77 36 5.245 0.731
Dedication 18-38 36 5.222 1.144
0.210 0.25 39-77 36 5.506 0.702
Absorption 18-38 36 5.120 1.064
0.297 0.21 39-77 36 5.342 0.690
(Source: Own compilation)

- 58 -
4.7.2 Spearman’s rho correlation
For Cohen’s standard regarding correlation coefficients, values between 0.1 and 0.29 can
be considered small, with no practical significance from 0.3 to 0.49, the significance will be
medium, and above 0.5, will have a large practical significance. The data below tabulates
the correlation between the motivation index and the engagement constructs.
In all three constructs, a medium significance is practically visible with Vigour (r = 0.393),
Dedication (r = 0.355) and Absorption (r = 0.337). This indicates that employees who are
more self-determined (motivated) tend to be more engaged in the workplace.
Table 4.14: Correlation between engagement and the motivation index
Engagement constructs
Motivation Index
Spearman's rho
Vigour
Correlation Coefficient .393**
Sig. (2-tailed) 0.001
N 72
Dedication
Correlation Coefficient .355**
Sig. (2-tailed) 0.002
N 72
Absorption
Correlation Coefficient .337**
Sig. (2-tailed) 0.004
N 72
(Source: Own compilation) ** Correlation is significant at the 0.01 level (2-tailed).
4.7.2.1 Relationship between the types of motivation and those who are part of a reward scheme
For this study, it was important to examine whether there is a correlation between the types
of motivation and how actively employees try to meet their goals. Only the employees who
are currently part of a reward scheme were considered. From the table below, it was noted
that there is a negative correlation (r = -0.183) with a small to medium significance between
Amotivation and how actively they try to reach their goals. This is expected because
Amotivation is described by a lack of any intrinsic and extrinsic motivation. The most
significant positive correlation (0.198) indicated was External Regulation with a small to
medium significance. This was also expected because this type of motivation relates to
activities done purely just to obtain a reward. The other motivation types resulted in no

- 59 -
practical significance. This indicates that the employees who are part of reward systems
only try to achieve their goals to obtain additional extrinsic rewards.
Table 4.15: Correlation between motivation and those who are part of a reward scheme
Intrinsic Motivation
Integrated Regulation
Identified Regulation
Introjected Regulation
External Regulation
Amotivation
Spearman's rho
Correlation Coefficient
0.073 -0.081 0.026 -0.013 0.198 -0.183
Sig. (2-tailed)
0.617 0.580 0.858 0.928 0.172 0.207
N 49 49 49 49 49 49
(Source: Own compilation)
4.7.2.2 Relationship between the types of motivation and those willing to be part of a corporate reward scheme
In order to determine whether a corporate reward scheme will be feasible within the
company, it was required to determine the correlation between the types of motivation and
the willingness to partake in a corporate reward scheme. The table below indicates that
there is a positive correlation between intrinsic motivation (r = 0.223) and integrated
regulation (r = 0.250) with a significance that leans toward being practically visible to a
medium extent. These two motivation types are classified as being more self-determined
than the other types, which indicated a relatively small practical significance. It can thus be
concluded that a corporate reward scheme will attract more self-determined employees.
Table 4.16: Correlation between motivation and those willing to be part of a corporate reward scheme
Intrinsic Motivation
Integrated Regulation
Identified Regulation
Introjected Regulation
External Regulation
Amotivation
Spearman's rho
Correlation Coefficient
0.223 0.250 0.192 0.176 0.158 0.082
Sig. (2-tailed)
0.062 0.035 0.108 0.142 0.188 0.497
N 71 71 71 71 71 71
(Source: Own compilation)

- 60 -
4.7.2.3 Relationship between the types of motivation and those willing to be part of a Gamification strategy
The literature indicated in Chapter 2.4.2 that a Gamification strategy would provide and
attract more intrinsically motivated employees and extrinsic to some degree. This would
result in a higher motivated workforce and could affect company performance (Klevers et
al., 2015). The results obtained confirmed the statements made in the literature with a
positive correlation between both intrinsic and extrinsic motivation types and Gamification
strategies. The more self-determined employees indicated a medium practical significant
relationship with Gamification (intrinsic, r = 0.304 and integrated regulation, r = 0.314).
Amotivation resulted in a negative correlation (r = -0.120) with Gamification that indicated
that the less motivated employees would not partake in such a strategy.
Table 4.17: Correlation between motivation and those willing to partake in Gamification
Intrinsic Motivation
Integrated Regulation
Identified Regulation
Introjected Regulation
External Regulation
Amotivation
Spearman's rho
Correlation Coefficient
0.304 0.314 0.271 0.200 0.289 -0.120
Sig. (2-tailed)
0.010 0.008 0.022 0.095 0.015 0.320
N 71 71 71 71 71 71
(Source: Own compilation)
4.7.3 Structure of the incentive strategy
In order to ensure that the correct constructs are included in the points-based reward
scheme, the effect between the preferred reward methods and the different generations was
calculated. The most significant reported effect size indicated a difference that leans towards
being practically visible (d = 0.37) between the means of the Millennial group and the older
generations with regards to staff discount being a preferred incentive method. The Millennial
group on average leaned toward being indecisive (mean = 4.47, SD = 2.05) that it is a
preferred incentive method and the older generation group agreed (mean = 5.23, SD = 1.26).
The second most significant effect size indicated that the Millennial group leaned towards
agreeing (mean = 5.36, SD = 1.33) that health benefits would be preferred, while the older
generations leaned towards strongly agreeing (mean = 5.77, SD = 1.11). The remainder of
the preferences indicated small differences between the two groups.

- 61 -
Table 4.18: Age effect on rewards preference
Preferred rewards Age Group N Mean Std.
Deviation Sig.
(2-tailed) Effect size
Health benefits 18-38 36 5.36 1.33
0.164 0.31 39-77 35 5.77 1.11
Paid leave 18-38 36 5.69 1.37
0.370 0.18 39-77 35 5.94 0.91
External training funds 18-38 36 5.36 1.57
0.449 0.16 39-77 35 5.11 1.13
Commission based bonus 18-38 36 5.22 1.85
0.431 0.18 39-77 35 4.89 1.73
Staff discount 18-38 36 4.47 2.05
0.065 0.37 39-77 35 5.23 1.26
Cell phone perks 18-38 36 4.64 1.91
0.418 0.16 39-77 35 4.94 1.14
Flexible working hours 18-38 36 5.67 1.82
0.838 0.04 39-77 35 5.74 1.27
Car allowance 18-38 36 5.44 1.56
0.837 0.04 39-77 35 5.51 1.29
Fuel perks 18-38 36 4.97 1.76
0.266 0.24 39-77 35 5.40 1.44
Meal vouchers 18-38 36 3.83 2.22
0.163 0.28 39-77 35 4.46 1.42
(Source: Own compilation)
4.7.4 Summary of inferential statistics
The inferential statistics indicated that the older generations (ages from 39-77) are more
Amotivated than the Millennials. However, the older generations were more vigorously
engaged (levels of energy) in the workplace. To establish whether motivated employees are
more engaged in their working environment and to satisfy the second, secondary objective,
the correlation between these two factors was calculated. The result indicated that there is
a significance between high levels of motivation with regards to the dimensions of
engagement that are practically visible. In all three constructs of engagement, a medium
significance is practically significant with Vigour (r = 0.393), Dedication (r = 0.355) and
Absorption (r = 0.337) with regards to the W-SDI score of motivation. This indicates that
employees who are more self-determined (motivated) tend to be more engaged in the
workplace.

- 62 -
For this study, it was important to examine whether there is a relationship between the types
of motivation and how actively employees try to meet their goals (only the employees who
are currently part of a reward scheme were considered). The results indicated that there is
a negative correlation (r = -0.183) with a small to medium significance between Amotivation
and how actively they try to reach their goals. This was expected because Amotivation is
described by a lack of any intrinsic and extrinsic motivation. The most significant positive
correlation (0.198) indicated was External Regulation with a small to medium significance.
This was also expected because this type of motivation relates to activities done purely just
to obtain a reward. This subsequently satisfies the sixth secondary objective of this study.
The fifth secondary objective required the investigation of the reward preferences regarding
the different generations within the company. The results indicated that the most desired
reward preference of all the employees was flexible working hours, health benefits and paid
leave. The most significant difference between the Millennials and the older generations
indicated that the Millennials were indecisive regarding staff discounts. In comparison, the
older generations agreed that this would be a preferred method. The second most significant
difference indicated that health benefits were more significant to the older generations than
the Millennial group. The remainder of the preferences indicated no significant differences
between the two generations.
In addition to the fourth secondary objective, the correlation was determined between the
types of motivation and the willingness to partake in a corporate reward scheme. The results
indicated that there is a positive correlation between those who would partake and intrinsic
motivation and integrated regulation with a significance that leans toward being practically
visible. These two motivation types are classified as being more self-determined than other
types of motivation. It can thus be concluded that a corporate reward scheme will attract
more self-determined employees.

- 63 -
To meet the last secondary objective of this study, the proposed points-based reward
scheme should subsequently include, but not limited to the following in preferred order
according to employee generation:
• Paid leave
• Flexible working hour
• Additional health benefits
• Car allowance
• External training
• Fuel perk
• Commission based bonus
• Staff discount
• Cellular phone perks
• Meal vouchers
Gamification should also form part of the incentive strategy to attract more self-determined
employees. This was confirmed with a medium practical significant relationship between
Gamification (intrinsic, r = 0.304 and integrated regulation, r = 0.314) and the most self-
determined motivational dimensions.
4.8 CHAPTER SUMMARY
The results regarding the empirical investigation were reported and discussed in this
Chapter. The demographical information was discussed, and the reliability of the
questionnaire evaluated. Descriptive statistics were used to assess the frequencies and
means of the questionnaire. Inferential statistics were used to report and discuss the
difference between means and correlations from various factors within the questionnaire to
determine the feasibility of a points-based reward scheme with game-like activities. The
most preferred reward methods were also determined according to the respective
generation of the employees, and a reward scheme was proposed.
Chapter 5 provides conclusions regarding the literature and empirical investigation. The
limitations and the recommendations to the company investigated, and future research is
also discussed.

- 64 -
5. CHAPTER 5: CONCLUSIONS AND RECOMMENDATIONS
5.1 INTRODUCTION
This chapter provides the concluding factors regarding the results obtained from the
constructs discussed in the literature and the empirical investigation. These conclusions are
discussed with regards to the primary and secondary objectives of this study. The limitations
about this study are also discussed, and the recommendations to the company investigated
regarding the proposed incentive strategy, and for future research.
5.2 MAIN FINDINGS FROM THE STUDY
The methodology described in Chapter 3 was implemented, and the results discussed in
Chapter 4. The following conclusions could be made regarding the constructs of the
measuring instrument and the conceptual framework of the study.
5.2.1 Demographical information
The first section of the measuring instrument, as discussed in Chapter 4.2, aimed to record
the required demographical information of the respondents. The following conclusions can
thus be made from the data obtained.
• Employee age
There was almost an equal split of respondents between the ages of 18 to 38 (n =
38) and 39 to 59 (n = 37), the remainder were of the age of 60 to 77 (n = 3). To aid
with the statistical analysis, the oldest group was added to the middle age group.
They were subsequently referred to as the Millennials and the older generation. The
Millennial group (18 - 38) resulted in the largest age group within the company.
• Duration of employment
The results obtained indicated an equal number of 0-3 years (n = 13) and 4-6 years
(n = 13) of employment. The second-highest number of respondents indicated that
they are employed for 7-10 years (n = 16), with another 13, indicated that have been
working for 11-15 years (n = 13). The longest working employees indicated that their
duration of employment is 16 or more (n = 23).

- 65 -
• Qualifications of employees
Five employees indicated that they have a grade 10 qualification, while an equal
number indicated that they either have grade 12 (n = 22) or a diploma (n = 22).
Regarding professional education, four employees indicated that they have an
Honours degree, 16 a bachelor’s degree and 6, a Master’s degree. The remainder of
the respondents indicated that they did some additional certification after school for
personal and professional development.
• Respective department of employees
With the various departments within the company, as described in Chapter 3.3.1. The
Sales division (n = 21) and customer services department (n = 14) of the company
resulted in the largest group of the respondents. The smallest group indicated that
they are working in the HR and Finance department (n = 6) and the second smallest
from the logistics and warehousing departments (n = 7). On the technical side,
engineering (n = 17) and technicians (n = 13) resulted in the second-largest group of
respondents within the company.
5.2.2 Employee motivation
As discussed in Chapter 4.6.2, the WEIMS obtained the following results regarding the
constructs of employee motivation.
• The highest construct to why the respondents are presently involved in their work
resulted in intrinsic motivation. This suggests that the sample found their work
activities inherently satisfying and interesting.
• The second highest construct was Introjected Regulation. This meant that the sample
was also motivated through contingencies of self-worth, for example, self-esteem or
guilt.
• Integrated Regulation resulted in the third-highest construct, which indicated that the
sample engaged and identified with activities to the extent to their self-identity.
• The levels of External Regulation and Identified Regulation were slightly lower which
suggested that the sample was also motivated purely just to obtain a reward and
because they found some value in their work activities.

- 66 -
• There were also levels of Amotivation that suggested that some employees lack any
form of intrinsic and extrinsic motivation.
Overall, the sample resulted in a Self-Determination Index score of 6.38 that indicated that
they were slightly more towards the right of the Self-Determination continuum, as discussed
in Chapter 2.2.4.
5.2.3 Employee engagement
The results from the UWES, as discussed in Chapter 4.6.2, resulted in very similar results
regarding the employee engagement constructs. The highest construct of employee
engagement was found to be dedication, that indicated strong feelings of inspiration, being
challenged and meaningfulness towards work activities. The second highest construct was
absorption, and this indicated that the sample was happy in their workplace and agreed that
they struggled to detach themselves from their work. The lowest construct was found to be
vigour, where the respondents agreed that they have energy and stamina in the workplace.
5.2.4 Employee incentives
In order to determine whether a points-based reward scheme with game-like activities would
be feasible, the respondents were requested to complete Section D of the questionnaire.
The data indicated that 97.77% of the respondents are familiar with reward schemes like
FNB eBucks and Discovery Vitality and 69% of the respondents indicated that they are
currently members of such reward schemes. These respondents indicated they sometimes
try to meet their goals to obtain reward points. Regarding a corporate reward scheme, on
average, they indicated that they would be willing to participate in such a scheme within the
organisation.
To propose the structure for a corporate points-based reward scheme with game-like
activities. A list of possible rewards was provided to the respondents to determine the most
preferred methods. The results indicated that overall, the sample would prefer paid leave
and flexible working hours the most and meal vouchers the least. The respondents also
indicated that on average, they agreed that they are competitive persons and that they would
be willing to participate in corporate game-like activities to obtain additional rewards.

- 67 -
5.2.5 Findings regarding the study framework
From the conceptual framework as introduced in Chapter 2.1, the literature review and the
empirical investigation confirmed that there is a correlation between employee motivation,
engagement and employee performance. The statistical analysis indicated that the average
employee is moderately self-determined (mean = 6.38) according to the Self-Determination
Index. There was also a practically visible, positive correlation with a medium significance
between the three engagement constructs and employee motivation (Vigour = 0.393,
Dedication = 0.355 and Absorption = 0.337). Thus, according to the literature, when
employees are more motivated and engaged in their working environment, their
performance would also increase. To achieve higher levels of motivation and engagement,
a corporate points-based reward scheme with game-like activities could be implemented
where employees would obtain points on an annual basis based on their performance and
spend them as they wish. The structure of the incentive strategy will be discussed in the
following section regarding the evaluation of the study.
(Source: Own compilation)
Extrinsic
Motivation
Employee
performance
Employee
Motivation
Employee
Engagement
Intrinsic
Motivation
Incentive
Strategy
Figure 5.1: Study framework

- 68 -
5.3 EVALUATION OF THE STUDY
The conclusions regarding the primary and secondary objectives pertaining to this study will
be discussed below. The objectives were constructed to determine the current levels of
employee motivation and engagement and whether they would be willing to participate in a
corporate points-based reward scheme with game-like activities.
5.3.1 Primary objective
The primary objective of this study was to ascertain whether a points-based reward incentive
scheme with game-like activities would be feasible within the company investigated to
encourage employees to be more engaged in the workplace. From the literature review, it
was confirmed that employees strive to perform better when they could achieve greater
rewards in addition to their regular salary (Ganta, 2014). This could be obtained using an
incentive strategy and would subsequently lead to continuous performance improvements
and enhanced organisational and individual growth (Hamari & Koivisto, 2015; Klevers et al.,
2015; Ruhi, 2015). This has the potential to increase the overall engagement and
motivational levels of the employees. The literature also indicated from various scenarios,
that game-like activities has led to the successful increase in the motivational levels of users
and increased their engagement in working activities (Morschheuser et al., 2017). Thus, a
reward scheme could include both a points-based reward scheme and game-like activities
through a Gamification strategy. The literature confirmed that both these strategies have a
direct impact on the engagement and motivational levels of a multigenerational workforce.
The statistical analysis confirmed the constructs described in the literature regarding
motivation and engagement, where the results indicated a positive correlation between the
sample motivational and engagement levels. Similarly, the analysis revealed that people
would actively try to reach their goals to obtain a reward. Thus, it implies that a corporate
points-based reward scheme with game-like activities would be feasible within the
engineering services entity. This has the potential to increase the overall motivation and
engagement levels within the organisation.
The structure of the proposed incentive strategy will be discussed in the section below.

- 69 -
5.3.2 Secondary objectives
For this study, seven secondary objectives were defined. These were explicitly formulated
to determine whether there are specific correlations between the constructs described in this
study. The following conclusions could be made regarding the secondary objectives of the
study.
• To determine the current motivational and engagement levels within the
company.
The first secondary objective was to determine the current motivational and
engagement levels within the company. The results indicated that the highest construct
to why the respondents are presently involved in their work was intrinsic motivation with
a mean value of 5.61, which suggested that the employees found their work activities
inherently satisfying. Introjected Regulation resulted in the second-highest construct
with a mean value of 5.52, which indicated that they also found motivation through
contingencies of self-worth. The third highest construct indicated motivation through
integrated regulation with a mean value of 5.09, which subsequently indicated that they
identified with their work activities to the extent of self-identity. External Regulation and
Identified Regulation were slightly lower with respective mean values of 5 and 4.95. This
suggests that the sample was also motivated purely to obtain a reward and because
they found some value in their work activities.
The employees indicated some level of Amotivation, which suggests that there is a lack
of any intrinsic and extrinsic motivation. Overall, the sample indicated a self-
determination index of 6.38, which indicates that the sample was more towards the right
of the self-determination continuum. The results regarding the engagement constructs
indicated that the sample experience the highest levels of dedication, which indicated
that they are inspired and find meaning in their work activities. The second highest
construct indicated that the sample agreed that they sometimes find it difficult to detach
themselves from their work. The last construct of engagement resulted in very similar
results to absorption. They indicated that they agree to some energy levels and stamina
in the working environment. In conclusion, the amount of motivation and engagement
of the employees within the company are moderately self-determined and did not

- 70 -
indicate exceptionally high levels of engagement (only agreed on average to the
engagement constructs).
• To investigate the relationship between employee engagement and motivation.
The second objective was to investigate the relationship between employee
engagement and motivation. This was required to determine whether motivated
employees are engaged in the workplace. To determine the correlation, the sample self-
determination index was compared to the three constructs of engagement. The results
from the Spearman’s rho correlation indicated that there is a practically visible
significance between high levels of motivation and the engagement constructs. This
suggests that employees who are more self-determined (motivated) tend to be more
engaged in the workplace.
• To investigate reward schemes and Gamification as incentive strategies based
on the literature.
The third objective was to investigate based on the literature available, whether reward
schemes and Gamification could be used to increase employee engagement and
motivation. The literature indicated that the consumer industry incorporated reward
schemes in their business strategy to engage customers in long-term relationships
where consumers would be able to earn and spend their loyalty points (Chang & Wong,
2018). The majority of the reward schemes are aimed towards economic benefits using
points that could be earned and spent according to the client’s preference (Hamari &
Koivisto, 2015). The literature indicated that humans that participate in game-like
activities tend to be more engaged and willing to take extra steps to win (Ergle, 2015).
Ruhi (2015), indicated through their research into Gamification, that organisations could
have a strategical advantage with game-like activities. Klevers et al. (2015) also
reported that Gamification could be a useful strategy to motivate employees to drive
performance in business activities. As discussed in Chapter 2.2, there are two types of
motivational factors, namely intrinsic and extrinsic. Gamification has the potential to
simultaneously drive the behaviour of both employee motivational factors (Hamari &
Koivisto, 2015; Huotari & Hamari, 2017).
- 71 -
• To determine whether the company would be open to a corporate reward scheme
and Gamification.
The fourth objective was to determine whether the employees would be open to a
corporate reward scheme and Gamification. The results indicated that on average, the
respondents agreed to participate in a corporate points-based reward scheme and
game-like activities in the workplace. Additionally, the relationship between those willing
to partake in such a scheme, and the constructs of motivation, was also determined. The
results obtained indicated that there is a practically visible positive correlation between
those who would be willing and the two most self-determined levels of motivation,
intrinsic and integrated regulation. Thus, it can be concluded that a corporate points-
based reward scheme will be feasible and could lead to a more self-determined
workforce.
• To investigate reward preferences according to employee age.
The reward preferences were investigated according to the generations of the
employees to propose the structure of a points-based reward scheme. The results
indicated that the most desired reward preference regarding the entire sample was
flexible working hours, health benefits and paid leave. The most significant difference
between the Millennials and the older generations indicated that the Millennials were
indecisive regarding staff discounts. In comparison, the older generations agreed that
this would be a preferred method. The second most significant difference indicated that
health benefits were more meaningful to the older generations than the Millennial group.
The remainder of the preferences revealed no significant differences between the two
generations.
• To determine the relationship between employee motivation levels and
participants who actively try and meet their goals with reward schemes like Vitality
and eBucks?
It was also important to investigate whether there is a relationship between those who
are currently part of a reward scheme and actively try to reach their goals and the
constructs of motivation. The results indicated that there is a negative correlation with a
small, practically visible correlation between levels of Amotivation and those who actively
try to reach their goals. This was expected because Amotivation refers to the absence

- 72 -
of any intrinsic and extrinsic motivation. The most practically visible positive correlation
was external regulation, which indicated that the respondents are trying to reach their
goals just to obtain a reward for their efforts. This also confirms the feasibility of a points-
based reward scheme due to this fact.
• To propose a feasible points-based reward scheme with Game-like activities.
The overall results from the study revealed that the respondents would prefer to spend
their earned points on the following methods in descending order. Thus, the points-based
reward scheme could include:
o Paid leave
o Flexible working hour
o Additional health benefits
o Car allowance
o External training
o Fuel perk
o Commission based bonus
o Staff discount
o Cellular phone perks
o Meal vouchers
Game-like activities should also be incorporated into the points-based reward scheme in
order to attract more self-determined employees. This was confirmed with a medium
practical significant relationship between Gamification and the most self-determined
motivational constructs.
5.4 LIMITATIONS OF THE STUDY
The primary limitation of the study includes the relatively small sample size (181 target
population) that resulted in a low response rate of 43.09%. This was still considered above
average for emailed questionnaires, as discussed in Chapter 4.3. With the scope of the
study limited to the South African operations to investigate the feasibility of a points-based
reward scheme with game-like activities for an engineering services entity. The primary
reason for the low response rate was mainly due to the COVID-19 global pandemic where
the company suffered a loss of employees during a Section 189. This resulted in a lower

- 73 -
employee count than initially expected with the remainder of employees mainly working from
home and the more technical personnel limited access to emails. This also resulted that no
factor analysis and generalisations could be performed. For future research, it would be
recommended to expand the scope of the study on a continental or global scale to ensure
a larger sample size.
A secondary limitation of this study was the limited number of Baby Boomers identified in
the company. Therefore, few comparisons could be made regarding the reward preferences
of the three generations in the workforce, as specified in Chapter 2.5.
Finally, with the company investigated in this study not made known for confidentiality
reasons, it will be difficult to incorporate the findings in this study to similar organisations.
Furthermore, the impacts from the COVID-19 pandemic on the organisation were not
considered as the pandemic is still an ongoing situation and might result in further changes
as the pandemic progresses.
5.5 RECOMMENDATIONS
The study recommendations include a summary of the primary objective and reason for the
study to the company investigated and for future research regarding similar strategies.
5.5.1 Recommendations for the organisation
According to the literature review, there is a connection between employee motivation,
engagement and employee performance. When employees are more intrinsically motivated,
they tend to be more engaged in their work activities. Low motivation levels (Amotivation)
can be considered when employees lack any intrinsic and extrinsic motivation and would
subsequently be disengaged in the workplace. The primary objective of this research study
was to determine the feasibility of a points-based reward scheme with game-like activities
in order to motivate employees to be more engaged within the workplace.
The primary reason for this study pertains to the current incentive/bonus scheme of the
company where employees receive an annual monetary bonus in the form of the following
structure:

- 74 -
• 50% based on group-level performance
• 25% based on local business unit performance
• 25% based on employee performance
The first two performance measures are interlinked; for example, if the global organisation
does not reach its annual performance targets, no bonus will be allocated to the respective
business entities and vice versa. The only difference between a highly motivated and
engaged employee and a disengaged one is a mere 25%. This can be demotivating to some
employees who are driven.
Thus, by implementing a points-based reward scheme with game-like activities, the total
employee incentive will solely rely on whether they reach their respective KPI’s. This
incentive strategy could result in a strategic advantage to the company due to a higher
motivated and engaged workforce. The higher motivated and engaged employees will thus
be able to earn points-based on their annual performance and can subsequently choose
how they wish to spend their points. Based on the results from the empirical study, the three
most desired methods include paid leave, flexible working hours and additional health
benefits. The game-like activities could be incorporated into the new incentive strategy
where each department within the company could have a dedicated dashboard where each
respective employee could compete for the top spot. The winner could subsequently be
rewarded with a price that could be determined by the company.
In essence, the proposed strategy would ensure that all the employees are more intrinsically
motivated because they feel that they have a purpose to work towards and also, extrinsically,
due to the reward they would be able to obtain for their performance.
5.5.2 Recommendations for future research
With the limitations of this study in mind, the results obtained indicated valuable suggestions
to the company investigated on how to increase overall employee. The suggested strategy
can be refined by targeting a larger population on a global scale. It should be noted that
there may be a difference between other countries and cultures and that it could not
represent the same population as targeted in this study. Further data refinement and sub-
investigations could subsequently be conducted to develop a global incentive strategy with
regional differences based on cultural and generational differences.

- 75 -
Future research regarding similar incentive strategies could include the effect of the COVID-
19 pandemic on organisations. Due to more companies working remotely, rewards could be
included that will assist employees with their daily tasks from home.
5.6 CHAPTER SUMMARY
This Chapter described the conclusions made from the literature review and the empirical
investigation regarding the feasibility of a points-based reward scheme with game-like
activities. The limitations identified in the study were listed and described, and various
recommendations were made to the company investigated and for future research regarding
similar studies.
- 76 -
LIST OF REFERENCES
Aarts, S., van den Akker, M. & Winkens, B. 2014. The importance of effect sizes. The
European Journal of General Practice, 20(1):61-64.
Abbah, M.T. 2014. Employee motivation: The key to effective organisational management
in Nigeria. IOSR Journal of Business and Management, 16(4):01-08.
Abner, I.P. & Samuel, U.E. 2019. Employees motivation in a competitive service and
manufacturing sectors performance. Kuwait Chapter of the Arabian Journal of Business
and Management Review, 8(2):30-39.
Aggarwal, R. & Ranganathan, P. 2019. Study designs: Part 2-Descriptive studies.
Perspectives in Clinical Research, 10(1):34.
Aguenza, B.B. & Som, APM 2012. Motivational factors of employee retention and
engagement in organisations. International Journal of Advances in Management and
Economics, 1(6):88-95.
Akoglu, H. 2018. User's guide to correlation coefficients. Turkish Journal of Emergency
Medicine, 18(3):91-93.
Alonso‐Almeida, M.D.M. & Llach, J. 2019. Socially responsible companies: Are they the
best workplace for millennials? A cross‐national analysis. Corporate Social Responsibility
and Environmental Management, 26(1):238-247.
Barik, S. & Kochar, A. 2017. Antecedents and consequences of employee engagement: A
literature review. International Journal of Latest Technology in Engineering, Management
& Applied Science, 6(4):33-38.
Basic, L. 2018. Examining generational differences in the workplace: employee
engagement practices and their impact on retention of different generations of human
resources employees in higher education. (Dissertation - Masters). Laguna, CA: Brandman
University.

- 77 -
Boikanyo, D.H. 2012. An Exploration of the effect of employee engagement on
performance in the petrochemical industry. (Dissertation - MBA). Potchefstroom: North-
West University.
Bonett, DG & Wright, T.A. 2015. Cronbach's alpha reliability: Interval estimation, hypothesis
testing, and sample size planning. Journal of Organizational Behavior, 36(1):3-15.
Bruneau, V., Swaen, V. & Zidda, P. 2018. Are loyalty program members really engaged?
Measuring customer engagement with loyalty programs. Journal of Business Research,
91:144-158.
Butz, N.T. & Stupnisky, R.H. 2017. Improving student relatedness through an online
discussion intervention: The application of self-determination theory in synchronous hybrid
programs. Computers & Education, 114:117-138.
Byrne, Z.S., Peters, J.M. & Weston, J.W. 2016. The struggle with employee engagement:
Measures and construct clarification using five samples. Journal of Applied Psychology,
101(9):1201-1227.
Calk, R. & Patrick, A. 2017. Millennials through the looking glass: Workplace motivating
factors. The Journal of Business Inquiry, 16(2):131-139.
Canedo, J.C., Graen, G., Grace, M. & Johnson, R.D. 2017. Navigating the new workplace:
Technology, millennials, and accelerating HR innovation. AIS Transactions on Human-
Computer Interaction, 9(3):243-260.
Casimir, Z.G. 2020. Piece rate pay and employees performance at Satcom Block Industry,
Nasarawa-Nigeria. World Journal of Innovative Research, 8(2):22-27.
Cerasoli, C.P., Nicklin, J.M. & Ford, M.T. 2014. Intrinsic motivation and extrinsic incentives
jointly predict performance: A 40-year meta-analysis. Psychological bulletin, 140(4):980.

- 78 -
Chandani, A., Mehta, M., Mall, A. & Khokhar, V. 2016. Employee engagement: A review
paper on factors affecting employee engagement. Indian Journal of Science and
Technology, 9(15):1-7.
Chang, H.H. & Wong, K.H. 2018. Consumer psychological reactance to coalition loyalty
program: price-consciousness as a moderator. Service Business, 12(2):379-402.
Chepkemoi, J. 2018. Effect of incentives on employee performance at Kenya forest service
Uasin Gishu County. IOSR Journal of Bussiness and Management, 20(3).
Chintalloo, S. & Mahadeo, J. 2013. Effect of motivation on employees' work performance
at Ireland Blyth Limited. In. Proceedings of 8th Annual London Business Research
Conference Imperial College, London, UK. p. 9.
Choy, L.T. 2014. The strengths and weaknesses of research methodology: Comparison
and complimentary between qualitative and quantitative approaches. IOSR Journal of
Humanities and Social Science, 19(4):99-104.
Clark, K.R. 2017. Managing multiple generations in the workplace. Radiologic technology,
88(4):379-396.
Conmy, S. & Melvin, M. 2019. Addressing staff turnover in small and medium sized
organisations Exemplar, 20:12-17.
Creswell, J.W. 2014. The selection of a research approach. Research design: Qualitative,
quantitative, and mixed methods approaches. 4th ed. Thousand Oakes, CA: Sage
Cronbach, L.J. 1951. Coefficient alpha and the internal structure of tests. Psychometrika,
16(3):297-334.
Cypress, B.S. 2017. Rigor or reliability and validity in qualitative research: Perspectives,
strategies, reconceptualization, and recommendations. Dimensions of Critical Care
Nursing, 36(4):253-263.

- 79 -
De Vito, L., Brown, A., Bannister, B., Cianci, M. & Mujtaba, BG 2018. Employee motivation
based on the hierarchy of needs, expectancy and the two-factor theories applied with higher
education employees. International Journal of Advances in Management, Economics and
Entrepreneurship, 3(1):20-32.
Du, C. 2020. 65 Creative Employee Reward Ideas. (Vol. 2020). https://blog.bonus.ly/creative-employee-reward-ideas Date of access: 12 Dec. 2020.
Edirisingha, P. 2012. Interpretivism and positivism (ontological and epistemological
perspectives). https://prabash78.wordpress.com/2012/03/14/interpretivism-and-postivism-
ontological-and-epistemological-perspectives/ Date of access: 10 Nov. 2020.
Ergle, D. 2015. Fostering Employee engagement through Gamification: AirBaltic
Forecaster Tool. (No. 18544223). Management 10(3):28-40.
Fahy, G. & Moylan, E. 2019. The challenge of developing reward programs that motivate
multi-generational workforces. Exemplar, 1(1):23-48, October.
Ganta, V.C. 2014. Motivation in the workplace to improve the employee performance.
International Journal of Engineering Technology, Management and Applied Sciences,
2(6):221-230.
Gard, S. 2019. 9 alternative employee benefits to offer your staff.
https://www.sage.com/en-gb/blog/alternative-employee-benefits-offer-staff/ Date of
access: 31 May 2020.
Gerard, N. 2019. Millennial managers: exploring the next generation of talent. Leadership
in Health Services.
Gordon, P.A. 2018. Age diversity in the workplace. Diversity and inclusion in the global
workplace. Berlin: Springer.

- 80 -
Gursoy, D., Chi, C.G.-Q. & Karadag, E. 2013. Generational differences in work values and
attitudes among frontline and service contact employees. International Journal of Hospitality
Management, 32:40-48.
Hamari, J. & Koivisto, J. 2015. Why do people use gamification services? International
Journal of Information Management, 35(4):419-431.
Hanel, P.H. & Mehler, D.M. 2019. Beyond reporting statistical significance: Identifying
informative effect sizes to improve scientific communication. Public Understanding of
Science, 28(4):468-485.
Hassan, H.A. & Ndegwa, P. 2019. Motivation and employees performance in county
assembly of Mandera, Kenya. International Journal of Current Aspects, 3(IV):1-13.
Hayashi Jr, P., Abib, G. & Hoppen, N. 2019. Validity in qualitative research: A processual
approach. The Qualitative Report, 24(1):98-112.
Heale, R. & Twycross, A. 2015. Validity and reliability in quantitative studies. Evidence-
based Nursing, 18(3):66-67.
Hojat, M. & Xu, G. 2004. A visitor's guide to effect sizes-statistical significance versus
practical (clinical) importance of research findings. Advances in health sciences education,
9(3):241-249.
Huotari, K. & Hamari, J. 2017. A definition for Gamification: anchoring gamification in the
service marketing literature. Electronic Markets, 27(1):21-31.
Ikäheimo, S., Kallunki, J.-P., Moilanen, S. & Schiehll, E. 2018. Do white-collar employee
incentives improve firm profitability? Journal of Management Accounting Research,
30(3):95-115.
Jadhav, S. & Bhise, P. Employee engagement: a study of past, present and emerging
perspectives.

- 81 -
Joo, B.-K., Lim, D.H. & Kim, S. 2016. Enhancing work engagement. Leadership &
Organization Development Journal, 31(26):74-83.
Kanfer, R. & Chen, G. 2016. Motivation in organisational behavior: History, advances and
prospects. Organisational Behavior and Human Decision Processes, 136:6-19.
Khalilzadeh, J. & Tasci, A.D. 2017. Large sample size, significance level, and the effect
size: Solutions to perils of using big data for academic research. Tourism Management,
62:89-96.
Khan, M., Daniyal, M. & Ashraf, M.Z. 2020. The relationship between monetary incentvies
and job performance: mediating role of employee loyalty. Educational Research, 2(6):12-
20.
Khodakarami, N., Dirani, K. & Rezaei, F. 2018. Employee engagement: finding a generally
accepted measurement scale. Industrial and Commercial Training, 50(6):305-311.
Kiradoo, G. 2014. The role of motivation of workforce on the performance and productivity
of employees. International Journal of Current Research in Life Science, 3(7):206-209.
Klevers, M., Sailer, M. & Günthner, W.A. 2015. Implementation model for the Gamification
of business processes. A Study from the Field of Material Handling. The 46th ISAGA, Kyoto,
Japan.
Knekta, E., Runyon, C. & Eddy, S. 2019. One size doesn’t fit all: Using factor analysis to
gather validity evidence when using surveys in your research. CBE - Life Sciences
Education, 18(1):Online. Doi: https://www.lifescied.org/doi/full/10.1187/cbe.18-04-0064
Knight, C., Patterson, M. & Dawson, J. 2017. Building work engagement: A systematic
review and meta‐analysis investigating the effectiveness of work engagement interventions.
Journal of Organizational Behavior, 38(6):792-812.
Kraus, M. 2017. Comparing Generation X and Generation Y on their preferred emotional
leadership style. Journal of Applied Leadership and Management, 5:62-75.

- 82 -
Lee, M.T. & Raschke, R.L. 2016. Understanding employee motivation and organisational
performance: Arguments for a set-theoretic approach. Journal of Innovation & Knowledge,
1(3):162-169.
Legault, L. 2016. Intrinsic and extrinsic motivation. Encyclopedia of Personality and Individual
Differences, 8:1-4. Doi: 10.1007/978-3-319-28099-8_1139-1
Leung, L. 2015. Validity, reliability, and generalizability in qualitative research. Journal of
Family Medicine and Primary Care, 4(3):324.
MacIntyre, P.D., Schnare, B. & Ross, J. 2018. Self-determination theory and motivation for
music. Psychology of Music, 46(5):699-715.
Maduka, C.E. & Okafor, O. 2014. Effect of motivation on employee productivity: A study of
manufacturing companies in Nnewi. International Journal of Managerial Studies and
Research, 2(7):137-147.
Mamdani, K.F. & Minhaj, S. 2016. Effects of motivational incentives on employees'
performance: A case study of banks of Karachi, Pakistan. South East Asia Journal of
Contemporary Business, Economics and Law, 9(2):32-39.
Martin, P. 2017. Job performance and employee engagement-the validity of utrecht work
engagement scale (uwes-9). Journal of Social and Psychological Sciences, 10(2):56-69.
Matthysen, M. & Harris, C. 2018. The relationship between readiness to change and work
engagement: A case study in an accounting firm undergoing change. SA Journal of Human
Resource Management, 16(1):1-11.
McCombes, S. 2020. An introduction to sampling methods.
https://www.scribbr.com/methodology/sampling-methods/ Date of access2020.
Mills, D.J. & Allen, J.J. 2020. Self-determination theory, internet gaming disorder, and the
mediating role of self-control. Computers in Human Behavior, 105:106209.
- 83 -
Mishra, P., Pandey, C.M., Singh, U., Gupta, A., Sahu, C. & Keshri, A. 2019. Descriptive
statistics and normality tests for statistical data. Annals of Cardiac Anaesthesia, 22(1):67.
Mohajan, H.K. 2017. Two criteria for good measurements in research: Validity and
reliability. Annals of Spiru Haret University (Economic Series), 17(4):59-82.
Moon, K., Blackman, D.A., Adams, V.M., Colvin, R.M., Davila, F., Evans, M.C.,
Januchowski‐Hartley, S.R., Bennett, N.J., Dickinson, H. & Sandbrook, C. 2019. Expanding
the role of social science in conservation through an engagement with philosophy,
methodology, and methods. Methods in Ecology and Evolution, 10(3):294-302.
Morschheuser, B., Hamari, J., Werder, K. & Abe, J. 2017. How to gamify? A method for
designing Gamification. In. Proceedings of the 50th Hawaii International Conference on
System Sciences 2017 organised by: University of Hawai'i at Manoa.
Muogbo, U. 2013. The impact of employee motivation on organisational performance (a
study of some selected firms in anambra state nigeria). The International Journal of
Engineering and Science, 2(7):70-80.
Nimon, K. & Shuck, B. 2020. Work engagement and burnout: Testing the theoretical
continuums of identification and energy. Human Resource Development Quarterly,
31(3):301-318.
Nnambooze, B.E. & Parumasur, S.B. 2016. Understanding the multigenerational
workforce: Are the generations significantly different or similar. Corporate Ownership and
Control, 13(2):224-237.
Nohria, N., Groysberg, B. & Lee, L.-E. 2008. Employee motivation. Harvard business
review, 86(7/8):78-84.
Noor, Z., Nayaz, N., Solanki, V., Manoj, A. & Sharma, A. 2020. Impact of rewards system
on employee motivation: a study of a manufacturing firm in Oman. International Journal of
Business and Management Future, 4(2):6-16.

- 84 -
Norberg, P.A. 2017. Employee incentive programs: Recipient behaviors in points, cash,
and gift card programs. Performance Improvement Quarterly, 29(4):375-388.
Ogbonnaya, C., Daniels, K. & Nielsen, K. 2017. How incentive pay affects employee
engagement, satisfaction, and trust. Harvard Business Review, Online.
https://hbr.org/2017/03/research-how-incentive-pay-affects-employee-engagement-
satisfaction-and-trust Date of access: 10 May 2020
Osborne, S. & Hammoud, M.S. 2017. Effective employee engagement in the workplace.
International Journal of Applied Management and Technology, 16(1):4.
Pallant, J. 2017. SPSS Survival Manual: A Step by Step Guide to Data Analysis Using
SPSS for Windows Version 15. Sydney: Allen and Unwin.
Parijat, P. & Bagga, S. 2014. Victor Vroom's expectancy theory of motivation - An
evaluation. International Research Journal of Business and Management, 7(9):1-8.
Pekelharing, R. 2018. Exploring the interrelationship between selected leadership styles,
motivational stance and work engagement. (Dissertation: MBA). Potchefstroom: North-West
University.
Perryer, C., Celestine, N.A., Scott-Ladd, B. & Leighton, C. 2016. Enhancing workplace
motivation through Gamification: Transferrable lessons from pedagogy. The International
Journal of Management Education, 14(3):327-335.
Pînzaru, F., Vătămănescu, E.-M., Mitan, A., Săvulescu, R., Vițelar, A., Noaghea, C. & Bălan,
M. 2016. Millennials at work: Investigating the specificity of generation Y versus other
generations. Management Dynamics in the Knowledge Economy, 4(2):173-192.
Rakhmanova, M. & Kryukov, V. 2019. Innovative approach and strategy for employee
incentive management of trade enterprises. International Transaction Journal of
Engineering, Management, & Applied Sciences & Technologies, 10(11):1-12

- 85 -
Riaz, H., Akhtar, C. & Aslam, R. 2018. Total rewards and employee performance:
Investigating the mediating role of employee motivation in telecom sector. Pakistan
Administrative Review, 2(3):342-356.
Rivers, L. 2016. The impact of Gamification on employee engagement in advertising
agencies in South Africa. (Dissertation - MBA). Pretoria: University of Pretoria.
Robescu, O. & Iancu, A.-G. 2016. The effects of motivation on employees performance in
organisations. Valahian Journal of Economic Studies, 7(2):49-56.
Ruhi, U. 2015. Level up your strategy: Towards a descriptive framework for meaningful
enterprise gamification. Technology Innovation Management Review, 5(8)5-16.
Ryan, R.M. & Deci, E.L. 2000. Self-determination theory and the facilitation of intrinsic
motivation, social development, and wellbeing. American Psychologist, 55(1):68-78.
Ryan, R.M. & Deci, E.L. 2017. Self-determination theory: Basic psychological needs in
motivation, development, and wellness. New York, NY: Guilford.
Salcido, M. 2020. The 3 different methods for motivating the 3 different employee types.
https://www.allbusiness.com/the-3-different-methods-for-motivating-the-3-different-
employee-types-104509-1.html Date of access 2020.
Sattar, T., Ahmad, K. & Hassan, S.M. 2015. Role of human resource practices in employee
performance and job satisfaction with mediating effect of employee engagement. Pakistan
Economic and Social Review, 53(1):81-96.
Schaufeli, W.B. 2018. Work engagement in Europe. Organizational Dynamics, 47(2):99-
106.
Seppälä, P., Mauno, S., Feldt, T., Hakanen, J., Kinnunen, U., Tolvanen, A. & Schaufeli, W.
2009. The construct validity of the Utrecht Work Engagement Scale: Multisample and
longitudinal evidence. Journal of Happiness studies, 10(4):459-481. Doi:
https://doi.org/10.1007/s10902-008-9100-y

- 86 -
Serhan, A. 2020. Development of Accounting Information Systems and the Barriers Faced
in Developing Nations. Business Excellence and Management, 10(2):84-96.
Shahzadi, I., Javed, A., Pirzada, S.S., Nasreen, S. & Khanam, F. 2014. Impact of employee
motivation on employee performance. European Journal of Business and Management,
6(23):159-166.
Shrotryia, V.K. & Dhanda, U. 2019. Measuring employee engagement: Perspectives from
literature. IUP Journal of Organizational Behavior, 18(3):26-47.
Singh, A.S. 2017. Common procedures for development, validity and reliability of a
questionnaire. International Journal of Economics, Commerce and Management, 5(5):790-
801.
Singh, R. 2016. The impact of intrinsic and extrinsic motivators on employee engagement
in information organisations. Journal of Education for Library and Information Science,
57(2):197-206.
Singh, S.K., Burgess, T.F., Heap, J. & Al Mehrzi, N. 2016. Competing through employee
engagement: a proposed framework. International Journal of Productivity and Performance
Management, Online. https://scholar.google.co.za/citations?user=5wORFZoAAAAJ&hl=en
Date of access: 10 Dec. 2020.
Sovacool, B.K., Axsen, J. & Sorrell, S. 2018. Promoting novelty, rigor, and style in energy
social science: towards codes of practice for appropriate methods and research design.
Energy Research & Social Science, 45:12-42.
Statistics South Africa. 2020. Quarterly labour force survey.
https://www.statssa.gov.za/publications/P0211/P02111stQuarter2020.pdf Date of access:
10 Nov. 2020.
Stoyanova, T. & Iliev, I. 2017. Employee engagement factor for organisational excellence.
International Journal of Business and Economic Sciences Applied Research, 10(1):23-29.
- 87 -
Taherdoost, H. 2016. Validity and reliability of the research instrument; how to test the
validation of a questionnaire/survey in a research. How to Test the Validation of a
Questionnaire/Survey in a Research. International Journal of Academic Research in
Management, 5(3):28-36, Doi: http://dx.doi.org/10.2139/ssrn.3205040
Tavakol, M. & Dennick, R. 2011. Making sense of Cronbach's alpha. International Journal
of Medical Education, 2:53-55.
Thomas, D. 2019. Clinical pharmacy education, practice and research: clinical pharmacy.
Amsterdam: Elsevier.
Tremblay, M.A., Blanchard, C.M., Taylor, S., Pelletier, L.G. & Villeneuve, M. 2009. Work
Extrinsic and intrinsic motivation scale: Its value for organisational psychology research.
Canadian Journal of Behavioural Science, 41(4):213.
Ursachi, G., Horodnic, I.A. & Zait, A. 2015. How reliable are measurement scales? External
factors with indirect influence on reliability estimators. Procedia Economics and Finance,
20:679-686.
Valickas, A. & Jakštaitė, K. 2017. Different generations' attitudes towards work and
management in the business organisations. Human Resources Management &
Ergonomics, XI(1):108-119.
Vasconcellos, D., Parker, P.D., Hilland, T., Cinelli, R., Owen, K.B., Kapsal, N., Lee, J.,
Antczak, D., Ntoumanis, N. & Ryan, R.M. 2020. Self-determination theory applied to
physical education: A systematic review and meta-analysis. Journal of Educational
Psychology, 112(7):1444-1469.
Victor, J. & Hoole, C. 2017. The influence of organisational rewards on workplace trust and
work engagement. SA Journal of Human Resource Management, 15(1):1-14.
Xi, N. & Hamari, J. 2019. Does Gamification satisfy needs? A study on the relationship
between gamification features and intrinsic need satisfaction. International Journal of
Information Management, 46:210-221.

- 88 -
Xiao, C., Ye, J., Esteves, R.M. & Rong, C. 2016. Using Spearman's correlation coefficients
for exploratory data analysis on big dataset. Concurrency and Computation: Practice and
Experience, 28(14):3866-3878.
Young, B., Bedford, L., das Nair, R., Gallant, S., Littleford, R., Robertson, J.F., Schembri,
S., Sullivan, F.M., Vedhara, K. & Kendrick, D. 2020. Unconditional and conditional
monetary incentives to increase response to mailed questionnaires: A randomized
controlled study within a trial (SWAT). Journal of Evaluation in Clinical Practice, 26(3):893-
902.
Yousaf, S., Latif, M., Aslam, S. & Saddiqui, A. 2014. Impact of financial and non financial
rewards on employee motivation. Middle-East Journal of Scientific Research, 21(10):1776-
1786.
Žukauskas, P., Vveinhardt, J. & Andriukaitienė, R. 2018. Philosophy and paradigm of
scientific research. Management Culture and Corporate Social Responsibility, 6:121-139.
Doi: http://dx.doi.org/10.5772/intecopen.70628
APPENDIXES

- 89 -
APPENDIX A
Participant consent letter

- 90 -
INFORMED CONSENT
My name is Lourens Pretorius, and I am an MBA student at the North-West University
Business School. This study aims to determine whether a points-based reward incentive
scheme with game-like work activities will be feasible within a South African engineering
services entity. This study forms part of a mini-dissertation to be submitted in partial
fulfilment of the requirements for the degree Master of Business Administration at the North-
West University.
Please note that participation in this study is voluntary, and the participant will not be
penalised by any means by not completing the questionnaires. The participant can withdraw
from the questionnaire at any time. The questionnaire will take approximately 15-20 minutes
to complete.
All participant's identity will remain anonymous, and the results will remain confidential. The
results of this study will be used for academic purposes to ascertain whether alternative
incentive strategies would be feasible.
The questionnaire is divided into four sections, the first being demographic information
required for further statistical analysis. The second part will measure the participant's
motivation level at work, and the third section will measure the current work engagement
levels. The last section will contain questions regarding the preferred incentive methods.

- 91 -
I hereby give consent to participate and the study and to use the results.
Permission Granted Yes No
Kind Regards
LP Pretorius
082 771 0576
- 92 -
APPENDIX B
Company consent letter

- 93 -

- 94 -
APPENDIX C
Data collection instrument(-s) – permission letters

- 95 -
Work Extrinsic and Intrinsic Motivation Scale (WEIMS) Permission to use the WEIMS was obtained from the author as below email.
Utrecht Work Engagement Scale (UWES) The UWES is free to use for non-commertial scientific research as below from the published
scale.

- 96 -
APPENDIX D
Data collection instrument(-s) -

- 97 -
All information will be treated as STRICTLY CONFIDENTIAL, and the data will only be used
for ACADEMIC PURPOSES.
INSTRUCTIONS:
• Please answer all the questions as honestly and objectively as possible in order to
accurately analyse and interpret the data.
• Please select the correct option most applicable.
SECTION A: DEMOGRAPHIC INFORMATION
1) Age (Years)
1) 18-38 2) 39-59 3) 60-77
2) Duration of employment (Years)
1) 0-3 2) 4-6 3) 7-10 4) 11-15 5) 16 above
3) Qualification
1) Grade 10 2) Grade 12 3) Diploma 4) Bachelor's
degree
5) Honours
degree
6) Masters
degree
7) Other: explain briefly:
4) Department in company
1) HR &
Finance
2)
Engineering
3) Sales 4) Customer
Services
5)
Technical
6)
Warehouse
and logistics

- 98 -
SECTION B: WORK EXTRINSIC and INTRINSIC MOTIVATION SCALE (WEIMS)
Please indicate to what extent you are presently involved in your work by completing the
following sentence.
I am presently involved in my work...
Ve
ry S
tro
ng
ly D
isa
gre
e
Str
on
gly
Dis
ag
ree
Dis
ag
ree
Ne
ith
er
Ag
ree
Str
on
gly
Ag
ree
Ve
ry S
tro
ng
ly A
gre
e
B1 …Because this is the type of work I chose to do to
attain a certain lifestyle 1 2 3 4 5 6 7
B2 …For the income it provides me 1 2 3 4 5 6 7
B3 …I ask myself this question, I do not seem to be able
to manage the important tasks related to this work 1 2 3 4 5 6 7
B4 …Because I derive much pleasure from learning
new things 1 2 3 4 5 6 7
B5 …Because it has become a fundamental part of who
I am 1 2 3 4 5 6 7
B6 …Because I want to succeed at this job, if not I
would be very ashamed of myself 1 2 3 4 5 6 7
B7 …Because I chose this type of work to attain my
career goals 1 2 3 4 5 6 7
B8 …For the satisfaction, I experience from taking on
interesting challenges 1 2 3 4 5 6 7
B9 …Because it allows me to earn money 1 2 3 4 5 6 7
B10 …Because it is part of the way in which I have
chosen to live my life 1 2 3 4 5 6 7
B11 …Because I want to be very good at this work,
otherwise I would be very disappointed 1 2 3 4 5 6 7
B12 …I do not know why we are provided with unrealistic
working conditions 1 2 3 4 5 6 7
B13 …Because I want to be a "winner" in life 1 2 3 4 5 6 7
B14 …Because it is the type of work I have chosen to
attain certain important objectives 1 2 3 4 5 6 7
B15 …For the satisfaction, I experience when I am
successful at doing difficult tasks 1 2 3 4 5 6 7
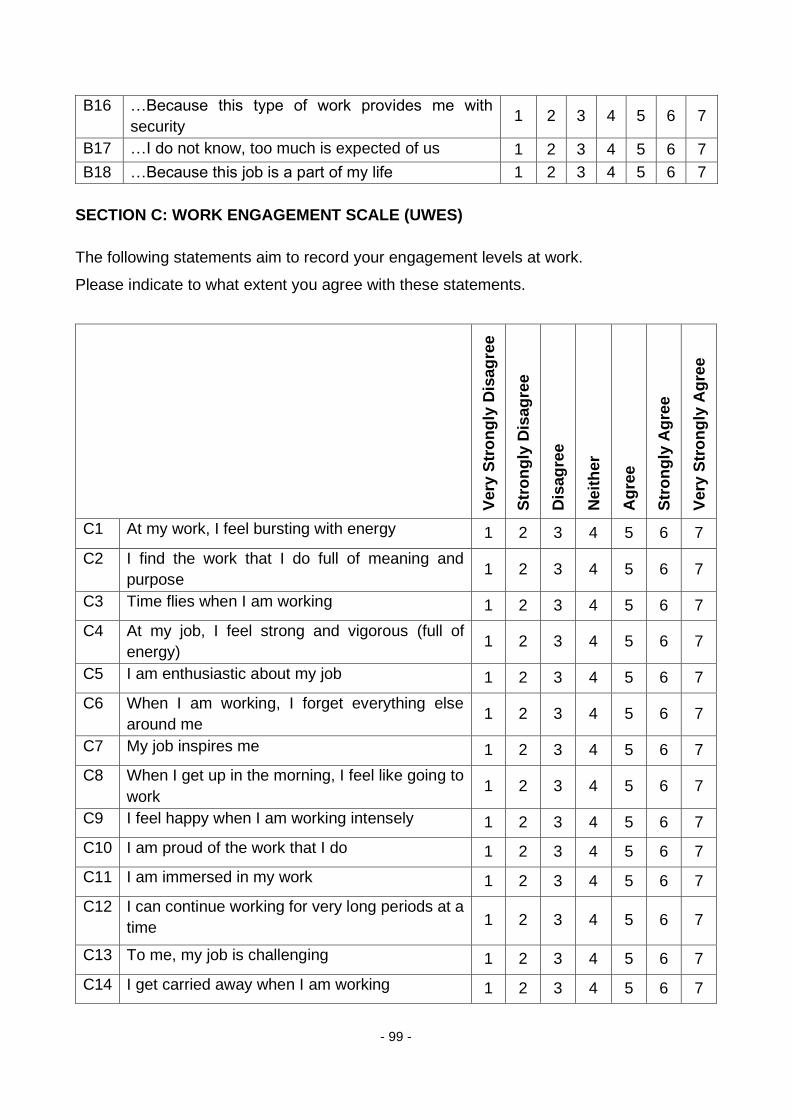
- 99 -
B16 …Because this type of work provides me with
security 1 2 3 4 5 6 7
B17 …I do not know, too much is expected of us 1 2 3 4 5 6 7
B18 …Because this job is a part of my life 1 2 3 4 5 6 7
SECTION C: WORK ENGAGEMENT SCALE (UWES)
The following statements aim to record your engagement levels at work.
Please indicate to what extent you agree with these statements.
Very
Str
on
gly
Dis
ag
ree
Str
on
gly
Dis
ag
ree
Dis
ag
ree
Neit
her
Ag
ree
Str
on
gly
Ag
ree
Very
Str
on
gly
Ag
ree
C1 At my work, I feel bursting with energy 1 2 3 4 5 6 7
C2 I find the work that I do full of meaning and
purpose 1 2 3 4 5 6 7
C3 Time flies when I am working 1 2 3 4 5 6 7
C4 At my job, I feel strong and vigorous (full of
energy) 1 2 3 4 5 6 7
C5 I am enthusiastic about my job 1 2 3 4 5 6 7
C6 When I am working, I forget everything else
around me 1 2 3 4 5 6 7
C7 My job inspires me 1 2 3 4 5 6 7
C8 When I get up in the morning, I feel like going to
work 1 2 3 4 5 6 7
C9 I feel happy when I am working intensely 1 2 3 4 5 6 7
C10 I am proud of the work that I do 1 2 3 4 5 6 7
C11 I am immersed in my work 1 2 3 4 5 6 7
C12 I can continue working for very long periods at a
time 1 2 3 4 5 6 7
C13 To me, my job is challenging 1 2 3 4 5 6 7
C14 I get carried away when I am working 1 2 3 4 5 6 7

- 100 -
C15 At my job, I am very resilient, mentally 1 2 3 4 5 6 7
C16 It is difficult to detach myself from my job 1 2 3 4 5 6 7
C17 At my work, I always persevere, even when
things do not go well 1 2 3 4 5 6 7
SECTION D: INCENTIVES
1) Are you familiar with reward schemes like ebucks and Discovery Vitality?
1) Yes 2) No
2) Are you a member of such reward schemes?
1) Yes 2) No
3) Do you actively try to meet your goals in order to obtain points of such reward
schemes?
1) Never 2) Almost Never 3) Rarely 4) Sometimes 5) Often 6) Very Often 7) Always
4) Please complete the following regarding preferred incentive methods:
Very
Str
on
gly
Dis
ag
ree
Str
on
gly
Dis
ag
ree
Dis
ag
ree
Neit
her
Ag
ree
Str
on
gly
Ag
ree
Very
Str
on
gly
Ag
ree
Health benefits 1 2 3 4 5 6 7
Paid leave 1 2 3 4 5 6 7
External training funds 1 2 3 4 5 6 7
Commission based bonus 1 2 3 4 5 6 7
Staff discount 1 2 3 4 5 6 7
Cell phone perks 1 2 3 4 5 6 7
Flexible working hours 1 2 3 4 5 6 7
Car allowance 1 2 3 4 5 6 7
Fuel perks 1 2 3 4 5 6 7
Meal vouchers 1 2 3 4 5 6 7

- 101 -
5) Will you be open to a corporate reward scheme to redeem points as you wish in
the form of the above-mentioned incentives?
Very
Strongly
Disagree
Strongly
Disagree Disagree Neither Agree
Strongly
Agree
Very
Strongly
Agree
1 2 3 4 5 6 7
6) Are you a competitive person?
Very
Strongly
Disagree
Strongly
Disagree Disagree Neither Agree
Strongly
Agree
Very
Strongly
Agree
1 2 3 4 5 6 7
7) Would you participate in a corporate game-like activity with colleagues to compete
for a price reward based on new business opportunities?
Very
Strongly
Disagree
Strongly
Disagree Disagree Neither Agree
Strongly
Agree
Very
Strongly
Agree
1 2 3 4 5 6 7
- 102 -
APPENDIX E
Statistical Analysis -

- 103 -

- 104 -
APPENDIX F
Ethics number -
- 105 -

- 106 -
APPENDIX G
Language Editing -

- 107 -