Embed Size (px)
Citation preview
Investigating line- versus point-laserexcitation for three-dimensionalfluorescence imaging and tomographyemploying a trimodal imaging system
Liji CaoJörg Peter
Downloaded From: https://www.spiedigitallibrary.org/journals/Journal-of-Biomedical-Optics on 08 Oct 2021Terms of Use: https://www.spiedigitallibrary.org/terms-of-use
Investigating line- versus point-laser excitation forthree-dimensional fluorescence imaging and tomographyemploying a trimodal imaging system
Liji Cao and Jörg PeterGerman Cancer Research Center, Department of Medical Physics in Radiology, Heidelberg, Germany
Abstract. The adoption of axially oriented line illumination patterns for fluorescence excitation in small animals forfluorescence surface imaging (FSI) and fluorescence optical tomography (FOT) is being investigated. A trimodalsingle-photon-emission-computed-tomography/computed-tomography/optical-tomography (SPECT-CT-OT) smallanimal imaging system is being modified for employment of point- and line-laser excitation sources. These sourcescan be arbitrarily positioned around the imaged object. The line source is set to illuminate the object along its entireaxial direction. Comparative evaluation of point and line illumination patterns for FSI and FOT is provided involvingphantom as well as mouse data. Given the trimodal setup, CT data are used to guide the optical approaches byproviding boundary information. Furthermore, FOT results are also being compared to SPECT. Results show thatline-laser illumination yields a larger axial field of view (FOV) in FSI mode, hence faster data acquisition, and practi-cally acceptable FOT reconstruction throughout the whole animal. Also, superimposed SPECT and FOT data pro-vide additional information on similarities as well as differences in the distribution and uptake of both probe types.Fused CT data enhance further the anatomical localization of the tracer distribution in vivo. The feasibility of line-laser excitation for three-dimensional fluorescence imaging and tomography is demonstrated for initiating furtherresearch, however, not with the intention to replace one by the other. © The Authors. Published by SPIE under a Creative Commons
Attribution 3.0 Unported License. Distribution or reproduction of this work in whole or in part requires full attribution of the original publication, including its
DOI. [DOI: 10.1117/1.JBO.18.6.066015]
Keywords: fluorescence imaging; fluorescence optical tomography; line laser; single photon emission computed tomography; x-ray com-puted tomography; multimodal imaging.
Paper 130163R received Mar. 21, 2013; revised manuscript received May 17, 2013; accepted for publication May 17, 2013; publishedonline Jun. 24, 2013.
1 IntroductionSpatially resolved detection of fluorescence-labeled agent distri-bution in mice has been demonstrated to hold great potential in abroad spectrum of preclinical molecular imaging studies.1
Because of the mathematical difficulties in resolving the highlyscattering nature of light photon propagation in tissue, themajority of in vivo small animal fluorescence imaging applica-tions in the laboratory settings is mostly performed to generatetwo-dimensional (2-D) planar images following epi-illumina-tion.2 Nonetheless, to improve localization as well as to enablequantification of fluorescent sources, efforts have been takentoward fully three-dimensional (3-D) tomographic reconstruc-tion of fluorescence light distribution within heterogeneouslyturbid and arbitrarily shaped objects such as mice and, in somecases, up to the size of rats.3,4
Noncontact data acquisition approaches have replaced fiber-based contact imaging implementations for the most part mainlybecause of animal handling and efficiency shortcomings of thelatter.5 Some noncontact imaging systems perform fluorescenceoptical tomography (FOT) reconstruction by slightly squeezingthe imaged animal into, or between, a purposely shaped cham-ber of simple geometry (e.g., translucent vices),6,7 or withintranslucent compartments of (generally) cylindrical geometry
with lesser spacing constraints forced onto the animal.8,9
Planar spacing by the use of opposite vices yields a much reducedboundary complexity involved in solving the inverse problem.However, this method substantially restricts freedom of excitationand detection geometry. Cylindrical animal burrow enclosuresmaintain a “normal” body shape and allow for arbitrary excitationand detection from the full set of 360 deg source angles and im-aging projections.8,9 However, this geometry involves a rathercomplex problem space for the inverse problem. The imaging sys-tem embodied herein uses the latter approach incorporating ananimal enclosure with a bore holder of 30-mm inner diameter.Fluorescence surface imaging (FSI) is performed by illuminatingthe entire imaged object, or local regions thereof, with a large,preferably homogeneous field of light to excite fluorochromesin a large area, generally the whole animal.
In almost all noncontact FOTapproaches, though, laser beamgenerated point illumination is used to sequentially form an illu-mination pattern on the surface of the animal to create a suffi-ciently high number of source points on the surface, which arepaired with some data projection schema, respectively.10 Suchscanning strategy, however, can be time consuming. Adoptionof galvanometer mirrors as suggested by Patwardhan et al. canaccelerate the scanning process.11 This strategy, however, stillinduces a large amount of acquired data and, hence, yieldsa large space problem for the FOT image reconstruction.Following recent studies, wide field illumination using struc-tured light or spatially modulated light has been extensively in-vestigated for turbid media as well as for in vivo imaging.12–16
Address all Correspondence to: Liji Cao, German Cancer Research Center(DKFZ), Department of Medical Physics in Radiology, E020, Im NeuenheimerFeld 280, D-69120 Heidelberg, Germany. Tel: +49 6221 42 2606; Fax: +496221 42 2585; E-mail: [email protected].
Journal of Biomedical Optics 066015-1 June 2013 • Vol. 18(6)
Journal of Biomedical Optics 18(6), 066015 (June 2013)
Downloaded From: https://www.spiedigitallibrary.org/journals/Journal-of-Biomedical-Optics on 08 Oct 2021Terms of Use: https://www.spiedigitallibrary.org/terms-of-use
Those interesting approaches are intended for lessening theinherently ill-posed nature of FOT12–14 or lowering the numberof excitation points.15,16
In the present study, we seek to investigate the use of singleexcitation line illumination as generated by a line laser sourceand conduct comparative experiments for FSI and FOT. The linesource is fit and aligned with the axial center line of the imagingbore and rotationally mounted at some distance from the imagedobject. Hence, a single 360-deg revolution (at certain angularstepping offsets) of the line source forms an illumination patternalong with a set of projection data that could be used for bothFSI and FOT.
Combining in vivo optical imaging with further imagingmodalities such as CT is being adopted more and more toimprove reconstruction accuracy and, hence, signal localiza-tion.17–19 To conduct this study, the optical imaging setup,including all light sources, is for that reason placed into a tri-modal small animal imaging system, incorporating also CT andSPECT.20 This enables simultaneous, coregistered FSI and FOTimaging with CT and SPECT.
2 Materials and Methods
2.1 Imaging System
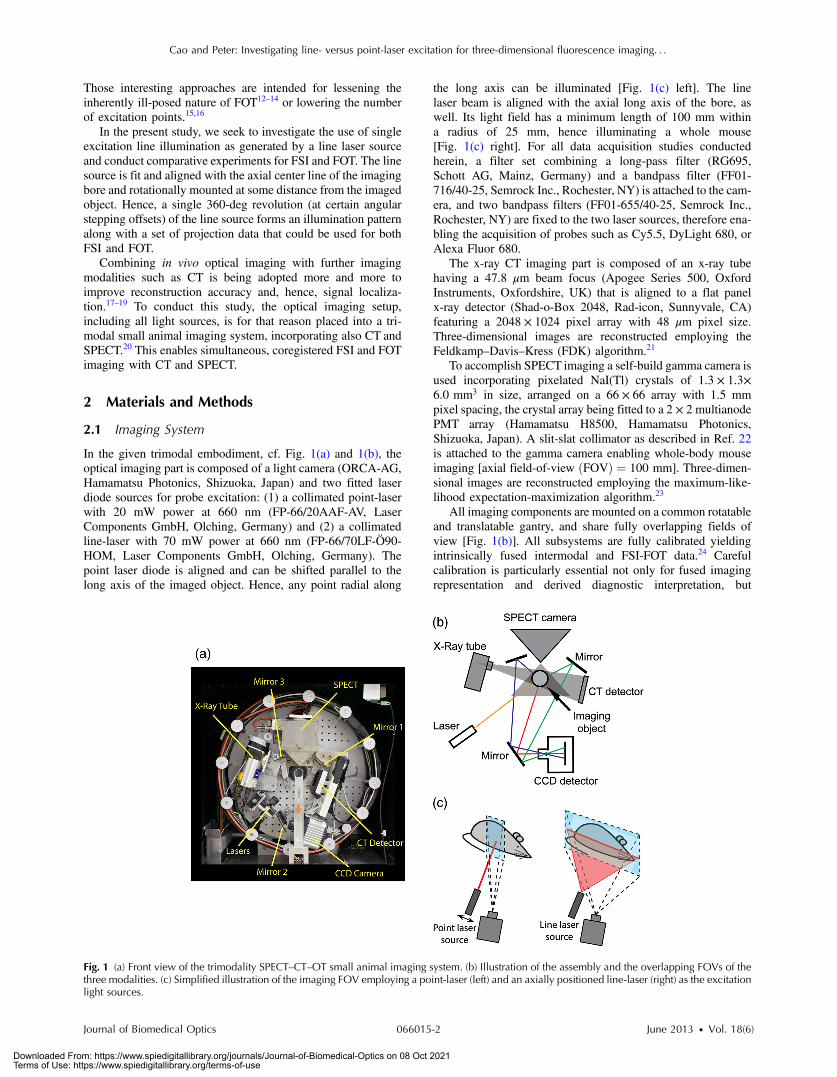
In the given trimodal embodiment, cf. Fig. 1(a) and 1(b), theoptical imaging part is composed of a light camera (ORCA-AG,Hamamatsu Photonics, Shizuoka, Japan) and two fitted laserdiode sources for probe excitation: (1) a collimated point-laserwith 20 mW power at 660 nm (FP-66/20AAF-AV, LaserComponents GmbH, Olching, Germany) and (2) a collimatedline-laser with 70 mW power at 660 nm (FP-66/70LF-Ö90-HOM, Laser Components GmbH, Olching, Germany). Thepoint laser diode is aligned and can be shifted parallel to thelong axis of the imaged object. Hence, any point radial along
the long axis can be illuminated [Fig. 1(c) left]. The linelaser beam is aligned with the axial long axis of the bore, aswell. Its light field has a minimum length of 100 mm withina radius of 25 mm, hence illuminating a whole mouse[Fig. 1(c) right]. For all data acquisition studies conductedherein, a filter set combining a long-pass filter (RG695,Schott AG, Mainz, Germany) and a bandpass filter (FF01-716/40-25, Semrock Inc., Rochester, NY) is attached to the cam-era, and two bandpass filters (FF01-655/40-25, Semrock Inc.,Rochester, NY) are fixed to the two laser sources, therefore ena-bling the acquisition of probes such as Cy5.5, DyLight 680, orAlexa Fluor 680.
The x-ray CT imaging part is composed of an x-ray tubehaving a 47.8 μm beam focus (Apogee Series 500, OxfordInstruments, Oxfordshire, UK) that is aligned to a flat panelx-ray detector (Shad-o-Box 2048, Rad-icon, Sunnyvale, CA)featuring a 2048 × 1024 pixel array with 48 μm pixel size.Three-dimensional images are reconstructed employing theFeldkamp–Davis–Kress (FDK) algorithm.21
To accomplish SPECT imaging a self-build gamma camera isused incorporating pixelated NaI(Tl) crystals of 1.3 × 1.3×6.0 mm3 in size, arranged on a 66 × 66 array with 1.5 mmpixel spacing, the crystal array being fitted to a 2 × 2multianodePMT array (Hamamatsu H8500, Hamamatsu Photonics,Shizuoka, Japan). A slit-slat collimator as described in Ref. 22is attached to the gamma camera enabling whole-body mouseimaging [axial field-of-view ðFOVÞ ¼ 100 mm]. Three-dimen-sional images are reconstructed employing the maximum-like-lihood expectation-maximization algorithm.23
All imaging components are mounted on a common rotatableand translatable gantry, and share fully overlapping fields ofview [Fig. 1(b)]. All subsystems are fully calibrated yieldingintrinsically fused intermodal and FSI-FOT data.24 Carefulcalibration is particularly essential not only for fused imagingrepresentation and derived diagnostic interpretation, but
Fig. 1 (a) Front view of the trimodality SPECT–CT–OT small animal imaging system. (b) Illustration of the assembly and the overlapping FOVs of thethree modalities. (c) Simplified illustration of the imaging FOV employing a point-laser (left) and an axially positioned line-laser (right) as the excitationlight sources.
Journal of Biomedical Optics 066015-2 June 2013 • Vol. 18(6)
Cao and Peter: Investigating line- versus point-laser excitation for three-dimensional fluorescence imaging. . .
Downloaded From: https://www.spiedigitallibrary.org/journals/Journal-of-Biomedical-Optics on 08 Oct 2021Terms of Use: https://www.spiedigitallibrary.org/terms-of-use
constitutes a crucial precondition for both FSI mapping and FOTreconstruction algorithms as laid out in the following.
2.2 3-D Fluorescence Surface Imaging
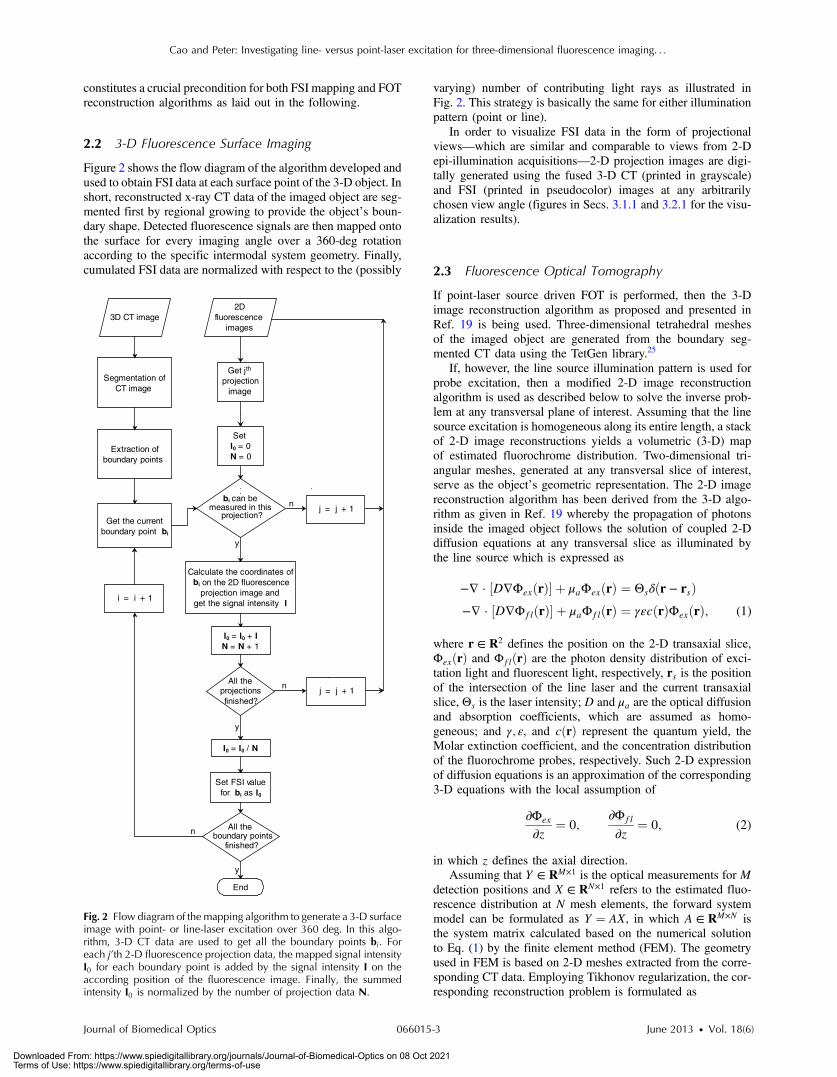
Figure 2 shows the flow diagram of the algorithm developed andused to obtain FSI data at each surface point of the 3-D object. Inshort, reconstructed x-ray CT data of the imaged object are seg-mented first by regional growing to provide the object’s boun-dary shape. Detected fluorescence signals are then mapped ontothe surface for every imaging angle over a 360-deg rotationaccording to the specific intermodal system geometry. Finally,cumulated FSI data are normalized with respect to the (possibly
varying) number of contributing light rays as illustrated inFig. 2. This strategy is basically the same for either illuminationpattern (point or line).
In order to visualize FSI data in the form of projectionalviews—which are similar and comparable to views from 2-Depi-illumination acquisitions—2-D projection images are digi-tally generated using the fused 3-D CT (printed in grayscale)and FSI (printed in pseudocolor) images at any arbitrarilychosen view angle (figures in Secs. 3.1.1 and 3.2.1 for the visu-alization results).
2.3 Fluorescence Optical Tomography
If point-laser source driven FOT is performed, then the 3-Dimage reconstruction algorithm as proposed and presented inRef. 19 is being used. Three-dimensional tetrahedral meshesof the imaged object are generated from the boundary seg-mented CT data using the TetGen library.25
If, however, the line source illumination pattern is used forprobe excitation, then a modified 2-D image reconstructionalgorithm is used as described below to solve the inverse prob-lem at any transversal plane of interest. Assuming that the linesource excitation is homogeneous along its entire length, a stackof 2-D image reconstructions yields a volumetric (3-D) mapof estimated fluorochrome distribution. Two-dimensional tri-angular meshes, generated at any transversal slice of interest,serve as the object’s geometric representation. The 2-D imagereconstruction algorithm has been derived from the 3-D algo-rithm as given in Ref. 19 whereby the propagation of photonsinside the imaged object follows the solution of coupled 2-Ddiffusion equations at any transversal slice as illuminated bythe line source which is expressed as
−∇ · ½D∇ΦexðrÞ� þ μaΦexðrÞ ¼ Θsδðr − rsÞ−∇ · ½D∇ΦflðrÞ� þ μaΦflðrÞ ¼ γεcðrÞΦexðrÞ; (1)
where r ∈ R2 defines the position on the 2-D transaxial slice,ΦexðrÞ and ΦflðrÞ are the photon density distribution of exci-tation light and fluorescent light, respectively, rs is the positionof the intersection of the line laser and the current transaxialslice, Θs is the laser intensity; D and μa are the optical diffusionand absorption coefficients, which are assumed as homo-geneous; and γ; ε, and cðrÞ represent the quantum yield, theMolar extinction coefficient, and the concentration distributionof the fluorochrome probes, respectively. Such 2-D expressionof diffusion equations is an approximation of the corresponding3-D equations with the local assumption of
∂Φex
∂z¼ 0;
∂Φfl
∂z¼ 0; (2)
in which z defines the axial direction.Assuming that Y ∈ RM×1 is the optical measurements for M
detection positions and X ∈ RN×1 refers to the estimated fluo-rescence distribution at N mesh elements, the forward systemmodel can be formulated as Y ¼ AX, in which A ∈ RM×N isthe system matrix calculated based on the numerical solutionto Eq. (1) by the finite element method (FEM). The geometryused in FEM is based on 2-D meshes extracted from the corre-sponding CT data. Employing Tikhonov regularization, the cor-responding reconstruction problem is formulated as
3D CT image
Segmentation of CT image
Extraction of boundary points
can be measured in this
projection?
2D fluorescence
images
y
Calculate the coordinates of on the 2D fluorescence projection image and
get the signal intensity I
Set I0 = 0N = 0
I0 = I0 + IN = N + 1
I0 = I0 / N
Get the current boundary point bi
Set FSI value for bi as I0
All the projections finished?
y
n
All the
finished?
End
y
n
n
boundary points
j = j + 1
projectionimage
Get jth
i = i + 1
bi
j = j + 1
bi
Fig. 2 Flow diagram of the mapping algorithm to generate a 3-D surfaceimage with point- or line-laser excitation over 360 deg. In this algo-rithm, 3-D CT data are used to get all the boundary points bi. Foreach j’th 2-D fluorescence projection data, the mapped signal intensityI0 for each boundary point is added by the signal intensity I on theaccording position of the fluorescence image. Finally, the summedintensity I0 is normalized by the number of projection data N.
Journal of Biomedical Optics 066015-3 June 2013 • Vol. 18(6)
Cao and Peter: Investigating line- versus point-laser excitation for three-dimensional fluorescence imaging. . .
Downloaded From: https://www.spiedigitallibrary.org/journals/Journal-of-Biomedical-Optics on 08 Oct 2021Terms of Use: https://www.spiedigitallibrary.org/terms-of-use
minX≥0
fkY − AXk2 þ λkXk2g; (3)
in which λ is the parameter to control the regularization strength.The minimization problem is solved iteratively using the con-strained conjugate gradient method which is constrained byenforcing nonnegativity.
2.4 Phantom Experiment
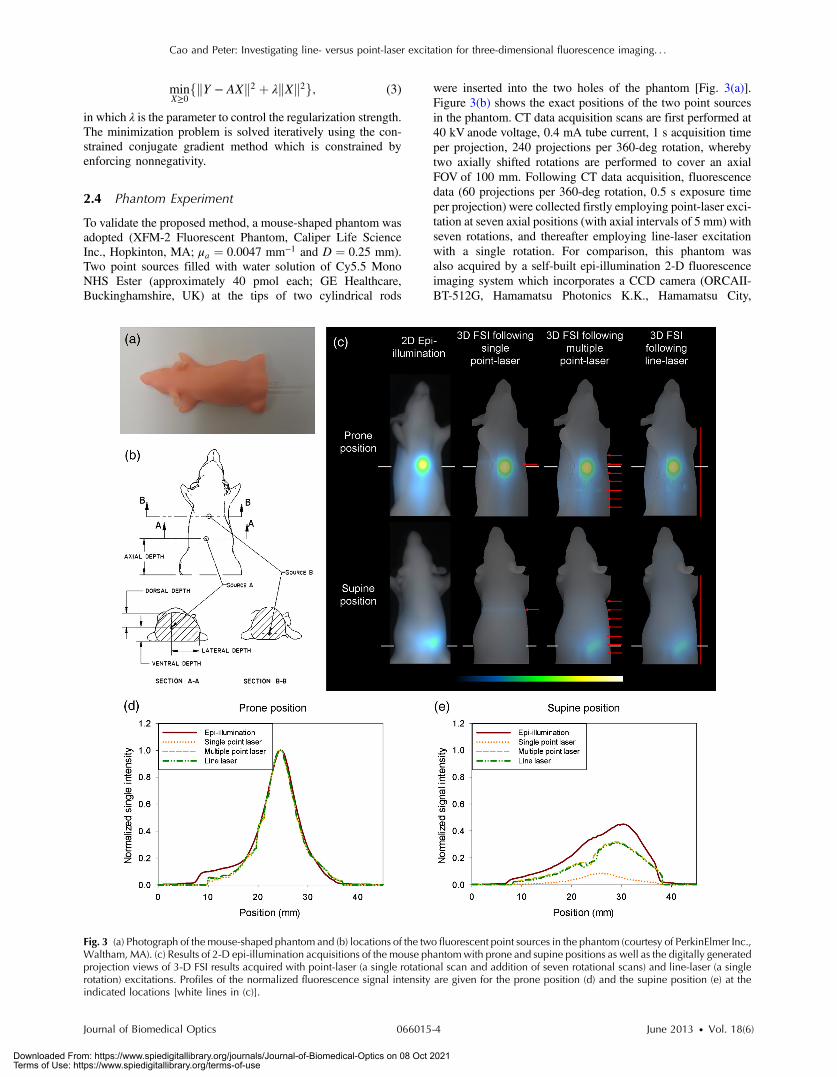
To validate the proposed method, a mouse-shaped phantom wasadopted (XFM-2 Fluorescent Phantom, Caliper Life ScienceInc., Hopkinton, MA; μa ¼ 0.0047 mm−1 and D ¼ 0.25 mm).Two point sources filled with water solution of Cy5.5 MonoNHS Ester (approximately 40 pmol each; GE Healthcare,Buckinghamshire, UK) at the tips of two cylindrical rods
were inserted into the two holes of the phantom [Fig. 3(a)].Figure 3(b) shows the exact positions of the two point sourcesin the phantom. CT data acquisition scans are first performed at40 kV anode voltage, 0.4 mA tube current, 1 s acquisition timeper projection, 240 projections per 360-deg rotation, wherebytwo axially shifted rotations are performed to cover an axialFOV of 100 mm. Following CT data acquisition, fluorescencedata (60 projections per 360-deg rotation, 0.5 s exposure timeper projection) were collected firstly employing point-laser exci-tation at seven axial positions (with axial intervals of 5 mm) withseven rotations, and thereafter employing line-laser excitationwith a single rotation. For comparison, this phantom wasalso acquired by a self-built epi-illumination 2-D fluorescenceimaging system which incorporates a CCD camera (ORCAII-BT-512G, Hamamatsu Photonics K.K., Hamamatsu City,
Fig. 3 (a) Photograph of the mouse-shaped phantom and (b) locations of the two fluorescent point sources in the phantom (courtesy of PerkinElmer Inc.,Waltham, MA). (c) Results of 2-D epi-illumination acquisitions of the mouse phantomwith prone and supine positions as well as the digitally generatedprojection views of 3-D FSI results acquired with point-laser (a single rotational scan and addition of seven rotational scans) and line-laser (a singlerotation) excitations. Profiles of the normalized fluorescence signal intensity are given for the prone position (d) and the supine position (e) at theindicated locations [white lines in (c)].
Journal of Biomedical Optics 066015-4 June 2013 • Vol. 18(6)
Cao and Peter: Investigating line- versus point-laser excitation for three-dimensional fluorescence imaging. . .
Downloaded From: https://www.spiedigitallibrary.org/journals/Journal-of-Biomedical-Optics on 08 Oct 2021Terms of Use: https://www.spiedigitallibrary.org/terms-of-use
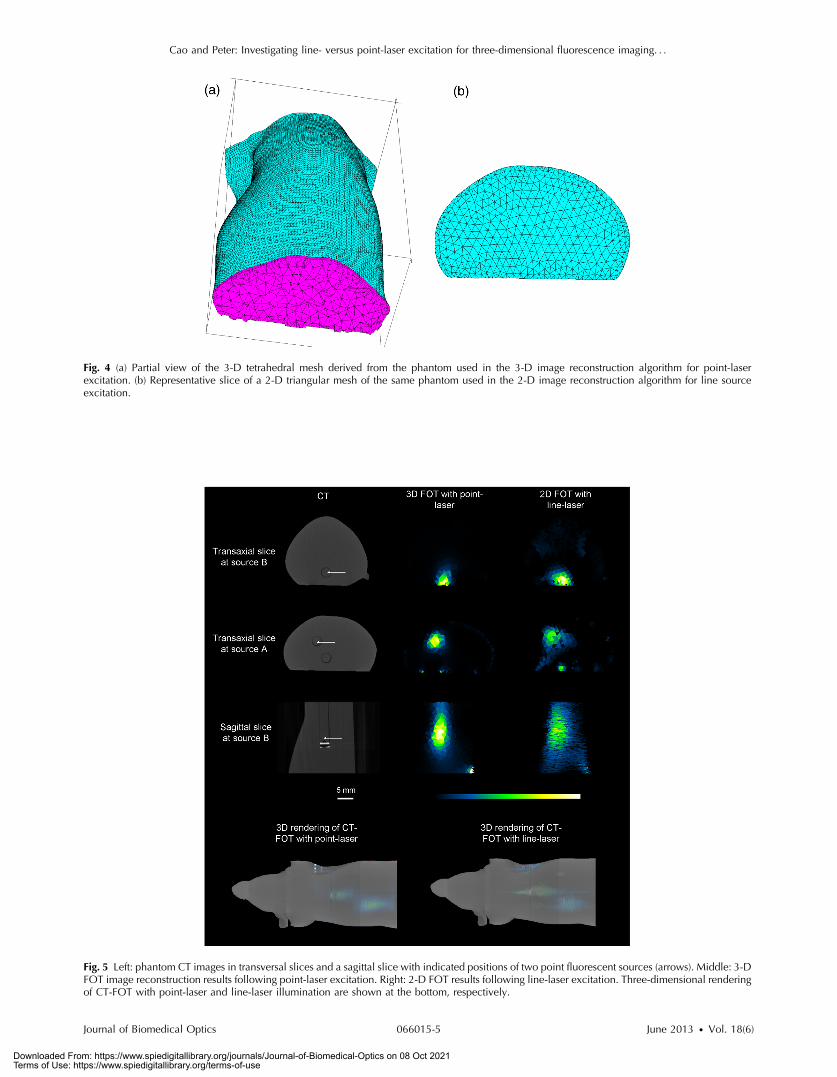
Fig. 4 (a) Partial view of the 3-D tetrahedral mesh derived from the phantom used in the 3-D image reconstruction algorithm for point-laserexcitation. (b) Representative slice of a 2-D triangular mesh of the same phantom used in the 2-D image reconstruction algorithm for line sourceexcitation.
Fig. 5 Left: phantom CT images in transversal slices and a sagittal slice with indicated positions of two point fluorescent sources (arrows). Middle: 3-DFOT image reconstruction results following point-laser excitation. Right: 2-D FOT results following line-laser excitation. Three-dimensional renderingof CT-FOT with point-laser and line-laser illumination are shown at the bottom, respectively.
Journal of Biomedical Optics 066015-5 June 2013 • Vol. 18(6)
Cao and Peter: Investigating line- versus point-laser excitation for three-dimensional fluorescence imaging. . .
Downloaded From: https://www.spiedigitallibrary.org/journals/Journal-of-Biomedical-Optics on 08 Oct 2021Terms of Use: https://www.spiedigitallibrary.org/terms-of-use
Japan) that is attached with an emission bandpass filter (FF01-716/40-25, Semrock Inc., Rochester, NY) as well as 4 LEDs(LR W5SM, OSRAM Opto Semiconductors GmbH,Regensburg, Germany) equipped with appropriate excitationfilters (FF01-655/40-25, Semrock Inc., Rochester, NY).
2.5 In Vivo Mouse Experiment
To further demonstrate the preclinical imaging ability of themethod, an in vivo mouse study was performed. This studywas carried out according to the policies and principles estab-lished by the German animal protection laws of district govern-ment Karlsruhe with the animal number G-61/10. A healthynude mouse was fed with chlorophyll free diets (CRD FLI,Harlan Laboratories, Inc., Indiana, IN) for three consecutivedays prior to imaging to reduce autofluorescence from abdomenand skin. One day prior to imaging, the mouse was injectedintravenously with 150 μl RediJect Bone Probe 680 (CaliperLife Science, Inc., Hopkinton, MA, concentration: 2 nmol∕150 μl). For cross-validation, SPECT data (120 projections ina 360-deg rotation, 30 s per projection) have been collected
following the administration of 104 MBq 99mTc tagged tomethylene diphosphonate molecules (MDP), injected 50 minprior to imaging. CT imaging was performed with the same pro-tocol as described in the phantom experiment. FollowingSPECT and CT scans, fluorescence data were acquired (60 pro-jections per 360-deg rotation, 0.5 s exposure time per projec-tion), first employing point-laser excitation and, thereafter,employing line-laser excitation. Image reconstruction was per-formed in reference to every modality as previously described.
3 Results
3.1 Phantom Experiment Results
3.1.1 3-D FSI
Figure 3(c) shows results of 2-D epi-illumination acquisitionof the mouse phantom at supine and prone positions, as wellas digital 2-D projection views of fused 3-D CT and FSI datausing both line-laser and point-laser illumination patterns,respectively. The view angles of the fused CT-FSI data areselected to be identical to those for the 2-D acquisition with
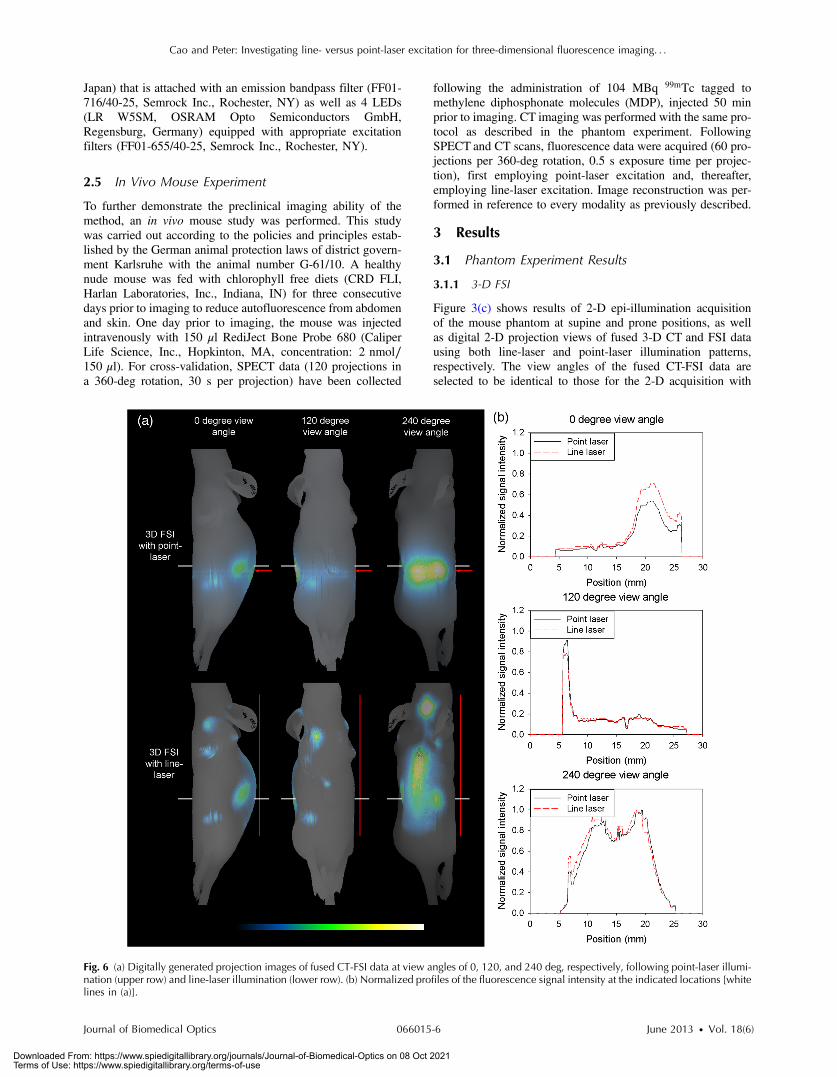
Fig. 6 (a) Digitally generated projection images of fused CT-FSI data at view angles of 0, 120, and 240 deg, respectively, following point-laser illumi-nation (upper row) and line-laser illumination (lower row). (b) Normalized profiles of the fluorescence signal intensity at the indicated locations [whitelines in (a)].
Journal of Biomedical Optics 066015-6 June 2013 • Vol. 18(6)
Cao and Peter: Investigating line- versus point-laser excitation for three-dimensional fluorescence imaging. . .
Downloaded From: https://www.spiedigitallibrary.org/journals/Journal-of-Biomedical-Optics on 08 Oct 2021Terms of Use: https://www.spiedigitallibrary.org/terms-of-use
epi-illumination. As can be seen in Fig. 3(c), when 3-D FSI dataare generated using point-laser illumination with only one axialposition, the axial FOV is primarily covering one fluorescentpoint source. Using multiple point-laser or line-laser illumina-tion, however, the whole phantom is exposed with one fullrotation. The fluorescence signal intensities are normalized indi-vidually for each illumination strategy toward its maximum sig-nal intensity. Figure 3(d) and 3(e) shows profiles of the signalintensities at the indicated positions providing quantitative com-parison among different illumination types.
3.1.2 FOT
Figure 4(a) depicts part of the 3-D mesh as calculated from theacquired CT data. This data set includes 18,987 nodes and73,339 tetrahedral elements. Figure 4(b) shows one of thederived 2-D meshes which includes 1017 nodes and 2593 tri-angular elements. Figure 5 shows results of 3-D FOT imagereconstruction following point-laser excitation, alongside resultsof FOT 2-D image reconstruction following line-laser illumina-tion; CT images are also provided as reference.
3.2 In Vivo Mouse Experiment Results
3.2.1 3-D FSI
The visualization of FSI results of the in vivo mouse experimentusing digital projection data is shown in Fig. 6(a). The upper rowdemonstrates the results following point-laser illumination at asingle axial position, while the lower row holds the results fol-lowing line-laser illumination. Profiles of the normalized fluo-rescence signal intensities are shown in Fig. 6(b) for a morequantitative comparison between the results following both illu-mination patterns.
3.2.2 FOT
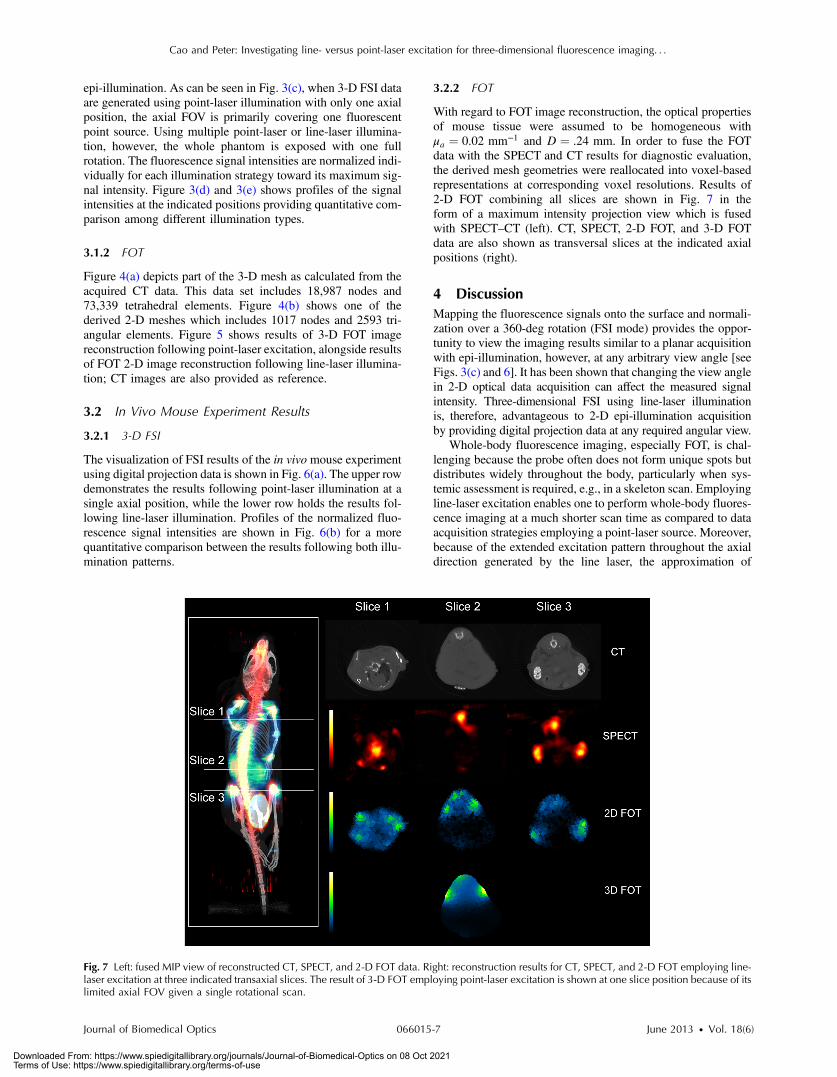
With regard to FOT image reconstruction, the optical propertiesof mouse tissue were assumed to be homogeneous withμa ¼ 0.02 mm−1 and D ¼ .24 mm. In order to fuse the FOTdata with the SPECT and CT results for diagnostic evaluation,the derived mesh geometries were reallocated into voxel-basedrepresentations at corresponding voxel resolutions. Results of2-D FOT combining all slices are shown in Fig. 7 in theform of a maximum intensity projection view which is fusedwith SPECT–CT (left). CT, SPECT, 2-D FOT, and 3-D FOTdata are also shown as transversal slices at the indicated axialpositions (right).
4 DiscussionMapping the fluorescence signals onto the surface and normali-zation over a 360-deg rotation (FSI mode) provides the oppor-tunity to view the imaging results similar to a planar acquisitionwith epi-illumination, however, at any arbitrary view angle [seeFigs. 3(c) and 6]. It has been shown that changing the view anglein 2-D optical data acquisition can affect the measured signalintensity. Three-dimensional FSI using line-laser illuminationis, therefore, advantageous to 2-D epi-illumination acquisitionby providing digital projection data at any required angular view.
Whole-body fluorescence imaging, especially FOT, is chal-lenging because the probe often does not form unique spots butdistributes widely throughout the body, particularly when sys-temic assessment is required, e.g., in a skeleton scan. Employingline-laser excitation enables one to perform whole-body fluores-cence imaging at a much shorter scan time as compared to dataacquisition strategies employing a point-laser source. Moreover,because of the extended excitation pattern throughout the axialdirection generated by the line laser, the approximation of
Fig. 7 Left: fused MIP view of reconstructed CT, SPECT, and 2-D FOT data. Right: reconstruction results for CT, SPECT, and 2-D FOT employing line-laser excitation at three indicated transaxial slices. The result of 3-D FOT employing point-laser excitation is shown at one slice position because of itslimited axial FOV given a single rotational scan.
Journal of Biomedical Optics 066015-7 June 2013 • Vol. 18(6)
Cao and Peter: Investigating line- versus point-laser excitation for three-dimensional fluorescence imaging. . .
Downloaded From: https://www.spiedigitallibrary.org/journals/Journal-of-Biomedical-Optics on 08 Oct 2021Terms of Use: https://www.spiedigitallibrary.org/terms-of-use
Eq. (2) could be locally held in practice. It is, however, not thecase for point-laser illumination. Two-dimensional imagereconstruction of tomographic slices becomes, therefore, practi-cally available over the entire animal following line-laser exci-tation. In comparison to 3-D FOT reconstruction with point-laser excitation, this method allows a much larger FOV giventhe same acquisition time. In the mouse phantom study withtwo point-like fluorescence inclusions, the 2-D FOT resultfrom the line-laser excitation shows broader distributions ofthe resolved point sources, especially in the axial direction,as compared to the 3-D reconstruction result from the point-laser excitation (cf. Fig. 5). Although, in this phantom study,3-D FOT with point-laser outperforms 2-D FOT with line-laser excitation. Note, however, that the data acquisition timeof the latter case was seven times faster. The in vivo experimentperformed in this study is in fact an extremely challengingexample for FOT as the hydroxyapatite-targeting probe hasan affinity to the entire skeleton system in the animal which isvery different to the case of spatially distinct point sources as arebeing used in the mouse phantom. The 2-D FOT reconstructionis applied slice by slice along the whole axial FOV. Intrinsicallycoregistered SPECT results with 99mTc-MDP, a probe with highbone-specificity as well, provides additional information forcross-validation. Two-dimensional FOT results are shown exem-plarily in three different transaxial slices (cf. Fig. 7). It can beseen from “Slice 1” that the small bone structures close to sur-face are well resolved, while the spine, which shows a highactivity uptake in SPECT, is not visible in FOT. In “Slice 2,”the 2-D FOT image shows not only the spine structure near tothe surface but also probe uptake in the kidneys, while no traceractivity can be seen in SPECT. “Slice 3” includes spine and kneejoints, showing similar information in FOT and SPECT.Employing point-laser excitation, however, only a small portionof the animal is within the active FOV. The reconstructionresults show a more pronounced convergence at the surfacearea (see the last row of Fig. 7).
This study has been particularly conducted to lay out a framefor future investigations. While exemplary studies have beenprovided illustratively for each illumination pattern, the resultsare not conclusive with respect to the quantitative accuracy ofeither of the involved method.
5 ConclusionIn conclusion, a trimodal SPECT–CT–OT system was investi-gated in this study, specifically with the aim of investigating theuse of a line-laser as the excitation source for 3-D fluorescenceimaging and tomography. Phantom and in vivo experimentsdemonstrate the feasibility of line-laser excitation yielding anaxially enlarged FOV in both 3-D FSI and FOT with shortacquisition time.
AcknowledgmentsThe authors would like to thank Bartlomiej Grychtol for the sup-port of mesh generation and Karin Leotta for excellent technicalassistance during the animal experiment. Disclosure statement:The authors have no conflict of interest to declare.
References1. S. A. Hilderbrand and R. Weissleder, “Near-infrared fluorescence:
application to in vivo molecular imaging,” Curr. Opin. Chem. Biol.14(1), 71–79 (2010).
2. F. Leblond et al., “Pre-clinical whole-body fluorescence imaging:review of instruments, methods and applications,” J. Photochem.Photobiol. B 98(1), 77–94 (2010).
3. R. B. Schulz, J. Ripoll, and V. Ntziachristos, “Noncontact opticaltomography of turbid media,” Opt. Lett. 28(18), 1701–1703 (2003).
4. A. Cong and G. Wang, “A finite-element-based reconstruction methodfor 3D fluorescence tomography,” Opt. Express 13(24), 9847–9857(2005).
5. H. Meyer et al., “Noncontact optical imaging in mice with full angularcoverage and automatic surface extraction,” Appl. Opt. 46(17), 3617–3627 (2007).
6. P. Mohajerani et al., “Compensation of optical heterogeneity-inducedartifacts in fluorescence molecular tomography: theory and in vivovalidation,” J. Biomed. Opt. 14(3), 034021 (2009).
7. K. O. Vasquez, C. Casavant, and J. D. Peterson, “Quantitative wholebody biodistribution of fluorescent-labeled agents by non-invasivetomographic imaging,” PLoS One 6(6), e20594 (2011).
8. N. Deliolanis et al, “Free-space fluorescence molecular tomographyutilizing 360 degrees geometry projections,” Opt. Lett. 32(4), 382–384 (2007).
9. X. Song et al., “Reconstruction for free-space fluorescence tomographyusing a novel hybrid adaptive finite element algorithm,” Opt. Express15(26), 18300–18317 (2007).
10. R. B. Schulz, J. Ripoll, and V. Ntziachristos, “Experimental fluores-cence tomography of tissues with noncontact measurements,” IEEETrans. Med. Imaging 23(4), 492–500 (2004).
11. S. Patwardhan et al., “Time-dependent whole-body fluorescencetomography of probe bio-distributions in mice,” Opt. Express 13(7),2564–2577 (2005).
12. J. Dutta et al., “Illumination pattern optimization for fluorescencetomography: theory and simulation studies,” Phys. Med. Biol. 55(10),2961–2982 (2010).
13. A. Bassi et al., “Spatial shift of spatially modulated light projected onturbid media,” J. Opt. Soc. Am. A 25(11), 2833–2839 (2008).
14. C. D’Andrea et al., “Fast 3D optical reconstruction in turbid mediausing spatially modulated light,” Biomed. Opt. Express 1(2), 471–481 (2010).
15. V. Venugopal et al., “Full-field time-resolved fluorescence tomographyof small animals,” Opt. Lett. 35(19), 3189–3191 (2010).
16. N. Ducros et al., “Fluorescence molecular tomography of an animalmodel using structured light rotating view acquisition,” J. Biomed.Opt. 18(2), 020503 (2013).
17. C. Li et al., “Three-dimensional fluorescence optical tomography insmall-animal imaging using simultaneous positron-emission-tomogra-phy priors,” Opt. Lett. 34(19), 2933–2935 (2009).
18. R. B. Schulz et al., “Hybrid system for simultaneous fluorescence andx-ray computed tomography,” IEEE Trans. Med. Imaging 29(2), 465–473 (2010).
19. L. Cao and J. Peter, “Bayesian reconstruction strategy of fluorescence-mediated tomography using an integrated SPECT–CT–OT system,”Phys. Med. Biol. 55(9), 2693–2708 (2010).
20. J. Peter, “Triple-modality imaging system,” U.S. Patent 2010/0030069A1 (February 4 2010).
21. L. A. Feldkamp, L. C. Davis, and J. W. Kress, “Practical cone-beamalgorithm,” J. Opt. Soc. Am. A 1(6), 612–619 (1984).
22. L. Cao and J. Peter, “Slit-slat collimator equipped gamma camera forwhole-mouse SPECT–CT imaging,” IEEE Trans. Nucl. Sci. 59(3),530–536 (2012).
23. L. A. Shepp and Y. Vardi, “Maximum likelihood reconstruction foremission tomography,” IEEE Trans. Med. Imaging 1(2), 113–122(1982).
24. L. Cao, M. Breithaupt, and J. Peter, “Geometrical co-calibration of atomographic optical system with CT for intrinsically co-registeredimaging,” Phys. Med. Biol. 55(6), 1591–1606 (2010).
25. H. Si and K. Gärtner, “Meshing piecewise linear complexes by con-strained Delaunay tetrahedralizations,” in Proc. 14th Int. MeshingRoundtable, pp. 147–163, Springer (2005).
Journal of Biomedical Optics 066015-8 June 2013 • Vol. 18(6)
Cao and Peter: Investigating line- versus point-laser excitation for three-dimensional fluorescence imaging. . .
Downloaded From: https://www.spiedigitallibrary.org/journals/Journal-of-Biomedical-Optics on 08 Oct 2021Terms of Use: https://www.spiedigitallibrary.org/terms-of-use