Embed Size (px)
Citation preview
Tharanath Tharanath
Investigating the design workflow for designing a component for Additive Manufacturing
A case study of designing a jet engine combustion chamber component for AM
Vaasa 2020
School of Technology and Innovation Master’s thesis in Industrial Systems Analytics
2
UNIVERSITY OF VAASA School of Innovation and Technology Author: Tharanath Tharanath Title of the Thesis: Investigating the design workflow for designing a component for Additive Manufacturing: A case study of designing a jet engine combustion chamber compo-nent for AM Degree: Master of Science Programme: Industrial Systems Analytics Supervisor: Rayko Toshev Year: 2020 Number of pages: 123
ABSTRACT: The increasing integration of Additive Manufacturing (AM) in the Product Development and pro-
duction phase has brought a need for developing a new design for manufacturing methodology
which is distinct to AM. Commonly known as Design for Additive Manufacturing (DfAM), it aims
to take complete advantage of the unique capabilities of AM by developing rules, guidelines,
and design methodologies. The existing studies on DfAM do not address practical problems
faced during the design stage which leads to dilemmas and uncertainties in decision making
concerning the design elements. Therefore, a workflow for implementing the methodologies of
DfAM is important. To solve this problem, this thesis develops and documents the workflow for
modeling lattice structures and minimal structures using the best tools available. In addition to
this, the study analyzes the workflow developed with the help of a case study. In this case study,
a component is developed for heat management which makes the use of heat transfer between
solid and fluid. The design process in the case study is developed with the integration of Design
for Six Sigma methodology. The outcomes are documented, and best practices from the study
are reported.
KEYWORDS: Design for Additive Manufacturing, DfAM, Additive Manufacturing, Design for Six-Sigma, DFSS, Conjugate Heat transfer Analysis, Lattice Structures, Minimal Structures, Gy-roid Structures, Siemens NX, nTop Platform
3
Contents
1 Introduction 11
1.1 Research Area 13
1.2 Research Onion as a Framework 14
1.3 Research Questions 17
1.4 Case study Problem Statement 17
1.5 Structure of the Study 20
2 Literature Review 21
2.1 Additive Manufacturing 21
Additive Manufacturing Processes 22
2.2 Design for Additive Manufacturing (DfAM) 24
Design for better Accuracy and Surface finish 25
Design for optimal Mechanical shapes 25
Self-supporting structures: 26
Print orientation/Avoid anisotropy 26
Holes and Round sections/Passages 27
Design for minimum post-processing 27
Optimize the part using topology optimization 27
Design for lightweight structures 28
2.3 Existing studies on DfAM implementation, approaches and tools used 29
2.4 Computer-Aided Design (CAD) 32
Parametric, Non-Parametric, and Implicit modeling: 33
Lattice Structures 35
2.5 Computer-Aided Engineering 38
2.6 Lean Six Sigma 41
Design for Six-Sigma (DFSS) 42
Design for Six-Sigma and Design for Additive Manufacturing (DfAM). 43
Design for Six-Sigma (DFSS) Phase: 45

4
3 Methodology 54
3.1 Creating Parametric Lattice structures. 55
3.2 Conjugate heat transfer 57
3.3 Software Tools Used 57
Siemens NX 57
nTop Platform 57
Ansys AIM 57
MATLAB 58
KDsurf 58
AHP Online Calculator 58
3.4 Design for Six Sigma 59
Analytic hierarchy process (AHP) 60
4 Results 62
4.1 Lattice structure design workflow 62
Reports from lattice structure design workflow 63
4.2 Heat transfer analysis workflow 72
Reports from Computer Simulation of the structure 73
Workflow for Simulating Heat transfer using Ansys AIM 74
4.3 Case Study Results 76
Identify Phase 77
Define Phase 80
Design and Optimize Phase 85
Validate phase: 95
4.4 Conclusions from the workflows for design and simulation 98
5 Discussion and Conclusion 99
5.1 Conclusion 99
5.2 Discussion 103
5.3 Scope for Future work 104

5
References 105
Appendices 120
Appendix 1. Thermal Analysis results 120
Appendix 2. MATLAB Code for Gyroid 123
6
Figures Figure 1 Research Area in a Venn Diagram 13
Figure 2 Saunders’s Research onion, (Mark et al., 2007) 14
Figure 3 Combustion geometry and dimension 17
Figure 4 Wall around the geometry and conformal cooling channel 18
Figure 5 Design example 19
Figure 6 Additive Manufacturing Process Classifications. 21
Figure 7 illustration of structure with nodes n and struts p 35
Figure 8 Representation of minimal surface equations (from left) (a) Schwartz (b) Gyroid
(c) Diamond (Strano et al., 2013) 36
Figure 9 Schoen Gyroid representation and its printed version source (Pixelrust, 2012)
37
Figure 10 Conjugate and Convective Heat transfer (Li et al., 2016) 39
Figure 11 (A) Circular Pin and (B) Diamond Pin (Furukawa & Yamauchi, 2018) 40
Figure 12 (a) Radial plate-fin heat sink (b) 3-D topology - optimized heat sink (Joo et al.,
2018) 44
Figure 13 Design Process (a) Without DFSS (b) With DFSS 44
Figure 14 Design for Six-Sigma (DFSS) - IDDOV Phases 45
Figure 15 Customer expectations Vs Designer understandings 48
Figure 16 Unit cell with struts and node. (a) uniform thickness lattice (b) non-uniform
thickness lattice 55
Figure 17 Lattice generation methods in Softwares (NX and nTop Platform) 55
Figure 18 Representation of minimal surface equations (from left) (a) Schwartz (b) Gyroid
(c) Diamond (Strano et al., 2013) 56
Figure 19 Analytic hierarchy process methodology (Kassem et al., 2017) 60
Figure 20 Built-in library of lattice structures in NX 64
Figure 21 Workflow for creating a unit fill type lattice in NX 65
Figure 22 Workflow for creating Unit conformal type lattice in NX 65
Figure 23 Workflow for creating non-conformal type Gyroid Lattice in NX 66
Figure 24 Workflow for creating conformal type Gyroid Lattice in NX 66
7
Figure 25 Workflow for creating conformal type Gyroid Lattice in NX 67
Figure 26 Creating Schwarz - P lattice structure in NX 67
Figure 27 Lattice Generation using nTopology Element 68
Figure 28 Gyroid/Minimal surface body generation using nTop Platform 69
Figure 29 Gyroid/Minimal Surface generation using KDsurf 70
Figure 30 Gyroid generation using MATLAB 71
Figure 31 Workflow for simulating conjugate heat transfer using Ansys AIM 74
Figure 32 Results generated in Ansys AIM post CHT simulation 75
Figure 33 DFSS - IDDOV phase roadmap of this project 78
Figure 34 Project Schedule - Gantt Chart 79
Figure 35 AHP analysis for selecting the best simulation software. 83
Figure 36 Variable thickness Pin Fin design concept - Parametric design type 86
Figure 37 Cell Type Lattice structures 87
Figure 38 Face type lattice structures 87
Figure 39 Gyroid TPMS type Minimal surface lattices 88
Figure 40 Candidate Concept (Pin Fins) around the heat transfer area. 89
Figure 41 Thermal Analysis Workflow 90
Figure 42 Lattice placement for the CHT simulation 91
Figure 42 Simulation Setup 92
Figure 43 Chart comparing the results from the Thermal Simulations 94
Figure 44 Print Orientation and Support preview using Altair Inspire 95
Figure 45 Optimal Workflow for Designing for AM 100
8
Tables Table 1 Study on approaches of DfAM in literature 30
Table 2 Difference between Lean and Six Sigma methodologies 42
Table 3 DFSS IDDOV Activities for Process and Product Design (Cudney and Furterer 2016)
46
Table 4 DFSS - Identify Phase tools and Techniques (Cudney & Furterer, 2016) 47
Table 5 DFSS - Define Phase activities and Tools/Techniques used (Cudney & Furterer,
2016) 49
Table 6 Pugh’s Concept Selection Technique. (Cudney & Furterer, 2016) 51
Table 7 Design Phase Activities and Tools/Deliverables (Cudney & Furterer, 2016) 52
Table 8 Concept verification Scorecard 53
Table 9 DFSS tools used in different phases of the design process of the case study 59
Table 10 The 1-9 Scale in the AHP (Zhang et al., 2009) 61
Table 11 Hardware and software used for lattice design 62
Table 12 Report from the lattice structure design workflow 63
Table 13 Hardware specification used for conducting CHT analysis 72
Table 14 Reports from CHT Simulation of the lattice structure 73
Table 15 Customer Requirement Form 81
Table 16 Customer Requirement Table 82
Table 17 Comparison of Computer Simulation Softwares 84
Table 18 Pugh's Concept Selection Matrix 89
Table 19 Pin Fin Placement Strategy 91
Table 20 Results from the Thermal Simulations 93
Table 21 Results from thermo-mechanical simulation using Altair Inspire 96
Table 22 Concept Verification Scorecard 97
9
Abbreviations AHP - Analytic Hierarchy Process
AM - Additive Manufacturing
BJ - Binder Jetting
CAD - Computer Aided Design
CAE - Computer Aided Design
CHT - Conjugate Heat Transfer
CTS - Critical to Satisfaction
DfAM - Design for Additive Manufacturing
DFSS - Design for Six Sigma
ISO - International Organization for Standardization
LSS - Lean Six Sigma
ME - Material Extrusion
MJ - Material Jetting
NX - Siemens NX
PBF – M - Powder Bed Fusion (Metal)
PBF – P - Powder Bed Fusion (Polymer)
TPMS - Triply periodic minimal surfaces
VOC - Voice of Customer
VP - VAT Polymerization

10
Acknowledgment
I would like to thank Dr. Rayko Toshev for his motivation, guidance, and encouragement
throughout my graduate career. I am grateful to have him as my thesis supervisor. This
thesis is part of my research on Additive Manufacturing at the University of Vaasa under
his supervision. I would also like to thank Mr. Heikki J Salminen, for his support on the
technical know-how of the case study and supervision of the computer simulation in this
thesis.
A heartfelt thanks and gratitude to my late father, my family, and friends for their con-
tinuous support and motivation during my hard times.
11
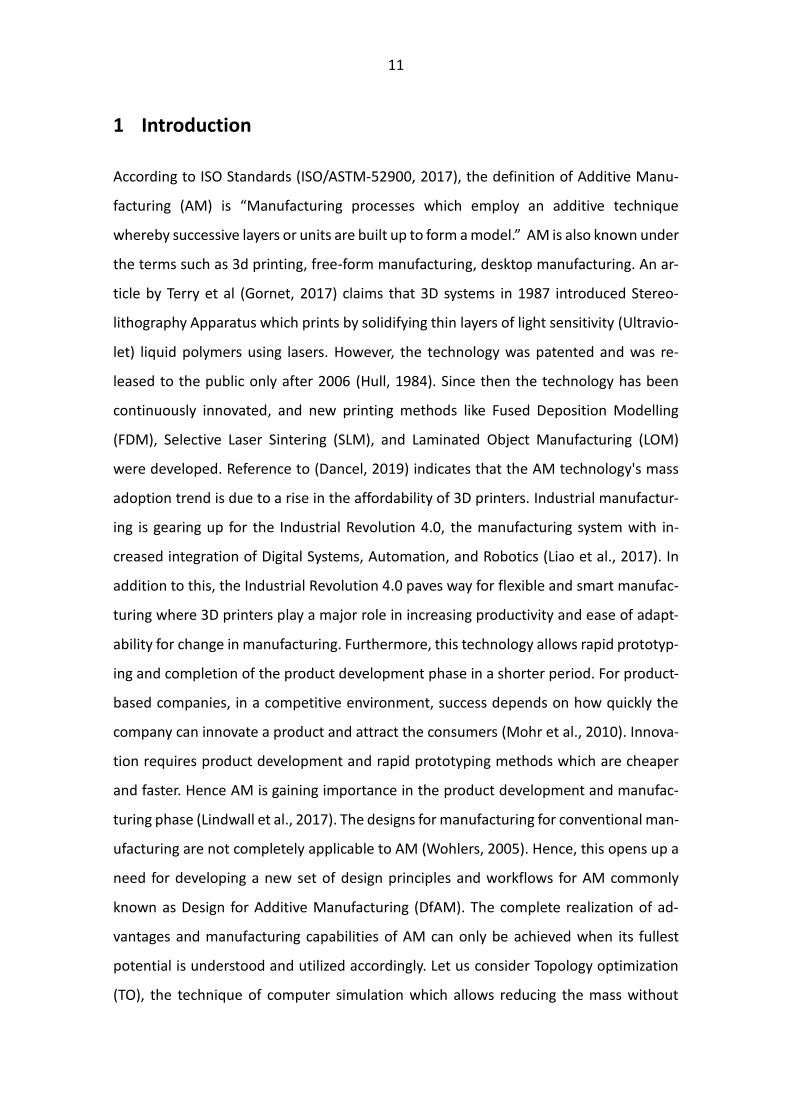
1 Introduction
According to ISO Standards (ISO/ASTM-52900, 2017), the definition of Additive Manu-
facturing (AM) is “Manufacturing processes which employ an additive technique
whereby successive layers or units are built up to form a model.” AM is also known under
the terms such as 3d printing, free-form manufacturing, desktop manufacturing. An ar-
ticle by Terry et al (Gornet, 2017) claims that 3D systems in 1987 introduced Stereo-
lithography Apparatus which prints by solidifying thin layers of light sensitivity (Ultravio-
let) liquid polymers using lasers. However, the technology was patented and was re-
leased to the public only after 2006 (Hull, 1984). Since then the technology has been
continuously innovated, and new printing methods like Fused Deposition Modelling
(FDM), Selective Laser Sintering (SLM), and Laminated Object Manufacturing (LOM)
were developed. Reference to (Dancel, 2019) indicates that the AM technology's mass
adoption trend is due to a rise in the affordability of 3D printers. Industrial manufactur-
ing is gearing up for the Industrial Revolution 4.0, the manufacturing system with in-
creased integration of Digital Systems, Automation, and Robotics (Liao et al., 2017). In
addition to this, the Industrial Revolution 4.0 paves way for flexible and smart manufac-
turing where 3D printers play a major role in increasing productivity and ease of adapt-
ability for change in manufacturing. Furthermore, this technology allows rapid prototyp-
ing and completion of the product development phase in a shorter period. For product-
based companies, in a competitive environment, success depends on how quickly the
company can innovate a product and attract the consumers (Mohr et al., 2010). Innova-
tion requires product development and rapid prototyping methods which are cheaper
and faster. Hence AM is gaining importance in the product development and manufac-
turing phase (Lindwall et al., 2017). The designs for manufacturing for conventional man-
ufacturing are not completely applicable to AM (Wohlers, 2005). Hence, this opens up a
need for developing a new set of design principles and workflows for AM commonly
known as Design for Additive Manufacturing (DfAM). The complete realization of ad-
vantages and manufacturing capabilities of AM can only be achieved when its fullest
potential is understood and utilized accordingly. Let us consider Topology optimization
(TO), the technique of computer simulation which allows reducing the mass without

12
compromising the strength (Bendsoe & Sigmund, 2013). TO generates results which are
extremely complicated in terms of geometries and shapes. As a result, AM goes hand in
hand with TO because of its ability to manufacture complex geometries and shapes.
However, if the geometries are not self-supporting, the print will fail; thus, support struc-
tures must be generated for both physical support and in case of metal AM to enhance
heat dissipation. Removal of support structures are sometimes complicated and can cost
a significant share of total print costs (Jiang & Xu, 2018). Hence, DfAM plays an important
role in designing for AM. DfAM consists of rules for designing and manufacturing in AM
(Kumke et al., 2016b), which is key for utilizing the potential of AM to its fullest.
The sheer difference between the conventional (subtractive and formative) manufactur-
ing and Additive Manufacturing (AM) method in terms of how the product is being man-
ufactured, differentiates the design process followed in designing components for man-
ufacturing. Therefore, mechanical designers with experiences in conventional manufac-
turing methods are required to learn the design principles of AM. For instance, while
conducting Finite Element Simulations (FEM) simulations; due to less complexity of the
geometries of products manufactured by conventional manufacturing, the meshing and
simulation process is faster. On the other hand, the unique feature of the AM is its ability
to manufacture complex geometries (D. W. Rosen, 2016). And so, the meshing and con-
ducting simulations will be comparatively complicated and will consume more time and
resources. The application of DfAM methodology in the design process needs to be stud-
ied in-depth and developing a dedicated workflow is essential. This study introduces the
readers to design principles of AM, discusses existing research on DfAM, describes the
methodology in designing the shapes AM, and with a case study, aims to develop a work-
flow ideal for DfAM. In addition to this, the design process needs to track the data of
different parameters involved in DfAM. By implementing the Design for Six Sigma meth-
odology, this research aims to streamline the use of parameters in the design process.
13
1.1 Research Area
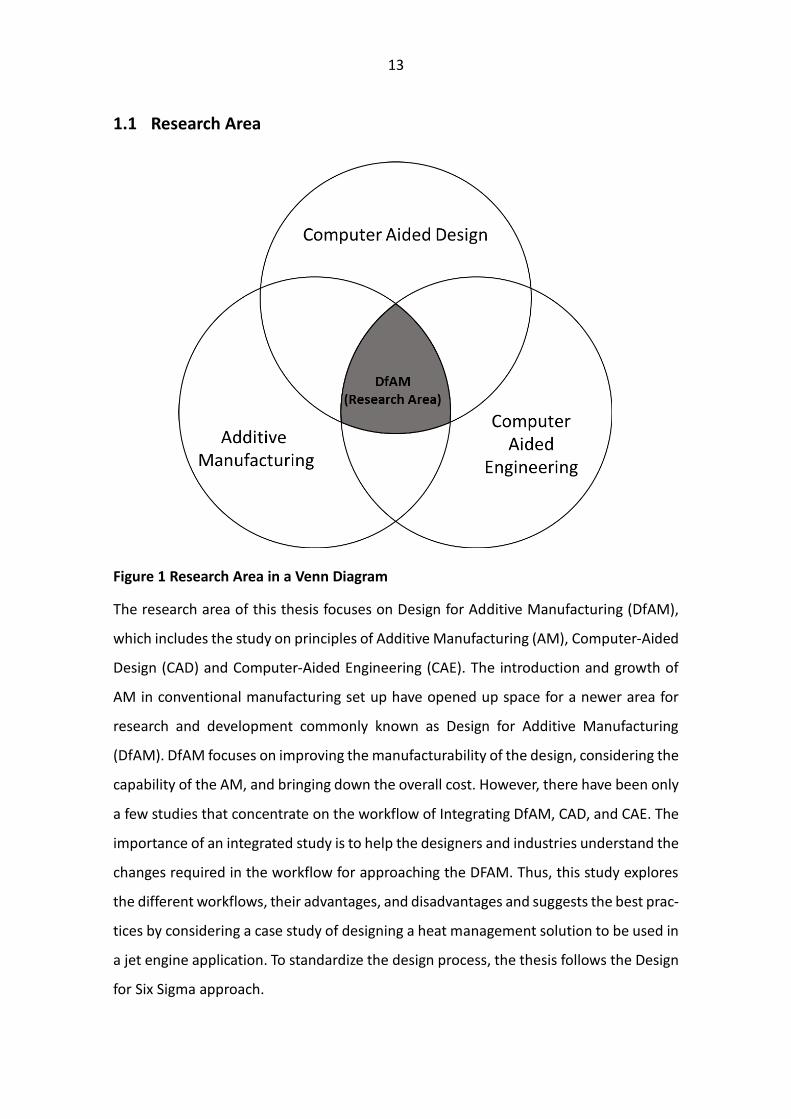
Figure 1 Research Area in a Venn Diagram
The research area of this thesis focuses on Design for Additive Manufacturing (DfAM),
which includes the study on principles of Additive Manufacturing (AM), Computer-Aided
Design (CAD) and Computer-Aided Engineering (CAE). The introduction and growth of
AM in conventional manufacturing set up have opened up space for a newer area for
research and development commonly known as Design for Additive Manufacturing
(DfAM). DfAM focuses on improving the manufacturability of the design, considering the
capability of the AM, and bringing down the overall cost. However, there have been only
a few studies that concentrate on the workflow of Integrating DfAM, CAD, and CAE. The
importance of an integrated study is to help the designers and industries understand the
changes required in the workflow for approaching the DFAM. Thus, this study explores
the different workflows, their advantages, and disadvantages and suggests the best prac-
tices by considering a case study of designing a heat management solution to be used in
a jet engine application. To standardize the design process, the thesis follows the Design
for Six Sigma approach.
14
To minimize the complexity involved and reduce the project span, the study only focuses
on the design and validation, and does not include,
1. Structural load study.
2. Manufacturing of the final design.
The key highlight in the research include the following,
➢ Exploring the workflow for designing Lattice structures like cellular lattices.
➢ Studying the workflow for designing minimal surfaces like Gyroid.
➢ Evaluating the workflow for Conjugate Heat transfer analysis of the lattice struc-
tures.
➢ Integration of Design for Six Sigma tools in the design workflow.
1.2 Research Onion as a Framework
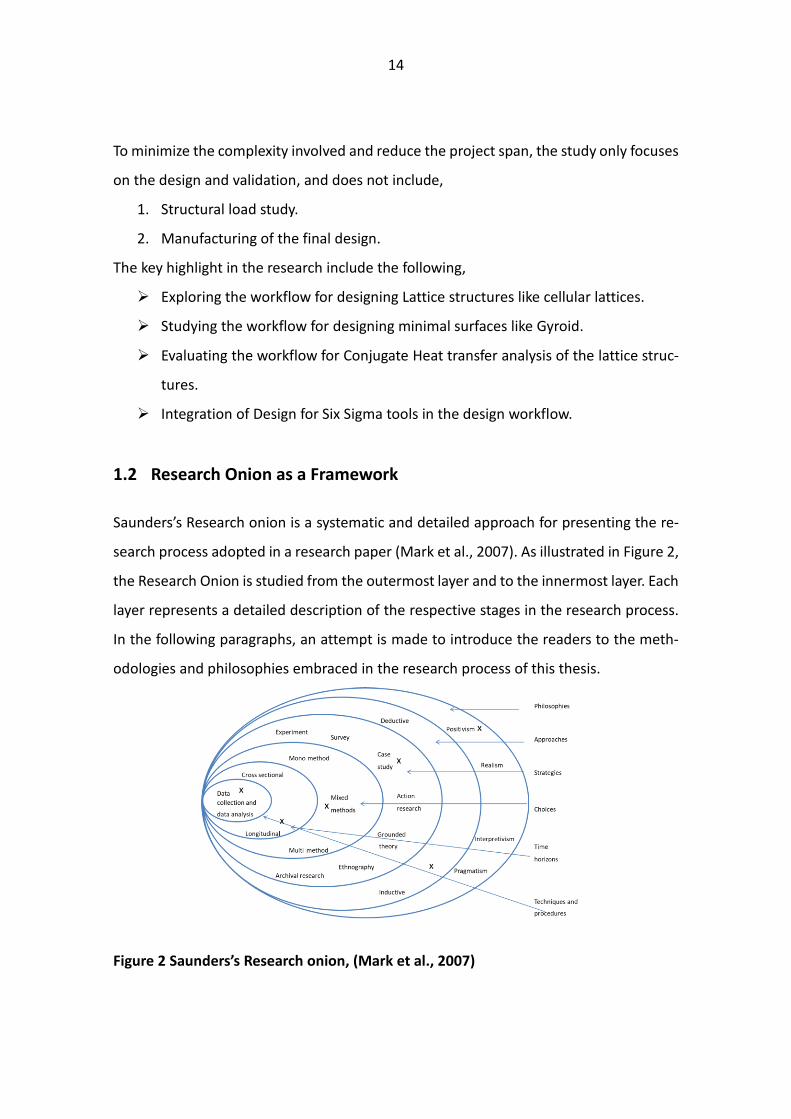
Saunders’s Research onion is a systematic and detailed approach for presenting the re-
search process adopted in a research paper (Mark et al., 2007). As illustrated in Figure 2,
the Research Onion is studied from the outermost layer and to the innermost layer. Each
layer represents a detailed description of the respective stages in the research process.
In the following paragraphs, an attempt is made to introduce the readers to the meth-
odologies and philosophies embraced in the research process of this thesis.
Figure 2 Saunders’s Research onion, (Mark et al., 2007)
15
Research Philosophy (Layer 1)
The research philosophy of this study leans on Epistemology. According to (Bryman,
2016), Epistemology incorporates positivism, realism, and interpretivism. The philoso-
phy of the study chosen in this thesis is Positivism. The underlying motivation for the
study is the questions that needed to be answered. With the increasing integration of
Additive Manufacturing, due to simpler and more affordable machines in the market,
the research questions framed are intended to help the mechanical designers and re-
searchers in the field to understand how they can use existing designing approaches to
design objects for AM. An effort was made to answer the questions in a very scientific
manner with evidence that supports the claims made in the discussion.
Research Approaches (Layer 2)
The research approaches layer in Saunders’s Research onion concerns with the validation
of the facts and findings of the research. In their book (Mark et al., 2007) describes that
the research approaches can be of two types; namely, deductive and inductive ap-
proaches. According to (Silverman, 2013), the deductive approach develops a theory or
hypothesis (or hypotheses) on existing theory and then frames the research approach to
test it. On the other hand, as per (Bell et al., 2018) the Inductive approach is described
as a move from a specific area to general of the research topic. The research approach
in this thesis can be characterized as a Deductive approach. There are pre-existing stud-
ies on the implementation of Design for Additive Manufacturing describing its purpose
and benefits. This research focuses on the existing studies and evaluates the approach
to answer the questions considering a case study.
Research Strategies (Layer 3)
Research Strategies describes the strategies used by the researcher to carry out the re-
search work (Mark et al., 2007). These strategies, in general, include a number of differ-
ent approaches, namely case studies, interviews, surveys, archival research, etcetera.
The strategy of the research work in this study is carried out by case study research. After
16
establishing the groundwork for the design principles and methodologies in additive
manufacturing as well as general industrial design; the research proceeds to implement
it in a case study to arrive at a conclusion that can assess the findings from the case study
and answer the research question.
Research Choices (Layer 4)
Research Choices describes the choice of methodology in the collection and processing
of the data. There are three choices used in research, mono-method, mixed-method,
and multi-method. These methods are differentiated by the approach of adopting the
qualitative and quantitative methodology. The research choice made in this study is
multi-methods. Both qualitative and quantitative methodologies are used to answer the
research questions.
Time Horizon (Layer 5)
This layer provides information about the time dependency of the research work. There
are two types of Time Horizons in research, namely cross-section and longitudinal
(Bryman, 2016). The cross-sectional time horizon focuses on collecting data from a spe-
cific time whereas the longitudinal time horizon collects data repeatedly from an ex-
tended time period. The research in this study collects data over a cross-sectional time
horizon. The data collected to support the conclusion are mainly from the design work-
flow and simulations associated with the case study.
Data Collection Methods (Layer 6)
This is the innermost layer of the Research onion. The data collected are from both the
primary source and secondary source. The primary source mainly consists of the data
collected from the simulations and design process of the case study. The secondary data
are the design procedures, parameters, and literature from various sources including re-
search papers, books, YouTube tutorials, and blogs.
17
1.3 Research Questions
1) What is the optimal workflow for designing a metal component for heat transfer
produced by Additive Manufacturing technology?
2) What are the challenges faced by the designers while designing for AM in terms
of the current software capabilities?
3) Can lattice structures with complex geometries be designed by conventional CAD
software?
4) Can lattice structures be simulated for thermal properties using conventional
computational software?
1.4 Case study Problem Statement
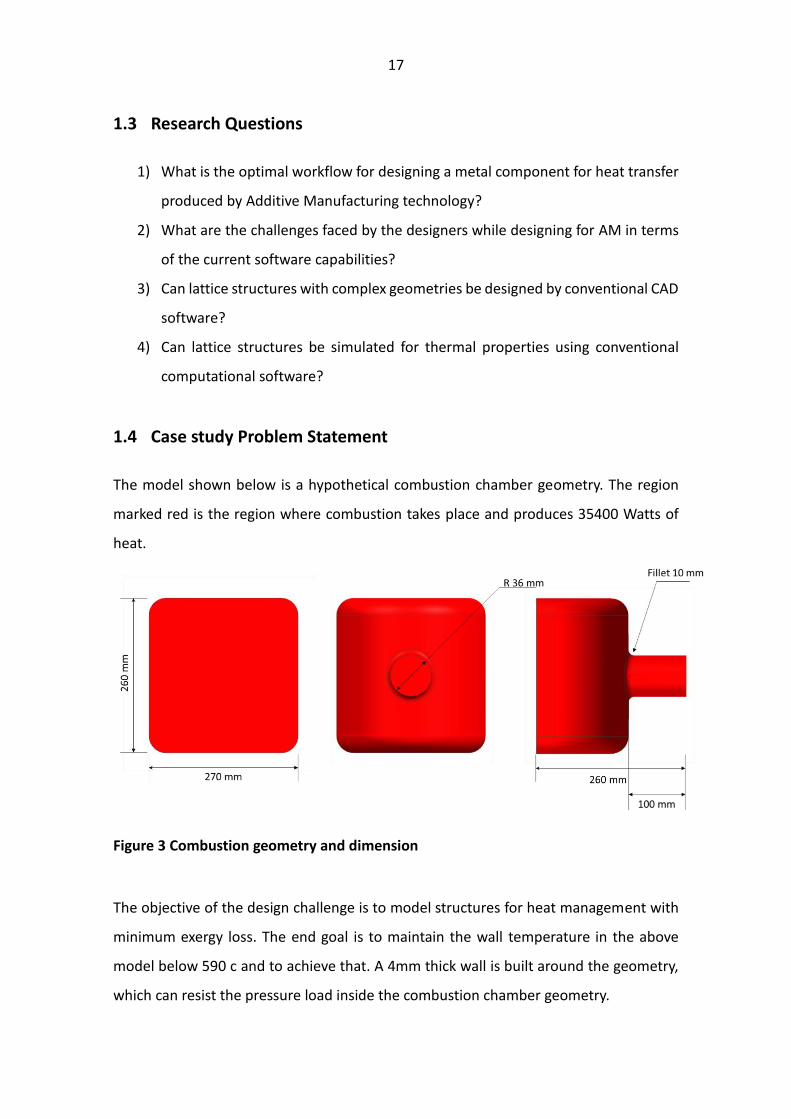
The model shown below is a hypothetical combustion chamber geometry. The region
marked red is the region where combustion takes place and produces 35400 Watts of
heat.
Figure 3 Combustion geometry and dimension
The objective of the design challenge is to model structures for heat management with
minimum exergy loss. The end goal is to maintain the wall temperature in the above
model below 590 c and to achieve that. A 4mm thick wall is built around the geometry,
which can resist the pressure load inside the combustion chamber geometry.

18
To cool down the geometry, compressed air is used as a coolant under an inlet pressure
of range of 82- 81 bar with expected pressure at the outlet at 80 bar. The temperature
range of coolant is 300 - 500 c near the inlet region. The channel for coolant flow can be
increased to a height of 4 mm. To increase convection and thereby to facilitate more heat
transfer, designs with the higher surface area are preferred. The cooling features are
mapped conformally over the wall to facilitate even distribution of temperature near the
inner surface of the wall.
The Figure 4 shows the design options,
Figure 4 Wall around the geometry and conformal cooling channel
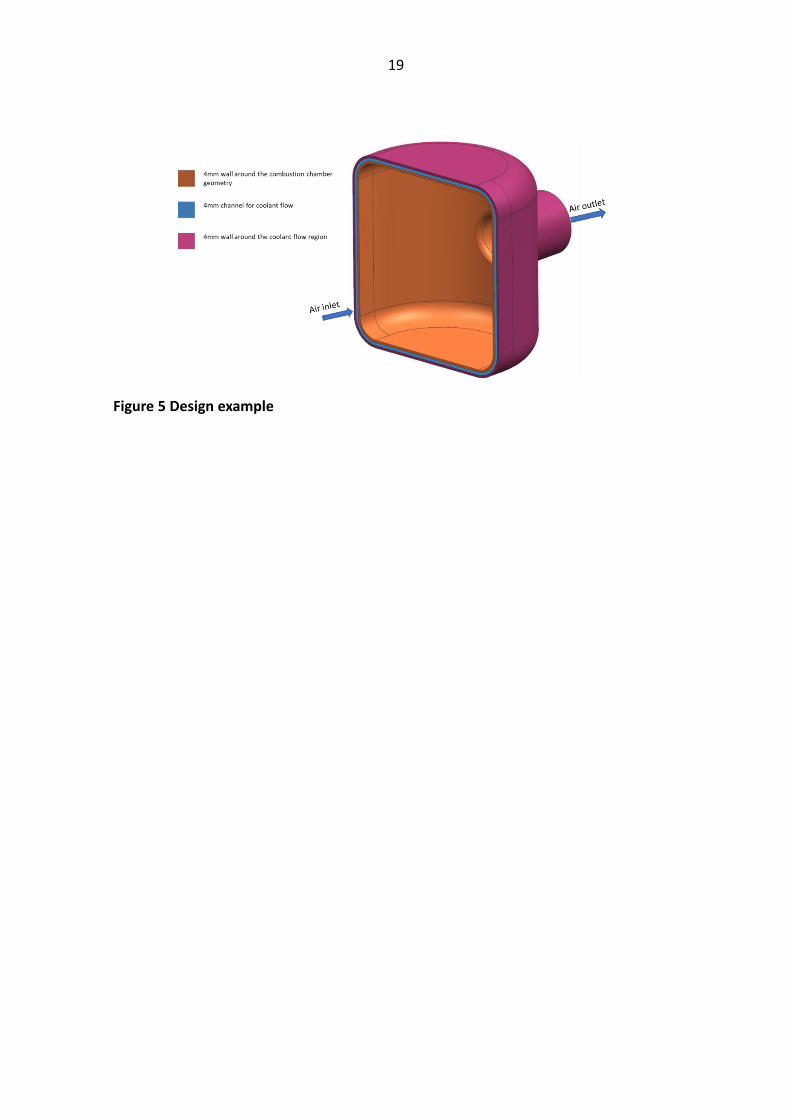
The secondary objective of the challenge is to obtain maximum material utilization effi-
ciency while maintaining minimum mass. The possible structures could be the use of
lattice structures or pin fins but avoid using slender cross-sections. Figure 5 represents
an example of the final model expectation. The boundary conditions for conjugate heat
transfer simulations are,
Coolant material: Compressed Air with a density of 56,2 kg m-3
Inlet pressure: 81-82 bar in 1 bar steps (can be increased up to 81 bar)
Inlet temperature: 300- 500 c in 100 c steps
Outlet Pressure: 80 bar
Heat flow near the combustion chamber wall: 35.4 kW
19
Figure 5 Design example
20
1.5 Structure of the Study
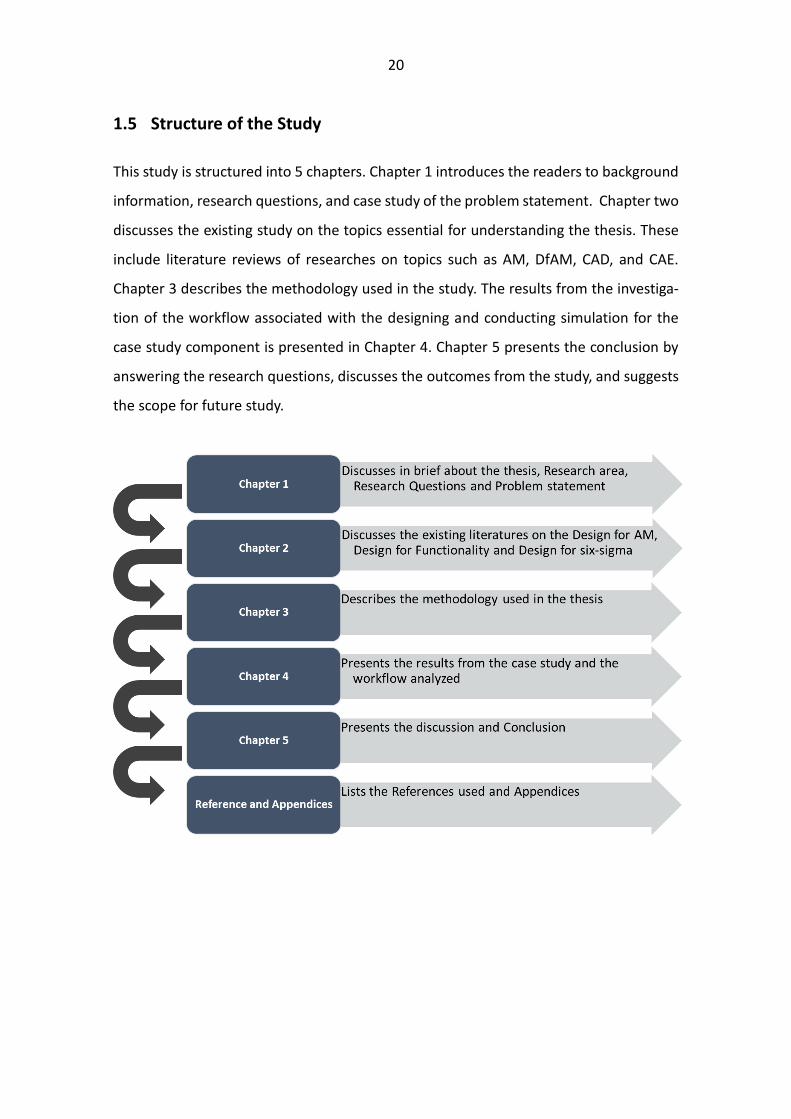
This study is structured into 5 chapters. Chapter 1 introduces the readers to background
information, research questions, and case study of the problem statement. Chapter two
discusses the existing study on the topics essential for understanding the thesis. These
include literature reviews of researches on topics such as AM, DfAM, CAD, and CAE.
Chapter 3 describes the methodology used in the study. The results from the investiga-
tion of the workflow associated with the designing and conducting simulation for the
case study component is presented in Chapter 4. Chapter 5 presents the conclusion by
answering the research questions, discusses the outcomes from the study, and suggests
the scope for future study.
21
2 Literature Review
2.1 Additive Manufacturing
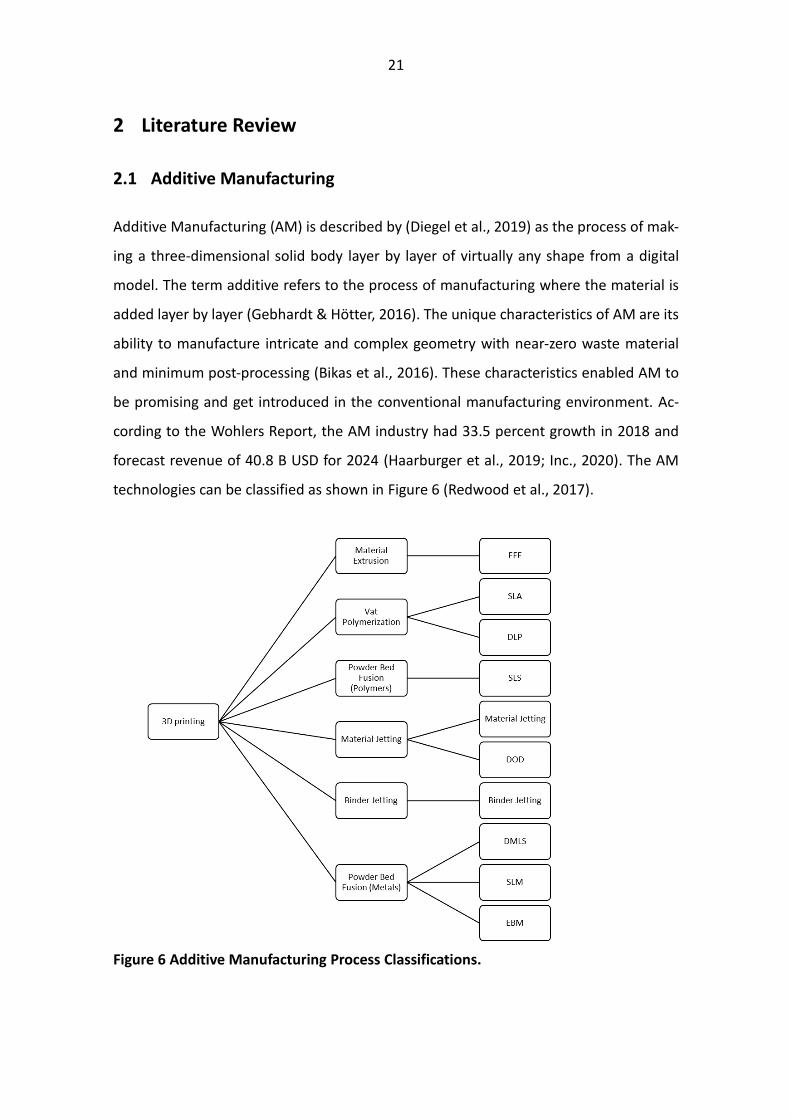
Additive Manufacturing (AM) is described by (Diegel et al., 2019) as the process of mak-
ing a three-dimensional solid body layer by layer of virtually any shape from a digital
model. The term additive refers to the process of manufacturing where the material is
added layer by layer (Gebhardt & Hötter, 2016). The unique characteristics of AM are its
ability to manufacture intricate and complex geometry with near-zero waste material
and minimum post-processing (Bikas et al., 2016). These characteristics enabled AM to
be promising and get introduced in the conventional manufacturing environment. Ac-
cording to the Wohlers Report, the AM industry had 33.5 percent growth in 2018 and
forecast revenue of 40.8 B USD for 2024 (Haarburger et al., 2019; Inc., 2020). The AM
technologies can be classified as shown in Figure 6 (Redwood et al., 2017).
Figure 6 Additive Manufacturing Process Classifications.
22
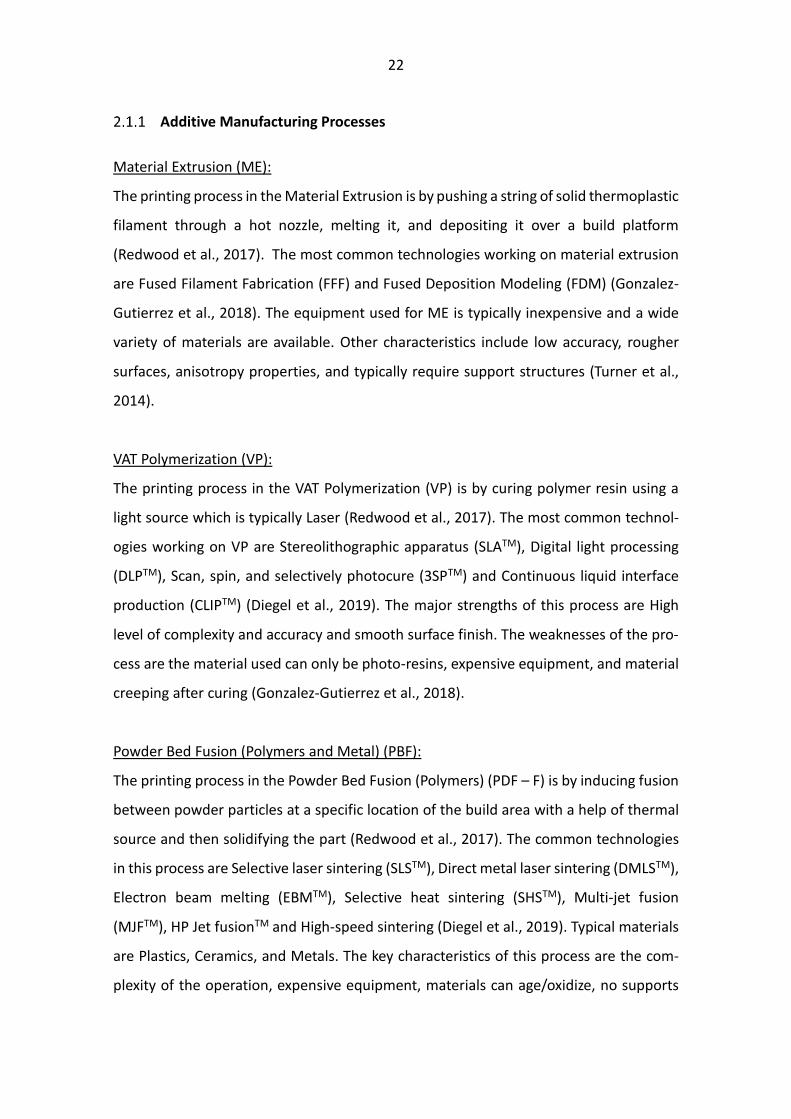
Additive Manufacturing Processes
Material Extrusion (ME):
The printing process in the Material Extrusion is by pushing a string of solid thermoplastic
filament through a hot nozzle, melting it, and depositing it over a build platform
(Redwood et al., 2017). The most common technologies working on material extrusion
are Fused Filament Fabrication (FFF) and Fused Deposition Modeling (FDM) (Gonzalez-
Gutierrez et al., 2018). The equipment used for ME is typically inexpensive and a wide
variety of materials are available. Other characteristics include low accuracy, rougher
surfaces, anisotropy properties, and typically require support structures (Turner et al.,
2014).
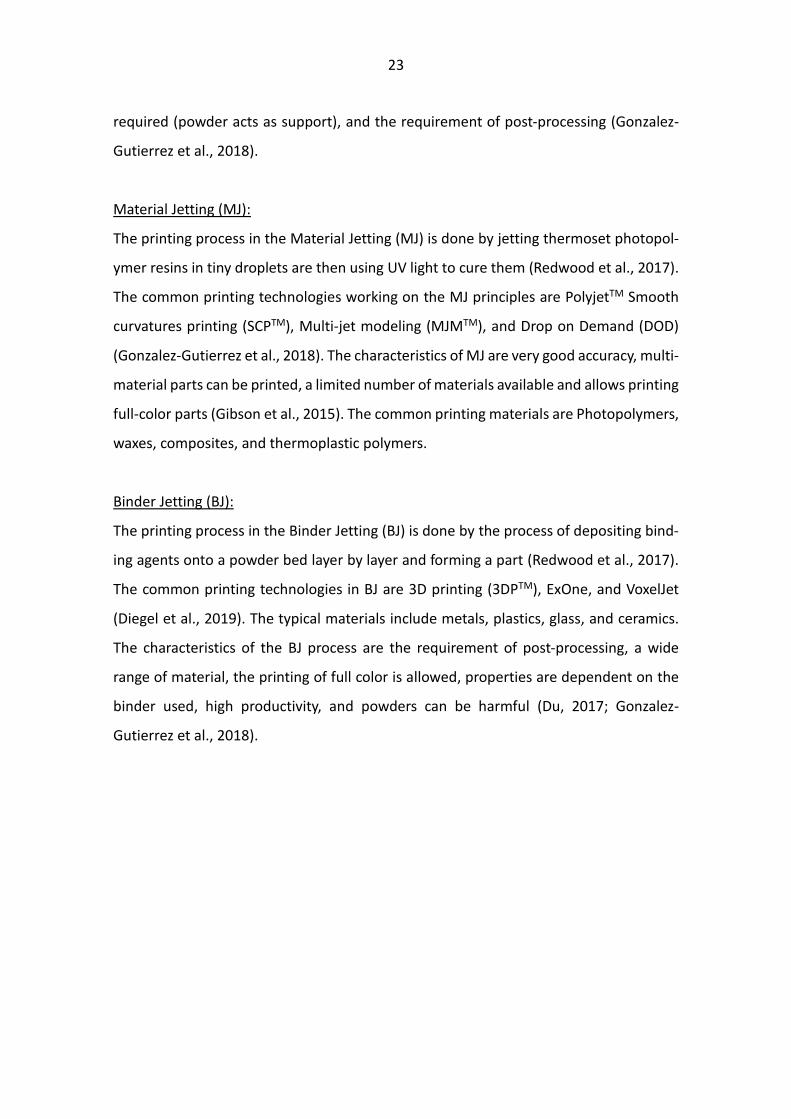
VAT Polymerization (VP):
The printing process in the VAT Polymerization (VP) is by curing polymer resin using a
light source which is typically Laser (Redwood et al., 2017). The most common technol-
ogies working on VP are Stereolithographic apparatus (SLATM), Digital light processing
(DLPTM), Scan, spin, and selectively photocure (3SPTM) and Continuous liquid interface
production (CLIPTM) (Diegel et al., 2019). The major strengths of this process are High
level of complexity and accuracy and smooth surface finish. The weaknesses of the pro-
cess are the material used can only be photo-resins, expensive equipment, and material
creeping after curing (Gonzalez-Gutierrez et al., 2018).
Powder Bed Fusion (Polymers and Metal) (PBF):
The printing process in the Powder Bed Fusion (Polymers) (PDF – F) is by inducing fusion
between powder particles at a specific location of the build area with a help of thermal
source and then solidifying the part (Redwood et al., 2017). The common technologies
in this process are Selective laser sintering (SLSTM), Direct metal laser sintering (DMLSTM),
Electron beam melting (EBMTM), Selective heat sintering (SHSTM), Multi-jet fusion
(MJFTM), HP Jet fusionTM and High-speed sintering (Diegel et al., 2019). Typical materials
are Plastics, Ceramics, and Metals. The key characteristics of this process are the com-
plexity of the operation, expensive equipment, materials can age/oxidize, no supports
23
required (powder acts as support), and the requirement of post-processing (Gonzalez-
Gutierrez et al., 2018).
Material Jetting (MJ):
The printing process in the Material Jetting (MJ) is done by jetting thermoset photopol-
ymer resins in tiny droplets are then using UV light to cure them (Redwood et al., 2017).
The common printing technologies working on the MJ principles are PolyjetTM Smooth
curvatures printing (SCPTM), Multi-jet modeling (MJMTM), and Drop on Demand (DOD)
(Gonzalez-Gutierrez et al., 2018). The characteristics of MJ are very good accuracy, multi-
material parts can be printed, a limited number of materials available and allows printing
full-color parts (Gibson et al., 2015). The common printing materials are Photopolymers,
waxes, composites, and thermoplastic polymers.
Binder Jetting (BJ):
The printing process in the Binder Jetting (BJ) is done by the process of depositing bind-
ing agents onto a powder bed layer by layer and forming a part (Redwood et al., 2017).
The common printing technologies in BJ are 3D printing (3DPTM), ExOne, and VoxelJet
(Diegel et al., 2019). The typical materials include metals, plastics, glass, and ceramics.
The characteristics of the BJ process are the requirement of post-processing, a wide
range of material, the printing of full color is allowed, properties are dependent on the
binder used, high productivity, and powders can be harmful (Du, 2017; Gonzalez-
Gutierrez et al., 2018).
24
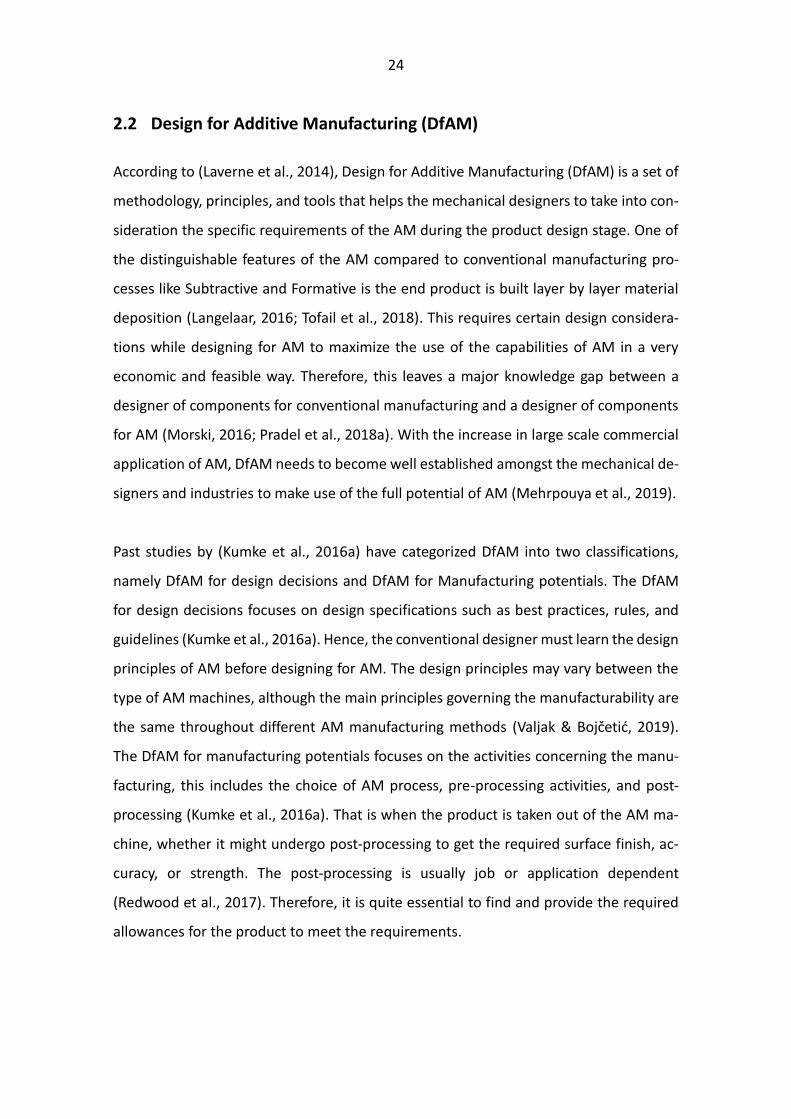
2.2 Design for Additive Manufacturing (DfAM)
According to (Laverne et al., 2014), Design for Additive Manufacturing (DfAM) is a set of
methodology, principles, and tools that helps the mechanical designers to take into con-
sideration the specific requirements of the AM during the product design stage. One of
the distinguishable features of the AM compared to conventional manufacturing pro-
cesses like Subtractive and Formative is the end product is built layer by layer material
deposition (Langelaar, 2016; Tofail et al., 2018). This requires certain design considera-
tions while designing for AM to maximize the use of the capabilities of AM in a very
economic and feasible way. Therefore, this leaves a major knowledge gap between a
designer of components for conventional manufacturing and a designer of components
for AM (Morski, 2016; Pradel et al., 2018a). With the increase in large scale commercial
application of AM, DfAM needs to become well established amongst the mechanical de-
signers and industries to make use of the full potential of AM (Mehrpouya et al., 2019).
Past studies by (Kumke et al., 2016a) have categorized DfAM into two classifications,
namely DfAM for design decisions and DfAM for Manufacturing potentials. The DfAM
for design decisions focuses on design specifications such as best practices, rules, and
guidelines (Kumke et al., 2016a). Hence, the conventional designer must learn the design
principles of AM before designing for AM. The design principles may vary between the
type of AM machines, although the main principles governing the manufacturability are
the same throughout different AM manufacturing methods (Valjak & Bojčetić, 2019).
The DfAM for manufacturing potentials focuses on the activities concerning the manu-
facturing, this includes the choice of AM process, pre-processing activities, and post-
processing (Kumke et al., 2016a). That is when the product is taken out of the AM ma-
chine, whether it might undergo post-processing to get the required surface finish, ac-
curacy, or strength. The post-processing is usually job or application dependent
(Redwood et al., 2017). Therefore, it is quite essential to find and provide the required
allowances for the product to meet the requirements.
25
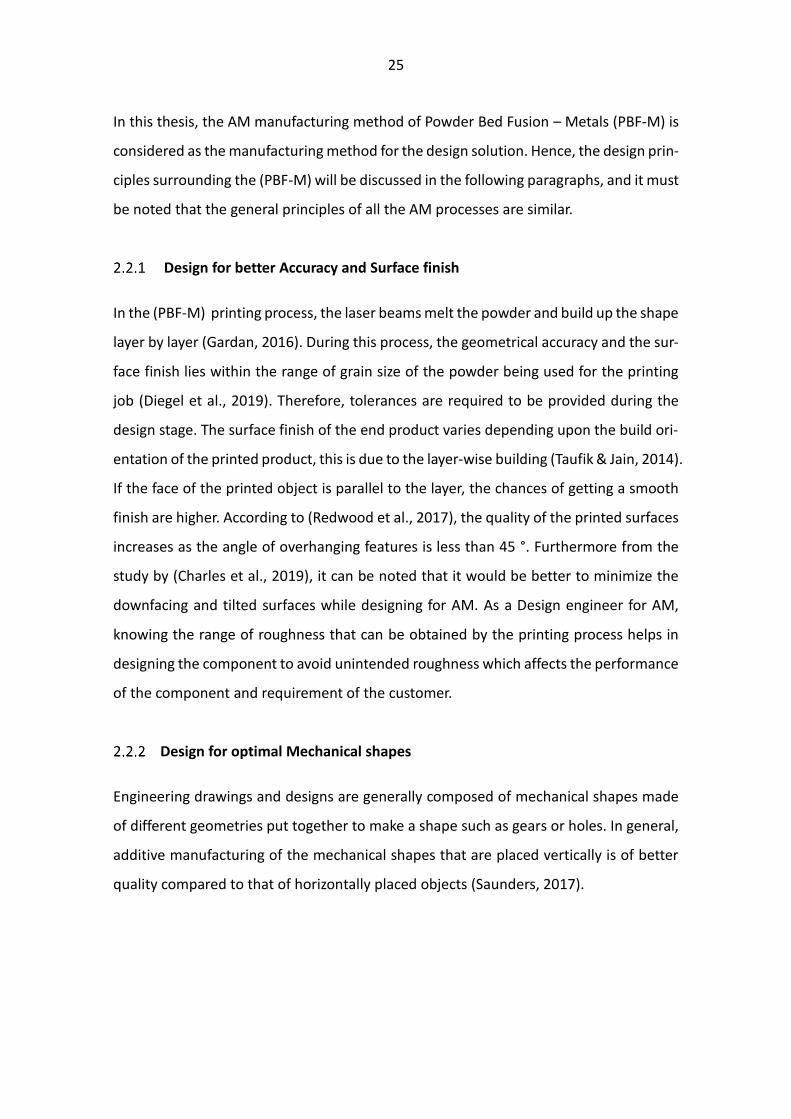
In this thesis, the AM manufacturing method of Powder Bed Fusion – Metals (PBF-M) is
considered as the manufacturing method for the design solution. Hence, the design prin-
ciples surrounding the (PBF-M) will be discussed in the following paragraphs, and it must
be noted that the general principles of all the AM processes are similar.
Design for better Accuracy and Surface finish
In the (PBF-M) printing process, the laser beams melt the powder and build up the shape
layer by layer (Gardan, 2016). During this process, the geometrical accuracy and the sur-
face finish lies within the range of grain size of the powder being used for the printing
job (Diegel et al., 2019). Therefore, tolerances are required to be provided during the
design stage. The surface finish of the end product varies depending upon the build ori-
entation of the printed product, this is due to the layer-wise building (Taufik & Jain, 2014).
If the face of the printed object is parallel to the layer, the chances of getting a smooth
finish are higher. According to (Redwood et al., 2017), the quality of the printed surfaces
increases as the angle of overhanging features is less than 45 °. Furthermore from the
study by (Charles et al., 2019), it can be noted that it would be better to minimize the
downfacing and tilted surfaces while designing for AM. As a Design engineer for AM,
knowing the range of roughness that can be obtained by the printing process helps in
designing the component to avoid unintended roughness which affects the performance
of the component and requirement of the customer.
Design for optimal Mechanical shapes
Engineering drawings and designs are generally composed of mechanical shapes made
of different geometries put together to make a shape such as gears or holes. In general,
additive manufacturing of the mechanical shapes that are placed vertically is of better
quality compared to that of horizontally placed objects (Saunders, 2017).

26
Self-supporting structures:
In additive manufacturing, the structures which do not require external supports during
the printing process are called Self-supporting structures. These structures are generally
below 45 degrees inclined when the print object is placed perpendicular to the printing
direction (Langelaar, 2016). The main consideration is to be given when designing lattice
structures or beams that are placed at an angle. One key design feature would be to
include fillets near the joints to improve the printing (Redwood et al., 2017). Self-support
structures also minimize the generation of support structures which are required to be
removed during the post-processing of the print (Jiang & Xu, 2018). Lesser the support
material, lesser is the time consumed for post-processing, and print quality would be
better. Support structures can also improve print quality, but the strategy must be so
that the support structures are only used in the required places. For (PBF-M) process
support structures are required for the following functions (Jiang & Xu, 2018),
• For thermal dissipations
• For printability
• For part balance
Print orientation/Avoid anisotropy
Anisotropy is nothing but the difference in mechanical properties in the vertical direction
from the base to top. This is due to layer-wise printing my method of AM, hence print
directions play a major role (Kok et al., 2018) in avoiding the anisotropy. Although, this
defect is commonly found in the material extrusion method compared to the metal pow-
der bed fusion method of printing. In the case of MS printing, this can be eliminated
using Hot Isostatic Pressing (HIP) (Wu & Lai, 2016). Therefore, the design engineer needs
to consider the importance of orientation while designing the component, so the mini-
mum number of features that are subjected to forces weaker sections due to anisotropy.
27
Holes and Round sections/Passages
The orientation chosen while printing the objects with cross-sections like holes and
round sections/passages play a vital role in determining the print quality as well as the
accuracy (Redwood et al., 2017). In the SLM printing process, due to the unavailability of
support structure inside a circular cross-section, there is a tendency that the topmost
part will have a sagging structure (Redwood et al., 2017). To avoid this kind of deformity,
a tear-shaped cross-section should be preferred instead of a circular cross-section
(Schmelzle et al., 2015).
Design for minimum post-processing
In additive manufacturing, the major share of the total cost required for manufacturing
a component is allocated to post-processing. The post-processing may be heat treatment
for decreasing thermal stress (or thermal load or anisotropy) or subtractive machining
like milling or surface finishing (Kumbhar & Mulay, 2018). The design strategies, as well
as considerations taken in the initial stages of design, can help in reducing the cost in-
curred in post-processing. The overall design considerations or thought process that can
be implemented during the design process are as follows (Diegel et al., 2019),
✓ Consider the right print orientation
✓ Consider replacing temporary supports with permanent walls
✓ Consider changing angles of features requiring support
✓ Consolidate several parts into the single part without compromising the func-
tions.
Optimize the part using topology optimization
One of the key advantages of additive manufacturing is it allows manufacturing compo-
nents with complex geometries (Bikas et al., 2016). Topology Optimization is a numerical
method that optimizes material layout in a given design space for a given boundary con-
dition without compromising the required performance targets (Bendsoe & Sigmund,
2013).
28
The general workflow for topology optimization is as follows,
1. Simplify the model
2. Define design space
3. Apply boundary conditions and materials
4. Set up the scenario
5. Perform topology optimization
6. Convert the results to a smooth body
In theory with the design criteria provided during the topology optimization, the result-
ant body can be manufactured using traditional manufacturing methods. But when the
design shapes become complex the manufacturing becomes expensive and infeasible.
Therefore, additive manufacturing is considered the most suitable method of manufac-
turing for topology optimized structures or bodies (Diegel et al., 2019).
Design for lightweight structures
A design engineer while working on structural design aims to achieve maximum struc-
tural strength with maximizing mass efficiency (Ramalingam, 2008). Therefore, light-
weight structures are always preferred while designing the CAD model of the design. For
example, while designing structures for aerospace application the engineering features
such as high strength to weight ratio, high resilience per weight ratio are given maximum
preference. As well as lesser material utilization attributes to more economical and en-
vironmental benefits (Seepersad, 2014). The AM design allows a designer to maximize
design for functionality which is driven by engineering specification instead of manufac-
turing ability limitations (Bäßler, 2018). Lattice structures are interconnected solid beam
networks that are solid wall networks with included voids (D. Rosen et al., 2006a). The
advantages of lattice structures are they can provide the same structural performance
compared to the solid body with the same boundary conditions and volume (D. Rosen
et al., 2006b).
29
2.3 Existing studies on DfAM implementation, approaches and tools used
There is a considerable amount of literature on DfAM, which focuses on tools, method-
ologies, and guidelines concerning DfAM. Although, some of the studies are not focused
on providing information about which stage of the design process has more significance
for the implementation of the DfAM. This study aims to consolidate the key points from
different studies and tabulate their approaches for DfAM. As proposed by (Kumke et al.,
2016a), in this study the existing literature is tabulated based on the approach, tools
used, and at what stage the DfAM principles were adopted.
The articles chosen for study were mainly related to additive manufacturing and ones
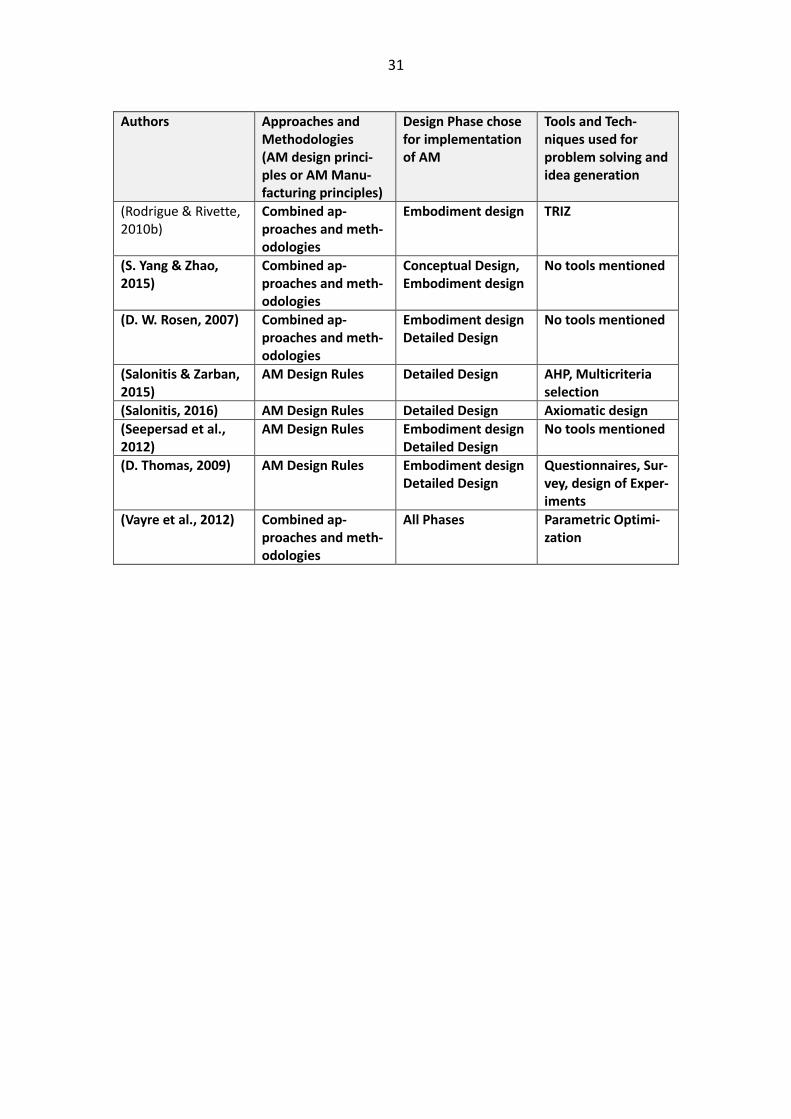
that emphasized on DfAM. Table 1 provides the data from the study of different litera-
ture on AM from different authors and their approaches. Interestingly, the majority of
authors emphasized the combined use of methodologies which includes implementing
both design and manufacturing rules of AM. However, this depended upon the phase of
implementation too, for instance, the majority of the conceptual design implementation
preferred AM Design. The combined approach of methodologies was prominently used
when the authors choose all the design phases (Boyard et al., 2014a; Klahn et al., 2015;
Ponche et al., 2014a; Rodrigue & Rivette, 2010a; D. W. Rosen, 2007; Vayre et al., 2012;
S. Yang & Zhao, 2015). Therefore, in the case of this study where the design is in the
conceptualization stage, the suitable approach is adopting design rules for AM. In the
case of studies by (Adam & Zimmer, 2014; Gerber & Barnard, 2008; Kamps et al., 2017a;
Laverne et al., 2015), AM design rules were given consideration and were implemented
at the conceptual design stage.

30
Table 1 Study on approaches of DfAM in literature
Authors Approaches and Methodologies (AM design princi-ples or AM Manu-facturing princi-ples)
Design Phase chose for implementation of AM
Tools and Techniques used for problem solving and idea generation
(Adam & Zimmer, 2014)
AM Design Rules Embodiment design Detailed Design
Design rules Catalogues
(Boyard et al., 2014b)
Combined ap-proaches and methodologies
Conceptual Design, De-tailed Design
3D graph of functions
(Doubrovski et al., 2012)
AM Design Rules Conceptual Design Questionnaire
(Gerber & Barnard, 2008)
AM Design Rules Embodiment design Detailed Design
No tools mentioned
(Hague et al., 2004)
AM Manufacturing principles
Conceptual Design, Embodiment design
No tools mentioned
(Kamps et al., 2017b)
AM Design Rules Conceptual Design TRIZ, Bio-mimicry data-base
(Klahn et al., 2015)
Combined ap-proaches and methodologies
All Phases Focus group-based data collection
(Kranz et al., 2015)
AM Design Rules Embodiment design Detailed Design
Design rules Catalogues
(Kumke et al., 2016a)
Combined ap-proaches and methodologies
All Phases Design feature database
(Laverne et al., 2015)
AM Design Rules Conceptual Design Brainstorming
(Maidin et al., 2012)
AM Design Rules Conceptual Design Design feature database
(Ponche et al., 2014b)
Combined ap-proaches and methodologies
Embodiment design Detailed Design
Design of Experiments
(Rias et al., 2016)
AM Design Rules Conceptual Design No tools mentioned
31
Authors Approaches and Methodologies (AM design princi-ples or AM Manu-facturing principles)
Design Phase chose for implementation of AM
Tools and Tech-niques used for problem solving and idea generation
(Rodrigue & Rivette, 2010b)
Combined ap-proaches and meth-odologies
Embodiment design TRIZ
(S. Yang & Zhao, 2015)
Combined ap-proaches and meth-odologies
Conceptual Design, Embodiment design
No tools mentioned
(D. W. Rosen, 2007) Combined ap-proaches and meth-odologies
Embodiment design Detailed Design
No tools mentioned
(Salonitis & Zarban, 2015)
AM Design Rules Detailed Design AHP, Multicriteria selection
(Salonitis, 2016) AM Design Rules Detailed Design Axiomatic design
(Seepersad et al., 2012)
AM Design Rules Embodiment design Detailed Design
No tools mentioned
(D. Thomas, 2009) AM Design Rules Embodiment design Detailed Design
Questionnaires, Sur-vey, design of Exper-iments
(Vayre et al., 2012) Combined ap-proaches and meth-odologies
All Phases Parametric Optimi-zation
32
2.4 Computer-Aided Design (CAD)
An article published by (Wilkes, 1990), describes the Computer-Aided Design (CAD) as
a software system that enables designing components by the visual representation of
components from various angles, references, and dimensions. CAD has developed as an
integral part of the mechanical design process since the introduction of Sketchpad – one
of the earliest CAD software in the 1960s (Sutherland, 1964). Computer-aided design
(CAD) is defined as the use of computer systems to assist in the creation, modification,
and analysis of a design (Groover & Zimmers, 1983). In practice designing in CAD soft-
ware has no restrictions, although manufacturing restriction has always been a limitation.
The exchange of data from CAD software to other applications such as AM software, CAE
software is done using CAD formats. Commonly used neutral CAD formats are as follows
(Xu, 2009),
o DXF (Drawing eXchange Format) (DXF, 2007)
o IGES (Initial Graphic Exchange Standard) (IGES, 2007)
o STEP (Standard for the Exchange of Product model data) (ISO 10303-1, 1994)
o 3DXML (3D Extensible Markup Language) (3DXML, 2007)
The CAD data may contain data from solid modeling, free-from surface/sheet modeling,
or generalized cellular modeling with functions such as Boolean operations, thickening,
fillet, or chamfering etcetera (Xu, 2009). Neutral formats are preferred while exchanging
data between CAD to CAD or CAD to CAE software. However, there are several problems
in transferring the model using these neutral formats (Dimitrov & Valchkova, 2011). Ac-
cording to (Xu, 2009), STEP format is a widely used neutral CAD format in the industries.
The most common CAD data exchange format for AM are as follows (Chua et al., 2017a;
Hällgren et al., 2016),
o STL (stereolithography).
o IGES (initial graphics exchange specification).
o STEP (standardized graphic exchange format).
o OBJ (object file).
o VRML (virtual reality modeling language).
33
CAD file formats such as STEP and IGES can be converted to STL (and other AM formats),
and during this process, there is a possibility of some quality issues. These quality prob-
lems/defects can be topological errors, zero volume parts, or missing parts. Hence, the
STL files may cause problems in downstream activities like Finite Element Analysis or NC
tool-path generation (Xu, 2009). The modeling approaches used to create the design in
CAD systems can be of Parametric modeling, non-parametric modeling, Implicit model-
ing, etcetera. Each modeling approach has its advantages and disadvantages. The follow-
ing paragraphs discuss these approaches from different studies.
Parametric, Non-Parametric, and Implicit modeling:
According to (Chang, 2014), “The CAD product model is parameterized by defining di-
mensions that govern the geometry of parts through geometric features and by estab-
lishing relations between dimensions within and across parts”. Therefore, a parametric
model allows changing the shapes based on the relations defined while creating the
model (Xu, 2009). The Parametric model generally contains information like dimensions,
relationships, and constraints between geometries like edges, vertices, or sketches
(Camba et al., 2016). This approach of modeling is very useful when developing the CAD
models for future modifications based on parameters applied. Most professional CAD
software uses a Parametric modeling approach for creating engineering models and
drawings (Chua et al., 2017b).
According to (Magnacad LLC, 2017), the non-parametric modeling methodologies do not
require a parent-child constraint relationship, rather models are created by Boolean op-
erations of a set of analytic primitives to obtain the desired form. Unlike Parametric mod-
eling, the non-parametric modeling of the geometric features is not governed by rela-
tionships or dimensions (Ma, 2005). These models are generally modeled like sculpturing
and are usually dependent upon the designer’s mind and approach. The modeling tools
use a combination of primitive shapes and surface tools or polynurbs to generate shapes
(Ranta et al., 1993).
34
Implicit modeling is where the modeling is done by generating surfaces using equations
and distance functions (Payne & Toga, 1992). Unlike parametric modeling software
which allows exporting Boundary representation (B-Rep) models, implicit modeling soft-
ware only allows visual representation file formats generally STL formats or voxel data
formats. With AM becoming more affordable and easier to use, complex models like
Schwarz minimal models/Gyroids (Yoo, 2014) which are generated using implicit model-
ing can be designed and manufactured.
Considering the problem statement of this thesis, the models designed will be analyzed
for its heat transfer performance and therefore the importance of parameters is very
essential to compare and validate the suitable design for the application. Furthermore,
to perform faster simulation and for better performance of the computational software,
the Boundary representation (B-rep) version of the model is much suitable (Hamri et al.,
2010). This is partly because the visual representation files are generally a representation
of the surfaces using triangles, more the triangular faces, better are the representations
(Dong et al., 2015). Therefore, it is hard to set up boundary conditions on these triangu-
lar faces.
35
Lattice Structures
Additive manufacturing allows tool-less manufacturing of complex geometries and this
is limited to self-supporting structures. Even though complex geometric freedom is de-
sired, in practice they are not possible in terms of complex overhanging geometries
(Hussein et al., 2013). Hence, understanding the lattice structures and their geometries
are important. This section of the literature review will be discussing the lattice struc-
tures and the theory behind it. Lattice structures are generally of three types, namely
strut-based lattice, triply periodic minimal surfaces, and shell lattice structure
(Maconachie et al., 2019a). According to (Nagesha et al., 2020), the lattice structures are
found to have characteristics of lower relative density, lightweight, better strength, and
elasticity compared to other solid structures.
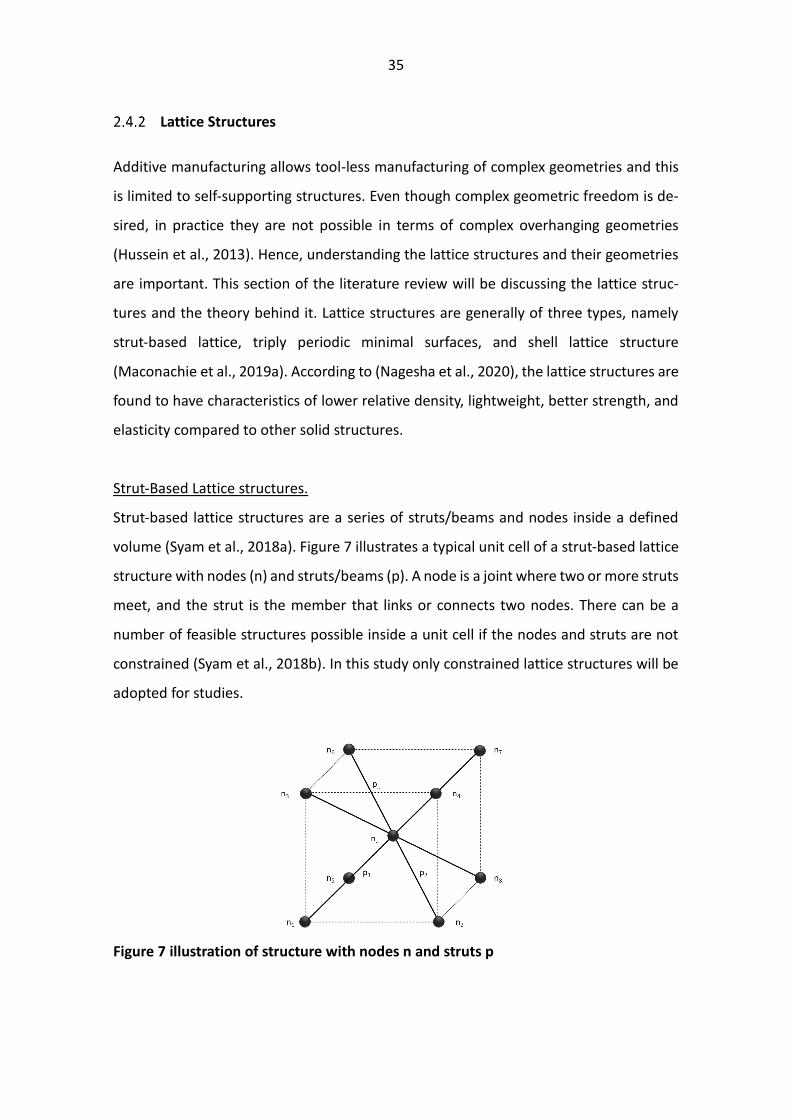
Strut-Based Lattice structures.
Strut-based lattice structures are a series of struts/beams and nodes inside a defined
volume (Syam et al., 2018a). Figure 7 illustrates a typical unit cell of a strut-based lattice
structure with nodes (n) and struts/beams (p). A node is a joint where two or more struts
meet, and the strut is the member that links or connects two nodes. There can be a
number of feasible structures possible inside a unit cell if the nodes and struts are not
constrained (Syam et al., 2018b). In this study only constrained lattice structures will be
adopted for studies.
Figure 7 illustration of structure with nodes n and struts p
36
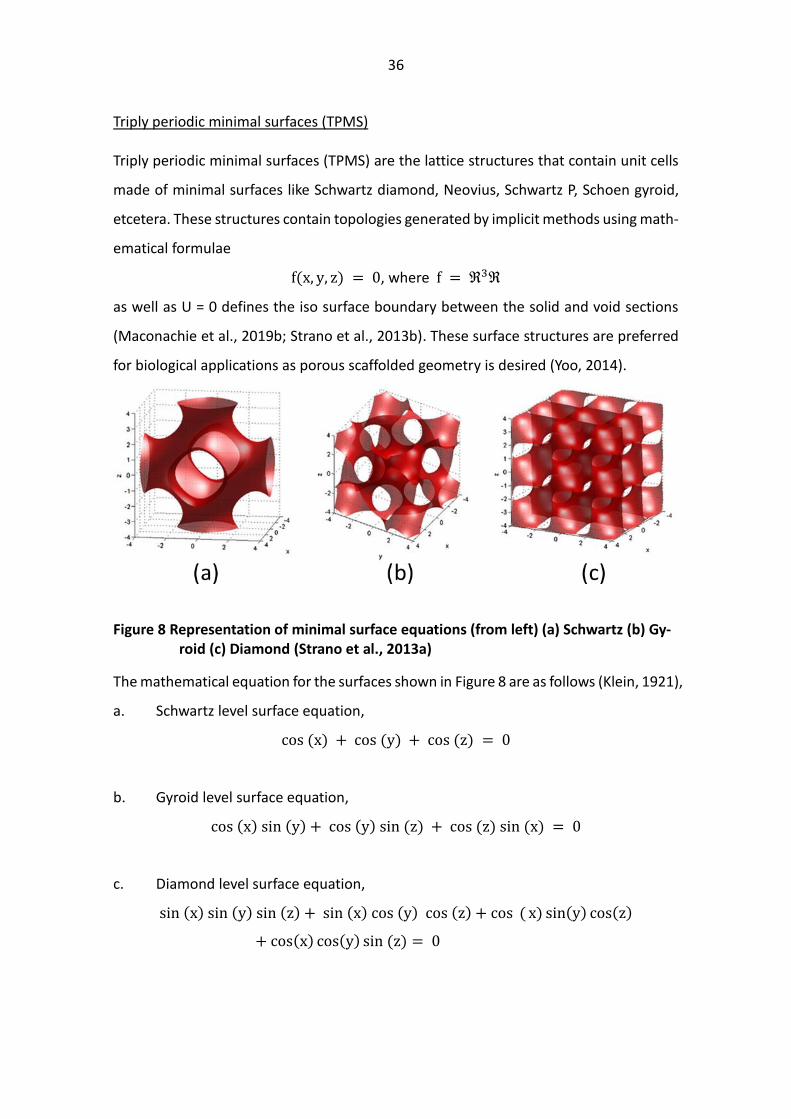
Triply periodic minimal surfaces (TPMS) Triply periodic minimal surfaces (TPMS) are the lattice structures that contain unit cells
made of minimal surfaces like Schwartz diamond, Neovius, Schwartz P, Schoen gyroid,
etcetera. These structures contain topologies generated by implicit methods using math-
ematical formulae
f(x, y, z) = 0, where f = ℜ3ℜ
as well as U = 0 defines the iso surface boundary between the solid and void sections
(Maconachie et al., 2019b; Strano et al., 2013b). These surface structures are preferred
for biological applications as porous scaffolded geometry is desired (Yoo, 2014).
Figure 8 Representation of minimal surface equations (from left) (a) Schwartz (b) Gy-roid (c) Diamond (Strano et al., 2013a)
The mathematical equation for the surfaces shown in Figure 8 are as follows (Klein, 1921),
a. Schwartz level surface equation,
cos (x) + cos (y) + cos (z) = 0
b. Gyroid level surface equation,
cos (x) sin (y) + cos (y) sin (z) + cos (z) sin (x) = 0
c. Diamond level surface equation,
sin (x) sin (y) sin (z) + sin (x) cos (y) cos (z) + cos ( x) sin(y) cos(z)
+ cos(x) cos(y) sin (z) = 0
37
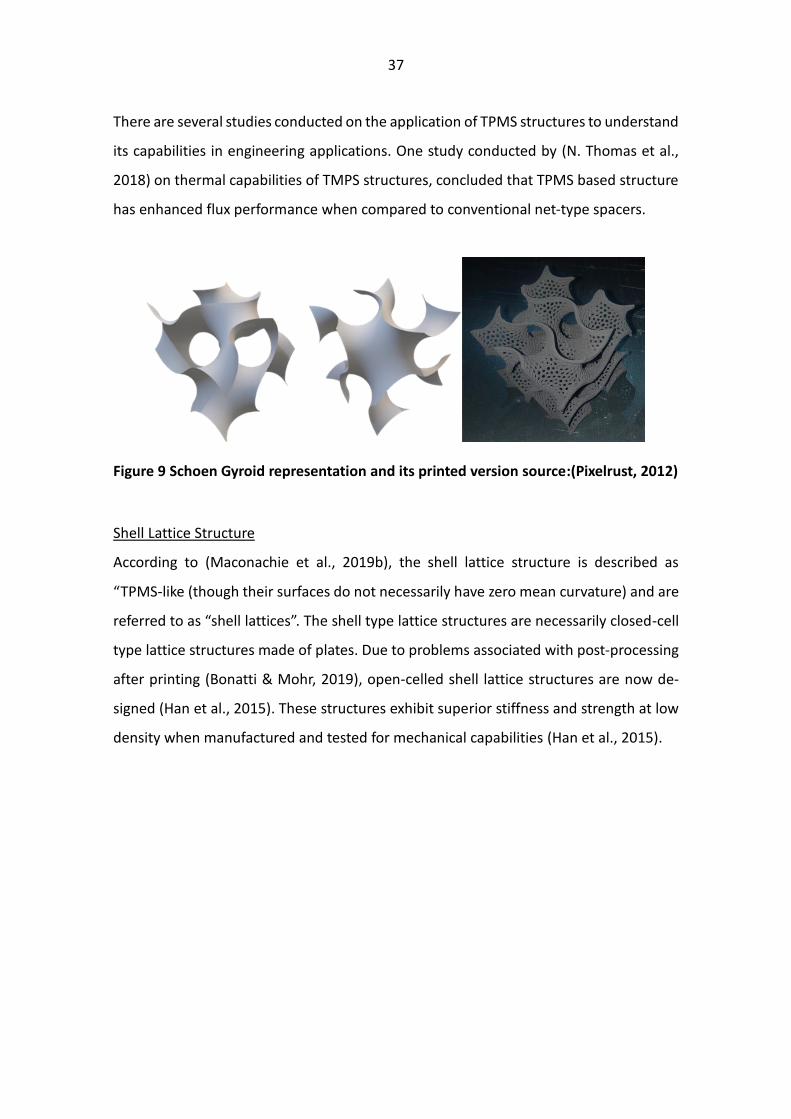
There are several studies conducted on the application of TPMS structures to understand
its capabilities in engineering applications. One study conducted by (N. Thomas et al.,
2018) on thermal capabilities of TMPS structures, concluded that TPMS based structure
has enhanced flux performance when compared to conventional net-type spacers.
Figure 9 Schoen Gyroid representation and its printed version source:(Pixelrust, 2012)
Shell Lattice Structure
According to (Maconachie et al., 2019b), the shell lattice structure is described as
“TPMS-like (though their surfaces do not necessarily have zero mean curvature) and are
referred to as “shell lattices”. The shell type lattice structures are necessarily closed-cell
type lattice structures made of plates. Due to problems associated with post-processing
after printing (Bonatti & Mohr, 2019), open-celled shell lattice structures are now de-
signed (Han et al., 2015). These structures exhibit superior stiffness and strength at low
density when manufactured and tested for mechanical capabilities (Han et al., 2015).
38
2.5 Computer-Aided Engineering
Computer-Aided Engineering (CAE) is the use of computer software to simulate the per-
formance of designs and models under specified boundary conditions to improve prod-
uct design (Bahman & Iannuzzo, 2018). To achieve the design goals, the design is re-
quired to undergo analysis using CAE i.e., computer simulation. The goal of the design is
to achieve optimal heat management. According to (Nowak & Wróblewski, 2011), the
performance of a cooling system is the ratio of the mass-flow of the cooling air and the
air inlet at the compressor. As mentioned in the problem statement the designed model
will be air-cooled, therefore the heat transfer takes place first from the body and then
the cooling surfaces and then from the cooling surfaces to the cooling fluid. The heat
transfer that takes place through a combination of heat transfer between the solids and
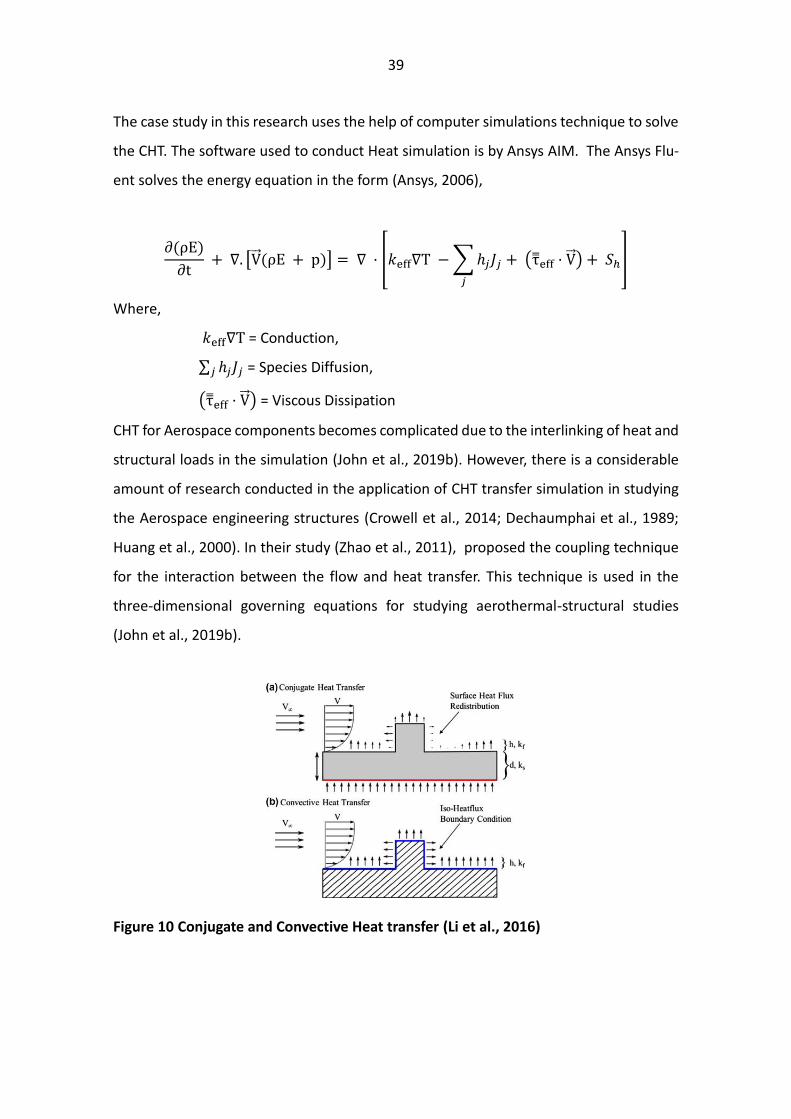
the heat transfer between the fluids is called Conjugate Heat transfer (Nicolas Huc, 2014).
Figure 10 shows the difference between conjugate heat transfer and convective heat
transfer. The governing equations considered for conjugate heat transfer problems are,
For the unsteady and steady-state in fluid flows (John et al., 2019a):
▪ Law of conservation of mass (The continuity equation)
▪ Law of conservation of momentum (The Navier– Stokes equations, 2D or 3D de-
pending on the nature of flow)
▪ Law of conservation of energy (The complete energy equation corresponding to
the dimensionality of the flow)
For Unsteady and Steady conduction in the solid domain (John et al., 2019b):
• Two dimensional or three-dimensional unsteady energy equation
• Two- or three-dimensional steady Laplace or Poisson equations
• One dimensional steady or unsteady conduction equation upon considering pre-
vented or negligible heat conduction in other dimensions as in case of heat con-
duction through thin plates
39
The case study in this research uses the help of computer simulations technique to solve
the CHT. The software used to conduct Heat simulation is by Ansys AIM. The Ansys Flu-
ent solves the energy equation in the form (Ansys, 2006),
∂(ρE)
∂t + ∇. [V⃗⃗ (ρE + p)] = ∇ · [𝑘eff∇T − ∑ℎ𝑗𝐽𝑗
𝑗
+ (τ̿eff · V⃗⃗ ) + 𝑆ℎ]
Where,
𝑘eff∇T = Conduction,
∑ ℎ𝑗𝐽𝑗𝑗 = Species Diffusion,
(τ̿eff · V⃗⃗ ) = Viscous Dissipation
CHT for Aerospace components becomes complicated due to the interlinking of heat and
structural loads in the simulation (John et al., 2019b). However, there is a considerable
amount of research conducted in the application of CHT transfer simulation in studying
the Aerospace engineering structures (Crowell et al., 2014; Dechaumphai et al., 1989;
Huang et al., 2000). In their study (Zhao et al., 2011), proposed the coupling technique
for the interaction between the flow and heat transfer. This technique is used in the
three-dimensional governing equations for studying aerothermal-structural studies
(John et al., 2019b).
Figure 10 Conjugate and Convective Heat transfer (Li et al., 2016)
40
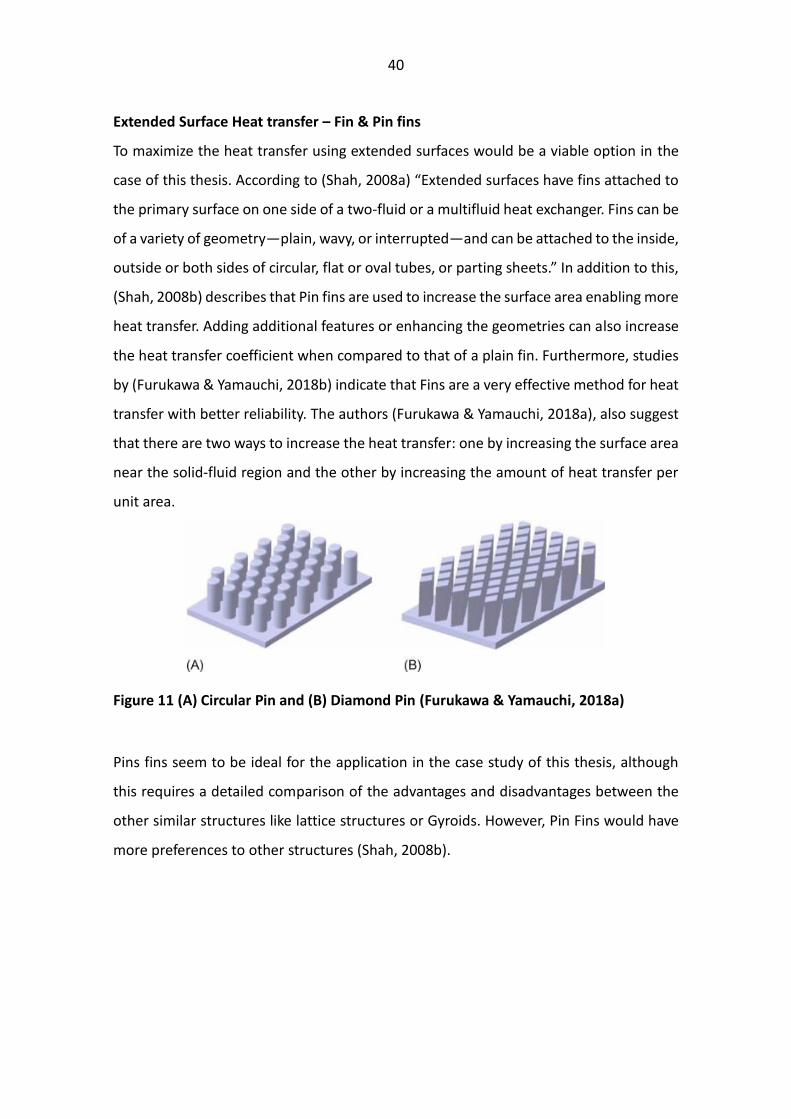
Extended Surface Heat transfer – Fin & Pin fins
To maximize the heat transfer using extended surfaces would be a viable option in the
case of this thesis. According to (Shah, 2008a) “Extended surfaces have fins attached to
the primary surface on one side of a two-fluid or a multifluid heat exchanger. Fins can be
of a variety of geometry—plain, wavy, or interrupted—and can be attached to the inside,
outside or both sides of circular, flat or oval tubes, or parting sheets.” In addition to this,
(Shah, 2008b) describes that Pin fins are used to increase the surface area enabling more
heat transfer. Adding additional features or enhancing the geometries can also increase
the heat transfer coefficient when compared to that of a plain fin. Furthermore, studies
by (Furukawa & Yamauchi, 2018b) indicate that Fins are a very effective method for heat
transfer with better reliability. The authors (Furukawa & Yamauchi, 2018a), also suggest
that there are two ways to increase the heat transfer: one by increasing the surface area
near the solid-fluid region and the other by increasing the amount of heat transfer per
unit area.
Figure 11 (A) Circular Pin and (B) Diamond Pin (Furukawa & Yamauchi, 2018a)
Pins fins seem to be ideal for the application in the case study of this thesis, although
this requires a detailed comparison of the advantages and disadvantages between the
other similar structures like lattice structures or Gyroids. However, Pin Fins would have
more preferences to other structures (Shah, 2008b).
41
2.6 Lean Six Sigma
The journey of modern Six-Sigma methodology begins with Motorola from 1987, follow-
ing the success of General Electric and Allied Signal deployed to improve their financial
performance (Mader, 2008). The concept of lean was introduced first by Toyota under
their Toyota Production System, however, it is believed that they learned the concept
from Ford’s manufacturing system (Dekier, 2012). With over 3 decades of experimenta-
tion of implementing Lean Six-Sigma (LSS) by different companies in various domains
inside the companies, the LSS has evolved to become a “large collection of tools that the
organization can bring to bear as appropriate on identified issues to achieve continual
improvement across the entire organization” (Munro, 2015). Adaptation of the LSS tools
in the continual improvement process depends upon the purpose and objective of the
LSS program. The core idea of Six-Sigma is to make use of the data from different param-
eters within the identified department and use statistical tools to analyze and make de-
cisions in the improvement process. Therefore, the Six-Sigma can be called a data-driven
decision making process rather than opinion (or intuition) based decision making pro-
cess.
Lean Six-Sigma (LSS) is a combined form of methodologies of both Lean and Six-Sigma,
it is important to understand the difference between these to understand the approach
used in this thesis. Lean emphasizes more on speed and waste, whereas Six sigma em-
phasizes more on variation, defects, and process evaluation (Antony, 2011). Table 2
shows the main differences that can be found between the two methodologies. The
problems vary from company to company; therefore, the best way to approach problem-
solving is to use the right tools and methods of both Lean and Six-Sigma. This thesis aims
at using the right tool at the right stage of problem-solving to make the design workflow
to be better, efficient and faster for the engineers in the design process.
42
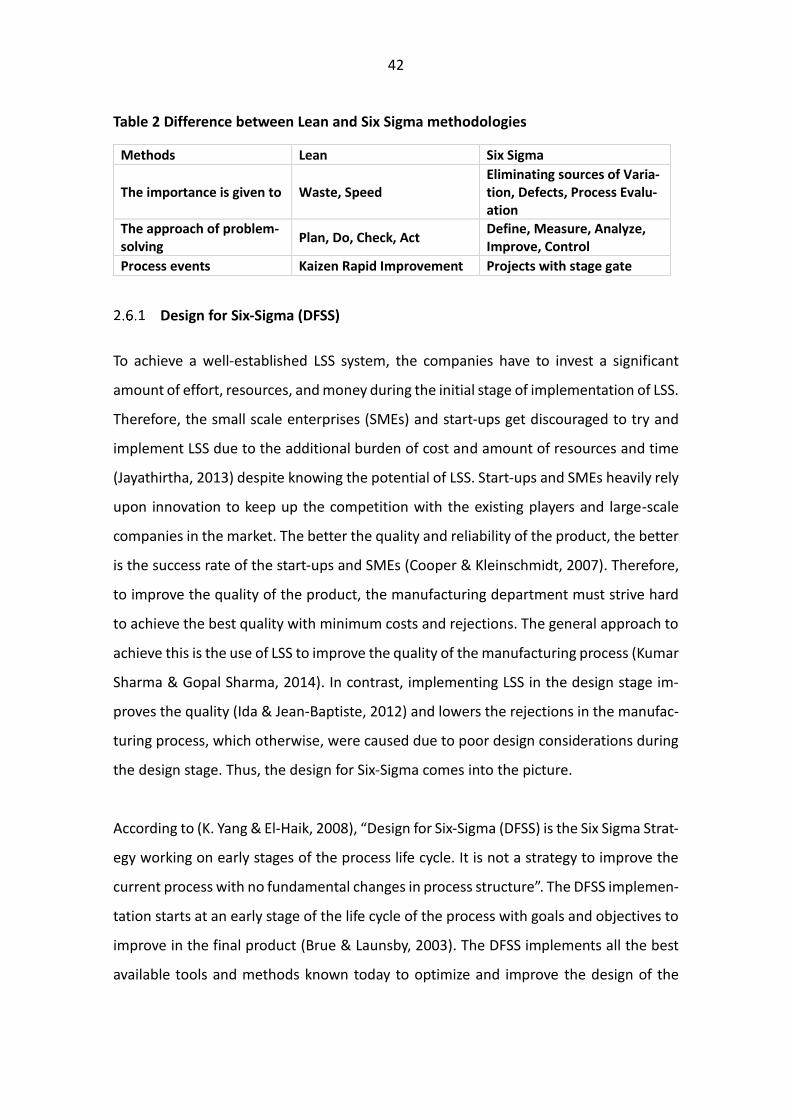
Table 2 Difference between Lean and Six Sigma methodologies
Methods Lean Six Sigma
The importance is given to Waste, Speed Eliminating sources of Varia-tion, Defects, Process Evalu-ation
The approach of problem-solving
Plan, Do, Check, Act Define, Measure, Analyze, Improve, Control
Process events Kaizen Rapid Improvement Projects with stage gate
Design for Six-Sigma (DFSS)
To achieve a well-established LSS system, the companies have to invest a significant
amount of effort, resources, and money during the initial stage of implementation of LSS.
Therefore, the small scale enterprises (SMEs) and start-ups get discouraged to try and
implement LSS due to the additional burden of cost and amount of resources and time
(Jayathirtha, 2013) despite knowing the potential of LSS. Start-ups and SMEs heavily rely
upon innovation to keep up the competition with the existing players and large-scale
companies in the market. The better the quality and reliability of the product, the better
is the success rate of the start-ups and SMEs (Cooper & Kleinschmidt, 2007). Therefore,
to improve the quality of the product, the manufacturing department must strive hard
to achieve the best quality with minimum costs and rejections. The general approach to
achieve this is the use of LSS to improve the quality of the manufacturing process (Kumar
Sharma & Gopal Sharma, 2014). In contrast, implementing LSS in the design stage im-
proves the quality (Ida & Jean-Baptiste, 2012) and lowers the rejections in the manufac-
turing process, which otherwise, were caused due to poor design considerations during
the design stage. Thus, the design for Six-Sigma comes into the picture.
According to (K. Yang & El-Haik, 2008), “Design for Six-Sigma (DFSS) is the Six Sigma Strat-
egy working on early stages of the process life cycle. It is not a strategy to improve the
current process with no fundamental changes in process structure”. The DFSS implemen-
tation starts at an early stage of the life cycle of the process with goals and objectives to
improve in the final product (Brue & Launsby, 2003). The DFSS implements all the best
available tools and methods known today to optimize and improve the design of the
43
product to reach the best version of the product, by reducing the redundancies and un-
certainties during the design process (Munro, 2015). Introducing lean concepts into DFSS
will eliminate wastes in the design process. For example, when designing a machine el-
ement with high strength to weight ratio, performing topology optimization with all the
loading and manufacturing constraints before performing a load-bearing test will reduce
the number of iterations in the design process.
Design for Six-Sigma and Design for Additive Manufacturing (DfAM).
Additive Manufacturing (AM) has removed the majority of the design constraints which
were previously not possible to manufacture using traditional manufacturing methods
like Subtractive or Formative Manufacturing (Diegel et al., 2019). Hence, the design pro-
cess/workflow for the AM becomes different from the design for the traditional manu-
facturing process. For instance, the light-weighting of the body in the design for tradi-
tional manufacturing methods was by introducing through holes, collars in the edges,
and so on (Kamal & Rizza, 2019). On the other hand, the design for AM allows using shell
objects with infill of lattice structures or gyroid structures. Therefore, bringing down the
overall weight to a significant level compared to the same object designed for traditional
manufacturing, without reducing the structural integrity (Kamal & Rizza, 2019). The
DfAM involves numerous parameters concerning the design principles of AM and the
design requirement itself. The applications such as heat transfer, fluid flow require design
elements that are created specifically for the application considering their behaviors at
different regions of the design element (Furukawa & Yamauchi, 2018a). These structures,
typically the lattices which are not self-supporting may cause deformity or support struc-
tures during the printing process (Langelaar, 2016). In order to improve this, the designer
must consider a variable that denotes this problem. Henceforth, there will be several
different variables just for structural design. Likewise, considering the Multiphysics anal-
ysis of the structure, each type of structure will exhibit particular results and the result
objectives will be considered as variables that are affected by the variables of the struc-
tural design (John et al., 2019b). Figure 12 shows the heatsink developed with manual
design manipulation and computer-based topology optimized design:

44
Figure 12 (a) Radial plate-fin heat sink (b) 3-D topology - optimized heat sink (Joo et al., 2018)
Hence, a relationship between these variables can be developed and visual tools like
graphs and pie charts can be used to represent them. Therefore, to reduce the redun-
dancies in the calculations/analysis as shown in Figure 13 and improve efficiency the
Design for Six Sigma (DFSS) is introduced.
Figure 13 Design Process (a) Without DFSS (b) With DFSS
45
A study by (Pradel et al., 2018b) concluded that the designers still see AM as a very good
rapid-prototyping tool. This is because of their limited build volume and the barriers such
as high cost which prevents it from used for mass production. Therefore, designers do
not see AM as the manufacturing method like they see the conventional manufacturing
methods. Hence, the need for learning AM specific designs rules are less understood by
them. In addition to this, a study by (Bikas et al., 2019), summed up as “the existing
design for manufacturing rules (DFM) for conventional processes contribute to the de-
signer’s psychological inertia, which drives the part design away from the AM advanta-
geous nature.” Therefore, before proceeding through the DFSS methodology the de-
signer must be well aware of the design principles of Additive Manufacturing (AM).
Design for Six-Sigma (DFSS) Phase:
The design for Six-Sigma can be achieved by using any one of the many established meth-
odologies such as DMADV (Design-Measure-Analyze-Design-Validate), IDDOV (Identify-
Define-Design- Optimize- Validate), IDOV (Identify-Design-Optimize-Validate), DMADOV
(Design-Measure-Analyze-Design-Optimize-Verify) (Asad et al., 2006).
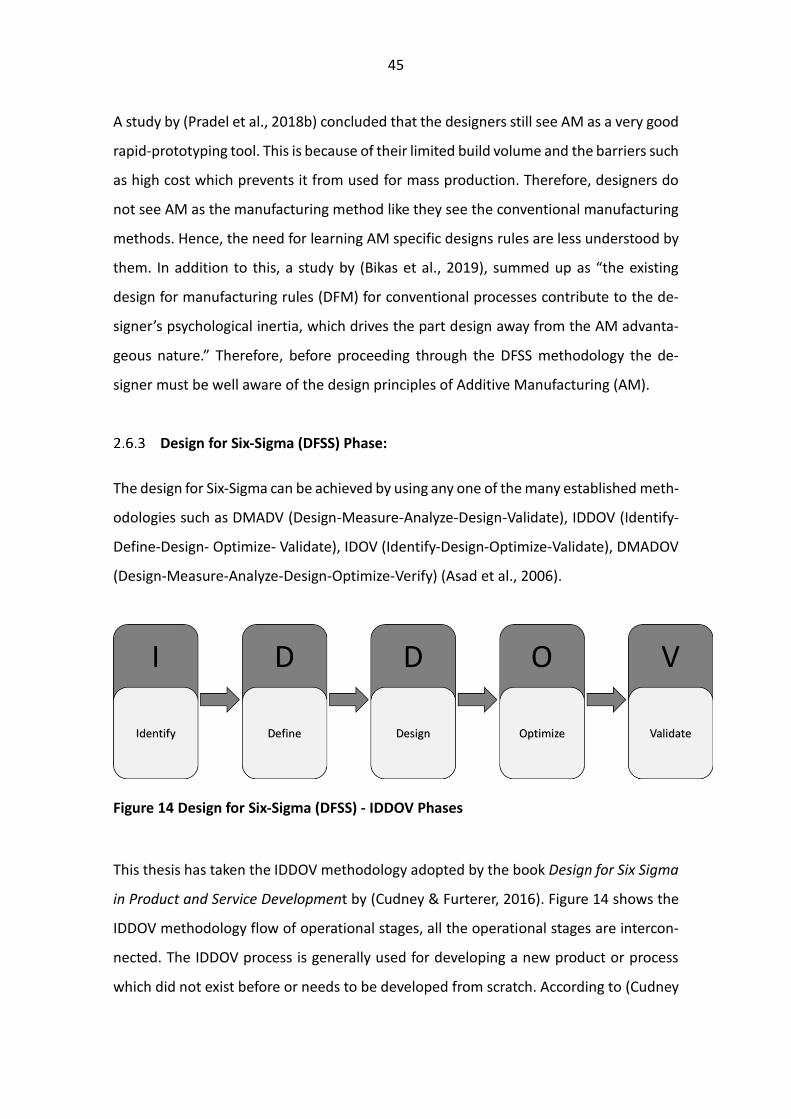
Figure 14 Design for Six-Sigma (DFSS) - IDDOV Phases
This thesis has taken the IDDOV methodology adopted by the book Design for Six Sigma
in Product and Service Development by (Cudney & Furterer, 2016). Figure 14 shows the
IDDOV methodology flow of operational stages, all the operational stages are intercon-
nected. The IDDOV process is generally used for developing a new product or process
which did not exist before or needs to be developed from scratch. According to (Cudney
46
& Furterer, 2016), “The benefits of applying Design for Six Sigma and IDDOV compared
to Six Sigma and DMAIC are that you are not constrained by an existing process, and you
do not need to collect large amounts of the voice of process (VOP) data, or spend time
baselining a non-existent or seriously broken process.”
IDDOV methodology roadmap will be further discussed based on the steps, tools, and
techniques relevant to the thesis, i.e., the steps, tools, and techniques required for de-
veloping an engineering design for the specific application. As a project manager, one
can choose the right tool and take its complete advantage depending upon its outcome,
because there is no standard approach for DFSS (Mader, 2003). Therefore, out of all the
tools available only selected tools and techniques shall be discussed in the following par-
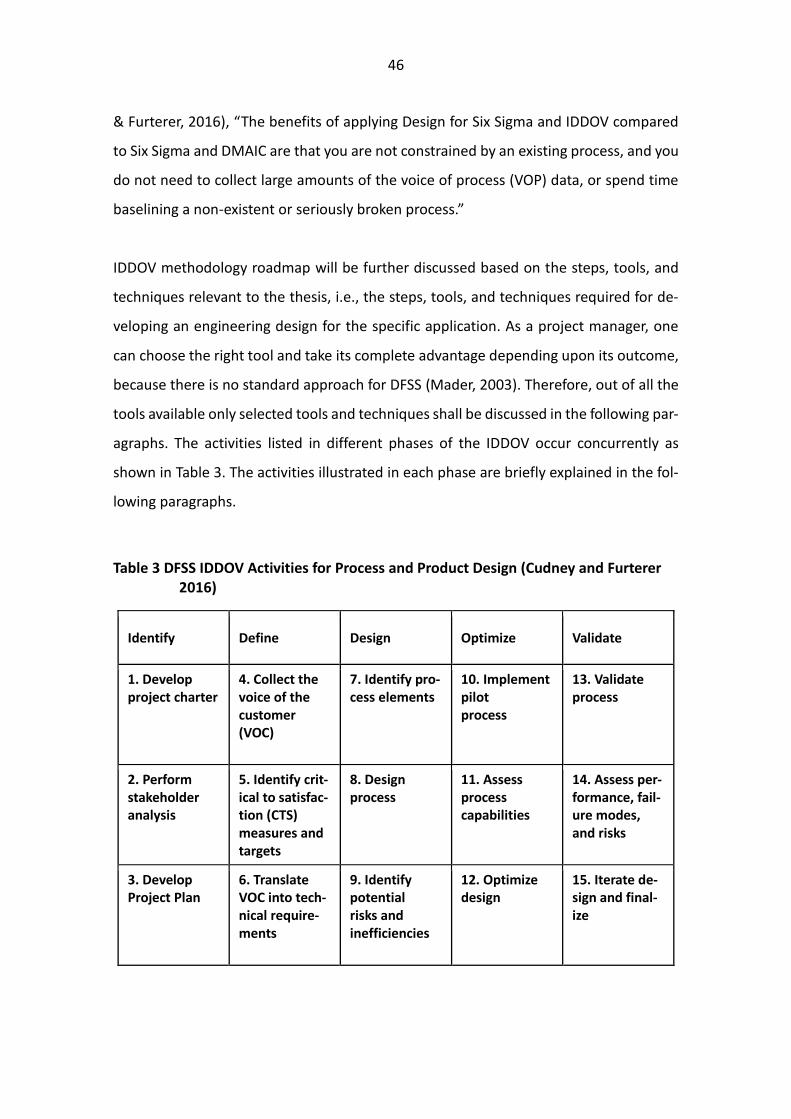
agraphs. The activities listed in different phases of the IDDOV occur concurrently as
shown in Table 3. The activities illustrated in each phase are briefly explained in the fol-
lowing paragraphs.
Table 3 DFSS IDDOV Activities for Process and Product Design (Cudney and Furterer 2016)
Identify Define Design Optimize Validate
1. Develop project charter
4. Collect the voice of the customer (VOC)
7. Identify pro-cess elements
10. Implement pilot process
13. Validate process
2. Perform stakeholder analysis
5. Identify crit-ical to satisfac-tion (CTS) measures and targets
8. Design process
11. Assess process capabilities
14. Assess per-formance, fail-ure modes, and risks
3. Develop Project Plan
6. Translate VOC into tech-nical require-ments
9. Identify potential risks and inefficiencies
12. Optimize design
15. Iterate de-sign and final-ize
47
2.6.3.1 Identify Phase
The goal of the Identify phase is to identify the design challenge in the project, scope of
the design project through the development of a project charter, and identify the entities
or stakeholders that the project has impacted (Jenab et al., 2018). The emphasis in this
phase is to define the requirements of the design project.
The major activities in this phase are as follows (Cudney & Furterer, 2016):
1. Develop project charter
2. Perform stakeholder analysis
3. Develop Project Plan
The Projector charter is usually a formal short document consisting of a description of
the project including the objectives, procedures, or methods used to execute and the
stakeholders involved. In the stakeholder analysis, the impact of the project on the cus-
tomers and stakeholders are evaluated (Munro, 2015). The quality of the design project
is set by understanding the requirements and expectations set by the consumers. The
customers need not be external always, the customers can be the internal stakeholders
too. In the case of this thesis, the customer is internal. Once the required information is
gathered, the project plan is developed (Cudney & Furterer, 2016). It includes the devel-
oping detailed work plan, work breakdown structure (WBS), and the plan with infor-
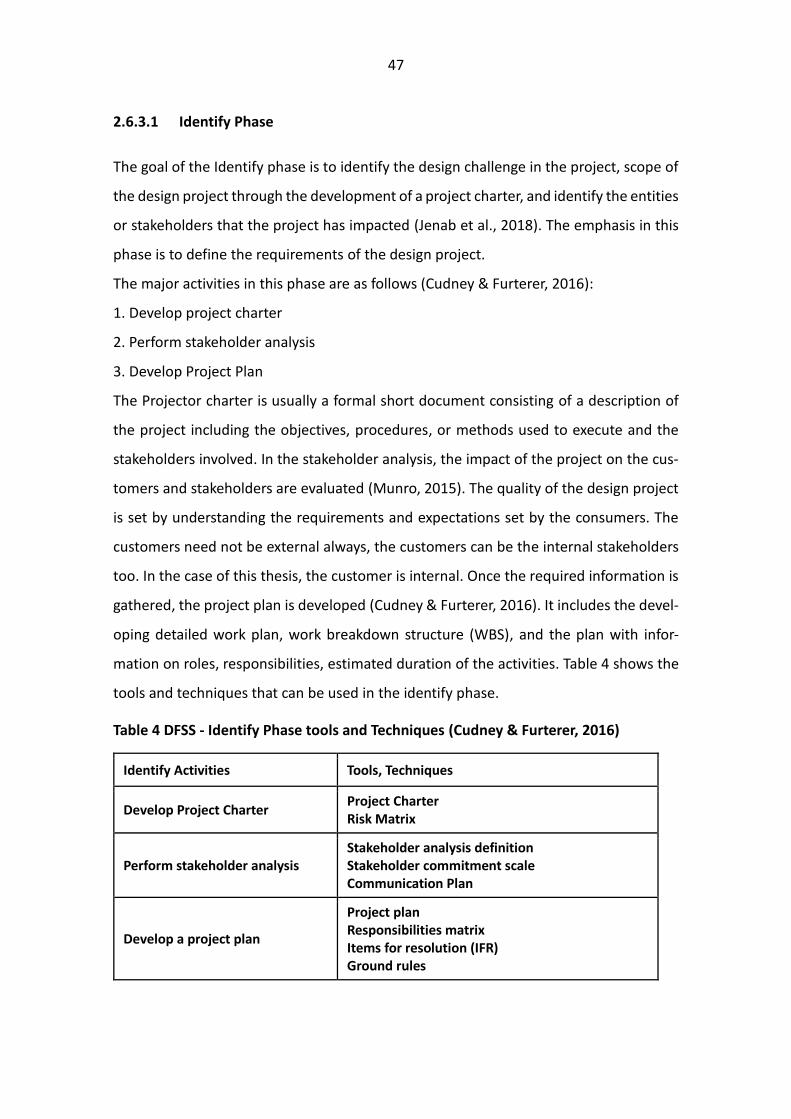
mation on roles, responsibilities, estimated duration of the activities. Table 4 shows the
tools and techniques that can be used in the identify phase.
Table 4 DFSS - Identify Phase tools and Techniques (Cudney & Furterer, 2016)
Identify Activities Tools, Techniques
Develop Project Charter Project Charter Risk Matrix
Perform stakeholder analysis Stakeholder analysis definition Stakeholder commitment scale Communication Plan
Develop a project plan
Project plan Responsibilities matrix Items for resolution (IFR) Ground rules
48
2.6.3.2 Define Phase
The defined phase aims at understanding the Voice of Customer (VOC) and then the cus-
tomer's requirements are defined in the Critical to Satisfaction (CTS) characteristic to
interpret them into the technical specifications of the product or process to be designed
(Cudney & Furterer, 2016).
The following are the activities involved in the define phase according to the methodol-
ogy followed by (Cudney & Furterer, 2016),
1. Collect the voice of the customer (VOC)
2. Identify CTS measures and targets
3. Translate VOC into technical requirements
The VOC is vital in the process of product development, which enables the designers to
reach the minds of the user or customer requirement and develop the technical ele-
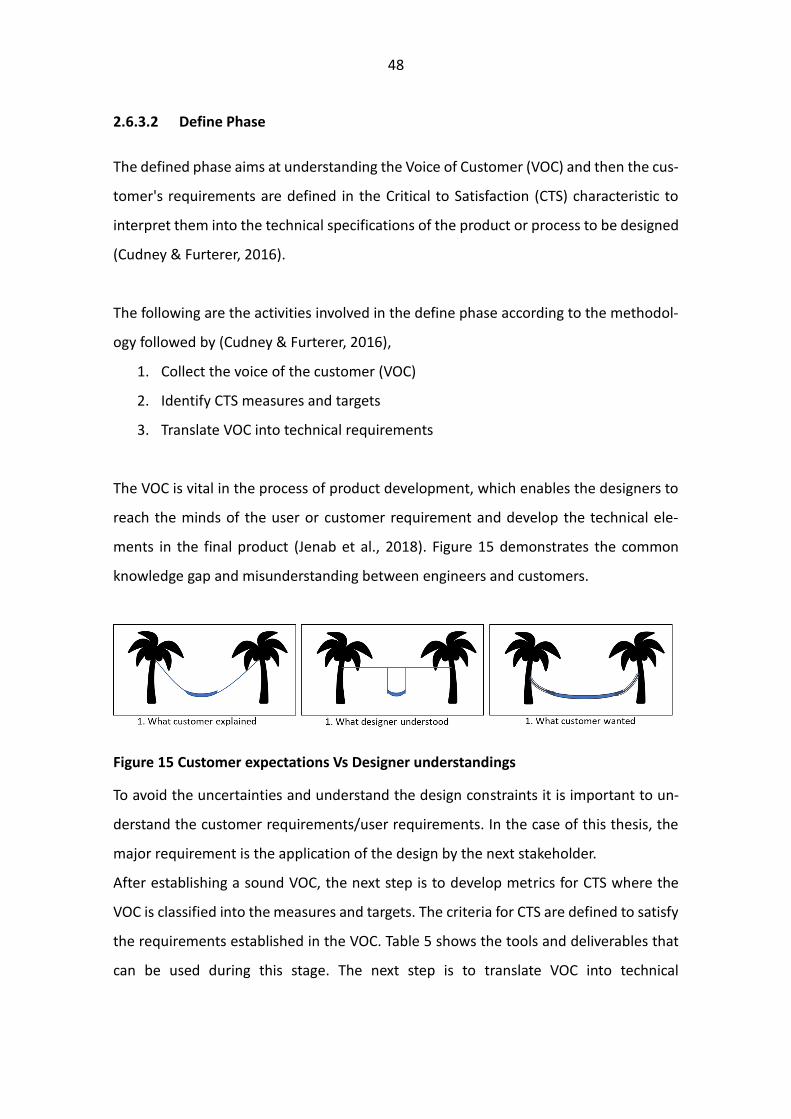
ments in the final product (Jenab et al., 2018). Figure 15 demonstrates the common
knowledge gap and misunderstanding between engineers and customers.
Figure 15 Customer expectations Vs Designer understandings
To avoid the uncertainties and understand the design constraints it is important to un-
derstand the customer requirements/user requirements. In the case of this thesis, the
major requirement is the application of the design by the next stakeholder.
After establishing a sound VOC, the next step is to develop metrics for CTS where the
VOC is classified into the measures and targets. The criteria for CTS are defined to satisfy
the requirements established in the VOC. Table 5 shows the tools and deliverables that
can be used during this stage. The next step is to translate VOC into technical
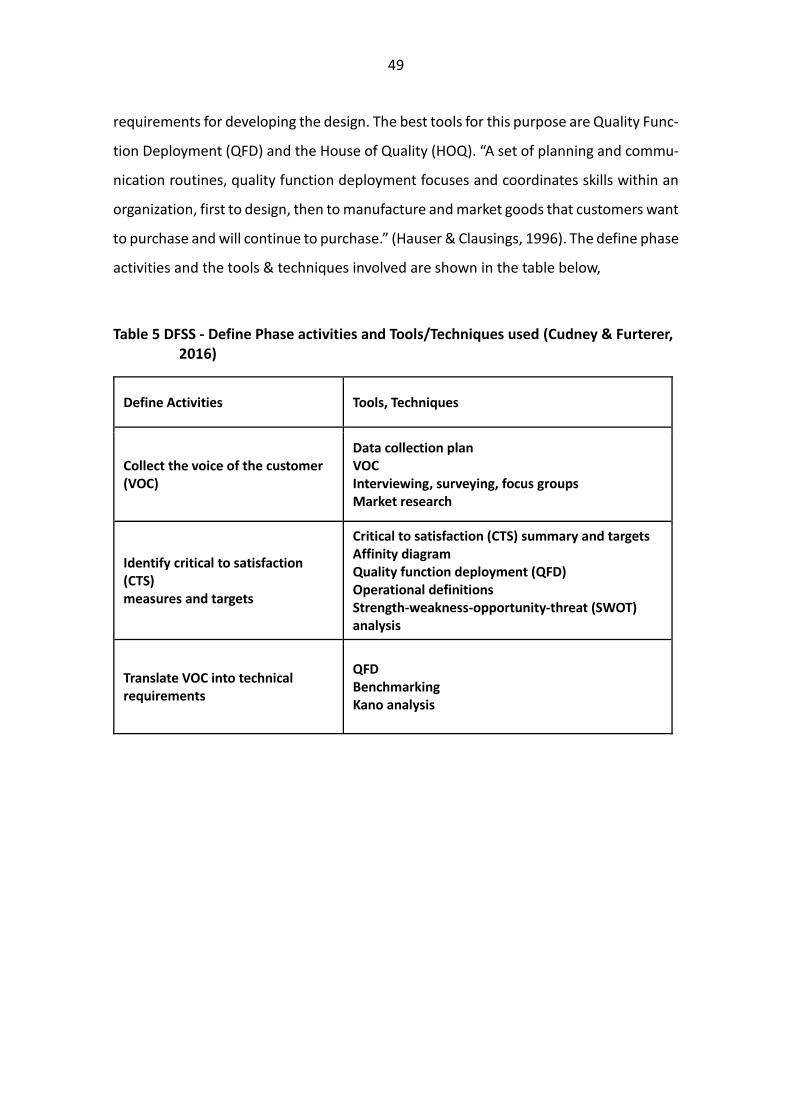
49
requirements for developing the design. The best tools for this purpose are Quality Func-
tion Deployment (QFD) and the House of Quality (HOQ). “A set of planning and commu-
nication routines, quality function deployment focuses and coordinates skills within an
organization, first to design, then to manufacture and market goods that customers want
to purchase and will continue to purchase.” (Hauser & Clausings, 1996). The define phase
activities and the tools & techniques involved are shown in the table below,
Table 5 DFSS - Define Phase activities and Tools/Techniques used (Cudney & Furterer, 2016)
Define Activities Tools, Techniques
Collect the voice of the customer (VOC)
Data collection plan VOC Interviewing, surveying, focus groups Market research
Identify critical to satisfaction (CTS) measures and targets
Critical to satisfaction (CTS) summary and targets Affinity diagram Quality function deployment (QFD) Operational definitions Strength-weakness-opportunity-threat (SWOT) analysis
Translate VOC into technical requirements
QFD Benchmarking Kano analysis

50
2.6.3.3 Design Phase
The objective of the Design phase is to (Brue & Launsby, 2003) “build a thorough base
of knowledge about the product or service and its processes.” The design engineers aim
to translate the customer requirements into (Brue & Launsby, 2003) “functional require-
ments and alternative concepts or solutions; through a selection process, the team eval-
uates the alternatives and reduces the list of solutions to one, the best-fit concept.” The
main activities in the design phase are as follows (Cudney & Furterer, 2016),
1. Identify process elements.
2. Design process.
3. Identify potential risks and inefficiencies.
Considering the context of this thesis, which aims at developing a design solution, the
activity ‘Identify process elements’ is nothing but identifying the design elements speci-
fied by the customers during the activity VOC. The process of generating the design ele-
ments may use the statistical approach or by traditional techniques such as brainstorm-
ing and the Nominal Group Technique (Brue & Launsby, 2003). The next activity is the
design process, which is the most important activity considering all the DFSS phase ac-
tivities. According to (Brue & Launsby, 2003), “For each technical requirement, the team
identifies critical-to-quality design parameters (CTQs) and their influence on the tech-
nical requirements (transfer functions), using analysis, Design of Experiments (DOE), sim-
ulation, and/or modeling— representations of the relationships (Y = f(X)) between cus-
tomer requirements (Y’s) and design elements (X’s).”
51
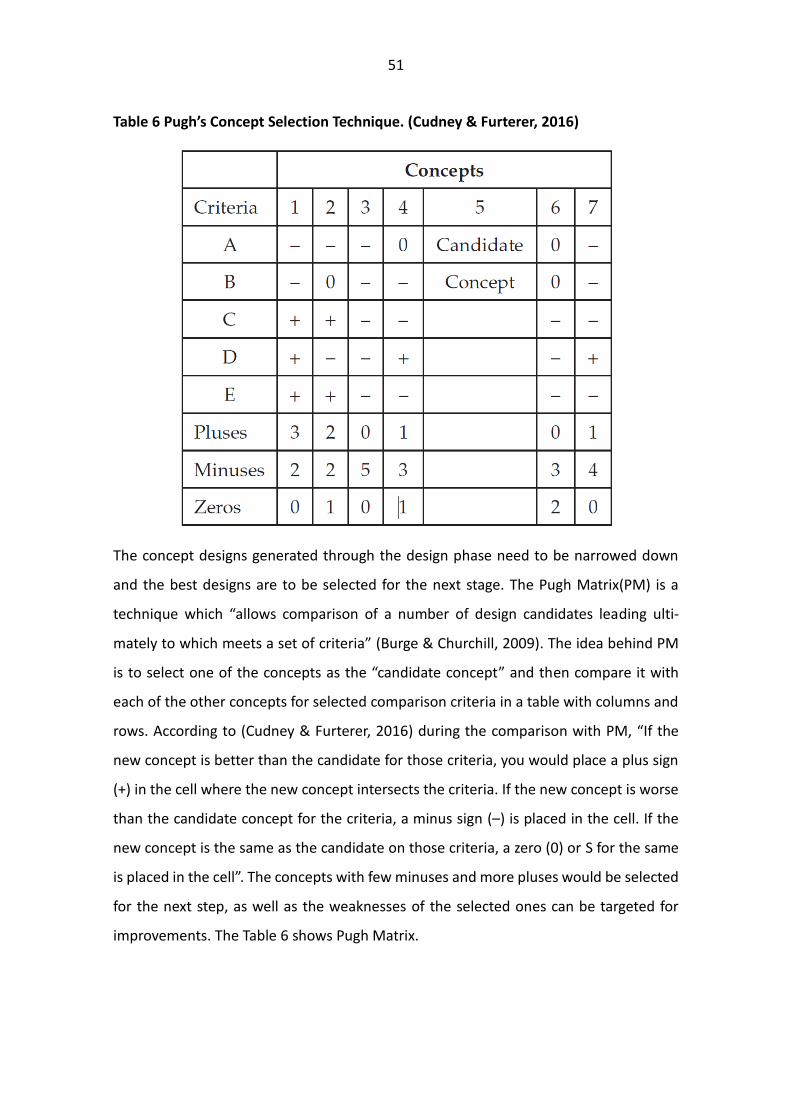
Table 6 Pugh’s Concept Selection Technique. (Cudney & Furterer, 2016)
The concept designs generated through the design phase need to be narrowed down
and the best designs are to be selected for the next stage. The Pugh Matrix(PM) is a
technique which “allows comparison of a number of design candidates leading ulti-
mately to which meets a set of criteria” (Burge & Churchill, 2009). The idea behind PM
is to select one of the concepts as the “candidate concept” and then compare it with
each of the other concepts for selected comparison criteria in a table with columns and
rows. According to (Cudney & Furterer, 2016) during the comparison with PM, “If the
new concept is better than the candidate for those criteria, you would place a plus sign
(+) in the cell where the new concept intersects the criteria. If the new concept is worse
than the candidate concept for the criteria, a minus sign (–) is placed in the cell. If the
new concept is the same as the candidate on those criteria, a zero (0) or S for the same
is placed in the cell”. The concepts with few minuses and more pluses would be selected
for the next step, as well as the weaknesses of the selected ones can be targeted for
improvements. The Table 6 shows Pugh Matrix.
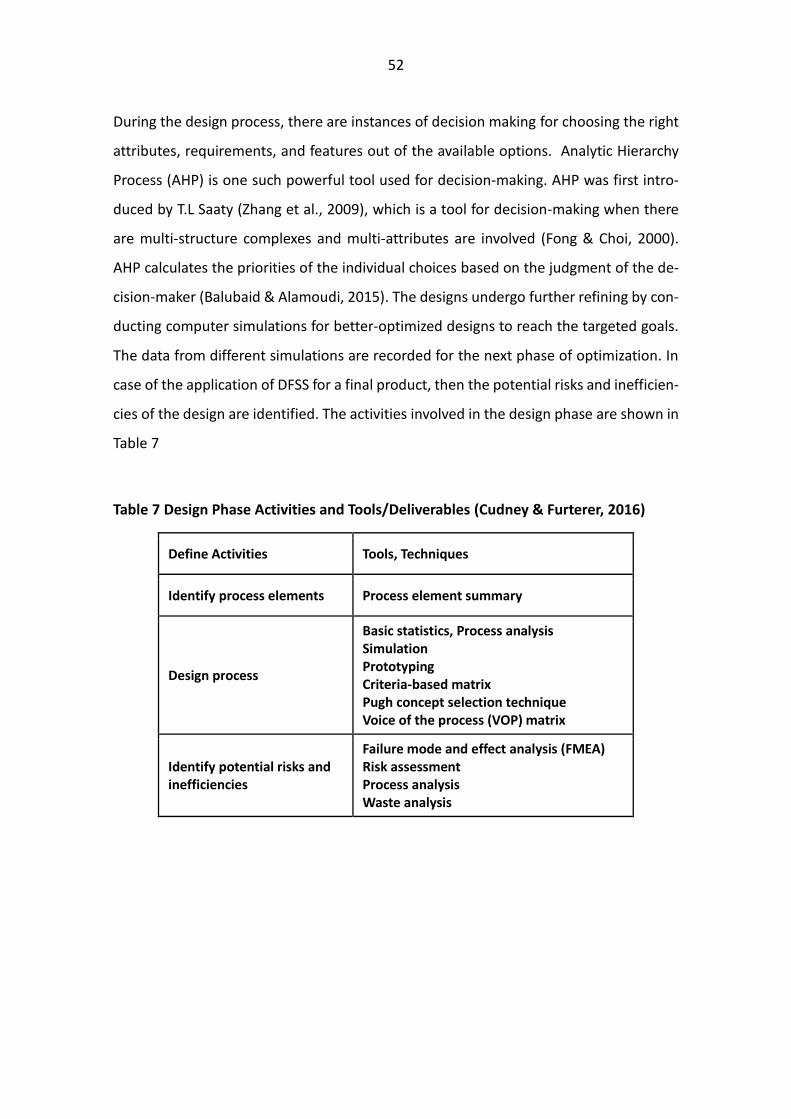
52
During the design process, there are instances of decision making for choosing the right
attributes, requirements, and features out of the available options. Analytic Hierarchy
Process (AHP) is one such powerful tool used for decision-making. AHP was first intro-
duced by T.L Saaty (Zhang et al., 2009), which is a tool for decision-making when there
are multi-structure complexes and multi-attributes are involved (Fong & Choi, 2000).
AHP calculates the priorities of the individual choices based on the judgment of the de-
cision-maker (Balubaid & Alamoudi, 2015). The designs undergo further refining by con-
ducting computer simulations for better-optimized designs to reach the targeted goals.
The data from different simulations are recorded for the next phase of optimization. In
case of the application of DFSS for a final product, then the potential risks and inefficien-
cies of the design are identified. The activities involved in the design phase are shown in
Table 7
Table 7 Design Phase Activities and Tools/Deliverables (Cudney & Furterer, 2016)
Define Activities Tools, Techniques
Identify process elements Process element summary
Design process
Basic statistics, Process analysis
Simulation
Prototyping
Criteria-based matrix
Pugh concept selection technique
Voice of the process (VOP) matrix
Identify potential risks and
inefficiencies
Failure mode and effect analysis (FMEA) Risk assessment Process analysis Waste analysis
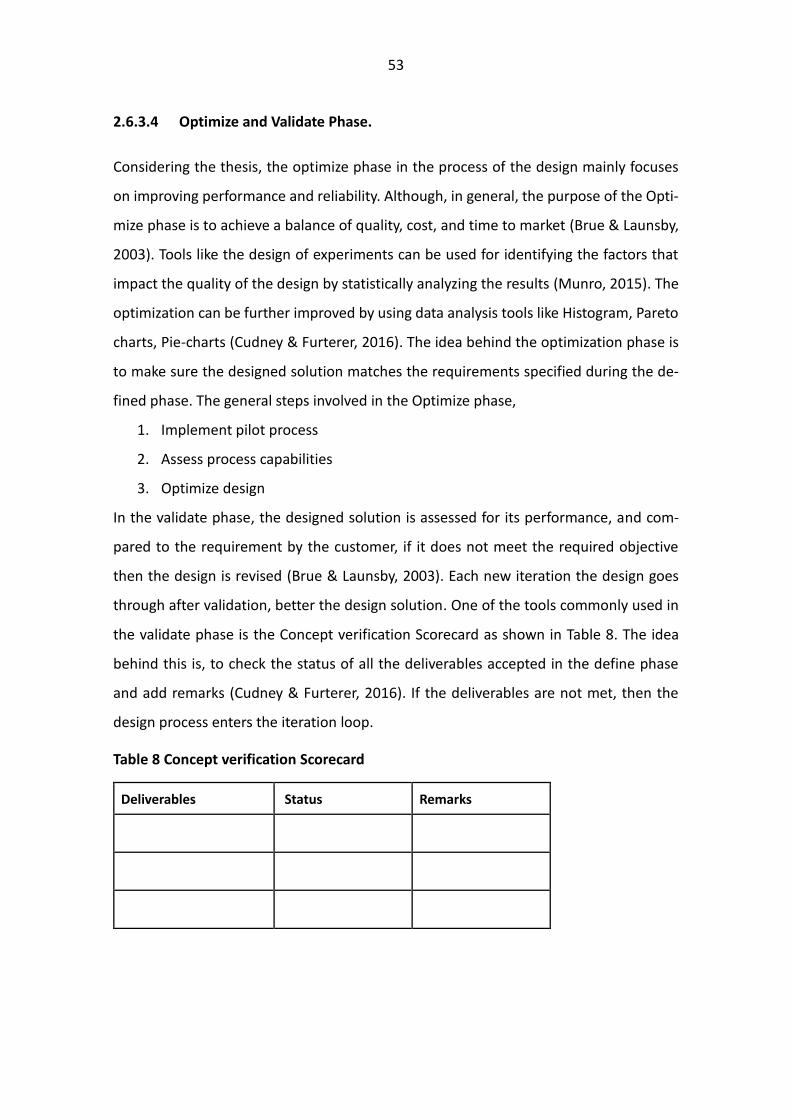
53
2.6.3.4 Optimize and Validate Phase.
Considering the thesis, the optimize phase in the process of the design mainly focuses
on improving performance and reliability. Although, in general, the purpose of the Opti-
mize phase is to achieve a balance of quality, cost, and time to market (Brue & Launsby,
2003). Tools like the design of experiments can be used for identifying the factors that
impact the quality of the design by statistically analyzing the results (Munro, 2015). The
optimization can be further improved by using data analysis tools like Histogram, Pareto
charts, Pie-charts (Cudney & Furterer, 2016). The idea behind the optimization phase is
to make sure the designed solution matches the requirements specified during the de-
fined phase. The general steps involved in the Optimize phase,
1. Implement pilot process
2. Assess process capabilities
3. Optimize design
In the validate phase, the designed solution is assessed for its performance, and com-
pared to the requirement by the customer, if it does not meet the required objective
then the design is revised (Brue & Launsby, 2003). Each new iteration the design goes
through after validation, better the design solution. One of the tools commonly used in
the validate phase is the Concept verification Scorecard as shown in Table 8. The idea
behind this is, to check the status of all the deliverables accepted in the define phase
and add remarks (Cudney & Furterer, 2016). If the deliverables are not met, then the
design process enters the iteration loop.
Table 8 Concept verification Scorecard
Deliverables Status Remarks
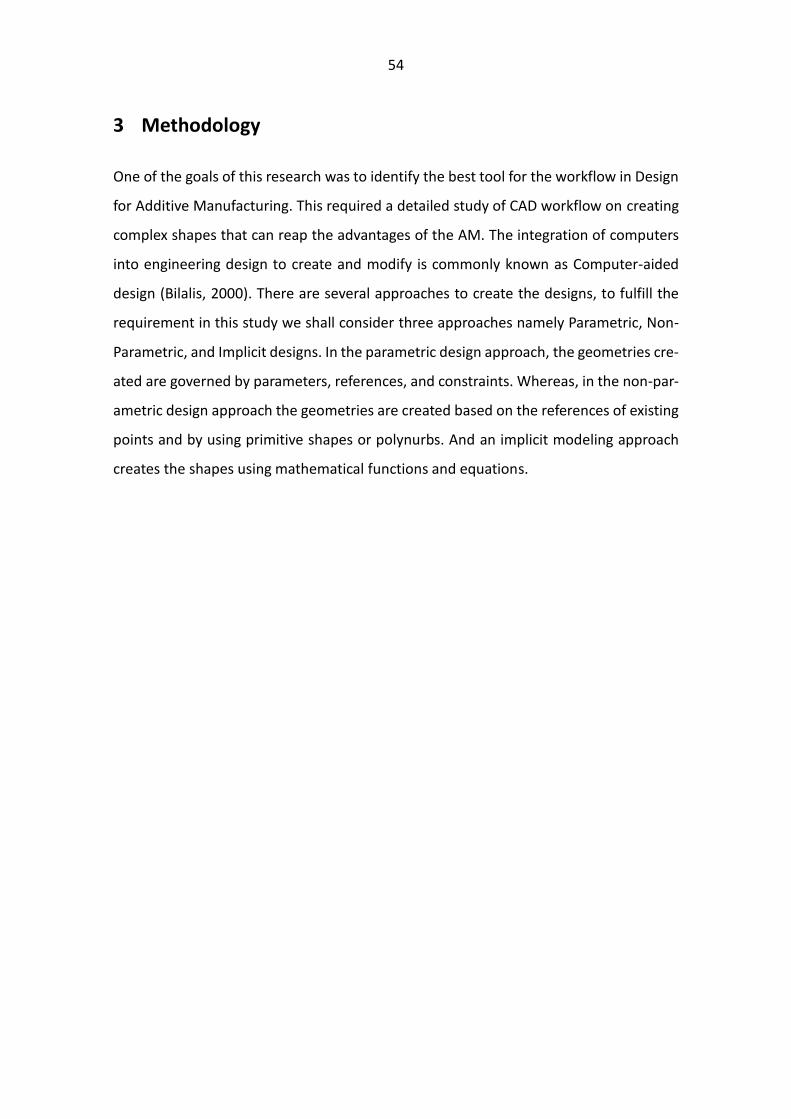
54
3 Methodology
One of the goals of this research was to identify the best tool for the workflow in Design
for Additive Manufacturing. This required a detailed study of CAD workflow on creating
complex shapes that can reap the advantages of the AM. The integration of computers
into engineering design to create and modify is commonly known as Computer-aided
design (Bilalis, 2000). There are several approaches to create the designs, to fulfill the
requirement in this study we shall consider three approaches namely Parametric, Non-
Parametric, and Implicit designs. In the parametric design approach, the geometries cre-
ated are governed by parameters, references, and constraints. Whereas, in the non-par-
ametric design approach the geometries are created based on the references of existing
points and by using primitive shapes or polynurbs. And an implicit modeling approach
creates the shapes using mathematical functions and equations.
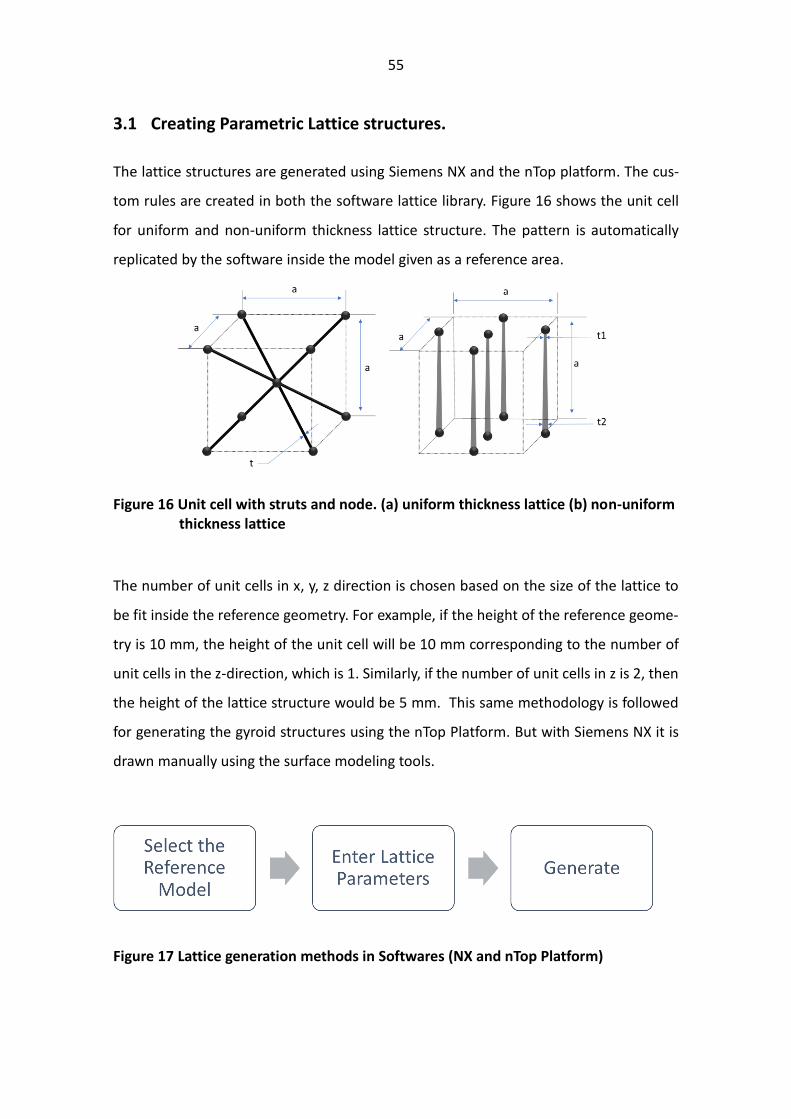
55
3.1 Creating Parametric Lattice structures.
The lattice structures are generated using Siemens NX and the nTop platform. The cus-
tom rules are created in both the software lattice library. Figure 16 shows the unit cell
for uniform and non-uniform thickness lattice structure. The pattern is automatically
replicated by the software inside the model given as a reference area.
Figure 16 Unit cell with struts and node. (a) uniform thickness lattice (b) non-uniform thickness lattice
The number of unit cells in x, y, z direction is chosen based on the size of the lattice to
be fit inside the reference geometry. For example, if the height of the reference geome-
try is 10 mm, the height of the unit cell will be 10 mm corresponding to the number of
unit cells in the z-direction, which is 1. Similarly, if the number of unit cells in z is 2, then
the height of the lattice structure would be 5 mm. This same methodology is followed
for generating the gyroid structures using the nTop Platform. But with Siemens NX it is
drawn manually using the surface modeling tools.
Figure 17 Lattice generation methods in Softwares (NX and nTop Platform)

56
Creating Gyroid structures using mathematical expressions in software,
Gyroid lattice structures can be generated using codes which contain equations for the
implicit generation of the lattice structures like gyroids, The mathematical equation for
the surfaces shown in Figure 18 are as follows (Klein, 1921),
Figure 18 Representation of minimal surface equations (from left) (a) Schwartz (b) Gyroid (c) Diamond (Strano et al., 2013a)
a. Schwartz level surface equation,
cos (x) + cos (y) + cos (z) = 0
b. Gyroid level surface equation,
cos (x) sin (y) + cos (y) sin (z) + cos (z) sin (x) = 0
c. Diamond level surface equation,
sin (x) sin (y) sin (z) + sin (x) cos (y) cos (z) + cos ( x) sin(y) cos(z)
+ cos(x) cos(y) sin (z) = 0
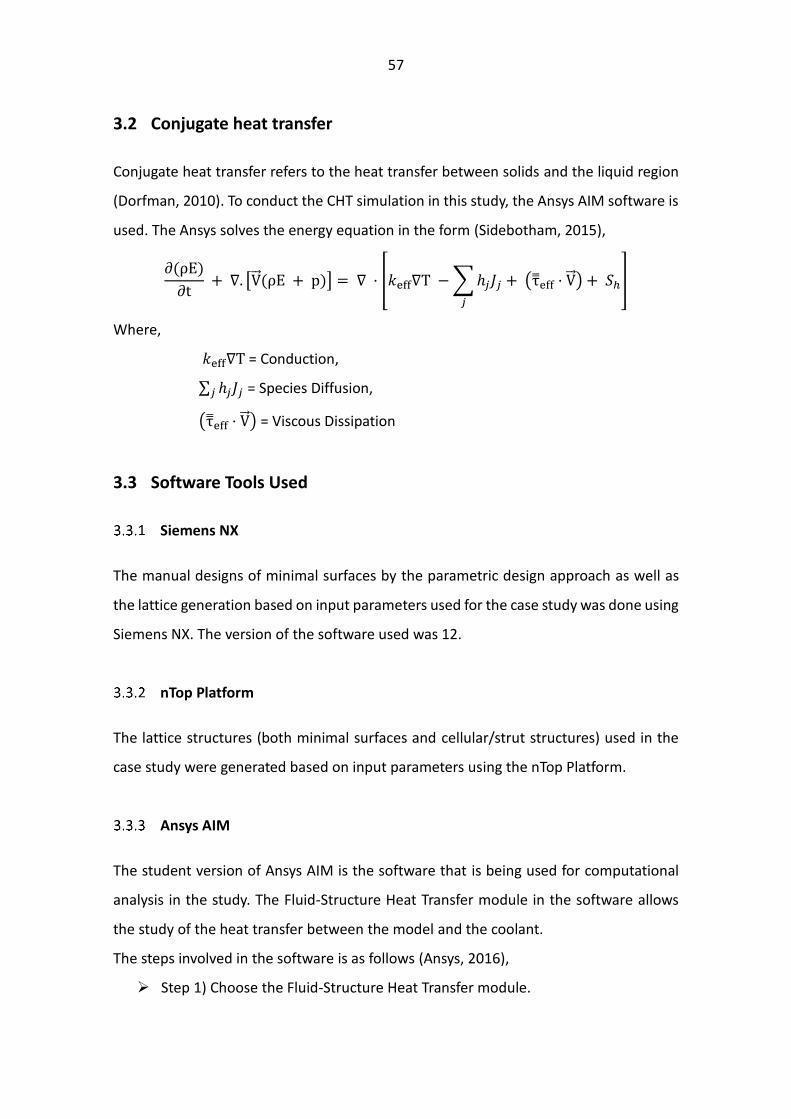
57
3.2 Conjugate heat transfer
Conjugate heat transfer refers to the heat transfer between solids and the liquid region
(Dorfman, 2010). To conduct the CHT simulation in this study, the Ansys AIM software is
used. The Ansys solves the energy equation in the form (Sidebotham, 2015),
∂(ρE)
∂t + ∇. [V⃗⃗ (ρE + p)] = ∇ · [𝑘eff∇T − ∑ℎ𝑗𝐽𝑗
𝑗
+ (τ̿eff · V⃗⃗ ) + 𝑆ℎ]
Where,
𝑘eff∇T = Conduction,
∑ ℎ𝑗𝐽𝑗𝑗 = Species Diffusion,
(τ̿eff · V⃗⃗ ) = Viscous Dissipation
3.3 Software Tools Used
Siemens NX
The manual designs of minimal surfaces by the parametric design approach as well as
the lattice generation based on input parameters used for the case study was done using
Siemens NX. The version of the software used was 12.
nTop Platform
The lattice structures (both minimal surfaces and cellular/strut structures) used in the
case study were generated based on input parameters using the nTop Platform.
Ansys AIM
The student version of Ansys AIM is the software that is being used for computational
analysis in the study. The Fluid-Structure Heat Transfer module in the software allows
the study of the heat transfer between the model and the coolant.
The steps involved in the software is as follows (Ansys, 2016),
➢ Step 1) Choose the Fluid-Structure Heat Transfer module.
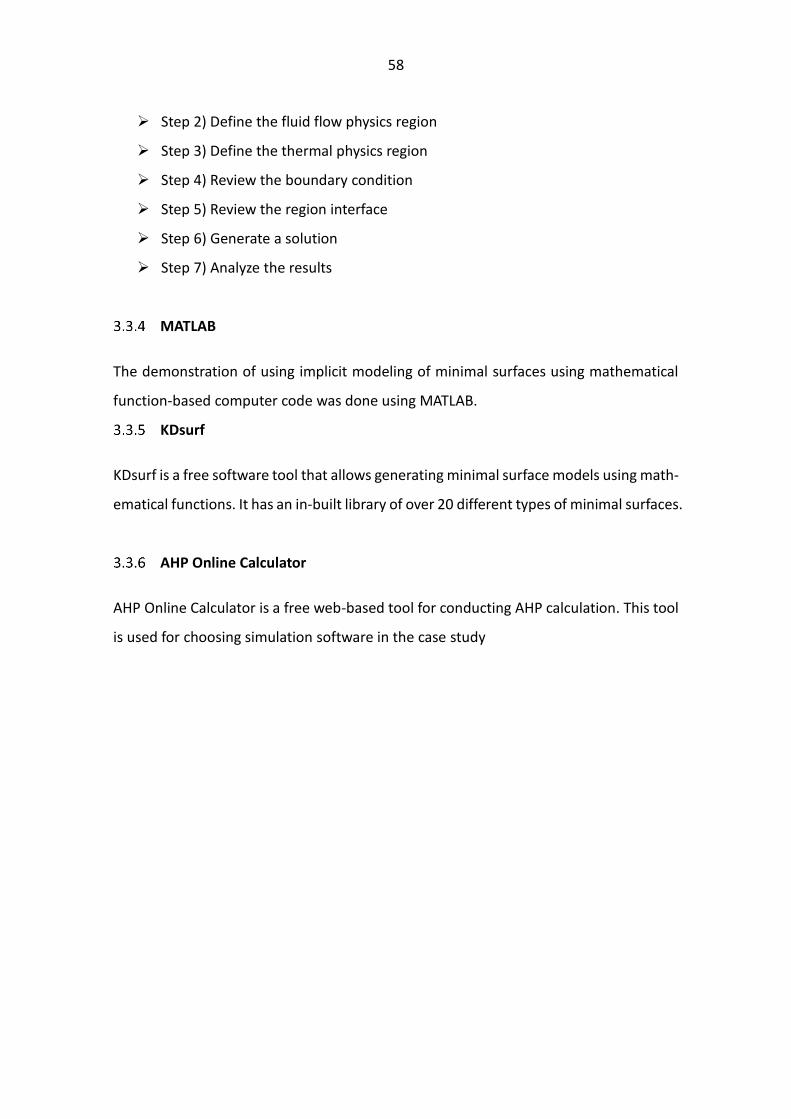
58
➢ Step 2) Define the fluid flow physics region
➢ Step 3) Define the thermal physics region
➢ Step 4) Review the boundary condition
➢ Step 5) Review the region interface
➢ Step 6) Generate a solution
➢ Step 7) Analyze the results
MATLAB
The demonstration of using implicit modeling of minimal surfaces using mathematical
function-based computer code was done using MATLAB.
KDsurf
KDsurf is a free software tool that allows generating minimal surface models using math-
ematical functions. It has an in-built library of over 20 different types of minimal surfaces.
AHP Online Calculator
AHP Online Calculator is a free web-based tool for conducting AHP calculation. This tool
is used for choosing simulation software in the case study
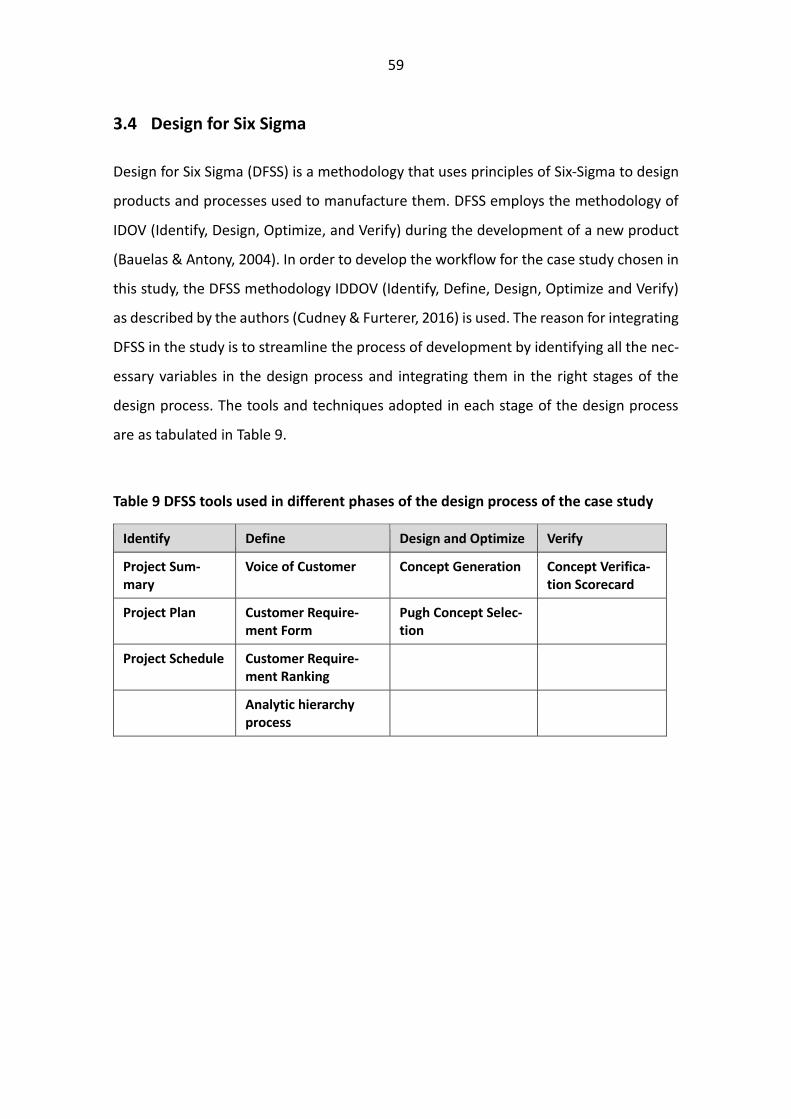
59
3.4 Design for Six Sigma
Design for Six Sigma (DFSS) is a methodology that uses principles of Six-Sigma to design
products and processes used to manufacture them. DFSS employs the methodology of
IDOV (Identify, Design, Optimize, and Verify) during the development of a new product
(Bauelas & Antony, 2004). In order to develop the workflow for the case study chosen in
this study, the DFSS methodology IDDOV (Identify, Define, Design, Optimize and Verify)
as described by the authors (Cudney & Furterer, 2016) is used. The reason for integrating
DFSS in the study is to streamline the process of development by identifying all the nec-
essary variables in the design process and integrating them in the right stages of the
design process. The tools and techniques adopted in each stage of the design process
are as tabulated in Table 9.
Table 9 DFSS tools used in different phases of the design process of the case study
Identify Define Design and Optimize Verify
Project Sum-mary
Voice of Customer Concept Generation Concept Verifica-tion Scorecard
Project Plan Customer Require-ment Form
Pugh Concept Selec-tion
Project Schedule Customer Require-ment Ranking
Analytic hierarchy process
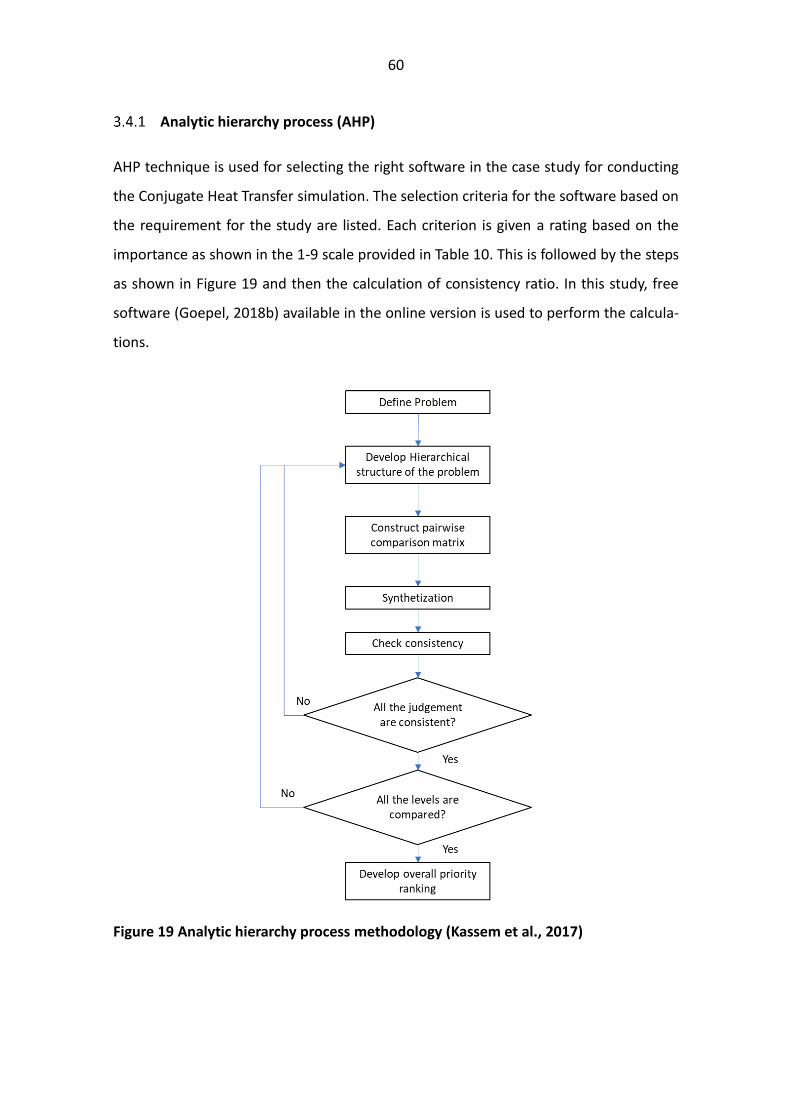
60
Analytic hierarchy process (AHP)
AHP technique is used for selecting the right software in the case study for conducting
the Conjugate Heat Transfer simulation. The selection criteria for the software based on
the requirement for the study are listed. Each criterion is given a rating based on the
importance as shown in the 1-9 scale provided in Table 10. This is followed by the steps
as shown in Figure 19 and then the calculation of consistency ratio. In this study, free
software (Goepel, 2018b) available in the online version is used to perform the calcula-
tions.
Figure 19 Analytic hierarchy process methodology (Kassem et al., 2017)
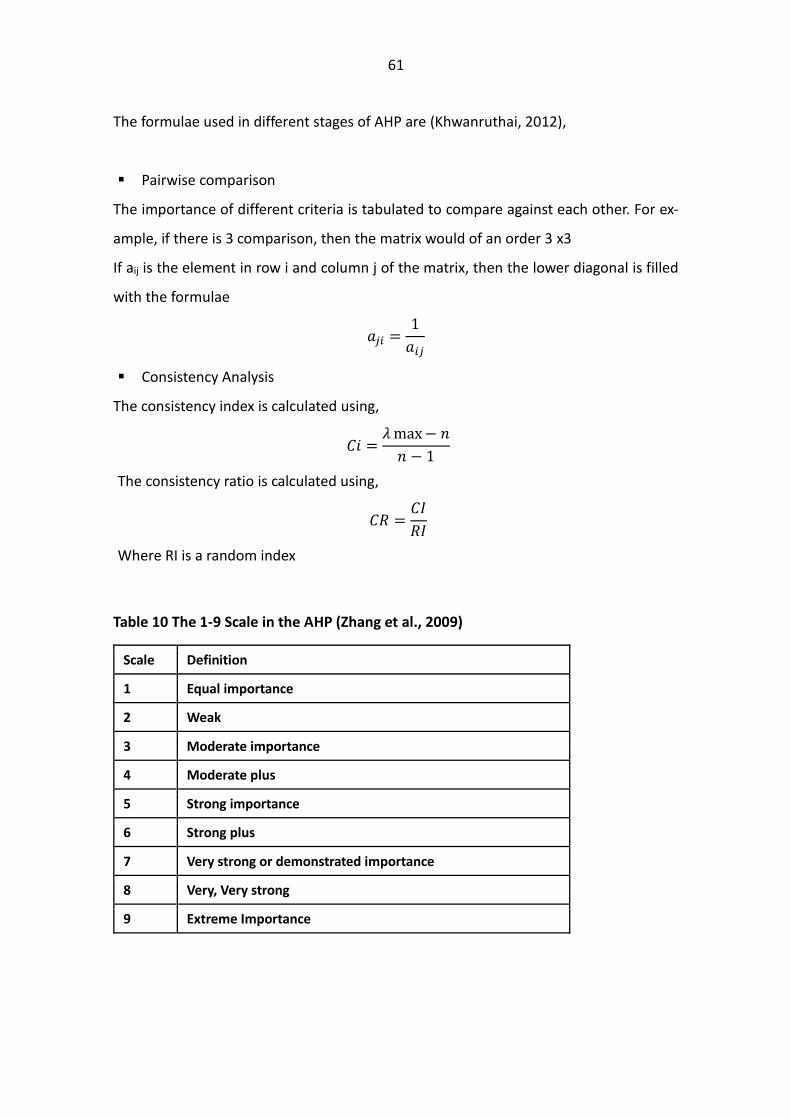
61
The formulae used in different stages of AHP are (Khwanruthai, 2012),
▪ Pairwise comparison
The importance of different criteria is tabulated to compare against each other. For ex-
ample, if there is 3 comparison, then the matrix would of an order 3 x3
If aij is the element in row i and column j of the matrix, then the lower diagonal is filled
with the formulae
𝑎𝑗𝑖 =1
𝑎𝑖𝑗
▪ Consistency Analysis
The consistency index is calculated using,
𝐶𝑖 =𝜆max− 𝑛
𝑛 − 1
The consistency ratio is calculated using,
𝐶𝑅 =𝐶𝐼
𝑅𝐼
Where RI is a random index
Table 10 The 1-9 Scale in the AHP (Zhang et al., 2009)
Scale Definition
1 Equal importance
2 Weak
3 Moderate importance
4 Moderate plus
5 Strong importance
6 Strong plus
7 Very strong or demonstrated importance
8 Very, Very strong
9 Extreme Importance
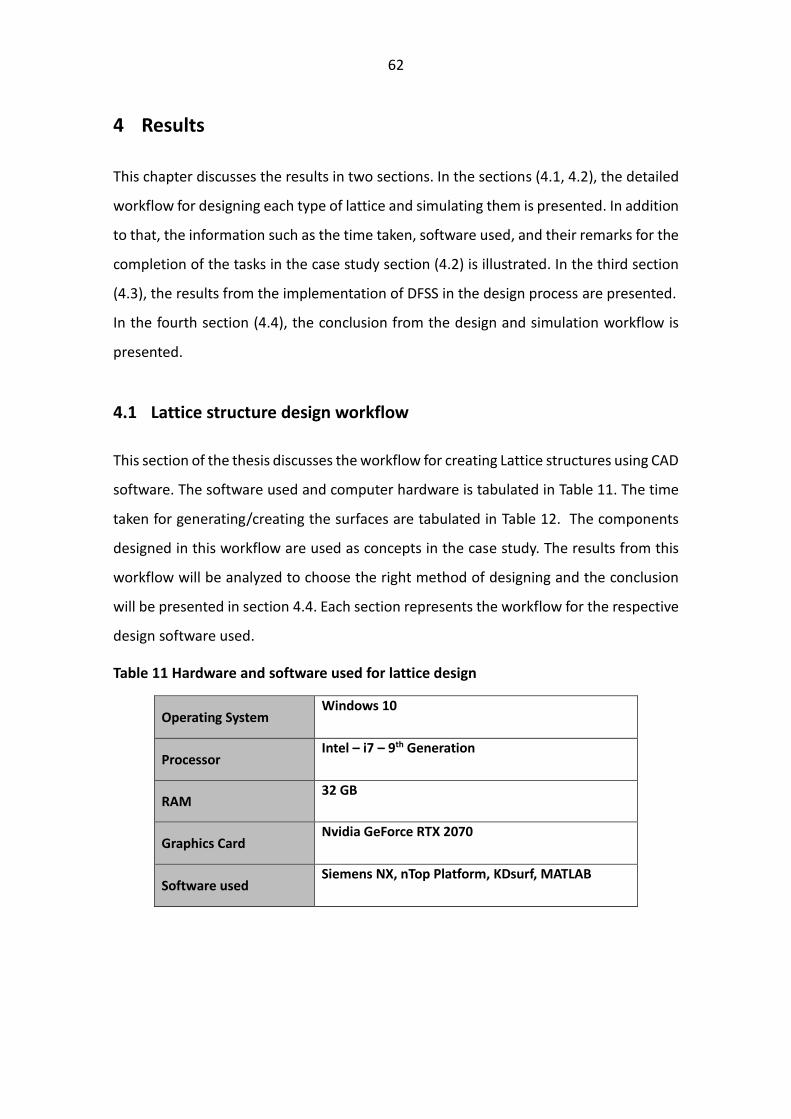
62
4 Results
This chapter discusses the results in two sections. In the sections (4.1, 4.2), the detailed
workflow for designing each type of lattice and simulating them is presented. In addition
to that, the information such as the time taken, software used, and their remarks for the
completion of the tasks in the case study section (4.2) is illustrated. In the third section
(4.3), the results from the implementation of DFSS in the design process are presented.
In the fourth section (4.4), the conclusion from the design and simulation workflow is
presented.
4.1 Lattice structure design workflow
This section of the thesis discusses the workflow for creating Lattice structures using CAD
software. The software used and computer hardware is tabulated in Table 11. The time
taken for generating/creating the surfaces are tabulated in Table 12. The components
designed in this workflow are used as concepts in the case study. The results from this
workflow will be analyzed to choose the right method of designing and the conclusion
will be presented in section 4.4. Each section represents the workflow for the respective
design software used.
Table 11 Hardware and software used for lattice design
Operating System Windows 10
Processor Intel – i7 – 9th Generation
RAM 32 GB
Graphics Card Nvidia GeForce RTX 2070
Software used Siemens NX, nTop Platform, KDsurf, MATLAB

63
Reports from lattice structure design workflow
Build volume: 50 mm x 50mm x 4 mm
Table 12 Report from the lattice structure design workflow
Structure Name
Method Software Time Taken Remarks
Gyroid Manual Siemens NX
2 hours for de-signing and exporting
As structures get com-plicated, the computer is hard to operate. The thickness of the sur-faces cannot go be-yond .8 mm, as it cre-ates a self-intersecting surface.
Schwarz P Manual Siemens NX
2 hours for de-signing and exporting
As structures get com-plicated, the compute is hard to operate.
Pin Fins (Lat-tice)
Manual Siemens NX
1 hour for de-signing and exporting
As structures get com-plicated, the computer is hard to operate
Lattice Struc-tures
Automated Generation using pa-rameters
Siemens NX
30 minutes (Designing and Exporting)
As structures get com-plicated, the compute is hard to operate
Face type lat-tice
Automated Generation using pa-rameters
nTop Plat-form
< 30 minutes (Designing and Exporting)
No performance issue
Cellular lat-tice
Automated Generation using pa-rameters
nTop Plat-form
< 30 minutes (Designing and Exporting)
No performance issue
Gyroid TPMS Automated Generation using pa-rameters
nTop Plat-form
< 30 minutes (Designing and Exporting)
No performance issue
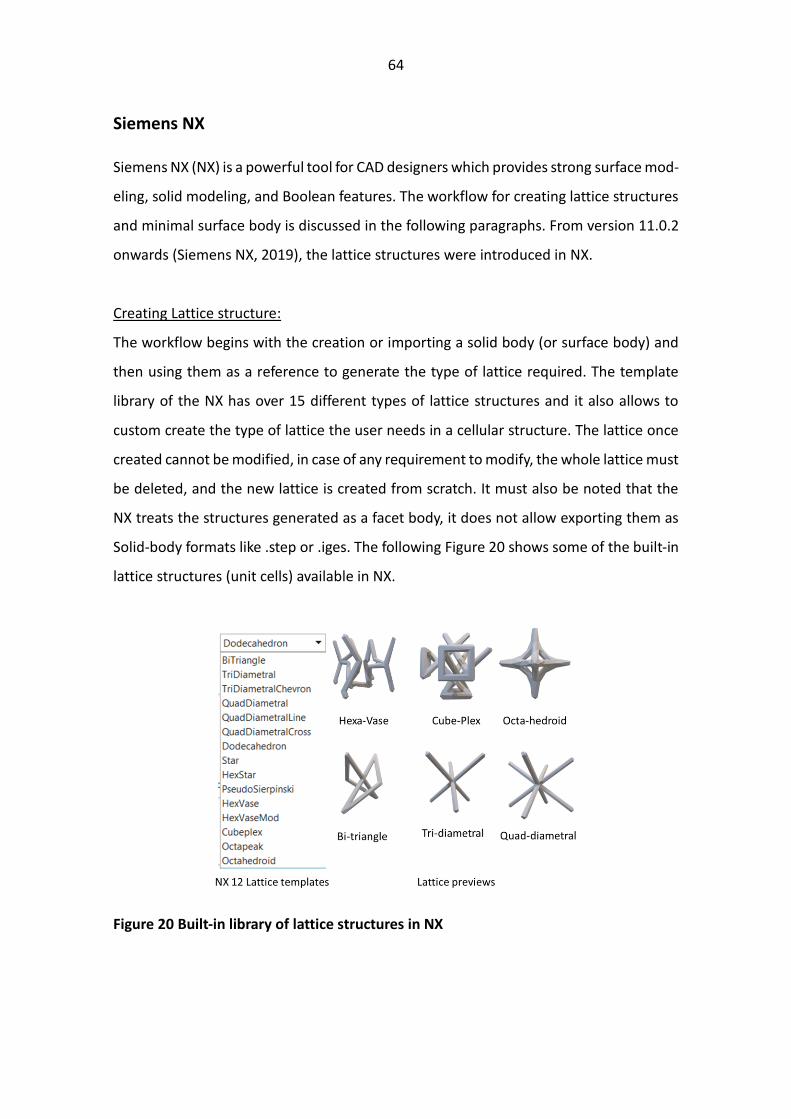
64
Siemens NX Siemens NX (NX) is a powerful tool for CAD designers which provides strong surface mod-
eling, solid modeling, and Boolean features. The workflow for creating lattice structures
and minimal surface body is discussed in the following paragraphs. From version 11.0.2
onwards (Siemens NX, 2019), the lattice structures were introduced in NX.
Creating Lattice structure:
The workflow begins with the creation or importing a solid body (or surface body) and
then using them as a reference to generate the type of lattice required. The template
library of the NX has over 15 different types of lattice structures and it also allows to
custom create the type of lattice the user needs in a cellular structure. The lattice once
created cannot be modified, in case of any requirement to modify, the whole lattice must
be deleted, and the new lattice is created from scratch. It must also be noted that the
NX treats the structures generated as a facet body, it does not allow exporting them as
Solid-body formats like .step or .iges. The following Figure 20 shows some of the built-in
lattice structures (unit cells) available in NX.
Figure 20 Built-in library of lattice structures in NX
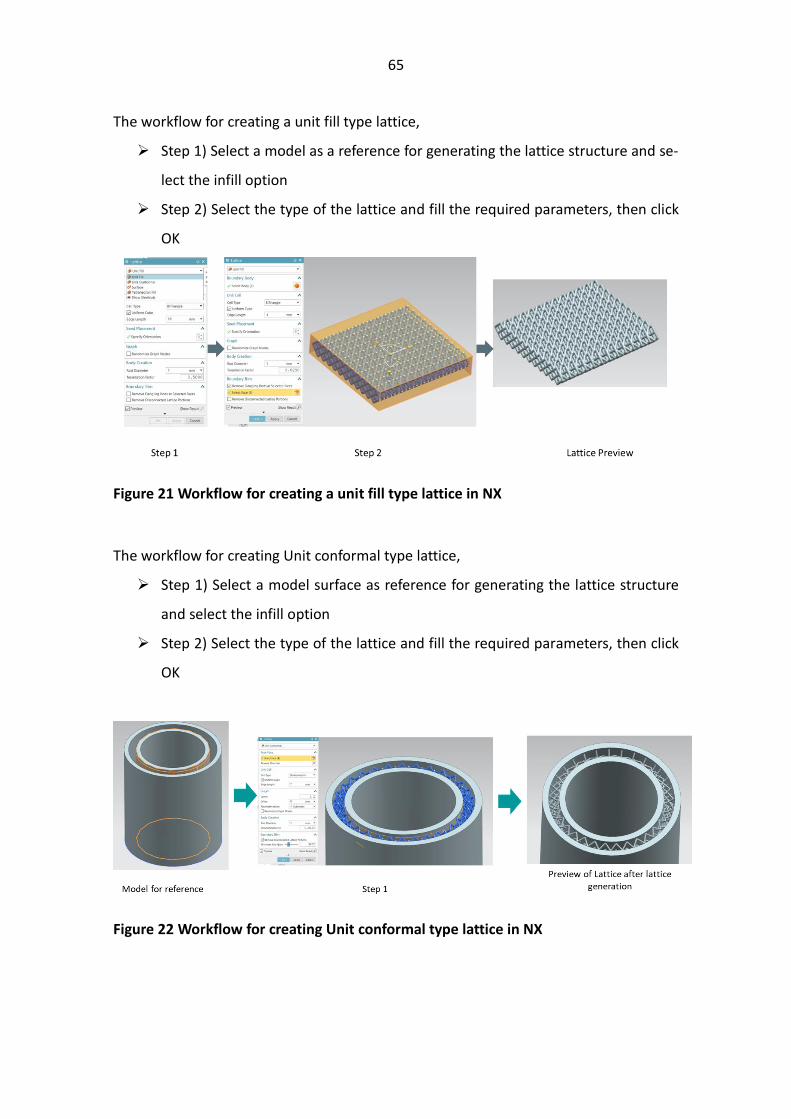
65
The workflow for creating a unit fill type lattice,
➢ Step 1) Select a model as a reference for generating the lattice structure and se-
lect the infill option
➢ Step 2) Select the type of the lattice and fill the required parameters, then click
OK
Figure 21 Workflow for creating a unit fill type lattice in NX
The workflow for creating Unit conformal type lattice,
➢ Step 1) Select a model surface as reference for generating the lattice structure
and select the infill option
➢ Step 2) Select the type of the lattice and fill the required parameters, then click
OK
Figure 22 Workflow for creating Unit conformal type lattice in NX

66
Creating Minimal surface lattice structures:
Siemens NX (NX) does not have an inbuilt option to generate minimal surfaces, these
surfaces are to be created using the surface modeling commands in the NX. The follow-
ing discusses the steps involved in creating a minimal surface – Gyroid.
For non-conformal gyroid:
➢ Step 1) Create a replica sketch of the Gyroid unit cell
➢ Step 2) Create a surface unit of the gyroid
➢ Step 3) Pattern and thicken
Figure 23 Workflow for creating non-conformal type Gyroid Lattice in NX
For conformal gyroid:
➢ Step 1) Create a replica sketch of the Gyroid unit cell in a sector shape
➢ Step 2) Create a surface unit of gyroid and pattern
➢ Step 3) Thicken the surface
➢ Step 4) Unit it with the model
➢ Step 5) If required, export it as .stl for 3D printing.
Figure 24 Workflow for creating conformal type Gyroid Lattice in NX

67
Figure 25 Workflow for creating conformal type Gyroid Lattice in NX
For non-conformal Schwarz P surface.
➢ Step 1) Create a replica sketch of Schwarz P
➢ Step 2) Create a surface unit of Schwarz P
➢ Step 3) Thicken the surface
➢ Step 4) Pattern the model and unit
Figure 26 Creating Schwarz - P lattice structure in NX
The gyroid structures created are solid body models, hence it can be exported as solid-
body formats like .step or .iges. Another advantage of this approach of creating such
structures is that the structures can be parametrized.
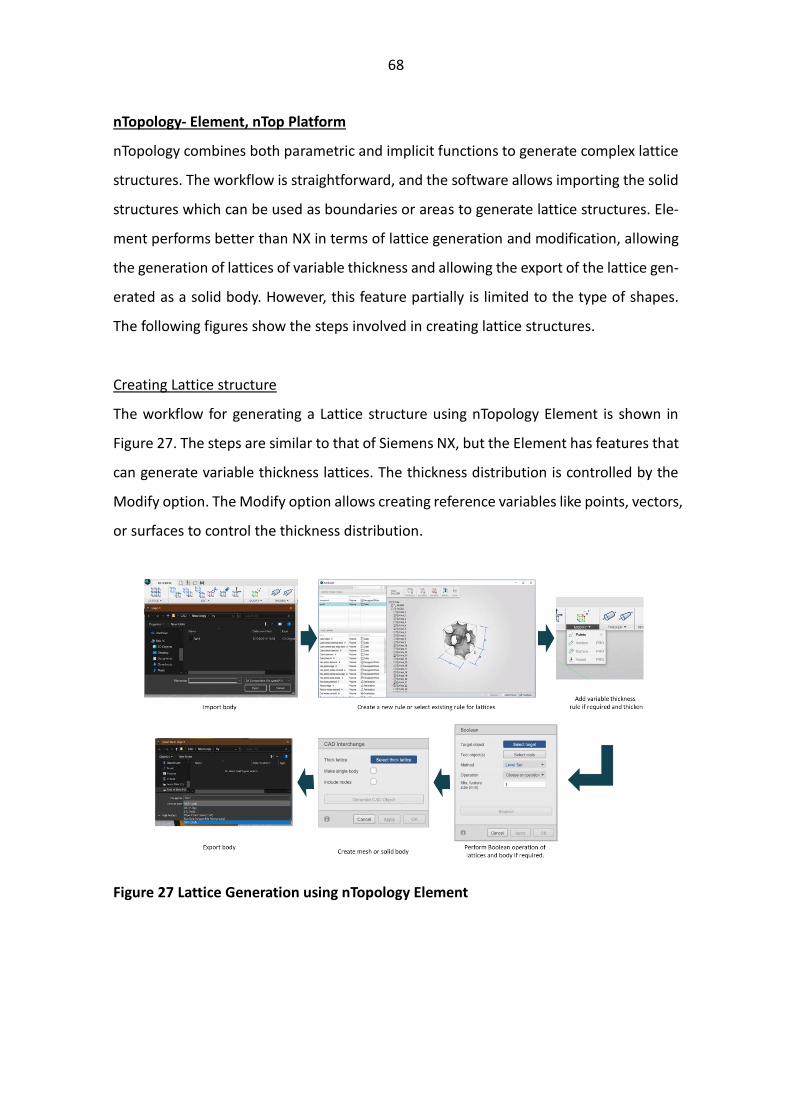
68
nTopology- Element, nTop Platform
nTopology combines both parametric and implicit functions to generate complex lattice
structures. The workflow is straightforward, and the software allows importing the solid
structures which can be used as boundaries or areas to generate lattice structures. Ele-
ment performs better than NX in terms of lattice generation and modification, allowing
the generation of lattices of variable thickness and allowing the export of the lattice gen-
erated as a solid body. However, this feature partially is limited to the type of shapes.
The following figures show the steps involved in creating lattice structures.
Creating Lattice structure
The workflow for generating a Lattice structure using nTopology Element is shown in
Figure 27. The steps are similar to that of Siemens NX, but the Element has features that
can generate variable thickness lattices. The thickness distribution is controlled by the
Modify option. The Modify option allows creating reference variables like points, vectors,
or surfaces to control the thickness distribution.
Figure 27 Lattice Generation using nTopology Element
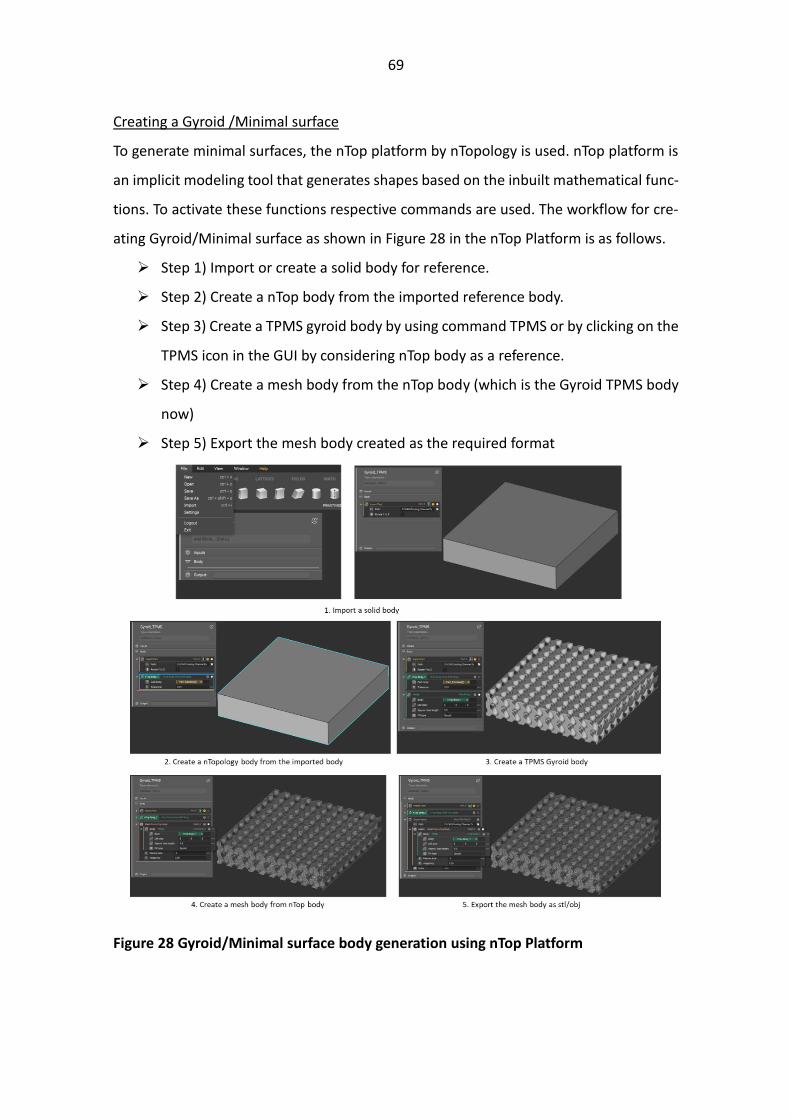
69
Creating a Gyroid /Minimal surface
To generate minimal surfaces, the nTop platform by nTopology is used. nTop platform is
an implicit modeling tool that generates shapes based on the inbuilt mathematical func-
tions. To activate these functions respective commands are used. The workflow for cre-
ating Gyroid/Minimal surface as shown in Figure 28 in the nTop Platform is as follows.
➢ Step 1) Import or create a solid body for reference.
➢ Step 2) Create a nTop body from the imported reference body.
➢ Step 3) Create a TPMS gyroid body by using command TPMS or by clicking on the
TPMS icon in the GUI by considering nTop body as a reference.
➢ Step 4) Create a mesh body from the nTop body (which is the Gyroid TPMS body
now)
➢ Step 5) Export the mesh body created as the required format
Figure 28 Gyroid/Minimal surface body generation using nTop Platform
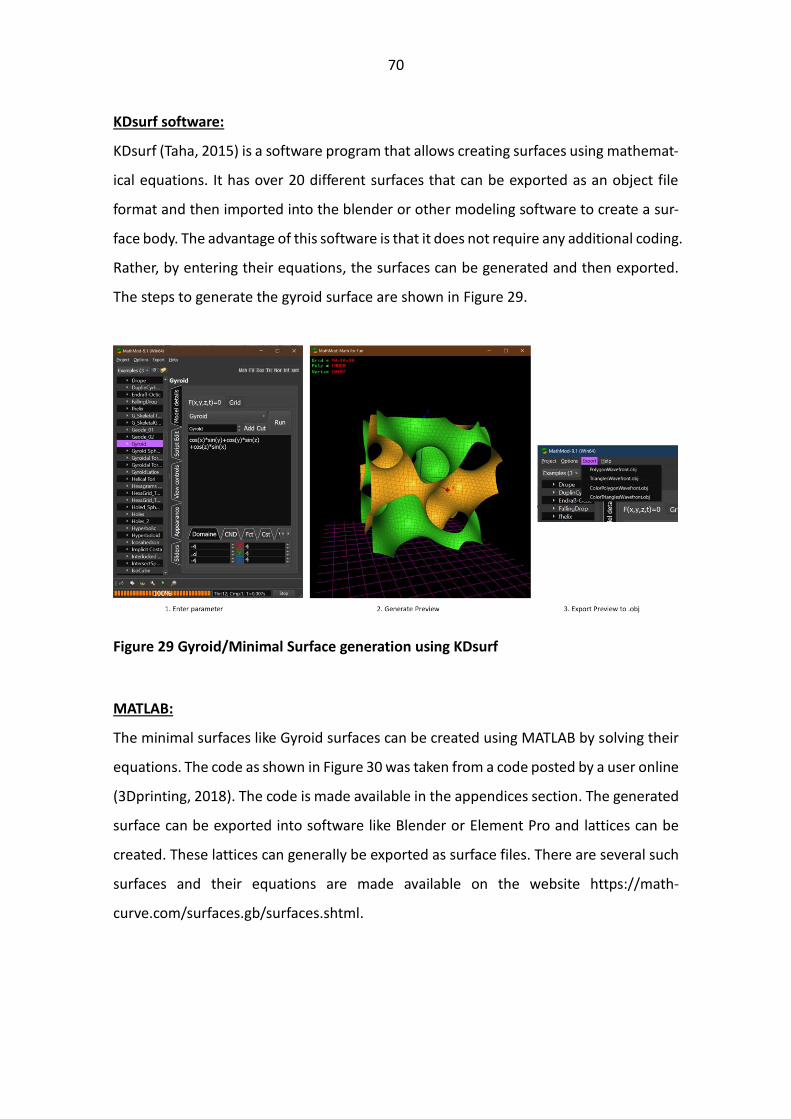
70
KDsurf software:
KDsurf (Taha, 2015) is a software program that allows creating surfaces using mathemat-
ical equations. It has over 20 different surfaces that can be exported as an object file
format and then imported into the blender or other modeling software to create a sur-
face body. The advantage of this software is that it does not require any additional coding.
Rather, by entering their equations, the surfaces can be generated and then exported.
The steps to generate the gyroid surface are shown in Figure 29.
Figure 29 Gyroid/Minimal Surface generation using KDsurf
MATLAB:
The minimal surfaces like Gyroid surfaces can be created using MATLAB by solving their
equations. The code as shown in Figure 30 was taken from a code posted by a user online
(3Dprinting, 2018). The code is made available in the appendices section. The generated
surface can be exported into software like Blender or Element Pro and lattices can be
created. These lattices can generally be exported as surface files. There are several such
surfaces and their equations are made available on the website https://math-
curve.com/surfaces.gb/surfaces.shtml.
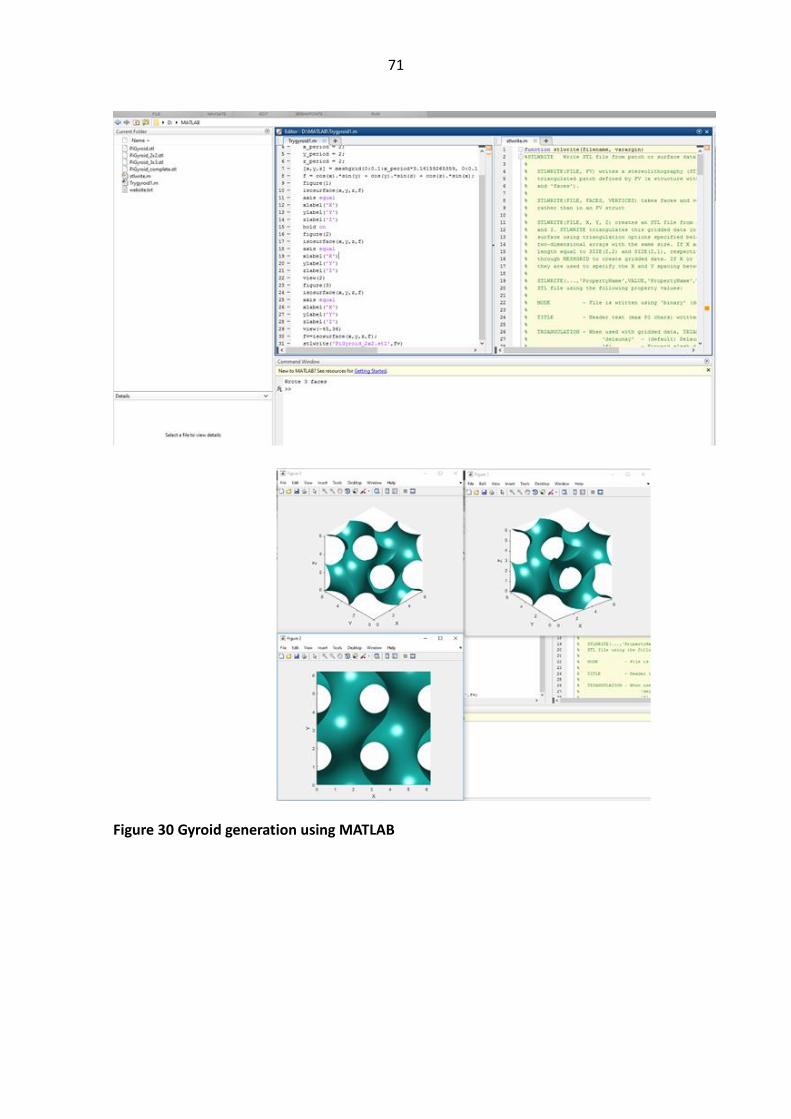
71
Figure 30 Gyroid generation using MATLAB
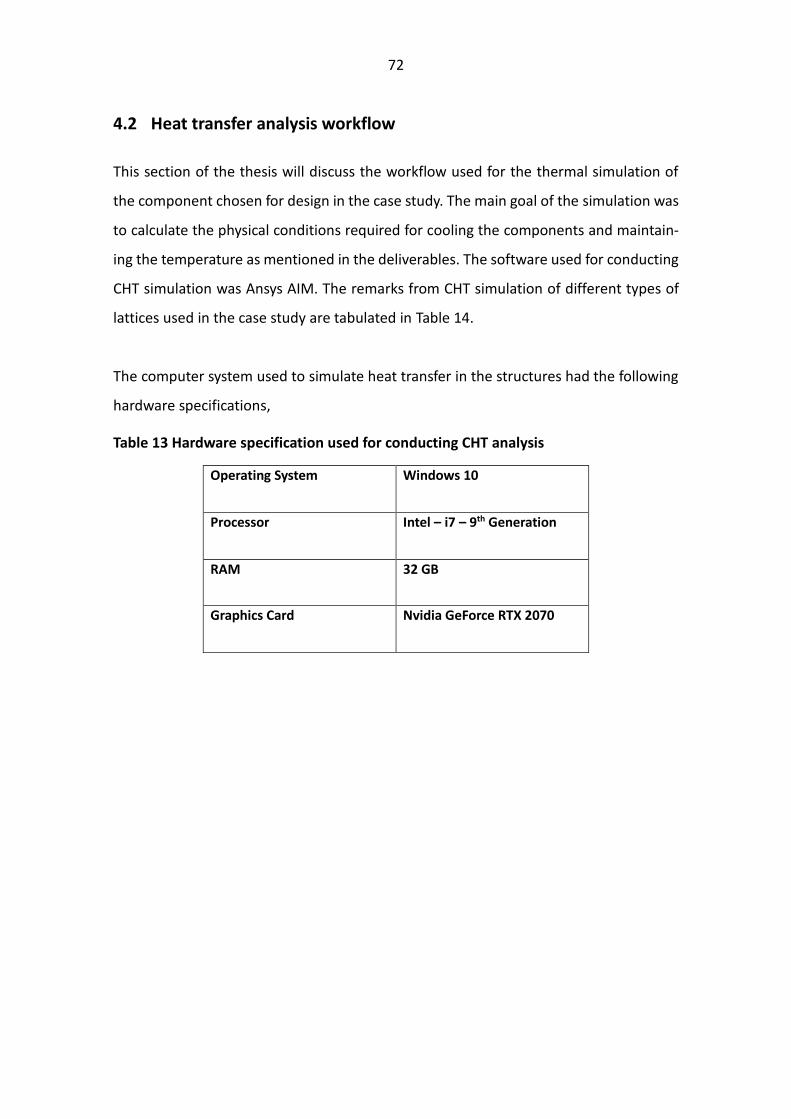
72
4.2 Heat transfer analysis workflow
This section of the thesis will discuss the workflow used for the thermal simulation of
the component chosen for design in the case study. The main goal of the simulation was
to calculate the physical conditions required for cooling the components and maintain-
ing the temperature as mentioned in the deliverables. The software used for conducting
CHT simulation was Ansys AIM. The remarks from CHT simulation of different types of
lattices used in the case study are tabulated in Table 14.
The computer system used to simulate heat transfer in the structures had the following
hardware specifications,
Table 13 Hardware specification used for conducting CHT analysis
Operating System Windows 10
Processor Intel – i7 – 9th Generation
RAM 32 GB
Graphics Card Nvidia GeForce RTX 2070
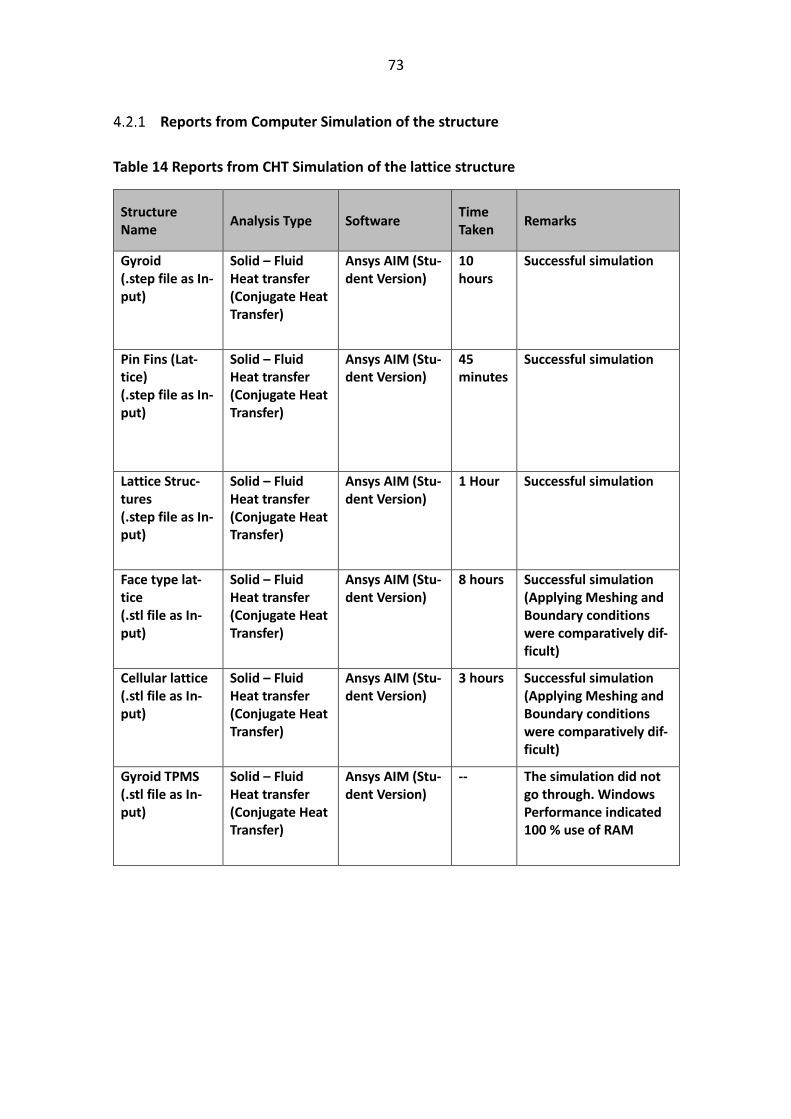
73
Reports from Computer Simulation of the structure
Table 14 Reports from CHT Simulation of the lattice structure
Structure Name
Analysis Type Software Time Taken
Remarks
Gyroid (.step file as In-put)
Solid – Fluid Heat transfer (Conjugate Heat Transfer)
Ansys AIM (Stu-dent Version)
10 hours
Successful simulation
Pin Fins (Lat-tice) (.step file as In-put)
Solid – Fluid Heat transfer (Conjugate Heat Transfer)
Ansys AIM (Stu-dent Version)
45 minutes
Successful simulation
Lattice Struc-tures (.step file as In-put)
Solid – Fluid Heat transfer (Conjugate Heat Transfer)
Ansys AIM (Stu-dent Version)
1 Hour Successful simulation
Face type lat-tice (.stl file as In-put)
Solid – Fluid Heat transfer (Conjugate Heat Transfer)
Ansys AIM (Stu-dent Version)
8 hours Successful simulation (Applying Meshing and Boundary conditions were comparatively dif-ficult)
Cellular lattice (.stl file as In-put)
Solid – Fluid Heat transfer (Conjugate Heat Transfer)
Ansys AIM (Stu-dent Version)
3 hours Successful simulation (Applying Meshing and Boundary conditions were comparatively dif-ficult)
Gyroid TPMS (.stl file as In-put)
Solid – Fluid Heat transfer (Conjugate Heat Transfer)
Ansys AIM (Stu-dent Version)
-- The simulation did not go through. Windows Performance indicated 100 % use of RAM
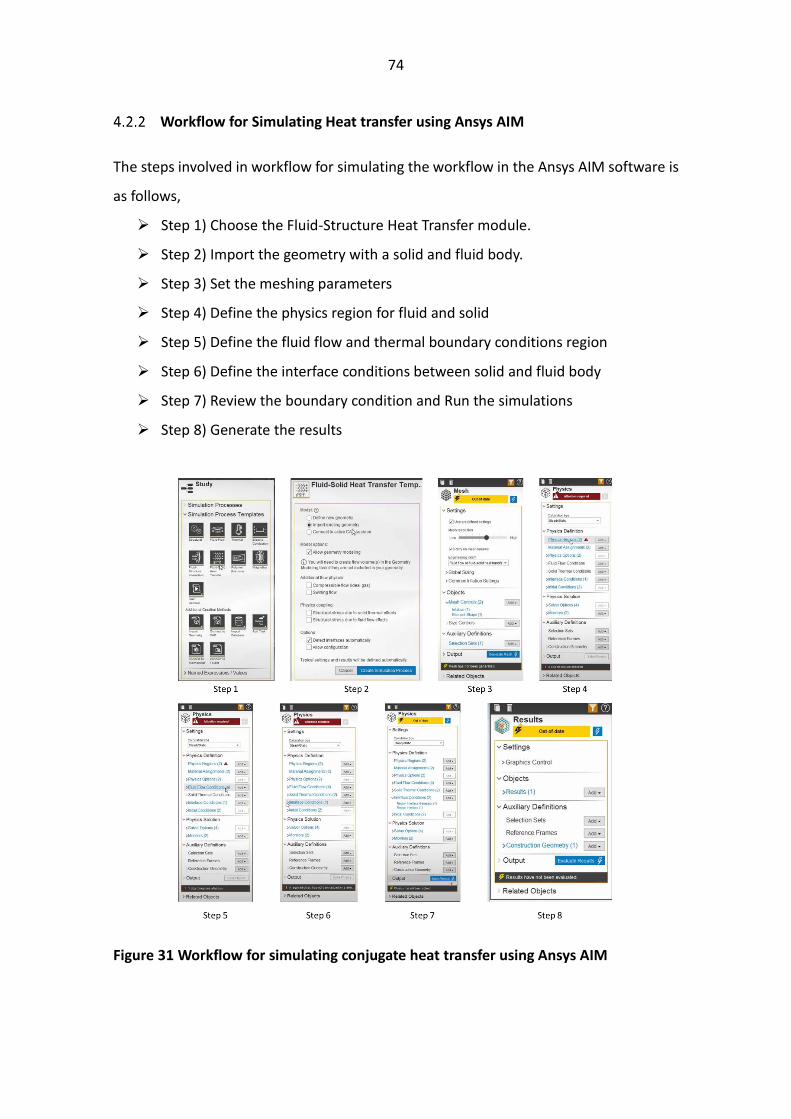
74
Workflow for Simulating Heat transfer using Ansys AIM
The steps involved in workflow for simulating the workflow in the Ansys AIM software is
as follows,
➢ Step 1) Choose the Fluid-Structure Heat Transfer module.
➢ Step 2) Import the geometry with a solid and fluid body.
➢ Step 3) Set the meshing parameters
➢ Step 4) Define the physics region for fluid and solid
➢ Step 5) Define the fluid flow and thermal boundary conditions region
➢ Step 6) Define the interface conditions between solid and fluid body
➢ Step 7) Review the boundary condition and Run the simulations
➢ Step 8) Generate the results
Figure 31 Workflow for simulating conjugate heat transfer using Ansys AIM

75
➢ Step 9) Analyze the results
Figure 32 Results generated in Ansys AIM post CHT simulation
76
4.3 Case Study Results
During the design process, there are several ideas and concepts which designers gener-
ate through their intuitions and research. In addition to this, different experiments/sim-
ulations are conducted to check the performance of these design concepts. When there
are several different parameters, variables, and rules governing the design process, there
is a good probability of uncertainties. These uncertainties may be in decision-making for
design selection or methodology for conducting experiments and so on. To avoid these
uncertainties and structure the processes in the design phase, DFSS methodology is im-
plemented. This case study acts as an example of the integration of DFSS in the design
process.
Jet engines are designed to be lightweight and gain maximum performance with the
lowest overall weight in order to get better fuel efficiency. Additive Manufacturing has
enabled manufacturing lightweight structures with most complex geometries, thus mak-
ing it ideal for manufacturing jet engine components. Although Design for AM is not a
fully mature method, there have been many kinds of research in this area. The goal of
this case study is to develop a workflow for the design for AM for a case of designing a
heat management solution. The physical conditions the design experiences resemble the
combustion chamber of a Jet Engine, although the geometry is modified to avoid any
hassles due to intellectual property rights. The final goal is to maintain a temperature of
590 c near the heat transfer region which transmits 35.4 kW of heat towards the outer
region. For the cooling purpose, air inlet at 80-82 bars can be given as input at 500 c. As
discussed earlier in the literature review section, extended surfaces are an ideal choice
for heat transfer-based applications.
77
Identify Phase
Project Summary
Project Name: Heat Management Solution
Project Overview: The purpose of this project is to develop a heat management solution
considering the advantages of Additive Manufacturing. Secondly, investigating right
amount of coolant and physical condition required to achieve it.
Project Statement: The design model is a hypothetical geometry of the bottom part of a
singular combustion chamber for turbofan application, including a portion of the
outlet pipe feeding the exhaust gases to the turbine inlet. For typical applications,
the cooling systems are manufactured using non-AM methods, hence the design is
more generic geometry which can be manufactured in non-AM methods. This de-
sign project aims to create non generic shapes by considering all the best available
simulation software to analyze its heat transfer performance its and advantages of
AM which enables the manufacturability of these non-generic shapes designed.
Customers/Stakeholders: The design concept will be handled in general to the concurrent
design process phase. (Although, here the stakeholder/customer is the author of
the thesis)
Critical to Satisfaction (CTS): There are two major CTSs: One, Achieve a heat distribution of
590 c near the heat source region. Two, achieve this with minimum weight.
Goal of the Project: The goal of the project is to make best use of the advantages of the
AM in terms of mechanical design to achieve the CTSs and to determine the right
physical condition required to achieve this.
Scope of the Project: The scope of the project is to design the solution only by considering
heat transfer load condition, therefore all the other structural conditions are ne-
glected. Furthermore, the project limits the scope at developing a workflow for de-
sign and understanding DfAM in design critical applications as such.
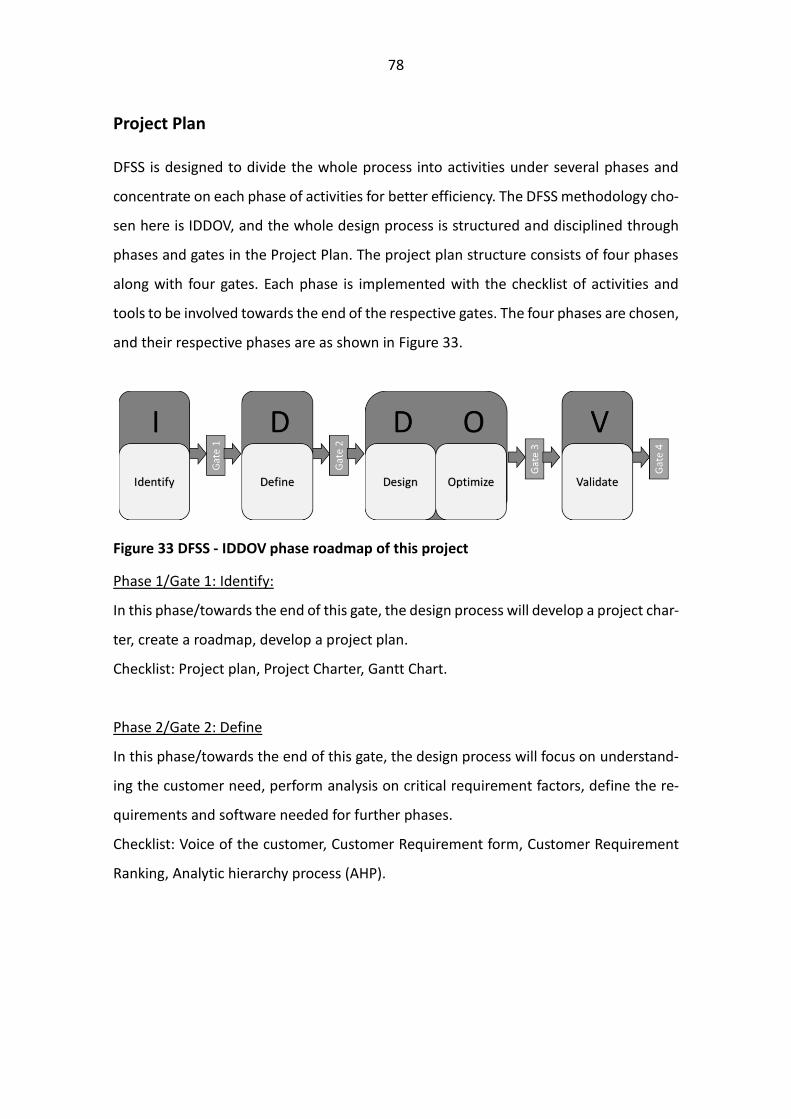
78
Project Plan DFSS is designed to divide the whole process into activities under several phases and
concentrate on each phase of activities for better efficiency. The DFSS methodology cho-
sen here is IDDOV, and the whole design process is structured and disciplined through
phases and gates in the Project Plan. The project plan structure consists of four phases
along with four gates. Each phase is implemented with the checklist of activities and
tools to be involved towards the end of the respective gates. The four phases are chosen,
and their respective phases are as shown in Figure 33.
Figure 33 DFSS - IDDOV phase roadmap of this project
Phase 1/Gate 1: Identify:
In this phase/towards the end of this gate, the design process will develop a project char-
ter, create a roadmap, develop a project plan.
Checklist: Project plan, Project Charter, Gantt Chart.
Phase 2/Gate 2: Define
In this phase/towards the end of this gate, the design process will focus on understand-
ing the customer need, perform analysis on critical requirement factors, define the re-
quirements and software needed for further phases.
Checklist: Voice of the customer, Customer Requirement form, Customer Requirement
Ranking, Analytic hierarchy process (AHP).
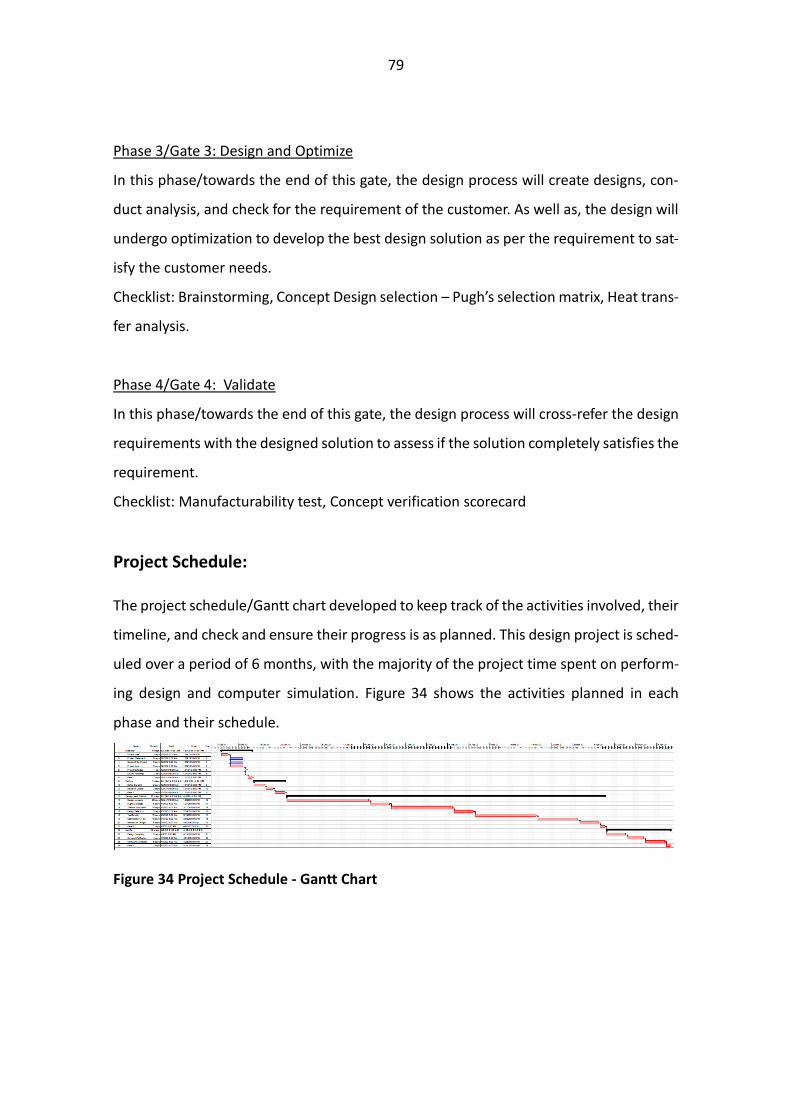
79
Phase 3/Gate 3: Design and Optimize
In this phase/towards the end of this gate, the design process will create designs, con-
duct analysis, and check for the requirement of the customer. As well as, the design will
undergo optimization to develop the best design solution as per the requirement to sat-
isfy the customer needs.
Checklist: Brainstorming, Concept Design selection – Pugh’s selection matrix, Heat trans-
fer analysis.
Phase 4/Gate 4: Validate
In this phase/towards the end of this gate, the design process will cross-refer the design
requirements with the designed solution to assess if the solution completely satisfies the
requirement.
Checklist: Manufacturability test, Concept verification scorecard
Project Schedule: The project schedule/Gantt chart developed to keep track of the activities involved, their
timeline, and check and ensure their progress is as planned. This design project is sched-
uled over a period of 6 months, with the majority of the project time spent on perform-
ing design and computer simulation. Figure 34 shows the activities planned in each
phase and their schedule.
Figure 34 Project Schedule - Gantt Chart

80
Define Phase
Voice of customer (VOC) To implement the VOC, a Requirement form was designed which could collect require-
ments of the customer. It must be noted that since the customer here is the author itself,
the required form is self-answered. Table 15 shows the requirement form. Considering
the major requirements from the other existing researches and developmental projects
the important characteristics of similar projects are also given as pre-filled criteria.
The key take-aways from the requirement forms were,
• Strong features of customization should be visible
• The design must be lightweight
• Maximum heat transfer with a minimum overall weight
• Must consider the advantages of the AM
• Must consider Manufacturability for AM
• Must explore software options available for conducting simulation
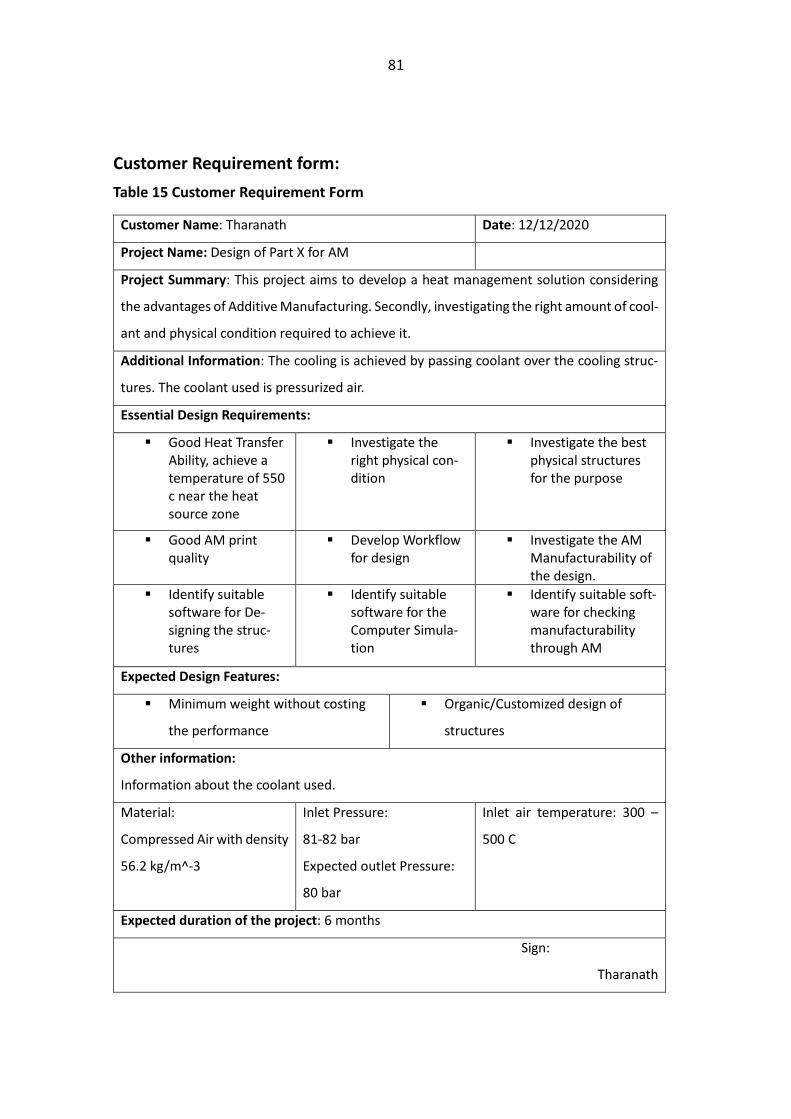
81
Customer Requirement form:
Table 15 Customer Requirement Form
Customer Name: Tharanath Date: 12/12/2020
Project Name: Design of Part X for AM
Project Summary: This project aims to develop a heat management solution considering
the advantages of Additive Manufacturing. Secondly, investigating the right amount of cool-
ant and physical condition required to achieve it.
Additional Information: The cooling is achieved by passing coolant over the cooling struc-
tures. The coolant used is pressurized air.
Essential Design Requirements:
▪ Good Heat Transfer Ability, achieve a temperature of 550 c near the heat source zone
▪ Investigate the right physical con-dition
▪ Investigate the best physical structures for the purpose
▪ Good AM print quality
▪ Develop Workflow for design
▪ Investigate the AM Manufacturability of the design.
▪ Identify suitable software for De-signing the struc-tures
▪ Identify suitable software for the Computer Simula-tion
▪ Identify suitable soft-ware for checking manufacturability through AM
Expected Design Features:
▪ Minimum weight without costing
the performance
▪ Organic/Customized design of
structures
Other information:
Information about the coolant used.
Material:
Compressed Air with density
56.2 kg/m^-3
Inlet Pressure:
81-82 bar
Expected outlet Pressure:
80 bar
Inlet air temperature: 300 –
500 C
Expected duration of the project: 6 months
Sign:
Tharanath
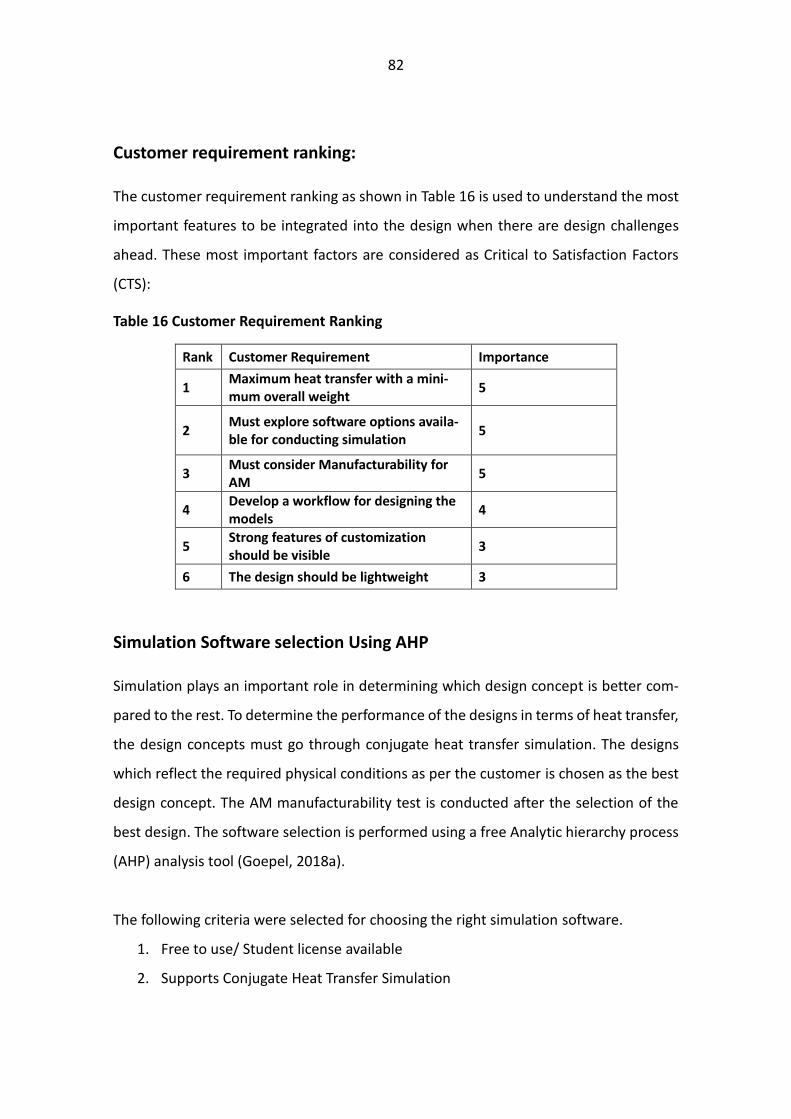
82
Customer requirement ranking: The customer requirement ranking as shown in Table 16 is used to understand the most
important features to be integrated into the design when there are design challenges
ahead. These most important factors are considered as Critical to Satisfaction Factors
(CTS):
Table 16 Customer Requirement Ranking
Rank Customer Requirement Importance
1 Maximum heat transfer with a mini-mum overall weight
5
2 Must explore software options availa-ble for conducting simulation
5
3 Must consider Manufacturability for AM
5
4 Develop a workflow for designing the models
4
5 Strong features of customization should be visible
3
6 The design should be lightweight 3
Simulation Software selection Using AHP Simulation plays an important role in determining which design concept is better com-
pared to the rest. To determine the performance of the designs in terms of heat transfer,
the design concepts must go through conjugate heat transfer simulation. The designs
which reflect the required physical conditions as per the customer is chosen as the best
design concept. The AM manufacturability test is conducted after the selection of the
best design. The software selection is performed using a free Analytic hierarchy process
(AHP) analysis tool (Goepel, 2018a).
The following criteria were selected for choosing the right simulation software.
1. Free to use/ Student license available
2. Supports Conjugate Heat Transfer Simulation

83
3. Easy to setup simulation
4. Requires more computational power
5. Cloud-based/Offline based
6. Reputation and Recommendation/Userbase
7. Support / Training Videos/ Reference Manuals
An AHP analysis was conducted to determine the ranking of the selection criteria
through the online AHP tool. The results from AHP analysis are shown in Figure 35.
Therefore, the top three priorities for software selection are categories 3, 1, and 2, re-
spectively.
Figure 35 AHP analysis for selecting the best simulation software.
After conducting AHP analysis, the simulations software was searched using google, the
keywords used were “free CHT transfer software, Conjugate heat transfer software, Fluid
– solid heat transfer, heat transfer analysis”. And then results were categorized and com-
pared to each other according to the criteria chosen earlier during the AHP. Based on the
comparison Table 17 and the priorities from the AHP analysis, the better choice for the
simulation task in this thesis is Ansys AIM.
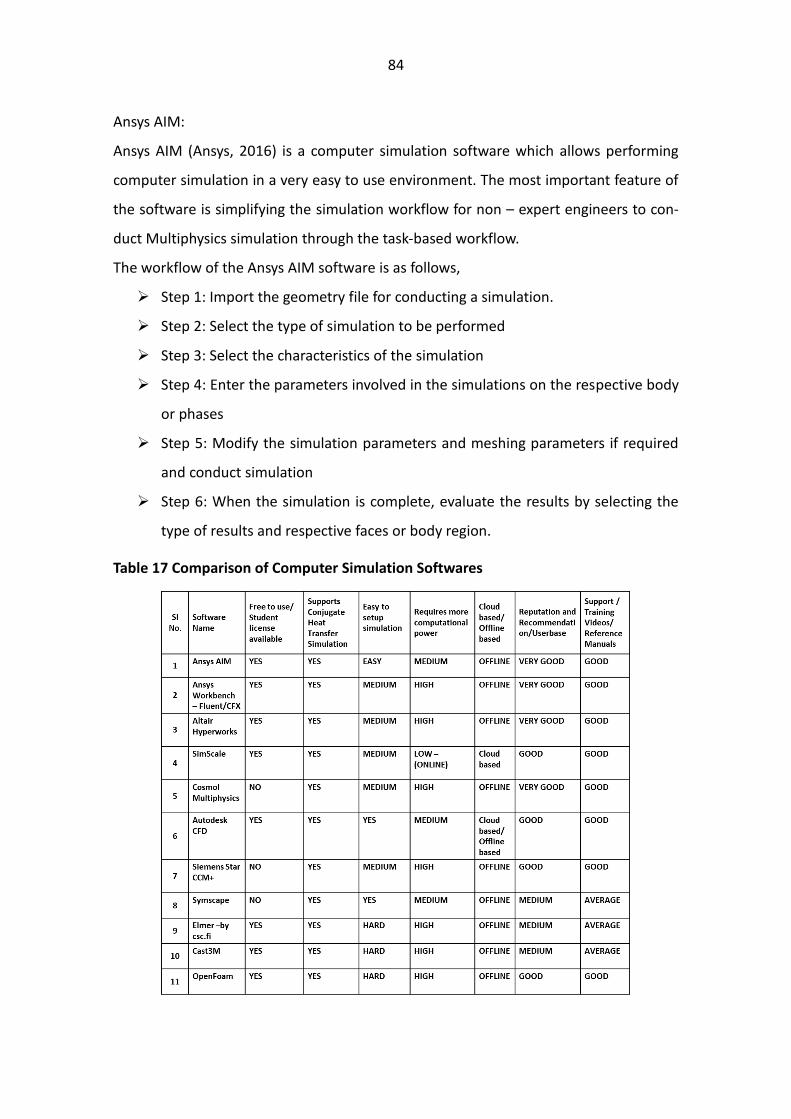
84
Ansys AIM:
Ansys AIM (Ansys, 2016) is a computer simulation software which allows performing
computer simulation in a very easy to use environment. The most important feature of
the software is simplifying the simulation workflow for non – expert engineers to con-
duct Multiphysics simulation through the task-based workflow.
The workflow of the Ansys AIM software is as follows,
➢ Step 1: Import the geometry file for conducting a simulation.
➢ Step 2: Select the type of simulation to be performed
➢ Step 3: Select the characteristics of the simulation
➢ Step 4: Enter the parameters involved in the simulations on the respective body
or phases
➢ Step 5: Modify the simulation parameters and meshing parameters if required
and conduct simulation
➢ Step 6: When the simulation is complete, evaluate the results by selecting the
type of results and respective faces or body region.
Table 17 Comparison of Computer Simulation Softwares
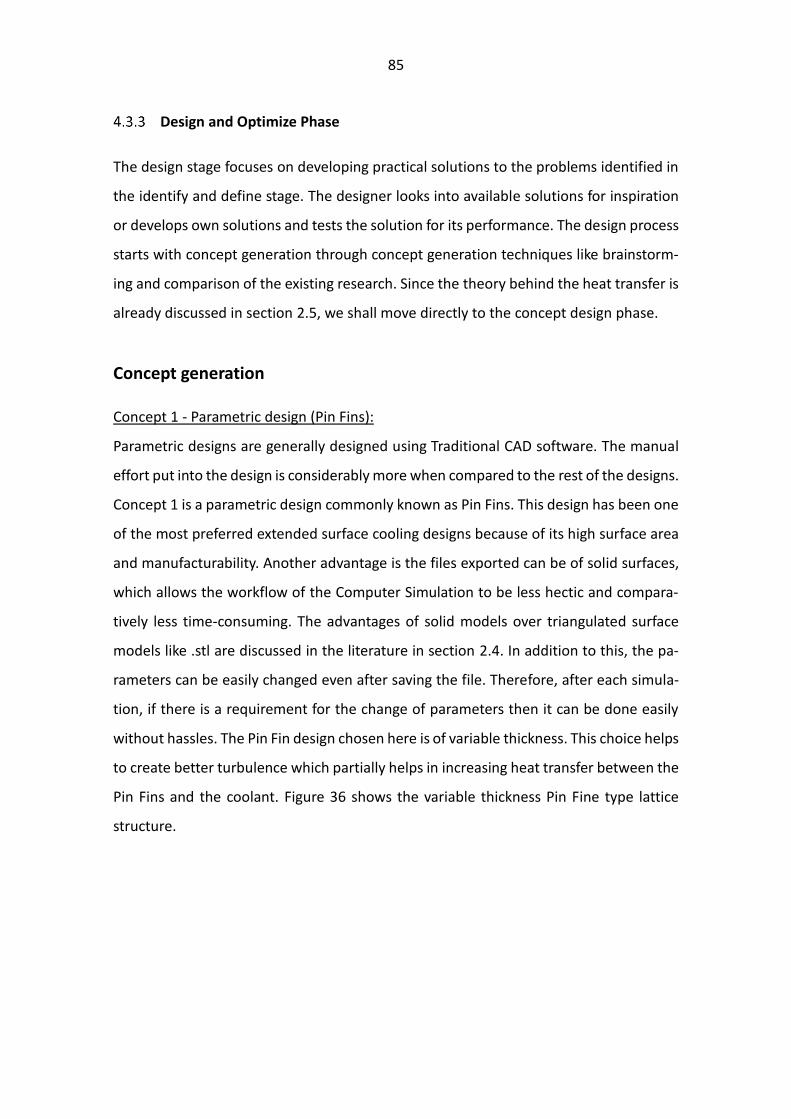
85
Design and Optimize Phase
The design stage focuses on developing practical solutions to the problems identified in
the identify and define stage. The designer looks into available solutions for inspiration
or develops own solutions and tests the solution for its performance. The design process
starts with concept generation through concept generation techniques like brainstorm-
ing and comparison of the existing research. Since the theory behind the heat transfer is
already discussed in section 2.5, we shall move directly to the concept design phase.
Concept generation Concept 1 - Parametric design (Pin Fins):
Parametric designs are generally designed using Traditional CAD software. The manual
effort put into the design is considerably more when compared to the rest of the designs.
Concept 1 is a parametric design commonly known as Pin Fins. This design has been one
of the most preferred extended surface cooling designs because of its high surface area
and manufacturability. Another advantage is the files exported can be of solid surfaces,
which allows the workflow of the Computer Simulation to be less hectic and compara-
tively less time-consuming. The advantages of solid models over triangulated surface
models like .stl are discussed in the literature in section 2.4. In addition to this, the pa-
rameters can be easily changed even after saving the file. Therefore, after each simula-
tion, if there is a requirement for the change of parameters then it can be done easily
without hassles. The Pin Fin design chosen here is of variable thickness. This choice helps
to create better turbulence which partially helps in increasing heat transfer between the
Pin Fins and the coolant. Figure 36 shows the variable thickness Pin Fine type lattice
structure.
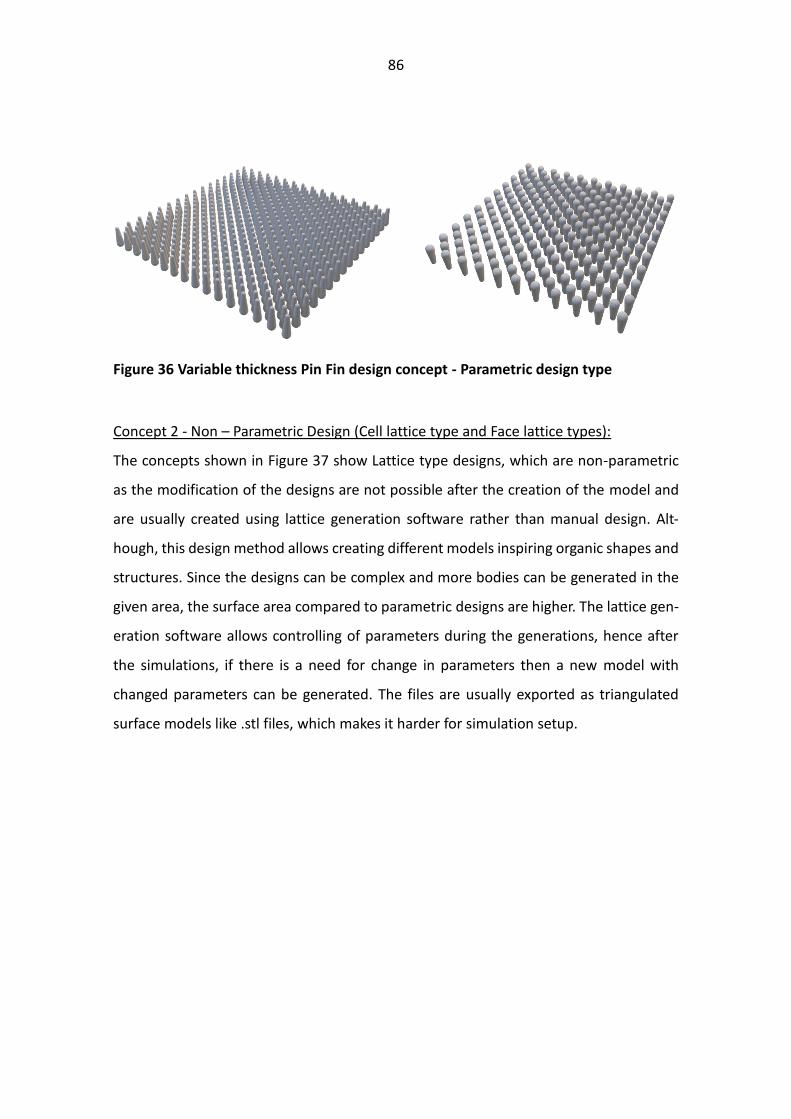
86
Figure 36 Variable thickness Pin Fin design concept - Parametric design type
Concept 2 - Non – Parametric Design (Cell lattice type and Face lattice types):
The concepts shown in Figure 37 show Lattice type designs, which are non-parametric
as the modification of the designs are not possible after the creation of the model and
are usually created using lattice generation software rather than manual design. Alt-
hough, this design method allows creating different models inspiring organic shapes and
structures. Since the designs can be complex and more bodies can be generated in the
given area, the surface area compared to parametric designs are higher. The lattice gen-
eration software allows controlling of parameters during the generations, hence after
the simulations, if there is a need for change in parameters then a new model with
changed parameters can be generated. The files are usually exported as triangulated
surface models like .stl files, which makes it harder for simulation setup.
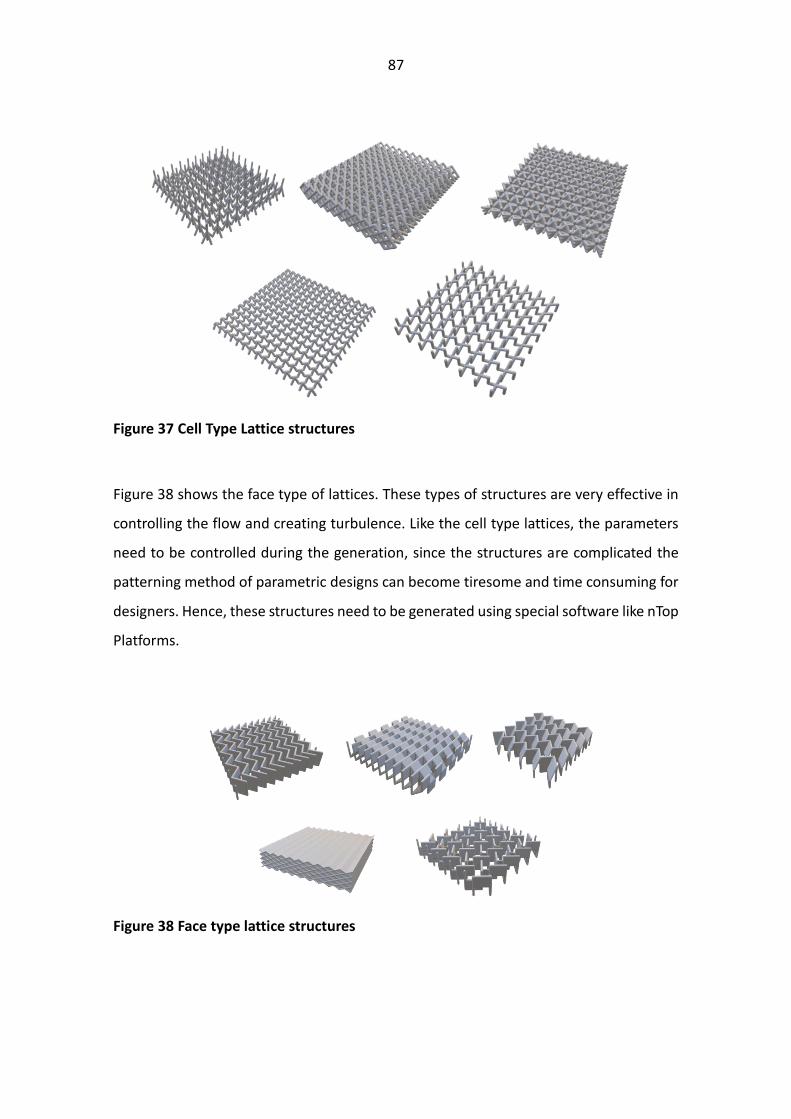
87
Figure 37 Cell Type Lattice structures
Figure 38 shows the face type of lattices. These types of structures are very effective in
controlling the flow and creating turbulence. Like the cell type lattices, the parameters
need to be controlled during the generation, since the structures are complicated the
patterning method of parametric designs can become tiresome and time consuming for
designers. Hence, these structures need to be generated using special software like nTop
Platforms.
Figure 38 Face type lattice structures
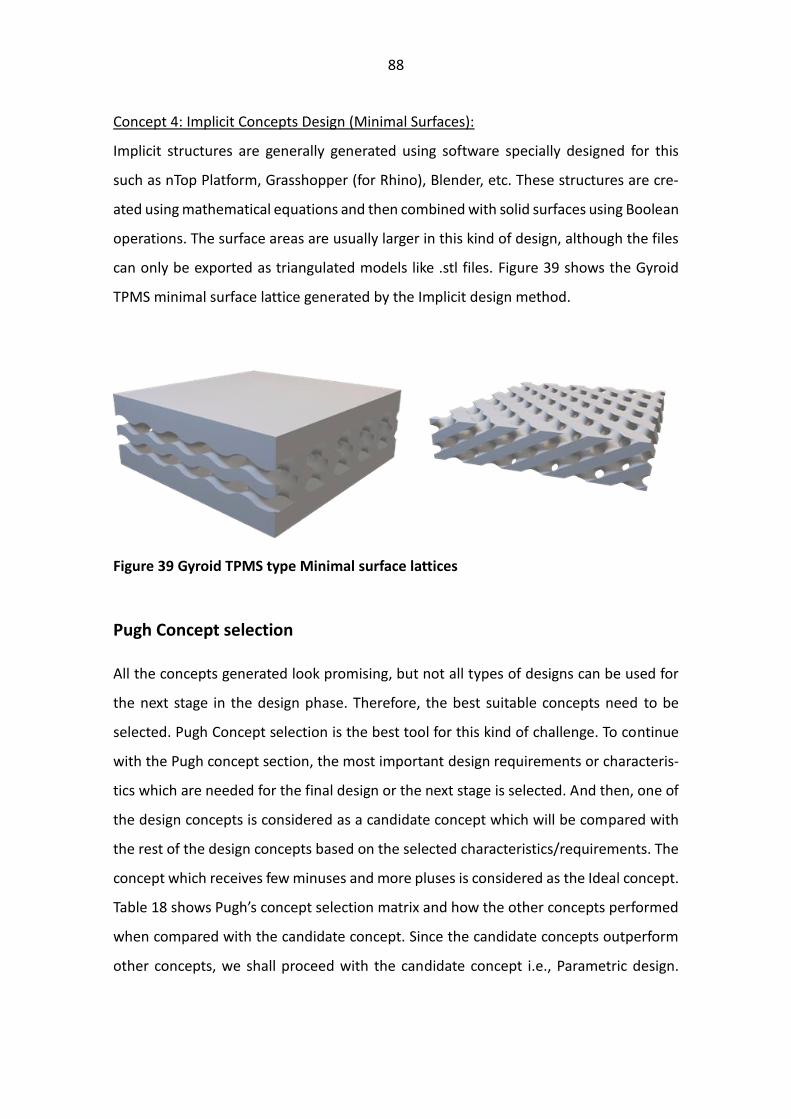
88
Concept 4: Implicit Concepts Design (Minimal Surfaces):
Implicit structures are generally generated using software specially designed for this
such as nTop Platform, Grasshopper (for Rhino), Blender, etc. These structures are cre-
ated using mathematical equations and then combined with solid surfaces using Boolean
operations. The surface areas are usually larger in this kind of design, although the files
can only be exported as triangulated models like .stl files. Figure 39 shows the Gyroid
TPMS minimal surface lattice generated by the Implicit design method.
Figure 39 Gyroid TPMS type Minimal surface lattices
Pugh Concept selection All the concepts generated look promising, but not all types of designs can be used for
the next stage in the design phase. Therefore, the best suitable concepts need to be
selected. Pugh Concept selection is the best tool for this kind of challenge. To continue
with the Pugh concept section, the most important design requirements or characteris-
tics which are needed for the final design or the next stage is selected. And then, one of
the design concepts is considered as a candidate concept which will be compared with
the rest of the design concepts based on the selected characteristics/requirements. The
concept which receives few minuses and more pluses is considered as the Ideal concept.
Table 18 shows Pugh’s concept selection matrix and how the other concepts performed
when compared with the candidate concept. Since the candidate concepts outperform
other concepts, we shall proceed with the candidate concept i.e., Parametric design.
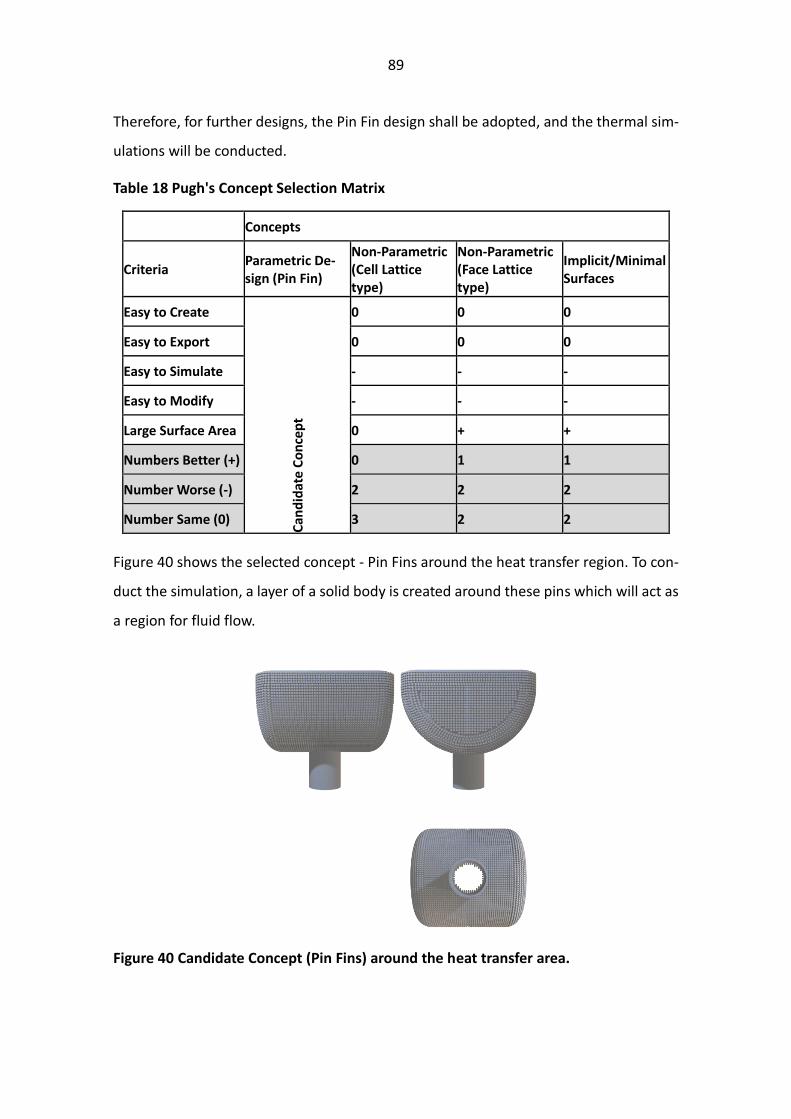
89
Therefore, for further designs, the Pin Fin design shall be adopted, and the thermal sim-
ulations will be conducted.
Table 18 Pugh's Concept Selection Matrix
Concepts
Criteria Parametric De-sign (Pin Fin)
Non-Parametric (Cell Lattice type)
Non-Parametric (Face Lattice type)
Implicit/Minimal Surfaces
Easy to Create C
and
idat
e C
on
cep
t 0 0 0
Easy to Export 0 0 0
Easy to Simulate - - -
Easy to Modify - - -
Large Surface Area 0 + +
Numbers Better (+) 0 1 1
Number Worse (-) 2 2 2
Number Same (0) 3 2 2
Figure 40 shows the selected concept - Pin Fins around the heat transfer region. To con-
duct the simulation, a layer of a solid body is created around these pins which will act as
a region for fluid flow.
Figure 40 Candidate Concept (Pin Fins) around the heat transfer area.
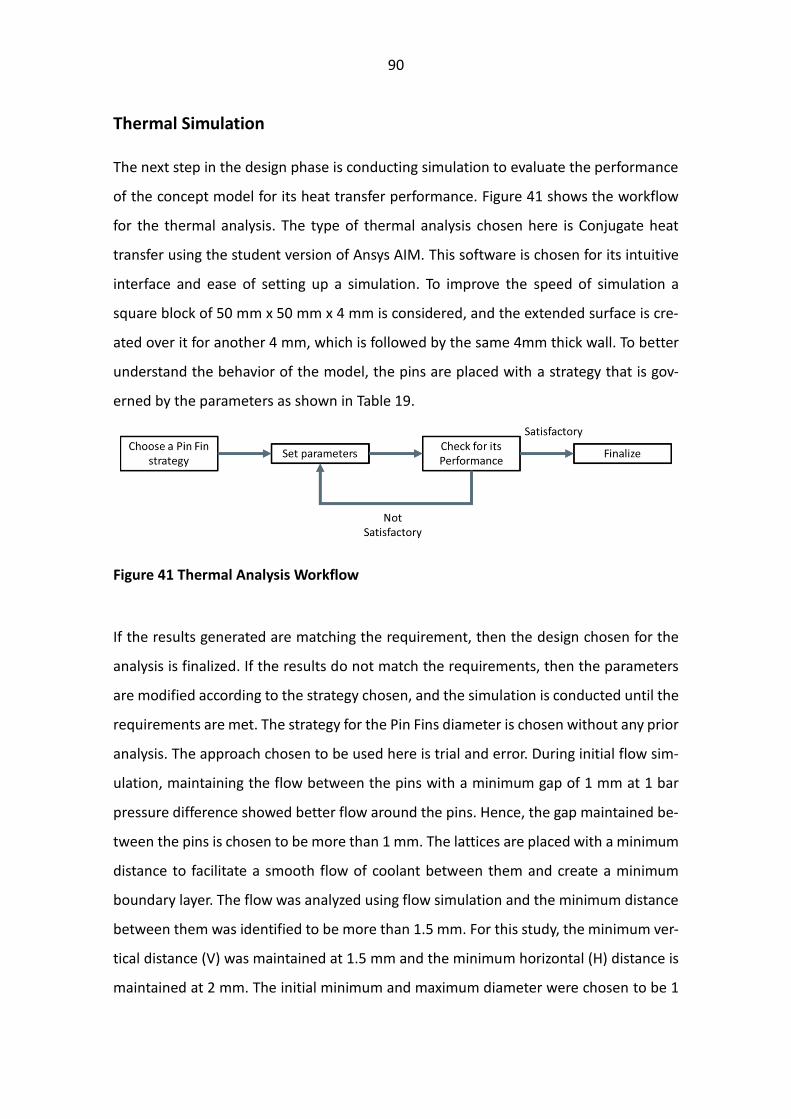
90
Thermal Simulation The next step in the design phase is conducting simulation to evaluate the performance
of the concept model for its heat transfer performance. Figure 41 shows the workflow
for the thermal analysis. The type of thermal analysis chosen here is Conjugate heat
transfer using the student version of Ansys AIM. This software is chosen for its intuitive
interface and ease of setting up a simulation. To improve the speed of simulation a
square block of 50 mm x 50 mm x 4 mm is considered, and the extended surface is cre-
ated over it for another 4 mm, which is followed by the same 4mm thick wall. To better
understand the behavior of the model, the pins are placed with a strategy that is gov-
erned by the parameters as shown in Table 19.
Figure 41 Thermal Analysis Workflow
If the results generated are matching the requirement, then the design chosen for the
analysis is finalized. If the results do not match the requirements, then the parameters
are modified according to the strategy chosen, and the simulation is conducted until the
requirements are met. The strategy for the Pin Fins diameter is chosen without any prior
analysis. The approach chosen to be used here is trial and error. During initial flow sim-
ulation, maintaining the flow between the pins with a minimum gap of 1 mm at 1 bar
pressure difference showed better flow around the pins. Hence, the gap maintained be-
tween the pins is chosen to be more than 1 mm. The lattices are placed with a minimum
distance to facilitate a smooth flow of coolant between them and create a minimum
boundary layer. The flow was analyzed using flow simulation and the minimum distance
between them was identified to be more than 1.5 mm. For this study, the minimum ver-
tical distance (V) was maintained at 1.5 mm and the minimum horizontal (H) distance is
maintained at 2 mm. The initial minimum and maximum diameter were chosen to be 1

91
mm and 1.5 mm, respectively. The maximum and minimum diameter of the variable lat-
tices is increased by 0.5 mm for 6 different trials. The goal is to predict the best physical
condition to achieve the required temperature near the heat source.
Figure 42 Lattice placement for the CHT simulation
Table 19 Pin Fin Placement Strategy
Strategy Desig-nation
Horizontal dis-tance (H)
Vertical Dis-tance (V)
Truncated Cone
Maximum Dia. Minimum Dia.
A 2 1.5 4 3.5
B 2 1.5 3.5 3
C 2 1.5 3 2.5
D 2 1.5 2.5 2
E 2 1.5 2 1.5
F 2 1.5 1.5 1
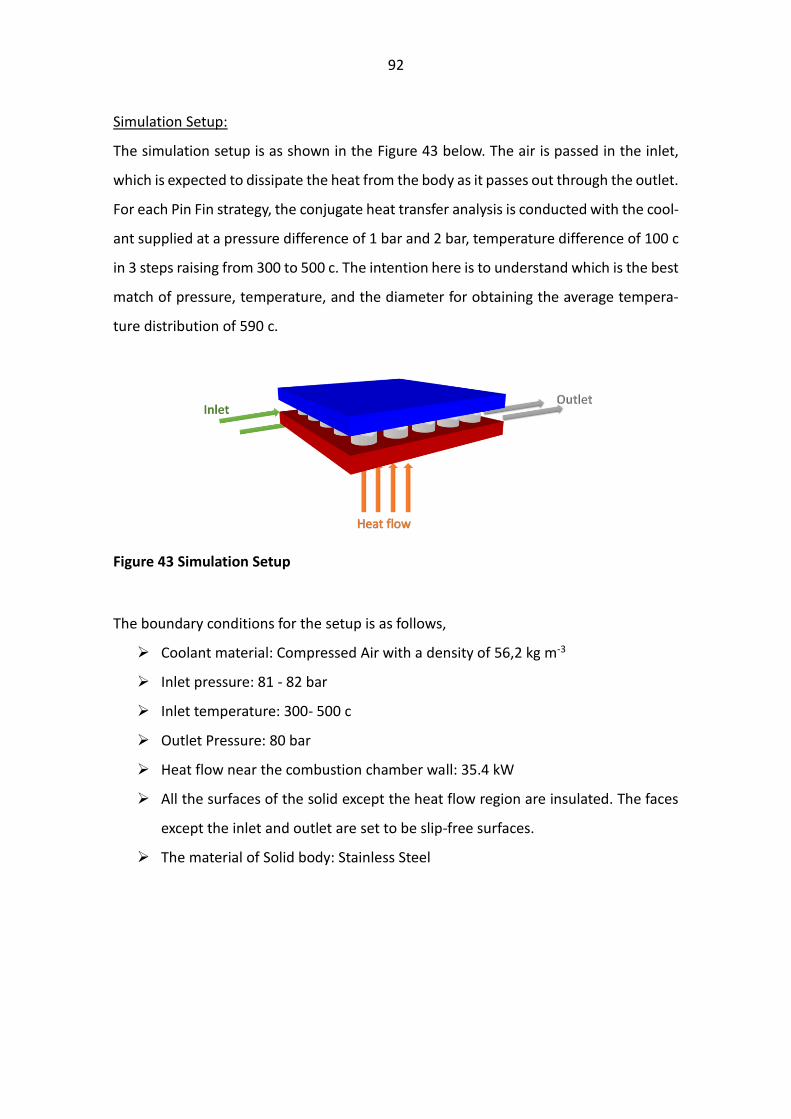
92
Simulation Setup:
The simulation setup is as shown in the Figure 43 below. The air is passed in the inlet,
which is expected to dissipate the heat from the body as it passes out through the outlet.
For each Pin Fin strategy, the conjugate heat transfer analysis is conducted with the cool-
ant supplied at a pressure difference of 1 bar and 2 bar, temperature difference of 100 c
in 3 steps raising from 300 to 500 c. The intention here is to understand which is the best
match of pressure, temperature, and the diameter for obtaining the average tempera-
ture distribution of 590 c.
Figure 43 Simulation Setup
The boundary conditions for the setup is as follows,
➢ Coolant material: Compressed Air with a density of 56,2 kg m-3
➢ Inlet pressure: 81 - 82 bar
➢ Inlet temperature: 300- 500 c
➢ Outlet Pressure: 80 bar
➢ Heat flow near the combustion chamber wall: 35.4 kW
➢ All the surfaces of the solid except the heat flow region are insulated. The faces
except the inlet and outlet are set to be slip-free surfaces.
➢ The material of Solid body: Stainless Steel

93
Results from the Thermal Analysis The results from each analysis are shown in the appendix in detail. But in order to un-
derstand the results better, pressure difference and temperature are paired. Therefore,
we get around 6 pairs of the combinations and 36 observations corresponding to the
pair and the average Pin Fin Strategy. The graphical representation of the data is easier
when there are fewer variables, hence the combination pairs are used to represent the
pairs of pressure difference and the temperature. The most significant observations from
the results are nothing but the average temperature around the heat flow region in the
model. Table 20 shows the temperature observation for different experiments con-
ducted using the simulation software.
Table 20 Results from the Thermal Simulations
Combina-tion names
Pressure Differ-ence (bar)
Inlet Tem-perature (c)
Temperature neat Heat Source Zone for differ-ent Pin Fin Strategy (c)
A B C D E F
P2_A 2 500 936 923 871 850 780 765
P2_B 2 400 865 862 825 815 694 669
P2_C 2 300 796 733 695 620 586 563
P1_A 1 500 1070 1010 982 906 829 812
P1_B 1 400 920 903 870 825 736 706
P1_C 1 300 850 859 805 760 652 627
The temperature near the heat source region for different simulation conditions is plot-
ted in the column chart as shown in Figure 44. The results show that the combination of
P2_C produces the lowest temperature near the heat source region. The P2_C combina-
tion corresponds to a pressure drop of 2 bar and temperature at the inlet as 300 c. Hence,
this is the right combination of the pressure, temperature, and diameter we were aiming
to find the research question. It can also be noted that the increase in surface area, a
decrease in inlet temperature, and an increase in pressure drop, gives better results.
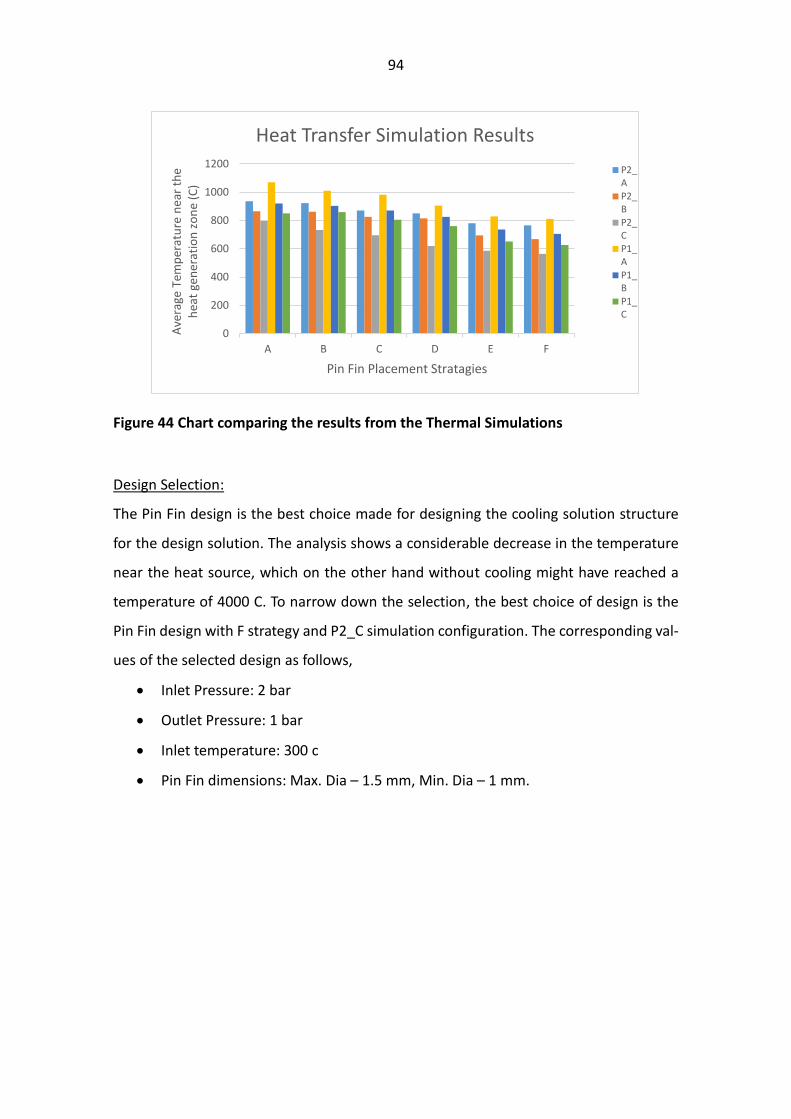
94
Figure 44 Chart comparing the results from the Thermal Simulations
Design Selection:
The Pin Fin design is the best choice made for designing the cooling solution structure
for the design solution. The analysis shows a considerable decrease in the temperature
near the heat source, which on the other hand without cooling might have reached a
temperature of 4000 C. To narrow down the selection, the best choice of design is the
Pin Fin design with F strategy and P2_C simulation configuration. The corresponding val-
ues of the selected design as follows,
• Inlet Pressure: 2 bar
• Outlet Pressure: 1 bar
• Inlet temperature: 300 c
• Pin Fin dimensions: Max. Dia – 1.5 mm, Min. Dia – 1 mm.
0
200
400
600
800
1000
1200
A B C D E F
Ave
rage
Tem
per
atu
re n
ear
the
hea
t ge
ner
atio
n z
on
e (C
)
Pin Fin Placement Stratagies
Heat Transfer Simulation Results
P2_AP2_BP2_CP1_AP1_BP1_C
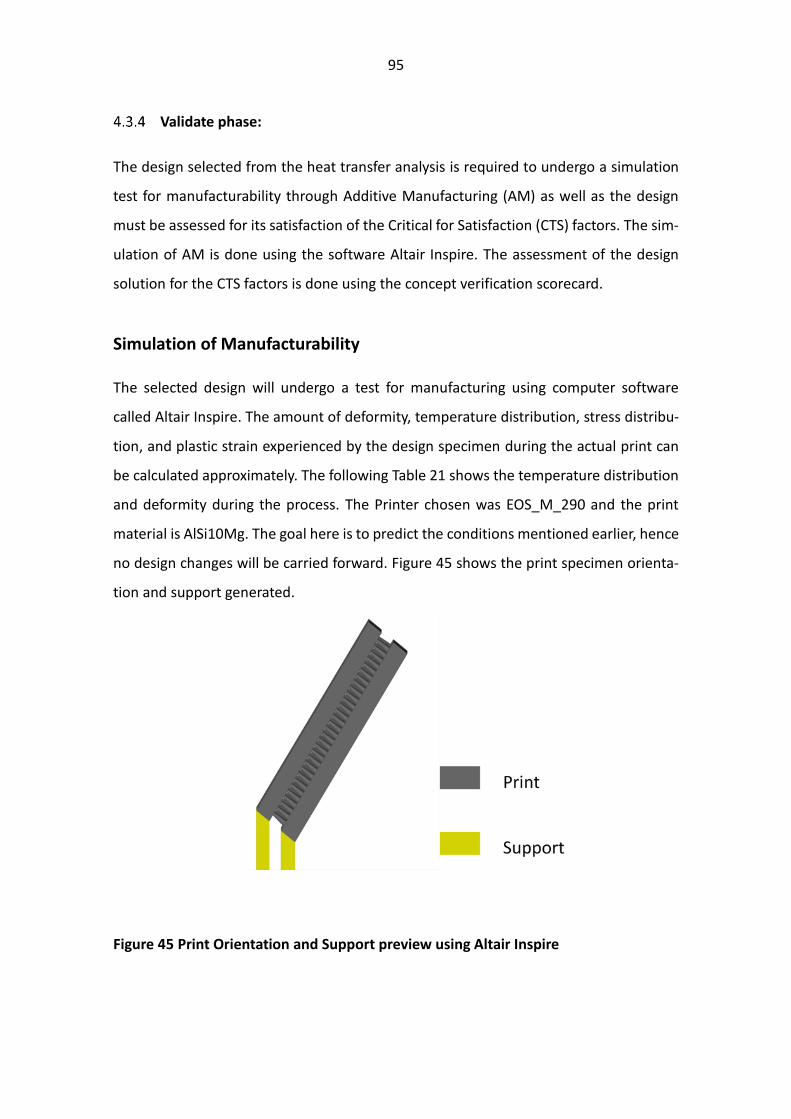
95
Validate phase:
The design selected from the heat transfer analysis is required to undergo a simulation
test for manufacturability through Additive Manufacturing (AM) as well as the design
must be assessed for its satisfaction of the Critical for Satisfaction (CTS) factors. The sim-
ulation of AM is done using the software Altair Inspire. The assessment of the design
solution for the CTS factors is done using the concept verification scorecard.
Simulation of Manufacturability The selected design will undergo a test for manufacturing using computer software
called Altair Inspire. The amount of deformity, temperature distribution, stress distribu-
tion, and plastic strain experienced by the design specimen during the actual print can
be calculated approximately. The following Table 21 shows the temperature distribution
and deformity during the process. The Printer chosen was EOS_M_290 and the print
material is AlSi10Mg. The goal here is to predict the conditions mentioned earlier, hence
no design changes will be carried forward. Figure 45 shows the print specimen orienta-
tion and support generated.
Figure 45 Print Orientation and Support preview using Altair Inspire
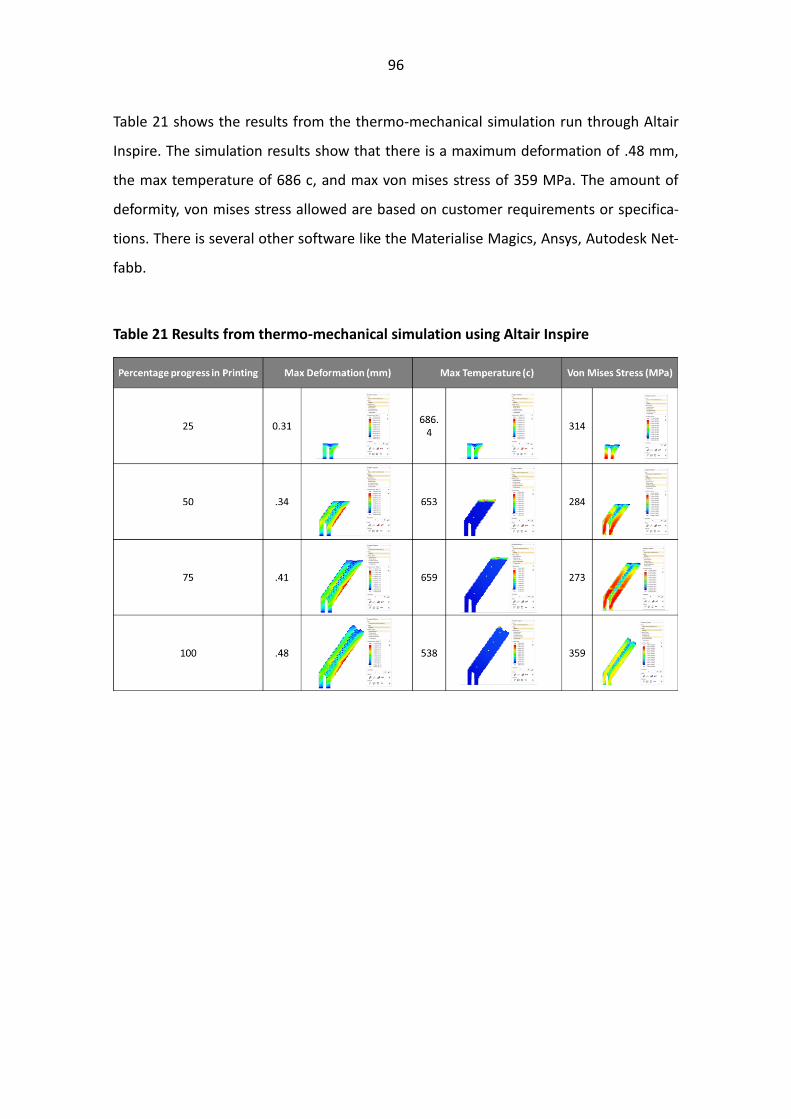
96
Table 21 shows the results from the thermo-mechanical simulation run through Altair
Inspire. The simulation results show that there is a maximum deformation of .48 mm,
the max temperature of 686 c, and max von mises stress of 359 MPa. The amount of
deformity, von mises stress allowed are based on customer requirements or specifica-
tions. There is several other software like the Materialise Magics, Ansys, Autodesk Net-
fabb.
Table 21 Results from thermo-mechanical simulation using Altair Inspire
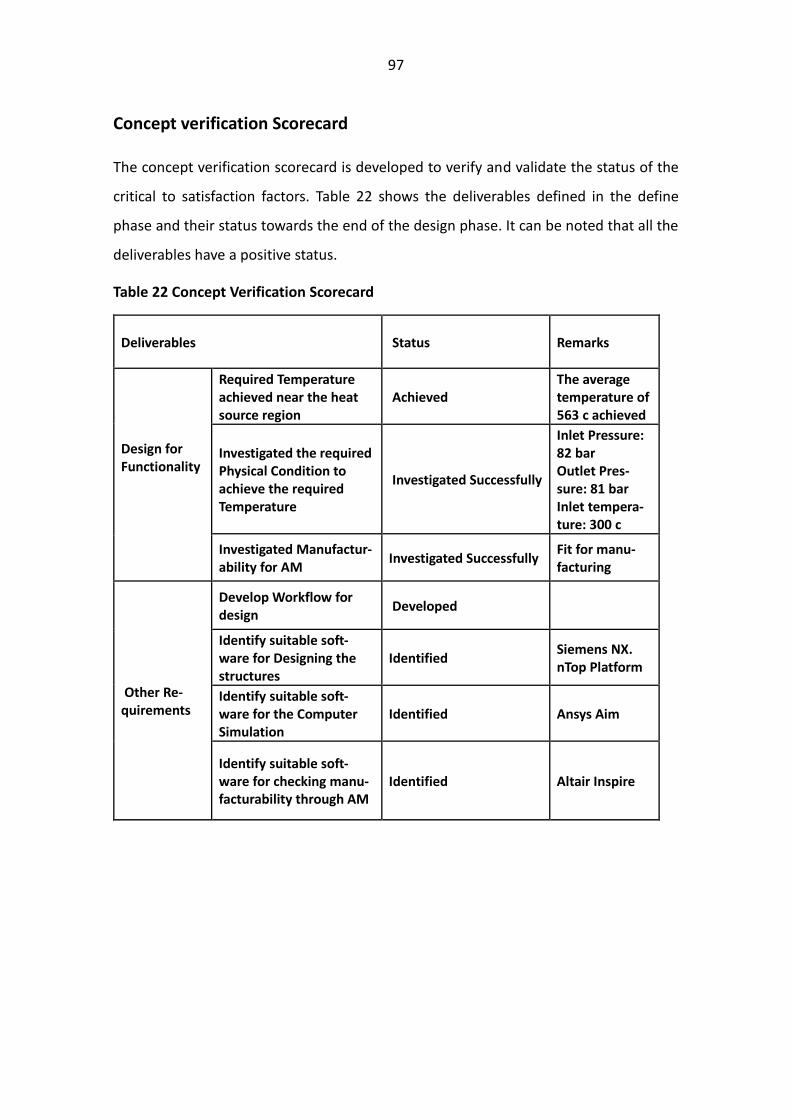
97
Concept verification Scorecard The concept verification scorecard is developed to verify and validate the status of the
critical to satisfaction factors. Table 22 shows the deliverables defined in the define
phase and their status towards the end of the design phase. It can be noted that all the
deliverables have a positive status.
Table 22 Concept Verification Scorecard
Deliverables Status Remarks
Design for Functionality
Required Temperature achieved near the heat source region
Achieved The average temperature of 563 c achieved
Investigated the required Physical Condition to achieve the required Temperature
Investigated Successfully
Inlet Pressure: 82 bar Outlet Pres-sure: 81 bar Inlet tempera-ture: 300 c
Investigated Manufactur-ability for AM
Investigated Successfully Fit for manu-facturing
Other Re-quirements
Develop Workflow for design
Developed
Identify suitable soft-ware for Designing the structures
Identified Siemens NX. nTop Platform
Identify suitable soft-ware for the Computer Simulation
Identified Ansys Aim
Identify suitable soft-ware for checking manu-facturability through AM
Identified Altair Inspire
98
4.4 Conclusions from the workflows for design and simulation
The CAD design (and modeling) of lattice structures and minimal surfaces by manual
design require comparatively more man-hours compared to the generation of the design
based on the parameters by a dedicated software or software feature. Although, the
generated structures cannot be called a parametric model as these models cannot be
modified later, instead a new set of the structure is to be generated and replaced with
modified parameters. For the design process involving multiple iterations for the design
and test cycle, the non-parametric models are not a good choice.
The computer simulations of both the parametric and non-parametric models were con-
ducted. The models with a solid body and lesser triangulation were successful, however,
models imported as .stl and having higher triangulation, the simulation time was com-
paratively higher. The simulation of the gyroid structure which was imported as .stl files
did not go through. During the simulation of the Gyroid (.stl) file, the resource monitor
feature of Windows 10 was run and analyzed, the RAM consumption was 100 %. There-
fore, it was concluded that the meshing method chosen was wrong or the triangulation
was higher which consumed more RAM resources. Since the goal of the case study was
to find the right physical condition for achieving the temperature, the models which
were easy to simulate were chosen.
99
5 Discussion and Conclusion
5.1 Conclusion
This study successfully demonstrated the challenges and limitations of the CAD and CAE
software selected for the study. This is done by exploring the features of the selected
software during the year of the thesis work. The important outcomes of the study are
written in the following paragraphs. There might be some limitations in the study due to
the author's knowledge and experience with the software used and the methodology
followed for design and simulation. However, the weaknesses or criticism highlighted
here are strong points for the engineering designers and industries to consider during
their endeavor of product development or manufacturing with the help of Additive Man-
ufacturing. And for the software developers, this would be a design challenge to accel-
erate their growth in the market by providing better design and simulation solutions tai-
lored for AM processes.
Research questions,
1. What is the optimal workflow for designing a metal component for heat transfer
produced by Additive Manufacturing technology?
The optimal workflow for designing a metal component, which is to be printed using AM
is shown in the flow chart (Figure 46). The recommendation for the designer while de-
signing a component are,
Before the design process,
❖ Collect the information about the printer used for manufacturing the component.
This information is necessary while considering DfAM guidelines and principles.
➢ The parameters of the design principles vary from printer to printer, although
most types of printers follow similar design principles.
❖ Collect the information about the final requirements of the design.
➢ For example: For a finer surface finish, the design may undergo post-processing.
Therefore, knowing the final requirements helps the designer understand the
support generation of the design and additional tolerances required.
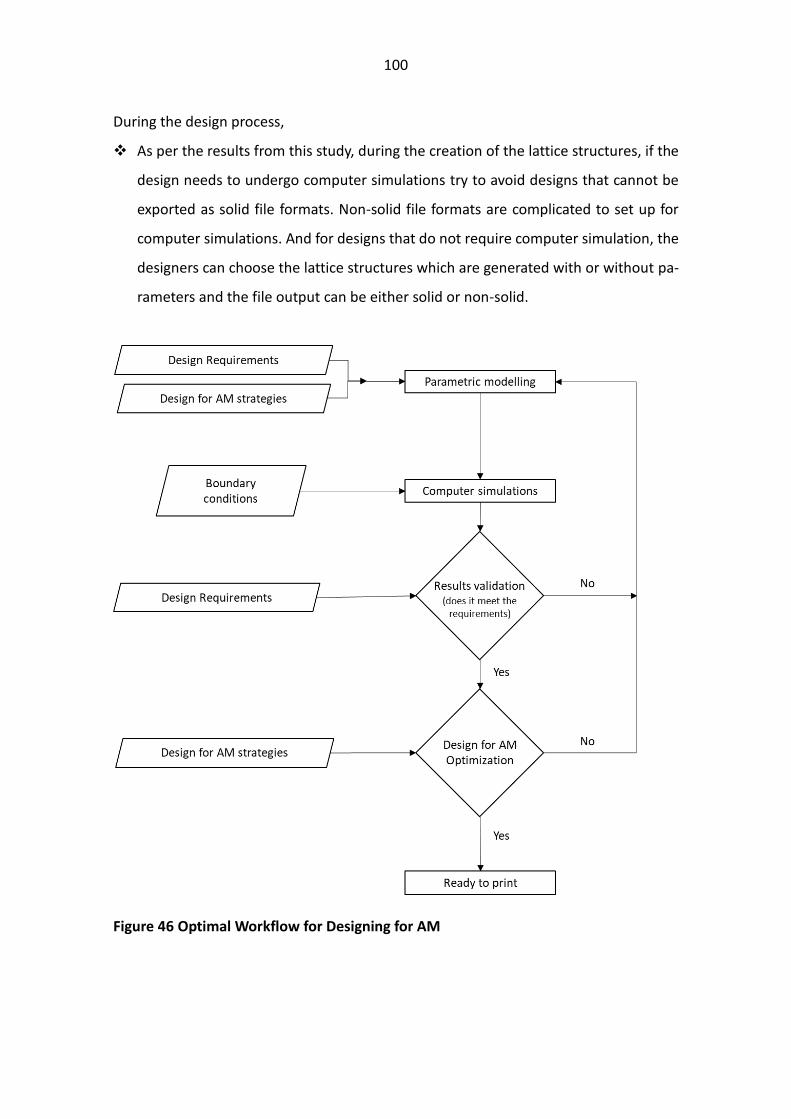
100
During the design process,
❖ As per the results from this study, during the creation of the lattice structures, if the
design needs to undergo computer simulations try to avoid designs that cannot be
exported as solid file formats. Non-solid file formats are complicated to set up for
computer simulations. And for designs that do not require computer simulation, the
designers can choose the lattice structures which are generated with or without pa-
rameters and the file output can be either solid or non-solid.
Figure 46 Optimal Workflow for Designing for AM
101
2. What are the challenges faced by the designers while designing for Additive Man-
ufacturing in terms of the current software capabilities?
The software chosen for answering the research questions are very powerful. Their ca-
pabilities are exceptional when compared to other commercially available software in
the market. However, to gain the complete benefit of the AM the design software must
include features that can give feedback on the design concerning design principles of the
AM. Due to the lack of such features in the software, the designing task enters multiple
loops of design and validation for DfAM. Therefore, reducing the productivity and effi-
ciency of the design engineers. Furthermore, from this study, it was observed that the
software behaves with lag and slow response as the complexity of the geometries and
file size of the design increases. This discourages the designers to try the complex lattice
structures in their designs. Therefore, reducing the intuition of the design engineers to
work around with the principles of AM and instead force them to use standard and sim-
ple designs. In addition to this, there are only a few softwares that provide easy exchange
of CAD data. This issue increases the complexity of workflow for using the CAD files from
one software to another. Hence considering the software, which is capable of generating
Lattice structures parametrically, it would be good to have a feature that can export the
generated geometries into neutral CAD file formats
3. Can lattice structures with complex geometries be designed by conventional CAD
software?
The answer is yes. The software used to answer this question is Siemens NX which has
the capability to create cellular/lattice structures. However, a faster generation of lattice
requires considerably high-end computer hardware in terms of processing power,
graphics, and RAM. For lower tessellation factor (which creates a better surface of the
lattice), the lattice generation takes more time depending upon the number of lattices
and complexity.
On the other hand, the nTop Platform, which is a software designed for implicit modeling
and lattice creation, is very efficient in creating the lattice structures with the faster
102
generation of lattice structures as compared to Siemens NX and it can also generate min-
imal surfaces with faster speed. The major disadvantage of both the software is they
cannot export the lattice structure files into a solid file format.
4. Can lattice structures be simulated for thermal load behavior using computa-
tional software?
The software used to answer the question is Ansys AIM. Yes, the computational software
allows simulation of lattice structures. Having said that, the time for setting up the sim-
ulation and running the calculation increases with the increase of the complexity of the
geometry. Therefore, methods like topology optimization would be a better option to
create lattice structures or organic structures for AM parts. In addition to this, for simu-
lating complex lattice structures, integrating the nTop Platform or similar software into
the workflow can improve the meshing efficiency. nTop Platform (version 2.4.5), has fea-
tures to create the nodes for boundary conditions and export them to most well estab-
lished simulation software. Hence, this makes it easier to apply boundary conditions for
complicated triangulated surfaces.
103
5.2 Discussion
Additive Manufacturing is gaining importance in both the product development stage
and the product manufacturing stage. The manufacturing constraints raised by subtrac-
tive and formative methods in terms of manufacturing complex structures are lifted by
AM. These structures which facilitate lightweight, high performance, and high strength
to weight ratio can be manufactured and used in a wide range of engineering applica-
tions. The DfAM increases efficiency and reduces uncertainties in both the designing
stage and manufacturing stage of AM with the help of its principles, rules, and guidelines.
However, the new challenge lies in designing these structures according to the require-
ment such as matching the mechanical or thermal load, weight, and strength require-
ments. For design engineers who have worked on designing components for conven-
tional manufacturing, the task of designing for AM becomes demanding. Therefore,
most CAD software has considered adding features related to AM such as Lattice struc-
tures, Support generations, and Topology Optimization. Training and creating awareness
about the available software, their workflow, and best practices in implementing DfAM
improves the designer's productivity and efficiency.
For the mechanical designers and the design managers who are planning to make use of
AM Technology, the following recommendations may be beneficial.
1. Engineering Design- CAD
From the study, it can be noted that the software-based parametric generation of lattice
structures and minimal surfaces is easier. In contrast, the manual creation/modeling of
these surfaces is time-consuming and inefficient. Depending upon the activity in the
downstream, the choice of method for creating these structures should be chosen.
2. Engineering Design- CAE
From the investigation made through this study, it can be concluded that for computer
simulations, the best choice of the input format is a solid file (STEP or IGES). Hence, the
recommended approach is using a parametric design that allows exporting the files into
solid file formats. Solid file formats are easy to set up and simulate, compared to surface
file formats like STL. Nevertheless, software like the nTop Platform allows the generation
104
of lattice structures and also allows simulations. As of April 23, 2020, the version 2.4.5
supports mechanical analysis like linear static, modal, and buckling structural and steady-
state thermal analysis.
3. DFSS methodology for DFAM
It can be noted from the study, that the integration of Design for Six Sigma methodology
streamlines the design flow. During the design process for AM, there are several param-
eters that are intrinsic to AM. DFSS tools such as AHP and Pugh’s concept selection ma-
trix as shown in the case study can play a major role in data-driven decision- making.
Therefore, to reduce the complications and uncertainty, integration of DFSS is recom-
mended.
5.3 Scope for Future work
For future works, the research can be extended with a detailed study on developing a
workflow for specific methods of DfAM such as Part Consolidation, Topology optimiza-
tion, Lattice structures, and Multi-Material design. The study can be further narrowed
down by choosing a software platform and understanding the workflow and developing
best practices. The research output can be presented as a database of guidelines and
workflow which will be a support for the mechanical designer to design for Additive
Manufacturing.
105
References
3Dprinting, M. a G. : (2018). Modeling a Gyroid : 3Dprinting.
https://www.reddit.com/r/3Dprinting/comments/858ypy/modeling_a_gyroid/
Adam, G. A. O., & Zimmer, D. (2014). Design for Additive Manufacturing-Element
transitions and aggregated structures. CIRP Journal of Manufacturing Science and
Technology, 7(1), 20–28. https://doi.org/10.1016/j.cirpj.2013.10.001
Ansys, I. (2006). Heat Transfer Modeling.
https://www.academia.edu/3196299/ANSYS_Fluent_-_Heat_Transfer_Modeling
Ansys, I. (2016). ANSYS AIM Simulation for Every Engineer. https://www.ansys.com/-
/media/ansys/corporate/resourcelibrary/brochure/ansys-aim-brochure.pdf
Antony, J. (2011). Six Sigma vs Lean: Some perspectives from leading academics and
practitioners. International Journal of Productivity and Performance Management,
60(2), 185–190. https://doi.org/10.1108/17410401111101494
Asad, U., Chakrabarty, A., & Chuan, T. K. (2006). Comparative Study of DFSS in Product
and Service Innovation. Asian Network for Quality Congress.
https://eprints.qut.edu.au/47097/1/Comparative_Study_of_DFSS_in_Product_an
d_Service_Innovations.pdf
Bahman, A. S., & Iannuzzo, F. (2018). Computer-aided engineering simulations. In Wide
Bandgap Power Semiconductor Packaging (pp. 199–223). Elsevier.
https://doi.org/10.1016/B978-0-08-102094-4.00010-4
Balubaid, M., & Alamoudi, R. (2015). Application of the Analytical Hierarchy Process (AHP)
to Multi-Criteria Analysis for Contractor Selection. American Journal of Industrial
and Business Management, 05(09), 581–589.
https://doi.org/10.4236/ajibm.2015.59058
Bäßler, R. (2018). Review: Additive manufacturing of metals – From fundamental
technology to rocket nozzles, medical implants, and custom jewelry. In Materials
and Corrosion. https://doi.org/10.1002/maco.201870124
Bauelas, R., & Antony, J. (2004). Six sigma or design for six sigma? TQM Magazine, 16(4),
250–263. https://doi.org/10.1108/09544780410541909
Bell, E., Bryman, A., & Harley, B. (2018). Business research methods. Oxford university
106
press.
Bendsoe, M. P., & Sigmund, O. (2013). Topology optimization: theory, methods, and
applications. Springer Science & Business Media.
Bikas, H., Lianos, A. K., & Stavropoulos, P. (2019). A design framework for additive
manufacturing. International Journal of Advanced Manufacturing Technology,
103(9–12), 3769–3783. https://doi.org/10.1007/s00170-019-03627-z
Bikas, H., Stavropoulos, P., & Chryssolouris, G. (2016). Additive manufacturing methods
and modeling approaches: A critical review. International Journal of Advanced
Manufacturing Technology, 83(1–4), 389–405. https://doi.org/10.1007/s00170-
015-7576-2
Bilalis, D. N. (2000). COMPUTER AIDED DESIGN-CAD.
http://dl.icdst.org/pdfs/files/ed22bd8e464c6ad75ff352f0d14f83c6.pdf
Bonatti, C., & Mohr, D. (2019). Mechanical performance of additively-manufactured
anisotropic and isotropic smooth shell-lattice materials: Simulations & experiments.
Journal of the Mechanics and Physics of Solids, 122, 1–26.
https://doi.org/10.1016/j.jmps.2018.08.022
Boyard, N., Rivette, M., Christmann, O., & Richir, S. (2014a). A design methodology for
parts using Additive Manufacturing. High Value Manufacturing: Advanced Research
in Virtual and Rapid Prototyping - Proceedings of the 6th International Conference
on Advanced Research and Rapid Prototyping, VR@P 2013, 399–404.
https://doi.org/10.1201/b15961-74
Boyard, N., Rivette, M., Christmann, O., & Richir, S. (2014b). A design methodology for
parts using Additive Manufacturing. High Value Manufacturing: Advanced Research
in Virtual and Rapid Prototyping - Proceedings of the 6th International Conference
on Advanced Research and Rapid Prototyping, VR@P 2013, 399–404.
https://doi.org/10.1201/b15961-74
Brue, G., & Launsby, R. (2003). Design for Six Sigma. McGraw-Hill Education.
https://books.google.com/books?id=Ao9j1KChMgYC
Bryman, A. (2016). Social research methods. Oxford university press.
Burge, S., & Churchill, W. (2009). The Systems Engineering Tool Box “Give us the tools and
107
we will finish the job.”
Camba, J. D., Contero, M., & Company, P. (2016). Computer-Aided Design Parametric CAD
modeling : An analysis of strategies for design reusability. Computer-Aided Design,
74, 18–31. https://doi.org/10.1016/j.cad.2016.01.003
Chang, K.-H. (2014). Design Theory and Methods Using CAD/CAE : The Computer Aided
Engineering Design Series. Elsevier Science & Technology.
http://ebookcentral.proquest.com/lib/tritonia-
ebooks/detail.action?docID=1813980
Charles, A., Elkaseer, A., Thijs, L., Hagenmeyer, V., & Scholz, S. (2019). Effect of process
parameters on the generated surface roughness of down-facing surfaces in
selective laser melting. Applied Sciences (Switzerland), 9(6), 1–13.
https://doi.org/10.3390/app9061256
Chua, C. K., Wong, C. H., & Yeong, W. Y. (2017a). Chapter Four - Software and Data Format
(C. K. Chua, C. H. Wong, & W. Y. B. T.-S. Yeong Quality Control, and Measurement
Sciences in 3D Printing and Additive Manufacturing (eds.); pp. 75–94). Academic
Press. https://doi.org/https://doi.org/10.1016/B978-0-12-813489-4.00004-0
Chua, C. K., Wong, C. H., & Yeong, W. Y. (2017b). Chapter Four - Software and Data Format
(C. K. Chua, C. H. Wong, & W. Y. B. T.-S. Yeong Quality Control, and Measurement
Sciences in 3D Printing and Additive Manufacturing (eds.); pp. 75–94). Academic
Press. https://doi.org/https://doi.org/10.1016/B978-0-12-813489-4.00004-0
Cooper, R. G., & Kleinschmidt, E. J. (2007). Winning businesses in product development:
The critical success factors. Research Technology Management, 50(3), 52–66.
https://doi.org/10.1080/08956308.2007.11657441
Crowell, A. R., Miller, B. A., & McNamara, J. J. (2014). Robust and efficient treatment of
temperature feedback in fluid–thermal–structural analysis. AIAA Journal, 52(11),
2395–2413.
Cudney, E. A., & Furterer, S. L. (2016). Design for Six Sigma in Product and Service
Development. In E. A. Cudney & S. L. Furterer (Eds.), Design for Six Sigma in Product
and Service Development. CRC Press. https://doi.org/10.1201/b12090
Dancel, R. (2019). Case Study Paper on Additive Manufacturing ( 3D Printing Technology ).
108
Philosophy of Technology, April. https://doi.org/10.13140/RG.2.2.32535.21924
Dechaumphai, P., Thornton, E. A., & Wieting, A. R. (1989). Flow-thermal-structural study
of aerodynamically heated leading edges. Journal of Spacecraft and Rockets, 26(4),
201–209.
Dekier, Ł. (2012). Th e Origins and Evolution of Lean Management System. Journal of
International Studies, 5(1), 46–51. https://watermark.silverchair.com/55-1-
49.pdf?token=AQECAHi208BE49Ooan9kkhW_Ercy7Dm3ZL_9Cf3qfKAc485ysgAAA
ncwggJzBgkqhkiG9w0BBwagggJkMIICYAIBADCCAlkGCSqGSIb3DQEHATAeBglghkgB
ZQMEAS4wEQQMV2uEsMHhcN6u5ChIAgEQgIICKpeDlr1PoG0MfOQX9w386gIDAA
atTqjcqelRm4b1QoEHqL7
Diegel, O., Nordin, A., & Motte, D. (2019). A Practical Guide to Design for Additive
Manufacturing. https://doi.org/10.1007/978-981-13-8281-9
Dimitrov, L., & Valchkova, F. (2011). Problems with 3D data exchange between CAD
systems using neutral formats. Proceedings in Manufacturing Systems, 6(3).
Dong, L., Fang, Y., Lin, W., & Seah, H. S. (2015). Perceptual Quality Assessment for 3D
Triangle Mesh Based on Curvature. IEEE Transactions on Multimedia, 17(12), 2174–
2184. https://doi.org/10.1109/TMM.2015.2484221
Dorfman, A. S. (2010). Conjugate Problems in Convective Heat Transfer. Taylor and
Francis Group, LLC.
Doubrovski, E. L., Verlinden, J. C., & Horvath, I. (2012). First steps towards collaboratively
edited design for additive manufacturing knowledge. 23rd Annual International
Solid Freeform Fabrication Symposium - An Additive Manufacturing Conference, SFF
2012, 891–901.
Du, W. (2017). Imece2017-70344 Binder Jetting Additive Manufacturing of Ceramics : a
Literature. 1–12.
Fong, P. S. W., & Choi, S. K. Y. (2000). Final contractor selection using the analytical
hierarchy process. Construction Management and Economics, 18(5), 547–557.
https://doi.org/10.1080/014461900407356
Furukawa, Y., & Yamauchi, S. (2018a). Technologies of a cooling device for power
semiconductor. In Wide Bandgap Power Semiconductor Packaging: Materials,
109
Components, and Reliability (pp. 111–126). Elsevier. https://doi.org/10.1016/B978-
0-08-102094-4.00007-4
Furukawa, Y., & Yamauchi, S. (2018b). Technologies of a cooling device for power
semiconductor. In Wide Bandgap Power Semiconductor Packaging: Materials,
Components, and Reliability (pp. 111–126). Elsevier. https://doi.org/10.1016/B978-
0-08-102094-4.00007-4
Gardan, J. (2016). Additive manufacturing technologies: State of the art and trends.
International Journal of Production Research, 54(10), 3118–3132.
https://doi.org/10.1080/00207543.2015.1115909
Gebhardt, A., & Hötter, J.-S. (2016). Additive Manufacturing: 3D Printing for Prototyping
and Manufacturing. In Hanser (Vol. 35, Issue 3).
http://search.ebscohost.com/login.aspx?direct=true&db=bwh&AN=96225499&la
ng=pt-br&site=ehost-live
Gerber, G., & Barnard, L. (2008). Designing for laser sintering. Journal for New Generation
Sciences, 6(2), 47–59.
Gibson, I., Rosen, D., & Stucker, B. (2015). Material Jetting BT - Additive Manufacturing
Technologies: 3D Printing, Rapid Prototyping, and Direct Digital Manufacturing (I.
Gibson, D. Rosen, & B. Stucker (eds.); pp. 175–203). Springer New York.
https://doi.org/10.1007/978-1-4939-2113-3_7
Goepel, K. D. (2018a). Implementation of an Online Software Tool for the Analytic
Hierarchy Process (AHP-OS). International Journal of the Analytic Hierarchy Process,
10(3), 469–487. https://doi.org/10.13033/ijahp.v10i3.590
Goepel, K. D. (2018b). Implementation of an Online Software Tool for the Analytic
Hierarchy Process (AHP-OS). International Journal of the Analytic Hierarchy Process,
10(3), 469–487. https://doi.org/10.13033/ijahp.v10i3.590
Gonzalez-Gutierrez, J., Cano, S., Schuschnigg, S., Kukla, C., Sapkota, J., & Holzer, C. (2018).
Additive manufacturing of metallic and ceramic components by the material
extrusion of highly-filled polymers: A review and future perspectives. Materials,
11(5). https://doi.org/10.3390/ma11050840
Gornet, T. T. W. (2017). History of Additive Manufacturing (pp. 1–24).
110
https://doi.org/10.4018/978-1-5225-2289-8.ch001
Groover, M., & Zimmers, E. (1983). CAD/CAM: computer-aided design and
manufacturing. Pearson Education.
Haarburger, P., Roschkowski, M., & Manglani, V. (2019). Formnext and Wohlers
Associates bring together investors and additive manufacturing.
https://wohlersassociates.com/investor-dinner.html
Hague, R., Mansour, S., & Saleh, N. (2004). Material and design considerations for Rapid
Manufacturing. International Journal of Production Research, 42(22), 4691–4708.
https://doi.org/10.1080/00207840410001733940
Hällgren, S., Pejryd, L., & Ekengren, J. (2016). 3D data export for Additive Manufacturing
- improving geometric accuracy. Procedia CIRP, 50, 518–523.
https://doi.org/10.1016/j.procir.2016.05.046
Hamri, O., Léon, J. C., Giannini, F., & Falcidieno, B. (2010). Computer aided design and
finite element simulation consistency. Strojniski Vestnik/Journal of Mechanical
Engineering, 56(11), 728–743. https://doi.org/10.5545/153_DOI_not_assigned
Han, S. C., Lee, J. W., & Kang, K. (2015). A New Type of Low Density Material: Shellular.
Advanced Materials, 27(37), 5506–5511.
https://doi.org/10.1002/adma.201501546
Hauser, J. R., & Clausings, D. (1996). The house of quality. Harvard Business Review.
https://hbr.org/1988/05/the-house-of-quality
Huang, T., Mao, G., Jiang, G., & Zhou, W. (2000). Two dimensional coupled flow-thermal-
structural numerical simulation. Acta Aerodynamica Sinica, 18(1), 115–119.
Hull, C. W. (1984). United States Patent (19) Hull (54) (75) (73) 21) 22 (51) 52) (58) (56)
APPARATUS FOR PRODUCTION OF THREE-DMENSONAL OBJECTS BY STEREO
THOGRAPHY.
Hussein, A., Hao, L., Yan, C., Everson, R., & Young, P. (2013). Advanced lattice support
structures for metal additive manufacturing. Journal of Materials Processing
Technology, 213(7), 1019–1026. https://doi.org/10.1016/j.jmatprotec.2013.01.020
Ida, G., & Jean-Baptiste, F. (2012). Design for Six Sigma and lean product development.
International Journal of Lean Six Sigma, 3(1), 45–58.
111
https://doi.org/10.1108/20401461211223722
Inc., W. A. (2020). SME Announces Insights on Additive Manufacturing for Investors by
Wohlers Associates at RAPID + TCT 2020.
https://wohlersassociates.com/press81.html
ISO/ASTM-52900. (2017). Additive manufacturing - General principles - Terminology
(ISO/ASTM 52900:2015). https://www.iso.org/obp/ui/#iso:std:iso-
astm:52900:dis:ed-2:v1:en
Jayathirtha, R. A. (2013). Barriers for implementation of Six Sigma by Small and Medium
Enterprises *. International Journal of Advancements in Research & Technology, 2.
Jenab, K., Wu, C., & Moslehpour, S. (2018). Design for six sigma: A review. Management
Science Letters, 8(1), 1–18. https://doi.org/10.5267/j.msl.2017.11.001
Jiang, J., & Xu, X. (2018). Support Structures for Additive Manufacturing : A Review.
https://doi.org/10.3390/jmmp2040064
John, B., Senthilkumar, P., & Sadasivan, S. (2019a). Applied and Theoretical Aspects of
Conjugate Heat Transfer Analysis: A Review. Archives of Computational Methods in
Engineering, 26(2), 475–489. https://doi.org/10.1007/s11831-018-9252-9
John, B., Senthilkumar, P., & Sadasivan, S. (2019b). Applied and Theoretical Aspects of
Conjugate Heat Transfer Analysis: A Review. Archives of Computational Methods in
Engineering, 26(2), 475–489. https://doi.org/10.1007/s11831-018-9252-9
Joo, Y., Lee, I., & Kim, S. J. (2018). Efficient three-dimensional topology optimization of
heat sinks in natural convection using the shape-dependent convection model.
International Journal of Heat and Mass Transfer, 127, 32–40.
https://doi.org/10.1016/j.ijheatmasstransfer.2018.08.009
Kamal, M., & Rizza, G. (2019). Design for metal additive manufacturing for aerospace
applications. In Additive Manufacturing for the Aerospace Industry. Elsevier Inc.
https://doi.org/10.1016/b978-0-12-814062-8.00005-4
Kamps, T., Gralow, M., Schlick, G., & Reinhart, G. (2017a). Systematic Biomimetic Part
Design for Additive Manufacturing. Procedia CIRP, 65, 259–266.
https://doi.org/10.1016/j.procir.2017.04.054
Kamps, T., Gralow, M., Schlick, G., & Reinhart, G. (2017b). Systematic Biomimetic Part
112
Design for Additive Manufacturing. Procedia CIRP, 65, 259–266.
https://doi.org/10.1016/j.procir.2017.04.054
Kassem, R., Ajmal, M., Hussain, M., & Helo, P. (2017). Critical factors for culture of judicial
excellence: benchmarking study of Emirati courts. Critical Factors for Culture of
Judicial Excellence, 24. https://doi.org/10.1108/BIJ-03-2016-0045
Khwanruthai, B. (2012). How to do AHP analysis in Excel.
Klahn, C., Leutenecker, B., & Meboldt, M. (2015). Design strategies for the process of
additive manufacturing. Procedia CIRP, 36, 230–235.
https://doi.org/10.1016/j.procir.2015.01.082
Klein, F. (1921). Gesammelte mathematische Abhandlungen (Vol. 1). J. Springer.
Kok, Y., Tan, X. P., Wang, P., Nai, M. L. S., Loh, N. H., Liu, E., & Tor, S. B. (2018). Anisotropy
and heterogeneity of microstructure and mechanical properties in metal additive
manufacturing : A critical review. Materials & Design, 139, 565–586.
https://doi.org/10.1016/j.matdes.2017.11.021
Kranz, J., Herzog, D., & Emmelmann, C. (2015). Design guidelines for laser additive
manufacturing of lightweight structures in TiAl6V4. Journal of Laser Applications,
27(S1), S14001. https://doi.org/10.2351/1.4885235
Kumar Sharma, R., & Gopal Sharma, R. (2014). Integrating six sigma culture and TPM
framework to improve manufacturing performance in SMEs. Quality and Reliability
Engineering International, 30(5), 745–765. https://doi.org/10.1002/qre.1525
Kumbhar, N. N., & Mulay, A. V. (2018). Post Processing Methods used to Improve Surface
Finish of Products which are Manufactured by Additive Manufacturing Technologies:
A Review. Journal of The Institution of Engineers (India): Series C, 99(4), 481–487.
https://doi.org/10.1007/s40032-016-0340-z
Kumke, M., Watschke, H., & Vietor, T. (2016a). A new methodological framework for
design for additive manufacturing. Virtual and Physical Prototyping, 11(1), 3–19.
https://doi.org/10.1080/17452759.2016.1139377
Kumke, M., Watschke, H., & Vietor, T. (2016b). A new methodological framework for
design for additive manufacturing. Virtual and Physical Prototyping, 11(1), 3–19.
https://doi.org/10.1080/17452759.2016.1139377
113
Langelaar, M. (2016). Topology optimization of 3D self-supporting structures for additive
manufacturing. Additive Manufacturing, 12, 60–70.
https://doi.org/10.1016/j.addma.2016.06.010
Laverne, F., Segonds, F., Anwer, N., & Le Coq, M. (2014). Engineering Education View
project Reference fitting algorithms for aspheric and freeform surfaces (15SIB01:
FreeFORM) View project Frederic Segonds Ecole Nationale Supérieure d’Arts et
Métiers DFAM IN THE DESIGN PROCESS: A PROPOSAL OF CLASSIFICATION TO
FOSTER EARLY DESIGN STAGES.
https://www.researchgate.net/publication/277131995
Laverne, F., Segonds, F., Anwer, N., & Le Coq, M. (2015). Assembly based methods to
support product innovation in design for additive manufacturing: An exploratory
case study. Journal of Mechanical Design, Transactions of the ASME, 137(12).
https://doi.org/10.1115/1.4031589
Li, W., Yang, L., Ren, J., & Jiang, H. (2016). Effect of thermal boundary conditions and
thermal conductivity on conjugate heat transfer performance in pin fin arrays.
International Journal of Heat and Mass Transfer, 95, 579–592.
https://doi.org/10.1016/j.ijheatmasstransfer.2015.12.010
Liao, Y., Deschamps, F., Loures, E. de F. R., & Ramos, L. F. P. (2017). Past, present and
future of Industry 4.0 - a systematic literature review and research agenda proposal.
In International Journal of Production Research (Vol. 55, Issue 12, pp. 3609–3629).
Taylor & Francis. https://doi.org/10.1080/00207543.2017.1308576
Lindwall, A., Dordlofva, C., & Öhrwall Rönnbäck, A. (2017). ADDITIVE MANUFACTURING
AND THE PRODUCT DEVELOPMENT PROCESS : INSIGHTS FROM THE SPACE.
International Conference on Engineering Design (ICED17), 5(August), 345–354.
Ma, Y. (2005). A case study on non-parametric design method in ODM collaborative
product development. International Journal of Product Development, 2(4), 411.
https://doi.org/10.1504/IJPD.2005.008228
Maconachie, T., Leary, M., Lozanovski, B., Zhang, X., Qian, M., Faruque, O., & Brandt, M.
(2019a). SLM lattice structures: Properties, performance, applications and
challenges. Materials and Design, 183, 108137.

114
https://doi.org/10.1016/j.matdes.2019.108137
Maconachie, T., Leary, M., Lozanovski, B., Zhang, X., Qian, M., Faruque, O., & Brandt, M.
(2019b). SLM lattice structures: Properties, performance, applications and
challenges. Materials and Design, 183, 108137.
https://doi.org/10.1016/j.matdes.2019.108137
Mader, D. P. (2003). DFSS and Your Current Design Process. www.asq.org
Mader, D. P. (2008). LEAN SIX SIGMA ’ S EVOLUTION. 40.
https://faculty.mercer.edu/burtner_j/documents/QualityArticleLeanSixSigmaQuali
tyProgress2008.pdf
Magnacad LLC. (2017). Not all Design Methologies are created equal.
https://magnacad.com/wp-content/uploads/2017/04/17MKT-ICWP-1.pdf
Maidin, S. Bin, Campbell, I., & Pei, E. (2012). Development of a design feature database
to support design for additive manufacturing. Assembly Automation, 32(3), 235–
244. https://doi.org/10.1108/01445151211244375
Mark, S., Lewis, P., & Thornhill, A. (2007). Research Method for Business Student, 4th
edition.
Mehrpouya, M., Dehghanghadikolaei, A., Fotovvati, B., Vosooghnia, A., Emamian, S. S.,
& Gisario, A. (2019). The Potential of Additive Manufacturing in the Smart. Applied
Science, 34.
Mohr, J. J., Sengupta, S., & Slater, S. F. (2010). Marketing of high-technology products and
innovations. Pearson Prentice Hall.
Morski, I. (2016). Additive manufacturing and the talent gap | Deloitte University Press.
https://www2.deloitte.com/us/en/insights/focus/3d-opportunity/3d-printing-
talent-gap-workforce-development.html#
Munro, R. (2015). The certified six sigma green belt handbook (Second Edition).
Nagesha, B. K., Dhinakaran, V., Varsha Shree, M., Manoj Kumar, K. P., Chalawadi, D., &
Sathish, T. (2020). Review on characterization and impacts of the lattice structure in
additive manufacturing. Materials Today: Proceedings, 21, 916–919.
https://doi.org/10.1016/j.matpr.2019.08.158
Nicolas Huc. (2014). Conjugate Heat Transfer | COMSOL Blog.

115
https://www.comsol.com/blogs/conjugate-heat-transfer/
Nowak, G., & Wróblewski, W. (2011). Optimization of blade cooling system with use of
conjugate heat transfer approach. International Journal of Thermal Sciences, 50(9),
1770–1781. https://doi.org/10.1016/j.ijthermalsci.2011.04.001
Payne, B. A., & Toga, A. W. (1992). Distance field manipulation of surface models. IEEE
Computer Graphics and Applications, 12(1), 65–71.
https://doi.org/10.1109/38.135885
Pixelrust. (2012). 3d printed gyroid | Detail of a gyroid I bought via Shapeway… | Flickr.
https://www.flickr.com/photos/pixelrust/7164440625
Ponche, R., Kerbrat, O., Mognol, P., & Hascoet, J. Y. (2014a). A novel methodology of
design for Additive Manufacturing applied to Additive Laser Manufacturing process.
Robotics and Computer-Integrated Manufacturing, 30(4), 389–398.
https://doi.org/10.1016/j.rcim.2013.12.001
Ponche, R., Kerbrat, O., Mognol, P., & Hascoet, J. Y. (2014b). A novel methodology of
design for Additive Manufacturing applied to Additive Laser Manufacturing process.
Robotics and Computer-Integrated Manufacturing, 30(4), 389–398.
https://doi.org/10.1016/j.rcim.2013.12.001
Pradel, P., Zhu, Z., Bibb, R., & Moultrie, J. (2018a). Investigation of design for additive
manufacturing in professional design practice. Journal of Engineering Design, 29(4–
5), 165–200. https://doi.org/10.1080/09544828.2018.1454589
Pradel, P., Zhu, Z., Bibb, R., & Moultrie, J. (2018b). Investigation of design for additive
manufacturing in professional design practice. Journal of Engineering Design, 29(4–
5), 165–200. https://doi.org/10.1080/09544828.2018.1454589
Ramalingam, S. (2008). Mass Efficiency in Mechanical Design. II.
Ranta, M., Inui, M., Kimura, F., & Mantyla, M. (1993). Cut and paste based modeling with
boundary features. Proceedings on the Second ACM Symposium on Solid Modeling
and Applications - SMA ’93, 303–312. https://doi.org/10.1145/164360.164452
Redwood, B., Schffer, F., & Garret, B. (2017). The 3D printing handbook: technologies,
design and applications. 3D Hubs.
Rias, A., Bouchard, C., Segonds, F., Vayre, B., & Abed, S. (2016). DESIGN FOR ADDITIVE
116
MANUFACTURING: A CREATIVE APPROACH. INTERNATIONAL DESIGN CONFERENCE
- DESIGN 2016. https://doi.org/10.1007/978-3-319-53195-3_8
Rodrigue, H., & Rivette, M. (2010a). An Assembly-Level Design for Additive
Manufacturing Methodology. IDMME - Virtual Concept, 1–9.
https://doi.org/10.1007/978-2-8178-0169-8
Rodrigue, H., & Rivette, M. (2010b). An Assembly-Level Design for Additive
Manufacturing Methodology. IDMME - Virtual Concept, 1–9.
https://doi.org/10.1007/978-2-8178-0169-8
Rosen, D., Johnston, S., & Reed, M. (2006a). Design of General Lattice Structures for
Lightweight and Compliance Applications. Rapid Manufacturing Conference, 1–14.
http://smartech.gatech.edu/handle/1853/33037
Rosen, D., Johnston, S., & Reed, M. (2006b). Design of General Lattice Structures for
Lightweight and Compliance Applications. Rapid Manufacturing Conference, 1–14.
Rosen, D. W. (2007). Design for additive manufacturing: A method to explore unexplored
regions of the design space. 18th Solid Freeform Fabrication Symposium, SFF 2007,
402–415.
Rosen, D. W. (2016). What are principles for design for additive manufacturing?
Proceedings of the International Conference on Progress in Additive Manufacturing,
Part F1290, 85–90. https://doi.org/10.3850/978-981-09-0446-3_027
Salonitis, K. (2016). Design for additive manufacturing based on the axiomatic design
method. International Journal of Advanced Manufacturing Technology, 87(1–4),
989–996. https://doi.org/10.1007/s00170-016-8540-5
Salonitis, K., & Zarban, S. Al. (2015). Redesign optimization for manufacturing using
additive layer techniques. Procedia CIRP, 36, 193–198.
https://doi.org/10.1016/j.procir.2015.01.058
Saunders, M. (2017). DfAM strategy - create ’ design space ’ for maximum AM impact.
44(0), 1–3. https://www.renishaw.com/en/dfam-strategy-create-design-space-for-
maximum-am-impact--43420
Schmelzle, J., Kline, E. V., Dickman, C. J., Reutzel, E. W., Jones, G., & Simpson, T. W. (2015).
(Re)Designing for Part Consolidation: Understanding the Challenges of Metal
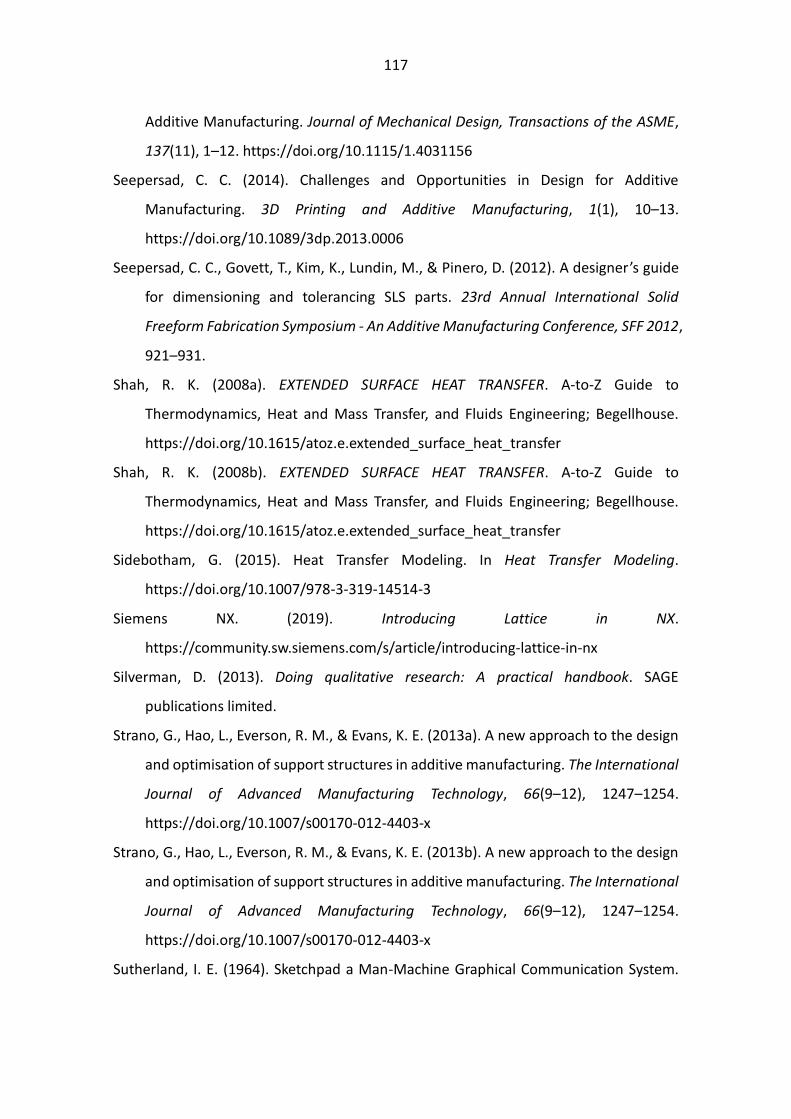
117
Additive Manufacturing. Journal of Mechanical Design, Transactions of the ASME,
137(11), 1–12. https://doi.org/10.1115/1.4031156
Seepersad, C. C. (2014). Challenges and Opportunities in Design for Additive
Manufacturing. 3D Printing and Additive Manufacturing, 1(1), 10–13.
https://doi.org/10.1089/3dp.2013.0006
Seepersad, C. C., Govett, T., Kim, K., Lundin, M., & Pinero, D. (2012). A designer’s guide
for dimensioning and tolerancing SLS parts. 23rd Annual International Solid
Freeform Fabrication Symposium - An Additive Manufacturing Conference, SFF 2012,
921–931.
Shah, R. K. (2008a). EXTENDED SURFACE HEAT TRANSFER. A-to-Z Guide to
Thermodynamics, Heat and Mass Transfer, and Fluids Engineering; Begellhouse.
https://doi.org/10.1615/atoz.e.extended_surface_heat_transfer
Shah, R. K. (2008b). EXTENDED SURFACE HEAT TRANSFER. A-to-Z Guide to
Thermodynamics, Heat and Mass Transfer, and Fluids Engineering; Begellhouse.
https://doi.org/10.1615/atoz.e.extended_surface_heat_transfer
Sidebotham, G. (2015). Heat Transfer Modeling. In Heat Transfer Modeling.
https://doi.org/10.1007/978-3-319-14514-3
Siemens NX. (2019). Introducing Lattice in NX.
https://community.sw.siemens.com/s/article/introducing-lattice-in-nx
Silverman, D. (2013). Doing qualitative research: A practical handbook. SAGE
publications limited.
Strano, G., Hao, L., Everson, R. M., & Evans, K. E. (2013a). A new approach to the design
and optimisation of support structures in additive manufacturing. The International
Journal of Advanced Manufacturing Technology, 66(9–12), 1247–1254.
https://doi.org/10.1007/s00170-012-4403-x
Strano, G., Hao, L., Everson, R. M., & Evans, K. E. (2013b). A new approach to the design
and optimisation of support structures in additive manufacturing. The International
Journal of Advanced Manufacturing Technology, 66(9–12), 1247–1254.
https://doi.org/10.1007/s00170-012-4403-x
Sutherland, I. E. (1964). Sketchpad a Man-Machine Graphical Communication System.
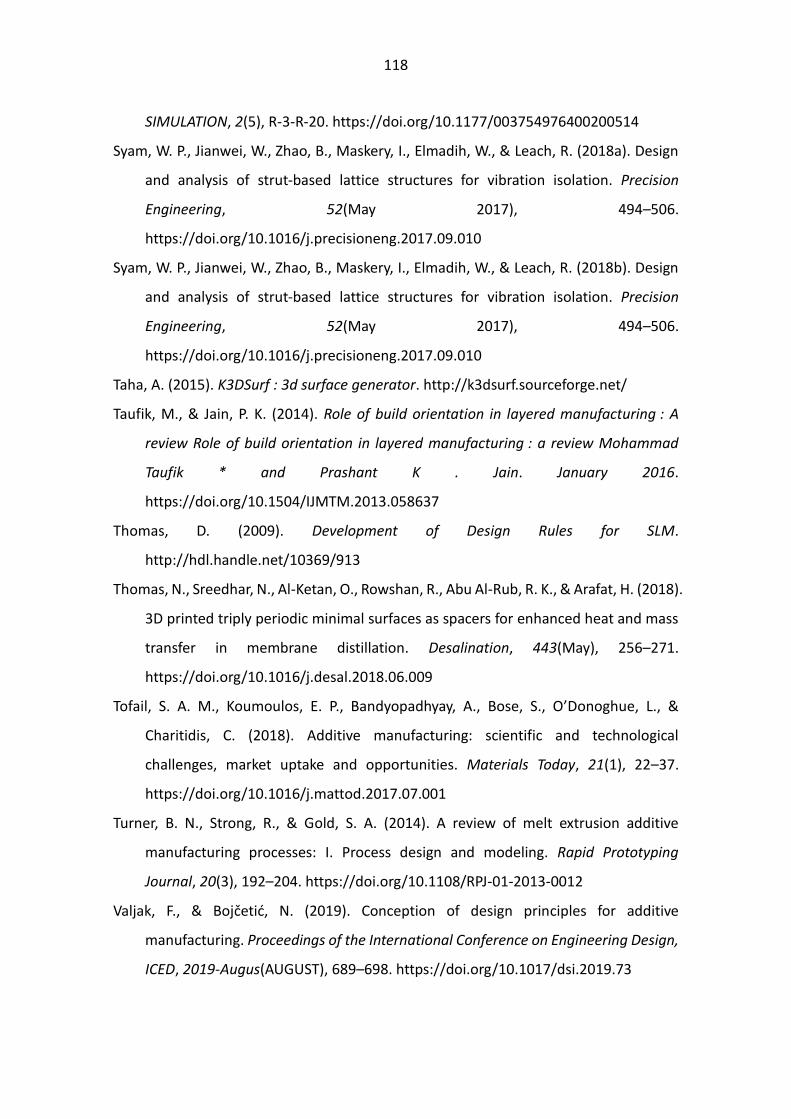
118
SIMULATION, 2(5), R-3-R-20. https://doi.org/10.1177/003754976400200514
Syam, W. P., Jianwei, W., Zhao, B., Maskery, I., Elmadih, W., & Leach, R. (2018a). Design
and analysis of strut-based lattice structures for vibration isolation. Precision
Engineering, 52(May 2017), 494–506.
https://doi.org/10.1016/j.precisioneng.2017.09.010
Syam, W. P., Jianwei, W., Zhao, B., Maskery, I., Elmadih, W., & Leach, R. (2018b). Design
and analysis of strut-based lattice structures for vibration isolation. Precision
Engineering, 52(May 2017), 494–506.
https://doi.org/10.1016/j.precisioneng.2017.09.010
Taha, A. (2015). K3DSurf : 3d surface generator. http://k3dsurf.sourceforge.net/
Taufik, M., & Jain, P. K. (2014). Role of build orientation in layered manufacturing : A
review Role of build orientation in layered manufacturing : a review Mohammad
Taufik * and Prashant K . Jain. January 2016.
https://doi.org/10.1504/IJMTM.2013.058637
Thomas, D. (2009). Development of Design Rules for SLM.
http://hdl.handle.net/10369/913
Thomas, N., Sreedhar, N., Al-Ketan, O., Rowshan, R., Abu Al-Rub, R. K., & Arafat, H. (2018).
3D printed triply periodic minimal surfaces as spacers for enhanced heat and mass
transfer in membrane distillation. Desalination, 443(May), 256–271.
https://doi.org/10.1016/j.desal.2018.06.009
Tofail, S. A. M., Koumoulos, E. P., Bandyopadhyay, A., Bose, S., O’Donoghue, L., &
Charitidis, C. (2018). Additive manufacturing: scientific and technological
challenges, market uptake and opportunities. Materials Today, 21(1), 22–37.
https://doi.org/10.1016/j.mattod.2017.07.001
Turner, B. N., Strong, R., & Gold, S. A. (2014). A review of melt extrusion additive
manufacturing processes: I. Process design and modeling. Rapid Prototyping
Journal, 20(3), 192–204. https://doi.org/10.1108/RPJ-01-2013-0012
Valjak, F., & Bojčetić, N. (2019). Conception of design principles for additive
manufacturing. Proceedings of the International Conference on Engineering Design,
ICED, 2019-Augus(AUGUST), 689–698. https://doi.org/10.1017/dsi.2019.73
119
Vayre, B., Vignat, F., & Villeneuve, F. (2012). Designing for additive manufacturing.
Procedia CIRP, 3(1), 632–637. https://doi.org/10.1016/j.procir.2012.07.108
Wilkes, M. V. (1990). Computing perspectives: it’s software now. Communications of the
ACM, 33(10), 19–21. https://doi.org/10.1145/84537.84539
Wohlers, T. (2005). Wohlers report 2005, rapid prototyping, tooling and manufacturing:
state of the industry. Annual Worldwide Progress Report, 342.
Wu, M. W., & Lai, P. H. (2016). The positive effect of hot isostatic pressing on improving
the anisotropies of bending and impact properties in selective laser melted Ti-6Al-
4V alloy. Materials Science and Engineering A, 658, 429–438.
https://doi.org/10.1016/j.msea.2016.02.023
Xu, X. (2009). Integrating advanced computer-aided design, manufacturing, and
numerical control: principles and implementations. Information Science Reference
New York.
Yang, K., & El-Haik, B. (2008). Design for Six Sigma: Roadmap to product development
(2nd Editio). McGraw-Hill.
Yang, S., & Zhao, Y. F. (2015). Additive manufacturing-enabled design theory and
methodology: a critical review. In International Journal of Advanced Manufacturing
Technology (Vol. 80, Issues 1–4, pp. 327–342). https://doi.org/10.1007/s00170-
015-6994-5
Yoo, D. J. (2014). Advanced porous scaffold design using multi-void triply periodic
minimal surface models with high surface area to volume ratios. International
Journal of Precision Engineering and Manufacturing, 15(8), 1657–1666.
https://doi.org/10.1007/s12541-014-0516-5
Zhang, Z., Liu, X., & Yang, S. (2009). A note on the 1-9 scale and index scale in ahp.
Communications in Computer and Information Science, 35, 630–634.
https://doi.org/10.1007/978-3-642-02298-2_92
Zhao, X., Sun, Z., Tang, L., & Zheng, G. (2011). Coupled flow-thermal-structural analysis
of hypersonic aerodynamically heated cylindrical leading edge. Engineering
Applications of Computational Fluid Mechanics, 5(2), 170–179.
120
Appendices
Appendix 1. Thermal Analysis results
The results from the Conjugate heat transfer analysis are tabulated in the following ta-
bles according to the Pin Placement Strategies used.
1. Type A - Pin Placement Strategy A
2. Type B - Pin Placement Strategy B
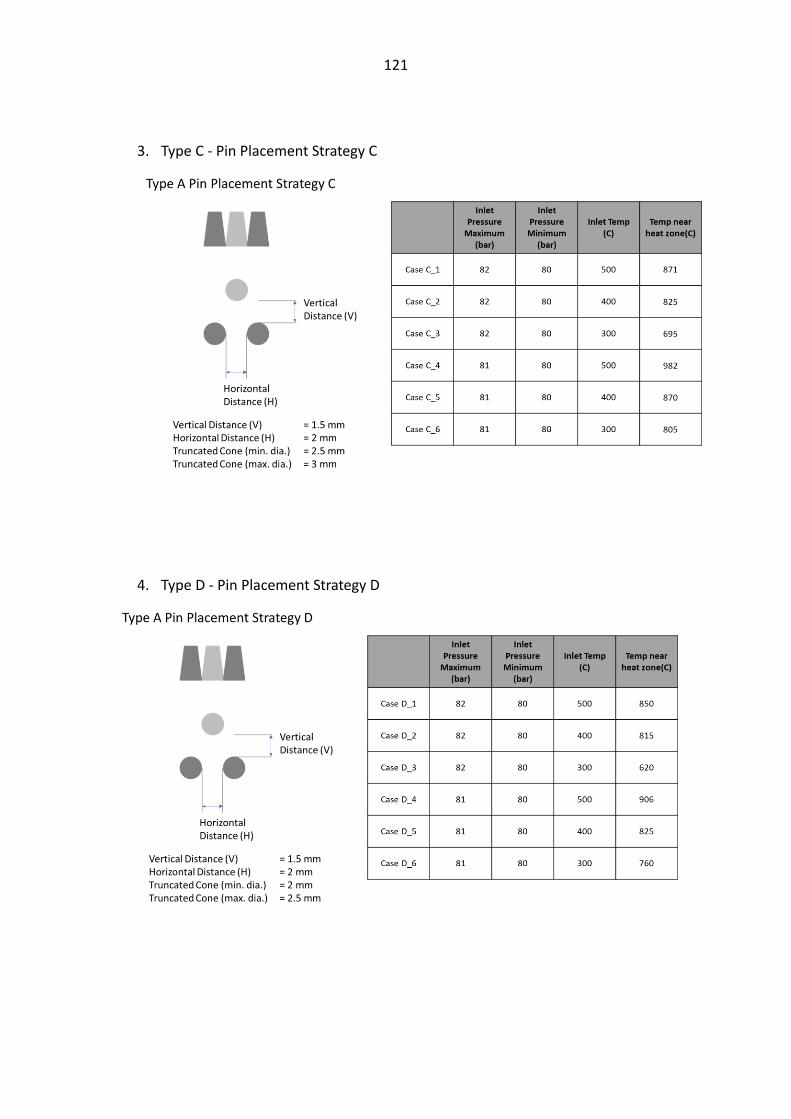
121
3. Type C - Pin Placement Strategy C
4. Type D - Pin Placement Strategy D

122
5. Type E - Pin Placement Strategy E
6. Type F - Pin Placement Strategy F

123
Appendix 2. MATLAB Code for Gyroid
clear all
close all
clc
x_period = 4;
y_period = 4;
z_period = 4;
[x,y,z] = meshgrid(0:0.1:x_period*3.14159265359, 0:0.1:y_pe-
riod*3.14159265359, 0:0.1:z_period*3.14159265359);
f = cos(x).*sin(y) + cos(y).*sin(z) + cos(z).*sin(x);
figure(1)
isosurface(x,y,z,f)
axis equal
xlabel('X')
ylabel('Y')
zlabel('Z')
hold on
figure(2)
isosurface(x,y,z,f)
axis equal
xlabel('X')
ylabel('Y')
zlabel('Z')
view(2)
figure(3)
isosurface(x,y,z,f)
axis equal
xlabel('X')
ylabel('Y')
zlabel('Z')
view(-45,36)
fv = isosurface(x,y,z,f)
stlwrite('0_to_pi_gyroid.stl',fv)