Embed Size (px)
Citation preview
Investigating the Effects of
Unbalanced Voltages on
Three-Phase Induction
Motor Performance
Thesis By: Daniel Adam Allison
Project Supervisor: Sujeewa Hettiwatte
i
Abstract
The purpose of this study is to examine and demonstrate the effects that unbalanced supply
voltages have on the operation and performance of a three-phase induction motor. Unlike a
single-phase supply, three-phase supply voltages can become unbalanced in a number of ways,
whereas a balanced condition maintains constant voltage magnitude and angles in all three
phases, though in practice it is impossible to have a perfectly balanced condition. Unbalanced
conditions can appear in different scales and can be potentially damaging to the motor. A three-
phase induction motor is designed to operate under balanced conditions, but can encounter
different and complex alterations in its electrical and mechanical variables under unbalanced
conditions. To understand the level of such alterations, this study compares different balanced
and unbalanced conditions in terms of their electrical and mechanical responses. These
responses include stator and rotor currents, electromechanical torque and rotor speed. A
simulated model of a three-phase induction motor along with different software generated
subsystems is used to examine these responses and the motor operation under different
unbalanced conditions. The final throughput of the motor is analysed from torque-speed
characteristics and derating factor curves for different unbalanced voltage conditions. A
general observation is that a complete loss of a phase is much more detrimental to the motor’s
performance than a certain percentage rise or drop in voltage magnitude or phase. In addition,
a change in the phase angle of the voltage has been found to yield further alterations in the
responses than would a change in the voltage magnitude. The quantitative relationship between
voltage imbalance and its resulting electrical and mechanical responses will facilitate devising
proper protection to mitigate the effects of voltage imbalance. This work would also help to
develop derating factors for motors operating under various unbalanced conditions.
ii
Acknowledgements
Project Supervisor: Dr. Sujeewa Hettiwatte Lecturer, Murdoch University
Dr. Gareth Lee Lecturer, Murdoch University
Mr. Lafeta “Jeff” Laava
Technician, Murdoch University
Mr. John Boulton Technician, Murdoch University
iii
Table of Contents
1 Introduction ........................................................................................................................ 1
1.1 Objectives .................................................................................................................... 2
1.2 Literature Review ........................................................................................................ 3
1.3 Requirements for the Study ......................................................................................... 3
2 Background Review ........................................................................................................... 5
2.1 Construction of the Stator ........................................................................................... 5
2.2 Construction of the Rotor ............................................................................................ 5
2.3 Operating Principle of a Three-Phase Induction Motor .............................................. 6
2.3.1 Reference Frame Theory.................................................................................... 12
2.3.2 Arbitrary Reference Frame ................................................................................ 14
2.3.3 Types of Reference Frames ............................................................................... 15
2.4 Torque-Speed Characteristics ................................................................................... 19
2.4.1 Low-Slip Region ................................................................................................ 20
2.4.2 Moderate-Slip Region ........................................................................................ 20
2.4.3 High-Slip Region ............................................................................................... 21
2.5 Symmetrical Component Method ............................................................................. 21
2.5.1 Effects on Operational Characteristics............................................................... 22
2.6 Equivalent Circuit ..................................................................................................... 22
2.7 Standards for Degrees of Imbalance ......................................................................... 24
2.7.1 Percentage Voltage Imbalance (PVI)................................................................. 24
2.7.2 Derating Curve and Voltage Unbalance Factor (VUF) ..................................... 25
3 Methodology ..................................................................................................................... 26
3.1 Laboratory Tests for Motor Parameter Estimation ................................................... 26
3.1.1 DC Test .............................................................................................................. 26
3.1.2 Blocked-Rotor Test ............................................................................................ 27
3.1.3 No-Load Test ..................................................................................................... 29
3.1.4 Challenge in Motor Parameter Estimation ......................................................... 31
3.2 Simulation of a Three-Phase Induction Motor .......................................................... 32
3.2.1 Introduction to Simulink .................................................................................... 32
3.2.2 Simulink Model for an Induction Motor ............................................................ 33
3.2.3 Electrical Sub-Model ......................................................................................... 34
3.2.4 Torque Sub-Model ............................................................................................. 35
3.2.5 Stator Current Sub-Model .................................................................................. 36
3.2.6 Power Supply Sub-Model .................................................................................. 36
iv
4 Experimental Results ........................................................................................................ 38
4.1 Results from Parameter Estimation ........................................................................... 38
4.2 Results from Simulation ............................................................................................ 38
4.3 Migrating Faults into Simulink ................................................................................. 41
4.3.1 Effect on Rotor Current ..................................................................................... 41
4.3.2 Effect on Stator Current ..................................................................................... 42
4.3.3 Effect on Rotor Speed ........................................................................................ 43
4.3.4 Effect on Electromagnetic Torque ..................................................................... 46
4.3.5 Effect on Derating Factor ................................................................................... 48
5 Discussion of the Results and Effects............................................................................... 49
6 Conclusion ........................................................................................................................ 51
6.1 Future Work Recommendations................................................................................ 51
7 Bibliography ..................................................................................................................... 53
8 Appendices ....................................................................................................................... 56
8.1 IEEE Standard 112 Method 4: Motor Parameter Calculations ................................. 56
8.2 MATLAB Torque-Speed Characteristics.................................................................. 57

v
Table of Figures
Figure 1 Per-phase equivalent circuit diagram of an induction motor....................................... 7
Figure 2 Power flow diagram of a three-Phase induction motor ............................................... 9
Figure 3 Vector diagram of the stationary reference frame ..................................................... 15
Figure 4 Geometric representation of the rotor reference frame ............................................. 16
Figure 5 Geometric representation of synchronous reference frame ....................................... 16
Figure 6 Equivalent circuit of an induction motor in the arbitrary reference frame ................ 17
Figure 7 Torque-Speed characteristics of a three-phase induction motor ............................... 20
Figure 8 Percentage temperature rise versus percentage voltage imbalance ........................... 22
Figure 9 Positive sequence unbalanced voltage equivalent circuit .......................................... 23
Figure 10 Negative sequence unbalanced voltage equivalent circuit ...................................... 23
Figure 11 Derating curve for induction motors of design class N ........................................... 25
Figure 12 Circuit diagram for DC test set-up .......................................................................... 26
Figure 13 Set-up for blocked-rotor test on 3P-IM ................................................................... 27
Figure 14 Per-phase equivalent circuit under blocked rotor test condition ............................. 28
Figure 15 Experimental set-up for no-load test ....................................................................... 30
Figure 16 Per-phase equivalent circuit under no load test condition ....................................... 30
Figure 17 Induction motor electrical sub-model in Simulink .................................................. 34
Figure 18 System implemented in Simulink to transform to synchronous reference frame ... 35
Figure 19 Simulink model to obtain electromagnetic torque from stator flux and current
components .............................................................................................................................. 36
Figure 20 Asynchronous model implemented in Simulink for induction motor ..................... 37
Figure 21 Asynchronous machine model and input-output interface implemented in
Simulink. .................................................................................................................................. 40
Figure 22 Effect of different voltages imbalances on rotor current ......................................... 42
Figure 23 Effect of different voltages imbalances on stator current ........................................ 43
Figure 24 Effect of different voltage imbalances on rotor speed ............................................. 44
Figure 25 Rotor speed characteristics ...................................................................................... 45
Figure 26 Effect of different voltages imbalances on electromagnetic torque ........................ 46
Figure 27 Effect of different voltages imbalances on torque-speed characteristics of the
induction motor ........................................................................................................................ 47
Figure 28 Derating curves ........................................................................................................ 48
vi
Table of Tables
Table 1 Rated specification of the 3P-IM used in this study ..................................................... 4
Table 2 Reference frame angular position and difference summary ....................................... 18
Table 3 Motor values for Toshiba 3P-IM under test conditions .............................................. 32
Table 4 Electrical parameter values for the Toshiba 3P-IM .................................................... 38
Table 5 Three-phase voltages corresponding to balanced conditions and different unbalanced
voltage conditions .................................................................................................................... 39
Table 6 Rotor speed at different experimental conditions. ...................................................... 44
Table 7 Different electrical and mechanical variables of the motor under different unbalanced
voltage conditions .................................................................................................................... 49
Table 8 Derating factors for magnitude UV ............................................................................ 59
Table 9 Derating factors for magnitude OV ............................................................................ 60
Table 10 Derating factors for phase UV .................................................................................. 61
Table 11 Derating factors for phase OV .................................................................................. 62
Table 12 Derating factors for magnitude and phase UV ......................................................... 63
Table 13 Derating factors for magnitude and phase OV ......................................................... 64
vii
Document Overview
This thesis comprises of a total of six chapters which are summarised below.
Chapter 1: Introduction
This chapter states the problem and presents the goals and requirements of the study. A
literature review is provided in line with the work of the thesis. The requirement for this is also
briefly outlined.
Chapter 2: Background Overview
This chapter illustrates the construction and operational characteristics of a three-phase
induction motor. A detailed theoretical background is provided to facilitate the analysis of
three-phase induction motor operation.
Chapter 3: Methodology
This chapter illustrates the underlying steps for two experimental procedures. In the first
section, it shows the laboratory set-up for the induction motor parameter tests. In the second
section, it introduces a Simulink based asynchronous motor model and how it is used to
simulate different unbalanced conditions for this study.
Chapter 4: Experimental Results
The results from the parameter tests and simulations based on Simulink are presented in this
chapter. The demonstration of results includes torque-speed characteristics, derating curves,
and transient responses of the different electrical and mechanical variables of the motor.
Chapter 5: Discussions on Results
The results obtained are discussed in this chapter to illustrate causes and effects of voltage
imbalance. This chapter focuses on the problems related to the output voltages of variable speed
drives.
Chapter 6: Conclusion
This thesis concludes in this chapter by summarising the overall work and results. To improve
the results, the probable cases for potential future studies are also included in this chapter.
1
1 Introduction
Three-phase induction motors (3P-IM) are widely used in industrial applications due to their
ruggedness, efficiency, reliability and low cost operation. While single-phase induction motors
are more common in residential and light operations, 3P-IMs are utilised in light to heavy
industrial applications. 3P-IMs drive conveyors, pumps, ventilation, compressors and many
other drive applications in the processing and manufacturing industry.
Since the induction motor speed is determined by the frequency of the electrical power supply,
it has been effectively used in applications where fixed speed is a key requirement. Their low
cost and higher power output have made them popular over their rival DC motor drives which
are commonly used in variable speed applications. With the advent of control electronics, the
speed of induction motors can be varied by altering the AC current frequency [1]. This
development has made variable speed drives both efficient and economical, and so the
induction motor have replaced DC motors in most industrial applications. 3P-IMs consume
about 75% of the total electric power used by industries [2]. About 80% of industrial
applications involve 3P-IMs [3]. Considering the large amount of power consumed by these
motors, greater efficiency and performance can result in significant savings in industrial
applications. The performance and throughput of any AC motor is dependent on the quality
and stability of the electric power system which energises the motor. Since electrical power
systems run through a very complex network of generation, transmission, distribution and
utilisation, it is not unusual to have faults and imbalances at any stage in various magnitude
and time, which in turn affects the overall quality of the supplied electrical power. Most modern
electric machines are designed with protective measures to prevent damage occurring as a
result of electric power quality degradations. However, long duration exposure to such a
degraded electric power supply may cause insidious loss or damage to the performance and
lifespan of the machine. A small percentage loss in efficiency can lead to a significant total loss
in mechanical output and loss of production in industries. Therefore, the effect of input
electrical power imbalance on AC motors is a crucial research area. Such research assesses
both the loss in performance as well as to aiding in the design of protective measures to
compensate or prevent such losses.
Despite all their advantages and different applications, 3P-IMs have numerous drawbacks, one
of which is their vulnerability to unbalanced voltage conditions. The unbalanced voltage
condition may appear either as a magnitude difference or as phase asymmetries. Under
2
unbalanced conditions, the motor encounters a simultaneous supply of over or under voltages
across different lines [4]. These phenomena degrade the performance of the 3P-IM in different
scales. A fault in a transmission line or uneven distribution of single-phase loads can introduce
an unbalanced supply situation. The supply voltage can also become unbalanced due to a
sudden change in the load, for example the shutdown of a factory, unbalanced line or phase
impedances in the power system, or an open delta transformer connection. According to the
report provided by the American National Standards Institute (ANSI), about 32% of the entire
electrical system in the USA experiences unbalanced levels of between 1% to 3% [3]. As per
recommendations of the International Electrotechnical Commission (IEC), voltage imbalances
should not exceed 2% [3], [5]. However, due to the complex loads and their distribution
systems, it is not possible to have a power system totally free of some sort of imbalance. These
unbalanced situations impact on the system in different ways depending on their degree and
characteristics [6]. The performance of a 3P-IM requires a thorough examination under
different unbalanced situations to estimate their effect on mechanical throughput and economy.
1.1 Objectives
In this study, computer-based simulations were conducted for four such conditions to examine
their individual impacts on the 3P-IM parameters and performance. These four conditions lead
to unbalanced voltage conditions and are broadly categorised as follows:
(1) Loss of a phase in a three-phase supply
(2) Unbalanced magnitudes in the three-phase supply voltage
(3) Unbalanced phase angles in the three-phase supply voltage
(4) Both unbalanced magnitudes and phase angles in the three-phase supply voltage
It is hoped that this study will inspire further research using similar software simulations.
Software simulation can be used to mimic real world scenarios with no or little cost or the need
for extensive and expensive hardware resources and setup. An experimental study may require
manipulation of numerous parameters and variables which may not be feasible in a real
hardware setup. Furthermore, in power systems, rendering events like faults or unbalanced
situations may be hazardous and detrimental to the machine under test unless proper protection
measures are put in place. A wide range of studies related to power systems and machinery
3
have been conducted based on the use of simulations [7]. Jayatunga et al. conducted a
simulation to demonstrate the effect of loading an induction motor during an unbalanced
voltage event [8]. A simulation can provide a reasonable estimate of what could occur in a
practical situation and can even be used to provide further design recommendations for
induction motors.
1.2 Literature Review
Raj et al. conducted a study on the effects of supply voltage distortion on a 5 HP 3P-IM’s
performance [9]. Results showed that unbalanced but undistorted (sinusoidal) waveforms of a
supply voltage produce worse effects on 3P-IMs compared to balanced but distorted (non-
sinusoidal) waveforms. The distortion of supply voltages in non-sinusoidal form leads to the
generation of harmful harmonics which affect the performance of the motor, introducing a
pulsating torque and noise [9]. Williams reports how unbalanced voltages lead to a drop in
efficiency due to counteracting torque which negates the mechanical throughput or torque [10].
A number of studies have reported the detrimental effects of overheating and early breakdown
of induction motors due to unbalanced currents [5], [11]. A report from the US Department of
Energy reveals that a 10o C rise in temperature above normal operating temperature can reduce
the lifespan of a 3P-IM by half [12].
A series of concurrent studies have identified the following effects of unbalanced voltages on
3P-IMs [9], [13], [14]. Firstly, the full output torque drops, which is essentially the throughput
of a motor [13]. Secondly, it reduces the efficiency [10] and power factor [15]. Thirdly, noise
and vibration [6] along with rise in temperature of the rotor [16] may cause wear and ageing
which also affects steady state operating conditions. Finally, a drop in efficiency can result in
considerable economic loss [17].
This study investigates different electrical and mechanical variables of a 3P-IM under these
unbalanced voltage situations in order to understand the corresponding effects on each
operating situation. The effects need to be explained by comparing the variables of 3P-IMs
which are subjected to both balanced and unbalanced situations respectively. To facilitate this
comparison, the operation of a 3P-IM is also simulated under balanced conditions.
1.3 Requirements for the Study
The experimentation used in this study is divided into two sections. In the first section, the
electrical parameters of the 3P-IM under test such as reactance and resistance values are
4
measured. Three tests, which include blocked-rotor, no-load and DC tests, are conducted on a
real 3P-IM in the laboratory. These tests are done to measure all the necessary electrical
parameters required for the simulation in the next section of the study. The DC test yields the
stator resistance, while the blocked-rotor test assists in computing the stator reactance as well
as the rotor resistance and reactance. The no-load test determines the magnetising reactance.
The tests are conducted sequentially as values obtained in one test are applied in the following
tests.
In the second section of the study, all the test cases for unbalanced voltages are rendered and
simulated in software. The parameter values obtained in the first section are used to create a
software model of a 3P-IM. The 3P-IM model is used to simulate and compare different
variables and results when subjected to different unbalanced voltage situations. The simulation
program is required to have certain features, such as it should be able to render displays and
plot various selected variables like output current, speed and torque. These variables and their
plots are used to illustrate and compare the impacts of balanced and unbalanced voltage
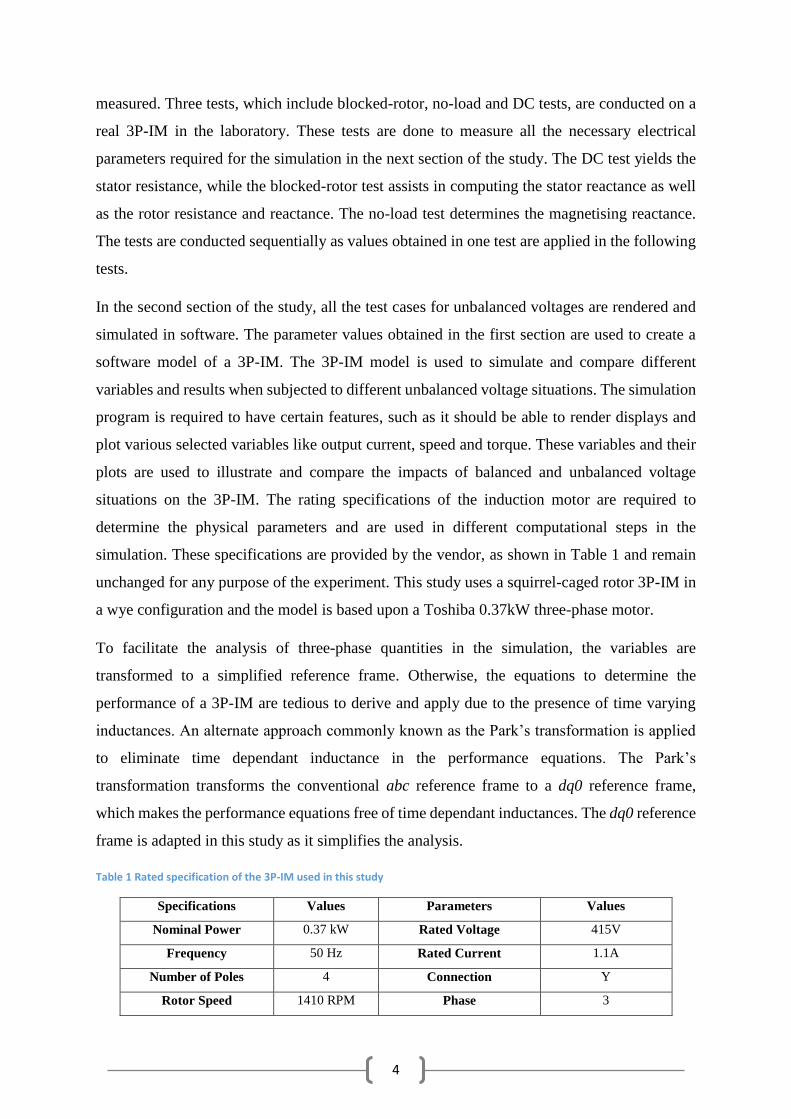
situations on the 3P-IM. The rating specifications of the induction motor are required to
determine the physical parameters and are used in different computational steps in the
simulation. These specifications are provided by the vendor, as shown in Table 1 and remain
unchanged for any purpose of the experiment. This study uses a squirrel-caged rotor 3P-IM in
a wye configuration and the model is based upon a Toshiba 0.37kW three-phase motor.
To facilitate the analysis of three-phase quantities in the simulation, the variables are
transformed to a simplified reference frame. Otherwise, the equations to determine the
performance of a 3P-IM are tedious to derive and apply due to the presence of time varying
inductances. An alternate approach commonly known as the Park’s transformation is applied
to eliminate time dependant inductance in the performance equations. The Park’s
transformation transforms the conventional abc reference frame to a dq0 reference frame,
which makes the performance equations free of time dependant inductances. The dq0 reference
frame is adapted in this study as it simplifies the analysis.
Table 1 Rated specification of the 3P-IM used in this study
Specifications Values Parameters Values
Nominal Power 0.37 kW Rated Voltage 415V
Frequency 50 Hz Rated Current 1.1A
Number of Poles 4 Connection Y
Rotor Speed 1410 RPM Phase 3
5
2 Background Review
The most common 3P-IM design is the squirrel cage motor and is more widely used than the
wound rotor motors. This is because the wound rotor type requires increased maintenance and
wear because of its associated brushes and slip rings. Both wye and delta connected stator
windings can be used in induction motors.
2.1 Construction of the Stator
The windings in the stator can be marked from outside as it is the exterior component of the
motor. The construction of the stator windings in a 3P-IM is different from single-phase or
other polyphase motors. The stator section consists of a laminated iron core with slots into
where the winding coils are woven. The three stator windings overlap one another as they are
built 120° out of phase and also operate 120° out of phase. The stator windings have a low
resistance and are insulated in between by varnish or an oxide type coating [18].
2.2 Construction of the Rotor
A squirrel-cage rotor is designed with a fixed shaft containing a laminated iron core, bearings,
and rotor conductors. The cylindrical laminated core has parallel slots cut into it to carry the
rotor conductors. Thick bars are used as rotor conductors instead of wires where the rotor bars
are slotted into the laminated iron core. With the help of two solid rings the ends of these rotor
bars are short-circuited. This structure helps to prevent external resistance occurring in series
with the rotor. These are usually structured with copper strips welded to copper rings.
Aluminium and special metal alloys are the materials most commonly used to construct the
rotors of small and medium sized motors. The end rings are either welded or bolted onto the
rotor to retain their electrical continuity.
The performance of the motor also depends on the electrical parameters and features of the
rotor bars. Deeper bars in the rotor construction will increase the reactance. This results in a
weaker starting current and produces a lower pull-out torque. The rotor conducting bars are
placed in skewed position compared to the shaft of the motor. These positions result in a
smooth, steady acceleration during motor start-up [19].
6
2.3 Operating Principle of a Three-Phase Induction Motor
Each of the three 120° separated phase stator windings receive an alternating current. This
current flowing into the stator windings produces a magnetic field which rotates at synchronous
speed, Ns. The value of Ns depends on the motor design. For a given frequency (𝑓𝑠𝑒) of the
supplied electric power, Ns is determined by the number of poles (𝑃) in the motor [20].
Synchronous speed is defined by:
𝑁𝑠 =
120 × 𝑓𝑠𝑒𝑃
,
(1)
where, 𝑁𝑠 is in revolutions per minute (rev/min), 𝑓𝑠𝑒 is the frequency (Hertz), and 𝑃 stands
for the number of motor poles.
From the rotation throughout the air gap, the rotating magnetic flux (RMF) produced gets cut
by the short-circuited rotor bars. The voltage induced drives a current which flows within the
rotor bars and produces a magnetic field. The magnetic field induced in the rotor interacts with
the stator magnetic field to generate a torque which causes the rotor to turn. The torque created
by the magnetic field varies depending on the rotor current and flux density. Essentially, the
stator and rotor magnetic fields rotate at the same synchronous speed. The rotor magnetic field
always rotates at synchronous speed. However, the rotor speed is slightly slower than the
synchronous speed [21].
The difference between the rotor speed (N) and the synchronous speed (Ns) is called the slip
(s). When a mechanical load is attached to the shaft, the rotor slows down, resulting in a higher
slip which directly affects the torque in the rotor. Slip speed (Nslip) is defined by Eq. 2.
𝑁𝑠𝑙𝑖𝑝 = 𝑁𝑠 − 𝑁𝑟
𝜔𝑠𝑙𝑖𝑝 = 𝜔𝑠 − 𝜔𝑟
(2)
Where, 𝑁𝑠 and 𝜔𝑠 represents the synchronous speed in (rev/min) and angular velocity (rad/sec)
of the stator magnetic field respectively. Similarly, 𝑁𝑟 and 𝜔𝑟 stand for the corresponding
variables related to the mechanical speed of the rotor.
7
The slip of an induction motor is defined as the ratio between the slip speed and the
synchronous speed, as shown in Eq. 3:
𝑠 =
𝑁𝑠 − 𝑁𝑟𝑁𝑠
=𝜔𝑠 − 𝜔𝑟𝜔𝑠
(3)
From Eq. 3 it is clear that when the slip approaches zero, the motor operates closer to
synchronous speed and when the slip is 1 the rotor has stopped completely.
From the definition of slip and frequency of the power supply, the rotor frequency can be
derived as
𝑓𝑟𝑒 = 𝑠𝑓𝑠𝑒 , (4)
From Eqs. 1 and 4, the rotor frequency can be written as
𝑓𝑟𝑒 =𝑃
120(𝑁𝑠 − 𝑁𝑟), (5)
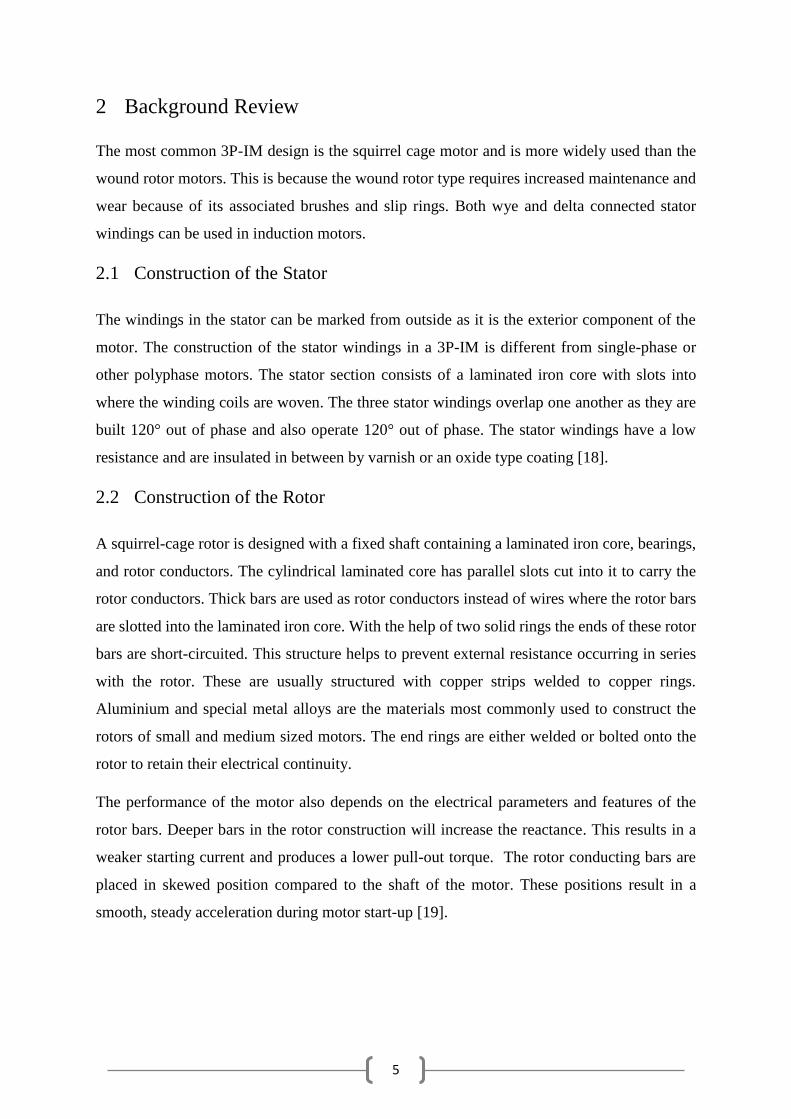
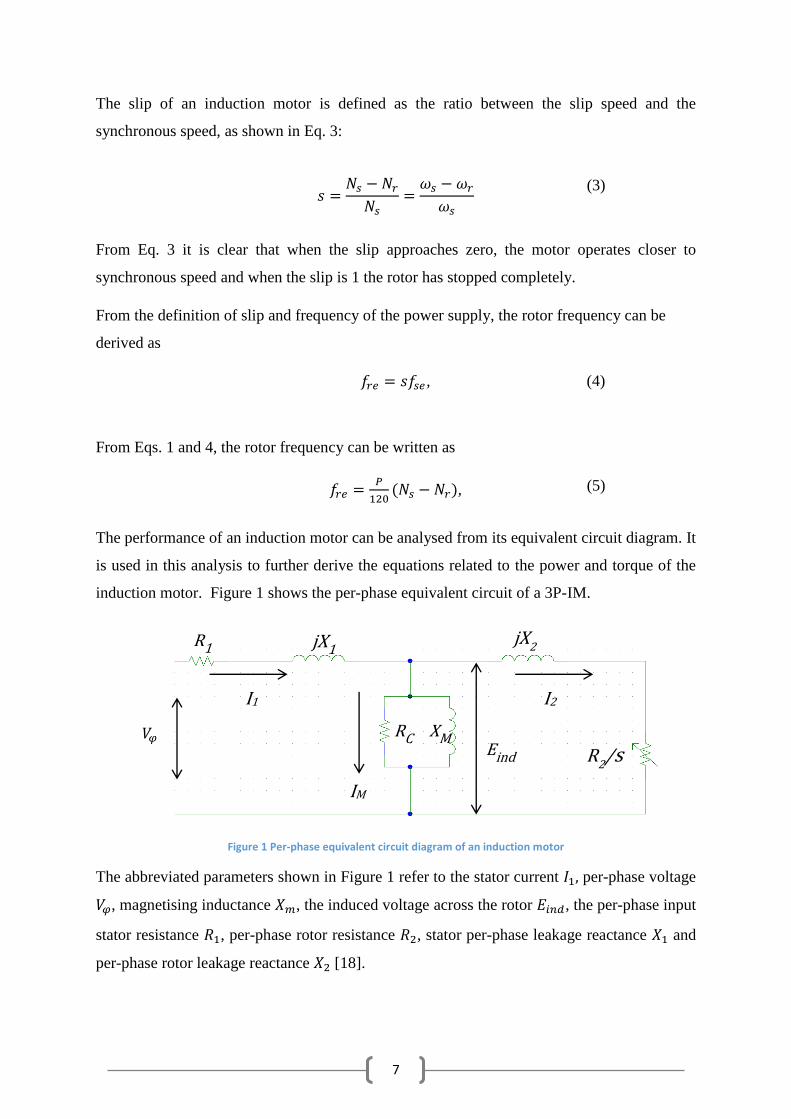
The performance of an induction motor can be analysed from its equivalent circuit diagram. It
is used in this analysis to further derive the equations related to the power and torque of the
induction motor. Figure 1 shows the per-phase equivalent circuit of a 3P-IM.
Figure 1 Per-phase equivalent circuit diagram of an induction motor
The abbreviated parameters shown in Figure 1 refer to the stator current 𝐼1, per-phase voltage
𝑉𝜑, magnetising inductance 𝑋𝑚, the induced voltage across the rotor 𝐸𝑖𝑛𝑑, the per-phase input
stator resistance 𝑅1, per-phase rotor resistance 𝑅2, stator per-phase leakage reactance 𝑋1 and
per-phase rotor leakage reactance 𝑋2 [18].
R1 jX1 jX2
RC XM
R2/s
𝑉𝜑
p
I1 I2
IM
Eind
8
From Fig. 1, the per-phase input current can be calculated as
𝐼1 =𝑉𝜑
𝑍𝑒𝑞 (6)
where, per-phase impedance of the 3P-IM is defined as 𝑍𝑒𝑞.
The input power 𝑃𝑖𝑛 of a three-phase induction motor is derived from the phase voltage, line
current and the power factor as
𝑃𝑖𝑛 = 3𝑉𝜑𝐼1 𝑐𝑜𝑠 𝜃 (7)
The mechanical output power is defined as a function of the load torque 𝑇𝐿 and the angular
velocity 𝜔𝑚:
𝑃𝑜𝑢𝑡 = 𝑇𝐿𝜔𝑚 (8)
The induced torque of the machine is obtained from Eq. 9.
𝑇𝑖𝑛𝑑 =𝑃𝑐𝑜𝑛𝑣
𝜔𝑚 =
𝑃𝐴𝐺
𝜔𝑠 (9)
The air gap power is defined as 𝑃𝐴𝐺 and 𝑃𝑐𝑜𝑛𝑣 is the converted power.
The air gap power is given by the following relationship:
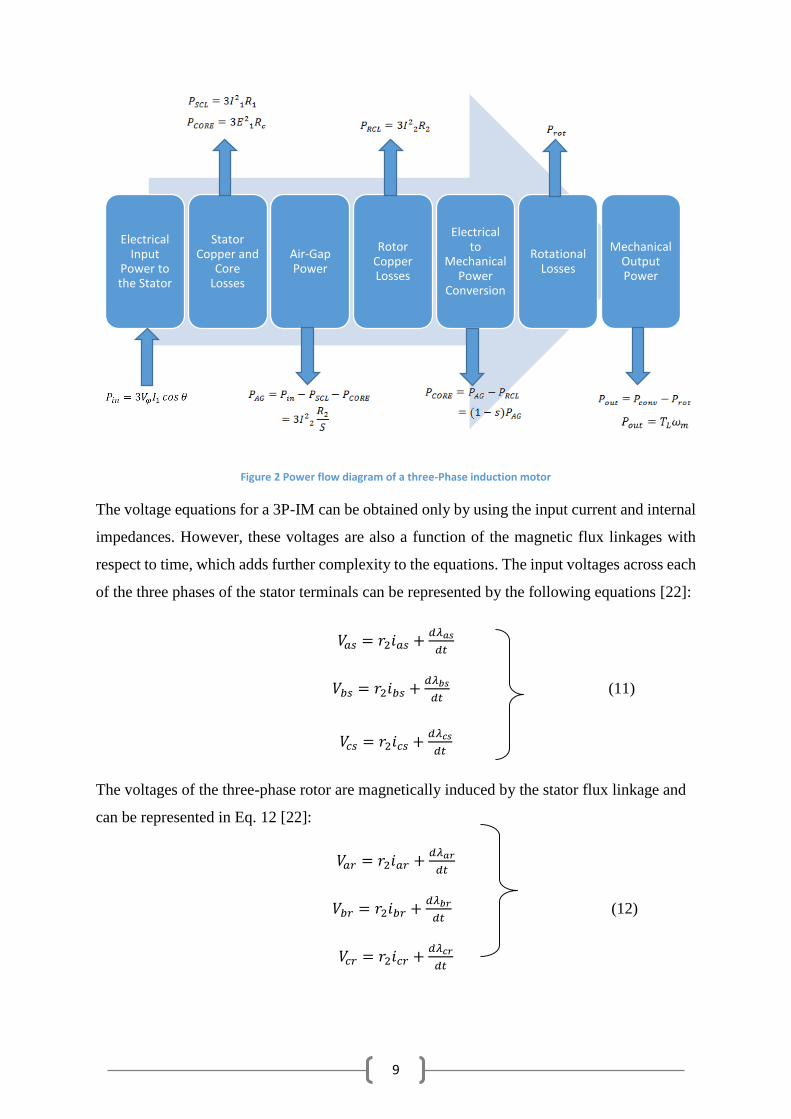
𝑃𝐴𝐺 = 𝑃𝑖𝑛 − 𝑃𝑆𝐶𝐿−𝑃𝐶𝑂𝑅𝐸
= 3𝐼22𝑅2
𝑆 (10)
where, 𝑃𝑆𝐶𝐿 is the stator copper losses, 𝑃𝑅𝐶𝐿 is the rotor copper losses and 𝑃𝐶𝑂𝑅𝐸 is the core
losses.
The conversion of the input electrical energy to the output mechanical power and internal
losses are illustrated in the corresponding equations shown in Figure 2 [18].
9
Figure 2 Power flow diagram of a three-Phase induction motor
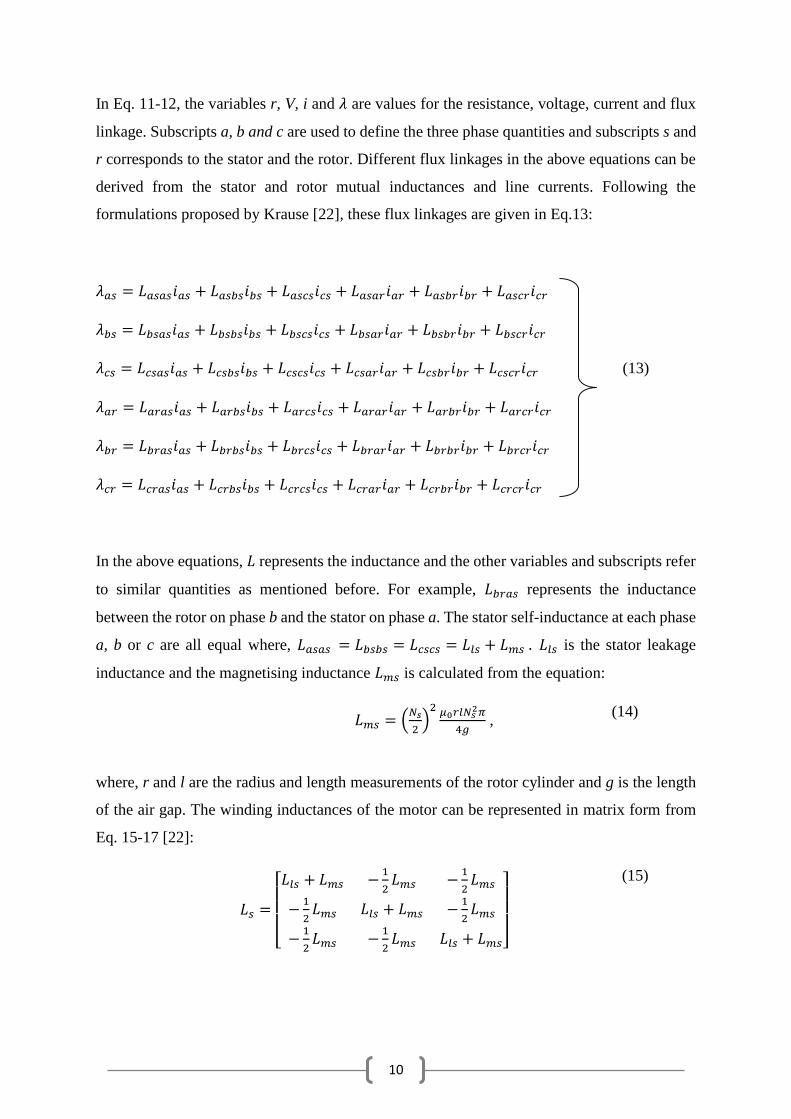
The voltage equations for a 3P-IM can be obtained only by using the input current and internal
impedances. However, these voltages are also a function of the magnetic flux linkages with
respect to time, which adds further complexity to the equations. The input voltages across each
of the three phases of the stator terminals can be represented by the following equations [22]:
𝑉𝑎𝑠 = 𝑟2𝑖𝑎𝑠 +𝑑𝜆𝑎𝑠
𝑑𝑡
𝑉𝑏𝑠 = 𝑟2𝑖𝑏𝑠 +𝑑𝜆𝑏𝑠
𝑑𝑡 (11)
𝑉𝑐𝑠 = 𝑟2𝑖𝑐𝑠 +𝑑𝜆𝑐𝑠
𝑑𝑡
The voltages of the three-phase rotor are magnetically induced by the stator flux linkage and
can be represented in Eq. 12 [22]:
𝑉𝑎𝑟 = 𝑟2𝑖𝑎𝑟 +𝑑𝜆𝑎𝑟
𝑑𝑡
𝑉𝑏𝑟 = 𝑟2𝑖𝑏𝑟 +𝑑𝜆𝑏𝑟
𝑑𝑡 (12)
𝑉𝑐𝑟 = 𝑟2𝑖𝑐𝑟 +𝑑𝜆𝑐𝑟
𝑑𝑡
Electrical Input
Power to the Stator
Stator Copper and
Core Losses
Air-Gap Power
Rotor Copper Losses
Electrical to
Mechanical Power
Conversion
Rotational Losses
Mechanical Output Power
10
In Eq. 11-12, the variables r, V, i and 𝜆 are values for the resistance, voltage, current and flux
linkage. Subscripts a, b and c are used to define the three phase quantities and subscripts s and
r corresponds to the stator and the rotor. Different flux linkages in the above equations can be
derived from the stator and rotor mutual inductances and line currents. Following the
formulations proposed by Krause [22], these flux linkages are given in Eq.13:
𝜆𝑎𝑠 = 𝐿𝑎𝑠𝑎𝑠𝑖𝑎𝑠 + 𝐿𝑎𝑠𝑏𝑠𝑖𝑏𝑠 + 𝐿𝑎𝑠𝑐𝑠𝑖𝑐𝑠 + 𝐿𝑎𝑠𝑎𝑟𝑖𝑎𝑟 + 𝐿𝑎𝑠𝑏𝑟𝑖𝑏𝑟 + 𝐿𝑎𝑠𝑐𝑟𝑖𝑐𝑟
𝜆𝑏𝑠 = 𝐿𝑏𝑠𝑎𝑠𝑖𝑎𝑠 + 𝐿𝑏𝑠𝑏𝑠𝑖𝑏𝑠 + 𝐿𝑏𝑠𝑐𝑠𝑖𝑐𝑠 + 𝐿𝑏𝑠𝑎𝑟𝑖𝑎𝑟 + 𝐿𝑏𝑠𝑏𝑟𝑖𝑏𝑟 + 𝐿𝑏𝑠𝑐𝑟𝑖𝑐𝑟
𝜆𝑐𝑠 = 𝐿𝑐𝑠𝑎𝑠𝑖𝑎𝑠 + 𝐿𝑐𝑠𝑏𝑠𝑖𝑏𝑠 + 𝐿𝑐𝑠𝑐𝑠𝑖𝑐𝑠 + 𝐿𝑐𝑠𝑎𝑟𝑖𝑎𝑟 + 𝐿𝑐𝑠𝑏𝑟𝑖𝑏𝑟 + 𝐿𝑐𝑠𝑐𝑟𝑖𝑐𝑟 (13)
𝜆𝑎𝑟 = 𝐿𝑎𝑟𝑎𝑠𝑖𝑎𝑠 + 𝐿𝑎𝑟𝑏𝑠𝑖𝑏𝑠 + 𝐿𝑎𝑟𝑐𝑠𝑖𝑐𝑠 + 𝐿𝑎𝑟𝑎𝑟𝑖𝑎𝑟 + 𝐿𝑎𝑟𝑏𝑟𝑖𝑏𝑟 + 𝐿𝑎𝑟𝑐𝑟𝑖𝑐𝑟
𝜆𝑏𝑟 = 𝐿𝑏𝑟𝑎𝑠𝑖𝑎𝑠 + 𝐿𝑏𝑟𝑏𝑠𝑖𝑏𝑠 + 𝐿𝑏𝑟𝑐𝑠𝑖𝑐𝑠 + 𝐿𝑏𝑟𝑎𝑟𝑖𝑎𝑟 + 𝐿𝑏𝑟𝑏𝑟𝑖𝑏𝑟 + 𝐿𝑏𝑟𝑐𝑟𝑖𝑐𝑟
𝜆𝑐𝑟 = 𝐿𝑐𝑟𝑎𝑠𝑖𝑎𝑠 + 𝐿𝑐𝑟𝑏𝑠𝑖𝑏𝑠 + 𝐿𝑐𝑟𝑐𝑠𝑖𝑐𝑠 + 𝐿𝑐𝑟𝑎𝑟𝑖𝑎𝑟 + 𝐿𝑐𝑟𝑏𝑟𝑖𝑏𝑟 + 𝐿𝑐𝑟𝑐𝑟𝑖𝑐𝑟
In the above equations, 𝐿 represents the inductance and the other variables and subscripts refer
to similar quantities as mentioned before. For example, 𝐿𝑏𝑟𝑎𝑠 represents the inductance
between the rotor on phase b and the stator on phase a. The stator self-inductance at each phase
a, b or c are all equal where, 𝐿𝑎𝑠𝑎𝑠 = 𝐿𝑏𝑠𝑏𝑠 = 𝐿𝑐𝑠𝑐𝑠 = 𝐿𝑙𝑠 + 𝐿𝑚𝑠 . 𝐿𝑙𝑠 is the stator leakage
inductance and the magnetising inductance 𝐿𝑚𝑠 is calculated from the equation:
𝐿𝑚𝑠 = (
𝑁𝑠
2)2 𝜇0𝑟𝑙𝑁𝑠
2𝜋
4𝑔 ,
(14)
where, r and l are the radius and length measurements of the rotor cylinder and g is the length
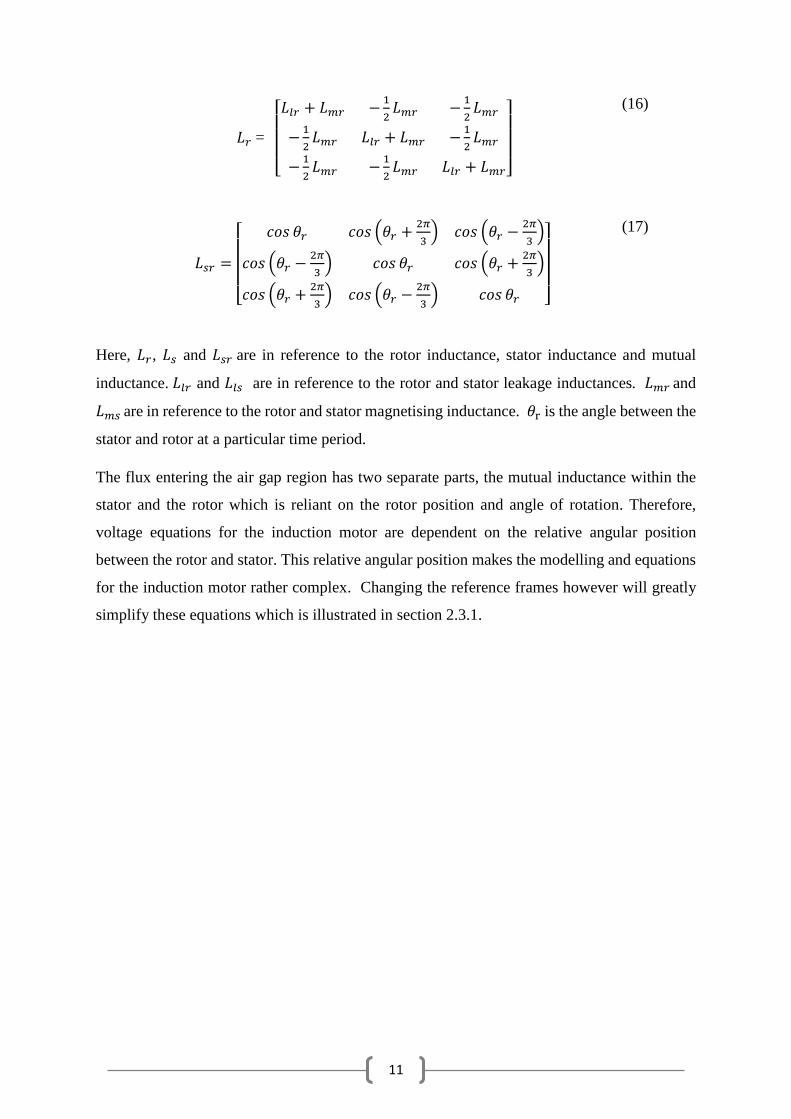
of the air gap. The winding inductances of the motor can be represented in matrix form from
Eq. 15-17 [22]:
𝐿𝑠 =
[ 𝐿𝑙𝑠 + 𝐿𝑚𝑠 −
1
2𝐿𝑚𝑠 −
1
2𝐿𝑚𝑠
−1
2𝐿𝑚𝑠 𝐿𝑙𝑠 + 𝐿𝑚𝑠 −
1
2𝐿𝑚𝑠
−1
2𝐿𝑚𝑠 −
1
2𝐿𝑚𝑠 𝐿𝑙𝑠 + 𝐿𝑚𝑠]
(15)
11
𝐿𝑟 =
[ 𝐿𝑙𝑟 + 𝐿𝑚𝑟 −
1
2𝐿𝑚𝑟 −
1
2𝐿𝑚𝑟
−1
2𝐿𝑚𝑟 𝐿𝑙𝑟 + 𝐿𝑚𝑟 −
1
2𝐿𝑚𝑟
−1
2𝐿𝑚𝑟 −
1
2𝐿𝑚𝑟 𝐿𝑙𝑟 + 𝐿𝑚𝑟]
(16)
𝐿𝑠𝑟 =
[ 𝑐𝑜𝑠 𝜃𝑟 𝑐𝑜𝑠 (𝜃𝑟 +
2𝜋
3) 𝑐𝑜𝑠 (𝜃𝑟 −
2𝜋
3)
𝑐𝑜𝑠 (𝜃𝑟 −2𝜋
3) 𝑐𝑜𝑠 𝜃𝑟 𝑐𝑜𝑠 (𝜃𝑟 +
2𝜋
3)
𝑐𝑜𝑠 (𝜃𝑟 +2𝜋
3) 𝑐𝑜𝑠 (𝜃𝑟 −
2𝜋
3) 𝑐𝑜𝑠 𝜃𝑟 ]
(17)
Here, 𝐿𝑟, 𝐿𝑠 and 𝐿𝑠𝑟 are in reference to the rotor inductance, stator inductance and mutual
inductance. 𝐿𝑙𝑟 and 𝐿𝑙𝑠 are in reference to the rotor and stator leakage inductances. 𝐿𝑚𝑟 and
𝐿𝑚𝑠 are in reference to the rotor and stator magnetising inductance. 𝜃r is the angle between the
stator and rotor at a particular time period.
The flux entering the air gap region has two separate parts, the mutual inductance within the
stator and the rotor which is reliant on the rotor position and angle of rotation. Therefore,
voltage equations for the induction motor are dependent on the relative angular position
between the rotor and stator. This relative angular position makes the modelling and equations
for the induction motor rather complex. Changing the reference frames however will greatly
simplify these equations which is illustrated in section 2.3.1.
12
2.3.1 Reference Frame Theory
The phase voltage equations derived in the previous section involve time dependent differential
equations as shown in Eq.11-12. Reference frames eliminate the time varying components
which facilitate the analysis of three-phase machines.
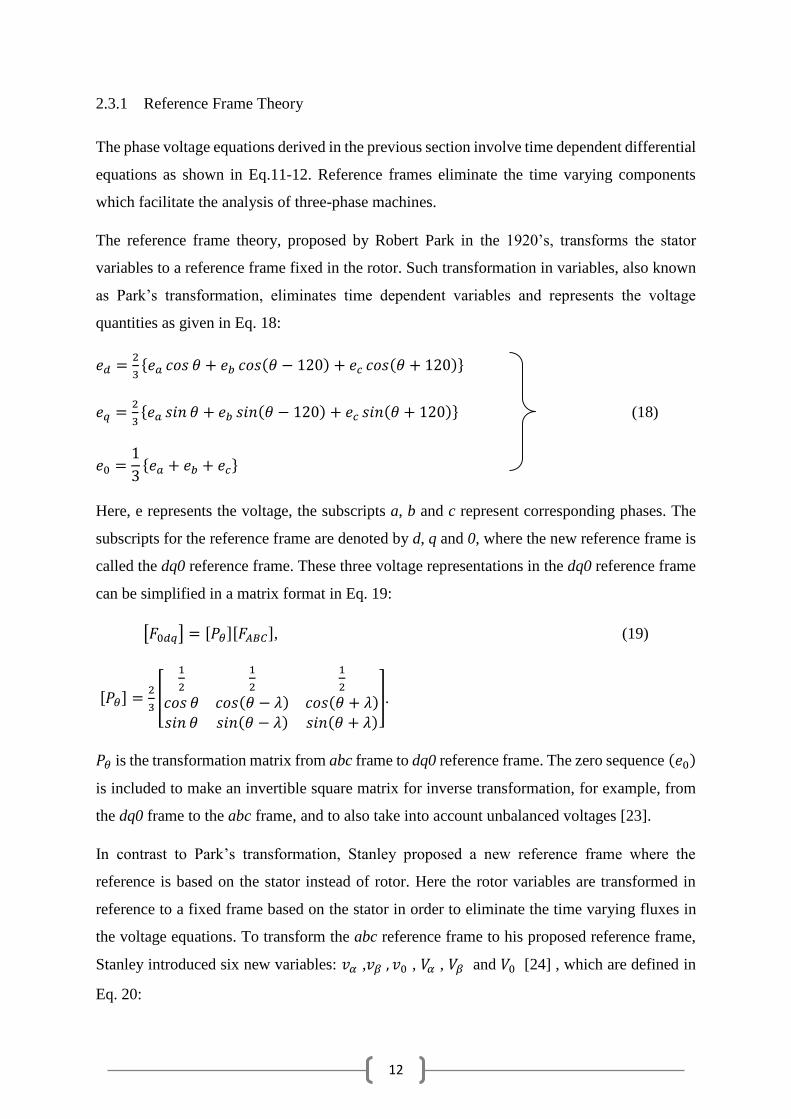
The reference frame theory, proposed by Robert Park in the 1920’s, transforms the stator
variables to a reference frame fixed in the rotor. Such transformation in variables, also known
as Park’s transformation, eliminates time dependent variables and represents the voltage
quantities as given in Eq. 18:
𝑒𝑑 =2
3𝑒𝑎 𝑐𝑜𝑠 𝜃 + 𝑒𝑏 𝑐𝑜𝑠(𝜃 − 120) + 𝑒𝑐 𝑐𝑜𝑠(𝜃 + 120)
𝑒𝑞 =2
3𝑒𝑎 𝑠𝑖𝑛 𝜃 + 𝑒𝑏 𝑠𝑖𝑛(𝜃 − 120) + 𝑒𝑐 𝑠𝑖𝑛(𝜃 + 120) (18)
𝑒0 =1
3𝑒𝑎 + 𝑒𝑏 + 𝑒𝑐
Here, e represents the voltage, the subscripts a, b and c represent corresponding phases. The
subscripts for the reference frame are denoted by d, q and 0, where the new reference frame is
called the dq0 reference frame. These three voltage representations in the dq0 reference frame
can be simplified in a matrix format in Eq. 19:
[𝐹0𝑑𝑞] = [𝑃𝜃][𝐹𝐴𝐵𝐶], (19)
[𝑃𝜃] =2
3[
1
2
1
2
1
2
𝑐𝑜𝑠 𝜃 𝑐𝑜𝑠(𝜃 − 𝜆) 𝑐𝑜𝑠(𝜃 + 𝜆)
𝑠𝑖𝑛 𝜃 𝑠𝑖𝑛(𝜃 − 𝜆) 𝑠𝑖𝑛(𝜃 + 𝜆)
].
𝑃𝜃 is the transformation matrix from abc frame to dq0 reference frame. The zero sequence (𝑒0)
is included to make an invertible square matrix for inverse transformation, for example, from
the dq0 frame to the abc frame, and to also take into account unbalanced voltages [23].
In contrast to Park’s transformation, Stanley proposed a new reference frame where the
reference is based on the stator instead of rotor. Here the rotor variables are transformed in
reference to a fixed frame based on the stator in order to eliminate the time varying fluxes in
the voltage equations. To transform the abc reference frame to his proposed reference frame,
Stanley introduced six new variables: 𝑣𝛼 ,𝑣𝛽 , 𝑣0 , 𝑉𝛼 , 𝑉𝛽 and 𝑉0 [24] , which are defined in
Eq. 20:
13
𝑣0 =1
3(𝑣1 + 𝑣2 + 𝑣3)
𝑣𝛼 =2
3[𝑣1 𝑐𝑜𝑠 𝜃 + 𝑣2 𝑐𝑜𝑠 (𝜃 +
2𝜋
3) + 𝑣3 𝑐𝑜𝑠 (𝜃 −
2𝜋
3)]
𝑣𝛽 =2
3[𝑣1 𝑠𝑖𝑛 𝜃 + 𝑣2 𝑠𝑖𝑛 (𝜃 +
2𝜋
3) + 𝑣3 𝑠𝑖𝑛 (𝜃 −
2𝜋
3)]
𝑉0 =1
3(𝑣𝑎 + 𝑣𝑏 + 𝑣𝑐)
𝑉𝛼 =2
3[𝑣𝑎 −
1
2(𝑣𝑏 − 𝑣𝑐)] (20)
𝑉𝑏 =√3
2(𝑣𝑏 − 𝑣𝑐)
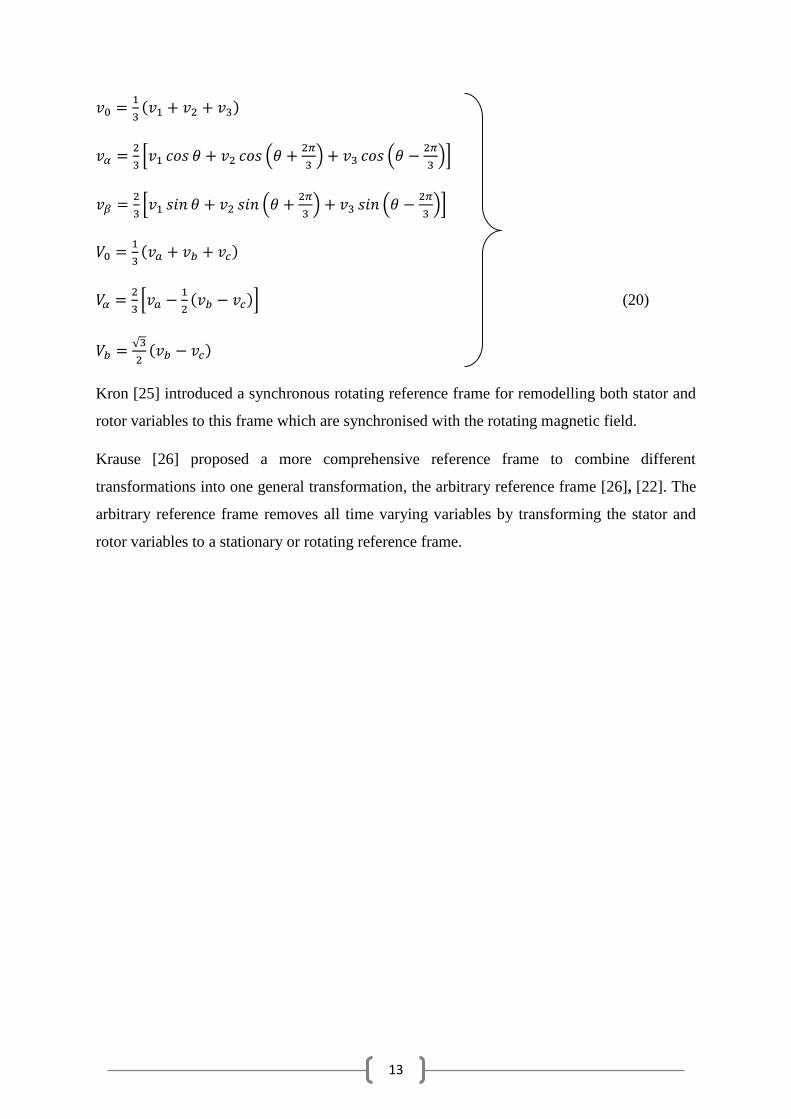
Kron [25] introduced a synchronous rotating reference frame for remodelling both stator and
rotor variables to this frame which are synchronised with the rotating magnetic field.
Krause [26] proposed a more comprehensive reference frame to combine different
transformations into one general transformation, the arbitrary reference frame [26], [22]. The
arbitrary reference frame removes all time varying variables by transforming the stator and
rotor variables to a stationary or rotating reference frame.
14
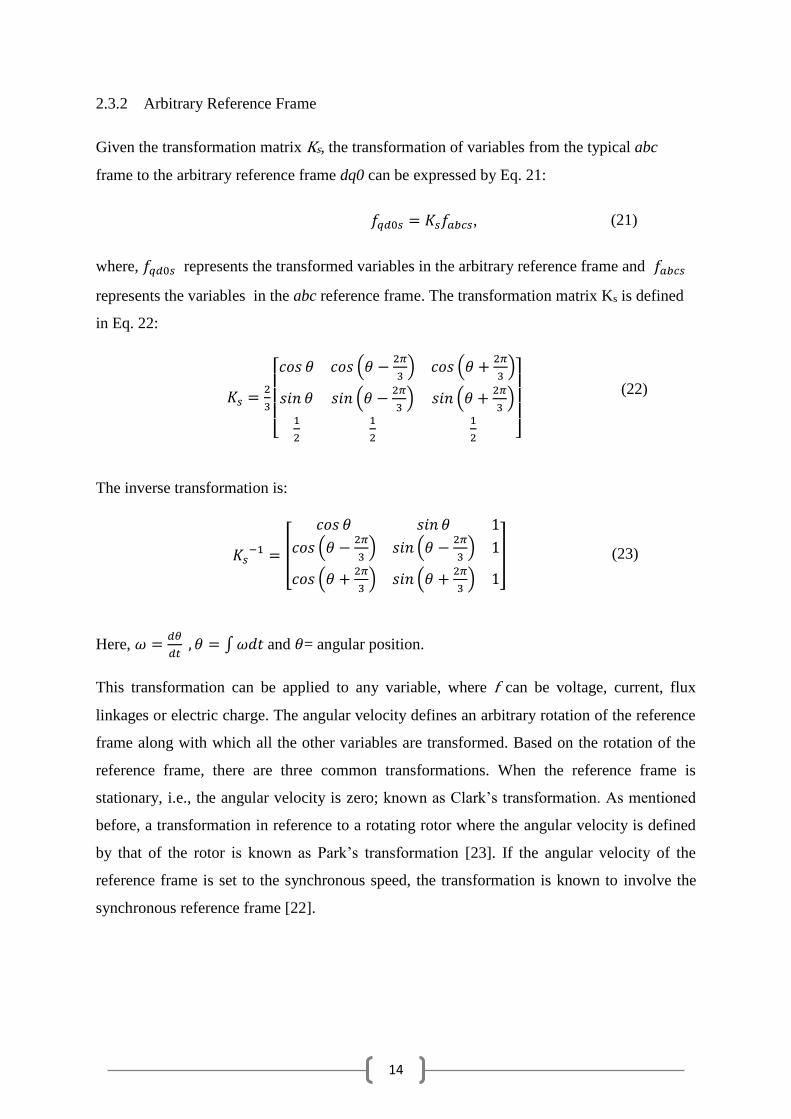
2.3.2 Arbitrary Reference Frame
Given the transformation matrix Ks, the transformation of variables from the typical abc
frame to the arbitrary reference frame dq0 can be expressed by Eq. 21:
where, 𝑓𝑞𝑑0𝑠 represents the transformed variables in the arbitrary reference frame and 𝑓𝑎𝑏𝑐𝑠
represents the variables in the abc reference frame. The transformation matrix Ks is defined
in Eq. 22:
𝐾𝑠 =2
3
[ 𝑐𝑜𝑠 𝜃 𝑐𝑜𝑠 (𝜃 −
2𝜋
3) 𝑐𝑜𝑠 (𝜃 +
2𝜋
3)
𝑠𝑖𝑛 𝜃 𝑠𝑖𝑛 (𝜃 −2𝜋
3) 𝑠𝑖𝑛 (𝜃 +
2𝜋
3)
1
2
1
2
1
2 ]
(22)
The inverse transformation is:
𝐾𝑠−1 = [
𝑐𝑜𝑠 𝜃 𝑠𝑖𝑛 𝜃 1
𝑐𝑜𝑠 (𝜃 −2𝜋
3) 𝑠𝑖𝑛 (𝜃 −
2𝜋
3) 1
𝑐𝑜𝑠 (𝜃 +2𝜋
3) 𝑠𝑖𝑛 (𝜃 +
2𝜋
3) 1
]
(23)
Here, 𝜔 =𝑑𝜃
𝑑𝑡 , 𝜃 = ∫𝜔𝑑𝑡 and 𝜃= angular position.
This transformation can be applied to any variable, where f can be voltage, current, flux
linkages or electric charge. The angular velocity defines an arbitrary rotation of the reference
frame along with which all the other variables are transformed. Based on the rotation of the
reference frame, there are three common transformations. When the reference frame is
stationary, i.e., the angular velocity is zero; known as Clark’s transformation. As mentioned
before, a transformation in reference to a rotating rotor where the angular velocity is defined
by that of the rotor is known as Park’s transformation [23]. If the angular velocity of the
reference frame is set to the synchronous speed, the transformation is known to involve the
synchronous reference frame [22].
𝑓𝑞𝑑0𝑠 = 𝐾𝑠𝑓𝑎𝑏𝑐𝑠, (21)
15
2.3.3 Types of Reference Frames
Stationary reference frame: The stationary reference frame is fixed where the f, d and q axes
are fixed in a static position (𝜔 = 0). The transformation in the stationary reference frame
(Clark’s transformation), uses notations: 𝑓𝛼,𝑓𝛽 , and 𝑓0 for the transformed variables.
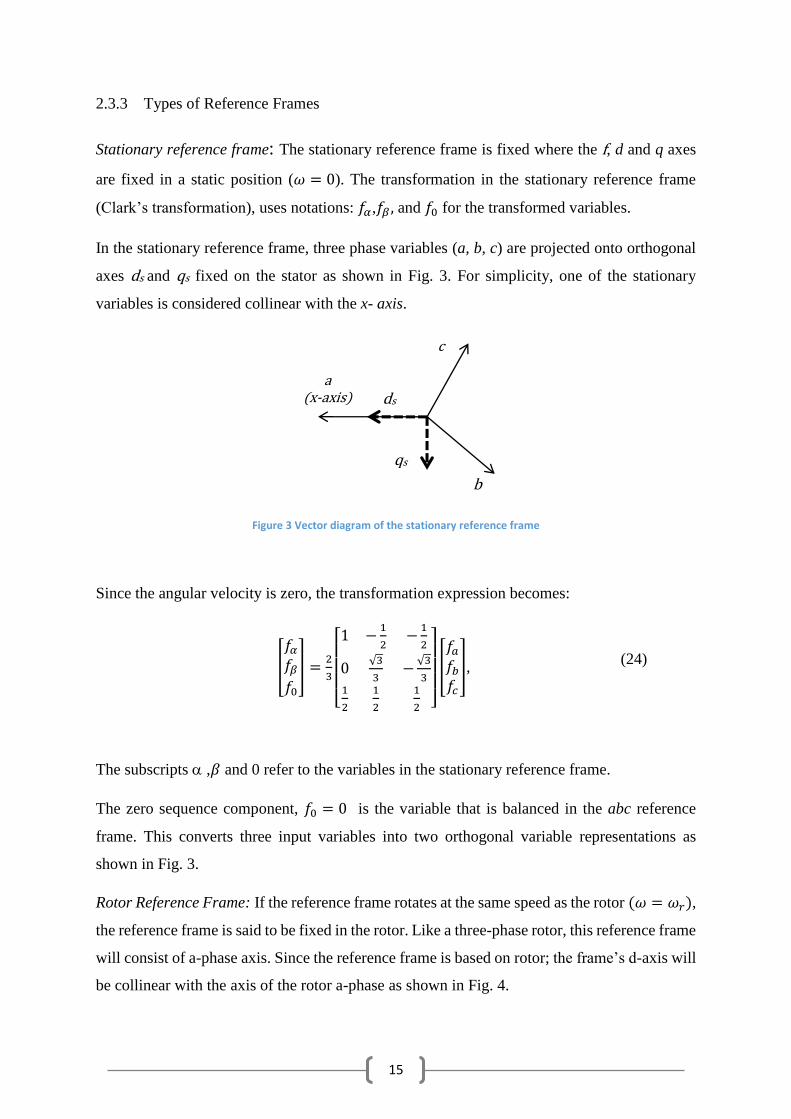
In the stationary reference frame, three phase variables (a, b, c) are projected onto orthogonal
axes ds and qs fixed on the stator as shown in Fig. 3. For simplicity, one of the stationary
variables is considered collinear with the x- axis.
Figure 3 Vector diagram of the stationary reference frame
Since the angular velocity is zero, the transformation expression becomes:
[
𝑓𝛼𝑓𝛽𝑓0
] =2
3
[ 1 −
1
2−1
2
0√3
3−√3
31
2
1
2
1
2 ]
[
𝑓𝑎𝑓𝑏𝑓𝑐
],
(24)
The subscripts ,𝛽 and 0 refer to the variables in the stationary reference frame.
The zero sequence component, 𝑓0 = 0 is the variable that is balanced in the abc reference
frame. This converts three input variables into two orthogonal variable representations as
shown in Fig. 3.
Rotor Reference Frame: If the reference frame rotates at the same speed as the rotor (𝜔 = 𝜔𝑟),
the reference frame is said to be fixed in the rotor. Like a three-phase rotor, this reference frame
will consist of a-phase axis. Since the reference frame is based on rotor; the frame’s d-axis will
be collinear with the axis of the rotor a-phase as shown in Fig. 4.
qs
ds
a
(x-axis)
b
c
16
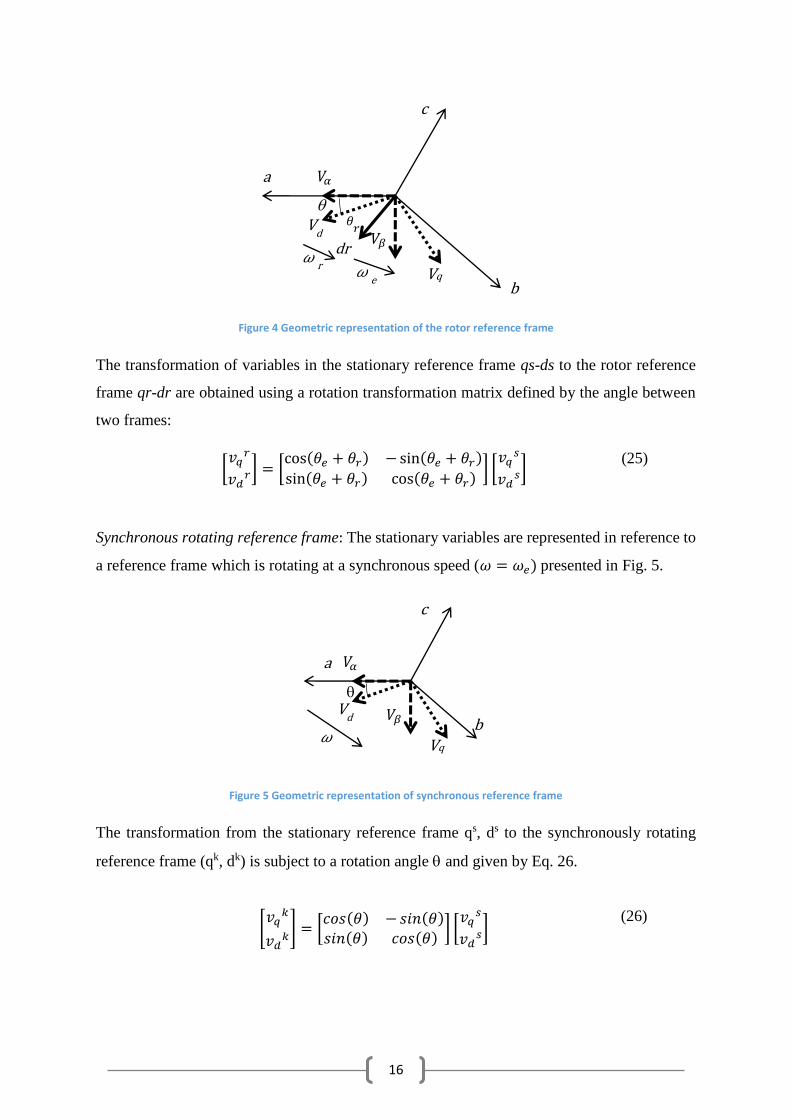
Figure 4 Geometric representation of the rotor reference frame
The transformation of variables in the stationary reference frame qs-ds to the rotor reference
frame qr-dr are obtained using a rotation transformation matrix defined by the angle between
two frames:
[𝑣𝑞𝑟
𝑣𝑑𝑟] = [
cos(𝜃𝑒 + 𝜃𝑟) − sin(𝜃𝑒 + 𝜃𝑟)
sin(𝜃𝑒 + 𝜃𝑟) cos(𝜃𝑒 + 𝜃𝑟)] [𝑣𝑞𝑠
𝑣𝑑𝑠]
(25)
Synchronous rotating reference frame: The stationary variables are represented in reference to
a reference frame which is rotating at a synchronous speed (𝜔 = 𝜔𝑒) presented in Fig. 5.
Figure 5 Geometric representation of synchronous reference frame
The transformation from the stationary reference frame qs, ds to the synchronously rotating
reference frame (qk, dk) is subject to a rotation angle and given by Eq. 26.
[𝑣𝑞𝑘
𝑣𝑑𝑘] = [
𝑐𝑜𝑠(𝜃) − 𝑠𝑖𝑛(𝜃)
𝑠𝑖𝑛(𝜃) 𝑐𝑜𝑠(𝜃)] [𝑣𝑞𝑠
𝑣𝑑𝑠]
(26)
𝑉𝛽
𝑉𝛼
a
b
c
Vq
Vd
𝜔 e
𝜔 r
dr
𝜃𝑟
𝑉𝛽
𝑉𝛼
a
b
c
Vq
Vd
𝜔
17
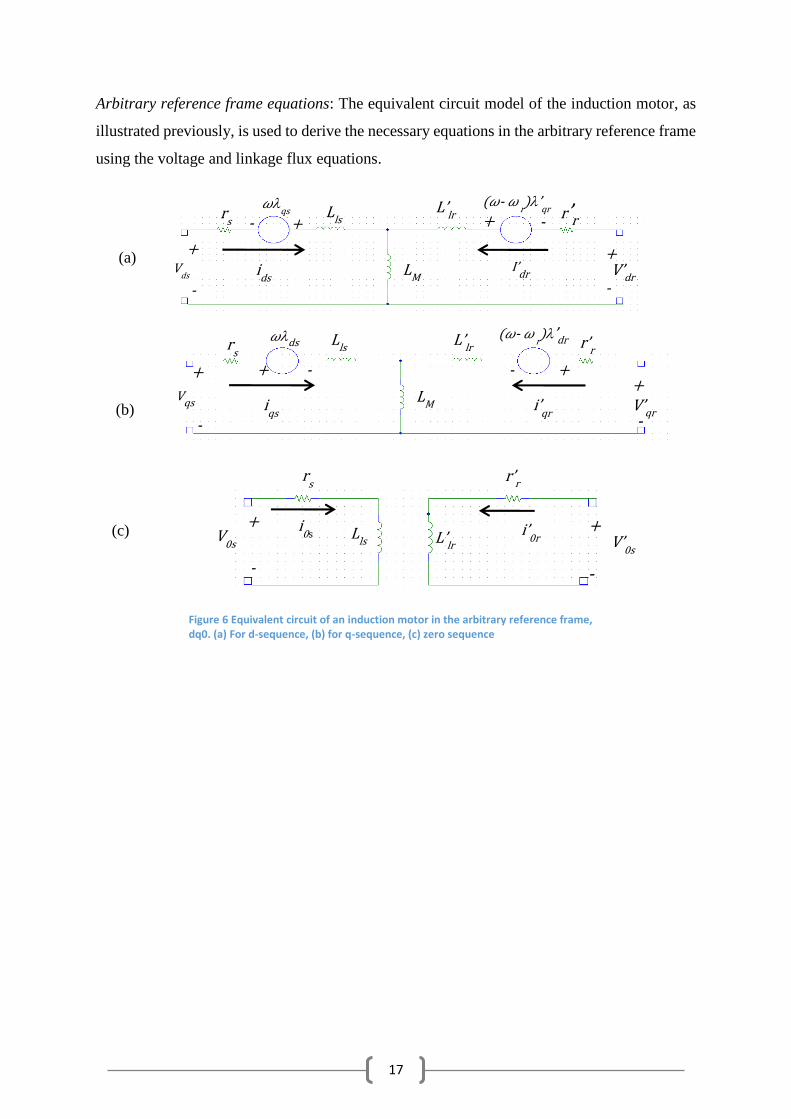
Arbitrary reference frame equations: The equivalent circuit model of the induction motor, as
illustrated previously, is used to derive the necessary equations in the arbitrary reference frame
using the voltage and linkage flux equations.
(a)
(b)
(c)
rs
𝜔ds L
ls L’
lr r’
r
LM
iqs
Vqs
V’qr
(𝜔- 𝜔 r)’dr
i’qr
+ - - +
+
-
+
-
rs
𝜔
qs
Lls
L’lr
r’r
LM
ids
Vds
V’dr
(𝜔- 𝜔 r)’
qr
I’dr
+ - + -
+ +
-
-
r’r r
s
+
-
i0s L
ls L’
lr
i’0r
+
-
V0s
V’0s
Figure 6 Equivalent circuit of an induction motor in the arbitrary reference frame, dq0. (a) For d-sequence, (b) for q-sequence, (c) zero sequence
18
Using Figure 6, the differential equations for the stator and rotor flux linkages are solved by
referring them to a reference frame at arbitary angular velocity as shown in Eq. 27-28, in this
instance 𝜔𝑟 is the electrical angular velocity and 𝜔 is the reference frame angular velocity:
𝑣𝑞𝑠 = 𝑟𝑠𝑖𝑞𝑠 +𝑑𝜆𝑞𝑠
𝑑𝑡+ 𝜔𝜆𝑑𝑠
𝑣𝑑𝑠 = 𝑟𝑠𝑖𝑑𝑠 +𝑑𝜆𝑑𝑠
𝑑𝑡− 𝜔𝜆𝑞𝑠 (27)
𝑣′𝑞𝑟 = 𝑟′𝑟𝑖′𝑞𝑟 +𝑑𝜆′𝑞𝑟
𝑑𝑡+ (𝜔−𝜔𝑟)𝜆′𝑑𝑟
𝑣′𝑑𝑟 = 𝑟′𝑟𝑖′𝑑𝑟 +𝑑𝜆′𝑑𝑟
𝑑𝑡+ (𝜔−𝜔𝑟)𝜆′𝑞𝑟
𝜆𝑑𝑠 = 𝐿𝑠𝑖𝑑𝑠 + 𝐿𝑚𝑖′𝑑𝑟
𝜆𝑞𝑠 = 𝐿𝑠𝑖𝑞𝑠 + 𝐿𝑚𝑖′𝑞𝑟 (28)
𝜆′𝑞𝑟 = 𝐿′𝑟𝑖′𝑞𝑟 + 𝐿𝑚𝑖𝑞𝑠
𝜆′𝑑𝑟 = 𝐿′𝑟𝑖′𝑑𝑟 + 𝐿𝑚𝑖𝑑𝑠
From the flux linkage equations, the currents can also be represented as a function of flux
linkage by substituting Eq. 28 into Eq. 27:
𝑖𝑞𝑠 =𝐿𝑟𝜆𝑞𝑠−𝐿𝑚𝜆′𝑞𝑟
𝐿𝑟𝐿𝑠−𝐿𝑚2
𝑖𝑑𝑠 =𝐿𝑟𝜆𝑑𝑠−𝐿𝑚𝜆′𝑑𝑟
𝐿𝑟𝐿𝑠−𝐿𝑚2 (29)
𝑖′𝑞𝑟 =𝐿𝑠𝜆′𝑞𝑟−𝐿𝑚𝜆𝑞𝑠
𝐿𝑟𝐿𝑠−𝐿𝑚2
𝑖′𝑑𝑟 =𝐿𝑟𝜆′𝑑𝑟−𝐿𝑚𝜆′𝑑𝑟
𝐿𝑟𝐿𝑠−𝐿𝑚2
For the three types of reference frames, the angular position 𝜃 and position difference are
summarised in Table 2:
Table 2 Reference frame angular position and difference summary
Reference Frame 𝜽𝒓 𝜷
Rotor 𝜃 0
Stationary 0 -𝜃𝑟
Synchronous 𝜃𝑒 𝜃𝑒- 𝜃𝑟
19
The electromagnetic torque and rotor speed can be expressed in a variety of ways. Most
commonly used are the equations shown in Eq. 30-31 [27]:
𝑇𝑒 =3
2
𝑃
2(𝜆𝑑𝑠𝑖𝑞𝑠 − 𝜆𝑞𝑠𝑖𝑑𝑠) (30)
𝜔𝑟 = ∫𝑃
2𝐽(𝑇𝑒 − 𝑇𝐿), (31)
From the above equations, 𝑃 is equal to the number of poles and 𝐽 is the moment of inertia
value.
The moment of inertia (𝐽) and the flywheel effect (𝐺𝐷2) are used to describe the moment of
inertia. The fly wheel effect is common in industrial applications with unit 𝑘𝑔𝑓.𝑚2 and is
considered four times larger than value 𝐽. The flywheel effect of the motor is obtained from the
Toshiba catalogue for the 3P-IM which is 0.01 [27], where the frame number is D71M. The
relationship between 𝐽 and 𝐺𝐷2 is given by
𝐽 =𝐺𝐷2
4 (32)
Therefore, the moment of inertia is 0.0025kg.m2.
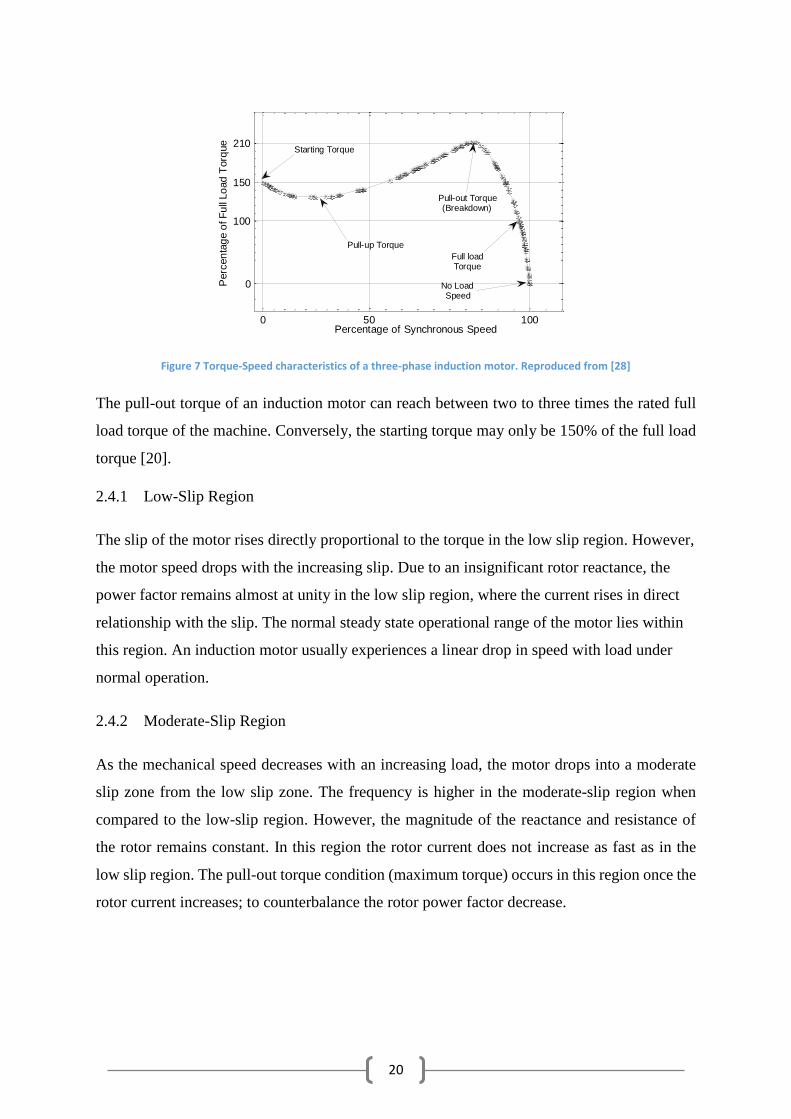
2.4 Torque-Speed Characteristics
The torque-speed characteristics provide crucial concepts in relation to the operation and
performance of the induction motor. The torque-speed characteristics of a 3P-IM can be
explained using three regions that lie between stationary and synchronous speed (Ns). This
range is fractionally represented by the slip (s) which is the ratio of the slip speed to
synchronous speed. The effective torque within this full range of speed can be defined in three
regions in terms of slip: low slip region, moderate slip region and high slip region. Each region
belongs to a specific operating condition of the motor in terms of torque as presented in Fig. 7.
20
Figure 7 Torque-Speed characteristics of a three-phase induction motor. Reproduced from [28]
The pull-out torque of an induction motor can reach between two to three times the rated full
load torque of the machine. Conversely, the starting torque may only be 150% of the full load
torque [20].
2.4.1 Low-Slip Region
The slip of the motor rises directly proportional to the torque in the low slip region. However,
the motor speed drops with the increasing slip. Due to an insignificant rotor reactance, the
power factor remains almost at unity in the low slip region, where the current rises in direct
relationship with the slip. The normal steady state operational range of the motor lies within
this region. An induction motor usually experiences a linear drop in speed with load under
normal operation.
2.4.2 Moderate-Slip Region
As the mechanical speed decreases with an increasing load, the motor drops into a moderate
slip zone from the low slip zone. The frequency is higher in the moderate-slip region when
compared to the low-slip region. However, the magnitude of the reactance and resistance of
the rotor remains constant. In this region the rotor current does not increase as fast as in the
low slip region. The pull-out torque condition (maximum torque) occurs in this region once the
rotor current increases; to counterbalance the rotor power factor decrease.
0 50 100
150
210
100
0
Percentage of Synchronous Speed
Perc
en
tag
e o
f F
ull
Lo
ad
Torq
ue
Starting Torque
Pull-up Torque
Pull-out Torque(Breakdown)
Full loadTorque
No Load Speed
21
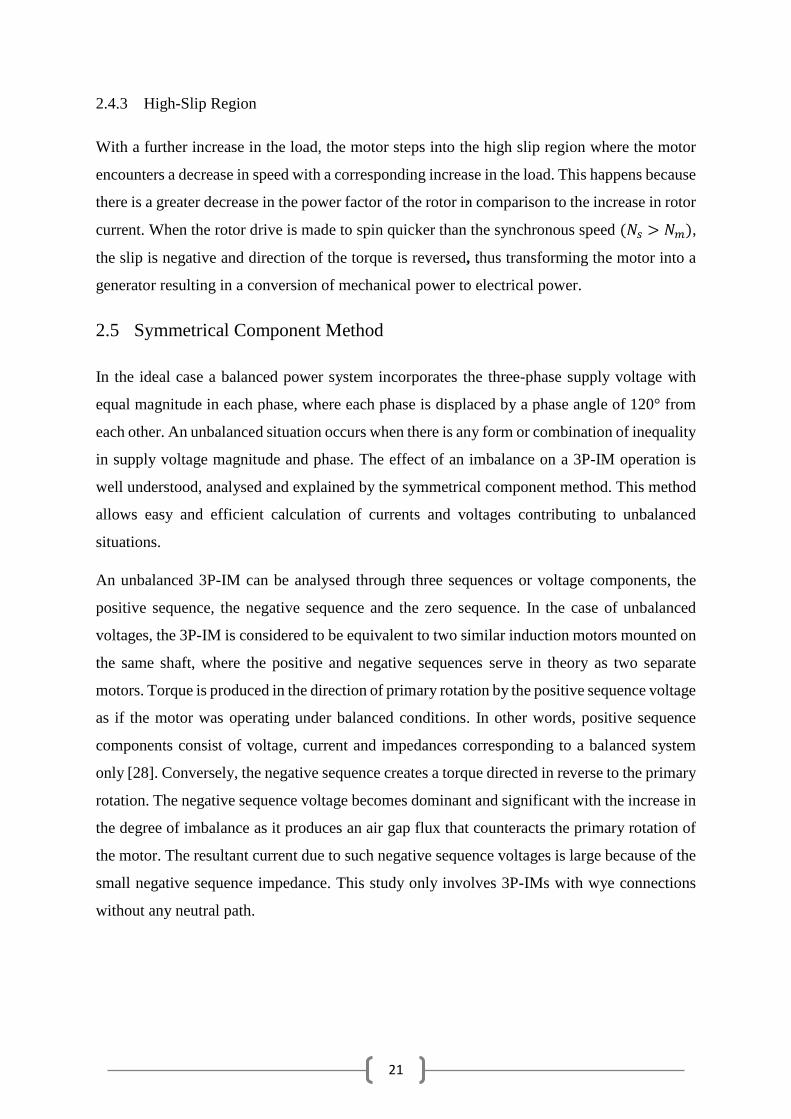
2.4.3 High-Slip Region
With a further increase in the load, the motor steps into the high slip region where the motor
encounters a decrease in speed with a corresponding increase in the load. This happens because
there is a greater decrease in the power factor of the rotor in comparison to the increase in rotor
current. When the rotor drive is made to spin quicker than the synchronous speed (𝑁𝑠 > 𝑁𝑚),
the slip is negative and direction of the torque is reversed, thus transforming the motor into a
generator resulting in a conversion of mechanical power to electrical power.
2.5 Symmetrical Component Method
In the ideal case a balanced power system incorporates the three-phase supply voltage with
equal magnitude in each phase, where each phase is displaced by a phase angle of 120° from
each other. An unbalanced situation occurs when there is any form or combination of inequality
in supply voltage magnitude and phase. The effect of an imbalance on a 3P-IM operation is
well understood, analysed and explained by the symmetrical component method. This method
allows easy and efficient calculation of currents and voltages contributing to unbalanced
situations.
An unbalanced 3P-IM can be analysed through three sequences or voltage components, the
positive sequence, the negative sequence and the zero sequence. In the case of unbalanced
voltages, the 3P-IM is considered to be equivalent to two similar induction motors mounted on
the same shaft, where the positive and negative sequences serve in theory as two separate
motors. Torque is produced in the direction of primary rotation by the positive sequence voltage
as if the motor was operating under balanced conditions. In other words, positive sequence
components consist of voltage, current and impedances corresponding to a balanced system
only [28]. Conversely, the negative sequence creates a torque directed in reverse to the primary
rotation. The negative sequence voltage becomes dominant and significant with the increase in
the degree of imbalance as it produces an air gap flux that counteracts the primary rotation of
the motor. The resultant current due to such negative sequence voltages is large because of the
small negative sequence impedance. This study only involves 3P-IMs with wye connections
without any neutral path.
22
2.5.1 Effects on Operational Characteristics
The negative sequence currents and voltages are essentially the results of unbalanced voltage
conditions, whereas under balanced conditions only the positive sequence components are
present. The negative sequence components counteract the real throughput of the motor and
contribute to power loss and generate excessive heat. The rotor losses are increased due to the
breakdown of voltage and currents into positive and negative sequences. Unbalanced
conditions also contribute to positive sequence voltage drops which result in an increase in the
positive sequence current within the stator and rotor, generating excessive heat [29].
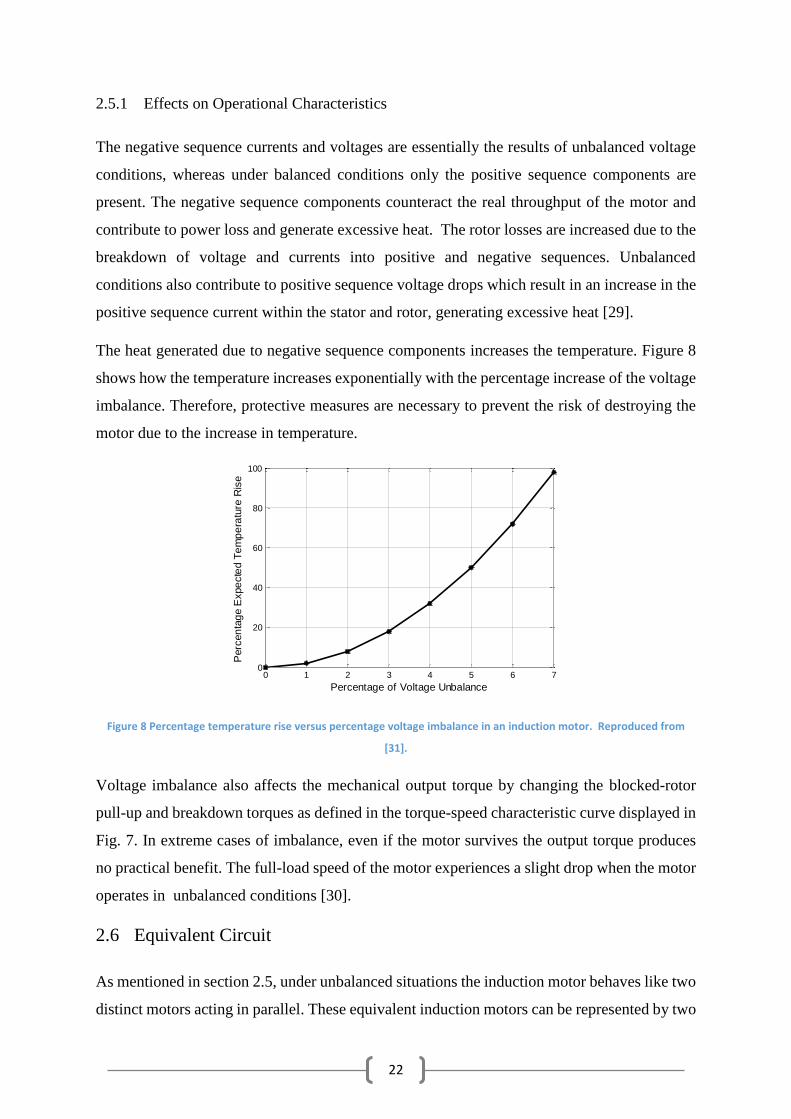
The heat generated due to negative sequence components increases the temperature. Figure 8
shows how the temperature increases exponentially with the percentage increase of the voltage
imbalance. Therefore, protective measures are necessary to prevent the risk of destroying the
motor due to the increase in temperature.
Figure 8 Percentage temperature rise versus percentage voltage imbalance in an induction motor. Reproduced from
[31].
Voltage imbalance also affects the mechanical output torque by changing the blocked-rotor
pull-up and breakdown torques as defined in the torque-speed characteristic curve displayed in
Fig. 7. In extreme cases of imbalance, even if the motor survives the output torque produces
no practical benefit. The full-load speed of the motor experiences a slight drop when the motor
operates in unbalanced conditions [30].
2.6 Equivalent Circuit
As mentioned in section 2.5, under unbalanced situations the induction motor behaves like two
distinct motors acting in parallel. These equivalent induction motors can be represented by two
0 1 2 3 4 5 6 70
20
40
60
80
100
Percentage of Voltage Unbalance
Perc
en
tag
e E
xpe
cte
d T
em
pe
ratu
re R
ise
23
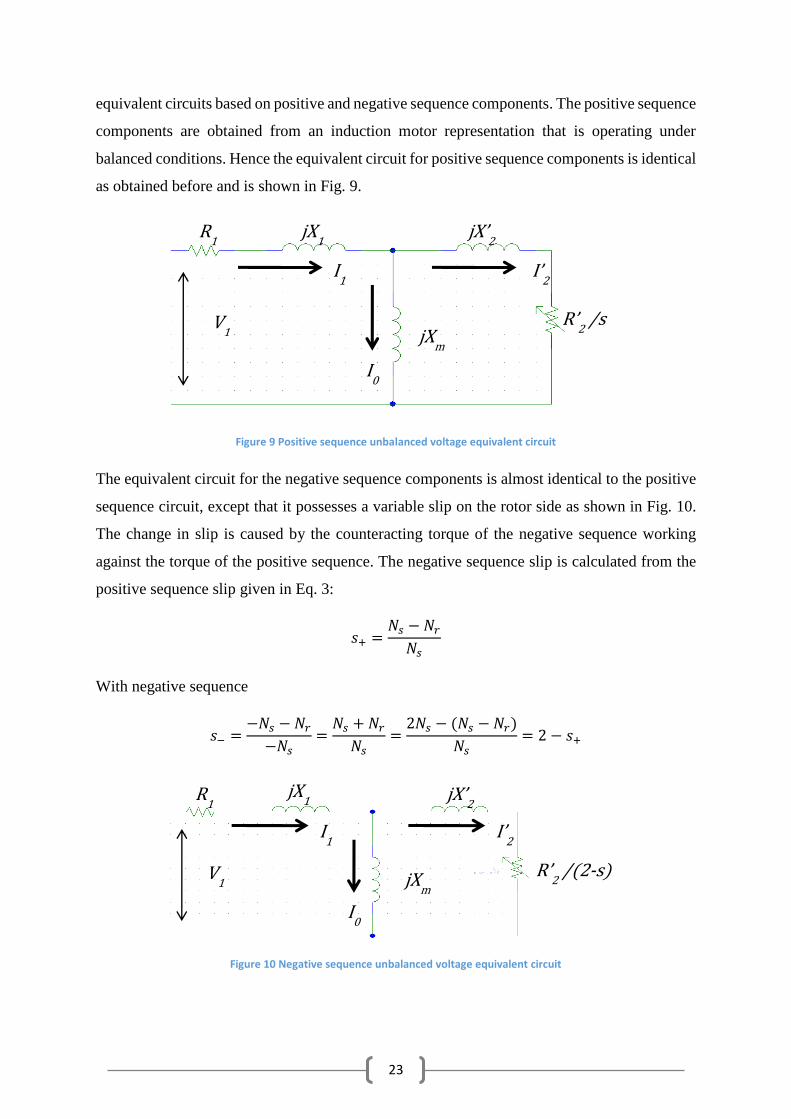
equivalent circuits based on positive and negative sequence components. The positive sequence
components are obtained from an induction motor representation that is operating under
balanced conditions. Hence the equivalent circuit for positive sequence components is identical
as obtained before and is shown in Fig. 9.
Figure 9 Positive sequence unbalanced voltage equivalent circuit
The equivalent circuit for the negative sequence components is almost identical to the positive
sequence circuit, except that it possesses a variable slip on the rotor side as shown in Fig. 10.
The change in slip is caused by the counteracting torque of the negative sequence working
against the torque of the positive sequence. The negative sequence slip is calculated from the
positive sequence slip given in Eq. 3:
𝑠+ =𝑁𝑠 − 𝑁𝑟𝑁𝑠
With negative sequence
𝑠− =−𝑁𝑠 − 𝑁𝑟−𝑁𝑠
=𝑁𝑠 + 𝑁𝑟𝑁𝑠
=2𝑁𝑠 − (𝑁𝑠 − 𝑁𝑟)
𝑁𝑠= 2 − 𝑠+
Figure 10 Negative sequence unbalanced voltage equivalent circuit
I1
I0
I’2
V1
jX1 jX’
2
jXm
R’2 /s
R1
I1
I0
I’2
V1
jX1 jX’
2
jXm
R’2 /(2-s)
R1
24
2.7 Standards for Degrees of Imbalance
The degree of imbalance is referenced under different Australian Standards provided as
published by ‘Standards Australia’ and the National Equipment Manufacturer’s Association
(NEMA). These standards are essential in establishing the necessary protection measures for
electrical machines and to prevent detrimental unbalanced situations.
This study adopted these standards to define the necessary metrics for unbalanced voltage
situations.
2.7.1 Percentage Voltage Imbalance (PVI)
The analysis of negative sequence components becomes important for voltage imbalance that
is 5% above the average. Similar to voltage unbalanced rate (LVUR) provided by NEMA [31].
LVUR – NEMA was used because it takes into account the phase angle in the average line
voltage imbalance while the Institute of Electrical and Electronics Engineers (IEEE) does not.
𝐿𝑉𝑈𝑅 (𝑁𝐸𝑀𝐴) =
𝑚𝑎𝑥. 𝑣𝑜𝑙𝑡𝑎𝑔𝑒 𝑑𝑒𝑣𝑖𝑎𝑡𝑖𝑜𝑛 𝑓𝑟𝑜𝑚 𝑎𝑣𝑒𝑟𝑎𝑔𝑒 𝑙𝑖𝑛𝑒 𝑣𝑜𝑙𝑡𝑎𝑔𝑒 𝑚𝑎𝑔𝑛𝑖𝑡𝑢𝑑𝑒
𝑎𝑣𝑒𝑟𝑎𝑔𝑒 𝑙𝑖𝑛𝑒 𝑣𝑜𝑙𝑡𝑎𝑔𝑒 𝑚𝑎𝑔𝑛𝑖𝑡𝑢𝑑𝑒 × 100%
(33)
The above formula gives an approximate value for the percentage of the negative sequence
voltage component. The actual negative sequence voltage component can be up to 18% greater
than the approximate value. Symmetrical components are analysed to provide a more accurate
estimation of negative sequence voltage components which may lead to unbalanced situations
[32].
25
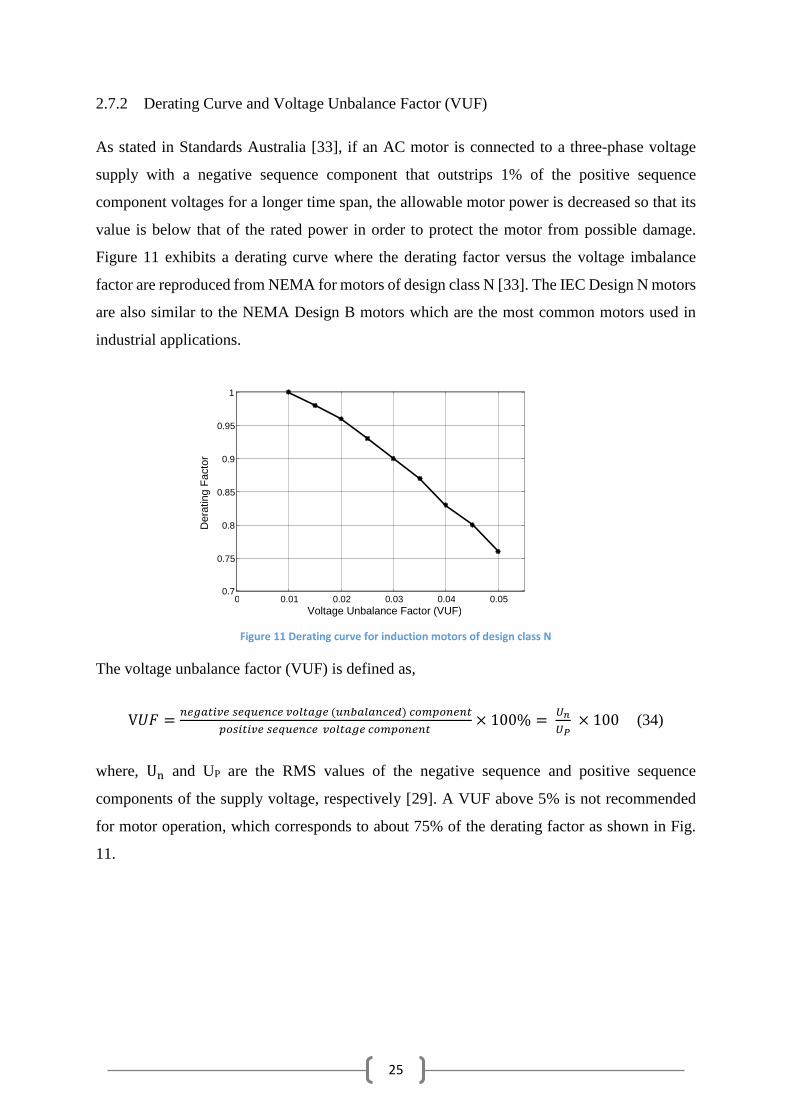
2.7.2 Derating Curve and Voltage Unbalance Factor (VUF)
As stated in Standards Australia [33], if an AC motor is connected to a three-phase voltage
supply with a negative sequence component that outstrips 1% of the positive sequence
component voltages for a longer time span, the allowable motor power is decreased so that its
value is below that of the rated power in order to protect the motor from possible damage.
Figure 11 exhibits a derating curve where the derating factor versus the voltage imbalance
factor are reproduced from NEMA for motors of design class N [33]. The IEC Design N motors
are also similar to the NEMA Design B motors which are the most common motors used in
industrial applications.
Figure 11 Derating curve for induction motors of design class N
The voltage unbalance factor (VUF) is defined as,
V𝑈𝐹 =𝑛𝑒𝑔𝑎𝑡𝑖𝑣𝑒 𝑠𝑒𝑞𝑢𝑒𝑛𝑐𝑒 𝑣𝑜𝑙𝑡𝑎𝑔𝑒 (𝑢𝑛𝑏𝑎𝑙𝑎𝑛𝑐𝑒𝑑) 𝑐𝑜𝑚𝑝𝑜𝑛𝑒𝑛𝑡
𝑝𝑜𝑠𝑖𝑡𝑖𝑣𝑒 𝑠𝑒𝑞𝑢𝑒𝑛𝑐𝑒 𝑣𝑜𝑙𝑡𝑎𝑔𝑒 𝑐𝑜𝑚𝑝𝑜𝑛𝑒𝑛𝑡 × 100% =
𝑈𝑛
𝑈𝑃 × 100 (34)
where, Un and UP are the RMS values of the negative sequence and positive sequence
components of the supply voltage, respectively [29]. A VUF above 5% is not recommended
for motor operation, which corresponds to about 75% of the derating factor as shown in Fig.
11.
0 0.01 0.02 0.03 0.04 0.05 0.7
0.75
0.8
0.85
0.9
0.95
1
Voltage Unbalance Factor (VUF)
Dera
tin
g F
acto
r
26
3 Methodology
To analyse the effect of voltage imbalances, this study conducts experiments in two sections.
The underlying methods for each section are illustrated in 3.1.
3.1 Laboratory Tests for Motor Parameter Estimation
This section involves practical experimentation in a laboratory setting to obtain different test
values. These test values are used in an electrical equivalent model of an induction motor to
obtain different physical parameters of the machine. An induction motor can be represented as
a transformer model where the stator is the primary winding and the rotor is the secondary
winding. The parameters of the motor models are as follows (see Fig. 1) stator resistance R1,
stator leakage reactance X1, magnetising reactance XM, rotor resistance R2 and rotor leakage
reactance X2. In order to obtain these parameter values for the motor under study, the following
three tests are conducted.
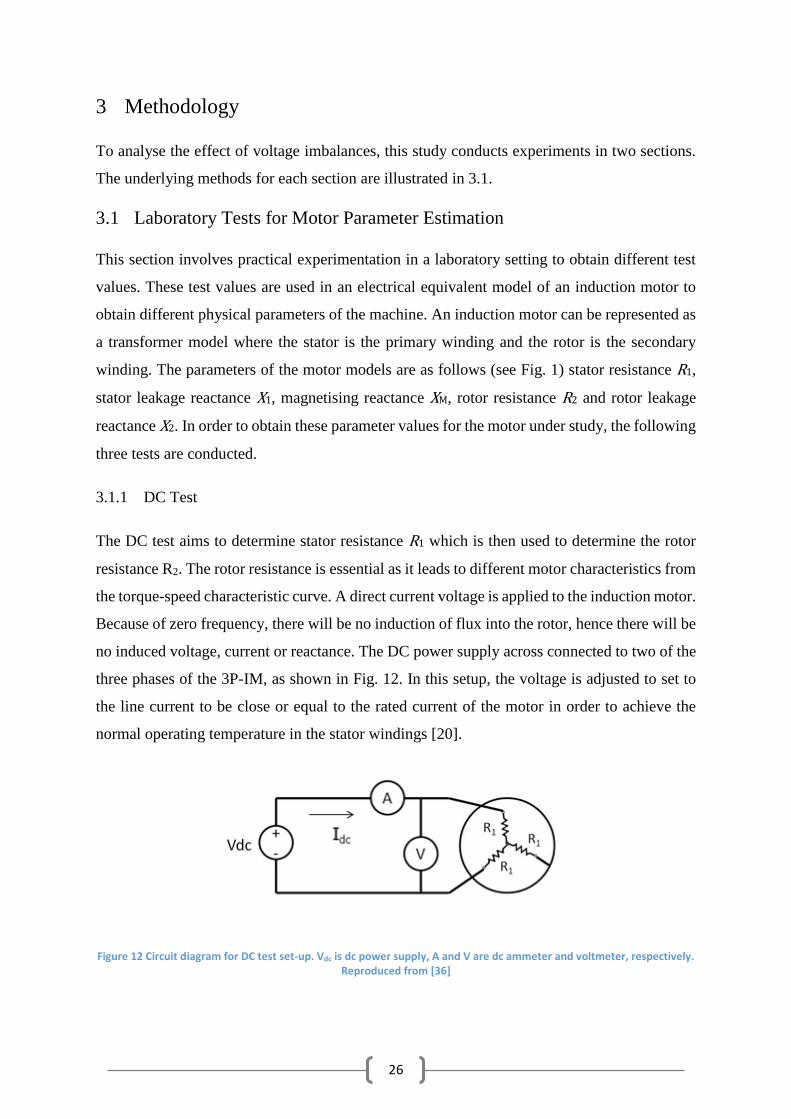
3.1.1 DC Test
The DC test aims to determine stator resistance R1 which is then used to determine the rotor
resistance R2. The rotor resistance is essential as it leads to different motor characteristics from
the torque-speed characteristic curve. A direct current voltage is applied to the induction motor.
Because of zero frequency, there will be no induction of flux into the rotor, hence there will be
no induced voltage, current or reactance. The DC power supply across connected to two of the
three phases of the 3P-IM, as shown in Fig. 12. In this setup, the voltage is adjusted to set to
the line current to be close or equal to the rated current of the motor in order to achieve the
normal operating temperature in the stator windings [20].
Figure 12 Circuit diagram for DC test set-up. Vdc is dc power supply, A and V are dc ammeter and voltmeter, respectively. Reproduced from [36]
27
The current flows through two stator windings, hence the total resistance in the current path
is 2𝑅1. From the supply voltage and resultant current, R1 can be easily obtained.
Considering the connection diagram shown in Fig. 12, the following steps are used as per the
laboratory guidelines to perform the DC test on an induction motor [36].
DC power supply and induction motor are tested to confirm their full functionality
before connecting anything. No power should be supplied until the setup is completed.
DC power is applied to two of the stator windings of the induction motor.
A DC voltmeter is placed across the two connected stator terminals.
A DC ammeter is placed in series with the DC power supply.
After the circuit is assembled, the DC power supply is turned on for the motor to carry
the rated current. The motor should not be operated beyond its rated values. Once the
rated current has been achieved the ammeter and voltmeter readings are recorded.
The power supply should be turned off and the stator resistor value should be calculated
from Eq. 35 for a star connected motor.
𝑅1 =
𝑉𝑑𝑐2 × 𝐼𝑑𝑐
(35)
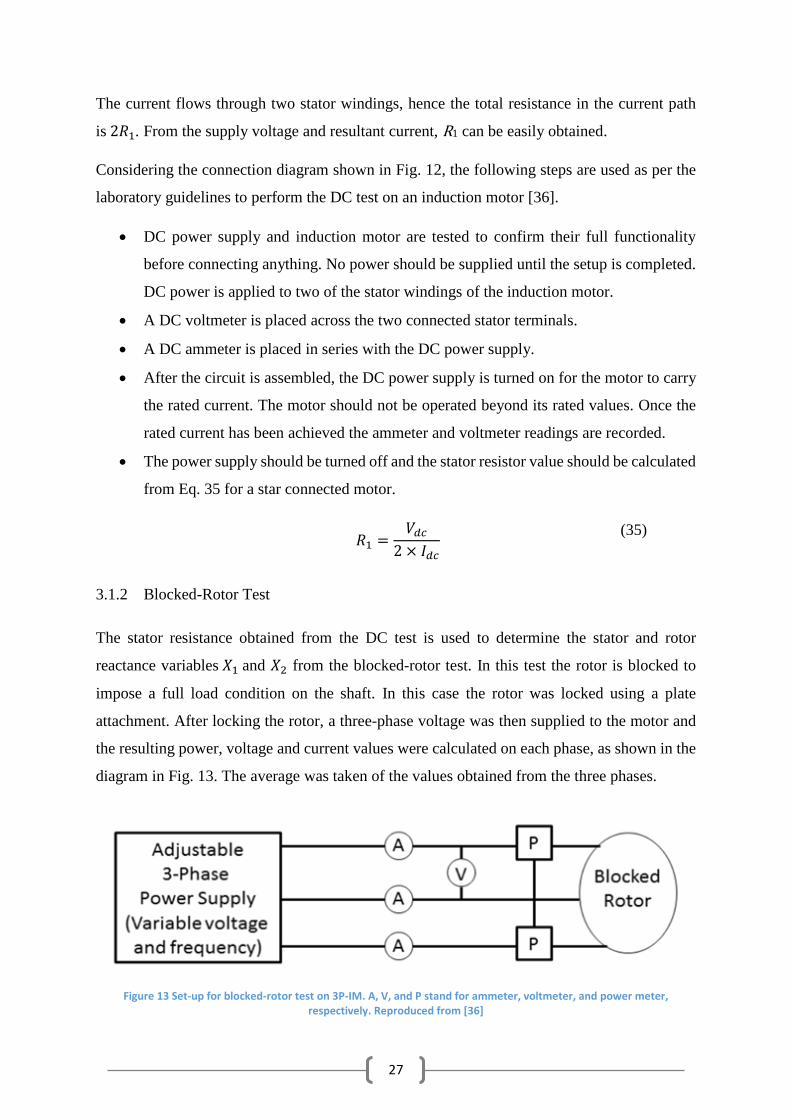
3.1.2 Blocked-Rotor Test
The stator resistance obtained from the DC test is used to determine the stator and rotor
reactance variables 𝑋1 and 𝑋2 from the blocked-rotor test. In this test the rotor is blocked to
impose a full load condition on the shaft. In this case the rotor was locked using a plate
attachment. After locking the rotor, a three-phase voltage was then supplied to the motor and
the resulting power, voltage and current values were calculated on each phase, as shown in the
diagram in Fig. 13. The average was taken of the values obtained from the three phases.
Figure 13 Set-up for blocked-rotor test on 3P-IM. A, V, and P stand for ammeter, voltmeter, and power meter, respectively. Reproduced from [36]

28
The blocked-rotor test requires an AC power supply applied to the stator, the current flow was
then adjusted to approximately full-load value. The voltmeter, ammeter and power meter
readings were then collected once the current had reached its rated value. These experimental
values were used to calculate the stator and rotor reactance values. Although the stator and
rotor reactance values are inseparable the values can be broken down based on empirical
findings.
Based on the connection diagram shown in Fig. 13, the procedural steps for the blocked-rotor
test are as follows.
Test the AC power Supply before organising the circuit.
An AC ammeter is placed in series with each phase of the induction motor in order to
measure the phase current.
Wattmeters should be connected across two of the phases (A and C in Fig. 13) for
measuring the real power.
The voltmeter is connected across phases A and B.
The rotor should be locked in place before connecting the power supply. The AC power
supply is then turned on and adjusted until the current approaches the rated current
value. The current should not exceed the rated value for the motor. When the rated
current is achieved the power, voltage and current readings are then taken. After taking
the readings the AC power supply is then turned off and the stator and rotor parameters
are obtained using the following calculations.
At the blocked-rotor condition the mechanical speed is zero which indicates that slip is at unity.
Therefore the rotor current becomes much larger than the exciting current, which can then be
ignored. The equivalent per-phase circuit diagram under blocked rotor test conditions is shown
in Fig. 14.
R1
jX1
ILR
jX’2
R’2
VLR
I’2
Figure 14 Per-phase equivalent circuit under blocked rotor test condition
29
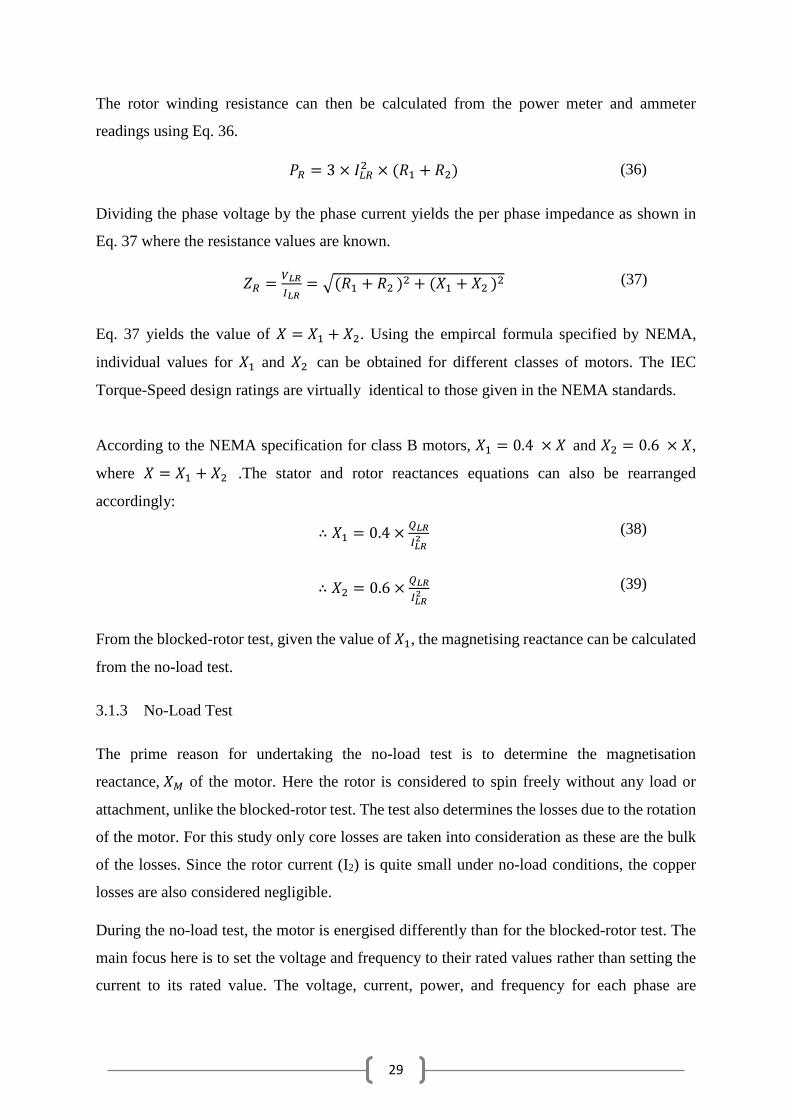
The rotor winding resistance can then be calculated from the power meter and ammeter
readings using Eq. 36.
𝑃𝑅 = 3 × 𝐼𝐿𝑅2 × (𝑅1 + 𝑅2) (36)
Dividing the phase voltage by the phase current yields the per phase impedance as shown in
Eq. 37 where the resistance values are known.
𝑍𝑅 =𝑉𝐿𝑅
𝐼𝐿𝑅= √(𝑅1 + 𝑅2 )2 + (𝑋1 + 𝑋2 )2 (37)
Eq. 37 yields the value of 𝑋 = 𝑋1 + 𝑋2. Using the empircal formula specified by NEMA,
individual values for 𝑋1 and 𝑋2 can be obtained for different classes of motors. The IEC
Torque-Speed design ratings are virtually identical to those given in the NEMA standards.
According to the NEMA specification for class B motors, 𝑋1 = 0.4 × 𝑋 and 𝑋2 = 0.6 × 𝑋,
where 𝑋 = 𝑋1 + 𝑋2 .The stator and rotor reactances equations can also be rearranged
accordingly:
∴ 𝑋1 = 0.4 ×𝑄𝐿𝑅
𝐼𝐿𝑅2 (38)
∴ 𝑋2 = 0.6 ×𝑄𝐿𝑅
𝐼𝐿𝑅2 (39)
From the blocked-rotor test, given the value of 𝑋1, the magnetising reactance can be calculated
from the no-load test.
3.1.3 No-Load Test
The prime reason for undertaking the no-load test is to determine the magnetisation
reactance, 𝑋𝑀 of the motor. Here the rotor is considered to spin freely without any load or
attachment, unlike the blocked-rotor test. The test also determines the losses due to the rotation
of the motor. For this study only core losses are taken into consideration as these are the bulk
of the losses. Since the rotor current (I2) is quite small under no-load conditions, the copper
losses are also considered negligible.
During the no-load test, the motor is energised differently than for the blocked-rotor test. The
main focus here is to set the voltage and frequency to their rated values rather than setting the
current to its rated value. The voltage, current, power, and frequency for each phase are
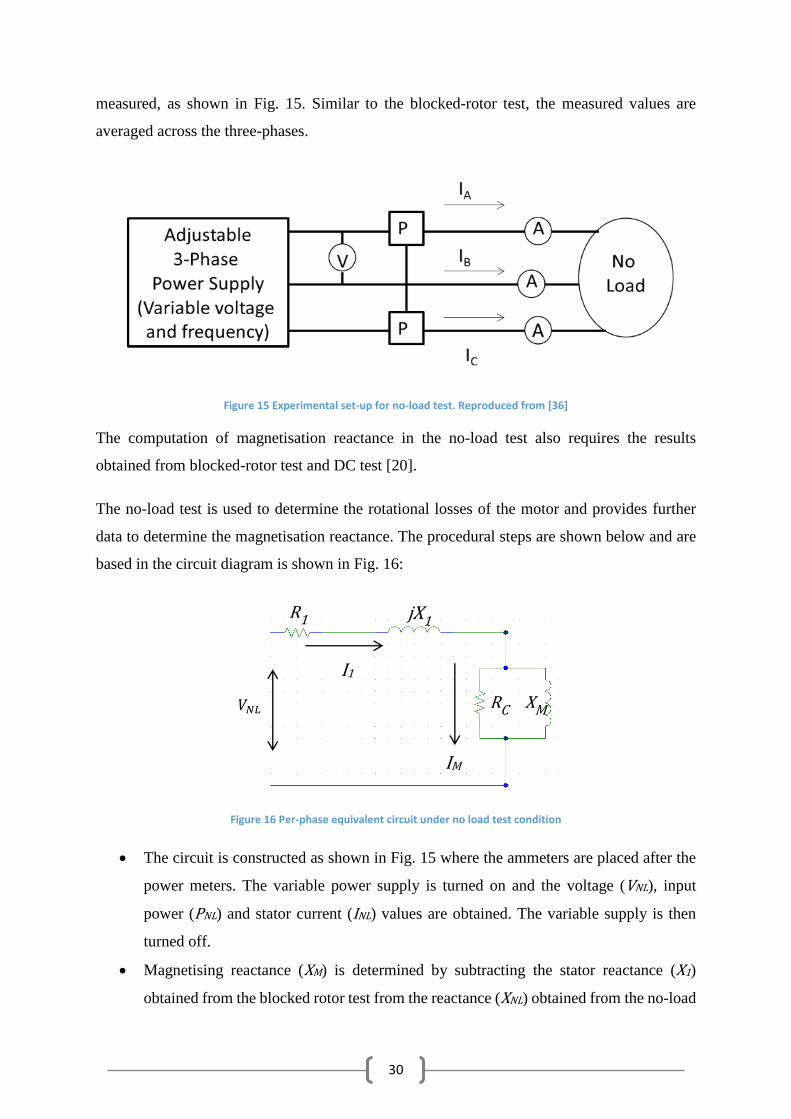
30
measured, as shown in Fig. 15. Similar to the blocked-rotor test, the measured values are
averaged across the three-phases.
Figure 15 Experimental set-up for no-load test. Reproduced from [36]
The computation of magnetisation reactance in the no-load test also requires the results
obtained from blocked-rotor test and DC test [20].
The no-load test is used to determine the rotational losses of the motor and provides further
data to determine the magnetisation reactance. The procedural steps are shown below and are
based in the circuit diagram is shown in Fig. 16:
Figure 16 Per-phase equivalent circuit under no load test condition
The circuit is constructed as shown in Fig. 15 where the ammeters are placed after the
power meters. The variable power supply is turned on and the voltage (VNL), input
power (PNL) and stator current (INL) values are obtained. The variable supply is then
turned off.
Magnetising reactance (XM) is determined by subtracting the stator reactance (X1)
obtained from the blocked rotor test from the reactance (XNL) obtained from the no-load
R1 jX1
RC XM 𝑉𝑁𝐿
p
I1
IM
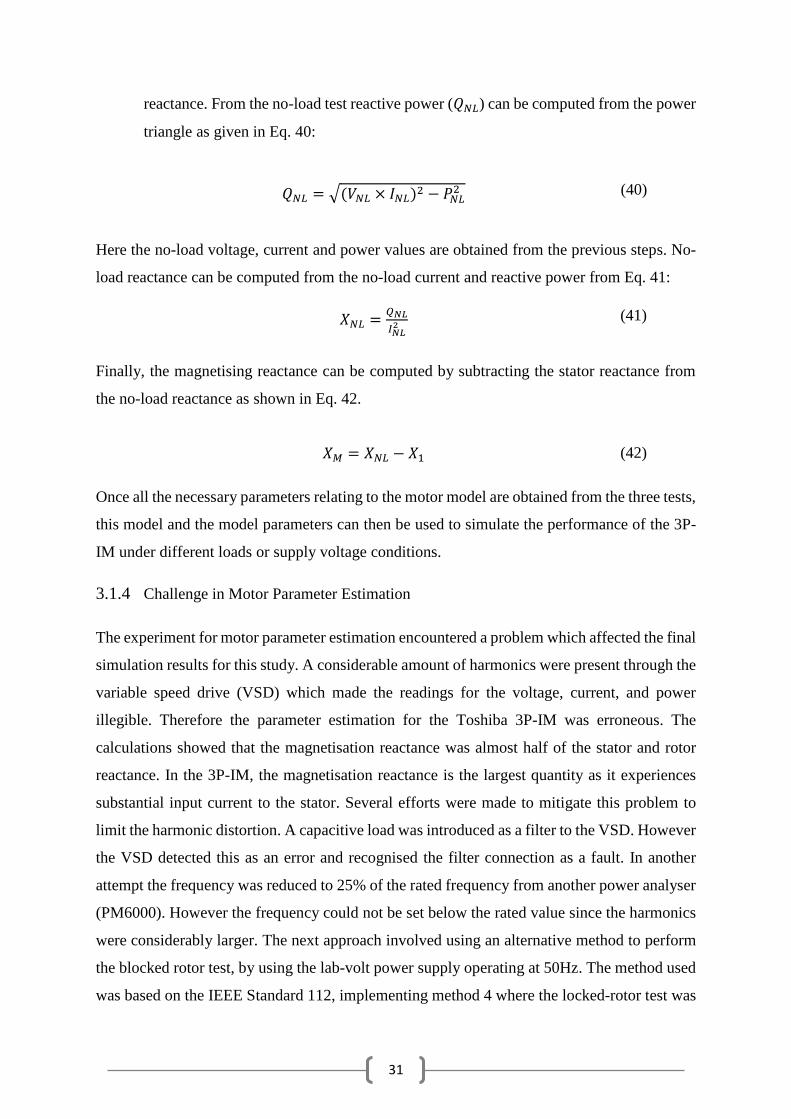
31
reactance. From the no-load test reactive power (𝑄𝑁𝐿) can be computed from the power
triangle as given in Eq. 40:
𝑄𝑁𝐿 = √(𝑉𝑁𝐿 × 𝐼𝑁𝐿)2 − 𝑃𝑁𝐿2 (40)
Here the no-load voltage, current and power values are obtained from the previous steps. No-
load reactance can be computed from the no-load current and reactive power from Eq. 41:
𝑋𝑁𝐿 =𝑄𝑁𝐿
𝐼𝑁𝐿2 (41)
Finally, the magnetising reactance can be computed by subtracting the stator reactance from
the no-load reactance as shown in Eq. 42.
𝑋𝑀 = 𝑋𝑁𝐿 − 𝑋1 (42)
Once all the necessary parameters relating to the motor model are obtained from the three tests,
this model and the model parameters can then be used to simulate the performance of the 3P-
IM under different loads or supply voltage conditions.
3.1.4 Challenge in Motor Parameter Estimation
The experiment for motor parameter estimation encountered a problem which affected the final
simulation results for this study. A considerable amount of harmonics were present through the
variable speed drive (VSD) which made the readings for the voltage, current, and power
illegible. Therefore the parameter estimation for the Toshiba 3P-IM was erroneous. The
calculations showed that the magnetisation reactance was almost half of the stator and rotor
reactance. In the 3P-IM, the magnetisation reactance is the largest quantity as it experiences
substantial input current to the stator. Several efforts were made to mitigate this problem to
limit the harmonic distortion. A capacitive load was introduced as a filter to the VSD. However
the VSD detected this as an error and recognised the filter connection as a fault. In another
attempt the frequency was reduced to 25% of the rated frequency from another power analyser
(PM6000). However the frequency could not be set below the rated value since the harmonics
were considerably larger. The next approach involved using an alternative method to perform
the blocked rotor test, by using the lab-volt power supply operating at 50Hz. The method used
was based on the IEEE Standard 112, implementing method 4 where the locked-rotor test was
32
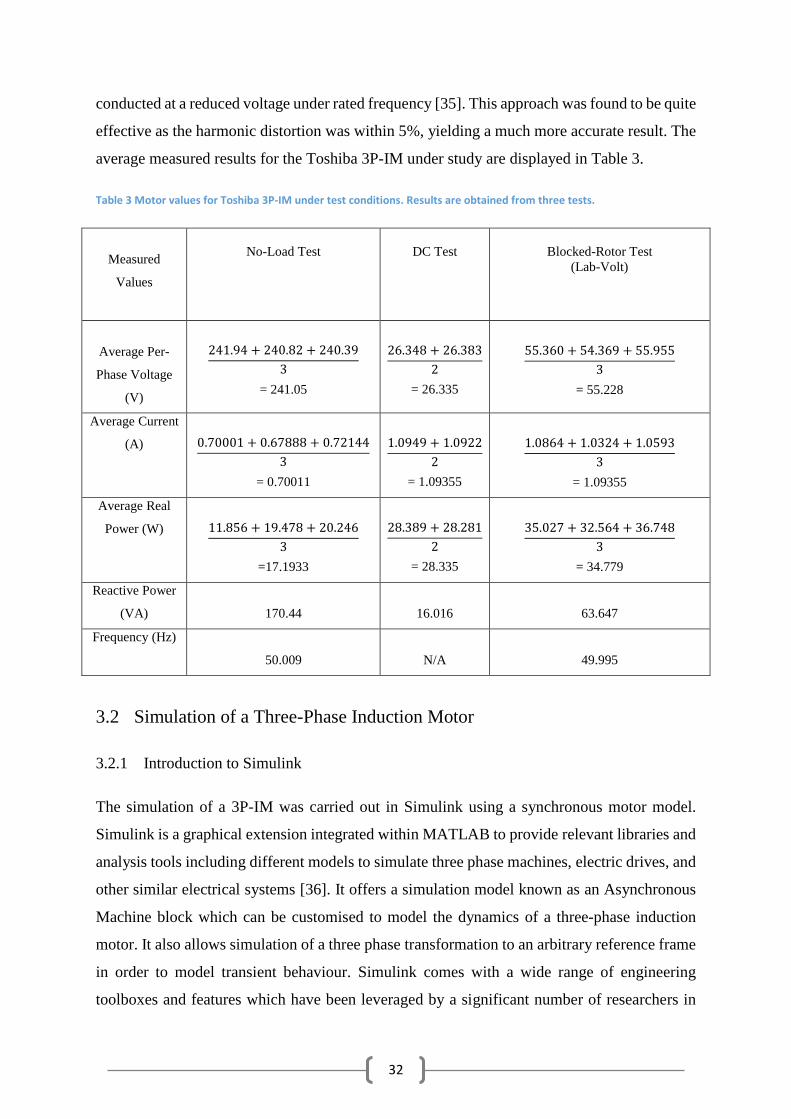
conducted at a reduced voltage under rated frequency [35]. This approach was found to be quite
effective as the harmonic distortion was within 5%, yielding a much more accurate result. The
average measured results for the Toshiba 3P-IM under study are displayed in Table 3.
Table 3 Motor values for Toshiba 3P-IM under test conditions. Results are obtained from three tests.
Measured
Values
No-Load Test
DC Test
Blocked-Rotor Test
(Lab-Volt)
Average Per-
Phase Voltage
(V)
241.94 + 240.82 + 240.39
3
= 241.05
26.348 + 26.383
2
= 26.335
55.360 + 54.369 + 55.955
3
= 55.228
Average Current
(A)
0.70001 + 0.67888 + 0.72144
3
= 0.70011
1.0949 + 1.0922
2
= 1.09355
1.0864 + 1.0324 + 1.0593
3
= 1.09355
Average Real
Power (W)
11.856 + 19.478 + 20.246
3
=17.1933
28.389 + 28.281
2
= 28.335
35.027 + 32.564 + 36.748
3
= 34.779
Reactive Power
(VA)
170.44
16.016
63.647
Frequency (Hz)
50.009
N/A
49.995
3.2 Simulation of a Three-Phase Induction Motor
3.2.1 Introduction to Simulink
The simulation of a 3P-IM was carried out in Simulink using a synchronous motor model.
Simulink is a graphical extension integrated within MATLAB to provide relevant libraries and
analysis tools including different models to simulate three phase machines, electric drives, and
other similar electrical systems [36]. It offers a simulation model known as an Asynchronous
Machine block which can be customised to model the dynamics of a three-phase induction
motor. It also allows simulation of a three phase transformation to an arbitrary reference frame
in order to model transient behaviour. Simulink comes with a wide range of engineering
toolboxes and features which have been leveraged by a significant number of researchers in
33
electrical machines and power systems. From previous simulation experiences it has been
found that the synchronous reference frame is the best for simulating induction motors due to
the creation of DC parameters in the rotor and stator d, q variables. The transient and the steady-
state characteristics as well as the torque-speed characteristics of a 3P-IM are compared in
different reference frames. The simulation model built in Simulink has four inputs which are:
mechanical torque, and the three input line-to-line voltages. The outputs are electromagnetic
torque, rotor speed, rotor currents and stator currents. To analyse the performance of the 3P-
IM during an electrical fault the induction model uses the arbitrary reference frame theory in
Simulink. Within this simulation environment the faults are created and variations in motor
output corresponding to a faulty situation were observed.
An asynchronous machine can operate either in the motor or generator mode depending on the
characteristics of the mechanical torque value. In a motor model this value is a positive constant
[36]. The entire system involved in energy conversion is presented with both electrical and
mechanical models. The measurements included two lists of observations using two
functionally distinct blocks; electrical and mechanical. All equations were implemented in
these blocks. The electrical model consists of several subsystems. At first it converts voltages
from the a-b-c system to a d-q system, one of the parts uses sine and cosine transformations
from the d-q to the a-b-c system. The other part converts the currents and the third part converts
the fluxes to the d-q system. One of the subsystems computes the mutual fluxes as well as all
direct and quadrature axis currents.
3.2.2 Simulink Model for an Induction Motor
The MATLAB based Simulink has a customisable dynamic model for an induction motor. This
model consists of several sub-models. The electrical sub-model transforms the three-phase
electrical variables to the two-axis dq reference frame as previously explained. The torque sub-
model computes the generated electromagnetic torque and the mechanical sub-model computes
the speed of the rotor. Additionally a stator current output sub-model is introduced to calculate
the line voltage drops. These sub-models are briefly outlined in sections 3.2.3-3.2.6:
34
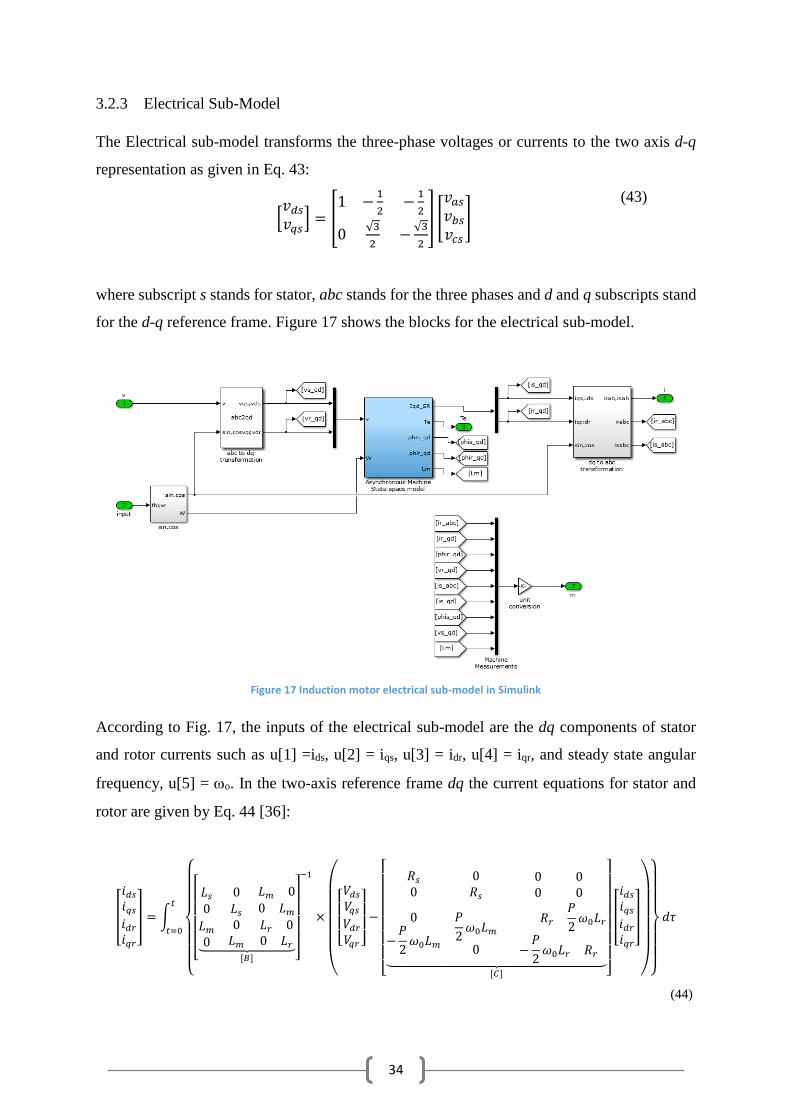
3.2.3 Electrical Sub-Model
The Electrical sub-model transforms the three-phase voltages or currents to the two axis d-q
representation as given in Eq. 43:
[𝑣𝑑𝑠𝑣𝑞𝑠] = [
1 −1
2−1
2
0√3
2−√3
2
] [
𝑣𝑎𝑠𝑣𝑏𝑠𝑣𝑐𝑠]
(43)
where subscript s stands for stator, abc stands for the three phases and d and q subscripts stand
for the d-q reference frame. Figure 17 shows the blocks for the electrical sub-model.
Figure 17 Induction motor electrical sub-model in Simulink
According to Fig. 17, the inputs of the electrical sub-model are the dq components of stator
and rotor currents such as u[1] =ids, u[2] = iqs, u[3] = idr, u[4] = iqr, and steady state angular
frequency, u[5] = o. In the two-axis reference frame dq the current equations for stator and
rotor are given by Eq. 44 [36]:
[
𝑖𝑑𝑠𝑖𝑞𝑠𝑖𝑑𝑟𝑖𝑞𝑟
] = ∫
[ 𝐿𝑠 0 𝐿𝑚 0
0 𝐿𝑠 0 𝐿𝑚𝐿𝑚0
0𝐿𝑚
𝐿𝑟 00 𝐿𝑟⏟
[𝐵] ] −1
×
(
[ 𝑉𝑑𝑠𝑉𝑞𝑠𝑉𝑑𝑟𝑉𝑞𝑟 ] −
[ 𝑅𝑠 0 0 0
0 𝑅𝑠 0 0
0
−𝑃
2𝜔0𝐿𝑚
𝑃
2𝜔0𝐿𝑚
0
𝑅𝑟𝑃
2𝜔0𝐿𝑟
−𝑃
2𝜔0𝐿𝑟 𝑅𝑟⏟
[𝐶] ]
[
𝑖𝑑𝑠𝑖𝑞𝑠𝑖𝑑𝑟𝑖𝑞𝑟
]
)
𝑑𝜏𝑡
𝑡=0
(44)
35
where, Vds, Vqs, Vdr, Vqr are voltages in the dq reference frame which corresponds to the
stator and rotor.
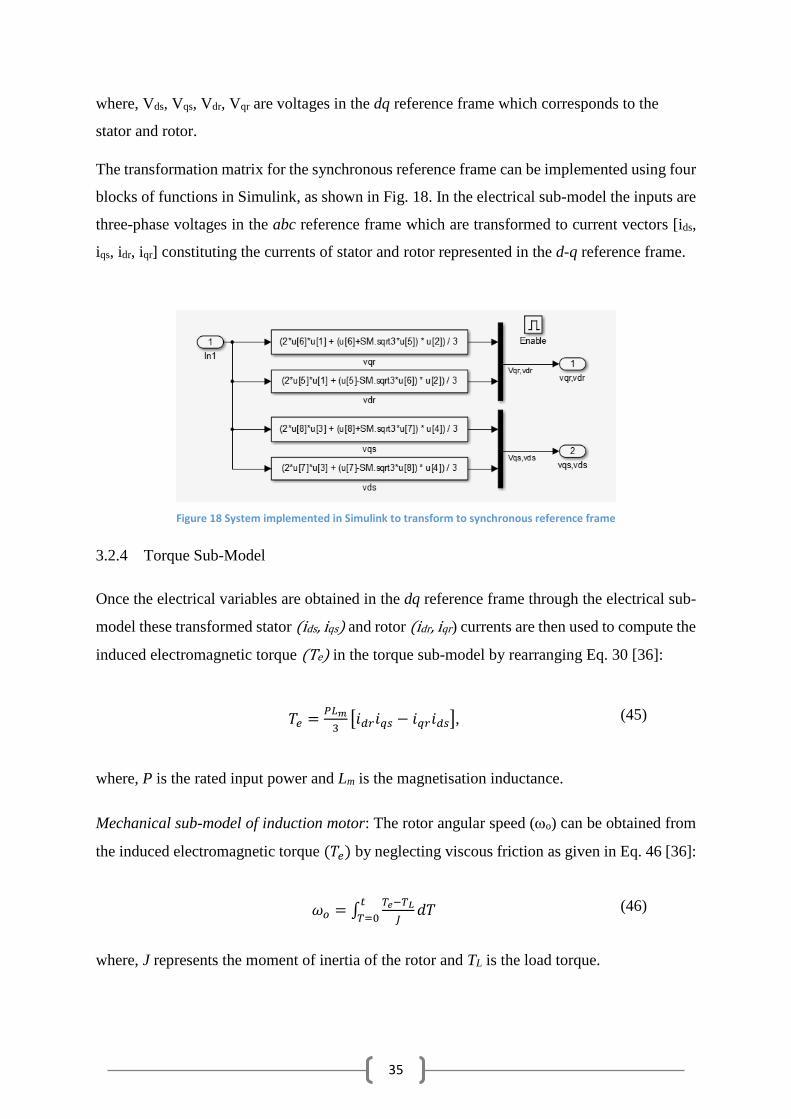
The transformation matrix for the synchronous reference frame can be implemented using four
blocks of functions in Simulink, as shown in Fig. 18. In the electrical sub-model the inputs are
three-phase voltages in the abc reference frame which are transformed to current vectors [ids,
iqs, idr, iqr] constituting the currents of stator and rotor represented in the d-q reference frame.
Figure 18 System implemented in Simulink to transform to synchronous reference frame
3.2.4 Torque Sub-Model
Once the electrical variables are obtained in the dq reference frame through the electrical sub-
model these transformed stator (ids, iqs) and rotor (idr, iqr) currents are then used to compute the
induced electromagnetic torque (Te) in the torque sub-model by rearranging Eq. 30 [36]:
𝑇𝑒 =𝑃𝐿𝑚
3[𝑖𝑑𝑟𝑖𝑞𝑠 − 𝑖𝑞𝑟𝑖𝑑𝑠], (45)
where, P is the rated input power and Lm is the magnetisation inductance.
Mechanical sub-model of induction motor: The rotor angular speed (o) can be obtained from
the induced electromagnetic torque (𝑇𝑒) by neglecting viscous friction as given in Eq. 46 [36]:
𝜔𝑜 = ∫𝑇𝑒−𝑇𝐿
𝐽𝑑𝑇
𝑡
𝑇=0 (46)
where, J represents the moment of inertia of the rotor and TL is the load torque.
36
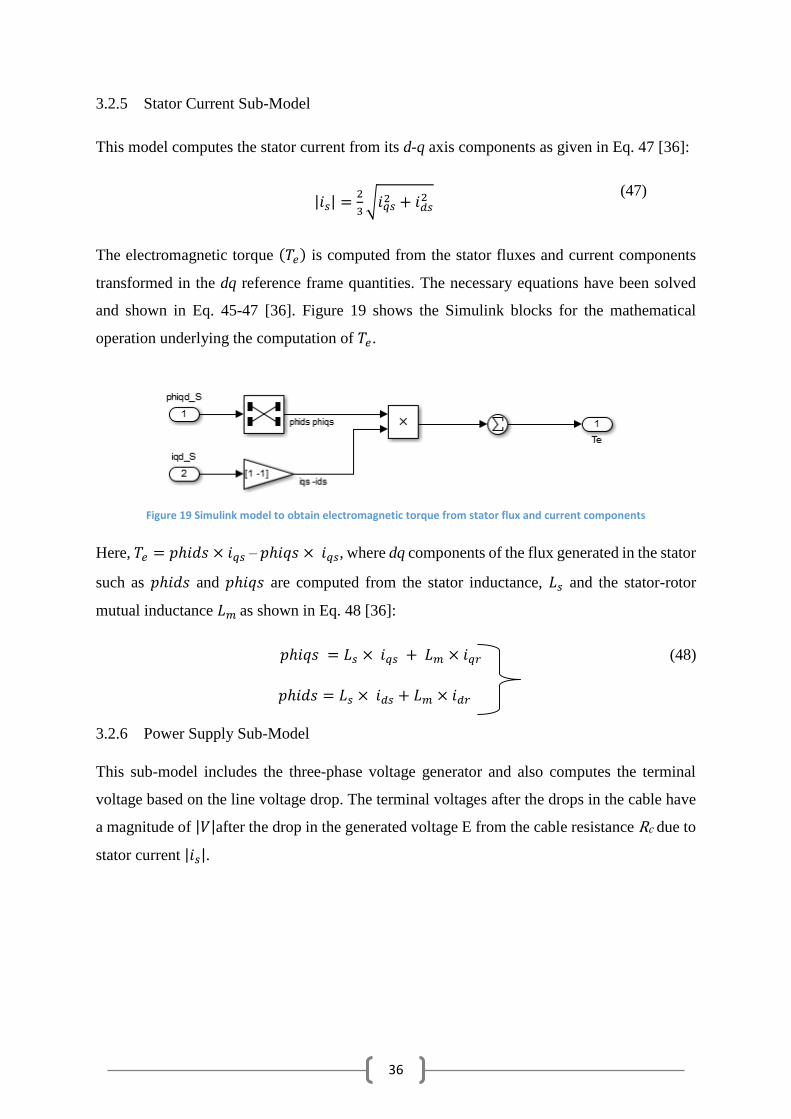
3.2.5 Stator Current Sub-Model
This model computes the stator current from its d-q axis components as given in Eq. 47 [36]:
|𝑖𝑠| =
2
3√𝑖𝑞𝑠2 + 𝑖𝑑𝑠
2 (47)
The electromagnetic torque (𝑇𝑒) is computed from the stator fluxes and current components
transformed in the dq reference frame quantities. The necessary equations have been solved
and shown in Eq. 45-47 [36]. Figure 19 shows the Simulink blocks for the mathematical
operation underlying the computation of 𝑇𝑒.
Figure 19 Simulink model to obtain electromagnetic torque from stator flux and current components
Here, 𝑇𝑒 = 𝑝ℎ𝑖𝑑𝑠 × 𝑖𝑞𝑠 – 𝑝ℎ𝑖𝑞𝑠 × 𝑖𝑞𝑠, where dq components of the flux generated in the stator
such as 𝑝ℎ𝑖𝑑𝑠 and 𝑝ℎ𝑖𝑞𝑠 are computed from the stator inductance, 𝐿𝑠 and the stator-rotor
mutual inductance 𝐿𝑚 as shown in Eq. 48 [36]:
𝑝ℎ𝑖𝑞𝑠 = 𝐿𝑠 × 𝑖𝑞𝑠 + 𝐿𝑚 × 𝑖𝑞𝑟 (48)
𝑝ℎ𝑖𝑑𝑠 = 𝐿𝑠 × 𝑖𝑑𝑠 + 𝐿𝑚 × 𝑖𝑑𝑟
3.2.6 Power Supply Sub-Model
This sub-model includes the three-phase voltage generator and also computes the terminal
voltage based on the line voltage drop. The terminal voltages after the drops in the cable have
a magnitude of |𝑉|after the drop in the generated voltage E from the cable resistance Rc due to
stator current |𝑖𝑠|.
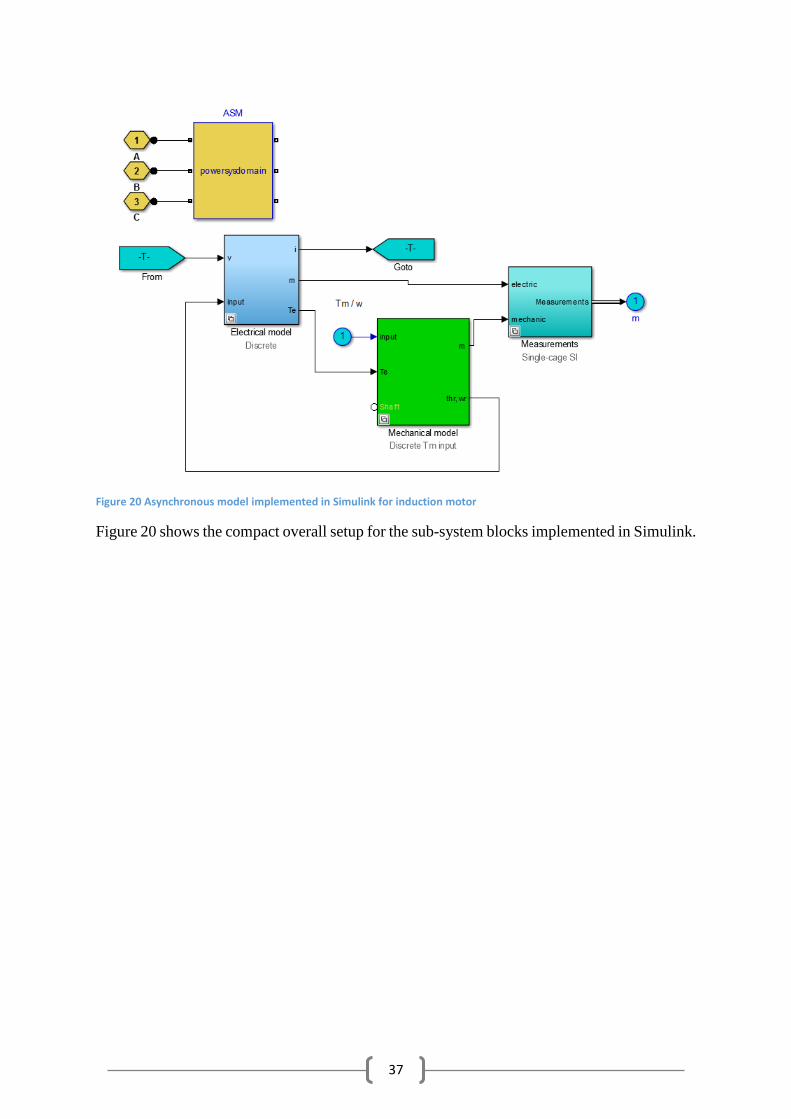
37
Figure 20 Asynchronous model implemented in Simulink for induction motor
Figure 20 shows the compact overall setup for the sub-system blocks implemented in Simulink.
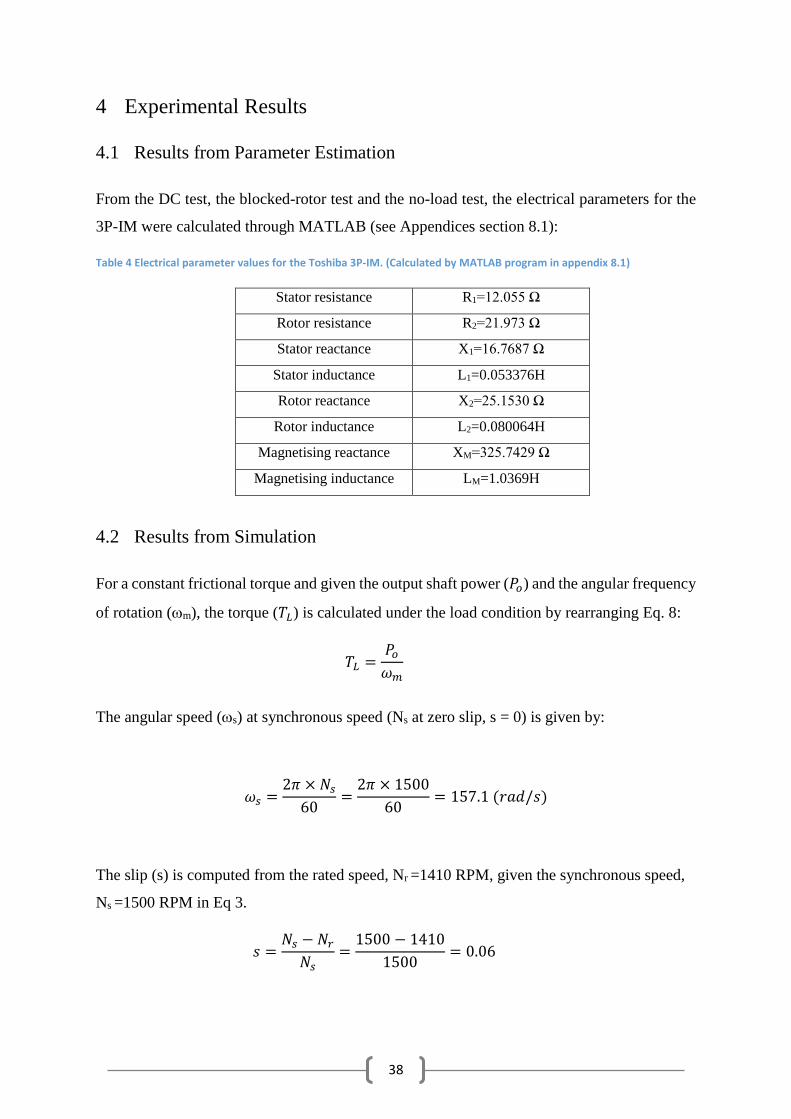
38
4 Experimental Results
4.1 Results from Parameter Estimation
From the DC test, the blocked-rotor test and the no-load test, the electrical parameters for the
3P-IM were calculated through MATLAB (see Appendices section 8.1):
Table 4 Electrical parameter values for the Toshiba 3P-IM. (Calculated by MATLAB program in appendix 8.1)
Stator resistance R1=12.055 Ω
Rotor resistance R2=21.973 Ω
Stator reactance X1=16.7687 Ω
Stator inductance L1=0.053376H
Rotor reactance X2=25.1530 Ω
Rotor inductance L2=0.080064H
Magnetising reactance XM=325.7429 Ω
Magnetising inductance LM=1.0369H
4.2 Results from Simulation
For a constant frictional torque and given the output shaft power (𝑃𝑜) and the angular frequency
of rotation (m), the torque (𝑇𝐿) is calculated under the load condition by rearranging Eq. 8:
𝑇𝐿 =
𝑃𝑜𝜔𝑚
The angular speed (s) at synchronous speed (Ns at zero slip, s = 0) is given by:
𝜔𝑠 =2𝜋 × 𝑁𝑠60
=2𝜋 × 1500
60= 157.1 (𝑟𝑎𝑑/𝑠)
The slip (s) is computed from the rated speed, Nr =1410 RPM, given the synchronous speed,
Ns =1500 RPM in Eq 3.
𝑠 =
𝑁𝑠 − 𝑁𝑟𝑁𝑠
=1500 − 1410
1500= 0.06
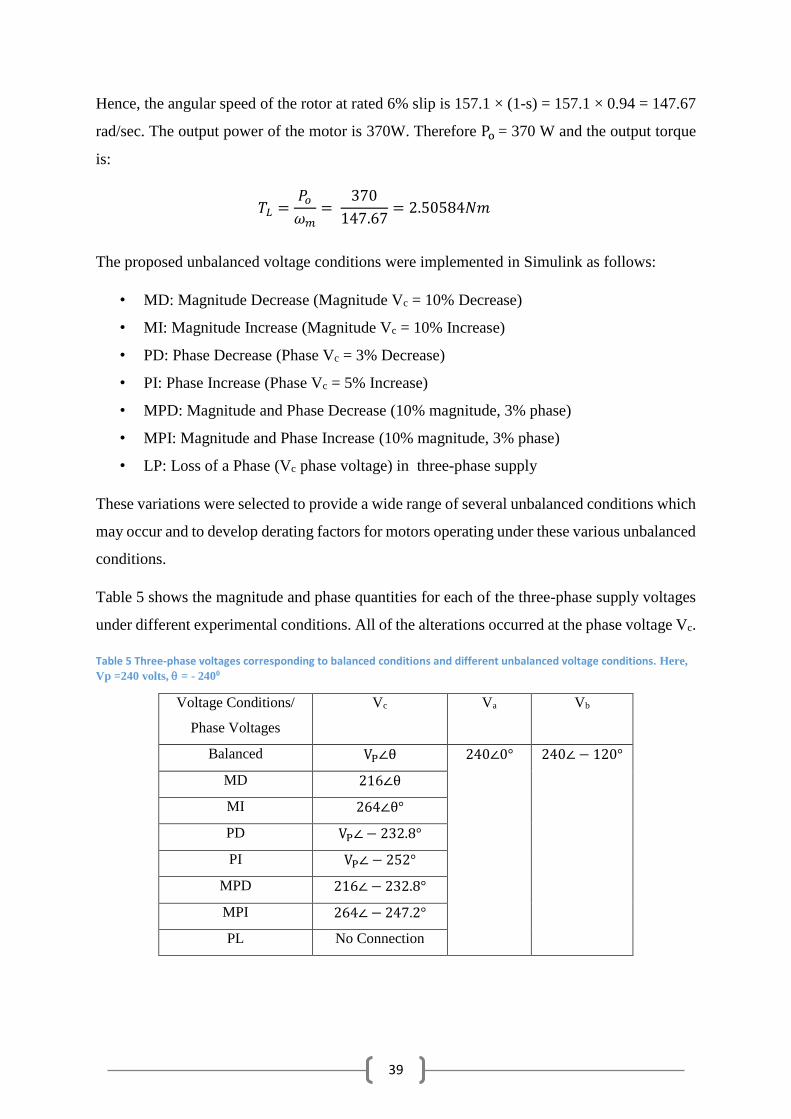
39
Hence, the angular speed of the rotor at rated 6% slip is 157.1 × (1-s) = 157.1 × 0.94 = 147.67
rad/sec. The output power of the motor is 370W. Therefore Po = 370 W and the output torque
is:
𝑇𝐿 =
𝑃𝑜𝜔𝑚
= 370
147.67= 2.50584𝑁𝑚
The proposed unbalanced voltage conditions were implemented in Simulink as follows:
• MD: Magnitude Decrease (Magnitude Vc = 10% Decrease)
• MI: Magnitude Increase (Magnitude Vc = 10% Increase)
• PD: Phase Decrease (Phase Vc = 3% Decrease)
• PI: Phase Increase (Phase Vc = 5% Increase)
• MPD: Magnitude and Phase Decrease (10% magnitude, 3% phase)
• MPI: Magnitude and Phase Increase (10% magnitude, 3% phase)
• LP: Loss of a Phase (Vc phase voltage) in three-phase supply
These variations were selected to provide a wide range of several unbalanced conditions which
may occur and to develop derating factors for motors operating under these various unbalanced
conditions.
Table 5 shows the magnitude and phase quantities for each of the three-phase supply voltages
under different experimental conditions. All of the alterations occurred at the phase voltage Vc.
Table 5 Three-phase voltages corresponding to balanced conditions and different unbalanced voltage conditions. Here,
Vp =240 volts, = - 2400
Voltage Conditions/
Phase Voltages
Vc Va Vb
Balanced VP∠θ 240∠0° 240∠ − 120°
MD 216∠θ
MI 264∠θ°
PD VP∠− 232.8°
PI VP∠ − 252°
MPD 216∠ − 232.8°
MPI 264∠ − 247.2°
PL No Connection
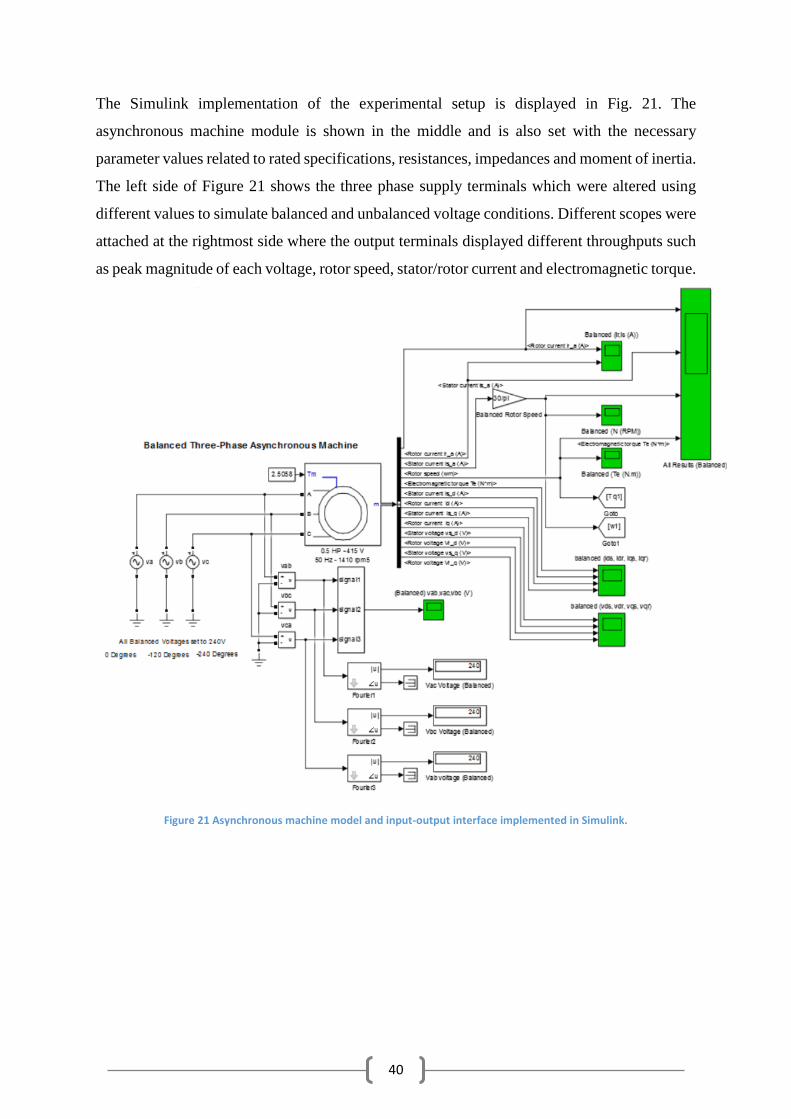
40
The Simulink implementation of the experimental setup is displayed in Fig. 21. The
asynchronous machine module is shown in the middle and is also set with the necessary
parameter values related to rated specifications, resistances, impedances and moment of inertia.
The left side of Figure 21 shows the three phase supply terminals which were altered using
different values to simulate balanced and unbalanced voltage conditions. Different scopes were
attached at the rightmost side where the output terminals displayed different throughputs such
as peak magnitude of each voltage, rotor speed, stator/rotor current and electromagnetic torque.
Figure 21 Asynchronous machine model and input-output interface implemented in Simulink.
41
4.3 Migrating Faults into Simulink
The unbalanced voltage conditions considered in Table 5 were rendered in the Simulink
environment on the induction motor sub-systems. The effects of different experimental
conditions were discussed on each individual motor output variable.
4.3.1 Effect on Rotor Current
Figure 22 shows the effects of different unbalanced conditions on the rotor current. These are
transient responses of the rotor current. Under balanced conditions the plot shows that it takes
about 0.15 seconds to settle to the rated rotor current after an initial amplified oscillation of the
current. Figure 22 also indicates that under or over voltage magnitudes introduce high
frequency components into the steady state rotor current. The rotor current is modulated by a
high frequency low magnitude component. On the other hand any change in phase angle of
supply voltage; either as an increase or decrease modulates the rotor current with high
frequency and high magnitude components. Therefore, changes in both magnitude and phase
angles results in a rotor current which is dominated by the effect of the phase angle changes.
These are high frequency harmonics in the rotor current which contribute to rotor losses and
heating. Loss of a phase results in a large unstable high frequency rotor current which then
creates pulsating torque as displayed in Fig. 26 and accelerating rotor speed as shown in Fig.
25. Interestingly an increase in magnitude or phase angle results in quicker steady state rotor
current which is attained within 0.1 seconds.
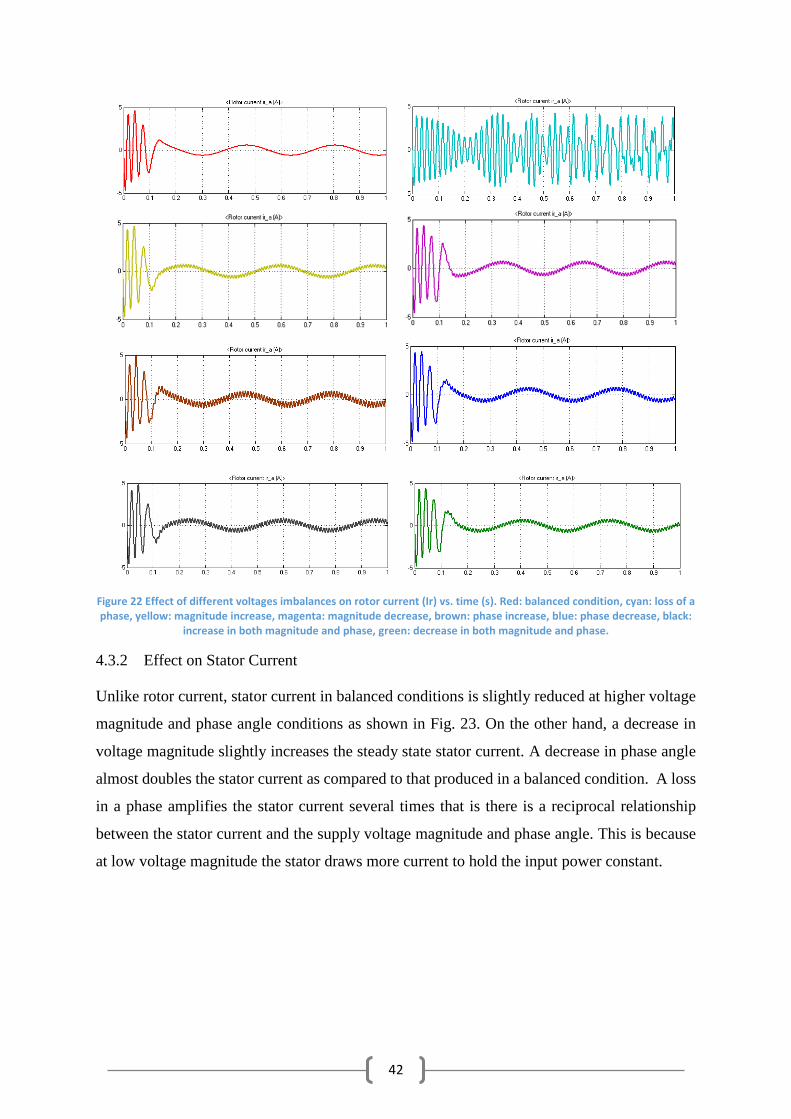
42
Figure 22 Effect of different voltages imbalances on rotor current (Ir) vs. time (s). Red: balanced condition, cyan: loss of a phase, yellow: magnitude increase, magenta: magnitude decrease, brown: phase increase, blue: phase decrease, black:
increase in both magnitude and phase, green: decrease in both magnitude and phase.
4.3.2 Effect on Stator Current
Unlike rotor current, stator current in balanced conditions is slightly reduced at higher voltage
magnitude and phase angle conditions as shown in Fig. 23. On the other hand, a decrease in
voltage magnitude slightly increases the steady state stator current. A decrease in phase angle
almost doubles the stator current as compared to that produced in a balanced condition. A loss
in a phase amplifies the stator current several times that is there is a reciprocal relationship
between the stator current and the supply voltage magnitude and phase angle. This is because
at low voltage magnitude the stator draws more current to hold the input power constant.
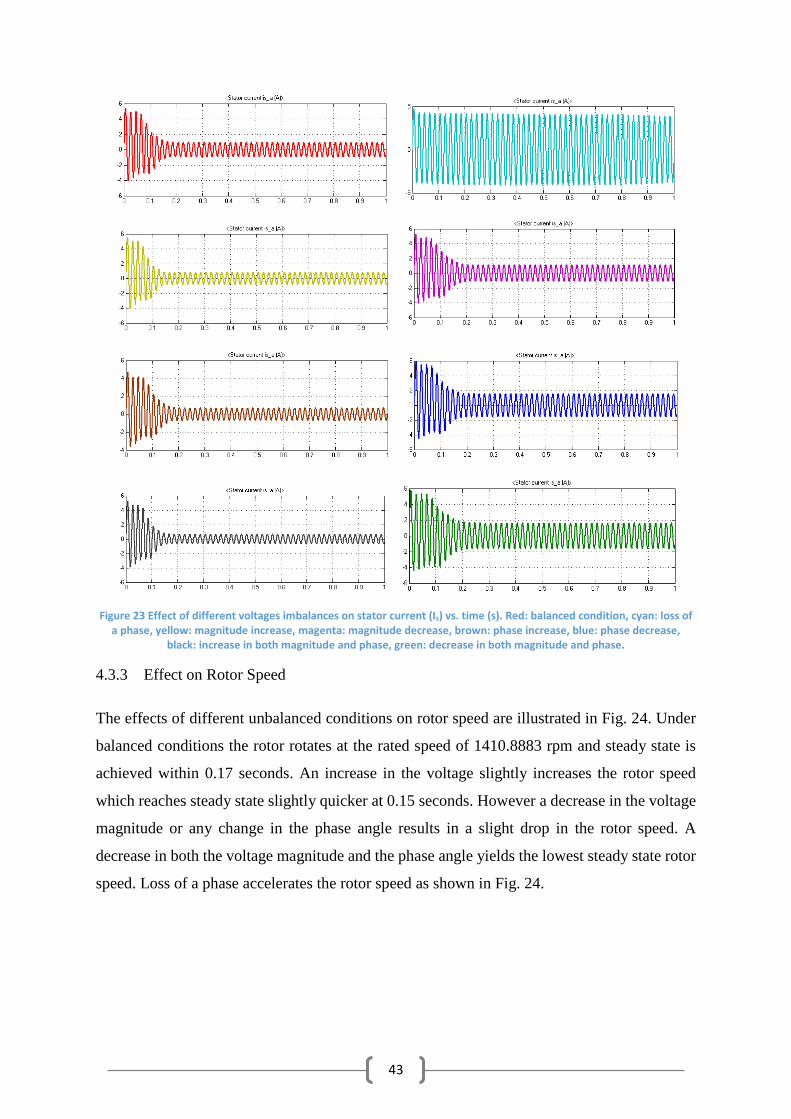
43
Figure 23 Effect of different voltages imbalances on stator current (Is) vs. time (s). Red: balanced condition, cyan: loss of a phase, yellow: magnitude increase, magenta: magnitude decrease, brown: phase increase, blue: phase decrease,
black: increase in both magnitude and phase, green: decrease in both magnitude and phase.
4.3.3 Effect on Rotor Speed
The effects of different unbalanced conditions on rotor speed are illustrated in Fig. 24. Under
balanced conditions the rotor rotates at the rated speed of 1410.8883 rpm and steady state is
achieved within 0.17 seconds. An increase in the voltage slightly increases the rotor speed
which reaches steady state slightly quicker at 0.15 seconds. However a decrease in the voltage
magnitude or any change in the phase angle results in a slight drop in the rotor speed. A
decrease in both the voltage magnitude and the phase angle yields the lowest steady state rotor
speed. Loss of a phase accelerates the rotor speed as shown in Fig. 24.
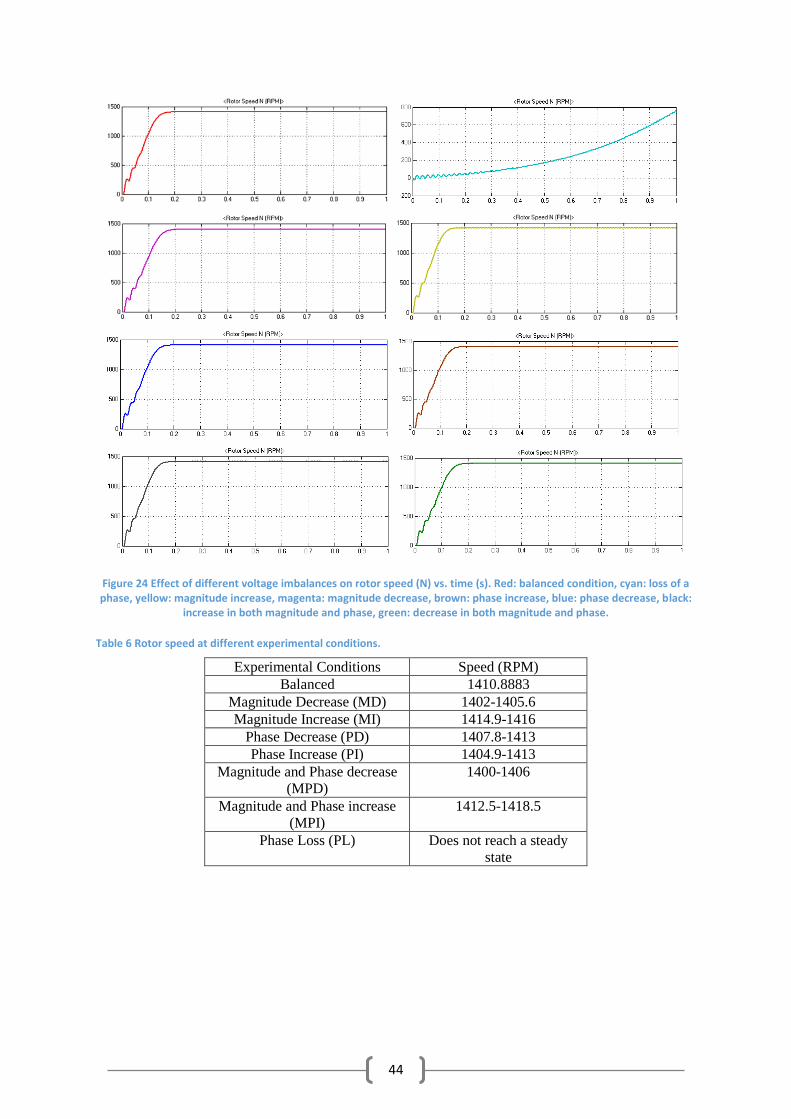
44
Figure 24 Effect of different voltage imbalances on rotor speed (N) vs. time (s). Red: balanced condition, cyan: loss of a phase, yellow: magnitude increase, magenta: magnitude decrease, brown: phase increase, blue: phase decrease, black:
increase in both magnitude and phase, green: decrease in both magnitude and phase.
Table 6 Rotor speed at different experimental conditions.
Experimental Conditions Speed (RPM)
Balanced 1410.8883
Magnitude Decrease (MD) 1402-1405.6
Magnitude Increase (MI) 1414.9-1416
Phase Decrease (PD) 1407.8-1413
Phase Increase (PI) 1404.9-1413
Magnitude and Phase decrease
(MPD)
1400-1406
Magnitude and Phase increase
(MPI)
1412.5-1418.5
Phase Loss (PL) Does not reach a steady
state
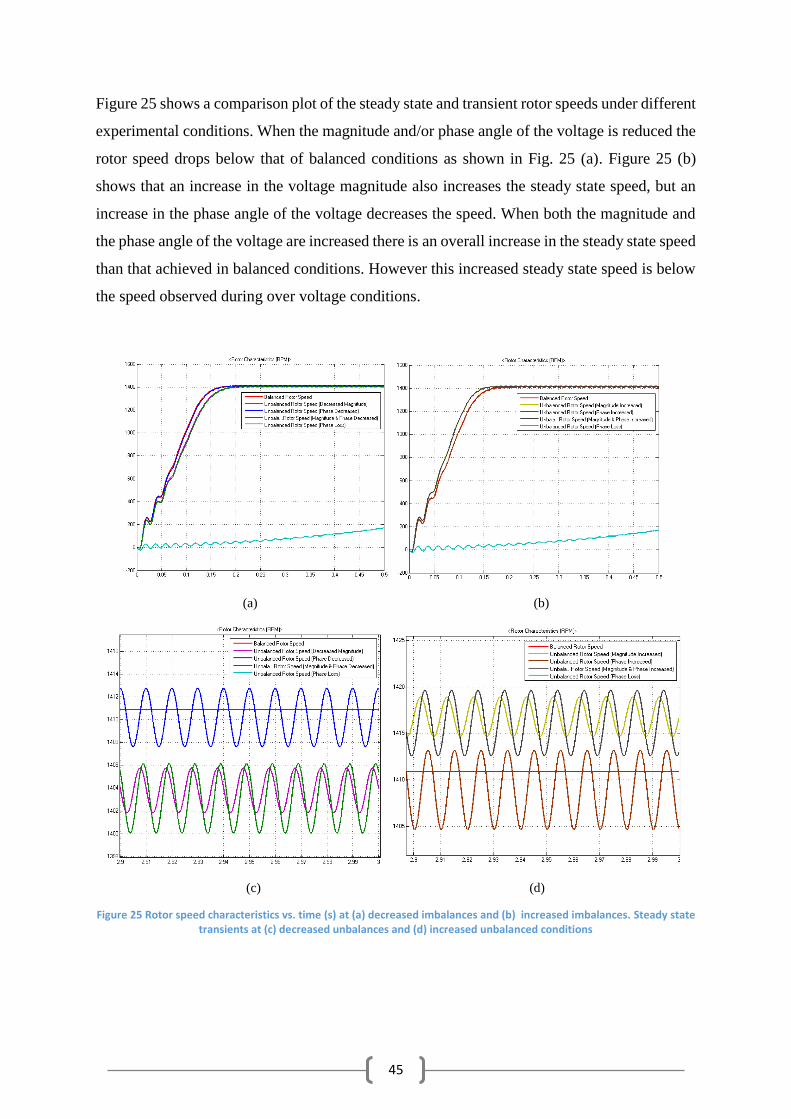
45
Figure 25 shows a comparison plot of the steady state and transient rotor speeds under different
experimental conditions. When the magnitude and/or phase angle of the voltage is reduced the
rotor speed drops below that of balanced conditions as shown in Fig. 25 (a). Figure 25 (b)
shows that an increase in the voltage magnitude also increases the steady state speed, but an
increase in the phase angle of the voltage decreases the speed. When both the magnitude and
the phase angle of the voltage are increased there is an overall increase in the steady state speed
than that achieved in balanced conditions. However this increased steady state speed is below
the speed observed during over voltage conditions.
(a) (b)
(c) (d)
Figure 25 Rotor speed characteristics vs. time (s) at (a) decreased imbalances and (b) increased imbalances. Steady state transients at (c) decreased unbalances and (d) increased unbalanced conditions
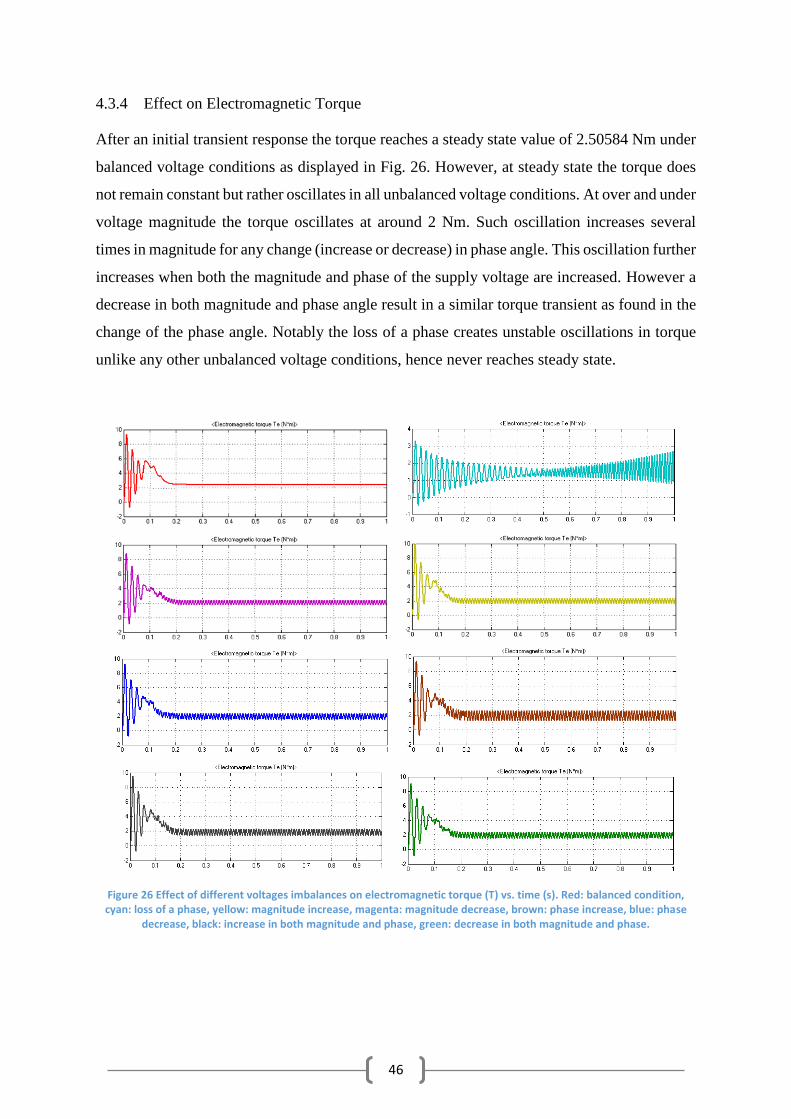
46
4.3.4 Effect on Electromagnetic Torque
After an initial transient response the torque reaches a steady state value of 2.50584 Nm under
balanced voltage conditions as displayed in Fig. 26. However, at steady state the torque does
not remain constant but rather oscillates in all unbalanced voltage conditions. At over and under
voltage magnitude the torque oscillates at around 2 Nm. Such oscillation increases several
times in magnitude for any change (increase or decrease) in phase angle. This oscillation further
increases when both the magnitude and phase of the supply voltage are increased. However a
decrease in both magnitude and phase angle result in a similar torque transient as found in the
change of the phase angle. Notably the loss of a phase creates unstable oscillations in torque
unlike any other unbalanced voltage conditions, hence never reaches steady state.
Figure 26 Effect of different voltages imbalances on electromagnetic torque (T) vs. time (s). Red: balanced condition, cyan: loss of a phase, yellow: magnitude increase, magenta: magnitude decrease, brown: phase increase, blue: phase
decrease, black: increase in both magnitude and phase, green: decrease in both magnitude and phase.
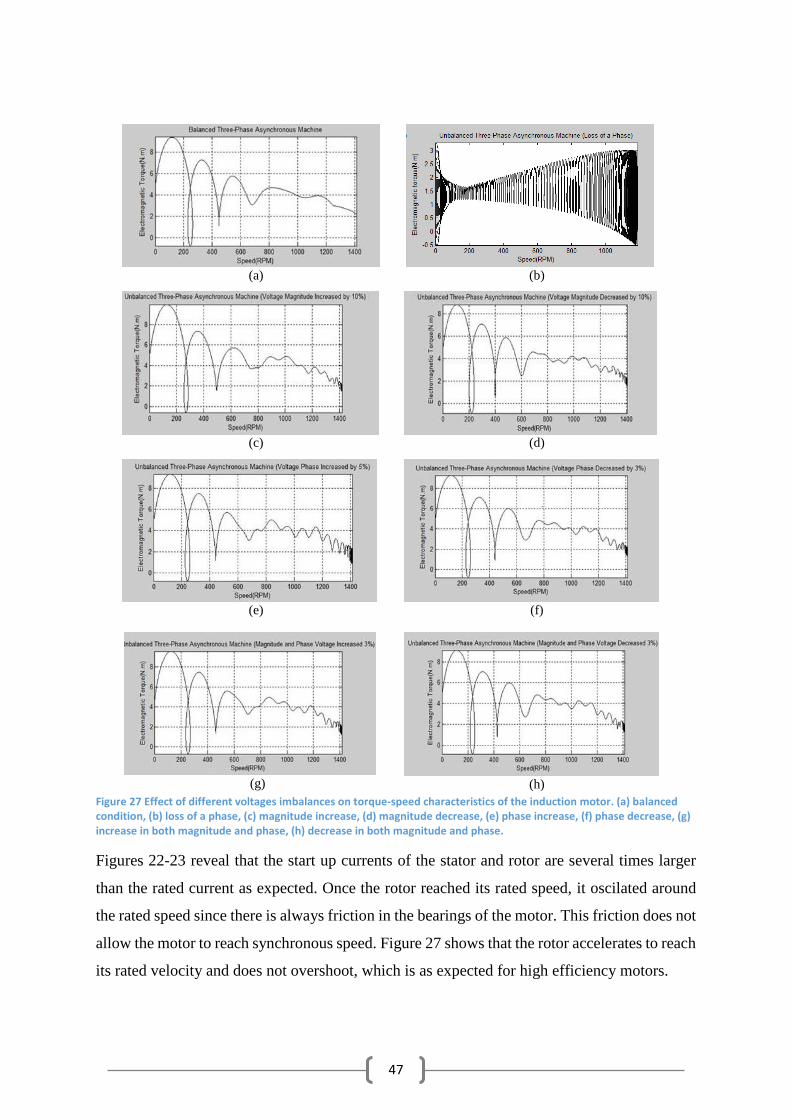
47
(a)
(b)
(c)
(d)
(e)
(f)
(g)
(h)
Figure 27 Effect of different voltages imbalances on torque-speed characteristics of the induction motor. (a) balanced condition, (b) loss of a phase, (c) magnitude increase, (d) magnitude decrease, (e) phase increase, (f) phase decrease, (g) increase in both magnitude and phase, (h) decrease in both magnitude and phase.
Figures 22-23 reveal that the start up currents of the stator and rotor are several times larger
than the rated current as expected. Once the rotor reached its rated speed, it oscilated around
the rated speed since there is always friction in the bearings of the motor. This friction does not
allow the motor to reach synchronous speed. Figure 27 shows that the rotor accelerates to reach
its rated velocity and does not overshoot, which is as expected for high efficiency motors.
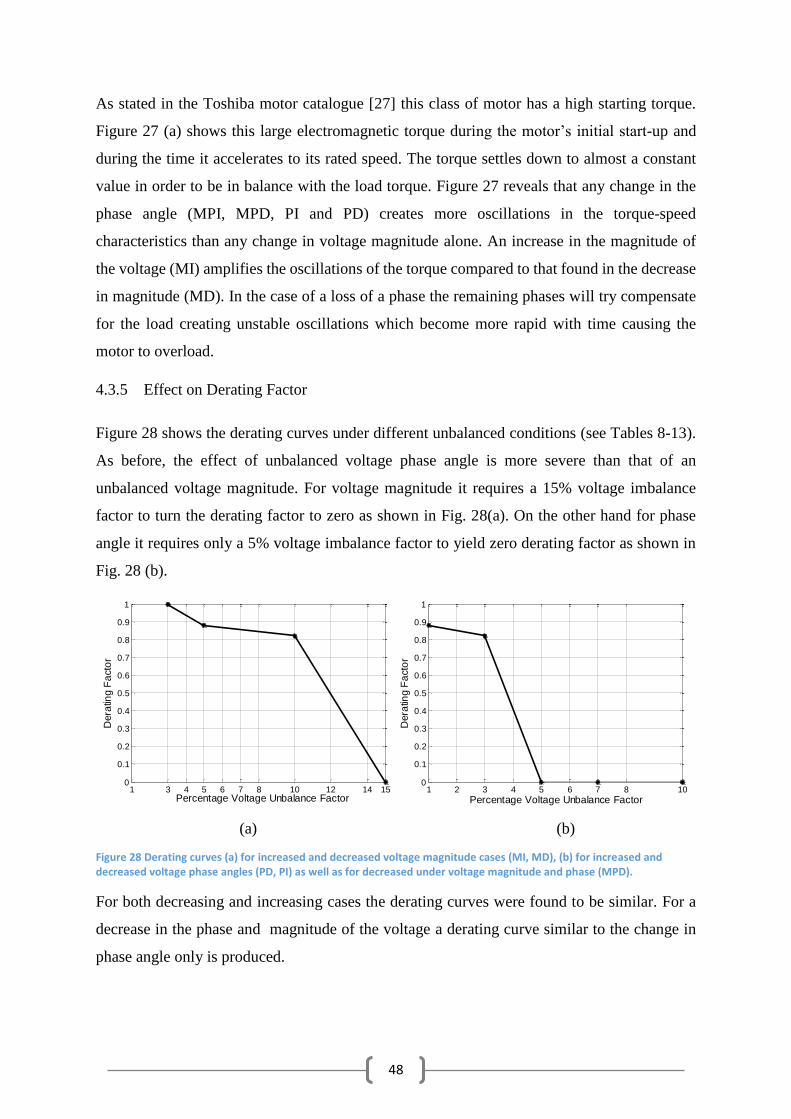
48
As stated in the Toshiba motor catalogue [27] this class of motor has a high starting torque.
Figure 27 (a) shows this large electromagnetic torque during the motor’s initial start-up and
during the time it accelerates to its rated speed. The torque settles down to almost a constant
value in order to be in balance with the load torque. Figure 27 reveals that any change in the
phase angle (MPI, MPD, PI and PD) creates more oscillations in the torque-speed
characteristics than any change in voltage magnitude alone. An increase in the magnitude of
the voltage (MI) amplifies the oscillations of the torque compared to that found in the decrease
in magnitude (MD). In the case of a loss of a phase the remaining phases will try compensate
for the load creating unstable oscillations which become more rapid with time causing the
motor to overload.
4.3.5 Effect on Derating Factor
Figure 28 shows the derating curves under different unbalanced conditions (see Tables 8-13).
As before, the effect of unbalanced voltage phase angle is more severe than that of an
unbalanced voltage magnitude. For voltage magnitude it requires a 15% voltage imbalance
factor to turn the derating factor to zero as shown in Fig. 28(a). On the other hand for phase
angle it requires only a 5% voltage imbalance factor to yield zero derating factor as shown in
Fig. 28 (b).
(a) (b)
Figure 28 Derating curves (a) for increased and decreased voltage magnitude cases (MI, MD), (b) for increased and decreased voltage phase angles (PD, PI) as well as for decreased under voltage magnitude and phase (MPD).
For both decreasing and increasing cases the derating curves were found to be similar. For a
decrease in the phase and magnitude of the voltage a derating curve similar to the change in
phase angle only is produced.
1 3 4 5 6 7 8 10 12 14 150
0.1
0.2
0.3
0.4
0.5
0.6
0.7
0.8
0.9
1
Percentage Voltage Unbalance Factor
Dera
ting
Fa
cto
r
1 2 3 4 5 6 7 8 100
0.1
0.2
0.3
0.4
0.5
0.6
0.7
0.8
0.9
1
Percentage Voltage Unbalance Factor
Dera
ting
Fa
cto
r
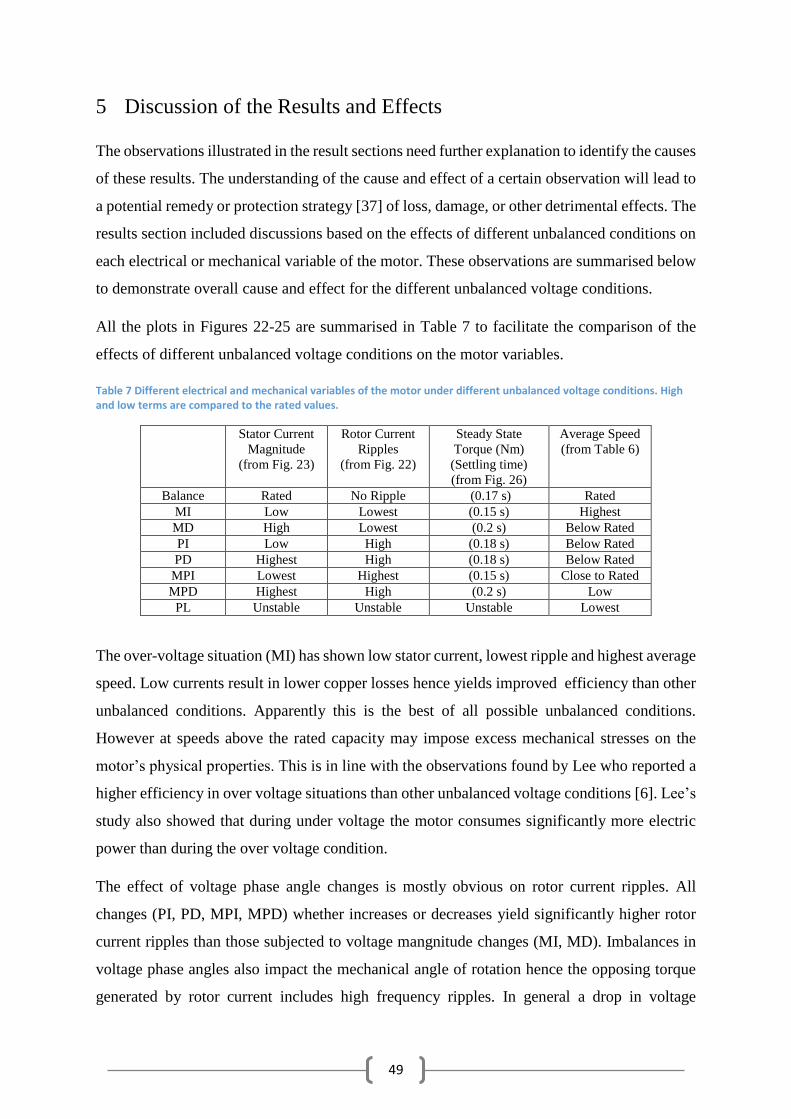
49
5 Discussion of the Results and Effects
The observations illustrated in the result sections need further explanation to identify the causes
of these results. The understanding of the cause and effect of a certain observation will lead to
a potential remedy or protection strategy [37] of loss, damage, or other detrimental effects. The
results section included discussions based on the effects of different unbalanced conditions on
each electrical or mechanical variable of the motor. These observations are summarised below
to demonstrate overall cause and effect for the different unbalanced voltage conditions.
All the plots in Figures 22-25 are summarised in Table 7 to facilitate the comparison of the
effects of different unbalanced voltage conditions on the motor variables.
Table 7 Different electrical and mechanical variables of the motor under different unbalanced voltage conditions. High and low terms are compared to the rated values.
Stator Current
Magnitude
(from Fig. 23)
Rotor Current
Ripples
(from Fig. 22)
Steady State
Torque (Nm)
(Settling time)
(from Fig. 26)
Average Speed
(from Table 6)
Balance Rated No Ripple (0.17 s) Rated
MI Low Lowest (0.15 s) Highest
MD High Lowest (0.2 s) Below Rated
PI Low High (0.18 s) Below Rated
PD Highest High (0.18 s) Below Rated
MPI Lowest Highest (0.15 s) Close to Rated
MPD Highest High (0.2 s) Low
PL Unstable Unstable Unstable Lowest
The over-voltage situation (MI) has shown low stator current, lowest ripple and highest average
speed. Low currents result in lower copper losses hence yields improved efficiency than other
unbalanced conditions. Apparently this is the best of all possible unbalanced conditions.
However at speeds above the rated capacity may impose excess mechanical stresses on the
motor’s physical properties. This is in line with the observations found by Lee who reported a
higher efficiency in over voltage situations than other unbalanced voltage conditions [6]. Lee’s
study also showed that during under voltage the motor consumes significantly more electric
power than during the over voltage condition.
The effect of voltage phase angle changes is mostly obvious on rotor current ripples. All
changes (PI, PD, MPI, MPD) whether increases or decreases yield significantly higher rotor
current ripples than those subjected to voltage mangnitude changes (MI, MD). Imbalances in
voltage phase angles also impact the mechanical angle of rotation hence the opposing torque
generated by rotor current includes high frequency ripples. In general a drop in voltage

50
magnitude (MD, MPD) delays the settling time for the torque. A drop in voltage magnitude
also causes an increase in the stator current in order to maintain the input power, hence delaying
the steady state torque generation.
The currents induced by the positive and negative sequences create opposing rotating magnetic
fields which yield ripple in the electromagnetic torque and velocity fluctuations. Torque
oscillations resulting from unbalanced voltages as observed in this study are also noted by
Mirabbasi et al. [7]. Such oscillations introduce noise, vibration and mechanical stresses
leading to wear and aging of the machine [38]. From the torque-speed characteristics the so
called values of pull-up and breakdown torque are changed due to the voltage imbalance. In
general, unbalanced voltages create negative sequence currents that have no purpose other than
further contributing to power loss and temperature increase [39], [40]. A drop in power factor
indicates a change in the real and reactive power consumption in unbalanced conditions [40].
The negative sequence components due to unbalanced voltage also contribute to excessive heat
that raises the motor temperature and may damage the insulation. A significantly large
imbalance may even lead to destruction of the motor.
The worst unbalanced condition is the loss of a phase. This condition is equivalent to a 100%
decrease in voltage magnitude and angle in comparison to any of the 15% decrease cases
(MPD, MD, PD). The loss in one phase imposes extreme load on the other two as the motor
attempts to deliver its full rated power. From the stator and rotor currents to speed and torque
output all of the variables become unstable under such conditions. If protective measures are
not taken the motor may break down within a short time.
51
6 Conclusion
A rigorous analysis of motor operation was carried out in order to understand the effects of
various unbalanced voltage conditions. The motor parameters were evaluated for use in further
simulations that yield graphical demonstrations of the motor operation. Following this
procedure any three-phase induction motor can be designed and tested for optimal operation
either before or after manufacture. The simulation of the motor characteristics under different
voltage conditions through the displays of the torque-speed characteristics, line currents and
rotor speeds can be extremely useful in predicting potential faults or motor design flaws. The
Simulink based MATLAB tool box provide an excellent platform to design and test motor
operations under different input power, faults, and/or critical adverse situations prior to
manufacture. The simulation results can provide essential feedback and data to optimise or
correct design parameters. This study provides the necessary initial data for future work
examining more complex and combined effects of supply voltage phases and magnitudes.
6.1 Future Work Recommendations
The three-phase induction motor operation can be studied in similar ways by using different
protection measures aimed to mitigate the adverse effects of unbalanced voltages. Such studies
will help in designing and optimising protective measures or devices. Such protection
mechanisms may involve automatic or adaptive control systems, micro-controller based
switches and sensor based filters and compensators. In the event of an unbalanced voltage
occurrence it is not always wise to trip or shut down the machine. In order to ensure
uninterrupted or seamless operations in industrial applications the standby protective measures
should automatically operate to compensate for the ill effects of negative sequence
components. Therefore real time acquisition and analysis of torque-speed characteristics,
currents and torques are imperative for a sophisticated and robust motor design.
A sample motor unit test similar to that performed in this study can be adapted for larger scale
motor designs and manufacture. Using similar theory, it would be valuable to study the
operations and characteristics of heavy industrial three-phase induction motors, especially
when they are used for heavy duty or critical industrial processes. It is also important to
understand the effects of drive end load fluctuations in conjunction with unbalanced voltage
conditions. This study focused on the input power quality on the motor performance whereas
the output mechanical power demands may have different transient effects. In cases of

52
overload, sudden changes in load or under load analysis and simulation of these motor variables
may also yield interesting observations.
53
7 Bibliography
[1] W. L. Kenly and B. K. Bose, “Triac Speed Control of Three-Phase Induction Motor
with Phase-Locked Loop Regulation,” Industry Applications, IEEE Transactions on,
vol. IA-12, no. 5, pp. 492–498, 1976.
[2] “Three-phase asynchronous motors: Generalities and ABB proposals for the
coordination of protective devices,” ABB, Jun. 2008.
[3] A. von Jouanne and B. Banerjee, “Assessment of voltage unbalance,” Power Delivery,
IEEE Transactions on, vol. 16, no. 4, pp. 782–790, Oct. 2001.
[4] P. Pillay and M. Manyage, “Loss of Life in Induction Machines Operating With
Unbalanced Supplies,” Energy Conversion, IEEE Transactions on, vol. 21, no. 4, pp.
813–822, Dec. 2006.
[5] P. Gnacinski, “Windings Temperature and Loss of Life of an Induction Machine Under
Voltage Unbalance Combined With Over- or Undervoltages,” Energy Conversion,
IEEE Transactions on, vol. 23, no. 2, pp. 363–371, Jun. 2008.
[6] C.-Y. Lee, “Effects of unbalanced voltage on the operation performance of a three-
phase induction motor,” Energy Conversion, IEEE Transactions on, vol. 14, no. 2, pp.
202–208, Jun. 1999.
[7] D. Mirabbasi, G. Seifossadat, and M. Heidari, “Effect of unbalanced voltage on
operation of induction motors and its detection,” in Electrical and Electronics
Engineering, 2009. ELECO 2009. International Conference on, 2009, pp. I–189–I–192.
[8] U. Jayatunga, S. Perera, and P. Ciufo, “Impact of mains connected three-phase
induction motor loading levels on network voltage unbalance attenuation,” in Power
System Technology (POWERCON), 2012 IEEE International Conference on, 2012, pp.
1–6.
[9] C. T. Raj, P. Agarwal, and S. P. Srivastava, “Performance Analysis of a Three-Phase
Squirrel-Cage Induction Motor under Unbalanced Sinusoidal and Balanced Non-
Sinusoidal Supply Voltages,” in Power Electronics, Drives and Energy Systems, 2006.
PEDES ’06. International Conference on, 2006, pp. 1–4.
[10] J. E. Williams, “Operation of 3-Phase Induction Motors on Unbalanced Voltages
[includes discussion],” Power Apparatus and Systems, Part III. Transactions of the
American Institute of Electrical Engineers, vol. 73, no. 1, Jan. 1954.
[11] B. N. Gafford, W. C. Duesterhoeft, and C. C. Mosher, “Heating of Induction Motors on
Unbalanced Voltages,” Power Apparatus and Systems, Part III. Transactions of the
American Institute of Electrical Engineers, vol. 78, no. 3, pp. 282–286, Apr. 1959.
[12] “Energy matters industrial technology program: The effects of unbalanced voltage on
the life and efficiency of three-phase electric motors,” US Department of Energy and
Renewable energy, Mar. 2005.
[13] L. Guasch-Pesquer, L. Youb, F. Gonzalez-Molina, and E.-R. Zeppa-Durigutti, “Effects
of voltage unbalance on torque and current of the induction motors,” in Optimization of
Electrical and Electronic Equipment (OPTIM), 2012 13th International Conference on,
2012, pp. 647–652.
[14] R. F. Woll, “Effect of Unbalanced Voltage on the Operation of Polyphase Induction
Motors,” Industry Applications, IEEE Transactions on, vol. IA-11, no. 1, pp. 38–42,
Jan. 1975.
[15] E. Quispe, P. Viego, and J. Cogollos, “Statistical equations to evaluate the effects of
voltage unbalance on the efficiency and power factor of a three-phase induction
motors,” WSEAS Trans. Circuits Syst., vol. 4, pp. 234–239, 2005.
54
[16] “Power quality solutions for industrial customers,” California energy commission, Aug.
2000.
[17] S. B. Singh, A. K. Singh, and P. Thakur, “Assessment of induction motor performance
under voltage unbalance condition,” in Harmonics and Quality of Power (ICHQP),
2012 IEEE 15th International Conference on, 2012, pp. 256–261.
[18] R. Automation, “Application basics of operation of three-phase induction motors,” WP-
motors, 1996.
[19] J. R. Jenneson, Electrical Principles For The Electrical Trades. New South Wales,
Australia: McGraw-Hill Book Company, 1985.
[20] S. J. Chapman, Electric Machinery Fundamentals, 4 th. New York: The McGraw-Hill
Companies, 2005.
[21] R. M. Hamouda, A. J. Alohah, and M. A. Badr, “Electromechanical transient of series
connected three phase slip ring induction motors,” in Power Engineering Society
Winter Meeting, 2000. IEEE, 2000, vol. 1, pp. 260–263 vol.1.
[22] P. C. Krause, “The Method of Symmetrical Components Derived by Reference Frame
Theory,” Power Apparatus and Systems, IEEE Transactions on, vol. PAS-104, no. 6,
pp. 1492–1499, Jun. 1985.
[23] R. H. Park, “Two-reaction theory of synchronous machines generalized method of
analysis-part I,” American Institute of Electrical Engineers, Transactions of the, vol.
48, no. 3, pp. 716–727, Jul. 1929.
[24] H. C. Stanley, “Simulation of Symmetrical Induction Machinery,” American Institute of
Electrical Engineers, Transactions, vol. 57, pp. 751–755, 1938.
[25] G. Kron, “Equivalent circuits for the hunting of electrical machinery,” Electrical
Engineering, vol. 61, no. 5, pp. 290–296, May 1942.
[26] P. C. Krause and C. H. Thomas, “Simulation of Symmetrical Induction Machinery,”
Power Apparatus and Systems, IEEE Transactions on, vol. 84, no. 11, pp. 1038–1053,
Nov. 1965.
[27] T. international corporation, “Totally Enclosed Fan Cooled Premium Efficiency Heavy
Duty Electric Motors,” Available:
http://www.tic.toshiba.com.au/premium_efficiency_heavy_duty_induction_motors/Cata
logue%20Toshiba%20LVM%20Premium%20Efficiency%20A4%201209.pdf. 2014.
[28] C. L. Fortescue, “Method of Symmetrical Co-Ordinates Applied to the Solution of
Polyphase Networks,” American Institute of Electrical Engineers, Transactions of the,
vol. XXXVII, no. 2, pp. 1027–1140, Jul. 1918.
[29] S. A. A. 60034.26-2009, “Rotating Electrical Machines: Part 26: Effects of unbalanced
voltages on the performance of three-phase induction motors,” Standards Australia,
2009.
[30] E. Quispe and G. Gonzalez, “Influence of Unbalanced and Waveform Voltage on the
Performance Characteristics of Three-Phase Induction Motors.,” in Energy and power
quality, International Conference on, 2006, pp. 1–5.
[31] “Motors and Generators,” ANSI/NEMA Standard, 1993.
[32] S. A. A. 1359.31-1997, “Rotating Electrical machines-General requirements: Part 31:
Three-phase induction motors-Operation on unbalanced voltages,” Standards Australia,
1997.
[33] S. A. A. 60034.12, “Rotating Electrical Machines Part 12: Starting performance of a
single-speed three-phase cage induction motors,” Standards Australia, 2009.
[34] R. Parekh, “AN887: AC induction motor fundamentals,” Microchip technologies Inc.,
2003.
55
[35] D. L. Skaar, “Circumventing the blocked rotor test when evaluating model elements of
three phase induction motors,” Energy Conversion, IEEE Transactions on, vol. 9, no. 2,
pp. 397–403, Jun. 1994.
[36] Mathworks, “SimPowerSystems: Model and Simulate Electrical Power Systems,”
http://www.mathworks.com.au/products/simpower. 2014.
[37] P. B. Cummings, J. R. Dunki-Jacobs, and R. H. Kerr, “Protection of Induction Motors
Against Unbalanced Voltage Operation,” Industry Applications, IEEE Transactions on,
vol. IA-21, no. 3, pp. 778–792, May 1985.
[38] A. C. Smith and D. G. Dorrell, “Calculation and measurement of unbalanced magnetic
pull in cage induction motors with eccentric rotors. I. Analytical model,” Electric
Power Applications, IEE Proceedings -, vol. 143, no. 3, pp. 193–201, May 1996.
[39] A. Jacob, V. Jose, and D. Sebastian, “Stator fault detection in induction motor under
unbalanced supply voltage,” in Emerging Research Areas: Magnetics, Machines and
Drives (AICERA/iCMMD), 2014 Annual International Conference on, 2014, pp. 1–6.
[40] C.-Y. Lee, B.-K. Chen, W.-J. Lee, and Y.-F. Hsu, “Effects of various unbalanced
voltages on the operation performance of an induction motor under the same voltage
unbalance factor condition,” in Industrial and Commercial Power Systems Technical
Conference, 1997. Conference Record, Papers Presented at the 1997 Annual Meeting.,
IEEE 1997, 1997, pp. 51–59.
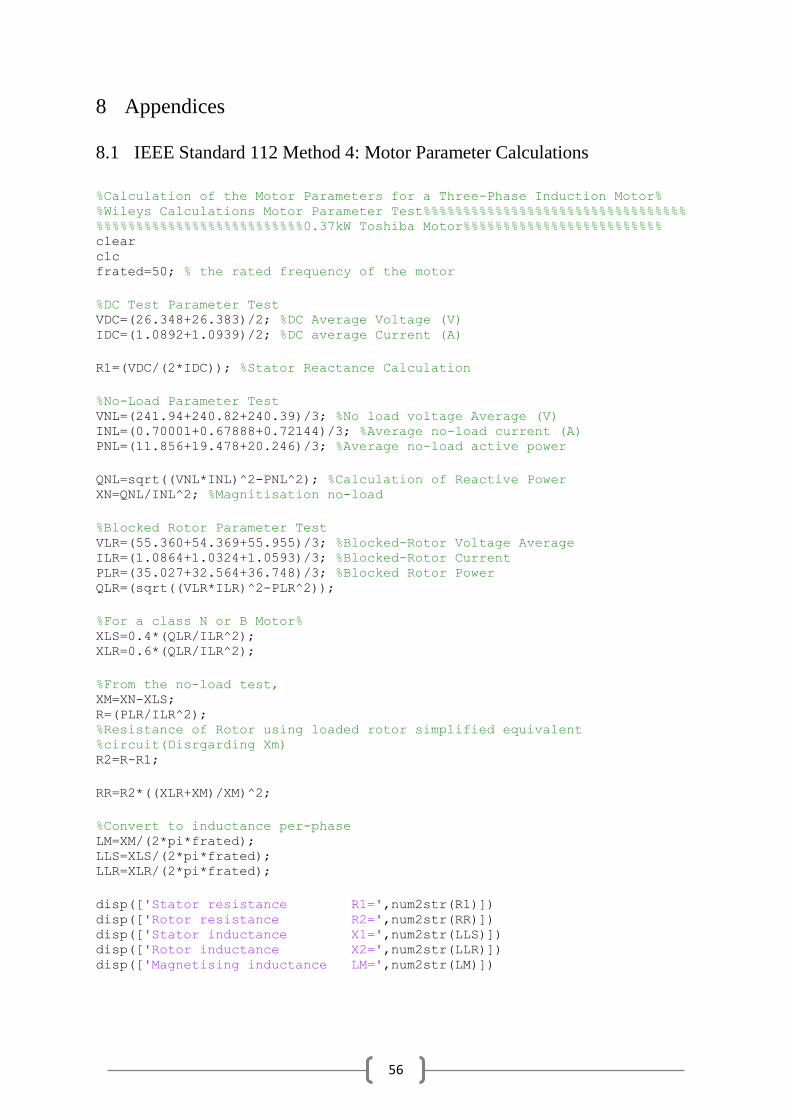
56
8 Appendices
8.1 IEEE Standard 112 Method 4: Motor Parameter Calculations
%Calculation of the Motor Parameters for a Three-Phase Induction Motor% %Wileys Calculations Motor Parameter Test%%%%%%%%%%%%%%%%%%%%%%%%%%%%%%%%% %%%%%%%%%%%%%%%%%%%%%%%%%%0.37kW Toshiba Motor%%%%%%%%%%%%%%%%%%%%%%%%% clear clc frated=50; % the rated frequency of the motor
%DC Test Parameter Test VDC=(26.348+26.383)/2; %DC Average Voltage (V) IDC=(1.0892+1.0939)/2; %DC average Current (A)
R1=(VDC/(2*IDC)); %Stator Reactance Calculation
%No-Load Parameter Test VNL=(241.94+240.82+240.39)/3; %No load voltage Average (V) INL=(0.70001+0.67888+0.72144)/3; %Average no-load current (A) PNL=(11.856+19.478+20.246)/3; %Average no-load active power
QNL=sqrt((VNL*INL)^2-PNL^2); %Calculation of Reactive Power XN=QNL/INL^2; %Magnitisation no-load
%Blocked Rotor Parameter Test VLR=(55.360+54.369+55.955)/3; %Blocked-Rotor Voltage Average ILR=(1.0864+1.0324+1.0593)/3; %Blocked-Rotor Current PLR=(35.027+32.564+36.748)/3; %Blocked Rotor Power QLR=(sqrt((VLR*ILR)^2-PLR^2));
%For a class N or B Motor% XLS=0.4*(QLR/ILR^2); XLR=0.6*(QLR/ILR^2);
%From the no-load test, XM=XN-XLS; R=(PLR/ILR^2); %Resistance of Rotor using loaded rotor simplified equivalent %circuit(Disrgarding Xm) R2=R-R1;
RR=R2*((XLR+XM)/XM)^2;
%Convert to inductance per-phase LM=XM/(2*pi*frated); LLS=XLS/(2*pi*frated); LLR=XLR/(2*pi*frated);
disp(['Stator resistance R1=',num2str(R1)]) disp(['Rotor resistance R2=',num2str(RR)]) disp(['Stator inductance X1=',num2str(LLS)]) disp(['Rotor inductance X2=',num2str(LLR)])
disp(['Magnetising inductance LM=',num2str(LM)])
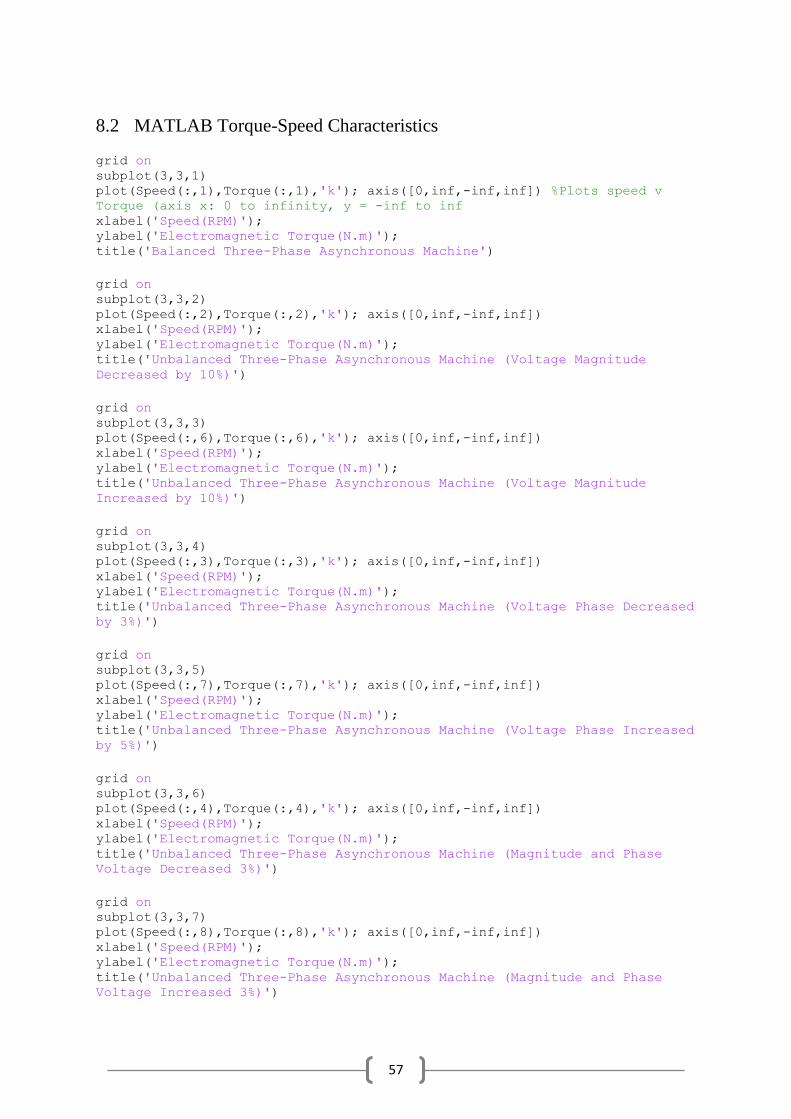
57
8.2 MATLAB Torque-Speed Characteristics
grid on subplot(3,3,1) plot(Speed(:,1),Torque(:,1),'k'); axis([0,inf,-inf,inf]) %Plots speed v
Torque (axis x: 0 to infinity, y = -inf to inf xlabel('Speed(RPM)'); ylabel('Electromagnetic Torque(N.m)'); title('Balanced Three-Phase Asynchronous Machine')
grid on subplot(3,3,2) plot(Speed(:,2),Torque(:,2),'k'); axis([0,inf,-inf,inf]) xlabel('Speed(RPM)'); ylabel('Electromagnetic Torque(N.m)'); title('Unbalanced Three-Phase Asynchronous Machine (Voltage Magnitude
Decreased by 10%)')
grid on subplot(3,3,3) plot(Speed(:,6),Torque(:,6),'k'); axis([0,inf,-inf,inf]) xlabel('Speed(RPM)'); ylabel('Electromagnetic Torque(N.m)'); title('Unbalanced Three-Phase Asynchronous Machine (Voltage Magnitude
Increased by 10%)')
grid on subplot(3,3,4) plot(Speed(:,3),Torque(:,3),'k'); axis([0,inf,-inf,inf]) xlabel('Speed(RPM)'); ylabel('Electromagnetic Torque(N.m)'); title('Unbalanced Three-Phase Asynchronous Machine (Voltage Phase Decreased
by 3%)')
grid on subplot(3,3,5) plot(Speed(:,7),Torque(:,7),'k'); axis([0,inf,-inf,inf]) xlabel('Speed(RPM)'); ylabel('Electromagnetic Torque(N.m)'); title('Unbalanced Three-Phase Asynchronous Machine (Voltage Phase Increased
by 5%)')
grid on subplot(3,3,6) plot(Speed(:,4),Torque(:,4),'k'); axis([0,inf,-inf,inf]) xlabel('Speed(RPM)'); ylabel('Electromagnetic Torque(N.m)'); title('Unbalanced Three-Phase Asynchronous Machine (Magnitude and Phase
Voltage Decreased 3%)')
grid on subplot(3,3,7) plot(Speed(:,8),Torque(:,8),'k'); axis([0,inf,-inf,inf]) xlabel('Speed(RPM)'); ylabel('Electromagnetic Torque(N.m)'); title('Unbalanced Three-Phase Asynchronous Machine (Magnitude and Phase
Voltage Increased 3%)')

58
grid on subplot(3,3,8) plot(Speed(:,5),Torque(:,5),'k'); axis([0,inf,-inf,inf]) xlabel('Speed(RPM)'); ylabel('Electromagnetic torque(N.m)'); title('Unbalanced Three-Phase Asynchronous Machine (Loss of a Phase)')
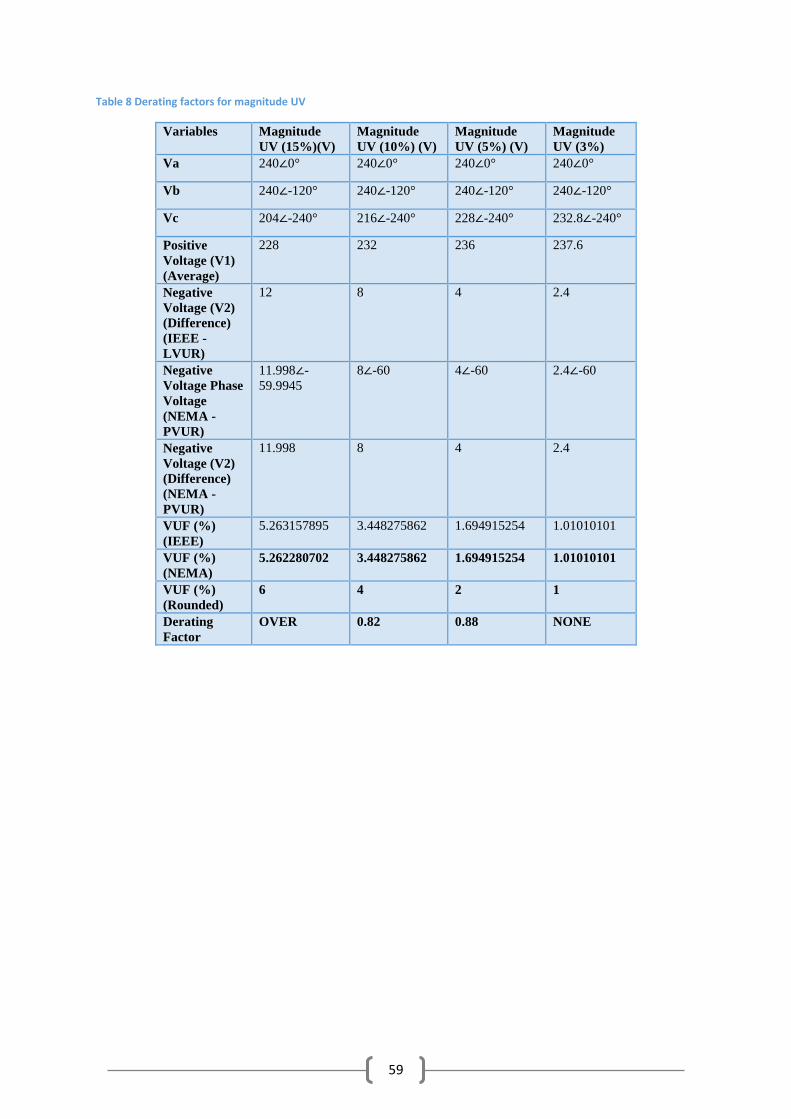
59
Table 8 Derating factors for magnitude UV
Variables Magnitude
UV (15%)(V)
Magnitude
UV (10%) (V)
Magnitude
UV (5%) (V)
Magnitude
UV (3%)
Va 240∠0° 240∠0° 240∠0° 240∠0°
Vb 240∠-120° 240∠-120° 240∠-120° 240∠-120°
Vc 204∠-240° 216∠-240° 228∠-240° 232.8∠-240°
Positive
Voltage (V1)
(Average)
228 232 236 237.6
Negative
Voltage (V2)
(Difference)
(IEEE -
LVUR)
12 8 4 2.4
Negative
Voltage Phase
Voltage
(NEMA -
PVUR)
11.998∠-
59.9945
8∠-60 4∠-60 2.4∠-60
Negative
Voltage (V2)
(Difference)
(NEMA -
PVUR)
11.998 8 4 2.4
VUF (%)
(IEEE)
5.263157895 3.448275862 1.694915254 1.01010101
VUF (%)
(NEMA)
5.262280702 3.448275862 1.694915254 1.01010101
VUF (%)
(Rounded)
6 4 2 1
Derating
Factor
OVER 0.82 0.88 NONE
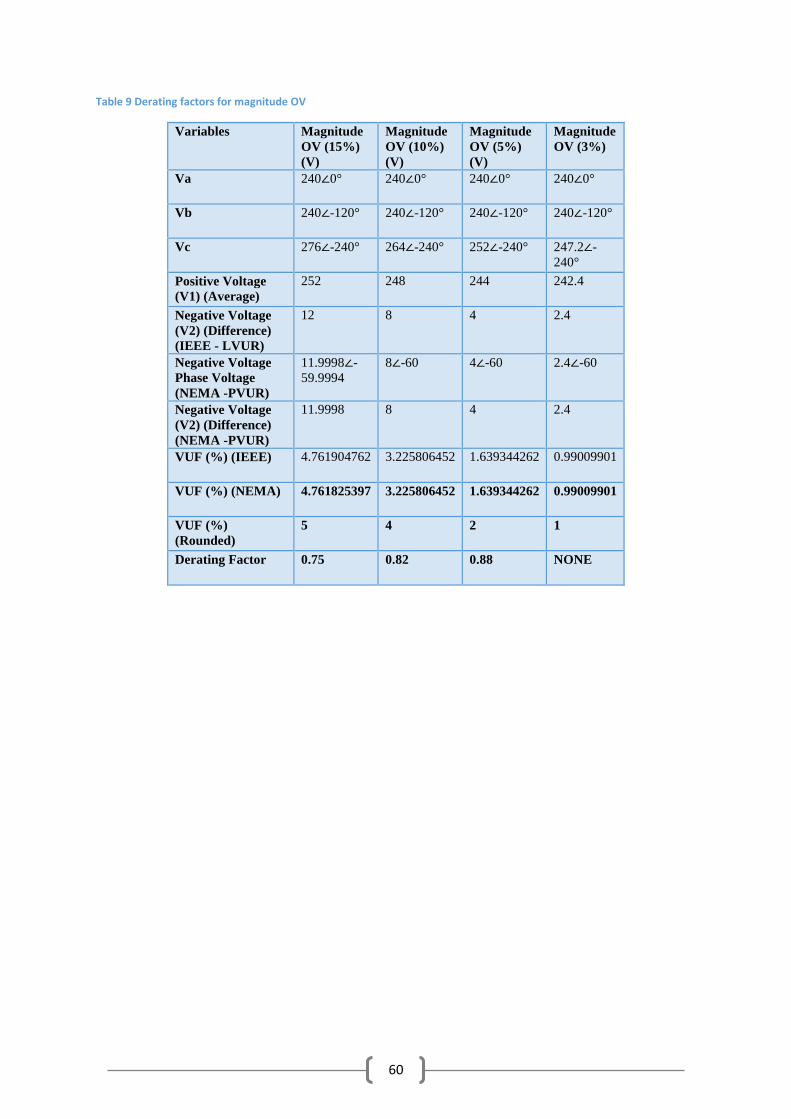
60
Table 9 Derating factors for magnitude OV
Variables Magnitude
OV (15%)
(V)
Magnitude
OV (10%)
(V)
Magnitude
OV (5%)
(V)
Magnitude
OV (3%)
Va 240∠0° 240∠0° 240∠0° 240∠0°
Vb 240∠-120° 240∠-120° 240∠-120° 240∠-120°
Vc 276∠-240° 264∠-240° 252∠-240° 247.2∠-
240°
Positive Voltage
(V1) (Average)
252 248 244 242.4
Negative Voltage
(V2) (Difference)
(IEEE - LVUR)
12 8 4 2.4
Negative Voltage
Phase Voltage
(NEMA -PVUR)
11.9998∠-
59.9994
8∠-60 4∠-60 2.4∠-60
Negative Voltage
(V2) (Difference)
(NEMA -PVUR)
11.9998 8 4 2.4
VUF (%) (IEEE) 4.761904762 3.225806452 1.639344262 0.99009901
VUF (%) (NEMA) 4.761825397 3.225806452 1.639344262 0.99009901
VUF (%)
(Rounded)
5 4 2 1
Derating Factor 0.75 0.82 0.88 NONE
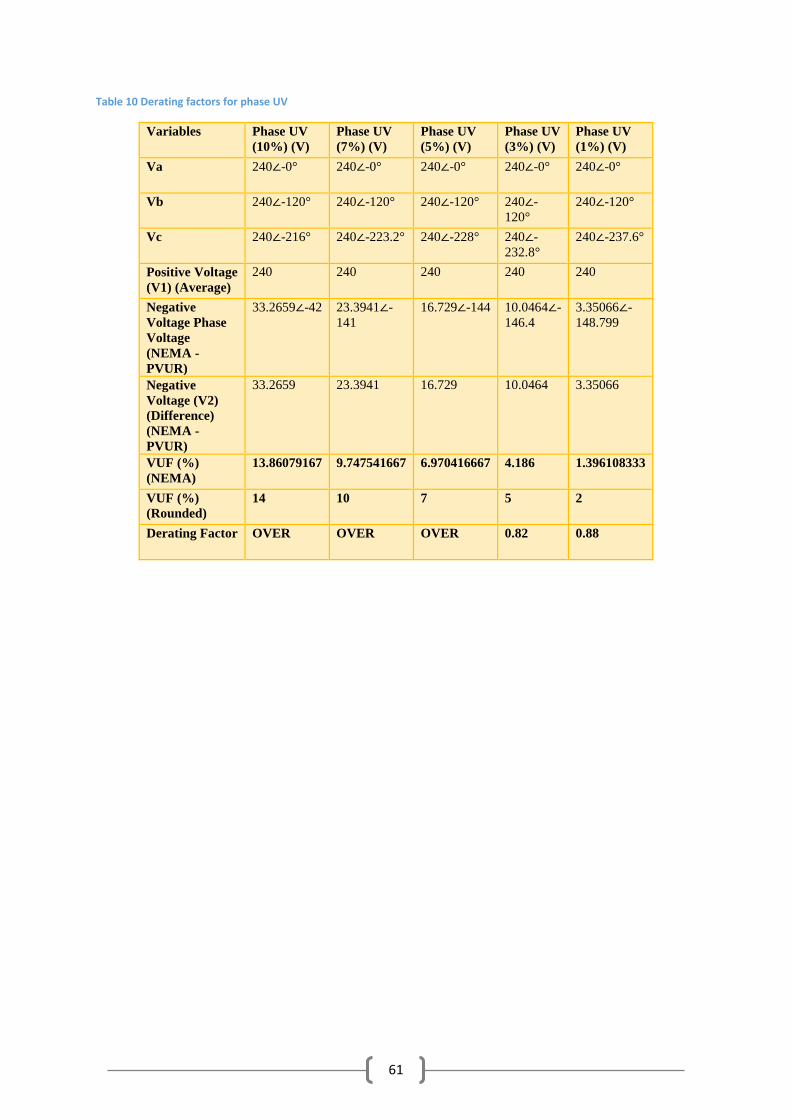
61
Table 10 Derating factors for phase UV
Variables Phase UV
(10%) (V)
Phase UV
(7%) (V)
Phase UV
(5%) (V)
Phase UV
(3%) (V)
Phase UV
(1%) (V)
Va 240∠-0° 240∠-0° 240∠-0° 240∠-0° 240∠-0°
Vb 240∠-120° 240∠-120° 240∠-120° 240∠-
120°
240∠-120°
Vc 240∠-216° 240∠-223.2° 240∠-228° 240∠-
232.8°
240∠-237.6°
Positive Voltage
(V1) (Average)
240 240 240 240 240
Negative
Voltage Phase
Voltage
(NEMA -
PVUR)
33.2659∠-42 23.3941∠-
141
16.729∠-144 10.0464∠-
146.4
3.35066∠-
148.799
Negative
Voltage (V2)
(Difference)
(NEMA -
PVUR)
33.2659 23.3941 16.729 10.0464 3.35066
VUF (%)
(NEMA)
13.86079167 9.747541667 6.970416667 4.186 1.396108333
VUF (%)
(Rounded)
14 10 7 5 2
Derating Factor OVER OVER OVER 0.82 0.88
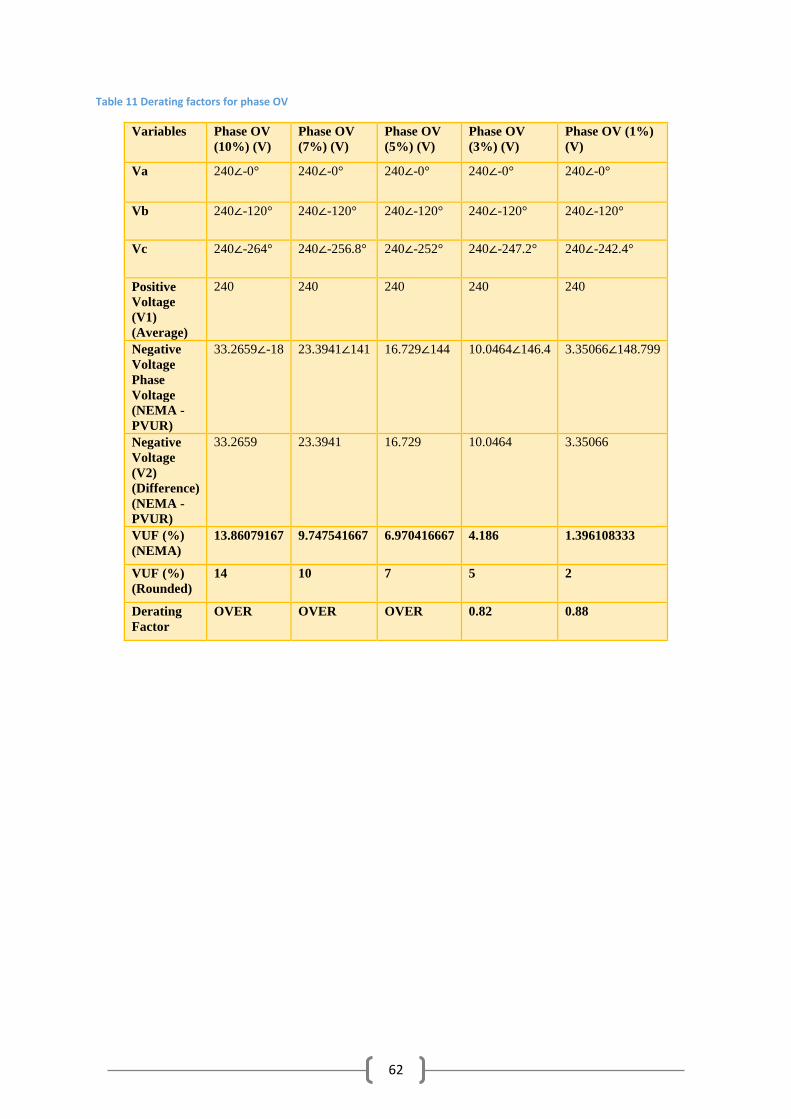
62
Table 11 Derating factors for phase OV
Variables Phase OV
(10%) (V)
Phase OV
(7%) (V)
Phase OV
(5%) (V)
Phase OV
(3%) (V)
Phase OV (1%)
(V)
Va 240∠-0° 240∠-0° 240∠-0° 240∠-0° 240∠-0°
Vb 240∠-120° 240∠-120° 240∠-120° 240∠-120° 240∠-120°
Vc 240∠-264° 240∠-256.8° 240∠-252° 240∠-247.2° 240∠-242.4°
Positive
Voltage
(V1)
(Average)
240 240 240 240 240
Negative
Voltage
Phase
Voltage
(NEMA -
PVUR)
33.2659∠-18 23.3941∠141 16.729∠144 10.0464∠146.4 3.35066∠148.799
Negative
Voltage
(V2)
(Difference)
(NEMA -
PVUR)
33.2659 23.3941 16.729 10.0464 3.35066
VUF (%)
(NEMA)
13.86079167 9.747541667 6.970416667 4.186 1.396108333
VUF (%)
(Rounded)
14 10 7 5 2
Derating
Factor
OVER OVER OVER 0.82 0.88
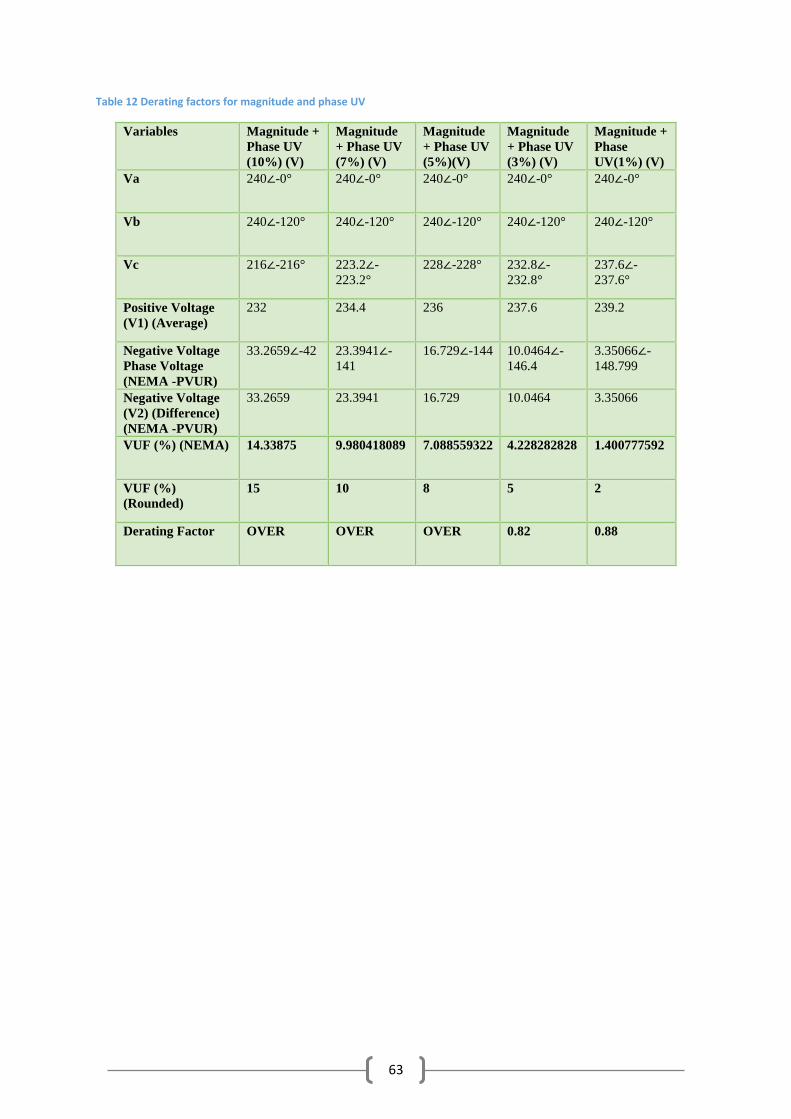
63
Table 12 Derating factors for magnitude and phase UV
Variables Magnitude +
Phase UV
(10%) (V)
Magnitude
+ Phase UV
(7%) (V)
Magnitude
+ Phase UV
(5%)(V)
Magnitude
+ Phase UV
(3%) (V)
Magnitude +
Phase
UV(1%) (V)
Va 240∠-0° 240∠-0° 240∠-0° 240∠-0° 240∠-0°
Vb 240∠-120° 240∠-120° 240∠-120° 240∠-120° 240∠-120°
Vc 216∠-216° 223.2∠-
223.2°
228∠-228° 232.8∠-
232.8°
237.6∠-
237.6°
Positive Voltage
(V1) (Average)
232 234.4 236 237.6 239.2
Negative Voltage
Phase Voltage
(NEMA -PVUR)
33.2659∠-42 23.3941∠-
141
16.729∠-144 10.0464∠-
146.4
3.35066∠-
148.799
Negative Voltage
(V2) (Difference)
(NEMA -PVUR)
33.2659 23.3941 16.729 10.0464 3.35066
VUF (%) (NEMA) 14.33875 9.980418089 7.088559322 4.228282828 1.400777592
VUF (%)
(Rounded)
15 10 8 5 2
Derating Factor OVER OVER OVER 0.82 0.88
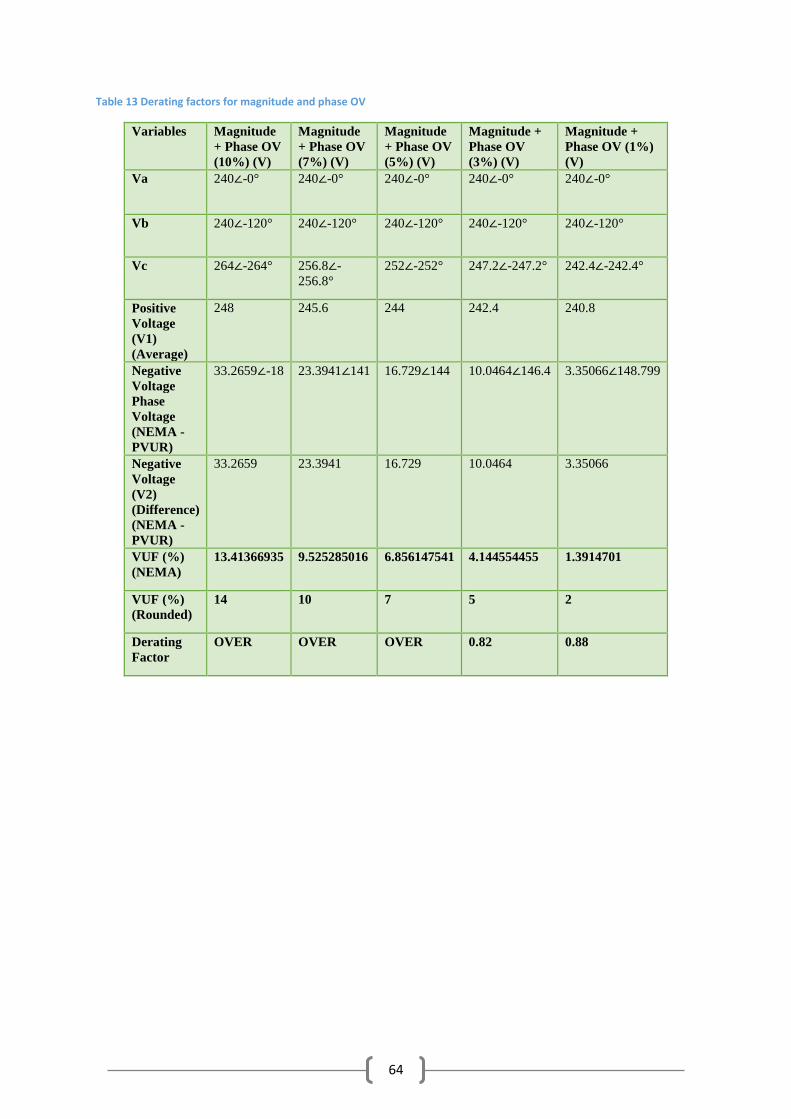
64
Table 13 Derating factors for magnitude and phase OV
Variables Magnitude
+ Phase OV
(10%) (V)
Magnitude
+ Phase OV
(7%) (V)
Magnitude
+ Phase OV
(5%) (V)
Magnitude +
Phase OV
(3%) (V)
Magnitude +
Phase OV (1%)
(V)
Va 240∠-0° 240∠-0° 240∠-0° 240∠-0° 240∠-0°
Vb 240∠-120° 240∠-120° 240∠-120° 240∠-120° 240∠-120°
Vc 264∠-264° 256.8∠-
256.8°
252∠-252° 247.2∠-247.2° 242.4∠-242.4°
Positive
Voltage
(V1)
(Average)
248 245.6 244 242.4 240.8
Negative
Voltage
Phase
Voltage
(NEMA -
PVUR)
33.2659∠-18 23.3941∠141 16.729∠144 10.0464∠146.4 3.35066∠148.799
Negative
Voltage
(V2)
(Difference)
(NEMA -
PVUR)
33.2659 23.3941 16.729 10.0464 3.35066
VUF (%)
(NEMA)
13.41366935 9.525285016 6.856147541 4.144554455 1.3914701
VUF (%)
(Rounded)
14 10 7 5 2
Derating
Factor
OVER OVER OVER 0.82 0.88