Embed Size (px)
Citation preview
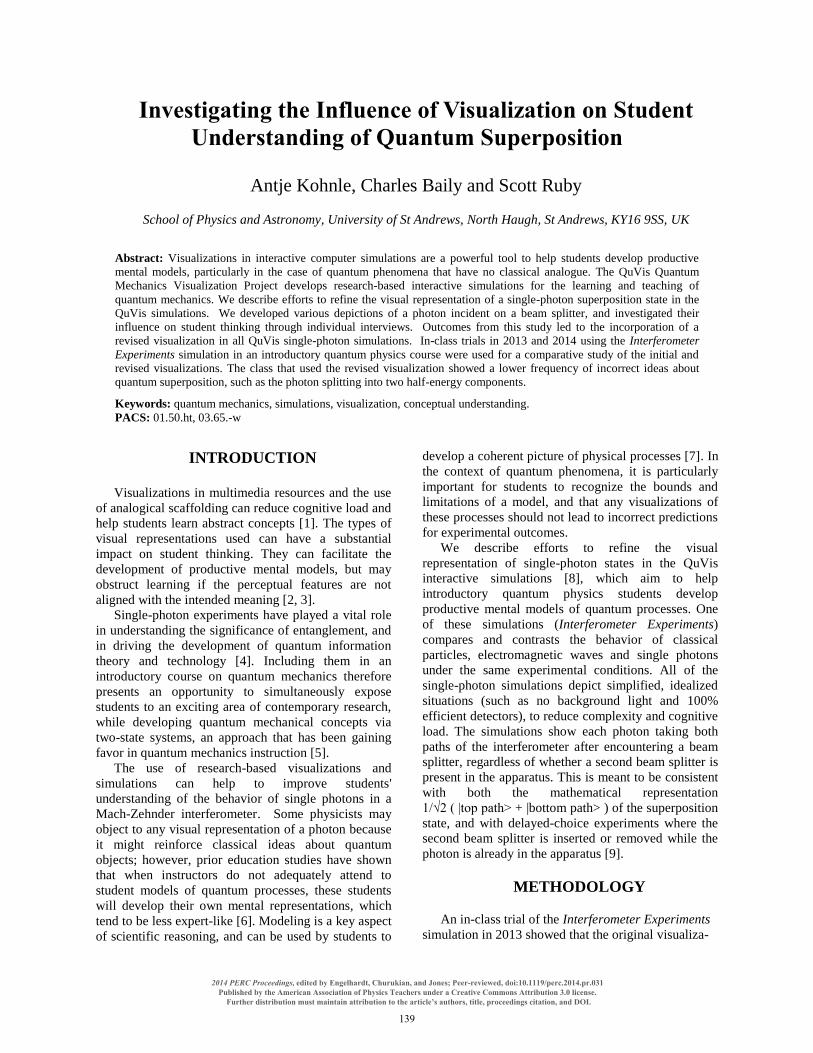
Investigating the Influence of Visualization on Student
Understanding of Quantum Superposition
Antje Kohnle, Charles Baily and Scott Ruby
School of Physics and Astronomy, University of St Andrews, North Haugh, St Andrews, KY16 9SS, UK
Abstract: Visualizations in interactive computer simulations are a powerful tool to help students develop productive
mental models, particularly in the case of quantum phenomena that have no classical analogue. The QuVis Quantum
Mechanics Visualization Project develops research-based interactive simulations for the learning and teaching of
quantum mechanics. We describe efforts to refine the visual representation of a single-photon superposition state in the
QuVis simulations. We developed various depictions of a photon incident on a beam splitter, and investigated their
influence on student thinking through individual interviews. Outcomes from this study led to the incorporation of a
revised visualization in all QuVis single-photon simulations. In-class trials in 2013 and 2014 using the Interferometer
Experiments simulation in an introductory quantum physics course were used for a comparative study of the initial and
revised visualizations. The class that used the revised visualization showed a lower frequency of incorrect ideas about
quantum superposition, such as the photon splitting into two half-energy components.
Keywords: quantum mechanics, simulations, visualization, conceptual understanding.
PACS: 01.50.ht, 03.65.-w
INTRODUCTION
Visualizations in multimedia resources and the use
of analogical scaffolding can reduce cognitive load and
help students learn abstract concepts [1]. The types of
visual representations used can have a substantial
impact on student thinking. They can facilitate the
development of productive mental models, but may
obstruct learning if the perceptual features are not
aligned with the intended meaning [2, 3].
Single-photon experiments have played a vital role
in understanding the significance of entanglement, and
in driving the development of quantum information
theory and technology [4]. Including them in an
introductory course on quantum mechanics therefore
presents an opportunity to simultaneously expose
students to an exciting area of contemporary research,
while developing quantum mechanical concepts via
two-state systems, an approach that has been gaining
favor in quantum mechanics instruction [5].
The use of research-based visualizations and
simulations can help to improve students'
understanding of the behavior of single photons in a
Mach-Zehnder interferometer. Some physicists may
object to any visual representation of a photon because
it might reinforce classical ideas about quantum
objects; however, prior education studies have shown
that when instructors do not adequately attend to
student models of quantum processes, these students
will develop their own mental representations, which
tend to be less expert-like [6]. Modeling is a key aspect
of scientific reasoning, and can be used by students to
develop a coherent picture of physical processes [7]. In
the context of quantum phenomena, it is particularly
important for students to recognize the bounds and
limitations of a model, and that any visualizations of
these processes should not lead to incorrect predictions
for experimental outcomes.
We describe efforts to refine the visual
representation of single-photon states in the QuVis
interactive simulations [8], which aim to help
introductory quantum physics students develop
productive mental models of quantum processes. One
of these simulations (Interferometer Experiments)
compares and contrasts the behavior of classical
particles, electromagnetic waves and single photons
under the same experimental conditions. All of the
single-photon simulations depict simplified, idealized
situations (such as no background light and 100%
efficient detectors), to reduce complexity and cognitive
load. The simulations show each photon taking both
paths of the interferometer after encountering a beam
splitter, regardless of whether a second beam splitter is
present in the apparatus. This is meant to be consistent
with both the mathematical representation
1/√2 ( |top path> + |bottom path> ) of the superposition
state, and with delayed-choice experiments where the
second beam splitter is inserted or removed while the
photon is already in the apparatus [9].
METHODOLOGY
An in-class trial of the Interferometer Experiments
simulation in 2013 showed that the original visualiza-
edited by Engelhardt, Churukian, and Jones; Peer-reviewed, doi:10.1119/perc.2014.pr.031 Published by the American Association of Physics Teachers under a Creative Commons Attribution 3.0 license. Further distribution must maintain attribution to the article’s authors, title, proceedings citation, and DOI.
2014 PERC Proceedings,
139

tion (see Fig. 1) led some students to develop incorrect
ideas about quantum superposition; in particular, some
students interpreted the effect of the beam splitter as
being analogous to splitting a classical object into two
pieces. In consultation with quantum optics research-
ers, through brainstorming and drawing on our own
experience and the literature on student difficulties, we
created four new animated sequences depicting a series
of single photons incident on a beam splitter, the
subsequent superposition state, and the detection of a
photon in one of two detectors (shown as a flash in the
detector). Each sequence was identical except for how
the photon was represented.
FIGURE 1. The original depiction of the single photon
superposition state.
In the original depiction, the yellow coloring of the
incident photon (chosen to suggest visible light) was
opaque, then semi-transparent after encountering the
beam splitter (Fig. 1), in order to provide a visual cue
for the reduced probability amplitude associated with
the individual state, and to reinforce that the state of
the photon had changed. This general type of
visualization was retained in the four revised
depictions, but they also included more substantial
cues about the differences between the incident and
superposition states (see Fig. 2).
In each case, the amplitude of the incident wave is
reduced by a factor of 1/√2 for the superposition state,
and the axis of the wave now rotates according to the
direction of propagation. The wavelength remains
constant throughout, to indicate that the energy of each
component in the superposition is not halved (i.e., the
wavelength is not doubled). We removed the outer
black circle of the original depiction, which implied
that each photon had a definite spatial extent; at the
same time, the size of the yellow circle is the same for
both incident and superposition states, to help students
avoid the idea of the photon dividing like a classical
object into two smaller components. The overall size of
the photon has been increased in order to make all of
these revised visual cues more perceptible.
As can be seen in Fig. 2, the yellow circle was
removed entirely from one of the depictions (II), as a
possible way to reduce associations with a classical
particle. Visualizations III and IV use a dashed line
connecting the two components of the superposition
state in order to indicate that they remain linked while
spatially separated, and are not independent of each
other. Visualizations I and III are identical with the
exception of the dashed line. The incident wave in
Visualization IV is half red and half black, but then
splits into two connected states, where one is entirely
black and the other red.
FIGURE 2. The four revised single photon depictions
(numbered I to IV) used in the individual student interviews
as described in the text. For each depiction, two screenshots
are shown, one of the incident photon and one of the photon
superposition state.
To assess the impact these revised visualizations
might have on student thinking, we carried out
individual interviews with nine volunteers who had
just completed an introductory quantum physics course
at the University of St Andrews. In these sessions,
I
II
III
IV
140
students were asked to view each of the revised
visualizations in turn. They were first asked to freely
describe what the visualization suggested to them, then
given a list of statements (see Table 1) and asked to
select out those that corresponded to what each
visualization suggested to them. Students typically
spent about 15 minutes in total exploring the different
visualizations. The statements in Table 1 include
incorrect student ideas about quantum superposition
collected during the 2013 in-class trial of the
Interferometer Experiments simulation (in particular,
statements 2 & 4); incorrect ideas that we thought the
new visualizations might suggest to students
(statements 5 & 10); and ideas we considered
productive for making sense of single-photon
interference and delayed choice experiments
(statements 1, 7, 8, 12 & 13).
TABLE 1. Statements used in the student interview
sessions, in the same order as they were given.
1 Photon takes both paths.
2 Photon has split into two photons.
3 Photon intensity is split in half.
4 Photon splits into two half-energy photons.
5 Two photons on top of one another
have separated.
6 There are two photons that are entangled
after the beam splitter.
7 Phase relationship between the two paths is
maintained.
8 Photon is in a superposition state.
9 Photon is a wave packet.
10 Photon is a particle.
11 Photon is a wave packet and a particle at the
same time.
12 Photon wave packet amplitude has decreased
to conserve probability.
13 The two wave packets represent a single
photon.
OUTCOMES
In these nine interviews, many students thought that
Visualizations I and II were showing two distinct
photons. Every student indicated that the dashed line
joining the two components in Visualizations III and
IV suggested some kind of relationship or connection
was being maintained between them. Some students
also agreed that the dashed line implied that the two
photons remain in phase. Every student stated that
Visualization II represented a wave packet, though
several thought this made the photon seem too much
like just a classical wave. Five of the nine students
thought that Visualization IV showed two overlapping
photons that then separate into two half-energy
photons. The use of different colors in the two
components seemed to suggest to them that they each
have distinct properties (e.g., different energies or
polarization states). Although the different colors were
not meant to have any physical interpretation, other
students were confused by what the two colors might
actually represent. One commented that this particular
depiction was overwhelming, because there was too
much going on visually.
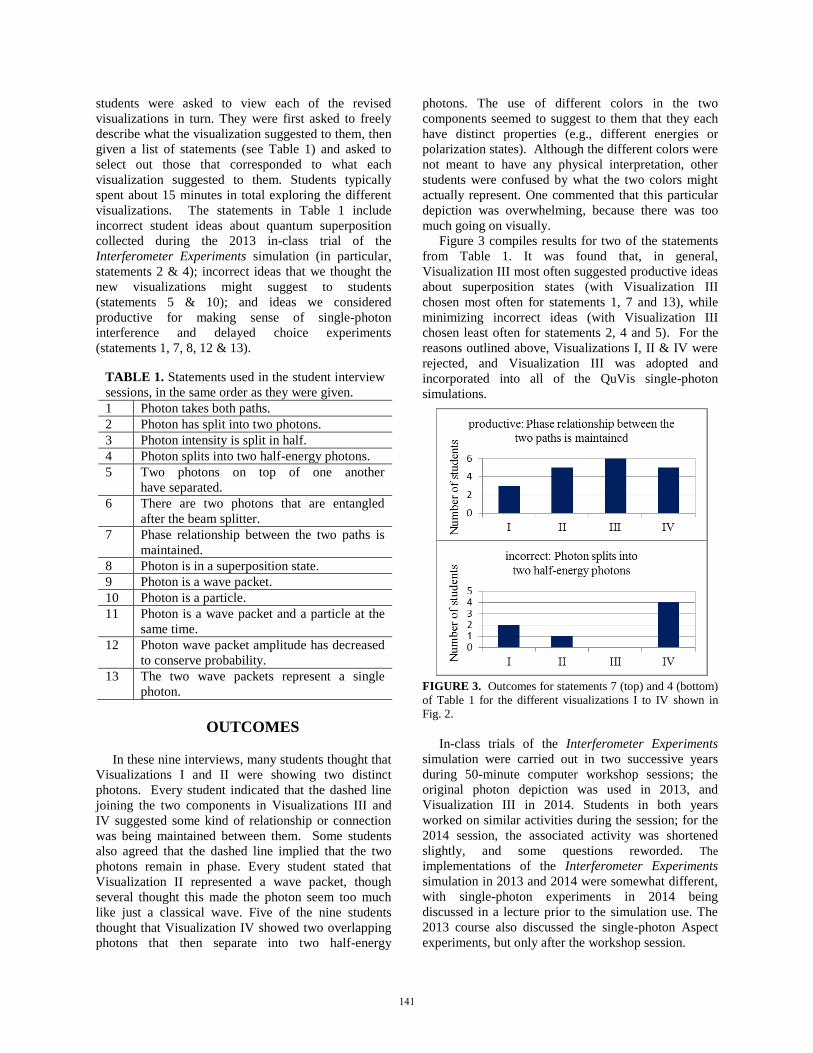
Figure 3 compiles results for two of the statements
from Table 1. It was found that, in general,
Visualization III most often suggested productive ideas
about superposition states (with Visualization III
chosen most often for statements 1, 7 and 13), while
minimizing incorrect ideas (with Visualization III
chosen least often for statements 2, 4 and 5). For the
reasons outlined above, Visualizations I, II & IV were
rejected, and Visualization III was adopted and
incorporated into all of the QuVis single-photon
simulations.
FIGURE 3. Outcomes for statements 7 (top) and 4 (bottom)
of Table 1 for the different visualizations I to IV shown in
Fig. 2.
In-class trials of the Interferometer Experiments
simulation were carried out in two successive years
during 50-minute computer workshop sessions; the
original photon depiction was used in 2013, and
Visualization III in 2014. Students in both years
worked on similar activities during the session; for the
2014 session, the associated activity was shortened
slightly, and some questions reworded. The
implementations of the Interferometer Experiments
simulation in 2013 and 2014 were somewhat different,
with single-photon experiments in 2014 being
discussed in a lecture prior to the simulation use. The
2013 course also discussed the single-photon Aspect
experiments, but only after the workshop session.
141

At the end of the session students were asked to
provide a written response (and to rate their confidence
in their answer) to the question: “What happens when a
single photon encounters a beam splitter?" [N=78 for
2014; N=28 for 2013, when only a a representative
third of the class, namely those with a given lab day,
used the simulation] We analyzed their responses with
an emergent coding scheme, using the same codes for
the 2013 and 2014 data. A subset of responses was
coded by a second researcher and checked for inter-
rater reliability. Categories with disagreement were
discussed and revised until high inter-rater reliability
was achieved (Cohen’s Kappa 0.62 to 1).
Figure 4 shows results from our analysis of student
responses collected during the in-class trials in 2013
and 2014; the various codes are given in the figure
caption. One can see that the fraction of students
describing a photon in a superposition state as being
split into two separate entities (Category D in Fig. 4)
decreased substantially from 2013 to 2014. An exact
test for Pearson’s chi-square shows a significant
difference in the two distributions: χ2(4, N=104) =15.9;
exact p=0.003. Some examples of typical student
statements for the different codes are: [Category A]
"The single photon will either go through or reflected,
one way or the other. It behaves like a particle.";
[Category B] "It turns into a superposition going along
both paths and only definitely goes down one of these
paths when it is observed."; [Category C] "The single
photon occupies two quantum states, of reflection and
of transmission. The photon does not 'split' but the
probability of it being in either is equal."; [Category D]
“A single photon is split into two after the beam
splitter. This is the photon exhibiting its wavelike
properties.”; [Category E] "It becomes superimposed
and behaves much like a wave."
FIGURE 4. Results from the in-class trials as described in
the text. The codes are: (A) “Photon takes one or the other
path”; (B) “Measurement reveals the path the photon took”;
(C) “Photon takes both paths”; (D) “Photon splits into two
separate photons”; and (E) Other.
CONCLUSIONS / FUTURE WORK
From the four visualizations we investigated in the
interviews, Visualization III was optimal in terms of
maximizing productive ideas about quantum
superposition and minimizing incorrect ones. The class
that used the revised visualization showed a lower
frequency of incorrect ideas about quantum
superposition. Limitations of this work are the small
number of different visualizations assessed, and the
somewhat different curricula in the 2013 and 2014
courses. Very few students noticed the change in
amplitude of the wave packet in the transition from
incident to superposition state, which may imply that
this visual cue is too small to be easily seen. Other
studies have found that students may incorrectly
associate amplitude of a quantum wave with energy, so
this visual cue may also not be productive [10].
We plan to continue these studies with further
visualizations. We have also developed a number of
visualizations of down-converted entangled photon
pairs and are currently trialing these in student
interviews.
ACKNOWLEDGMENTS
We thank Frieder König at the University of St
Andrews and Heather Lewandowski at JILA in
Boulder, Colorado for useful discussions about single
photons and their visualization. We gratefully
acknowledge all of the students who participated in
this study. We thank the UK Institute of Physics for
funding this work.
REFERENCES
1. N. Podolefsky and N. Finkelstein, Phys Rev ST PER 3,
010109 (2007); Z. Chen, T. Stelzer and G. Gladding,
Phys Rev ST PER 6, 010108 (2010).
2. Z Chen and G Gladding, Phys Rev ST PER 10, 010111
(2014).
3. A. Van Heuvelen and X. Zou, Am. J. Phys. 69, 184
(2001).
4. A. Aspect, J. Bell and the second quantum revolution, in
Speakable and Unspeakable in Quantum Mechanics, 2nd
Ed. (Cambridge University Press, Cambridge, 2004).
5. Cf. M. Beck, Quantum Mechanics – Theory and
Experiment (Oxford University Press, NY, 2012); D
McIntyre, Quantum Mechanics (Pearson Addison-
Wesley, San Francisco CA, 2012).
6. C. Baily and N. D. Finkelstein, Phys Rev ST PER 6,
010101 (2010); Phys Rev ST PER 6, 020113 (2010).
7. C. Schwarz et al., J. Res. Sci. Teach. 46, 632 (2009).
8. Simulations 1-3 in the “New Quantum Curriculum sims”
collection at www.st-andrews.ac.uk/physics/quvis
9. F. Kaiser, et al., Science 338, 637 (2012).
10. S. B. McKagan, K. K. Perkins and C. E Wieman, Phys
Rev ST PER 4, 020103 (2008).
142