Embed Size (px)
Citation preview
i
Investigating the Mechanisms of Silver Nanoparticle Toxicity in Daphnia magna: A Multi-Omics Approach
By
Alex Gavin
A thesis submitted to
The University of Birmingham
for the degree of
DOCTOR OF PHILOSOPHY
School of Biosciences
College of Life and Environmental Sciences
University of Birmingham
September 2014
University of Birmingham Research Archive
e-theses repository This unpublished thesis/dissertation is copyright of the author and/or third parties. The intellectual property rights of the author or third parties in respect of this work are as defined by The Copyright Designs and Patents Act 1988 or as modified by any successor legislation. Any use made of information contained in this thesis/dissertation must be in accordance with that legislation and must be properly acknowledged. Further distribution or reproduction in any format is prohibited without the permission of the copyright holder.
ii
Abstract
Silver nanoparticles (AgNPs), one of the most common nanomaterials in use today, have
been shown to enter the aquatic environment through use of commercially obtained
products. Although toxicity to aquatic organisms has been demonstrated, there is still
uncertainty surrounding the molecular mechanism of AgNP-induced toxicity. The work
presented in this thesis investigates the hypothesis that AgNP toxicity is induced indirectly
through the release of ionic silver (Ag+) upon dissolution. The mechanism of AgNP
toxicity would therefore be identical to that induced by dissolved silver. This hypothesis
was tested through the comparison of the molecular-level changes in Daphnia magna, a
global keystone species of freshwater ecosystems, induced by AgNP and AgNO3 exposure.
Through use of Agilent microarray transcriptomics and direct-infusion mass spectrometry
metabolomics, the same molecular profile changes were observed in D. magna exposed to
AgNPs and to the dissolved Ag fraction alone. However, a greater magnitude of effect was
observed in AgNP exposures. The measurement of the uptake and depuration of both
forms of silver suggested the increased magnitude of molecular response to AgNP
exposure fit a Trojan-horse type mechanism. Therefore, AgNPs absorbed by D. magna,
resulted in higher internal concentration of toxic Ag+. Further investigation into the
mechanism of AgNP toxicity revealed significant changes to constituents of the purine
metabolism pathway. Additionally, measurement of the expression of glutathione-S-
transferase and heme-oxygenase 1 (traditional markers for oxidative stress) by quantitative
RT-PCR showed no significant changes. This suggested that if oxidative stress was a
primary mechanism of AgNP toxicity in D. magna, the transcriptional response may not be
through well-conserved anti-oxidant enzymes. Overall, this research advances the
mechanistic understanding of AgNP toxicity to aquatic organisms, and highlights the
ability of omics technologies to provide unique insights into mechanisms of toxicity.
iii
Acknowledgements
I’ve learnt a lot over the past four years:
I have met a woman with two birthdays and a man with incessant hiccups
I now know that Cornwall has its own style of tartan
Despite possibly being the most eaten thing on the entire planet, the resting eggs of
Daphnia can survive dormant for 700 years. And then hatch. Alive.
And finally, it is fundamentally impossible to complete a PhD and the resulting
thesis without the support of those around you
It is on this final point I wish to focus. A lot of people have helped me throughout the
term of my PhD and it is in this section that I would like to acknowledge their help and
contributions to this thesis.
Firstly, I would like to thank both Professor Mark Viant and Professor Kevin Chipman for
their guidance and support. Thanks are also due to Dr Tim Willams, Dr Leda Mirbahai
and Lorna Thorne for their patience and tuition on all things microarray and PCR. Thanks
to Dr Andy Southam for his lessons on mass spectrometry, and also to Dr Nadine Taylor
and Dr Thomas White for the Daphnia magna culturing 101. This work revolves around
silver nanoparticles which were manufactured in-house, and without the help of Dr
Isabella Romer, Dr Mila Tejamaya, and soon to be Doctors Laura Ellis and Marie-France
Belinga-Desaunay-Nault, this thesis would be a lot shorter.
I would like to thank members of the fourth floor, past and present, for their help, advice,
tea-breaks, cake-breaks and the proverbial one or two in staff house. So thanks to Tom,
Rosie, Kate, Martin, Leda, Chib, Nadine, Louise, Lorna, Will, Ralf, Greg, Jinkang,
Ricardo, Andy, Rob, Cronin and Tim; you’ve all made lab-life a lot more bearable.

iv
I must also thank my parents, Tony and Lyn Gavin, for raising me the way they have and
always telling me off for saying “that’ll do” – either something’s done to the best of your
ability or it’s not good enough. Finally, this thesis simply would not exist without the
unending support of my fantastic and wonderful wife Rebecca Gavin. She kept me
motivated, positive and never let me be too hard on myself. And when things got really
stressful she put the kettle on.
v
Table of Contents
Chapter 1: General Introduction ............................................................................................ 1
1.1 Nanotechnologies and the emergence of Nanotoxicology .......................................... 1
1.2 Silver nanoparticles: The most commercially prominent nanomaterial ...................... 4
1.2.1 The toxicity of dissolved silver ............................................................................ 5
1.2.2 The molecular toxicity of silver nanoparticles ................................................... 11
1.2.3 The potential role of dissolved Ag+ in AgNP toxicity........................................ 12
1.3 Omics-technologies and their application to silver nanotoxicology ......................... 17
1.3.1 Analytical platforms for Transcriptomics........................................................... 19
1.3.2 Analytical platforms for metabolomics .............................................................. 20
1.3.3 Statistical analysis of ‘omics datasets ................................................................. 22
1.3.4 Annotation of genes and metabolites and methods of pathway analysis ........... 22
1.3.5 The application of omics-technologies for the elution of the AgNP MoA ........ 26
1.4 Ecotoxicogenomics and the importance of relevant test organisms .......................... 30
1.4.1 Ecotoxicogenomics and Daphnia magna ........................................................... 36
1.5 Research hypothesis, aims and objectives ................................................................. 37
Chapter 2: Materials and Methods....................................................................................... 38
2.1 Standard chemicals and reagents ............................................................................... 38
2.2 Acid-wash cleaning procedures ................................................................................. 38
2.3 Nanoparticle synthesis and characterisation .............................................................. 38
vi
2.3.1 Silver nanoparticle synthesis – conducted by Dr. Isabella Römer and Dr. Mila
Tejamaya (University of Birmingham) ....................................................................... 38
2.3.2 Particle characterisation – conducted by Dr. Isabella Römer and Dr. Mila
Tejamaya (University of Birmingham) ....................................................................... 39
2.3.3 Measurement of total Ag concentration of stock solutions by Inductively
Coupled Plasma Mass Spectrometry (ICP-MS) .......................................................... 40
2.4 Daphnia magna culturing .......................................................................................... 41
2.4.1 Preparation and composition of media ............................................................... 41
2.4.2 Chlorella vulgaris maintenance and preparation of feeding solution ................ 42
2.4.3 Preparation of dietary supplements for D. magna culture .................................. 44
2.4.4 Daphnia magna strain origin .............................................................................. 44
2.4.5 Daphnia magna culture maintenance ................................................................. 44
2.5 Daphnia magna toxicity exposure conditions ........................................................... 45
Chapter 3: Optimisation of aqueous nanoparticle toxicity exposure conditions and
characterisation of AgNPs ................................................................................................... 46
3.1 Introduction ............................................................................................................... 46
3.2 Materials and Methods .............................................................................................. 49
3.2.1 Nanoparticle synthesis and characterisation - conducted by Dr. Isabella Römer
& Dr. Mila Tejamaya (University of Birmingham) .................................................... 49
3.2.2 Determining the impact of media composition on cit-AgNP toxicity ................ 49
3.2.3 Determining the impact of media composition on cit-AgNP stability ............... 52
vii
3.2.4 Full characterisation of dose-response curves of PVP-AgNPs and dissolved Ag
(from AgNO3) to D. magna neonates in media10 ....................................................... 53
3.2.5 Measurement of PVP-AgNP dissolution in media10 ......................................... 56
3.2.6 Assessment of particle dissolution by ultracentrifugation .................................. 57
3.2.7 Assessment of particle dissolution by ultrafiltration .......................................... 57
3.2.8 Measurement of silver dissolution samples by ICP-MS .................................... 58
3.3 Results and Discussion .............................................................................................. 62
3.3.1 Importance of media composition in nanoparticle toxicity testing .................... 62
3.3.2 Characterisation of PVP-AgNP and Ag+ toxicity to D. magna in media10 ....... 68
3.3.3 Measuring dissolution of AgNPs in D. magna exposure media ........................ 71
3.4 Conclusions ............................................................................................................... 75
Chapter 4: Determining the role of Ag+ ions in AgNP toxicity .......................................... 77
4.1 Introduction ............................................................................................................... 77
4.2 Materials and Methods .............................................................................................. 81
4.2.1 Sub-lethal omics exposure studies ...................................................................... 81
4.2.2 Dual-omics extraction protocol .......................................................................... 82
4.2.3 Bi-phasic extraction of polar metabolites ........................................................... 83
4.2.4 Polar extract re-suspension for MS analysis....................................................... 84
4.2.5 Acquisition of mass spectra ................................................................................ 84
4.2.6 Mass spectral data processing ............................................................................ 85
4.2.7 Probable Quotient Normalisation of m/z intensity matrices ............................... 86
4.2.8 Missing value imputation by the k-nearest neighbour method .......................... 86
viii
4.2.9 Generalised logarithm transformation for multivariate analysis ........................ 87
4.2.10 Generation of calibration lists........................................................................... 87
4.2.11 Assessment of MS data quality ........................................................................ 87
4.2.12 Extraction of total RNA .................................................................................... 91
4.2.13 Ethanol/Acetate precipitation of RNA ............................................................. 91
4.2.14 Amplification and Cy3-labelling of selected RNA samples ............................ 91
4.2.15 Hybridisation and scanning of a custom D. magna microarray ....................... 92
4.2.16 Microarray data processing .............................................................................. 93
4.2.17 Principal components analysis of multivariate data ......................................... 93
4.2.18 Analysis of variance of individual peak intensities between exposure groups 94
4.2.19 AgNP and AgNO3 uptake and elimination studies ........................................... 94
4.2.20 Preparation of samples for ICP-MS analysis of internalised silver .................. 96
4.3 Result and Discussion ................................................................................................ 98
4.3.1 Exposure to the capping agent and bulk-Ag controls does not induce an adverse
transcriptional or metabolic response. ......................................................................... 98
4.3.2 AgNP and Ag+ exposures and sample processing ............................................ 100
4.3.3 Ag NPs induce a dose-dependent perturbation to Daphnia gene transcription
and metabolism which is not fully accounted for by the Ag+ content of AgNP
exposures ................................................................................................................... 101
4.3.4 AgNP likely enact toxicity via the digestive tract ............................................ 112
4.4 Conclusion ............................................................................................................... 120
ix
Chapter 5: Elucidating the molecular mode of action of silver nanoparticles to Daphnia
magna ................................................................................................................................ 122
5.1 Introduction ............................................................................................................. 122
5.2 Materials and Methods ............................................................................................ 127
5.2.1 Putative annotation of filtered genes and m/z peaks ........................................ 127
5.2.2 Over-representation analysis of transcriptomics datasets using DAVID ......... 128
5.2.3 Over-representation analysis of metabolomics datasets using MetaboAnalyst 128
5.2.4 Integrated over-representation pathway analysis of metabolomics and
transcriptomics datasets using IMPaLA .................................................................... 129
5.2.5 Confirmation of gene changes in purine metabolism pathway by quantitative,
reverse transcriptase PCR .......................................................................................... 129
5.2.6 Synthesis of cDNA ........................................................................................... 129
5.2.7 Primer design and validation ............................................................................ 130
5.2.8 Agarose gel electrophoresis of PCR products .................................................. 132
5.2.9 Purification and sequencing of PCR products .................................................. 132
5.2.10 RT-qPCR using omics samples ...................................................................... 133
5.2.11 Relative quantification using the Pfaffl method ............................................. 134
5.2.12 Confirming the identities of significantly changing metabolites.................... 134
5.3 Result and Discussion .............................................................................................. 136
5.3.1 Putative annotation of molecular markers of AgNP exposure ......................... 136
5.3.2 Interpreting annotation: over-representation analysis of annotated variables .. 137
x
5.3.3 AgNPs and Ag+ ions induce a significant change in metabolites and gene-
products involved in purine metabolism ................................................................... 143
5.3.4 Attempted confirmation of perturbed gene regulation by qPCR ...................... 149
5.3.5 Identification of inosine and guanosine by MS/MS fragmentation .................. 151
5.4 Conclusions ............................................................................................................. 155
Chapter 6: Exploring the role of reactive oxygen species and oxidative stress in Ag toxicity
to D. magna ....................................................................................................................... 157
6.1 Introduction ............................................................................................................. 157
6.2 Methods ................................................................................................................... 162
6.2.1 AgNP and AgNO3 toxicity exposures to D. magna neonates .......................... 162
6.2.2 Dynamic light scattering (DLS) ....................................................................... 163
6.2.3 ICP-MS ............................................................................................................. 164
6.2.4 Extraction of RNA ............................................................................................ 165
6.2.5 Synthesis of cDNA ........................................................................................... 165
6.2.6 Primer design .................................................................................................... 167
6.2.7 RT-qPCR .......................................................................................................... 167
6.3 Results and Discussion ............................................................................................ 170
6.3.1 Characterisation of dosed exposure media using DLS and ICP-MS ................ 170
6.3.2 Targeted analysis of antioxidant enzyme expression by RT-qPCR ................. 174
6.4 Conclusions ............................................................................................................. 178
Chapter 7: General Discussion and future work ................................................................ 180
7.1 The role of dissolution in AgNP toxicity................................................................. 180
xi
7.2 The molecular response of D. magna to Ag exposure ............................................ 183
7.3 The use of omics-technologies in nanoparticle risk assessment.............................. 188
7.4 Concluding remarks ................................................................................................. 191
Chapter 8: References ........................................................................................................ 192
Chapter 9: Appendix .......................................................................................................... 222
9.1 Mean measured total Ag concentrations following separation of dissolved Ag and
AgNP ............................................................................................................................. 222
9.2 Lists of m/z peaks and putative IDs used for calibration in negative ion mode ...... 223
9.3 Mortality data for sub-lethal toxicity exposures ...................................................... 224
9.4 Tables of annotated variables that change significantly in intensity in response to
AgNP and Ag+ exposure ................................................................................................ 226
xii
List of Figures
Chapter 1
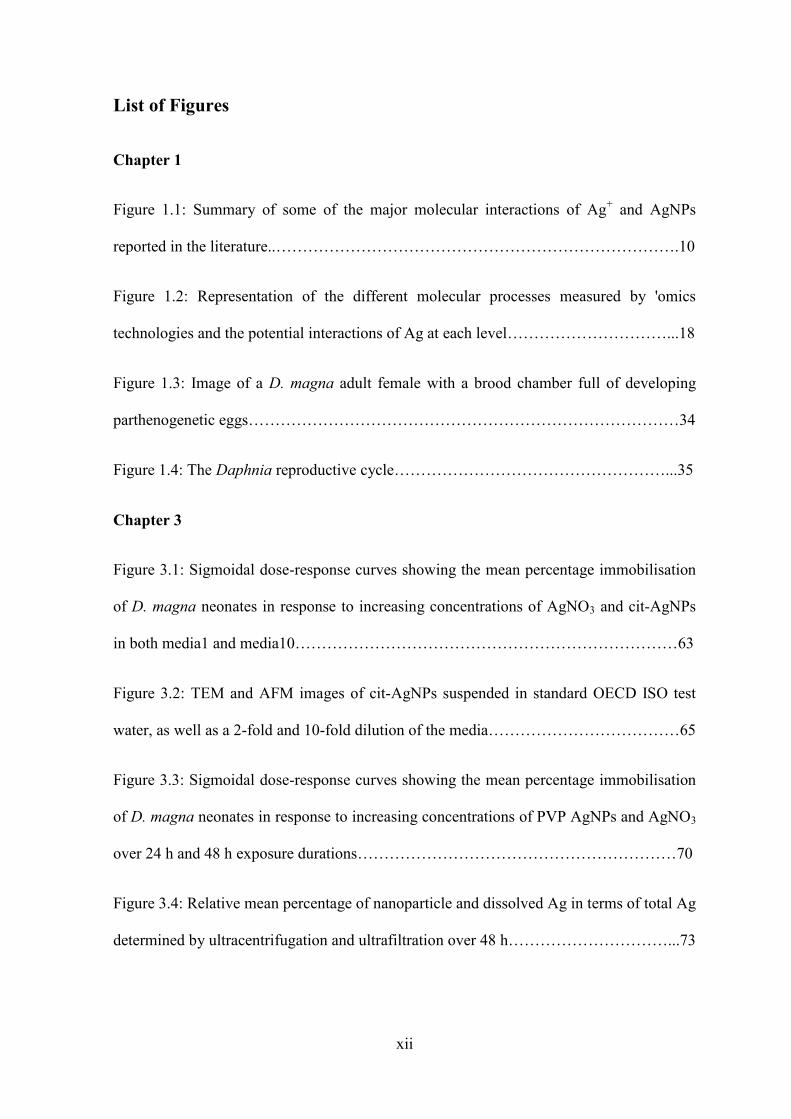
Figure 1.1: Summary of some of the major molecular interactions of Ag+ and AgNPs
reported in the literature..………………………………………………………………….10
Figure 1.2: Representation of the different molecular processes measured by 'omics
technologies and the potential interactions of Ag at each level…………………………...18
Figure 1.3: Image of a D. magna adult female with a brood chamber full of developing
parthenogenetic eggs………………………………………………………………………34
Figure 1.4: The Daphnia reproductive cycle……………………………………………...35
Chapter 3
Figure 3.1: Sigmoidal dose-response curves showing the mean percentage immobilisation
of D. magna neonates in response to increasing concentrations of AgNO3 and cit-AgNPs
in both media1 and media10………………………………………………………………63
Figure 3.2: TEM and AFM images of cit-AgNPs suspended in standard OECD ISO test
water, as well as a 2-fold and 10-fold dilution of the media………………………………65
Figure 3.3: Sigmoidal dose-response curves showing the mean percentage immobilisation
of D. magna neonates in response to increasing concentrations of PVP AgNPs and AgNO3
over 24 h and 48 h exposure durations……………………………………………………70
Figure 3.4: Relative mean percentage of nanoparticle and dissolved Ag in terms of total Ag
determined by ultracentrifugation and ultrafiltration over 48 h…………………………...73
xiii
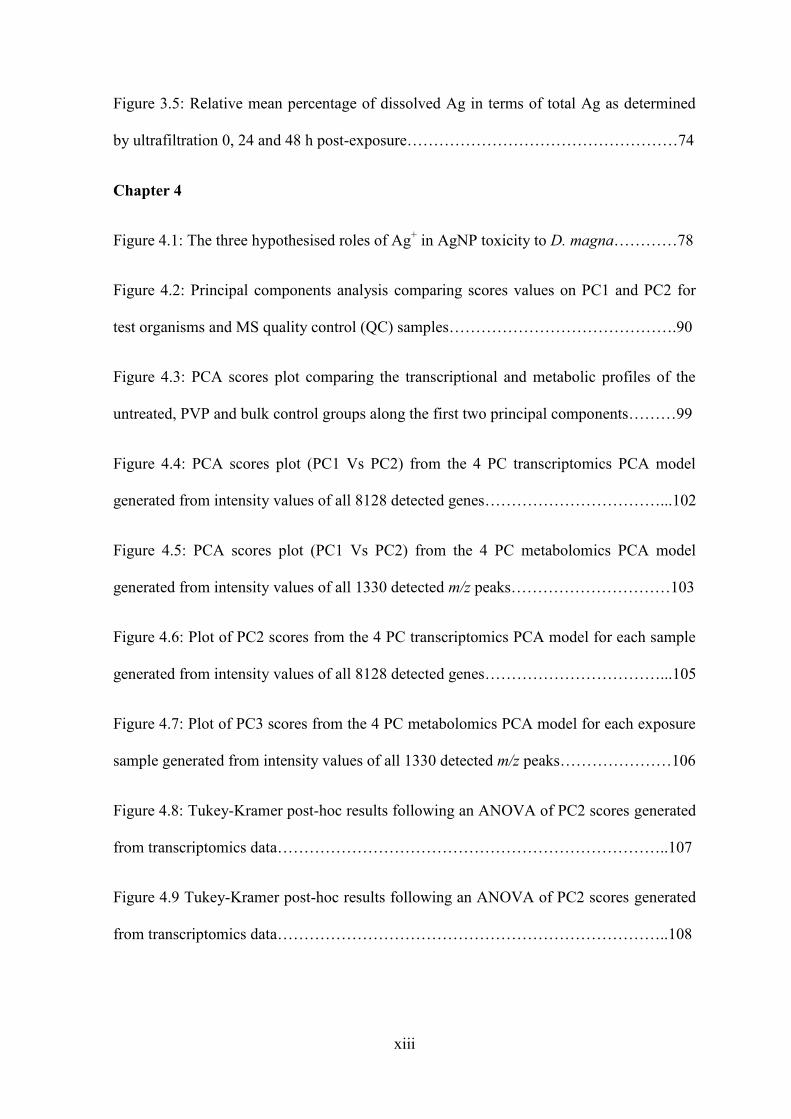
Figure 3.5: Relative mean percentage of dissolved Ag in terms of total Ag as determined
by ultrafiltration 0, 24 and 48 h post-exposure……………………………………………74
Chapter 4
Figure 4.1: The three hypothesised roles of Ag+ in AgNP toxicity to D. magna…………78
Figure 4.2: Principal components analysis comparing scores values on PC1 and PC2 for
test organisms and MS quality control (QC) samples…………………………………….90
Figure 4.3: PCA scores plot comparing the transcriptional and metabolic profiles of the
untreated, PVP and bulk control groups along the first two principal components………99
Figure 4.4: PCA scores plot (PC1 Vs PC2) from the 4 PC transcriptomics PCA model
generated from intensity values of all 8128 detected genes……………………………...102
Figure 4.5: PCA scores plot (PC1 Vs PC2) from the 4 PC metabolomics PCA model
generated from intensity values of all 1330 detected m/z peaks…………………………103
Figure 4.6: Plot of PC2 scores from the 4 PC transcriptomics PCA model for each sample
generated from intensity values of all 8128 detected genes……………………………...105
Figure 4.7: Plot of PC3 scores from the 4 PC metabolomics PCA model for each exposure
sample generated from intensity values of all 1330 detected m/z peaks…………………106
Figure 4.8: Tukey-Kramer post-hoc results following an ANOVA of PC2 scores generated
from transcriptomics data………………………………………………………………..107
Figure 4.9 Tukey-Kramer post-hoc results following an ANOVA of PC2 scores generated
from transcriptomics data………………………………………………………………..108

xiv
Figure 4.10: PCA scores plots of models generated from significantly changing gene-spots
(A) or m/z peaks (B) only…………………………………………………………….......110
Figure 4.11: Comparison of the relationship between body burden of Ag following AgNP
and AgNO3 exposure, and the total Ag concentration of the exposure media…………...114
Figure 4.12: Comparison of body burden of Ag following exposure to Low and High
concentrations of AgNO3 and AgNPs……………………………………………………116
Figure 4.13: The depuration of absorbed AgNPs and dissolved Ag from exposed D. magna
over a 96 h period………………………………………………………………………..119
Chapter 5
Figure 5.1: Map of the key interactions between significantly changing putative
metabolites and gene-products in the purine metabolism pathway……………………...146
Figure 5.2: Fold changes of the peaks corresponding to the putative IDs of inosine,
guanosine, cAMP and adenosine/deoxyguanosine relative to the combined control in
response to varying concentrations of AgNP and dissolved Ag…………………………147
Figure 5.3: Fold changes of microarray gene spots for ADSSL1, NT5C2, POLR2G and
PAPSS2 relative to the combined control in response to High and low concentration AgNP
and dissolved Ag exposure………………………………………………………………148
Figure 5.4: The relative fold changes of ADSSL1, NT5C2 and POLR2G expression
following exposure to AgNP, dissolved Ag and control conditions calculated by the Pfaffl
method…………………………………………………………………………………....150
Figure 5.5: The fragmentation pattern of an isolated precursor ion at 267.07334 m/z…..152
Figure 5.6: The fragmentation pattern of an isolated precursor ion at 282.08422 m/z…..153

xv
Chapter 6
Figure 6.1: Characterisation of particles within control, AgNO3 and AgNP exposure media by
DLS……………………………………………………………………………………….171
Figure 6.2: Relative gene expression of glutathione-S-transferase (GST), metallothionein (MT)
and heme-oxygenase 1 (HMOX) in D. magna following exposure AgNP and AgNO3...............176
xvi
List of Tables
Chapter 1
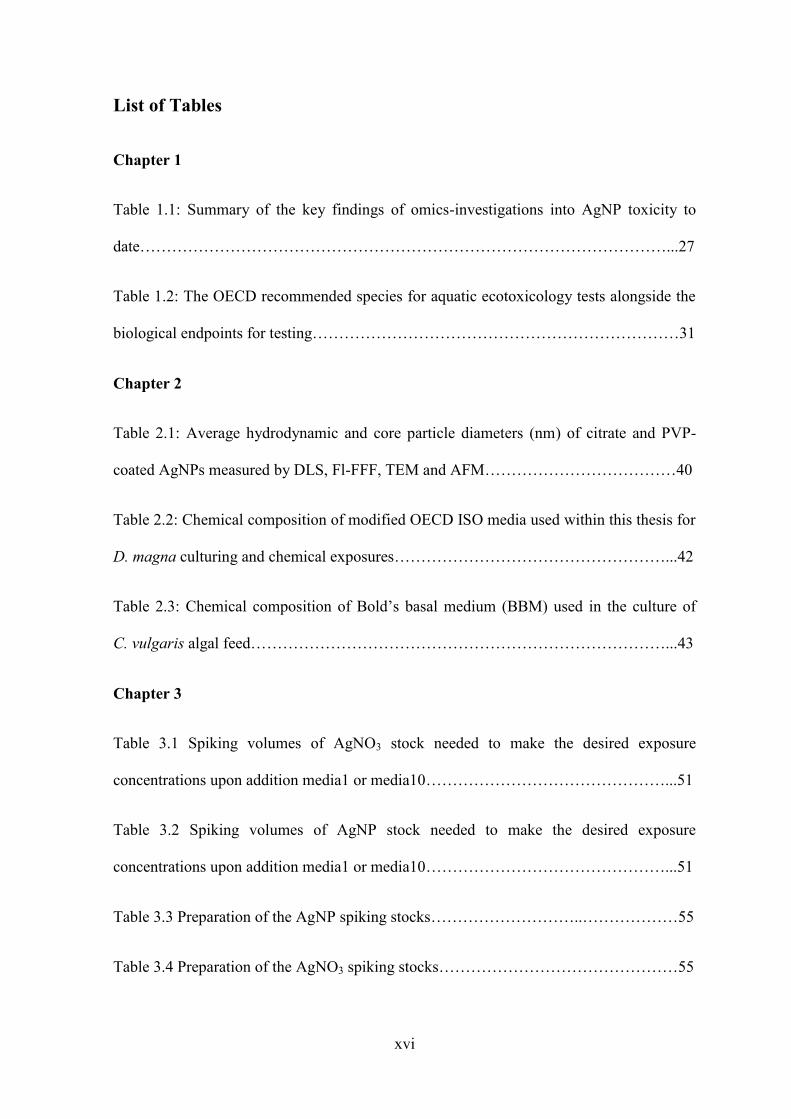
Table 1.1: Summary of the key findings of omics-investigations into AgNP toxicity to
date………………………………………………………………………………………...27
Table 1.2: The OECD recommended species for aquatic ecotoxicology tests alongside the
biological endpoints for testing……………………………………………………………31
Chapter 2
Table 2.1: Average hydrodynamic and core particle diameters (nm) of citrate and PVP-
coated AgNPs measured by DLS, Fl-FFF, TEM and AFM………………………………40
Table 2.2: Chemical composition of modified OECD ISO media used within this thesis for
D. magna culturing and chemical exposures……………………………………………...42
Table 2.3: Chemical composition of Bold’s basal medium (BBM) used in the culture of
C. vulgaris algal feed……………………………………………………………………...43
Chapter 3
Table 3.1 Spiking volumes of AgNO3 stock needed to make the desired exposure
concentrations upon addition media1 or media10………………………………………...51
Table 3.2 Spiking volumes of AgNP stock needed to make the desired exposure
concentrations upon addition media1 or media10………………………………………...51
Table 3.3 Preparation of the AgNP spiking stocks………………………..………………55
Table 3.4 Preparation of the AgNO3 spiking stocks………………………………………55
xvii
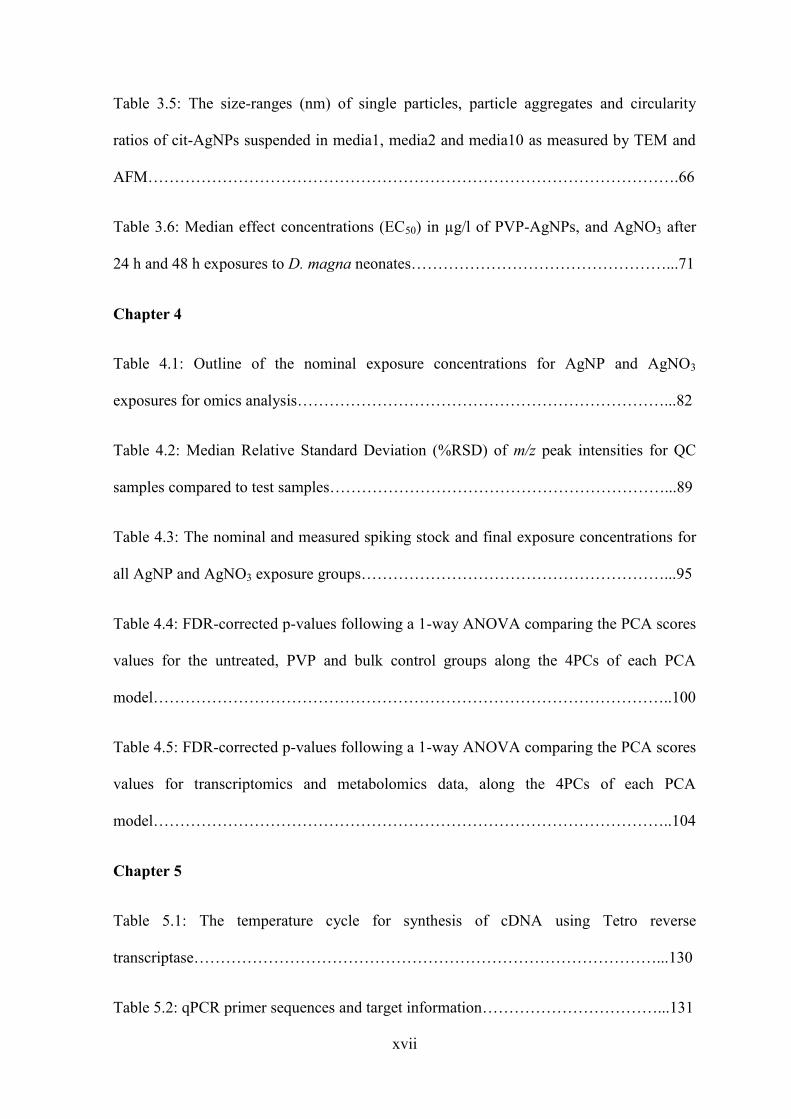
Table 3.5: The size-ranges (nm) of single particles, particle aggregates and circularity
ratios of cit-AgNPs suspended in media1, media2 and media10 as measured by TEM and
AFM……………………………………………………………………………………….66
Table 3.6: Median effect concentrations (EC50) in µg/l of PVP-AgNPs, and AgNO3 after
24 h and 48 h exposures to D. magna neonates…………………………………………...71
Chapter 4
Table 4.1: Outline of the nominal exposure concentrations for AgNP and AgNO3
exposures for omics analysis……………………………………………………………...82
Table 4.2: Median Relative Standard Deviation (%RSD) of m/z peak intensities for QC
samples compared to test samples………………………………………………………...89
Table 4.3: The nominal and measured spiking stock and final exposure concentrations for
all AgNP and AgNO3 exposure groups…………………………………………………...95
Table 4.4: FDR-corrected p-values following a 1-way ANOVA comparing the PCA scores
values for the untreated, PVP and bulk control groups along the 4PCs of each PCA
model……………………………………………………………………………………..100
Table 4.5: FDR-corrected p-values following a 1-way ANOVA comparing the PCA scores
values for transcriptomics and metabolomics data, along the 4PCs of each PCA
model……………………………………………………………………………………..104
Chapter 5
Table 5.1: The temperature cycle for synthesis of cDNA using Tetro reverse
transcriptase……………………………………………………………………………...130
Table 5.2: qPCR primer sequences and target information……………………………...131

xviii
Table 5.3: Primer validation temperature cycle using BIOTAQ polymerase……………131
Table 5.4: RT-qPCR temperature cycle………………………………………………….133
Table 5.5: Pathways of interest following over-representation analysis of the
transcriptomics dataset via DAVID……………………………………………………...138
Table 5.6: Pathways of interest following over-representation analysis of the metabolomics
dataset via MetaboAnalyst……………………………………………………………….139
Table 5.7: Pathways of interest following over-representation analysis………………...142
Table 5.8: Putative identities of significantly changing metabolites and gene-products in
the purine metabolism pathway………………………………………………………….143
Chapter 6
Table 6.1: The intended concentration of total silver within the spiking stocks and
exposure vessels (µg/l)…………………………………………………………………...162
Table 6.2: The temperature cycle for synthesis of cDNA using Tetro reverse
transcriptase……………………………………………………………………………...166
Table 6.3: RT-qPCR primer sequences and target information………………………………167
Table 6.4: RT-qPCR temperature cycle…………………………………………………………168
Table 6.5: The average measured concentrations of total Ag within AgNP exposure media with
standard deviation for each group compared to the intended nominal concentrations…………...172
Chapter 9 (Appendix)
Table 9.1 Mean total Ag concentrations ± SD following separation of AgNP suspensions
into the dissolved and nanoparticle fractions by ultracentrifugation……………………222
xix
Table 9.2: Mean total Ag concentrations ± SD following separation of AgNP suspensions
into the dissolved and nanoparticle fractions by ultrafiltration.…………………………222
Table 9.3: List of m/z values and putative annotation used for calibration of D. magna
polar MS spectra in negative ion mode reported in Chapter 4…………...……………...223
Table 9.4: Number of mortalities occurring in each treatment group over the 24 h exposure
period prior to transcriptomics and metabolomic analyses in Chapter 4………………...224
Table 9.5: Number of mortalities occurring in each treatment group over the 24 h exposure
period prior to RTt-qPCR analysis in Chapter 6…………………………………………225
Table 9.6: List of significantly changing gene-spots with putative human analogue
Ensembl gene IDs reported in Chapter 5.………………………………………………..226
Table 9.7: List of significantly changing m/z peaks and their putative empirical formulae
and KEGG names reported in Chapter 5......…………………………………………….241
xx
Abbreviations
AgNPs Silver nanoparticles
BSI British standards institution
ISO International organization for standardization
SCHENIR Scientific committee on emerging and newly identified health risks
EC European commission
REACH Registration, evaluation, authorisation and restriction of chemicals
Ag+ Silver ion
ROS Reactive oxygen species
OECD The organisation for economic co-operation and development
MoA Mode of action
RNA Ribonucleic acid
rRNA Ribosomal ribonucleic acid
mRNA Messenger ribonucleic acid
tRNA Transfer ribonucleic acid
NMR Nuclear magnetic resonance
MS Mass spectrometry
m/z Mass to charge ratio
DIMS Direct infusion mass spectrometry
GC-MS Gas chromatography mass spectrometry
LC-MS Liquid chromatography mass spectrometry
FT-ICR Fourier transform ion cyclotron resonance
LTQ Linear trap quadropole
nESI Nano electrospray ionisation
PCA Principal Component’s analysis
PC Principal Component
MS/MS Tandem mass spectrometry
SPS Single peak search
MI-Pack Metabolite identification package
xxi
TM Transformation mapping
KEGG Kyoto encyclopaedia of genes and genomes
FDR False discovery rate
ORA Over representation analysis
FCSA Functional class scoring analysis
PTA Pathway topology analysis
PAK Serine/threonine-protein kinase
MAPK Mitogen-activated protein kinases
PP2A Protein phosphatase 2A
DLVO Derjaguin, Landau, Verwey, and Overbeek theory
VDW Van der Waals
Cit-AgNPs Citrate stabilised silver nanoparticles
PVP-AgNPs Polyvinylpyrrolidone stabilised silver nanoparticles
UF Ultrafiltration
UC Ultracentrifugation
FlFFF Flow field flow fractionation
DLS Dynamic light scattering
TEM Transmission electron microscopy
AFM Atomic force microscopy
BBM Bold’s basal medium
SEM Standard error of the mean
HPLC High-performance liquid chromatography
QC Quality control
PCR Polymerase chain reaction
SIM Selective ion monitoring
PQN Probable quotient normalisation
KNN K nearest neighbour
ANOVA Analysis of variance
EC50 Median effective concentration
xxii
ICP-MS Inductively coupled plasma mass spectrometry
SIMS Secondary ion mass spectrometry
DAVID Database for annotation visualisation and integrated discovery
IMPaLA Integrated molecular pathway level analyses
RT-qPCR Reverse transcriptase quantitative polymerase chain reaction
BBID Biological biochemical image database
EHMN Edinburgh human metabolic network
cAMP Cyclic adenosine monophosphate
ADSSL1 Adenylosuccinate synthetase like 1
POLR2G Polymerase (RNA) II (DNA directed) polypeptide G
NT5C2 5’-nucleotidase, cytosolic II
PAPSS2 3’-phosphoadenosine 5’-phosphosulfate synthase 2
AMP adenosine monophosphate
dGMP deoxyguanosine monophosphate
NIBB National institute for basic biology
SOD Super oxide dismutase
GSH Glutathione
GSSG Glutathione disulfide
GST Glutathone-S-transferase
HMOX Heme oxygenase 1
MicroPIXE Microscopic proton-induced X-ray emission
1
Chapter 1: General Introduction
1.1 Nanotechnologies and the emergence of Nanotoxicology
Nanotechnology has become of huge interest, both industrially and politically, over the
past decade and has amassed billions of dollars in investment (Wardak et al., 2007). This
has led to a wide range of available nanomaterials and an equally wide range of
applications that make use of their unique size-related properties. For example, the use of
TiO2 nanoparticles as UV filters in sunscreens (Johnson et al., 2011) and as photocatalytic
degrading agents in self-cleaning windows (Parkin and Palgrave, 2005), carbon nanotubes
as high tensile strength fibres, cerium dioxide nanoparticles as a diesel fuel additive and
constituent of catalytic converters (Bekyarova et al., 1998), and an increasing number of
products which benefit from the antimicrobial properties of silver nanoparticles (AgNPs)
(Chaloupka et al., 2010). This is just a handful of examples of the products known to
contain nanomaterials; 1827 products are currently listed on the nanotechnology consumer
product inventory (http://www.nanotechproject.org/cpi/) (Vance et al., 2015) and that
number is certain to rise.
Despite an increasing body of literature in nanotechnology and nanotoxicology, there is
still, as of yet, no single internationally agreed definition of a nanomaterial with individual
organisations each providing their own interpretation of a definition. These definitions
have gradually expanded and developed over time. Early definitions of nanomaterials
were based principally on size parameters alone (Kreyling et al., 2010), for example, the
British Standards Institution (BSI) (British Standards Institution, 2007) and the
International Organisation for Standardisation (ISO) (ISO, 2010) define nanomaterials
simply as materials with one or more external dimensions in the nanoscale (British
Standards Institution, 2007). The ISO also includes materials with internal structures or

2
surface structures within the nanoscale (ISO, 2010). Both of these institutions define the
nanoscale as a size range from approximately 1 nm to 100 nm (British Standards
Institution 2007; ISO, 2010), a definition which was first held by the Scientific Committee
on Emerging and Newly Identified Health Risks (SCENIHR). To put things in
perspective, the smallest particles in this scale would be of similar size to a molecule of
glucose, whereas the largest molecules would be of similar size to coated vesicles and
some virus molecules. In practice however, this range is arbitrary and there is no scientific
evidence to date that clearly defines a size cut-off where the characteristic effects of
nanomaterials begin to appear (Bleeker et al., 2013; Horbach et al., 2014).
These simplistic definitions of nanomaterials have since been deemed inadequate by some
institutions. Recent recommendations given by both SCENIHR (2010) and the EC (2011),
include the number size distribution of the material as an additional tool to aid
classification. The number size distribution represents the number of particles within a
given size range, and is used to account for the poly-disperse nature of nanomaterials.
SCENIHR recommends that if greater than 0.15 % of a material contains dimensions
within the nanoscale, then it may be classified as a nanomaterial (SCENIHR, 2010). The
EU definition published in 2011 (EU, 2011) recommends that this threshold be increased
to 50 %. Particle aggregates and agglomerates are often not considered as nanomaterials,
however the EU recommended definition recognises that agglomerates and aggregates
may exhibit the same properties as disperse particles and therefore includes them if
constituent particles are in the nanoscale.
The necessity for a definition arises from the growing recognition that some nanomaterials
may be hazardous to human and environmental health (Bleeker et al., 2013). As such a
definition will be necessary should legislation be required for their regulation. It has been
found that nanomaterials often display physical and chemical properties which can be
3
substantially different from those of their bulk counterparts. These unique properties are
thought to arise from the increased available surface area that a given mass of
nanoparticles has when compared to the same mass of bulk-scale particles. Currently,
there is no specific legislation surrounding the regulation of nanomaterials. The main
concern regarding this lack of regulation is that as well as beneficial effects, the nanoscale
could also bestow a “nanostructure-dependant biological activity” (Oberdörster et al.,
2005b), which could result in the amplification of any inherent toxic properties that are
otherwise unseen in the substance at larger scales. There is also concern surrounding the
potential of particles at the lower end of the scale being able to cross biological membranes
with relative ease. This property has been shown in multiple particle types (Geiser et al.,
2005; Ryman-Rasmussen et al., 2009; Bhabra et al., 2009), and in some cases has been
used to our benefit in the areas of nanomedicine and drug delivery (Roy and Vij, 2010;
Couvreur, 2013).
Although engineered nanomaterials are relatively new, the idea that a substance can
become toxic simply by being at a reduced scale is not; particle toxicology is a well-
established discipline, and it is two paradigms of this science, quartz and asbestos, that
formed the basis of research into nanomaterial toxicity (Seaton et al., 2010). In their larger
crystalline forms, these two substances are inert, however, if inhaled in powder form these
two substances become toxic, with asbestos responsible for over 4,000 deaths in the UK in
2011 alone (http://www.hse.gov.uk/statistics/causdis/asbestos.htm). They also serve as a
reminder that in the advancement of technology, thorough assessment of potential risks
and hazards that any new technology may present should not be forfeit (Seaton et al.,
2010). The discipline of nanotoxicology was therefore created to investigate the potential
threats that widespread use of nanoparticles may present to humans and the wider
4
environment (Donaldson et al., 2004) with the aim of better risk assessment and regulation
for nanomaterials.
1.2 Silver nanoparticles: The most commercially prominent nanomaterial
AgNPs have become one of the most commercially available varieties of nanomaterial due
to their ease of manufacture and potent antimicrobial properties. They are found in a
growing list of medical (Chen and Schluesener, 2008; Rai et al., 2009; Chaloupka et al.,
2010) and consumer-based (Chaudhry et al., 2008) products with 442 products currently
listed as containing AgNPs on the nanotechnology consumer product inventory
(http://www.nanotechproject.org/cpi/) (Vance et al., 2015). Products containing silver salts
(such as silver nitrate) have been recognised for their medicinal properties since ancient
times and until the widespread use of antibiotics in the 1940s, were the antiseptic treatment
of choice for burns and open wounds. AgNPs are a much more recent addition though
arguably have been used as antimicrobial agents in the form of colloidal silver for over 100
years (Nowack et al., 2011). In the past decade the use of AgNPs has increased
dramatically, partially in response to increasing numbers of antibiotic-resistant strains of
bacteria (Rai et al., 2012). As well as being potent bactericides (reviewed in Rai et al.,
2012 and Mijnendonckx et al., 2013), they have shown anti-fungal (Chladek et al., 2011)
as well as anti-viral properties (Rogers et al., 2008; De Gusseme et al., 2011). As a direct
consequence of their growing use there is an increased likelihood of AgNPs entering the
aquatic environment. Prior to the development and use of AgNPs, the primary source of
Ag contamination was from the photographic industry, as well as from mining and
leaching from natural sources (Purcell and Peters, 1998). The environmental
concentrations of Ag in natural waters have been measured in the ng/L range (Luoma,
2008; Gottschalk et al., 2013). The points of AgNP environmental contamination are most
likely during synthesis, during the incorporation of AgNPs into products and through the
5
use and disposal of these products (Fabrega et al., 2011). Experimental evidence has
identified their release from the washing of commercially available sock fabrics into waste
water (Benn and Westerhoff, 2008; Geranio et al., 2009), as well as from outdoor facades
coated in nano-silver paints in rainwater runoff (Kaegi et al., 2010). Despite evidence of
their release, there is a lack of experimental data on the exact environmental
concentrations due to a lack of analytical methods available for quantification of trace
concentrations of nanoparticles (Mueller and Nowack, 2008). This has subsequently led to
a number of modelling studies in an attempt to predict environmental conditions from
limited measurements or effluent data (reviewed in Gottshalk et al., 2013).
These studies suggest that freshwater ecosystems are likely to act as terminal sinks for
AgNP products, which raises concerns for the potential effects that these products may
have on organisms within these ecosystems. Although the toxicity of AgNPs to aquatic
organisms is not fully understood, dissolved Ag is a well-known, highly potent aquatic
toxicant. If we use this prior knowledge as a baseline for our assessment of AgNPs, then
obtaining a detailed understanding of the exact risks posed by AgNPs to the environment
should become a priority.
1.2.1 The toxicity of dissolved silver
The toxicity of a substance is ultimately determined by the level of exposure an organism
has to that particular toxicant and the amount that is available for internalisation over time.
The availability of metals in the aqueous environment is primarily dependant on their
speciation – the distribution of a metal between its ionic or ligand-bound forms (Luoma,
2008). As a rule of thumb, it is usually the free metal ion which is the most toxic form,
with reductions in toxicity observed for ion-complexes with dissolved organic matter and
inorganic cations. For example, the free ion form of silver (Ag+) is easily adsorbed into an
organism’s cells through ion transport proteins which normally transport the essential ions
6
sodium (Na+) and copper (transported as Cu1+) (Bury and Wood, 1999; Fabrega et al.,
2011).
It is the relative ease with which Ag+ are internalised into the cells of organisms which
results in their high toxicity. If the uptake of these ions is prevented, then their
bioavailability and hence their toxicity is reduced. The free Ag+ ion can form strong
complexes with organic and inorganic ligands such as the chloride anion (Cl-) and
sulfhydryl groups (-SH), which can either be free in solution or incorporated within
dissolved organic materials (Adams and Kramer, 1998; Luoma, 2008). In environments
where these ligands are present in greater concentrations than Ag+, it is possible for all
silver to complex with these materials and precipitate out of solution, rendering them non-
toxic and unavailable for uptake by organisms (Leblanc et al., 1984; Erikson et al., 1997;
Bianchini and Wood, 2008). In these instances silver cannot enter cells through ion-
transport proteins leaving them less available for adsorption than the free ionic form.
However it is still possible for these forms of silver to enter an organism’s cells by
alternative pathways such as endocytosis. As a consequence of this decreased
bioavailability, complexed silver ions are less toxic than their free counterparts (Bianchini
and Wood, 2008).
Following internalisation, Ag+ ions are free to induce toxicity through interaction with
cellular components (Figure 1.1) such as -SH groups of cysteine residues (Liau et al.,
1997; Jung et al., 2008). These residues are often important in maintaining conformation
of cytosolic or membrane-associated proteins; interaction of silver with these groups leads
to the production of strong S-Ag bonds which prevent disulphide bond formation. This
ultimately results in the disruption of protein structure and loss of function (Ratte, 1999;
Luoma, 2008).

7
This protein-function disruption through interaction with sulfhydryl groups has long been
associated with the primary antibacterial mechanism of Ag+ (Yudkin, 1937; Chambers et
al., 1962; Russell and Hugo, 1994), namely the interruption of the bacterial respiratory
chain by proton-pump inhibition which has been observed in Escherichia coli and
Staphylococcus aureus (Bragg et al., 1974; Jung et al., 2008; Mijnendonckx et al., 2013).
This impairment has been shown to induce the generation of the superoxide radical (O2-) in
both organisms (Park et al., 2009) leading to cell death. A similar mechanism has been
observed in rat liver mitochondria; Ag has been shown to induce the permeability of the
inner mitochondrial membrane through disruption and opening of the permeability
transition pore (Almofti et al., 2003). This was shown to result in a loss of proton potential
(the driving force of oxidative phosphorylation) and the release of cytochrome c; an
apoptosis-inducing factor (Almofti et al., 2003). The authors summarised that Ag induced
the opening of this pore through interaction with sulfhydryl groups within its structure
(Almofti et al., 2003).
The primary mechanism of acute, aquatic Ag+ toxicity is well established in rainbow trout
(Oncorhynchus mykiss) (for reviews see (Hogstrand and Wood, 1998; Wood, 1999); near-
total reduction of the active transport of Na+ and Cl- at the gill. This reduction was shown
to occur primarily through the inhibition of Na+/K+-ATPase activity in the basolateral
membrane of the gill epithelium following absorption into the cell (Morgan et al., 1997).
This occurs through a direct interaction of Ag with cytoplasmic side of this enzyme,
specifically a competitive inhibition of the Mg2+ binding site, preventing the binding and
hydrolysis of ATP (Ferguson et al., 1996). This inhibition reduces the transport capacity
of this enzyme, leading to a net loss of Na+ and Cl- from blood plasma. This results in an
osmotic imbalance between the plasma and surrounding tissues, causing a net shift of
water from the blood to the intracellular compartment. Death is finally thought to occur
8
from circulatory failure induced by low blood volume and high blood viscosity (Hogstrand
and Wood, 1998; Wood, 1999; Bianchini and Wood, 2003). This is also thought to be the
primary mechanism of Ag toxicity in D. magna; exposure to Ag in the form of AgNO3
induced a reduction of whole-body Na concentration as well as a rapid inhibition of
Na+/K+-ATPase activity (Bianchini and Wood, 2003).
Ag is also known to induce the formation of reactive oxygen species (ROS). This has been
observed in E. coli, S. aureus (Park et al., 2009), and human skin fibroblasts (Cortese-
Krott et al., 2009) in response to AgNO3 exposure. Ag is thought to induce ROS formation
by two mechanisms; either through the disruption of the respiratory chain via interaction
with thiol groups of mitochondrial proteins (Mijnendonckx et al., 2013), or through the
catalysis of the production of superoxide radicals, hydroxyl radicals and hydrogen
peroxide from O2. If the production of ROS becomes excessive, cellular anti-oxidant
systems can become overwhelmed resulting in a state of oxidative stress (Finkel and
Holbrook, 2000). Common consequences of oxidative stress include damage to DNA, the
oxidation of polyunsaturated fatty acids in lipids (lipid peroxidation) and oxidation of
amino acids in cellular proteins. This can result in genotoxicity and mutations, as well as
membrane and enzyme dysfunction potentially leading to cytotoxicity and cell death. Ag+
has also been observed to complex directly with DNA and RNA molecules, specifically at
the N7 site of the purine bases guanine and adenine (Arakawa et al., 2001) which has been
shown to interrupt DNA replication leading to mutagenesis and genotoxicity.
The reason that metallic silver is essentially non-toxic to humans and other mammalian
species is removal of Ag occurs much more proficiently than in aquatic organisms
(Fabrega et al., 2011). Protection against, and sequestration of, Ag occurs either through
precipitation with chloride, sulfide or phosphate ions within the cytoplasm, or through
binding with antioxidants (such as cysteine and glutathione), or with sulfhydryl-rich metal-
9
specific binding proteins like the metallothionein family of proteins (Ferguson et al.,
1996). Precipitated forms of silver (chloride, sulfide and phosphate complexes) are
deposited outside cells in connective tissue, whereas silver sequestered by antioxidants and
proteins aggregate together and are encased by lysosomes. These methods of Ag
sequestration have been hinted to occur in aquatic organisms, but do not do so with the
efficiency of some other organisms. A summary of the cellular mechanisms of toxicity of
dissolved Ag and also AgNPs, is depicted in Figure 1.1.
10
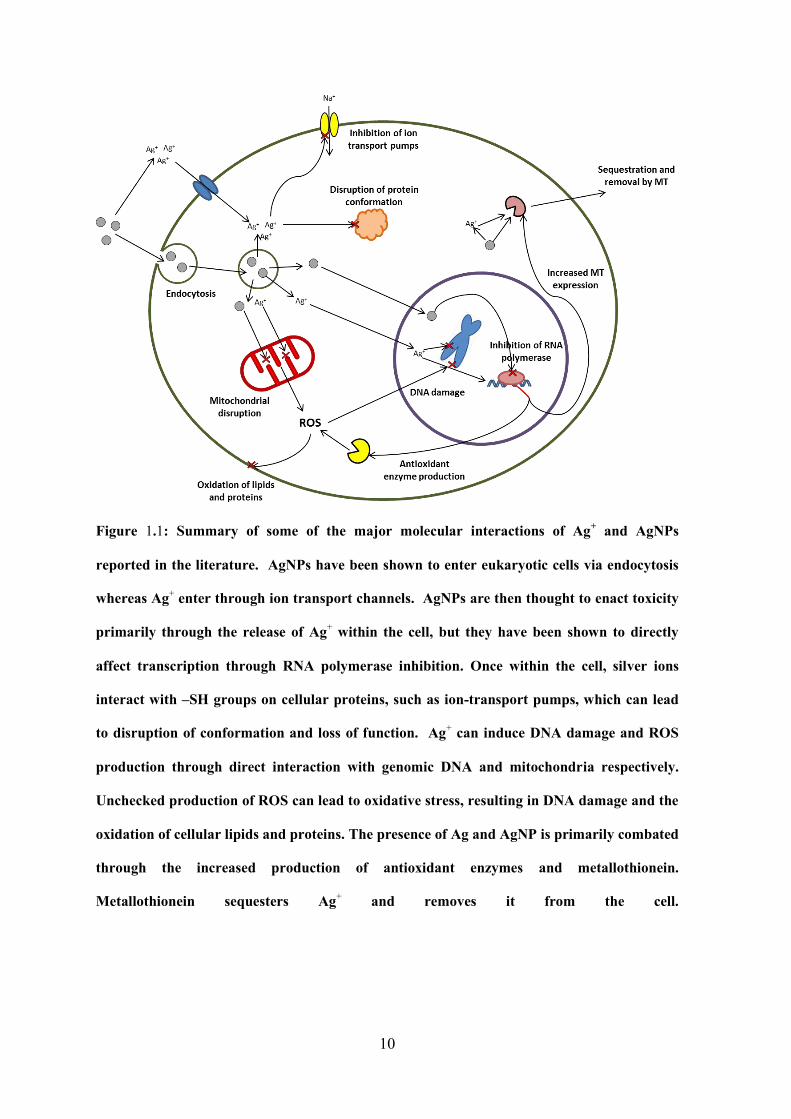
Figure 1.1: Summary of some of the major molecular interactions of Ag+ and AgNPs
reported in the literature. AgNPs have been shown to enter eukaryotic cells via endocytosis
whereas Ag+ enter through ion transport channels. AgNPs are then thought to enact toxicity
primarily through the release of Ag+ within the cell, but they have been shown to directly
affect transcription through RNA polymerase inhibition. Once within the cell, silver ions
interact with –SH groups on cellular proteins, such as ion-transport pumps, which can lead
to disruption of conformation and loss of function. Ag+ can induce DNA damage and ROS
production through direct interaction with genomic DNA and mitochondria respectively.
Unchecked production of ROS can lead to oxidative stress, resulting in DNA damage and the
oxidation of cellular lipids and proteins. The presence of Ag and AgNP is primarily combated
through the increased production of antioxidant enzymes and metallothionein.
Metallothionein sequesters Ag+ and removes it from the cell.
11
1.2.2 The molecular toxicity of silver nanoparticles
The efficiency with which a metal can exert toxicity depends on its bioavailability; how
readily it can be internalised within the cells of an organism. Metal bioavailability is itself
dependent upon speciation, with the free ion form of a metal typically being the most toxic
due to their mimicry of major essential ions such as Na+ and subsequent uptake via ion-
transport pumps (Bury and Wood, 1999). These methods of uptake are rapid, and are
unavailable to the larger, nanoparticle forms of metals thus reducing the rate at which they
are internalised by cells and organisms. Metallic nanoparticles are therefore less
bioavailable than their free ion counterparts, an observation which is reflected in the
reported LC50 and EC50 data. A recent review has compared terrestrial and aquatic
ecotoxicity data for three metal and metal oxide nanoparticles; silver, zinc oxide and
copper oxide (Notter et al., 2014). Through calculation of a ratio comparing nanomaterial
and metal LC50, LD50 and EC50 data, it was determined that in almost all cases the
nanoparticle forms of these compounds were less toxic than their ionic counterparts
(Notter et al., 2014). Although the authors themselves did not provide an explanation for
this observation, it is possible that this is the result of reduced availability for the
nanoparticle form of the metal in question.
It is unlikely that metallic nanoparticles cross cellular membranes via the same mechanism
as metal ions, however a large variety of nanomaterials have been shown to be taken into
cells by endocytosis (Zhao et al., 2011). Using selective inhibitors of the different
endocytotic pathways, it was determined that AgNPs are adsorbed primarily by both
clathrin-mediated endocytosis and macropinocytosis in human lung fibroblasts and
glioblastoma cells (Asharani et al., 2009), as well as in human mesenchymal stem cells
(Greulich et al., 2011). Endocytosis was also confirmed as the primary mechanism of
AgNP transport in the ragworm, Nereis diversicolor, using Transmission Electron
12
Microscopy (TEM) and Energy Dispersive X-ray analysis, but the exact form of
endocytosis was not detailed in this study (García-Alonso et al., 2011). AgNPs have been
identified as being localised to the lysosomes of mouse macrophage cells using confocal
laser microscopy following a 24 h exposure to 10 µg/ml of AgNPs with a 20 nm core
diameter (Arai et al., 2015). This observation has also been made using fluorescence
microscopy in human mesenchymal stem cells; AgNPs were found to co-localise to endo-
lysosomes after a 24 h exposure to AgNPs (Greulich et al., 2011). Lysosomes are an
endpoint of endocytosis; they are specifically designed for the degradation of foreign
material. The detection of AgNPs within these structures was considered by the authors of
both papers to be evidence of uptake via endocytosis. Nanoparticles of other forms have
been reported to escape these structures should the internal concentration of particles
become high enough (Nam et al., 2009). A summary of the cellular interactions of AgNP
is depicted in Figure 1.1.
Investigations into the molecular mechanisms of AgNP toxicity are mostly inconclusive
but one thing which is frequently investigated is the potential indirect induction of toxicity
through the release of the free silver ion, Ag+.
1.2.3 The potential role of dissolved Ag+ in AgNP toxicity
Several studies have suggested that toxicity induced by AgNPs can be fully accounted for
by the Ag+ fraction of AgNP dispersions (Kennedy et al., 2010; Zhao and Wang, 2011;
Newton et al., 2013). Kennedy et al. (2010) assessed the acute toxicity of AgNPs to
P. subcapitata D. magna, and P. promelas. They discovered that when expressed in terms
of “fractionated nanosilver” (their terminology for the free silver ion) and/or <4nm
particles), the LC50 values of AgNPs were comparable to those of AgNO3 within 95%
confidence intervals (Kennedy et al., 2010). A separate study by Newton et al. in 2013
characterised the dose-response relationship of AgNO3 and AgNPs with three different
13
capping agents to D. magna. When the dissolved Ag content was measured at the 48 h
LC50 values for each of these, they were found to be similar for all nanoparticles and
AgNO3. This led the authors to conclude that toxicity of AgNPs was a function of
dissolved silver released by AgNP dissolution.
Chelating agents have been used frequently alongside AgNP exposures in order to
sequester dissolved Ag ions and test their role in toxicity (Zhao and Wang, 2011; Kim et
al., 2011; Zhao and Wang, 2013; Groh et al., 2014). The toxicity of AgNO3 and
carbonate-coated AgNPs to zebrafish embryos was shown to be prevented by the addition
of cysteine (Groh et al., 2014). Addition of cysteine was also seen to protect against PVP-
coated AgNP and AgNO3 toxicity to D. magna (Zhao and Wang, 2011) as well as the
disruptive effects of both AgNO3 and AgNPs to Na and Ca regulation in D. magna (Zhao
and Wang, 2013). In each of these studies the authors surmised that the reduction or
removal of toxicity was the direct result of the successful sequestration of dissolved Ag
from all exposures. They followed by concluding that all toxicity observed in these
exposures could be fully accounted for by the dissolved Ag fraction, and that AgNP would
have no independent toxicity.
One shortfall of the work referenced above is that the comparison of the ultimate outcome
of toxicant exposure, namely mortality, gives no information as to the underlying
molecular perturbations which are induced following exposure to AgNPs and AgNO3.
Comparison of these profiles will allow a more detailed assessment of which form is
responsible for toxicity, or if unique mechanisms are induced by either species of Ag.
There has been an increase in the number of robust investigations into the molecular
mechanism of AgNP toxicity in recent years, utilising large combinations of traditional
biochemical techniques (Yang et al., 2012; Stensberg et al., 2013; Wang et al., 2013; Ahn
et al., 2014; De Matteis et al., 2015) or high-throughput omics technologies (Scown et al.,
14
2010; Poynton et al., 2012; Aerle et al., 2013; Rainville et al., 2014; Li et al., 2015a,
2015b) to address the role of Ag+ in AgNP toxicity. A number of these studies have
shown agreement between the molecular responses induced by nanoparticle and ionic Ag
(Scown et al., 2010; Poynton et al., 2012; Aerle et al., 2013; Rainville et al., 2014; Li et al.,
2015a, 2015b). A comparison of the transcriptional changes observed in zebrafish
embryos (Danio rerio) following exposure to 5 µg/L of 10 nm commercial AgNPs, 5 µg/L
of Bulk Ag (600 -1600 nm) and 0.25 µg/L of AgNO3 showed significant over-
representation of mitochondrial disruption pathways across all treatments (Aerle et al.,
2013). This was primarily caused by down-regulation of genes encoding complexes I, II,
III and IV of the oxidative phosphorylation machinery (Aerle et al., 2013). This study
aligns with other work demonstrating the disruption of mitochondrial membrane potential
by AgNPs (Stensberg et al., 2013) and also with a previous study demonstrating
mitochondrial disruption by AgNO3 (Almofti et al., 2003). A 1H NMR-based
metabolomics investigation in D. magna saw similar profiles induced in response to AgNP
and AgNO3 (Li et al., 2015a). This investigation also saw disturbances in energy
metabolism and oxidative stress. Western blot analysis and immunofluorescence showed a
significant increase in expression of the metallothionein family of proteins in human lung
carcinoma and human cervix carcinoma cells exposed to 20 nM AgNPs over 48 h (De
Matteis et al., 2015). The metallothionein family of proteins, as metal-specific, thiol-rich
proteins appear to be a primary response to Ag exposure in many organisms (Ferguson et
al., 1996; Chae et al., 2009; Meyer et al., 2010; García-Alonso et al., 2011; Johari et al.,
2015). This further supports the notion that both nanoparticle and dissolved forms of silver
induce a similar response.
Other studies have proposed that AgNPs may have a particle-specific mechanism, which
may either be the sole cause of toxicity, or may act alongside effects initiated by Ag+
15
release. In 2013, Stensberg and colleagues measured the impact of AgNP and Ag+
exposure to D. magna on Na+ transport and mitochondrial activity – processes known to be
affected by Ag+ (Stensberg et al., 2013). They discovered that AgNPs were not as
effective at disrupting Na+ transportation as their ionic counterparts, but induced greater
H+ efflux from mitochondria. This led the authors to conclude that AgNP and Ag+ have
different mechanisms of toxicity, though they may act in a synergistic mechanism to
produce a greater overall response (Stensberg et al., 2013). The inhibition of RNA
polymerase has been previously observed as an adverse effect induced specifically by the
nanoparticle form of Ag (Wang et al., 2013). Wang and colleagues demonstrated that
exposure of erythroid progenitor cells to 8 µg/l AgNP resulted in >50 % inhibition of RNA
synthesis (Wang et al., 2013). The study also used a pull down assay to demonstrate the
association of AgNPs with Sp6 RNA polymerase.
A transcriptomics investigation by Poynton et al. showed the induction of different gene
expression profiles by AgNP and Ag+ (Poynton et al., 2012). They showed that Ag+
resulted in a down-regulation of developmental processes, whereas AgNPs increased
expression of metallothionein and genes involved in the repair of DNA (Poynton et al.,
2012). A proteomic study by Rainville et al. revealed that both forms of silver induced an
increase of protein-thiol content, but only AgNPs caused an increase of protein carbonyls
(Rainville et al., 2014). The authors suggest that the increase in protein-thiol content is in
response to the presence of Ag+ ions within the organisms; to directly chelate the ions and
decrease their toxicity, or to reduce toxicity by ROS. The increased carbonyl content
induced by AgNPs is thought to be an indication of AgNP-induced oxidative stress. The
authors surmise that signs of different MoAs were discovered suggesting AgNP can induce
toxicity independently of Ag+ (Rainville et al., 2014).
16
From the data discussed above, it seems highly likely that Ag+ play a role in AgNP
toxicity, but there is great uncertainty on whether they are solely responsible. Importantly,
studies taking a mechanistic approach report discrepancies in the mechanisms induced by
the two compounds, which may suggest independent but synergistic MoAs (Poynton et al.,
2012; Stensberg et al., 2013; Rainville et al., 2014). One of the more popular hypotheses
to arise in recent years is the ‘Trojan horse’ hypothesis. It addresses the conflicting
evidence, some of which is discussed above, stating that AgNPs act as a vehicle for Ag+
toxicity. The hypothesis states that AgNPs are taken into an organism, tissue, or cell,
resulting in a concentrated, internalised dissolution of AgNPs resulting in toxicity induced
by the released free Ag+ ion (Moore, 2006; Luoma, 2008; Lubick, 2008). This MoA has
been suggested to occur in a mouse macrophage cell line (Park et al., 2010) and has also
been implied within the digestive tract of D. magna (Zhao and Wang, 2010). The gradual
dissolution of internalised AgNPs has been observed previously using a fluorescent
chemosensor specific for the observation of Ag+ in living cells (RC-1) by confocal
microscopy (De Matteis et al., 2015). Following a 3 h exposure to 0.6 nM of 20 nm
AgNPs, human lung carcinoma cells were observed for 96 h. A significant increase in
fluorescence was observed after 24 h and again 48 h and 96 h after the initial exposure
distributed across the cytoplasm, organelles and nuclei. The authors concluded that this
internal release of Ag+ was a direct result of adsorption of AgNP by the endocytosis
pathway leading to an accumulation of AgNP in the lysosomes. The acidic environment of
these structures was thought to then accelerate the dissolution of the particles, resulting in
toxicity via Ag+ (De Matteis et al., 2015) which is consistent with the Trojan-horse
hypothesis. However it is not evident, from this study, which species of silver is
responsible for toxicity following AgNP absorption, only that dissolution of can occur
17
following internalisation. To better compare the exact role each form of silver plays in
AgNP toxicity, a more detailed comparison of the global molecular response is required.
1.3 Omics-technologies and their application to silver nanotoxicology
The majority of investigations into the molecular mechanism of AgNP toxicity have
primarily centred on the traditional biochemical targets of dissolved Ag toxicity (reviewed
in section 1.2.3). This has potentially led to a narrow perspective on the molecular
perturbations induced by AgNPs, leaving potential novel changes undiscovered. In order
to give greater insight into the entire molecular mechanisms of toxicity an increasing
number of studies, including those investigation AgNP toxicity, are utilising high-
throughput omics technologies. Omics technologies enable us to employ a non-targeted or
hypothesis-forming approach as a platform from which to direct further investigations.
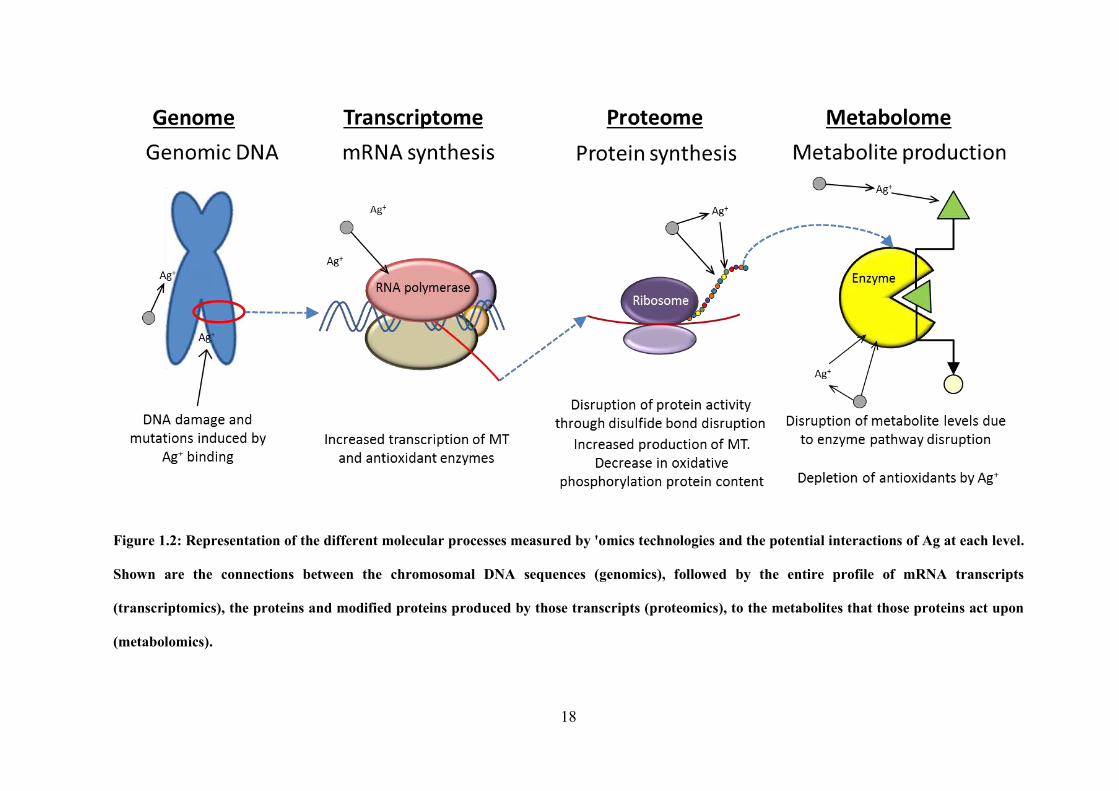
The global molecular perturbations induced by toxicant-exposure can be assessed at the
level of: gene expression (transcriptomics), protein synthesis and modification
(proteomics), and the entire profile of small molecular metabolites (metabolomics)
(Figure 1.2). The use of transcriptomics techniques in tandem with metabolomics for
example, will allow for the mapping of the initial transcriptional changes onto the
phenotypic response of the organism. Through use of these techniques it is possible to
observe the molecular responses that occur as a result of exposure to a particular toxicant,
such as AgNPs (Figure 1.2), and from this one can infer the MoA (Fiehn, 2002; Taylor et
al., 2010; Piña and Barata, 2011).
18
Figure 1.2: Representation of the different molecular processes measured by 'omics technologies and the potential interactions of Ag at each level.
Shown are the connections between the chromosomal DNA sequences (genomics), followed by the entire profile of mRNA transcripts
(transcriptomics), the proteins and modified proteins produced by those transcripts (proteomics), to the metabolites that those proteins act upon
(metabolomics).
19
1.3.1 Analytical platforms for Transcriptomics
Transcriptomics represents one of the most developed and utilised high-throughput ‘omics
approaches, which aims to measure the entire gene transcription profile of an organism or
tissue i.e. the entire complement of ribonucleic acid (RNA) molecules . There are three
major forms of RNA: ribosomal RNA (rRNA), which forms the bulk of the translational
machinery; messenger RNA (mRNA) which is a transcription of the protein-coding
regions of a particular gene, and transfer RNA (tRNA) which provides the physical link
between mRNA and the encoded amino acid sequence during translation. The aim of
transcriptomics is to gain an insight into all genes being expressed at any given time, and it
is the mRNA fraction which contains this information. The expression of certain genes
changes during toxicity, either as a direct or indirect result of exposure (Nuwaysir et al.,
1999). By measuring these changes in comparison with untreated conditions we can begin
to infer which molecular pathways or processes are involved in the toxicant response.
The most commonly utilised transcriptomics technology when applied to toxicology is the
gene expression microarray (Nuwaysir et al., 1999; Schirmer et al., 2010; Piña and Barata,
2011) which allows for rapid analysis of genome-wide expression profiles. Various
microarray technologies have been developed but currently oligonucleotide microarrays
are most commonly used. These microarrays consist of short single-stranded 60-mer DNA
oligonucleotide probes, synthesised in situ on glass arrays, corresponding to transcribed
regions and hence RNA transcripts, of known genes. The total RNA content of control and
treated samples is extracted then simultaneously amplified and labelled with a fluorescent
dye by reverse transcription (Piña and Barata, 2011). Samples are then hybridised to
individual arrays, and the fluorescence measured from each probe corresponds to relative
concentration, and hence expression, of that particular mRNA molecule (Nguyen et al.,
2002). The major disadvantage to DNA microarrays is that they require some prior
20
knowledge of the test organism’s genome or transcriptome, as this information is
necessary to synthesise the DNA probes.
1.3.2 Analytical platforms for metabolomics
Metabolomics is the measurement of the entire profile of low molecular weight products
within a cell-line, tissue or whole organism (Viant, 2008). An organism’s metabolic
profile is the direct result of gene expression and cellular metabolism (Figure 1.2) and as
such can be considered the phenotype of alterations in gene-expression (Fiehn, 2002).
Metabolomics has been readily applied to ecotoxicology studies through comparison of the
metabolic profiles of treated and untreated samples. To detect and identify as many
components of an organism’s metabolome as possible, the discipline requires highly
sensitive and highly selective analytical techniques (Lenz and Wilson, 2006). Two
technologies come close to meeting this paradigm; Nuclear Magnetic Resonance (NMR)
and Mass Spectrometry (MS).
NMR has been used in metabolomics-based toxicology and ecotoxicology studies for years
and is still used extensively for this purpose. NMR is rapid, highly-reproducible between
procedures and laboratories (Viant et al., 2009), and does not alter the original sample i.e.
it is non-destructive (Lenz and Wilson, 2007). As a major limitation however, NMR is not
as sensitive as MS and as such struggles to detect the naturally low-concentration
metabolites that make up a majority of the metabolome. For this reason NMR was not
appropriate for this thesis.
Unlike NMR, MS is a destructive technique that depends upon the ionisation of
metabolites in order to separate and detect them based on their molecular mass/charge
(m/z) ratios. The end result of MS analysis is a spectrum of m/z values plotted against their
respective relative intensities which correspond to metabolite abundance. MS techniques
21
are often as rapid as NMR but have much greater sensitivity, enabling the detection of the
large number of low-concentration metabolites that exist in biological mixtures (Lenz and
Wilson, 2007). This enhanced sensitivity has resulted in an increased use of MS
techniques in environmental metabolomics due to a need for greater exploration of
organism metabolomes (Viant and Sommer, 2012).
MS analysis usually occurs either through an initial separation of metabolites by
chromatography or electrophoresis techniques (hyphenated MS), or through the direct-
infusion of mixtures with the ionisation source (Direct Infusion MS (DIMS)) (Robertson et
al., 2007). Prior separation using Gas-Chromatography (GC-MS), Liquid-
Chromatography (LC-MS) or capillary electrophoresis is often employed to enable better
separation of peaks thus enhancing identification and quantification of metabolites
(Allwood and Goodacre, 2010). However the price for this enhanced level of
identification is longer preparation and analysis time which reduces the efficiency of this
technique as a high-throughput technology.
DIMS allows rapid sample throughput, with each analysis potentially acquired within
minutes. However, without the addition of one of the techniques above the separation of
peaks is based on m/z values only. To address this problem mass spectrometers with high
mass resolution and high mass accuracy are required to accurately differentiate peaks with
similar m/z values (Dettmer et al., 2007). Of the various forms of MS technique, Fourier
Transform Ion Cyclotron Resonance (FT-ICR) and Orbitrap MS are the most favoured for
DIMS (Junot et al., 2010). In this thesis, data is acquired using a FT-ICR MS, hybridised
with a Linear Trap Quadropole (LTQ) ion trap MS (LTQ-FT Ultra). Metabolites within
samples are first ionised using a nano-Electrospray Ionisation (nESI) source. This utilises
electrical energy to ionise samples as either positively or negatively charged droplets
which are transferred into the LTQ-MS (Bruins, 1998). The LTQ is used as an ion-trap;
22
this allows collection of a specific number of ions of a particular m/z range prior to
injection into the ICR cell. Contrary to conventional mass spectrometers, the ICR is not
dependent upon the collision of ions with a detector plate. Instead, ions are trapped within
a strong magnetic field and excited by electrodes to rotate at a frequency which is
dependent upon their m/z. This rotation of ions allows them to be detected as they pass the
surrounding detector plates.
1.3.3 Statistical analysis of ‘omics datasets
Transcriptomics and metabolomics data are intrinsically multivariate and as such
multivariate statistical methods are commonly used. Principal Components Analysis
(PCA) allows perception of inherent similarities between transcriptional or metabolic
profiles of samples based upon the relative proportions of the constituent genes or
metabolites. PCA does not use sample class information in the construction of models, but
rather attempts to describe the dataset based on the overall variation in the data (Wise et
al., 2006). Patterns of variation are described as principal components (PCs). Each
subsequent PC in a PCA model describes a decreasing amount of variance within the data;
that is PC1 accounts for the greatest patterns variance, followed by PC2 then PC3 and so
on (Robertson, 2005). Each sample is assigned a score value based upon how it reflects
the variation described by a PC. Score plots (typically PC1 against PC2) are used to
visually determine if there are any natural similarities in the profiles of samples through
clustering of scores values (Robertson et al., 2007). These clusters allow for rapid
identification of similar and dissimilar samples, indicating a common effect or mechanism
(Keun, 2006).
1.3.4 Annotation of genes and metabolites and methods of pathway analysis
Assigning functional or chemical identities to genes and compounds is referred to as
annotation. For transcriptomics data, online databases allow the comparison of transcript
23
sequences with those of other documented genes (Piña and Barata, 2011). Examples of
such databases include the Gene Ontology consortium (http://geneontology.org/) and the
National Centre for Biotechnology Information (http://blast.st-
va.ncbi.nlm.nih.gov/Blast.cgi). This allows the user to identify genes with the greatest
sequence homology/similarity to their target genes across multiple species in an effort to
assign an appropriate annotation (such as gene- function).
For metabolomics techniques, the process of metabolite identification is still a major
limiting factor. Metabolite identification is possible through tandem mass spectrometry
(MS/MS) which fragments metabolites allowing the elucidation of structures. However,
this approach is time-consuming, and is unfeasible for the thousands of peaks that can be
detected by FT-ICR MS. Theoretically, through the accurate mass values obtained by the
FT-ICR, putative identification of metabolites is possible following a database search for
each peak in turn (Kind and Fiehn, 2006). This process is known as a Single Peak Search
(SPS). The Metabolite Identification Package (MI-Pack) is a software package which
enables the automated putative annotation of m/z peaks by SPS and by the Transformation
Mapping (TM) algorithm. TM utilises prior information of the metabolic interactions
mapped in the Kyoto Encyclopaedia of Genes and Genomes (KEGG) to improve putative
annotation of m/z peaks. The TM algorithm has been shown to reduce the false positive
rate (FPR) of metabolite annotation from 68% (by SPS) to 15.9 % while maintaining a
minimal false negative rate of 5.6% (Weber and Viant, 2010). However the number of
known metabolites is comparatively small to the numbers of peaks possible to detect in an
FT-ICR spectrum. Additionally, many metabolites are present at concentrations or for
periods of time which make them very difficult to detect.
Pathway analysis allows us to make sense of large lists of putative genes or metabolites by
putting them into context of known molecular interactions. As our understanding of
24
molecular pathways grow, the available methods for pathway analysis have also grown to
incorporate more and more variables (Khatri et al., 2012). There are three major
categories of pathway analysis; Over-Representation Analysis (ORA), Function Class
Scoring Analysis (FCSA) and Pathway Topology Analysis (PTA) (Khatri et al., 2012).
The general principles surrounding each category are outlined below.
ORA is a qualitative form of pathway analysis that determines the fraction of detected
genes or metabolites within a pathway that change in expression or concentration (Khatri
et al., 2012). An input list is formed consisting of genes or metabolites deemed to be of
interest, normally by statistical significance tests or through use of an arbitrary fold-change
threshold. The number of these compounds within each tested pathway-definition is then
counted, and the same process is repeated for an appropriate background list. Traditionally
for microarray analyses this background consists of all detected genes on the microarray,
regardless of expression or significance. When applied to metabolomics, determining this
background list has proven problematic due to the minute fraction of detected metabolites
which are successfully identified (Bouhifd et al., 2013). Statistical tests for ORA are based
around the hypergeometric or binomial distributions such as the Fisher’s exact test. The
major disadvantage of ORA is that it purely accounts for the presence or absence of
‘interesting’ pathway components and does not take into account associated intensity
values (Khatri et al., 2012).
FCSA is based on the notion that small, but co-ordinated pathway-wide increases or
decreases in gene expression or metabolite production are equally as important as large
changes in individual genes or metabolites. As such FCSA takes into account the changes
in expression or production of all pathway constituents and not just a selection (Khatri et
al., 2012). Most methods of FCSA follow the same three steps (Ackermann and Strimmer,
2009). Firstly differential expression of individual pathway components is calculated

25
through univariate statistics. Secondly the component-level statistics are combined to
create pathway-level statistics which are then ranked in order of importance. Finally, the
significance of the pathway-level statistic is assessed.
Pathway topology analysis is the most recent development in pathway analysis techniques.
This method follows the same three steps as FCSA but instead use information on pathway
topology, interactions of constituent genes and metabolites, to compute component-level
statistics (Khatri et al., 2012). One major challenged faced by this method that the
topology of many pathways is entirely dependent on the cells or organisms used and
largely unavailable.
In the field of transcriptomics, pathway analysis has proven invaluable for years and as a
result large numbers of analysis tools are available (reviewed in Khatri et al., 2012). For
the relatively new discipline of metabolomics, the connection of metabolomics results to
the genome has long been predicted (Fiehn, 2002) and only recently enabled (Xia and
Wishart, 2010; Xia et al., 2012). Online tools have also become available for combined
transcriptomics and metabolomics pathway analysis (Kamburov et al., 2011). This enables
an objective, statistical approach which avoids speculation as to how statistically
significant genes and metabolites interact (Cavill et al., 2011). One massive disadvantage
of all categories of pathway analysis is that they rely upon absolute confidence in the
assigned, imputed identities. For microarray transcriptomics, where the identity of each
probe is known prior to analysis, this is less of a problem. However for DIMS, where
high-throughput identification of detected metabolites is limited, it presents an additional
limitation.
26
1.3.5 The application of omics-technologies for the elution of the AgNP MoA
As stated above, the non-targeted approach of mechanistic investigation that omics
technologies provide us with, allows us to bypass the potential limitations of traditional
hypothesis-driven research. Several omics-investigations into AgNP toxicity have
highlighted mechanisms known also to be shared by dissolved silver, such as disruption of
mitochondrial activity (Aerle et al., 2013), energy metabolism (Li et al., 2015a; 2015b) and
the induction of oxidative stress following production of ROS (Poynton et al., 2012;
Rainville et al., 2014). However some studies have highlighted potential mechanisms of
AgNP toxicity that have not been investigated as extensively. A summary of omics
investigations into AgNP toxicity is given in Table 1.1.
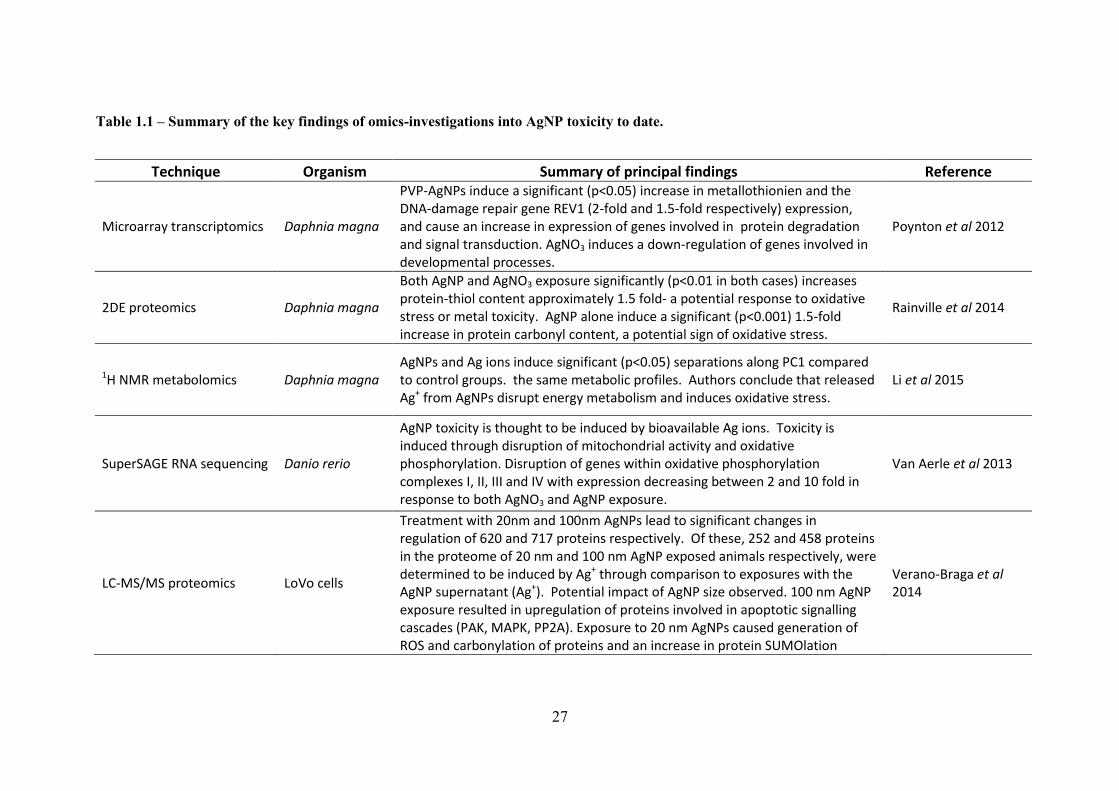
27
Table 1.1 – Summary of the key findings of omics-investigations into AgNP toxicity to date.
Technique Organism Summary of principal findings Reference
Microarray transcriptomics Daphnia magna
PVP-AgNPs induce a significant (p<0.05) increase in metallothionien and the DNA-damage repair gene REV1 (2-fold and 1.5-fold respectively) expression, and cause an increase in expression of genes involved in protein degradation and signal transduction. AgNO3 induces a down-regulation of genes involved in developmental processes.
Poynton et al 2012
2DE proteomics Daphnia magna
Both AgNP and AgNO3 exposure significantly (p<0.01 in both cases) increases protein-thiol content approximately 1.5 fold- a potential response to oxidative stress or metal toxicity. AgNP alone induce a significant (p<0.001) 1.5-fold increase in protein carbonyl content, a potential sign of oxidative stress.
Rainville et al 2014
1H NMR metabolomics Daphnia magna AgNPs and Ag ions induce significant (p<0.05) separations along PC1 compared to control groups. the same metabolic profiles. Authors conclude that released Ag+ from AgNPs disrupt energy metabolism and induces oxidative stress.
Li et al 2015
SuperSAGE RNA sequencing Danio rerio
AgNP toxicity is thought to be induced by bioavailable Ag ions. Toxicity is induced through disruption of mitochondrial activity and oxidative phosphorylation. Disruption of genes within oxidative phosphorylation complexes I, II, III and IV with expression decreasing between 2 and 10 fold in response to both AgNO3 and AgNP exposure.
Van Aerle et al 2013
LC-MS/MS proteomics LoVo cells
Treatment with 20nm and 100nm AgNPs lead to significant changes in regulation of 620 and 717 proteins respectively. Of these, 252 and 458 proteins in the proteome of 20 nm and 100 nm AgNP exposed animals respectively, were determined to be induced by Ag+ through comparison to exposures with the AgNP supernatant (Ag+). Potential impact of AgNP size observed. 100 nm AgNP exposure resulted in upregulation of proteins involved in apoptotic signalling cascades (PAK, MAPK, PP2A). Exposure to 20 nm AgNPs caused generation of ROS and carbonylation of proteins and an increase in protein SUMOlation
Verano-Braga et al 2014
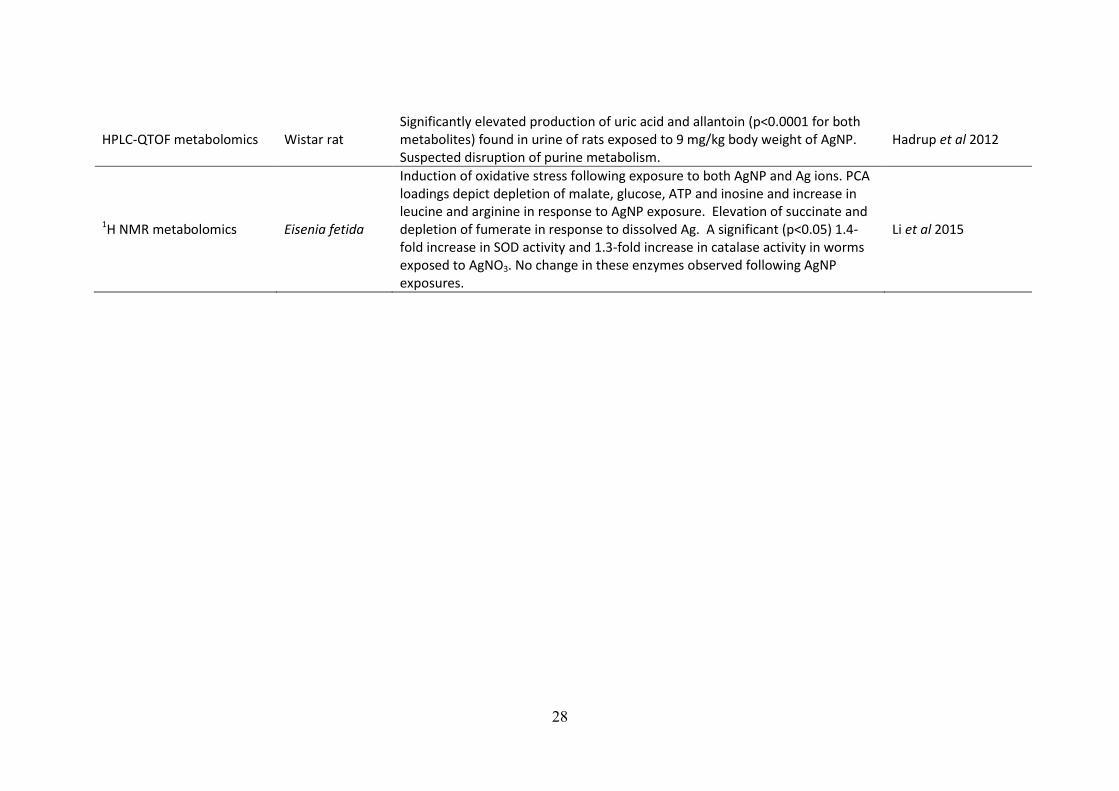
28
HPLC-QTOF metabolomics Wistar rat Significantly elevated production of uric acid and allantoin (p<0.0001 for both metabolites) found in urine of rats exposed to 9 mg/kg body weight of AgNP. Suspected disruption of purine metabolism.
Hadrup et al 2012
1H NMR metabolomics Eisenia fetida
Induction of oxidative stress following exposure to both AgNP and Ag ions. PCA loadings depict depletion of malate, glucose, ATP and inosine and increase in leucine and arginine in response to AgNP exposure. Elevation of succinate and depletion of fumerate in response to dissolved Ag. A significant (p<0.05) 1.4-fold increase in SOD activity and 1.3-fold increase in catalase activity in worms exposed to AgNO3. No change in these enzymes observed following AgNP exposures.
Li et al 2015
29
A quantitative proteomics investigation identified up-regulation of serine/threonine protein
kinase (PAK), mitogen-activated protein kinase (MAPK) and protein phosphatase 2A
(PP2A) subunits following exposure of human colon carcinoma cells to 100 nm citrate-
coated AgNPs (Verano-Braga et al., 2014). PAK and MAPK are both involved in
signalling cascades that result in caspase-dependent and caspase-independent apoptosis
respectively, and PP2A is involved in the regulation of the cell cycle. This study also
detected an increase in protein ubiquitination, as well as an upregulation of proteins
involved in the ribosome and proteasome complexes. This implies an increase in
degradation of proteins by the ubiquitin-proteasome system, possibly damage proteins,
followed by the synthesis of replacement proteins (Verano-Braga et al., 2014). In addition
to concluding that both AgNPs and dissolved silver impact oxidative phosphorylation and
mitochondrial activity, Van Aerle et al (2013) identified significant down-regulation (6.3
fold over 24 h) in cryptochrome 1a transcription, a protein involved in the repressor of
clock function. Additional observations included down-regulation of proteasome subunit
beta type-1 and up-regulation of ribosomal protein S6 modification-like protein B, the
authors suggested that together these alterations imply an increased level of protein
turnover due to oxidative damage (Aerle et al., 2013). AgNP-exposed rats were identified
as having an increase in the concentration of uric acid and allantoin excreted in their urine
suggested a disruption of purine metabolism (Hadrup et al., 2012). These pathways are
unlikely to have been targeted through use of a traditional approach, as the background
knowledge of AgNP toxicity is still relatively low. AgNPs are therefore ideal candidates
for a non-targeted omics approach to investigating their mechanism of toxicity in
environmentally relevant test organisms.
30
1.4 Ecotoxicogenomics and the importance of relevant test organisms
Ecotoxicology, the combination of ecology and toxicology, is the discipline of observing
toxicant effects upon ecological systems. Although heavily influenced by toxicology with
regards to experimental methods, the influence of ecology is most notable in the selection
of ecologically relevant test species and test conditions (Chapman, 2002). Environmental
risk assessment differs from standard toxicological risk assessment, in that it not only aims
to look at the effects of toxicants on individual organisms, but also the consequences of
these effects upon the wider ecosystem (Breitholtz et al., 2006). In an ideal situation all
species in a particular ecosystem would be tested to fully investigate the potential impact
of a toxicant (Breitholtz et al., 2006). However, as this is impossible, it is vital to select an
organism that is representative of the ecosystem under investigation (Chapman, 2002;
Breitholtz et al., 2006). Examples of such organisms recommended by the OECD are
summarised in Table 1.2 along with examples of recommended testing guidelines.
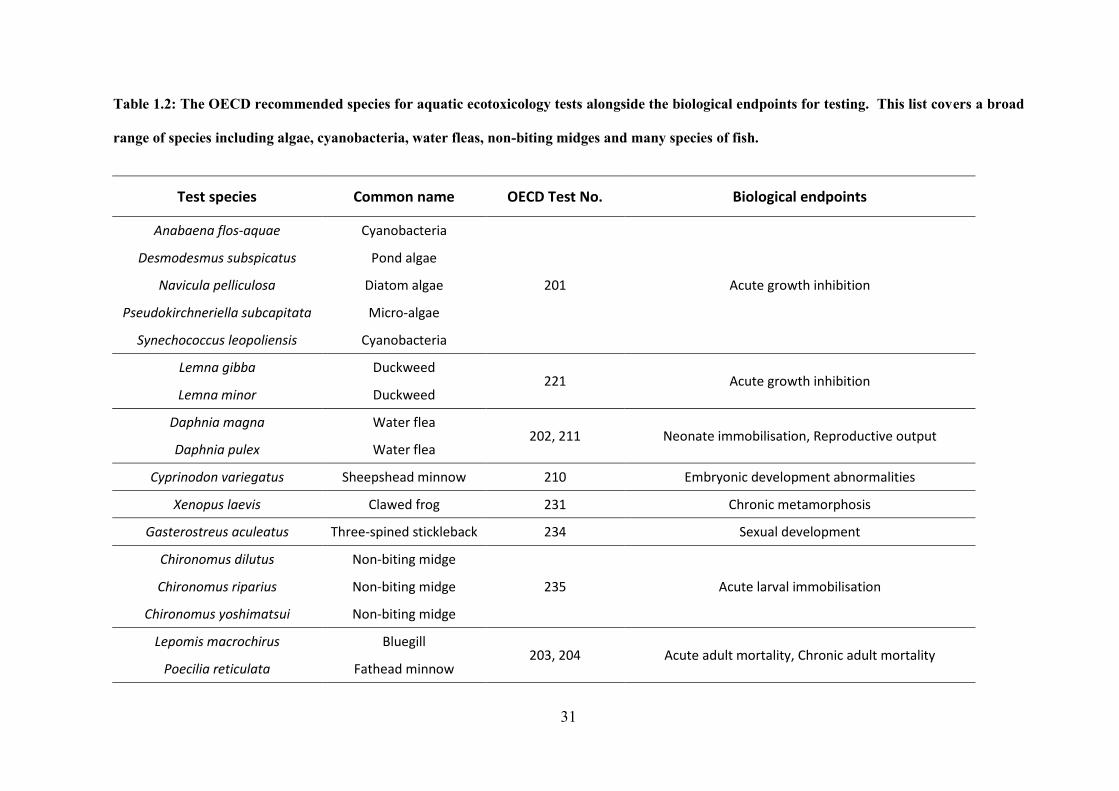
31
Table 1.2: The OECD recommended species for aquatic ecotoxicology tests alongside the biological endpoints for testing. This list covers a broad
range of species including algae, cyanobacteria, water fleas, non-biting midges and many species of fish.
Test species Common name OECD Test No. Biological endpoints
Anabaena flos-aquae Cyanobacteria
201 Acute growth inhibition
Desmodesmus subspicatus Pond algae
Navicula pelliculosa Diatom algae
Pseudokirchneriella subcapitata Micro-algae
Synechococcus leopoliensis Cyanobacteria
Lemna gibba Duckweed 221 Acute growth inhibition
Lemna minor Duckweed
Daphnia magna Water flea 202, 211 Neonate immobilisation, Reproductive output
Daphnia pulex Water flea
Cyprinodon variegatus Sheepshead minnow 210 Embryonic development abnormalities
Xenopus laevis Clawed frog 231 Chronic metamorphosis
Gasterostreus aculeatus Three-spined stickleback 234 Sexual development
Chironomus dilutus Non-biting midge
235 Acute larval immobilisation Chironomus riparius Non-biting midge
Chironomus yoshimatsui Non-biting midge
Lepomis macrochirus Bluegill 203, 204 Acute adult mortality, Chronic adult mortality
Poecilia reticulata Fathead minnow

32
Oncorhynchus mykiss Rainbow trout 203, 204, 210, 212,
215
Acute adult mortality, Chronic adult mortality, Chronic embryonic development, Acute embryonic
development, Juvenile growth
Oryzias latipes Japanese medaka 203, 204, 210, 212, 215, 229, 230, 234
Acute adult mortality, Chronic adult mortality, Chronic embryonic development, Acute embryonic
development, Juvenile growth, Acute endochrine disruption, Chronic endochrine disruption, Sexual
development
Danio rerio Zebra fish 203, 204, 210, 212, 215, 229, 230, 234,
236
Acute adult mortality, Chronic adult mortality, Chronic embryonic development, Acute embryonic
development, Juvenile growth, Acute endochrine disruption, Chronic endochrine disruption, Sexual
development, Acute embryo mortality
Pimephales promelas Fathead minnow 203, 204, 210, 212,
229, 230
Acute adult mortality, Chronic adult mortality, Chronic embryonic development, Acute embryonic
development, Acute endochrine disruption, Chronic endochrine disruption
Cyprinus carpio Common carp 203, 204, 212 Acute adult mortality, Chronic adult mortality,
Embryonic development abnormalities
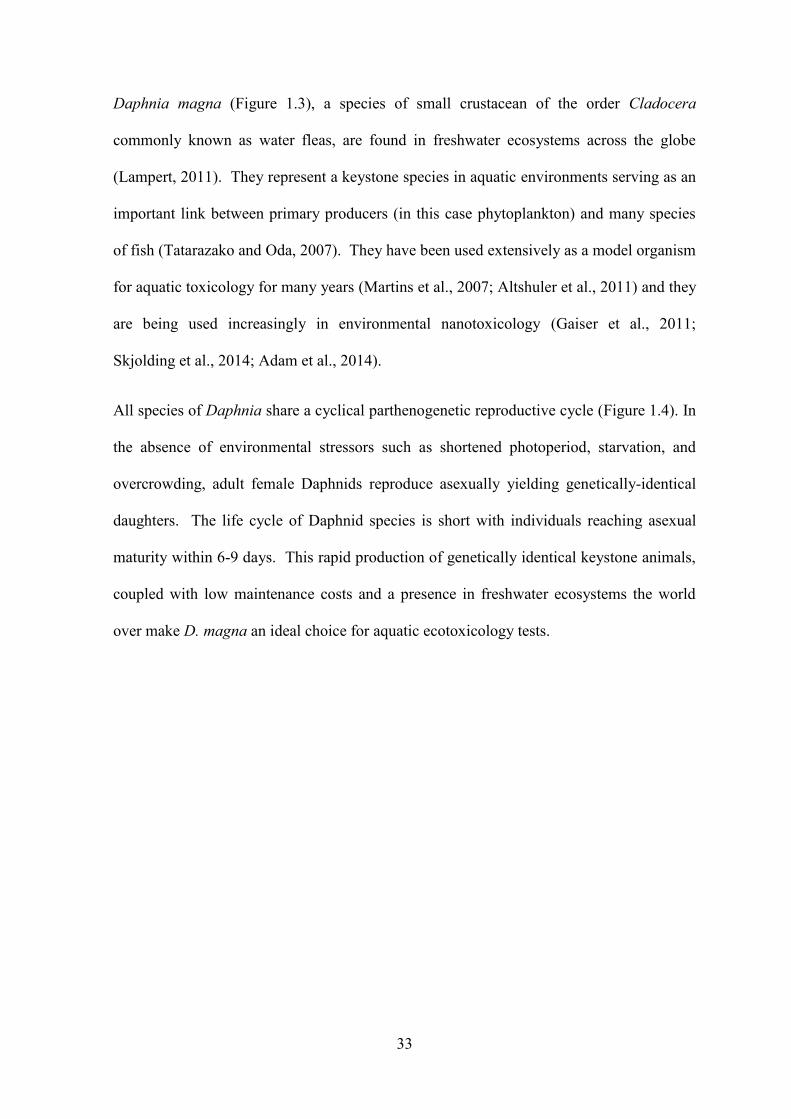
33
Daphnia magna (Figure 1.3), a species of small crustacean of the order Cladocera
commonly known as water fleas, are found in freshwater ecosystems across the globe
(Lampert, 2011). They represent a keystone species in aquatic environments serving as an
important link between primary producers (in this case phytoplankton) and many species
of fish (Tatarazako and Oda, 2007). They have been used extensively as a model organism
for aquatic toxicology for many years (Martins et al., 2007; Altshuler et al., 2011) and they
are being used increasingly in environmental nanotoxicology (Gaiser et al., 2011;
Skjolding et al., 2014; Adam et al., 2014).
All species of Daphnia share a cyclical parthenogenetic reproductive cycle (Figure 1.4). In
the absence of environmental stressors such as shortened photoperiod, starvation, and
overcrowding, adult female Daphnids reproduce asexually yielding genetically-identical
daughters. The life cycle of Daphnid species is short with individuals reaching asexual
maturity within 6-9 days. This rapid production of genetically identical keystone animals,
coupled with low maintenance costs and a presence in freshwater ecosystems the world
over make D. magna an ideal choice for aquatic ecotoxicology tests.
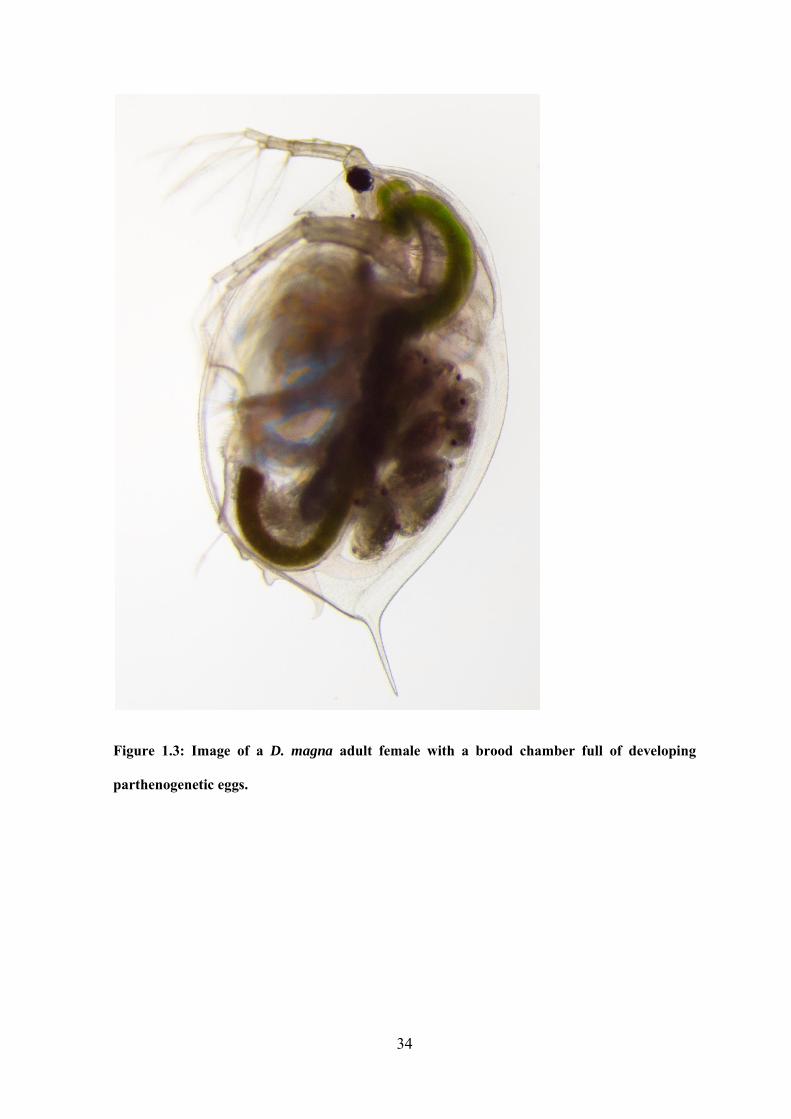
34
Figure 1.3: Image of a D. magna adult female with a brood chamber full of developing
parthenogenetic eggs.
35
Figure 1.4: The Daphnia reproductive cycle. Outlined in this image is the asexual,
parthenogenetic cycle which is able to switch to the sexual cycle under unfavourable or
stressful conditions (Ebert, 2005)
36
1.4.1 Ecotoxicogenomics and Daphnia magna
In recent years, the number of studies which have applied omics technologies to D. magna
toxicology studies has grown, with applications of transcriptomics (Garcia-Reyero et al.,
2009; David et al., 2011; Poynton et al., 2012; Campos et al., 2013; Rivetti et al., 2014),
proteomics (Le et al., 2013; Otte et al., 2014; Rainville et al., 2014), and metabolomics
(Taylor et al., 2009; Bunescu et al., 2010; Poynton et al., 2011b; Nagato et al., 2013) being
reported. With the publication of the Daphnia pulex genome in 2011 (Colbourne et al.,
2011), it was not long before gene-expression microarrays were constructed for the sister
species D. magna from EST libraries (Watanabe et al., 2007; Heckmann et al., 2008;
Garcia-Reyero et al., 2009). The transcriptomics analysis in this thesis uses a custom
D. magna microarray developed in 2009 (Garcia-Reyero et al., 2009) and used previously
for nanoparticle toxicology (Poynton et al., 2011a, 2012; Scanlan et al., 2013). Despite its
value as a toxicity test species, only a few metabolomic toxicity studies using D. magna
have been reported (Taylor et al., 2009, 2010; Bunescu et al., 2010; Poynton et al., 2011b;
Nagato et al., 2013). The first recorded metabolomics study using D. magna was in 2009,
where Taylor et al. validated the use of FT-ICR MS in metabolomic studies of D. magna,
using copper as a model toxicant. This model has already been used previously with
AgNPs for mechanistic investigations using transcriptomics (Poynton et al., 2012),
proteomics (Rainville et al., 2014) and NMR-metabolomics (Li et al., 2015a). This
organism therefore represents an ideal model for a dual-omic assessment of molecular
mechanisms of toxicity of AgNPs. Omics-technologies present a unique opportunity in
the on-going debate over the role of Ag+ in AgNP toxicity through direct comparison of
the pathways perturbed by both forms of silver. These technologies can also be used to
direct further research into the elution of the changes induced in D. magna by exposure to
Ag.
37
1.5 Research hypothesis, aims and objectives
The primary objective of this research was to investigate the molecular mechanisms of
AgNP toxicity to the freshwater Cladocera, D. magna, using a combined analysis platform
of microarray transcriptomics and FT-ICR MS metabolomics. The work within this thesis
tested the hypothesis that toxicity by AgNPs to D. magna is induced through the actions of
dissolved Ag released upon nanoparticle dissolution. Specifically that, if the nanoparticle
fraction plays no part in toxicity, AgNP toxicity is induced through mechanisms known to
be induced by dissolved Ag; such as oxidative stress, disruption of mitochondrial function
and inhibition of ion-transport proteins.
The primary aims were:
1. To compare the transcriptional and metabolic perturbations induced by AgNPs and
dissolved Ag, to determine whether AgNP toxicity is induced solely by the
dissolved Ag component.
2. To use the non-targeted approach offered by omics technologies to identify the
prominent molecular pathways impacted by AgNP exposure. This platform would
then be used to develop and test hypotheses with the aim of elucidating the AgNP
mechanism of toxicity.
38
Chapter 2: Materials and Methods
2.1 Standard chemicals and reagents
Unless otherwise stated, all standard chemicals and reagents were purchased from Sigma-
Aldrich.
2.2 Acid-wash cleaning procedures
All glassware and plastic-ware used for exposures, ultrafiltration, or in the preparation of
samples for ICP-MS were rinsed and then soaked in a bath of 10 % nitric acid (analytical
grade, Fisher Scientific) made with ultrapure water (18.2 MΩ, Purelab) for 24 h.
Following this, items were rinsed thoroughly and left to soak in ultrapure water for a
further 24 h. All equipment was then left to dry overnight and wrapped in cling-film prior
to use.
2.3 Nanoparticle synthesis and characterisation
2.3.1 Silver nanoparticle synthesis – conducted by Dr. Isabella Römer and Dr. Mila
Tejamaya (University of Birmingham)
AgNPs stabilised with citrate (cit-AgNPs) were synthesised by Dr. Isabella Römer
through the reduction of AgNO3 (100 ml, 0.25 mM) by sodium borohydride (NaBH4, 6 ml,
10 mM) in the presence of sodium citrate (100 ml, 0.31 mM) using a method outlined
previously (Römer et al. 2011). AgNPs stabilised with polyvinyl pyrrolidone (PVP-
AgNPs) were synthesised by Dr. Mila Tejamaya using a similar method, again through the
reduction of AgNO3 (60 ml, 1 mM) with NaBH4 (180 ml, 2 mM) however this time in the
presence of PVP10 (Tejamaya et al. 2012). Newly synthesised nanoparticles were
‘cleaned’ to remove excess reagents using ultrafiltration (UF) through a 1 kDa regenerated
cellulose membrane (Millipore, USA) in a stirred UF cell under N2. The volume was
39
maintained with capping agent solution (sodium citrate or PVP) using a diafiltration
method to keep particles in solution. Particles underwent cleaning 3 times following
preparation and a further 3 times prior to all exposure work, with the final clean always
finishing less than 1 h before the initiation of particle exposures. All UF equipment was
washed in 2% nitric acid and rinsed thoroughly in ultrapure water prior to use.
2.3.2 Particle characterisation – conducted by Dr. Isabella Römer and Dr. Mila
Tejamaya (University of Birmingham)
The cit-AgNPs and PVP-AgNPs used in this research were characterised in ultrapure
water, by Dr Isabella Romer and Dr Mila Tejamaya respectively, using flow field flow
fractionation (Fl-FFF), dynamic light scattering (DLS), transmission electron microscopy
(TEM) and in the case of cit-AgNPs only, atomic force microscopy (AFM) as outlined
previously (Römer et al. 2011; Roche 2012; Tejamaya et al. 2012) and summarised in
Table 2.1. Briefly, both particles were dispersed in ultrapure water and deemed spherical
in shape by TEM analysis. The cit-AgNPs had mean diameters measured as 7.2 ± 0.2, 7.0
± 2.0 and 6.0 ± 3.0 nm by Fl-FFF, TEM and AFM respectively and 16 ± 1.0 nm by DLS.
The discrepancy in the measurement made by DLS when compared to the other techniques
is indicative of the particles hydrated radius (Baalousha and Lead, 2012). The PVP-
AgNPs had mean diameter measurements of 25.6, 10.8 ± 3.3 and 28.3 ± 0.8 nm by Fl-FFF,
TEM and DLS. The discrepancy between measurements of the PVP-AgNPs by TEM and
Fl-FFF is due to the inability of TEM to visualise the increased diameter of the particles
caused by the PVP polymer coating (Domingos et al., 2009). Observational techniques
such as TEM and AFM therefore give an assessment of the particles’ core diameter
whereas Fl-FFF also measures the PVP shell (Baalousha and Lead, 2012). As it is the
technique which directly measures the core of the nanoparticles, the measurements made
by TEM will be used when referring to nanoparticle size in this thesis.
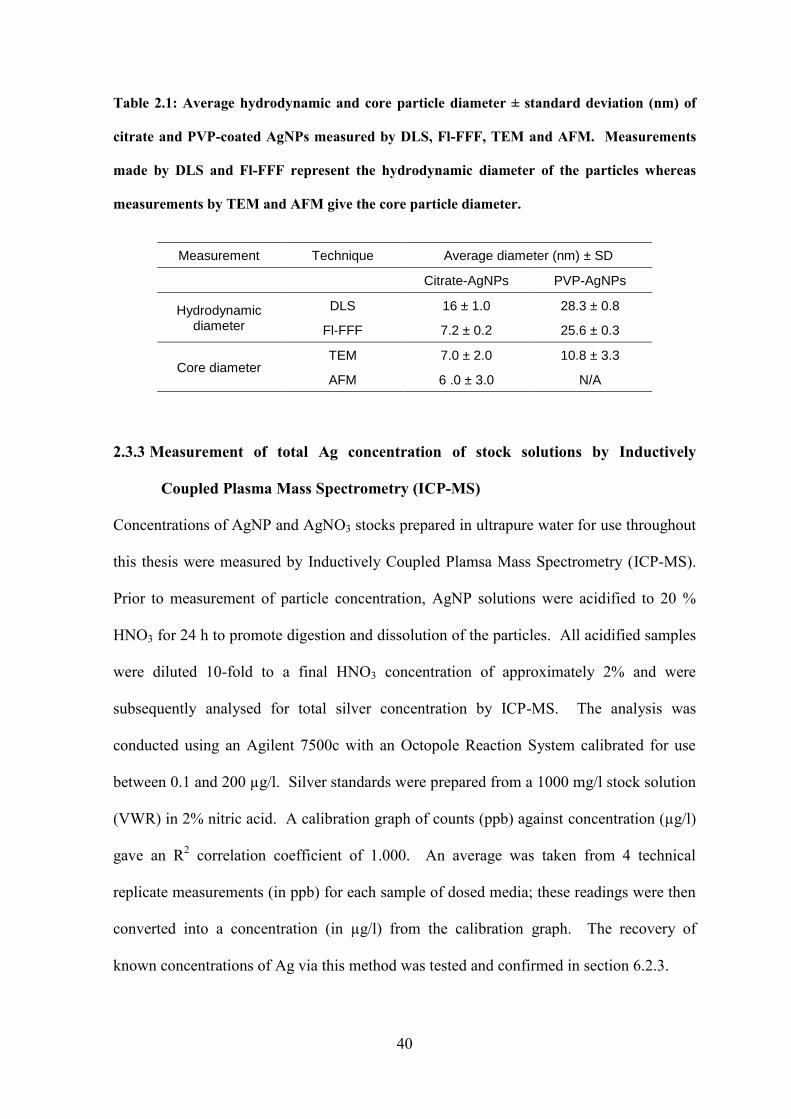
40
Table 2.1: Average hydrodynamic and core particle diameter ± standard deviation (nm) of
citrate and PVP-coated AgNPs measured by DLS, Fl-FFF, TEM and AFM. Measurements
made by DLS and Fl-FFF represent the hydrodynamic diameter of the particles whereas
measurements by TEM and AFM give the core particle diameter.
Measurement Technique Average diameter (nm) ± SD
Citrate-AgNPs PVP-AgNPs
Hydrodynamic diameter
DLS 16 ± 1.0 28.3 ± 0.8
Fl-FFF 7.2 ± 0.2 25.6 ± 0.3
Core diameter TEM 7.0 ± 2.0 10.8 ± 3.3
AFM 6 .0 ± 3.0 N/A
2.3.3 Measurement of total Ag concentration of stock solutions by Inductively
Coupled Plasma Mass Spectrometry (ICP-MS)
Concentrations of AgNP and AgNO3 stocks prepared in ultrapure water for use throughout
this thesis were measured by Inductively Coupled Plamsa Mass Spectrometry (ICP-MS).
Prior to measurement of particle concentration, AgNP solutions were acidified to 20 %
HNO3 for 24 h to promote digestion and dissolution of the particles. All acidified samples
were diluted 10-fold to a final HNO3 concentration of approximately 2% and were
subsequently analysed for total silver concentration by ICP-MS. The analysis was
conducted using an Agilent 7500c with an Octopole Reaction System calibrated for use
between 0.1 and 200 µg/l. Silver standards were prepared from a 1000 mg/l stock solution
(VWR) in 2% nitric acid. A calibration graph of counts (ppb) against concentration (µg/l)
gave an R2 correlation coefficient of 1.000. An average was taken from 4 technical
replicate measurements (in ppb) for each sample of dosed media; these readings were then
converted into a concentration (in µg/l) from the calibration graph. The recovery of
known concentrations of Ag via this method was tested and confirmed in section 6.2.3.
41
2.4 Daphnia magna culturing
2.4.1 Preparation and composition of media
Three different preparations of ISO test water (1) (Annex 3, OECD 202, 2004) with
additional sodium selenite (Keating and Dagbusan, 1984; Taylor et al., 2009) were used
throughout this thesis (Table 2.2). These consisted of the standard strength media
(media1) as well as a 2-fold (media2) and 10-fold (media10) dilution as reported
previously (Römer et al., 2011; Tejamaya et al., 2012; Römer et al., 2013). Media were
prepared through the addition of concentrated stocks of the composite salts to deionised
water (15 MΩ). The composition of media1, media2 and media10 is outlined below
(Table 2.2). Following preparation, media was aerated for a minimum of 24 h after which
the pH and dissolved oxygen concentration were measured before use. Media was used
only with a pH between 6.0 and 9.0 and a dissolved oxygen concentration above 60 %
relative saturation as outlined in the OECD guidelines (OECD 202, 2004).
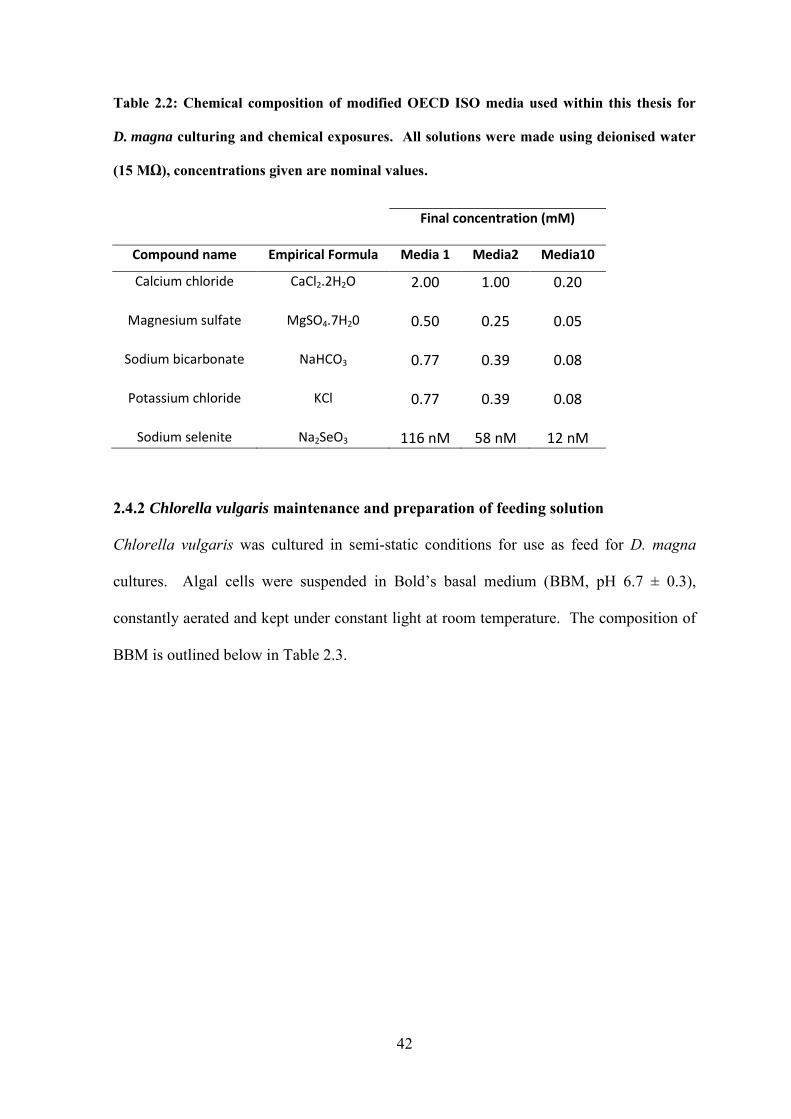
42
Table 2.2: Chemical composition of modified OECD ISO media used within this thesis for
D. magna culturing and chemical exposures. All solutions were made using deionised water
(15 MΩ), concentrations given are nominal values.
Final concentration (mM)
Compound name Empirical Formula Media 1 Media2 Media10
Calcium chloride CaCl2.2H2O 2.00 1.00 0.20
Magnesium sulfate MgSO4.7H20 0.50 0.25 0.05
Sodium bicarbonate NaHCO3 0.77 0.39 0.08
Potassium chloride KCl 0.77 0.39 0.08
Sodium selenite Na2SeO3 116 nM 58 nM 12 nM
2.4.2 Chlorella vulgaris maintenance and preparation of feeding solution
Chlorella vulgaris was cultured in semi-static conditions for use as feed for D. magna
cultures. Algal cells were suspended in Bold’s basal medium (BBM, pH 6.7 ± 0.3),
constantly aerated and kept under constant light at room temperature. The composition of
BBM is outlined below in Table 2.3.
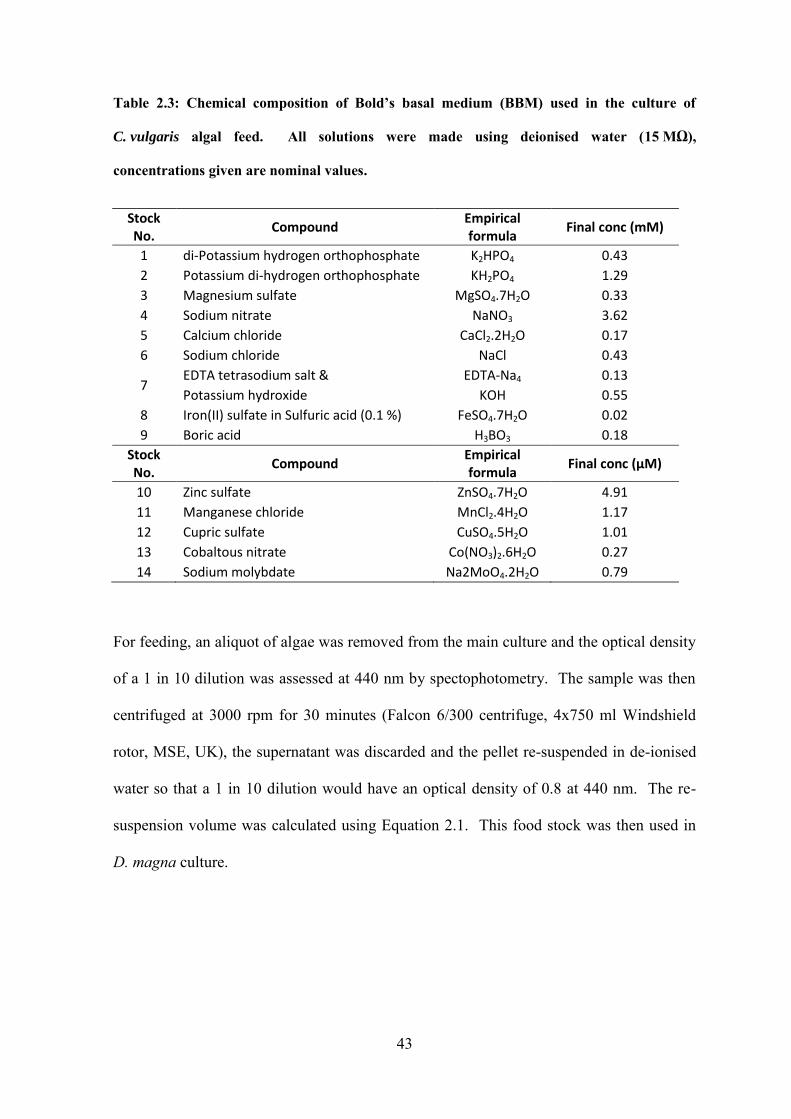
43
Table 2.3: Chemical composition of Bold’s basal medium (BBM) used in the culture of
C. vulgaris algal feed. All solutions were made using deionised water (15 MΩ),
concentrations given are nominal values.
Stock No.
Compound Empirical formula
Final conc (mM)
1 di-Potassium hydrogen orthophosphate K2HPO4 0.43
2 Potassium di-hydrogen orthophosphate KH2PO4 1.29
3 Magnesium sulfate MgSO4.7H2O 0.33
4 Sodium nitrate NaNO3 3.62
5 Calcium chloride CaCl2.2H2O 0.17
6 Sodium chloride NaCl 0.43
7 EDTA tetrasodium salt & EDTA-Na4 0.13
Potassium hydroxide KOH 0.55
8 Iron(II) sulfate in Sulfuric acid (0.1 %) FeSO4.7H2O 0.02
9 Boric acid H3BO3 0.18
Stock No.
Compound Empirical formula
Final conc (µM)
10 Zinc sulfate ZnSO4.7H2O 4.91
11 Manganese chloride MnCl2.4H2O 1.17
12 Cupric sulfate CuSO4.5H2O 1.01
13 Cobaltous nitrate Co(NO3)2.6H2O 0.27
14 Sodium molybdate Na2MoO4.2H2O 0.79
For feeding, an aliquot of algae was removed from the main culture and the optical density
of a 1 in 10 dilution was assessed at 440 nm by spectophotometry. The sample was then
centrifuged at 3000 rpm for 30 minutes (Falcon 6/300 centrifuge, 4x750 ml Windshield
rotor, MSE, UK), the supernatant was discarded and the pellet re-suspended in de-ionised
water so that a 1 in 10 dilution would have an optical density of 0.8 at 440 nm. The re-
suspension volume was calculated using Equation 2.1. This food stock was then used in
D. magna culture.
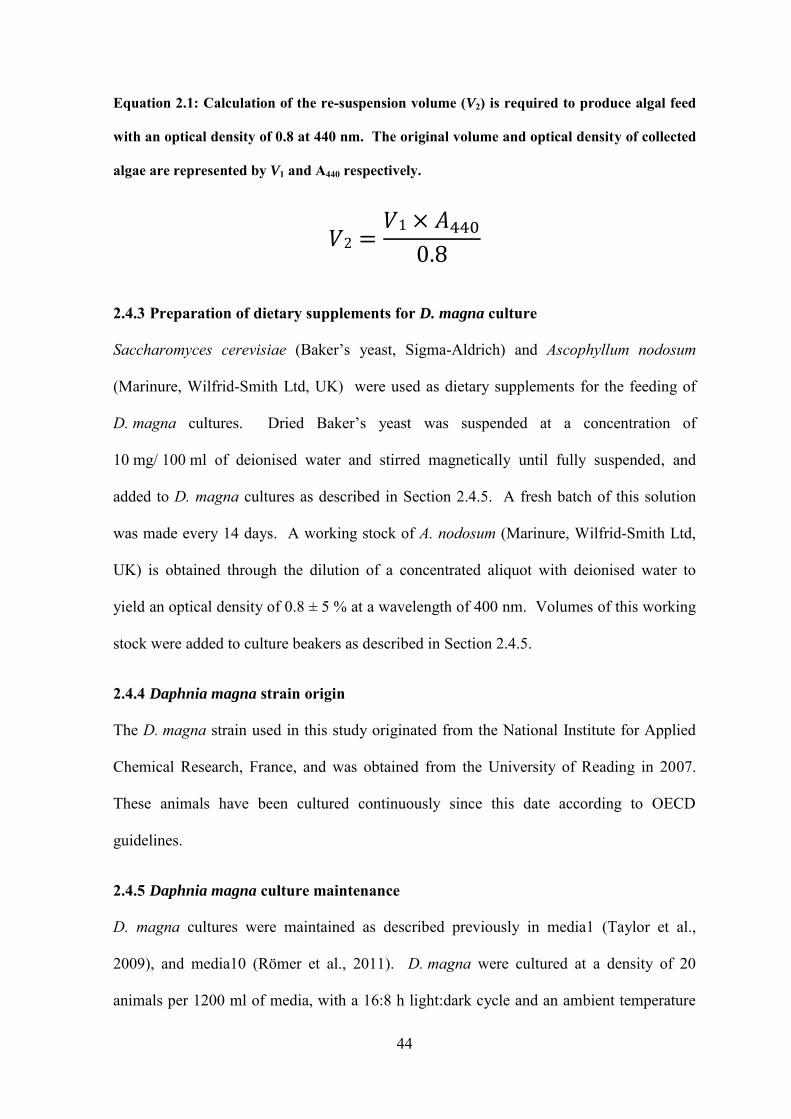
44
Equation 2.1: Calculation of the re-suspension volume (V2) is required to produce algal feed
with an optical density of 0.8 at 440 nm. The original volume and optical density of collected
algae are represented by V1 and A440 respectively.
𝑉2 =𝑉1 × 𝐴4400.8
2.4.3 Preparation of dietary supplements for D. magna culture
Saccharomyces cerevisiae (Baker’s yeast, Sigma-Aldrich) and Ascophyllum nodosum
(Marinure, Wilfrid-Smith Ltd, UK) were used as dietary supplements for the feeding of
D. magna cultures. Dried Baker’s yeast was suspended at a concentration of
10 mg/ 100 ml of deionised water and stirred magnetically until fully suspended, and
added to D. magna cultures as described in Section 2.4.5. A fresh batch of this solution
was made every 14 days. A working stock of A. nodosum (Marinure, Wilfrid-Smith Ltd,
UK) is obtained through the dilution of a concentrated aliquot with deionised water to
yield an optical density of 0.8 ± 5 % at a wavelength of 400 nm. Volumes of this working
stock were added to culture beakers as described in Section 2.4.5.
2.4.4 Daphnia magna strain origin
The D. magna strain used in this study originated from the National Institute for Applied
Chemical Research, France, and was obtained from the University of Reading in 2007.
These animals have been cultured continuously since this date according to OECD
guidelines.
2.4.5 Daphnia magna culture maintenance
D. magna cultures were maintained as described previously in media1 (Taylor et al.,
2009), and media10 (Römer et al., 2011). D. magna were cultured at a density of 20
animals per 1200 ml of media, with a 16:8 h light:dark cycle and an ambient temperature
45
of 19 °C. D. magna were fed daily with 0.5 ml baker’s yeast solution (Section 2.4.3), and
a set volume of the C. vulgaris food stock depending on the age of the organisms within
the culture. Animals aged between 0-2 d were fed 1 ml, 3-7 d daphnids were fed 1.5 ml,
and daphnids aged 8 d and older were fed 2 ml. Marinure (Section 2.4.3) was added upon
culture initiation and bi-weekly media change; 3 ml was added aged 1-7 d, and 4 ml for
daphnids aged 8 d and over. Cultures were maintained for 14 days allowing the
production of at least three broods of neonates before exposures were set up or colonies
restarted with < 24 h old neonates.
2.5 Daphnia magna toxicity exposure conditions
Before their neonates could be collected for use, animals were cultured for at least one full
generation (ca. 14 days) in the appropriate medium as outlined in section 2.4.5. D. magna
neonates (< 24 h) from at least the third reproductive brood of a culture were used in all
toxicity exposures described in this thesis. The concentration of all AgNP and AgNO3
exposure stocks was measured by ICP-MS prior to use in toxicity exposures. A spike-in
method was used for exposure; groups of D. magna neonates (<24 h) were added to
vessels (250 ml glass beaker, Fisher Scientific) containing between approximately 50%
and 80% of the total desired exposure volume. A pre-calculated volume of AgNP or
AgNO3 exposure stock was then used to spike the study medium followed immediately by
the remaining volume of exposure medium to mix. The exact volumes of medium and
exposure stock concentrations used in each exposure, as well as exposure durations, are
reported in greater detail in the respective chapters of this thesis. Once prepared, exposure
vessels were kept at 19 ± 1 °C and on a 16h:8h light:dark cycle with no additional
administration of food or supplements. Tests were only considered valid if no more than
10% of control animals were immobilised during the exposure.
46
Chapter 3: Optimisation of aqueous nanoparticle toxicity exposure
conditions and characterisation of AgNPs*
3.1 Introduction
One of the major setbacks of many published nanoparticle toxicology studies is improper
characterisation of the particles or experimental conditions that are used. As stated earlier,
the unique effects of the nano-scale are directly related to the area of the particles’ surface
available for interaction (Section 1.1). The composition of the medium in which
nanoparticles are dispersed can impact their stability; either allowing for an even dispersal
or the formation of particle aggregates (Badawy et al., 2010; Römer et al., 2011; Tejamaya
et al., 2012). According to Derjaguin, Landau, Verwey, and Overbeek (DLVO) theory, the
colloidal stability of nanoparticles in solution is dictated by the balance between attractive
forces such as van der Waal’s (VDW), which promote aggregation, and electrostatic
repulsion forces which oppose aggregation (Badawy et al., 2010). In high purity water and
at neutral pH two particles of the same type in suspension will have the same surface
charge and will therefore repel one another. This electrostatic repulsion will prevent the
two particles from getting close enough for VDW forces to promote aggregation. The
dispersion of particles within an aqueous medium can be impacted by the ionic strength
and the pH of the medium (Stebounova et al., 2011). Free-ions present in the aqueous
medium such as Ca2+, Cl-, H+ and OH-, will be attracted to disperse particles if they are of
the opposing charge to the particle’s surface. Interactions between these ions within the
medium and dispersed particles may result in a shielding of the particle’s surface charge.
This reduces the level of electrostatic repulsion between colloidal particles allowing for
* Contents of this chapter, including the figures, have been published in Toxicology Letters: Römer, I., Gavin, A. J., White, T. A., Merrifield, R. C., Chipman, J. K., Viant, M. R., & Lead, J. R. (2013). The critical importance of defined media conditions in Daphnia magna nanotoxicity studies. Toxicology letters, 223(1), 103-108.
47
VDW forces to induce formation of particle aggregates. To reduce the likelihood of
aggregation, particles are often coated in substances which either increase the electrostatic
repulsion between particles, such as citrate or that prevent VDW interactions through steric
hindrance of particle interactions such as polyvinylpyrrolidone (PVP) (Christian et al.,
2008).
When particles are aggregated, the quantity of surface area available for interaction is
reduced, potentially suppressing toxicity (Jiang et al., 2008). The bioavailaility of
aggregates is also seen to be less than dispersed particles, as large aggregates are more
likely to be deposited in sediments removing them from the water column (Bradford et al.,
2009). If we are to account for any potential impact that aggregation may have on AgNP
toxicity, particle stability must be fully characterised in the appropriate exposure
conditions. It has been shown previously that AgNPs stabilised with various capping
agents (citrate, PVP and PEG) form aggregates in standard OECD ISO test media
(media1) for D. magna acute toxicity tests (Römer et al., 2011; Tejamaya et al., 2012). By
diluting the standard media 10-fold, aggregation is reduced substantially without inducing
immobilisation or a significant reduction in daphnid reproductive output (Römer et al.,
2011). What has not yet been observed is whether the aggregation induced by media
composition has a significant impact upon the results of a D. magna acute immobilisation
test.
The primary aim of this chapter is to assess the impact that dilution of standard exposure
media, and hence particle stability, has on acute nanoparticle toxicity. To that end, the
dose-response relationships of cit-AgNPs and a non-nanoparticle control (AgNO3) were
characterised in standard strength OECD ISO test water (media1) and a 10-fold dilution of
this medium (media10). To investigate the potential role of particle stability in any
observed effect, stability assessed in media1, and a two-fold (media2) and ten-fold
48
(media10) dilution of media1 using AFM and TEM. The results of this and previous
studies determined the optimum combination of exposure medium and AgNPs that yield
dispersed particles.
To study the molecular level changes that occur in response to AgNP exposure, the use of
exposure concentrations which do not induce organism death are required. The large
number of transcriptional and metabolic changes associated with death may mask the more
subtle changes associated purely with adaptive responses to toxicant exposure. To
accurately select an appropriate concentration for omics exposures, the full dose-response
relationship of both toxicants must be characterised. As stated above (Section 1.2.3), the
mechanism of AgNP toxicity is widely thought to be mediated by Ag+ ions which are
released from the particles’ surface. It is therefore imperative to control for the dissolved
Ag+ component of nanoparticle exposures if we are to attempt to elucidate its role in AgNP
toxicity (Allen et al., 2010; Kennedy et al., 2010; Zhao and Wang, 2012a). Therefore the
secondary aim of this chapter was to characterise the full dose-response relationship of
both the AgNPs and Ag+ ions in the optimum test media, and to assess the amount of Ag+
released from AgNPs over the standard exposure period. This enables the calculation of
EC50 values for each toxicant and an accurate selection of sub-lethal exposure
concentrations. Through use of ultracentrifugation (UC) and ultrafiltration (UF) followed
by inductively coupled plasma mass spectrometry (ICP-MS), the release of Ag+ from
AgNPs in the selected exposure conditions can be assessed.
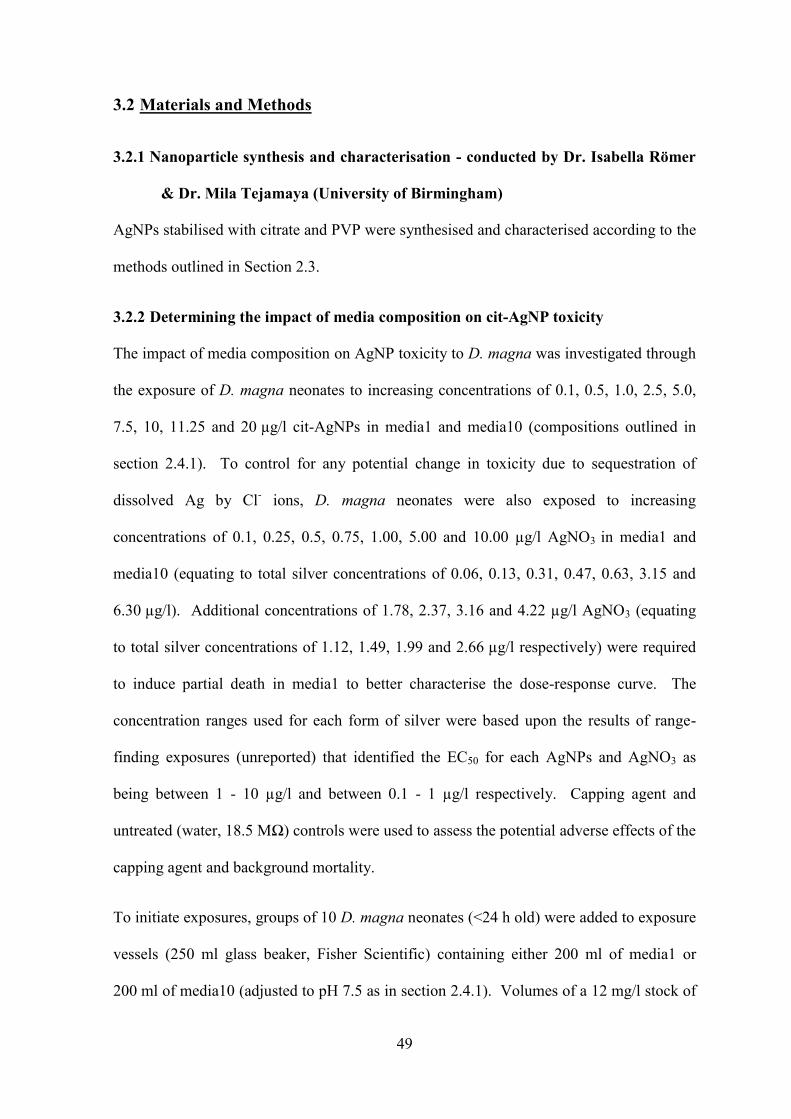
49
3.2 Materials and Methods
3.2.1 Nanoparticle synthesis and characterisation - conducted by Dr. Isabella Römer
& Dr. Mila Tejamaya (University of Birmingham)
AgNPs stabilised with citrate and PVP were synthesised and characterised according to the
methods outlined in Section 2.3.
3.2.2 Determining the impact of media composition on cit-AgNP toxicity
The impact of media composition on AgNP toxicity to D. magna was investigated through
the exposure of D. magna neonates to increasing concentrations of 0.1, 0.5, 1.0, 2.5, 5.0,
7.5, 10, 11.25 and 20 µg/l cit-AgNPs in media1 and media10 (compositions outlined in
section 2.4.1). To control for any potential change in toxicity due to sequestration of
dissolved Ag by Cl- ions, D. magna neonates were also exposed to increasing
concentrations of 0.1, 0.25, 0.5, 0.75, 1.00, 5.00 and 10.00 µg/l AgNO3 in media1 and
media10 (equating to total silver concentrations of 0.06, 0.13, 0.31, 0.47, 0.63, 3.15 and
6.30 µg/l). Additional concentrations of 1.78, 2.37, 3.16 and 4.22 µg/l AgNO3 (equating
to total silver concentrations of 1.12, 1.49, 1.99 and 2.66 µg/l respectively) were required
to induce partial death in media1 to better characterise the dose-response curve. The
concentration ranges used for each form of silver were based upon the results of range-
finding exposures (unreported) that identified the EC50 for each AgNPs and AgNO3 as
being between 1 - 10 µg/l and between 0.1 - 1 µg/l respectively. Capping agent and
untreated (water, 18.5 MΩ) controls were used to assess the potential adverse effects of the
capping agent and background mortality.
To initiate exposures, groups of 10 D. magna neonates (<24 h old) were added to exposure
vessels (250 ml glass beaker, Fisher Scientific) containing either 200 ml of media1 or
200 ml of media10 (adjusted to pH 7.5 as in section 2.4.1). Volumes of a 12 mg/l stock of

50
cit-AgNP (prepared and concentration measured as in Sections 2.3 and 2.3.3 respectively)
were added, in groups of 3 replicates per media composition, to prepare each of the nine
nominal cit-AgNP exposure concentrations. An analogous protocol was used with a
1.79 mg/l stock of AgNO3 to prepare each of the 7 and 11 intended exposure
concentrations in media 10 and media1 respectively. Once spiked, an additional 50 ml of
appropriate media was added to each vessel to mix. The exact volumes used in the
production of these control groups and nominal exposure concentrations are outlined in
Table 3.1. Exposure conditions were otherwise as outlined in section 2.5.
Animals were exposed for 24 h after which the total number of dead or immobilised
neonates was counted. Immobilisation is defined by the OECD, as “those animals not able
to swim within 15 seconds after gentle agitation of the test container” (OECD, 2004).
EC50s were calculated using the logistic analysis algorithms in Prism6 statistical analysis
software (version 6.03, GraphPad Software Inc., California). Briefly, the mean %
immobilisation (± SEM) values were calculated from the raw data and plotted against their
respective log10-transformed nominal concentration values using a sigmoidal (four-
parametric logistic) curve with lower and upper constraints of 0 and 100 % respectively.
Where possible the resulting EC50 values were compared between exposures in media1
and media10 for each toxicant by a sum-of-squares F-test in Prism6.
51
Table 3.1: Spiking volumes of a 1.79 mg/l AgNO3 stock needed to make the desired exposure
concentrations upon addition to a total volume of 250 ml media1 or media10
Desired Exposure conc. (µg/l)
Spike volume (µl)
0.10 14
0.25 35
0.50 70
0.75 105
1.00 140
1.78 249
2.37 331
3.16 441
4.22 589
5.00 698
10.00 1397
Table 3.2: Spiking volumes of a 12.0 mg/l AgNP stock needed to make the desired exposure
concentrations upon addition to a total volume of 250 ml media1 or media10
Desired Exposure conc. (µg/l)
Spike volume (µl)
0.10 2
0.50 10
1.00 21
2.50 52
5.00 104
7.50 156
10.00 208
11.25 234
20.00 417
52
3.2.3 Determining the impact of media composition on cit-AgNP stability
In parallel to the toxicity assessment of cit-AgNPs described above (section 3.2.2) the
impact of media composition (outlined for all media types in Table 2.1) on particle
stability was assessed through TEM and AFM measurement of particle size distributions
and TEM measurement of particle circularity. To assess stability, 46 ml aliquots (n=3 per
media type) of a 12 mg/l stock solution of cit-AgNPs were added to 250 ml of media1, as
well as media2 and media10, to a final concentration of 2.2 mg/l. The final pH of
solutions was adjusted to 7.5 through addition of 1 M HNO3 or NaOH to lower or raise the
pH respectively. Suspensions were maintained at room temperature for 24 h to match the
duration of an acute toxicity exposure before imaging with TEM and AFM.
These suspensions of AgNPs were then prepared for TEM analysis by using the “drop
method” as outlined previously (Domingos et al., 2009; Römer et al., 2013). Briefly, a
single droplet of AgNP suspension was partially dried at room temperature on a carbon-
coated copper mesh (Agar Scientific). Once dry, samples were washed with ultrapure
water (18.2 MΩ) and images were obtained with a transmission electron microscope
(Tecnai F20, Phillips, Netherlands), and recorded and analysed using digital micrograph
software (Gatan, Abingdon, UK) to measure size distribution and Image J to measure
particle circularity. Circularity is defined as the ratio of a particle’s area to its perimeter
(Stevenson et al., 2012), and ranges from 0 (elongated or irregular shape) to 1 (circular
shape). Where possible, mean circularity values as well as mean particle size distributions
were compared between particle suspensions in each media composition by a 1-way
ANOVA followed by a Tukey post-hoc test for multiple comparisons.
Samples for AFM measurements were prepared by ultracentrifugation. Briefly, 10 ml
aliquots of AgNP suspensions were transferred into ultracentrifuge tubes containing a
cleaved mica sheet on a flat polytetrafluoroethylene support. Samples were then ultra-
53
centrifuged (Beckman L7-65 Ultracentrifuge with SW40 swinging bucket rotor) at 10,000
rpm, for 60 minutes at 15°C. After centrifugation, the tubes were emptied, the PTFE
supports removed and the mica sheets washed in high purity water (18.2 MΩ) and dried at
ambient conditions prior to AFM analysis. Images were obtained with an AFM (XE 100,
Park Systems) in non-contact mode, as described previously (Römer et al., 2013). Non-
contact mode silicon AFM Cantilevers PPP-NCHR were used (spring constant 42 N m−1),
X–Y scan sizes were 5 µm × 5 µm with resolution of 250 pixels per line. Scanning rates
were optimised to acquire a stable and clear image without damaging the tip or detaching
particles during scanning, usually 0.3–1 Hz. Images were recorded using XEP data
acquisition software and analysed with XEI data analysis software (Park systems). Where
possible, mean particle size distributions were compared between particle suspensions in
each media composition by a 1-way ANOVA followed by a Tukey post-hoc test for
multiple comparisons. Both TEM and AFM analysis were done in equal collaboration
with Dr Isabella Romer (University of Birmingham).
3.2.4 Full characterisation of dose-response curves of PVP-AgNPs and dissolved Ag
(from AgNO3) to D. magna neonates in media10
Initial range-finding exposures (not reported) in media10 identified the EC50 for each form
of Ag as being between 1 and 10 µg/l for AgNPs and between 0.1 and 1 µg/l of total Ag
for AgNO3. Following these range-finding exposures, nominal exposure concentrations of
3.08, 3.54, 4.07, 4.70, 6.29, 8.38, 9.69, and 11.17 μg/l of PVP-AgNPs and 0.10, 0.18, 0.32,
0.56, 0.75, 1.00 and 1.78 µg/l of AgNO3 (equating to 0.07, 0.12, 0.20, 0.37, 0.41, 0.62 and
1.07 μg/l theoretical total Ag) were assembled to map the dose-response relationship for
each form of Ag. Capping agent (0.03 % v/v. PVP) and no-added silver controls were
used to account for any potential impact of the nanoparticle capping agent and background
mortality respectively.
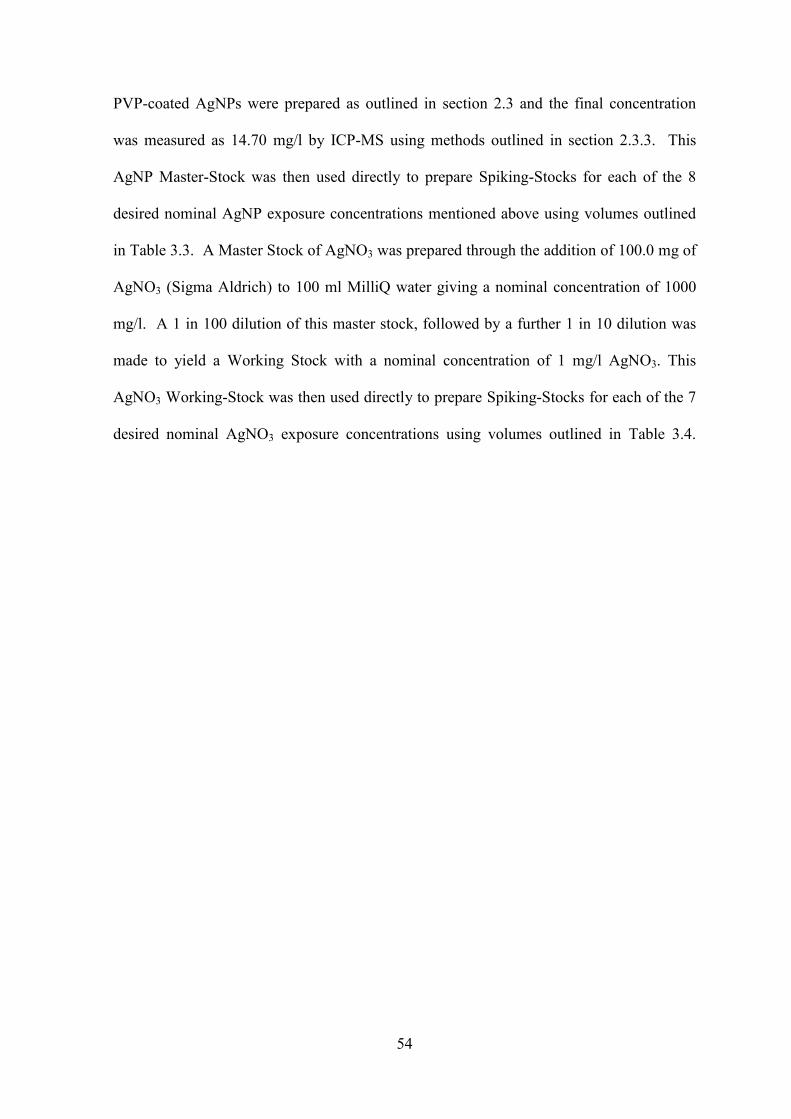
54
PVP-coated AgNPs were prepared as outlined in section 2.3 and the final concentration
was measured as 14.70 mg/l by ICP-MS using methods outlined in section 2.3.3. This
AgNP Master-Stock was then used directly to prepare Spiking-Stocks for each of the 8
desired nominal AgNP exposure concentrations mentioned above using volumes outlined
in Table 3.3. A Master Stock of AgNO3 was prepared through the addition of 100.0 mg of
AgNO3 (Sigma Aldrich) to 100 ml MilliQ water giving a nominal concentration of 1000
mg/l. A 1 in 100 dilution of this master stock, followed by a further 1 in 10 dilution was
made to yield a Working Stock with a nominal concentration of 1 mg/l AgNO3. This
AgNO3 Working-Stock was then used directly to prepare Spiking-Stocks for each of the 7
desired nominal AgNO3 exposure concentrations using volumes outlined in Table 3.4.
55
Table 3.3: Preparation of the AgNP spiking stocks from the 14.7 mg/l master stock. The
table gives the volumes of the 14.7 mg/l AgNP master stock used to prepare each of the
spiking stocks. Each spiking stock was designed to be 250 times more concentrated than the
desired exposure concentration.
Nominal conc. of AgNP (µg/l)
Desired exposure conc.
Spiking stock conc.
Volume of 14.7 mg/l Master stock (µl)
3.08 769 52
3.54 884 60
4.07 1016 69
4.70 1176 80
6.29 1573 107
8.38 2095 143
9.69 2422 165
11.17 2793 190
Table 3.4: Preparation of the AgNO3 spiking stocks from the 1 mg/l working stock. The table
gives the volumes of working stock used to prepare each spiking stock in a total volume of 10
ml. Each spiking stock was designed to be 250 times more concentrated than the desired
exposure concentration.
Nominal conc. of AgNO3 (µg/l)
Desired exposure conc.
Spiking stock conc.
Volume of 1.0 mg/l Working stock (ml)
0.10 25 0.25
0.18 45 0.45
0.32 80 0.80
0.56 140 1.40
0.75 188 1.88
1.00 250 2.50
1.78 445 4.45
56
To initiate toxicant exposures, groups of 10 neonates (<24 h old) were added using a
plastic Pasteur pipette to 200 ml of media10 in 72 x 250 ml glass beakers. In groups of
four, these vessels were spiked with 1 ml of a Spiking-Stock immediately followed by a
further 49 ml of media10 to mix. This produced the 8 desired AgNP concentrations along
with the 7 desired AgNO3 concentrations complete with one PVP control and two no-
added silver control groups. Exposure conditions were otherwise as outlined in section 2.5.
Animals were exposed for 48 h in total, with the number of dead or immobilised neonates
counted after 24 h and 48 h. Immobilisation is defined by the OECD, as “those animals
not able to swim within 15 seconds after gentle agitation of the test container” (OECD,
2004). EC50s were calculated using the logistic analysis algorithms in Prism6 statistical
analysis software (version 6.03, GraphPad Software Inc., California). Briefly, the mean %
immobilisation (± SEM) values were calculated from the raw data for each group and
plotted against their respective log10-transformed nominal total Ag concentrations using a
sigmoidal (four-parametric logistic) curve using lower and upper constraints of 0 and
100 % respectively. The resulting EC50 values of PVP-AgNPs and AgNO3 were compared
at each time point by a sum of squares F-test in Prism6.
3.2.5 Measurement of PVP-AgNP dissolution in media10
Three individual suspensions of PVP-AgNPs were made through the addition of 140 µl
from a 8.839 mg/l stock solution (approximately 8 mg/l) in triplicate to 200 ml of
media10. The final volume was made up to 250 ml to mix yielding a final nominal AgNP
concentration of approximately 5 µg/l. No daphnids were present during the 48 h period.
Kept alongside the three nanoparticle suspensions were three control beakers consisting of
250 ml of media10 and no additional nanoparticles. The separation of the nanoparticle and
ionic fractions of PVP-AgNP suspensions was attempted using ultacentrifugation (UC)
57
and ultrafiltration (UF) prior to measurement of their respective concentrations by ICP-MS
(section 3.2.8).
3.2.6 Assessment of particle dissolution by ultracentrifugation
Aliquots (5 ml) of the PVP-AgNP suspensions and control samples were removed at 0, 24
and 48 h after particle dispersal into UC tubes (14 ml, Ultra-Clear, Beckman Coulter,
USA). These aliquots were then made up to a total volume of 10 ml with ultrapure water
(18.2 MΩ, Purelab), and vortex mixed before centrifugation at 30000 rpm for 1 h at 10 °C
in a (L7-65 ultracentrifuge using a SW 40 swinging-bucket rotor, Beckman Coulter, USA).
In theory, ultracentrifugation of AgNP suspensions should result in the concentration of
AgNPs at the bottom of the test tube, while any dissolved Ag should remain in solution
dispersed evenly throughout the solution. Following UC separation, 4.9 ml of solution
was removed from the top of each sample. This 4.9 ml top aliquot, along with the
remaining 5.1 ml bottom aliquot for each sample, was subsequently acidified by the
addition of 2.0 ml and 1.8 ml concentrated (69 % v/v) nitric acid (HNO3, trace metal
grade, Fisher Scientific) respectively. The acidification of samples to 20 % HNO3
followed by vortex mixing until colourless ensured the total Ag content of each sample
was fully dissolved ready for analysis.
3.2.7 Assessment of particle dissolution by ultrafiltration
Triplicate aliquots (10 ml) of the 5 μg/l PVP-AgNP dilutions were taken at 0, 24 and 48 h
after particle dispersal and transferred directly into separate UF cells (10 ml, Millipore
UK). Each cell was fitted with a 1 kDa NMWL filter with a 2nm pore (25 mm, Ultracel
regenerated cellulose) and a magnetic stir-bar. Cells were pressurised with nitrogen gas
(N2, 1 bar) for approximately 1 h, with constant stirring, until the volume of solution had
reduced by half. The 2 nm pore filter used in this study should trap AgNPs (which are
10.8 ± 3.3 nm in diameter) inside the ultrafiltration cell allowing only water and dissolved
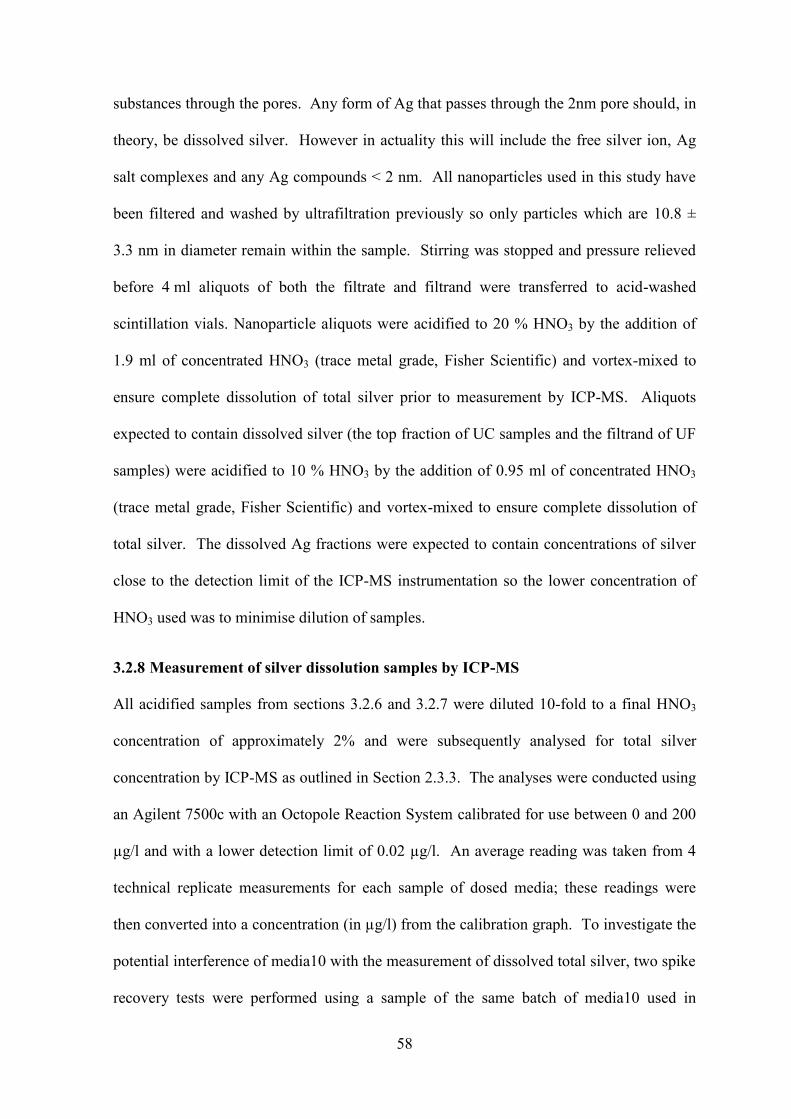
58
substances through the pores. Any form of Ag that passes through the 2nm pore should, in
theory, be dissolved silver. However in actuality this will include the free silver ion, Ag
salt complexes and any Ag compounds < 2 nm. All nanoparticles used in this study have
been filtered and washed by ultrafiltration previously so only particles which are 10.8 ±
3.3 nm in diameter remain within the sample. Stirring was stopped and pressure relieved
before 4 ml aliquots of both the filtrate and filtrand were transferred to acid-washed
scintillation vials. Nanoparticle aliquots were acidified to 20 % HNO3 by the addition of
1.9 ml of concentrated HNO3 (trace metal grade, Fisher Scientific) and vortex-mixed to
ensure complete dissolution of total silver prior to measurement by ICP-MS. Aliquots
expected to contain dissolved silver (the top fraction of UC samples and the filtrand of UF
samples) were acidified to 10 % HNO3 by the addition of 0.95 ml of concentrated HNO3
(trace metal grade, Fisher Scientific) and vortex-mixed to ensure complete dissolution of
total silver. The dissolved Ag fractions were expected to contain concentrations of silver
close to the detection limit of the ICP-MS instrumentation so the lower concentration of
HNO3 used was to minimise dilution of samples.
3.2.8 Measurement of silver dissolution samples by ICP-MS
All acidified samples from sections 3.2.6 and 3.2.7 were diluted 10-fold to a final HNO3
concentration of approximately 2% and were subsequently analysed for total silver
concentration by ICP-MS as outlined in Section 2.3.3. The analyses were conducted using
an Agilent 7500c with an Octopole Reaction System calibrated for use between 0 and 200
µg/l and with a lower detection limit of 0.02 µg/l. An average reading was taken from 4
technical replicate measurements for each sample of dosed media; these readings were
then converted into a concentration (in µg/l) from the calibration graph. To investigate the
potential interference of media10 with the measurement of dissolved total silver, two spike
recovery tests were performed using a sample of the same batch of media10 used in
59
exposures. The first test using a final spike concentration of 1 ppb gave a return reading of
1.02 ppb and the second using a final concentration of 10 ppb gave a return reading of
10.03 ppb, indicating that the media component had no impact on the measurements. All
submitted control samples resulted in a total silver content below the limit of detection
signifying the background Ag content of exposures to be, at the very least, <0.02 µg/l.
ICP-MS measurements were conducted by Dr Steve Baker (University of Birmingham).
The concentration of dissolved silver in the exposure vessels at 0 h, 24 h and 48 h was
calculated using Equation 3.1. Briefly, the concentration of total silver measured in the top
fraction of UC samples or the filtrate of UF samples [Ag]dm was multiplied by the total
factor of dilution (D) that occurred during sample preparation (14.75 fold dilution in total).
Theoretically, as described above (sections 3.2.6 and 3.2.7), these fractions should contain
only dissolved Ag species and as such should be representative of the total dissolved silver
fraction of exposures once dilutions during preparation are taken into account. The
concentration of the AgNP fraction is calculated using Equation 3.2. The total silver
concentration of the lower UC fraction and UF filtrand should theoretically contain both
dissolved and concentrated nanoparticle silver. As such is representative of the total silver
concentration of the media once dilutions during preparation and concentration of AgNP
fraction has been taken into account. The initial concentration of AgNPs [Ag]NP is
therefore calculated through the multiplication of the measured total silver fraction [Ag]tm
by the dilution factor (D) of sample preparation. This resulting figure then has the [Ag]ds
value calculated earlier subtracted from it before dividing the result by the concentration
factor (C); the factor by which the nanoparticles have become concentrated from the
original aliquot. The mean total Ag concentrations measured following UC and UF
separation are given in the Appendix (Table 9.1 and Table 9.2 respectively).

60
The percentage dissolution was then calculated by dividing the concentration of the
dissolved Ag fraction [Ag]d by the total silver concentration of the exposure media
([Ag]NP+[Ag]I) and multiplying the resulting fraction by 100 (Equation 3.3). The resulting
data were compared for each technique across treatment type and dissolution duration by a
2-way ANOVA followed by a Sidak’s comparison test.
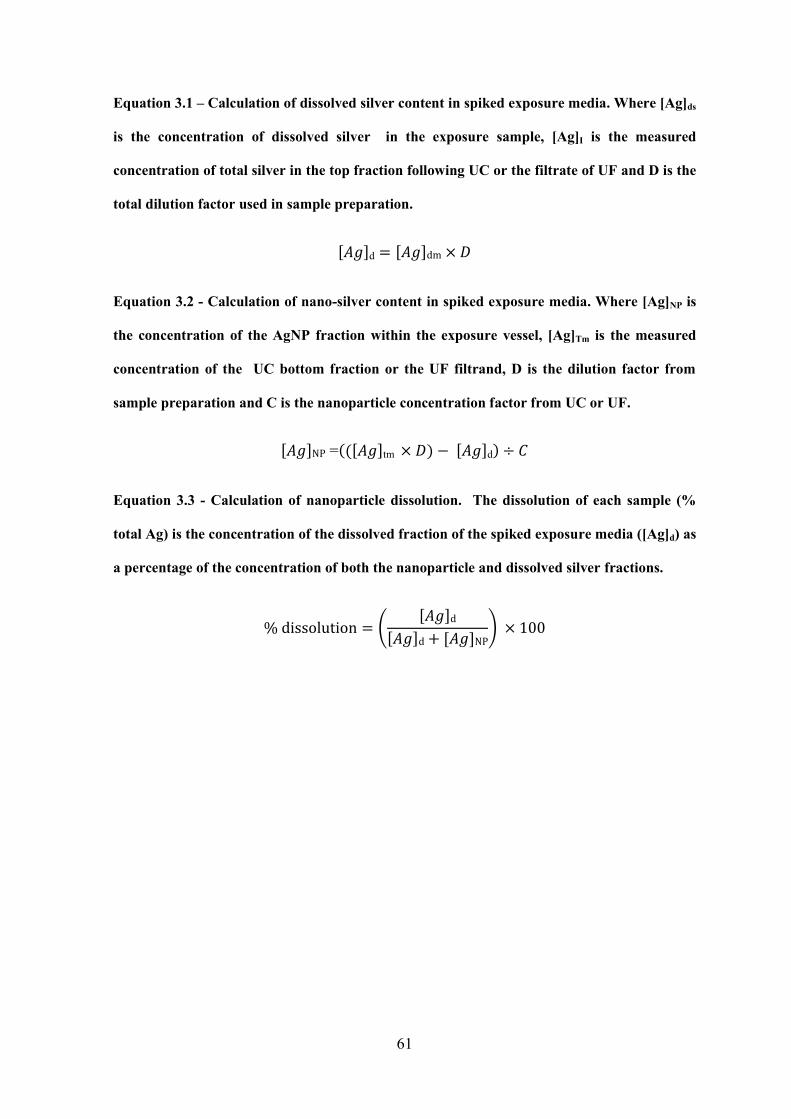
61
Equation 3.1 – Calculation of dissolved silver content in spiked exposure media. Where [Ag]ds
is the concentration of dissolved silver in the exposure sample, [Ag]I is the measured
concentration of total silver in the top fraction following UC or the filtrate of UF and D is the
total dilution factor used in sample preparation.
[𝐴𝑔]d = [𝐴𝑔]dm × 𝐷
Equation 3.2 - Calculation of nano-silver content in spiked exposure media. Where [Ag]NP is
the concentration of the AgNP fraction within the exposure vessel, [Ag]Tm is the measured
concentration of the UC bottom fraction or the UF filtrand, D is the dilution factor from
sample preparation and C is the nanoparticle concentration factor from UC or UF.
[𝐴𝑔]NP =(([𝐴𝑔]tm × 𝐷) − [𝐴𝑔]d) ÷ 𝐶
Equation 3.3 - Calculation of nanoparticle dissolution. The dissolution of each sample (%
total Ag) is the concentration of the dissolved fraction of the spiked exposure media ([Ag]d) as
a percentage of the concentration of both the nanoparticle and dissolved silver fractions.
% dissolution = ([𝐴𝑔]d
[𝐴𝑔]d+ [𝐴𝑔]NP) × 100

62
3.3 Results and Discussion
3.3.1 Importance of media composition in nanoparticle toxicity testing
The potential impact of the concentration of D. magna culture media on cit-AgNP acute
immobilisation exposures was assessed in media1 and media10. Groups of D. magna
neonates were exposed to increasing concentrations of cit-AgNPs, as well as Ag+ ions to
control for any non-nanoparticle specific effects in media1 and media10 only. Under all
conditions, immobilisation followed a concentration-dependent pattern with an absence of
adverse effect in both the negative and capping agent controls. For cit-AgNPs in media10 a
lowest observed adverse effect concentration (LOAEC) of 2.5 μg/l was observed, with
total immobilisation occurring at 10 μg/l (Figure 3.1). The corresponding LOAEC in
media1 was 11.25 μg/l and, despite an increased exposure range of up to 20 μg/l, complete
immobilisation was not achieved (Figure 3.1). The EC50 for AgNPs was calculated as
7.70 μg/l in media10 and nominally stated as being 20.00 μg/l in media1. Due to the
incomplete dose-response curve in media1, a comparison by sum of squares F-test was not
possible. However, in media1 the lowest observed effect is induced at a concentration
shown to cause total immobilisation in media10. The non-nanoparticle control exposures
of AgNO3 in media10 began inducing immobilisation from 0.31 µg/l until total
immobilisation was observed at 3.15 µg/l. In media1, immobilisation was induced between
0.63 and 1.12 µg/l until total immobilisation was observed at 1.49 µg/l. Through use of the
logistic approach EC50s were calculated as being 0.61 µg/l in media10 and 1.10 in media1.
These two EC50s were deemed as not being significantly different through use of a sum-of-
squares F-test, nevertheless the EC50 of AgNO3 in media1 is greater than in media10.
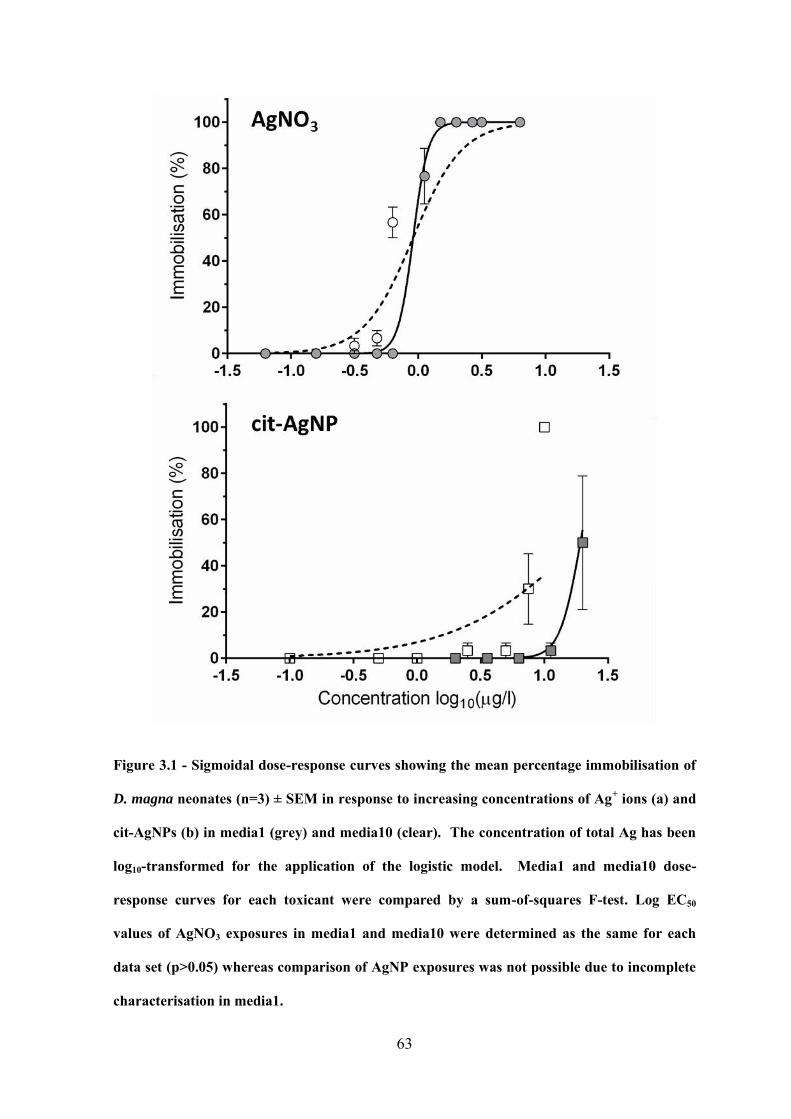
63
Figure 3.1 - Sigmoidal dose-response curves showing the mean percentage immobilisation of
D. magna neonates (n=3) ± SEM in response to increasing concentrations of Ag+ ions (a) and
cit-AgNPs (b) in media1 (grey) and media10 (clear). The concentration of total Ag has been
log10-transformed for the application of the logistic model. Media1 and media10 dose-
response curves for each toxicant were compared by a sum-of-squares F-test. Log EC50
values of AgNO3 exposures in media1 and media10 were determined as the same for each
data set (p>0.05) whereas comparison of AgNP exposures was not possible due to incomplete
characterisation in media1.
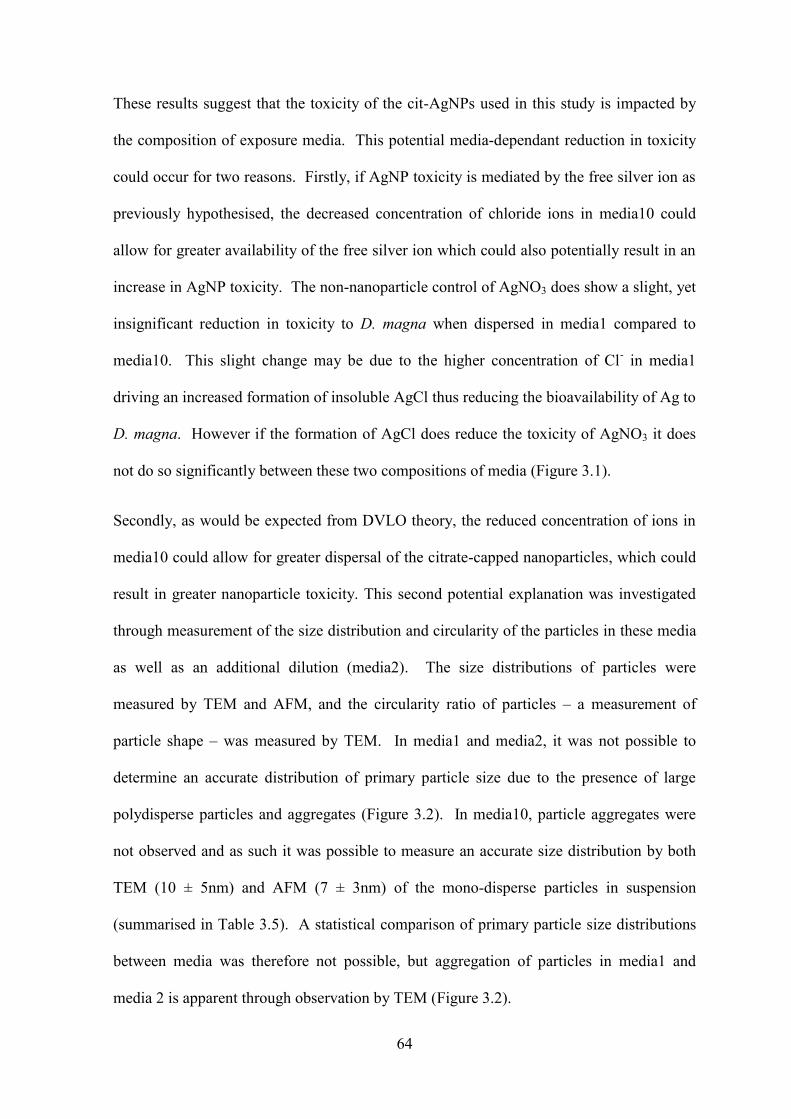
64
These results suggest that the toxicity of the cit-AgNPs used in this study is impacted by
the composition of exposure media. This potential media-dependant reduction in toxicity
could occur for two reasons. Firstly, if AgNP toxicity is mediated by the free silver ion as
previously hypothesised, the decreased concentration of chloride ions in media10 could
allow for greater availability of the free silver ion which could also potentially result in an
increase in AgNP toxicity. The non-nanoparticle control of AgNO3 does show a slight, yet
insignificant reduction in toxicity to D. magna when dispersed in media1 compared to
media10. This slight change may be due to the higher concentration of Cl- in media1
driving an increased formation of insoluble AgCl thus reducing the bioavailability of Ag to
D. magna. However if the formation of AgCl does reduce the toxicity of AgNO3 it does
not do so significantly between these two compositions of media (Figure 3.1).
Secondly, as would be expected from DVLO theory, the reduced concentration of ions in
media10 could allow for greater dispersal of the citrate-capped nanoparticles, which could
result in greater nanoparticle toxicity. This second potential explanation was investigated
through measurement of the size distribution and circularity of the particles in these media
as well as an additional dilution (media2). The size distributions of particles were
measured by TEM and AFM, and the circularity ratio of particles – a measurement of
particle shape – was measured by TEM. In media1 and media2, it was not possible to
determine an accurate distribution of primary particle size due to the presence of large
polydisperse particles and aggregates (Figure 3.2). In media10, particle aggregates were
not observed and as such it was possible to measure an accurate size distribution by both
TEM (10 ± 5nm) and AFM (7 ± 3nm) of the mono-disperse particles in suspension
(summarised in Table 3.5). A statistical comparison of primary particle size distributions
between media was therefore not possible, but aggregation of particles in media1 and
media 2 is apparent through observation by TEM (Figure 3.2).
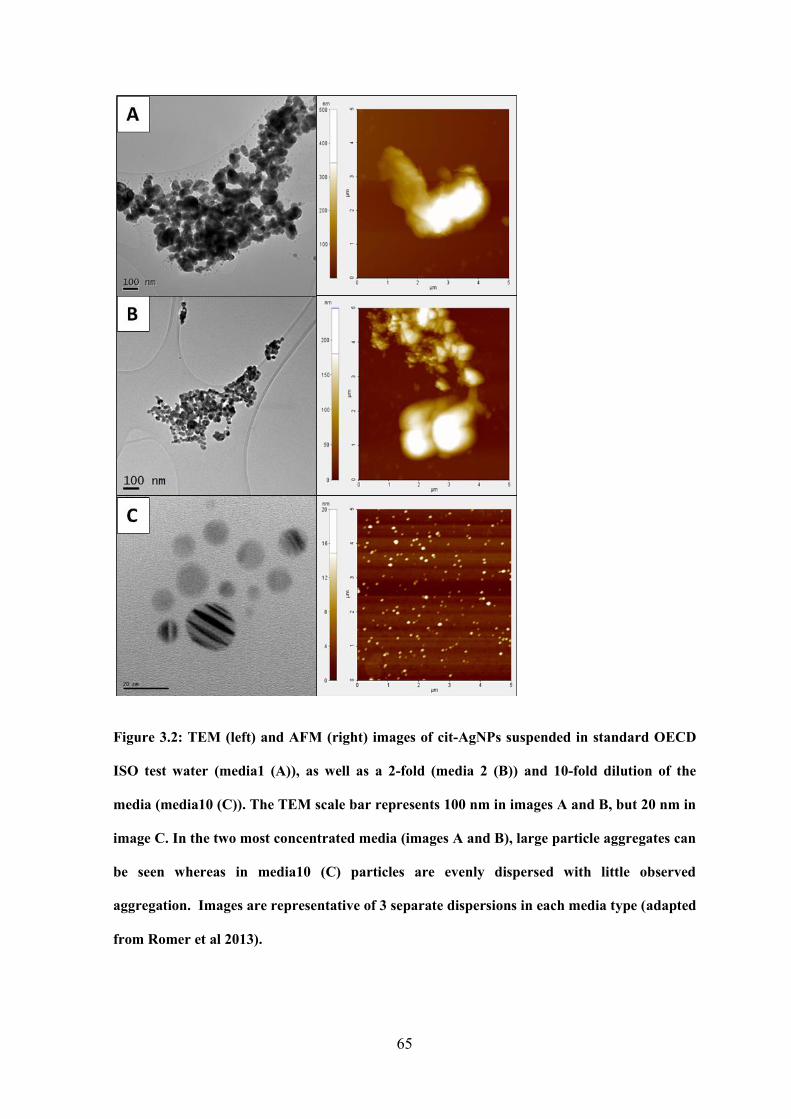
65
Figure 3.2: TEM (left) and AFM (right) images of cit-AgNPs suspended in standard OECD
ISO test water (media1 (A)), as well as a 2-fold (media 2 (B)) and 10-fold dilution of the
media (media10 (C)). The TEM scale bar represents 100 nm in images A and B, but 20 nm in
image C. In the two most concentrated media (images A and B), large particle aggregates can
be seen whereas in media10 (C) particles are evenly dispersed with little observed
aggregation. Images are representative of 3 separate dispersions in each media type (adapted
from Romer et al 2013).
66
Table 3.5 - The size-ranges (nm) of single particles, particle aggregates and circularity ratios of cit-AgNPs suspended in media1, media2 and
media10 as measured by TEM and AFM. The mean particle size measurements are calculated from a minimum of 100 observations across 3
replicate dispersions in each media type. Accurate particle size distributions could not be made in media1 or media2 due to the presence of large
polydisperse aggregates. In these cases the approximate range of single particle sizes is included. Table adapted from Romer et al., 2013. A 1-
way ANOVA indicated the circularity of particles in media1 and media2 were not significantly different (p=0.9388), but that particle circularity
of particles in media 10 were significantly different compared to in media1 and media 2 (p<0.001 in both cases).
Measurement Range of aggregate
sizes TEM (nm) Single particle size
TEM (nm) Single particle size
AFM (nm) Circularity (from
TEM)
Media1 50 - 3300 2 - 40 N/A 0.28 ± 0.13 Media2 60 - 1100 3 - 60 N/A 0.25 ± 0.12
Media10 N/A 10 ± 5 7 ± 3 0.95 ± 0.06
67
The circularity ratios obtained for media1 and media2 were 0.28 ± 0.13 and 0.25 ± 0.12
respectively (Table 3.5) suggesting the presence of irregular-shaped particle aggregates
(Stevenson et al., 2012). Values for circularity of cit-AgNP suspension in media10 were
much closer to 1 (0.95 ± 0.06) suggesting the presence of circular structures which were
confirmed as disperse particles by TEM (Figure 3.2). Following a 1-way ANOVA and
Tukey post-hoc test, the circularity of particles suspended in media1 and media2 were not
shown to be significantly different (p=0.9388). Conversely, circularity of cit-AgNPs
suspended in media 10 were seen to be significantly different to suspensions in both
media1 and media2 (p<0.001).
These results suggest that dilution of media1 to media10 has resulted in reduced
aggregation of cit-AgNPs and increased particle dispersion and stability. This results
corresponds with data published previously where these same particles were measured in
media1, media2 and media10 using DLS and Fl-FFF (Römer et al., 2011). This increased
stability could be a result of the reduced overall ionic strength of the media. It has been
previously noted that the overall concentrations of salts within exposure media can affect
the stability of AgNPs (Badawy et al., 2010) and induce the formation of aggregates
(Römer et al., 2011; Tejamaya et al., 2012). Likewise this increased stability could be the
result of a reduction in any of the individual ions that are present in the media. It has been
shown, for example, that millimolar concentrations of Ca have been shown to induce
aggregation of AgNPs (Badawy et al., 2010; Piccapietra et al., 2012; Behra et al., 2013).
The nominal concentration of CaCl2 in media1 is 2mM compared to 0.2 mM in media10
which could explain the decreased aggregation of AgNPs.
When the cit-AgNP stability data in media1 and media 10 are coupled with the
corresponding toxicity data, it is possible to infer that when media1 is diluted to media10,
cit-AgNPs are more dispersed leading to a truer assessment of AgNP toxicity to D. magna.
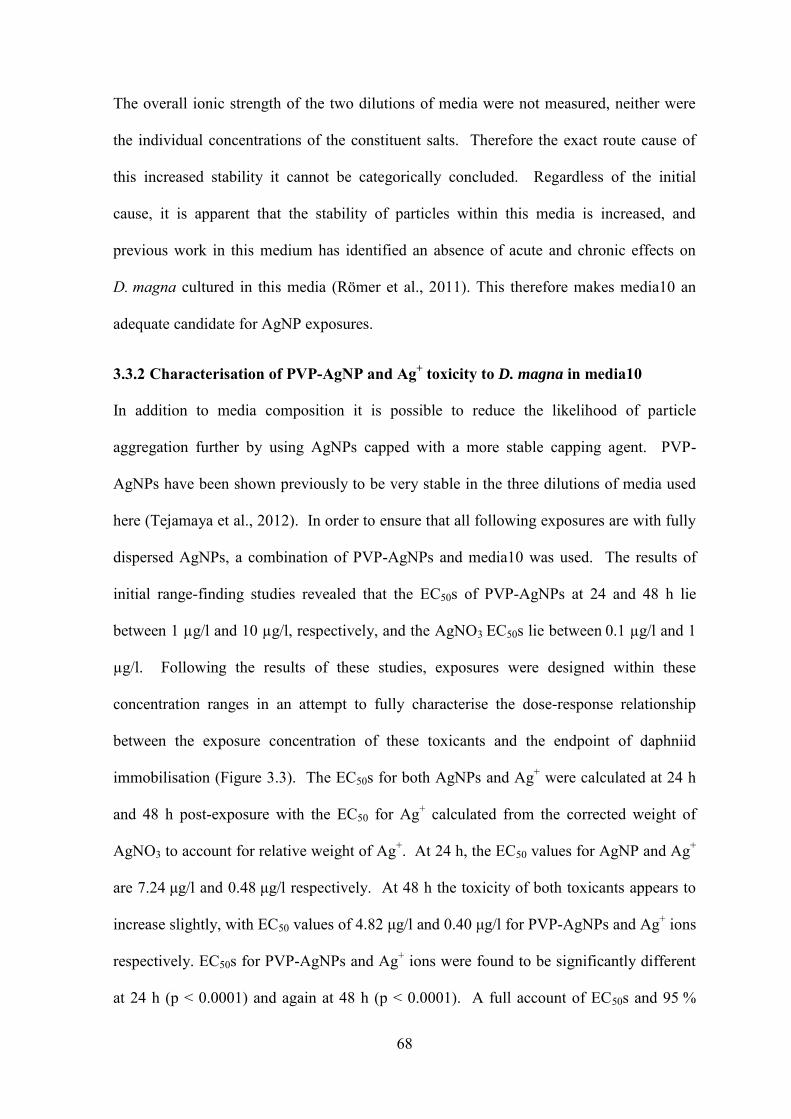
68
The overall ionic strength of the two dilutions of media were not measured, neither were
the individual concentrations of the constituent salts. Therefore the exact route cause of
this increased stability it cannot be categorically concluded. Regardless of the initial
cause, it is apparent that the stability of particles within this media is increased, and
previous work in this medium has identified an absence of acute and chronic effects on
D. magna cultured in this media (Römer et al., 2011). This therefore makes media10 an
adequate candidate for AgNP exposures.
3.3.2 Characterisation of PVP-AgNP and Ag+ toxicity to D. magna in media10
In addition to media composition it is possible to reduce the likelihood of particle
aggregation further by using AgNPs capped with a more stable capping agent. PVP-
AgNPs have been shown previously to be very stable in the three dilutions of media used
here (Tejamaya et al., 2012). In order to ensure that all following exposures are with fully
dispersed AgNPs, a combination of PVP-AgNPs and media10 was used. The results of
initial range-finding studies revealed that the EC50s of PVP-AgNPs at 24 and 48 h lie
between 1 µg/l and 10 µg/l, respectively, and the AgNO3 EC50s lie between 0.1 µg/l and 1
µg/l. Following the results of these studies, exposures were designed within these
concentration ranges in an attempt to fully characterise the dose-response relationship
between the exposure concentration of these toxicants and the endpoint of daphniid
immobilisation (Figure 3.3). The EC50s for both AgNPs and Ag+ were calculated at 24 h
and 48 h post-exposure with the EC50 for Ag+ calculated from the corrected weight of
AgNO3 to account for relative weight of Ag+. At 24 h, the EC50 values for AgNP and Ag+
are 7.24 μg/l and 0.48 μg/l respectively. At 48 h the toxicity of both toxicants appears to
increase slightly, with EC50 values of 4.82 μg/l and 0.40 μg/l for PVP-AgNPs and Ag+ ions
respectively. EC50s for PVP-AgNPs and Ag+ ions were found to be significantly different
at 24 h (p < 0.0001) and again at 48 h (p < 0.0001). A full account of EC50s and 95 %
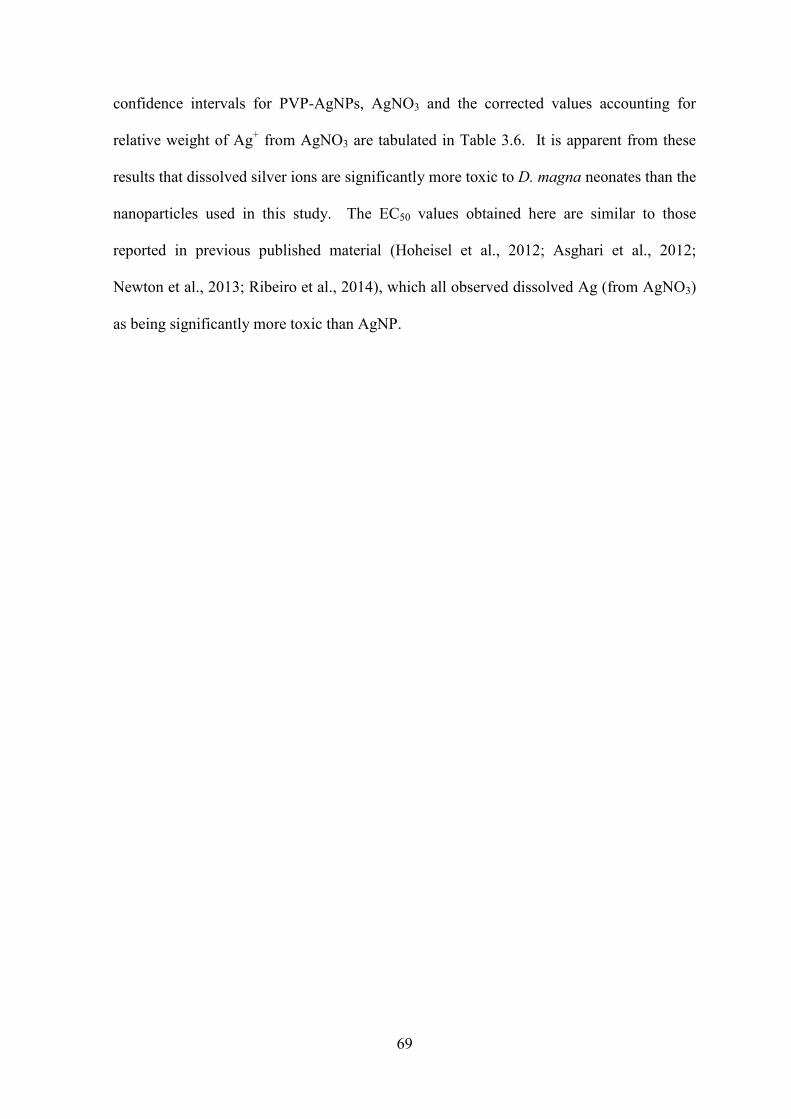
69
confidence intervals for PVP-AgNPs, AgNO3 and the corrected values accounting for
relative weight of Ag+ from AgNO3 are tabulated in Table 3.6. It is apparent from these
results that dissolved silver ions are significantly more toxic to D. magna neonates than the
nanoparticles used in this study. The EC50 values obtained here are similar to those
reported in previous published material (Hoheisel et al., 2012; Asghari et al., 2012;
Newton et al., 2013; Ribeiro et al., 2014), which all observed dissolved Ag (from AgNO3)
as being significantly more toxic than AgNP.
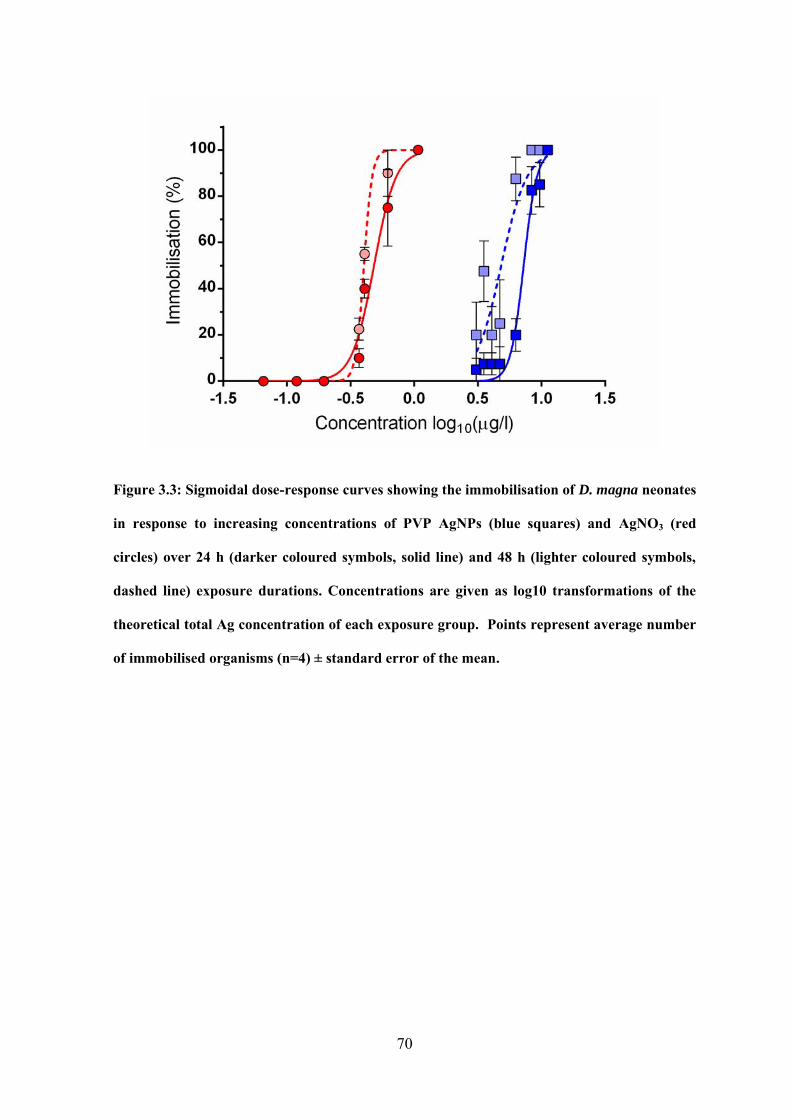
70
Figure 3.3: Sigmoidal dose-response curves showing the immobilisation of D. magna neonates
in response to increasing concentrations of PVP AgNPs (blue squares) and AgNO3 (red
circles) over 24 h (darker coloured symbols, solid line) and 48 h (lighter coloured symbols,
dashed line) exposure durations. Concentrations are given as log10 transformations of the
theoretical total Ag concentration of each exposure group. Points represent average number
of immobilised organisms (n=4) ± standard error of the mean.
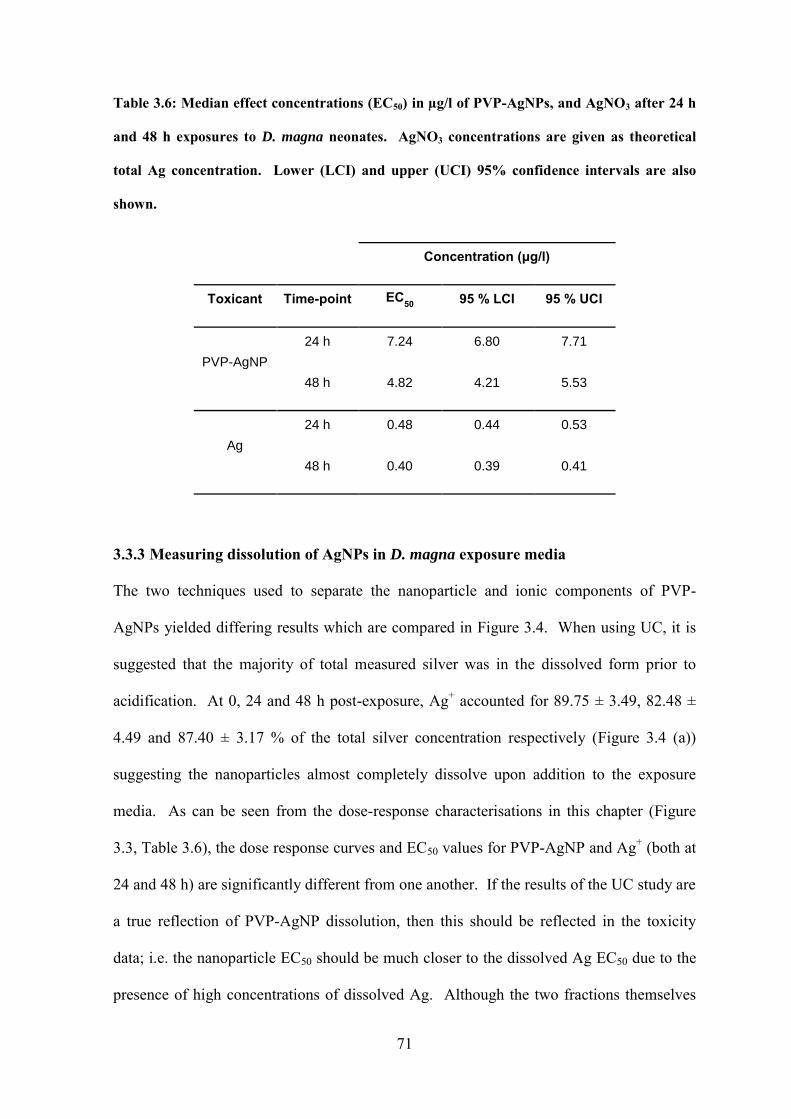
71
Table 3.6: Median effect concentrations (EC50) in µg/l of PVP-AgNPs, and AgNO3 after 24 h
and 48 h exposures to D. magna neonates. AgNO3 concentrations are given as theoretical
total Ag concentration. Lower (LCI) and upper (UCI) 95% confidence intervals are also
shown.
Concentration (μg/l)
Toxicant Time-point EC50 95 % LCI 95 % UCI
PVP-AgNP 24 h 7.24 6.80 7.71
48 h 4.82 4.21 5.53
Ag 24 h 0.48 0.44 0.53
48 h 0.40 0.39 0.41
3.3.3 Measuring dissolution of AgNPs in D. magna exposure media
The two techniques used to separate the nanoparticle and ionic components of PVP-
AgNPs yielded differing results which are compared in Figure 3.4. When using UC, it is
suggested that the majority of total measured silver was in the dissolved form prior to
acidification. At 0, 24 and 48 h post-exposure, Ag+ accounted for 89.75 ± 3.49, 82.48 ±
4.49 and 87.40 ± 3.17 % of the total silver concentration respectively (Figure 3.4 (a))
suggesting the nanoparticles almost completely dissolve upon addition to the exposure
media. As can be seen from the dose-response characterisations in this chapter (Figure
3.3, Table 3.6), the dose response curves and EC50 values for PVP-AgNP and Ag+ (both at
24 and 48 h) are significantly different from one another. If the results of the UC study are
a true reflection of PVP-AgNP dissolution, then this should be reflected in the toxicity
data; i.e. the nanoparticle EC50 should be much closer to the dissolved Ag EC50 due to the
presence of high concentrations of dissolved Ag. Although the two fractions themselves
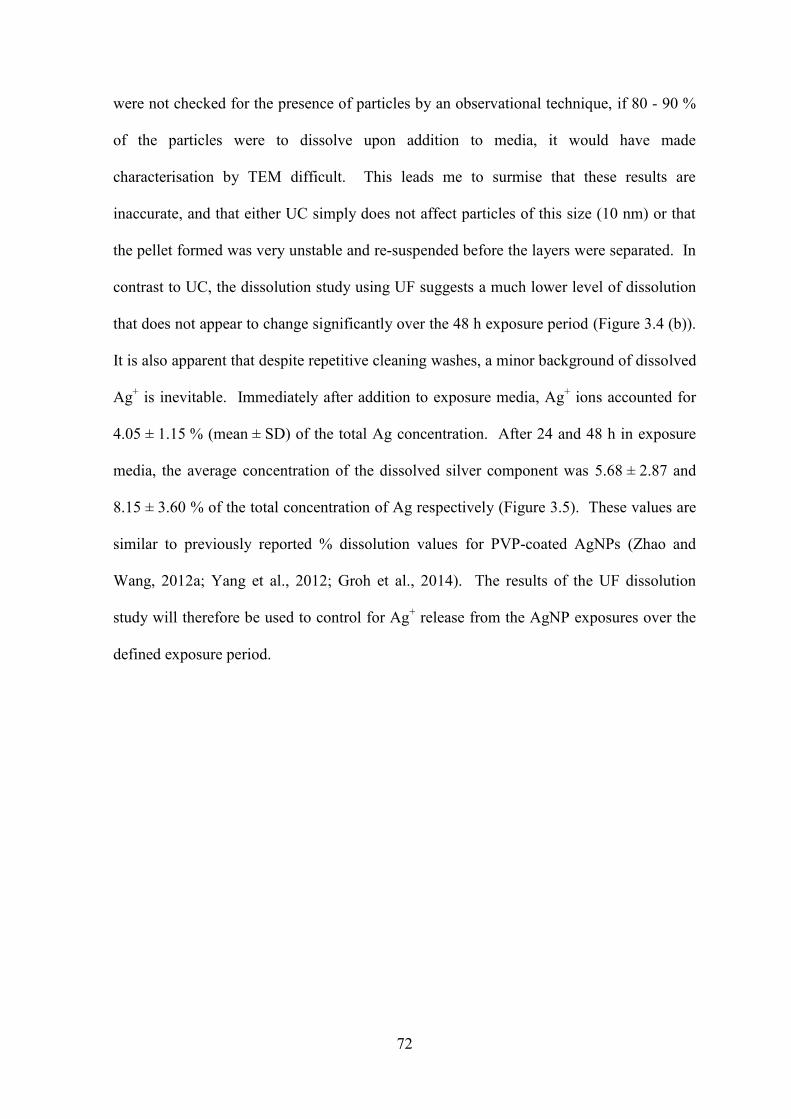
72
were not checked for the presence of particles by an observational technique, if 80 - 90 %
of the particles were to dissolve upon addition to media, it would have made
characterisation by TEM difficult. This leads me to surmise that these results are
inaccurate, and that either UC simply does not affect particles of this size (10 nm) or that
the pellet formed was very unstable and re-suspended before the layers were separated. In
contrast to UC, the dissolution study using UF suggests a much lower level of dissolution
that does not appear to change significantly over the 48 h exposure period (Figure 3.4 (b)).
It is also apparent that despite repetitive cleaning washes, a minor background of dissolved
Ag+ is inevitable. Immediately after addition to exposure media, Ag+ ions accounted for
4.05 ± 1.15 % (mean ± SD) of the total Ag concentration. After 24 and 48 h in exposure
media, the average concentration of the dissolved silver component was 5.68 ± 2.87 and
8.15 ± 3.60 % of the total concentration of Ag respectively (Figure 3.5). These values are
similar to previously reported % dissolution values for PVP-coated AgNPs (Zhao and
Wang, 2012a; Yang et al., 2012; Groh et al., 2014). The results of the UF dissolution
study will therefore be used to control for Ag+ release from the AgNP exposures over the
defined exposure period.
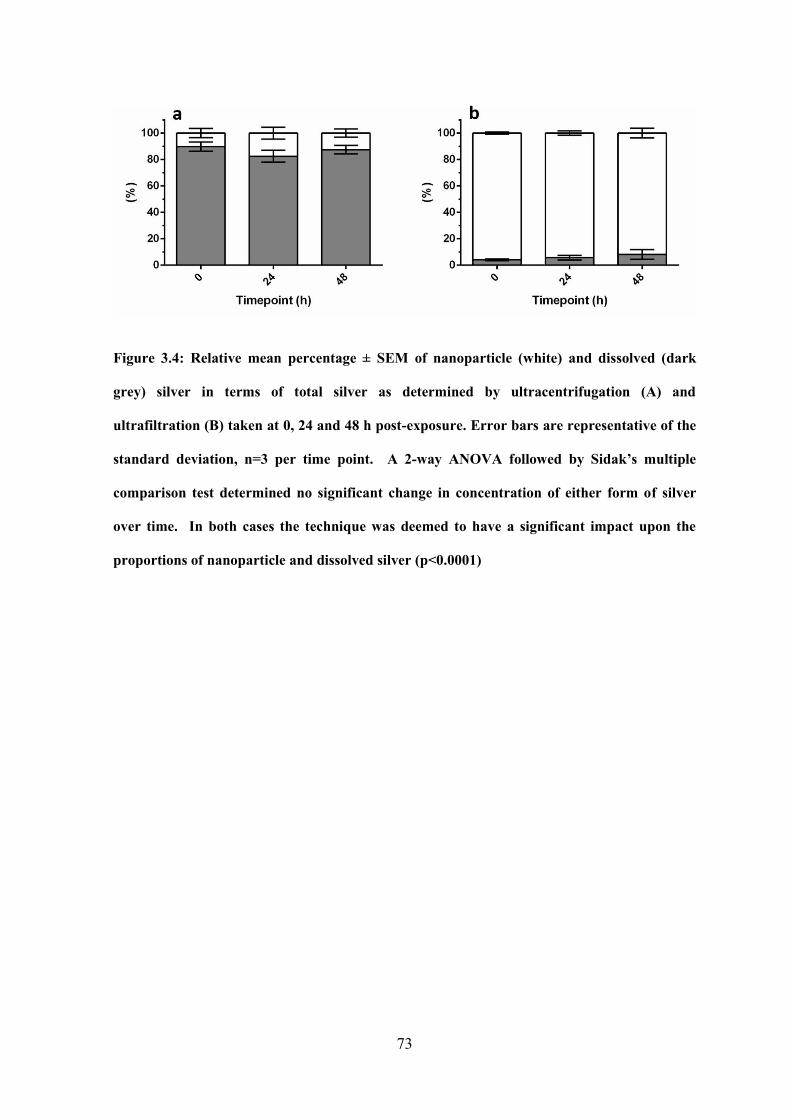
73
Figure 3.4: Relative mean percentage ± SEM of nanoparticle (white) and dissolved (dark
grey) silver in terms of total silver as determined by ultracentrifugation (A) and
ultrafiltration (B) taken at 0, 24 and 48 h post-exposure. Error bars are representative of the
standard deviation, n=3 per time point. A 2-way ANOVA followed by Sidak’s multiple
comparison test determined no significant change in concentration of either form of silver
over time. In both cases the technique was deemed to have a significant impact upon the
proportions of nanoparticle and dissolved silver (p<0.0001)
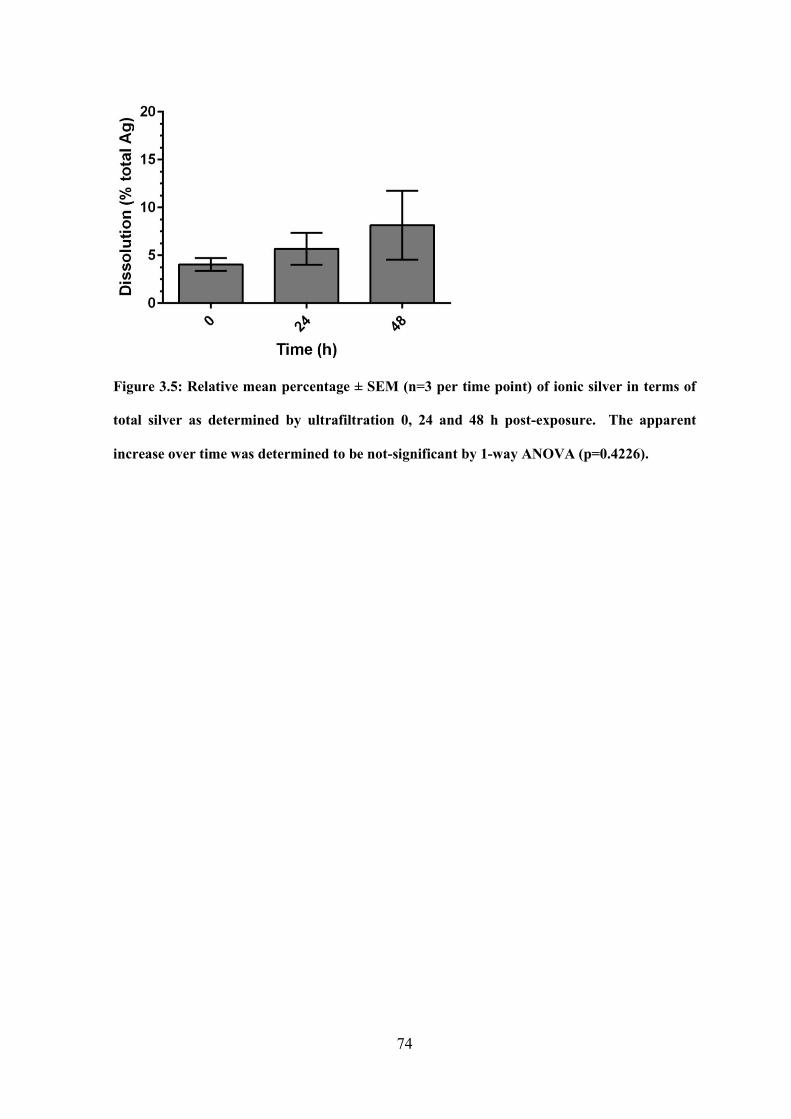
74
Figure 3.5: Relative mean percentage ± SEM (n=3 per time point) of ionic silver in terms of
total silver as determined by ultrafiltration 0, 24 and 48 h post-exposure. The apparent
increase over time was determined to be not-significant by 1-way ANOVA (p=0.4226).

75
3.4 Conclusions
TEM and AFM confirm that cit-AgNPs suspended in media10 are dispersed, whereas in
media1 the formation of aggregates is observed. This observed increase in stability with
reduced nominal concentration of salts within culture/exposure media is in accordance
with DLVO theory, whereby an increased ion concentration shields the surface-charges of
nanoparticles allowing them to come into sufficiently close contact for aggregation to
occur. The observed significant reduction in toxicity of AgNPs dispersed in media1 is not
seen for AgNO3 in media10 suggesting that this is a consequence of nanoparticle
aggregation and not increased sequestration of the dissolved component by Cl- ions. To
fully assess the toxicity of AgNPs we need them in their dispersed form (Stevenson et al.,
2012). From the results of this and previous studies (Römer et al., 2011; Tejamaya et al.,
2012) it is clear that media10 presents an ideal medium in which to achieve increased
particle dispersal for toxicity assessment. In addition to this, the likelihood of particle
aggregation can be reduced further through use of capping agents that induce stability
through steric hindrance and not charge-based repulsion. PVP-AgNPs have been shown
previously to be very stable in the three dilutions of media used here (Tejamaya et al.,
2012). In order to ensure that all following exposures, specifically those intended to
induce a sub-lethal toxic response, are with fully dispersed AgNPs, a combination of PVP-
AgNPs and media10 was used.
The fully characterised dose-response curves and EC50 values for PVP-AgNPs and AgNO3
reflect the same comparisons in previously reported studies (Hoheisel et al., 2012; Asghari
et al., 2012; Newton et al., 2013; Ribeiro et al., 2014) that conclude dissolved silver (from
AgNO3) is more toxic to D. magna than AgNPs. This is an observation that has also been
made in the comparison of other metal or metal-oxide nanoparticles with the EC50’s of
their respective dissolved forms (Notter et al., 2014). The dissolution of PVP-AgNPs over
76
24 h and 48 h, measured by ICP-MS following UF, were found to be similar to previously
reported values (Zhao and Wang, 2012a; Yang et al., 2012; Groh et al., 2014).
For the planned exposures for omics analyses, the planned concentration of the dissolved-
Ag groups would be 5.68 ± 2.87 % over 24 h or 8.15 ± 3.60 % over 48 h of the AgNP w/v
concentration. This would be to ensure animals in the dissolved-Ag control groups were
exposed to the same concentration of dissolved Ag as animals in the respective AgNP
groups. The 48 h exposure duration suggested by the OECD is designed to observe a final
outcome of immobilisation or organism death whereas the initial transcriptional response
to toxicant exposure and likewise the resulting impact on metabolism will occur much
earlier, within the first 24 h. Therefore, an exposure duration of 24 h was selected as the
optimum window to capture the transcriptional and metabolic response. This exposure
duration has been used previously in –omic analyses of D. magna toxicity tests (Poynton
et al., 2012). To detect the subtle molecular responses of D. magna to AgNP and AgNP
exposure, a range of concentrations was selected – thus enabling identification of potential
concentration dependant responses – which are high enough to induce a subtle response
but low enough avoid lethality. The lowest observed adverse effect concentration
(LOAEC) of PVP-AgNPs was observed to be approximately 4.70 µg/l over 24 h and
3.08 µg/l over 48 h. Only three neonates were immobilised at this concentration at 24 h
suggesting a threshold point between maximum tolerance and immobilisation. The
LOAEC for the chosen exposure period was therefore selected as the maximum PVP-
AgNP exposure concentration. Following the results of the UF dissolution test, the Ag
control concentrations would be 5.68 ± 2.87 % of the AgNP w/v concentration.
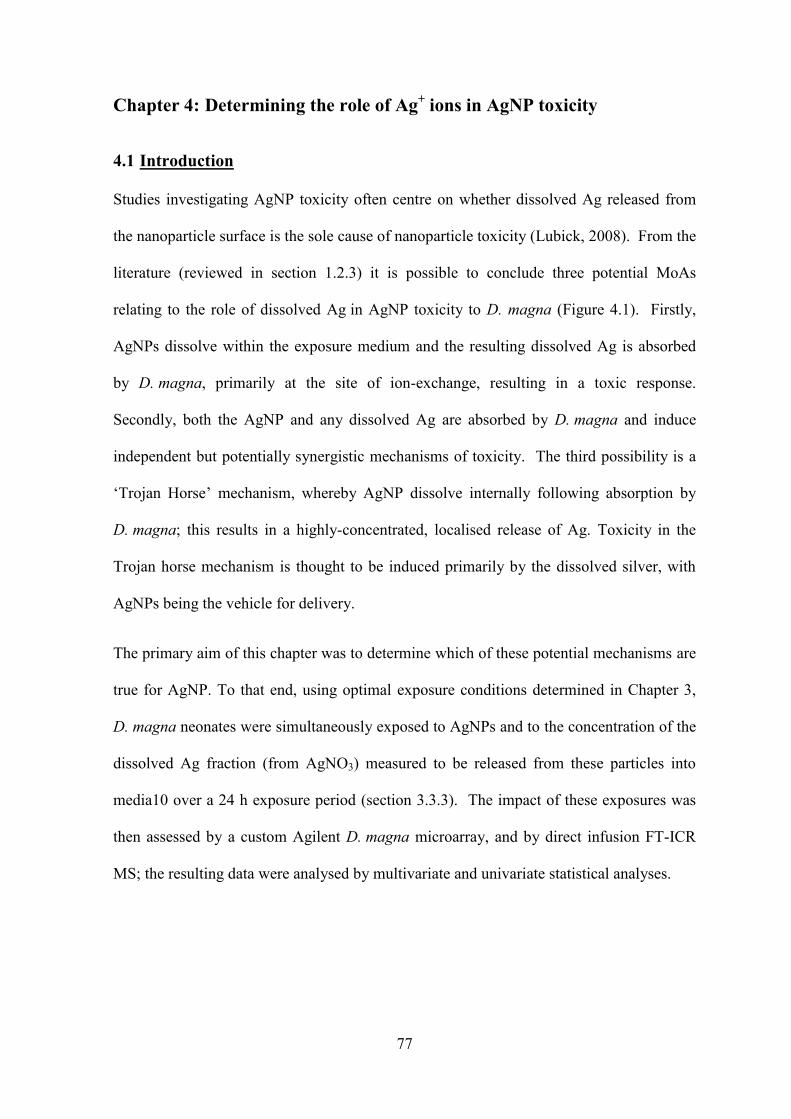
77
Chapter 4: Determining the role of Ag+ ions in AgNP toxicity
4.1 Introduction
Studies investigating AgNP toxicity often centre on whether dissolved Ag released from
the nanoparticle surface is the sole cause of nanoparticle toxicity (Lubick, 2008). From the
literature (reviewed in section 1.2.3) it is possible to conclude three potential MoAs
relating to the role of dissolved Ag in AgNP toxicity to D. magna (Figure 4.1). Firstly,
AgNPs dissolve within the exposure medium and the resulting dissolved Ag is absorbed
by D. magna, primarily at the site of ion-exchange, resulting in a toxic response.
Secondly, both the AgNP and any dissolved Ag are absorbed by D. magna and induce
independent but potentially synergistic mechanisms of toxicity. The third possibility is a
‘Trojan Horse’ mechanism, whereby AgNP dissolve internally following absorption by
D. magna; this results in a highly-concentrated, localised release of Ag. Toxicity in the
Trojan horse mechanism is thought to be induced primarily by the dissolved silver, with
AgNPs being the vehicle for delivery.
The primary aim of this chapter was to determine which of these potential mechanisms are
true for AgNP. To that end, using optimal exposure conditions determined in Chapter 3,
D. magna neonates were simultaneously exposed to AgNPs and to the concentration of the
dissolved Ag fraction (from AgNO3) measured to be released from these particles into
media10 over a 24 h exposure period (section 3.3.3). The impact of these exposures was
then assessed by a custom Agilent D. magna microarray, and by direct infusion FT-ICR
MS; the resulting data were analysed by multivariate and univariate statistical analyses.
78
Figure 4.1 The three hypothesised roles of Ag+ in AgNP toxicity to D. magna. (1) AgNPs
dissolve completely externally to the organism and toxicity is induced by the dissolved silver
alone. (2) AgNPs are absorbed by the organism and exert toxicity by an independent and
potentially synergistic mechanism to dissolved Ag. (3) AgNPs are absorbed and dissolve
internally, resulting in a concentrated release of Ag+ which are then the sole mediators of
toxicity.
79
Similarities or discrepancies between these exposure profiles measured by this dual-omics
approach will give an enhanced insight into the role of dissolved Ag in AgNP-induced
toxicity through a direct comparison of the induced molecular level changes. Certain
molecular responses have been shown to occur following exposure to both Ag and AgNP.
For example, Ag+ is known to impact Na+/Cl- transport and Na+/K+-ATPases, an effect
which may be reflected in the transcription of their respective genes. AgNP have been
also observed to disrupt the transport of Na+ by these enzymes but at a reduced level
(Stensberg et al., 2013). Both forms of silver have also been identified as causing an
increase in protein-thiols (Rainville et al., 2014), such as glutathione, cysteine residues and
metallothioneins. Impacts on amino acids and sugars have been measured as being similar
for both forms of silver (Li et al., 2015a), as has their impact on genes for oxidative
phosphorylation complexes I, II, III and IV (Aerle et al., 2013). If AgNP toxicity is due
solely to the dissolved fraction, which would be the case in both mechanism 1 and 3 above
(Figure 4.1), we would expect to see similar changes in the molecular response of
D. magna exposed to AgNPs and to the respective dissolved fraction alone.
Likewise any discrepancies in the MoAs of AgNP and Ag+ ions will be observed. For
example, as well as the reduced efficiency for Na+ transport disruption of AgNPs
mentioned above (Stensberg et al., 2013), other molecular effects have been identified
which are specific to either AgNP or dissolved Ag exposure. It is known, for example,
that AgNPs and Ag+ ions enter cells by differing methods; Ag+ ions through ion-transport
pumps (Bury and Wood, 1999) and AgNPs primarily by clathryn-mediated endocytosis
(Asharani et al., 2009). There may be differing levels of expression in the genes associated
with these processes upon exposure to either dissolved silver or AgNPs. High-throughput
superSAGE (serial analysis of gene expression) in zebrafish embryos identified 13
D. magna genes unique to the response to AgNP exposure and 32 genes unique to
80
dissolved Ag treatment including cyclic AMP-dependent transcription factor ATF-4 (Aerle
et al., 2013). If AgNPs induce an independent molecular response, the patterns of gene-
expression and metabolite production will be noticeably different to those induced by
AgNO3 exposure.
In this chapter a dual-omics approach is taken to compare the perturbations induced in the
overall transcriptional and metabolic profiles of D. magna, following exposure to
increasing concentrations of AgNPs and AgNO3. As an additional stage of investigation,
the uptake and elimination of Ag in D. magna at these concentrations was assessed. By
confirming the presence of Ag within or on the organisms it will allow the differentiation
between some of the hypothesised mechanisms. If only dissolved silver is available to
D. magna neonates then these exposures will result in similar concentrations of Ag
associated with the exposed neonates. If the nanoparticle form of silver is ingested, then a
greater Ag body burden would be expected in those animals exposed to AgNPs. The
pattern of Ag elimination from the organisms can give an insight into the extent of Ag
accumulated within tissues and cells.
81
4.2 Materials and Methods
4.2.1 Sub-lethal omics exposure studies
Nominal exposure concentrations of 4.70, 2.35, 1.18 and 0.59 μg/l AgNPs (AgNP High,
Mid, Low and V. Low respectively) were used alongside nominal concentrations of 0.44,
0.22, 0.11 and 0.06 µg/l AgNO3 (Ag+ High, Mid, Low and V. Low respectively). These
exposure concentrations of AgNO3 equate to 0.28, 0.14, 0.07 and 0.04 μg/l of total Ag
corresponding to approximately 6 % of the respective AgNP exposures. Untreated
(deionised water; no-added silver), capping agent (0.03 % v/v. PVP) and bulk silver
(4.7 μg/l, 3μm average diameter, Sigma Aldrich) controls were used to account for
background mortality, any potential impact of the capping agent, and to control for
potential aggregation effects respectively. The Ag filtered from the AgNP stock prior to
use was included as an additional filtrate control. Each group contained 6 biological
replicates and all exposures were performed in media10. For each desired control, AgNP
and AgNO3 exposure concentration to be used, a 250-fold concentrated stock was made. A
master sock of PVP-AgNPs was prepared as outlined in section 2.3 and measured by ICP-
MS (section 2.3.3) to have a concentration of 14.7 mg/l. Separately, 117.5, 58.8, 29.4 and
14.7 µl of this stock were diluted with MilliQ water to a volume of 10 ml to produce
spiking stocks for the AgNP High, Mid, Low and V Low groups respectively. A AgNO3
Master-Stock was produced as before (section 3.2.4) by weighing 100.5 mg AgNO3 into
100 mL MilliQ water to give a nominal concentration of 1 g/l. This stock was
subsequently diluted 1 in 100 followed by a subsequent 1 in 10 dilution to produce a
working stock with a nominal concentration of 1 mg/l. Seperately, 1100, 550, 275 and 150
µl of this stock were diluted to 10 ml with MilliQ water to produce spiking stocks for the
Ag+ High, Mid, Low and V Low groups respectively. The exposure groups used and the
desired nominal exposure concentrations are outlined in (Table 4.1).
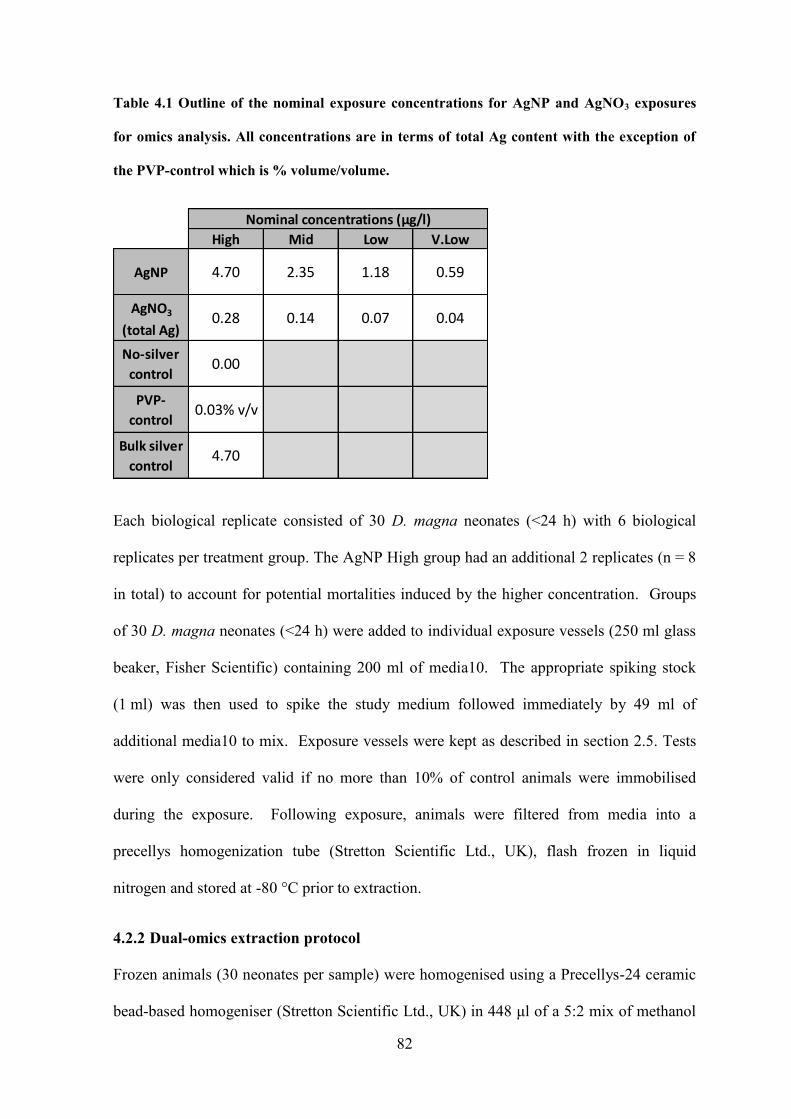
82
Table 4.1 Outline of the nominal exposure concentrations for AgNP and AgNO3 exposures
for omics analysis. All concentrations are in terms of total Ag content with the exception of
the PVP-control which is % volume/volume.
Each biological replicate consisted of 30 D. magna neonates (<24 h) with 6 biological
replicates per treatment group. The AgNP High group had an additional 2 replicates (n = 8
in total) to account for potential mortalities induced by the higher concentration. Groups
of 30 D. magna neonates (<24 h) were added to individual exposure vessels (250 ml glass
beaker, Fisher Scientific) containing 200 ml of media10. The appropriate spiking stock
(1 ml) was then used to spike the study medium followed immediately by 49 ml of
additional media10 to mix. Exposure vessels were kept as described in section 2.5. Tests
were only considered valid if no more than 10% of control animals were immobilised
during the exposure. Following exposure, animals were filtered from media into a
precellys homogenization tube (Stretton Scientific Ltd., UK), flash frozen in liquid
nitrogen and stored at -80 °C prior to extraction.
4.2.2 Dual-omics extraction protocol
Frozen animals (30 neonates per sample) were homogenised using a Precellys-24 ceramic
bead-based homogeniser (Stretton Scientific Ltd., UK) in 448 μl of a 5:2 mix of methanol
High Mid Low V.Low
AgNP 4.70 2.35 1.18 0.59
AgNO3
(total Ag)0.28 0.14 0.07 0.04
No-silver
control0.00
PVP-
control0.03% v/v
Bulk silver
control4.70
Nominal concentrations (µg/l)
83
(HPLC grade): water (nuclease free, QIAGEN) for two 10 s bursts at 6400 rpm with a 15 s
intermission then returned to ice. A 112 μl aliquot of homogenate was then removed into a
nuclease-free microfuge tube (1.7 ml, Axygen) for RNA extraction and replaced with the
same volume of 5:2 methanol:water. This aliquot was centrifuged for 5 minutes at 15,000
rcf in a bench-top microcentrifuge (5415D, Eppendorf) and the supernatant was removed.
The pellet was then immediately re-suspended vigorously in 350 μl of guanidine-
thiocyanate containing buffer (RLT buffer, QIAGEN) with added β-mercaptoethanol (1 µl
per ml of buffer) and stored at -80 C for future extraction.
4.2.3 Bi-phasic extraction of polar metabolites
Polar metabolites were extracted using a two-step, biphasic method as detailed previously
(Wu et al., 2008). Briefly, homogenate was transferred into 1.8 ml glass vials on ice and
further volumes of nuclease free water (160 µl) and chloroform (320 μl) were added to
produce a final solvent ratio of 2:2:1.8 methanol:chloroform: water (Wu et al., 2008). This
mixture was then vortex-mixed for 30 s and left on ice for 10 minutes before being
centrifuged (4000 rcf, 4 °C, 10 min) (Biofuge Primo R, Thermo Scientific) yielding a
biphasic mixture separated by a layer of protein debris. The upper, polar layer of each
sample was removed into a single 1.5 ml microfuge tube (Starstedt, Leicester, UK) via
Hamilton syringe. The lower, non-polar layer was removed and prepared for FT-ICR
lipidomic analysis which is not reported in this thesis (White, 2013). Polar extracts were
dried under vacuum (Savant Refrigerated Vapour Trap, Thermo Scientific) using a
centrifugal concentrator (Savant SpeedVac concentrator, Thermo Scientific) without
application of heat and stored at -80 °C prior to FT-ICR analysis. Two extract blanks were
created using the above homogenisation and extraction protocols in the absence of
biological material.
84
4.2.4 Polar extract re-suspension for MS analysis
All frozen, dried, polar extracts were re-suspended by addition of 30μl 4:1 mixture of
methanol:water with 20 mM ammonium acetate followed by vortex-mixing for 30 s for
negative ion mode analysis. All re-suspended samples were centrifuged at 22,000 rcf, 4 °C
for 10 minutes to remove particulate matter. The supernatant of each sample was then
loaded alongside quality control (QC) samples in a randomly generated order on 384 well
polymerase chain reaction (PCR) plates (Agilent technologies). QC samples were created
from a pool of D. magna polar extract collected from a separately collected group of
neonates. Once samples were loaded, wells were immediately covered with self-adhesive
foil to temporarily prevent contamination or sample evaporation. Once an entire plate was
loaded, it was permanently sealed using a single, heat-sealed, foil sheet (ALPS 50V,
Thermo Fisher Scientific, US).
4.2.5 Acquisition of mass spectra
All extracts were analysed in quadruplicate using an LTQ-FT Ultra (Thermo Fisher
Scientific, Bremen, Germany) hybrid LTQ FT-ICR mass spectrometer with a direct
infusion, chip-based nano-electrospray ionisation source (Triversa, Advion Biosciences,
Ithaca, NY). Nanoelectrospray conditions consisted of a 200 nl/min flow rate, 0.3 psi
backing pressure and an electrospray voltage of either +1.7 kV or -1.7 kV in positive or
negative ion mode respectively controlled by Chipsoft software (Advion, Ithaca, NY,
USA). An automatic gain control setting of 1x10⁶ was used in combination with a mass
resolution of 100,000 (FWHM at 400 m/z). Each technical replicate was analysed using
Xcalibur software (Version, Thermo Scientific). Data were acquired as transients from
m/z 70-590 using the selected ion monitoring (SIM) stitching methodology (Southam et
al., 2007; Payne et al., 2009; Weber et al., 2011) in 7 SIM windows of 100 m/z width and
85
30 m/z overlap. Samples were analysed in a randomly generated order with QC samples
spaced evenly throughout to disentangle MS technical drift from biological differences.
4.2.6 Mass spectral data processing
Transient data from the FT-ICR were processed, and the SIM stitch algorithm was applied
as described previously (Southam et al., 2007; Payne et al., 2009). Briefly, transients were
averaged and then transformed into spectra with Fast Fourier Transform (Comisarow and
Melka, 1979) and calibrated using a list of defined peaks for each SIM window (Section
0). SIM window spectra were then ‘stitched’ together through the alignment of peaks in
overlapping regions (30 Da) using the SIM-stitching algorithm (Southam et al., 2007). All
peaks with intensities with a signal to noise ratio of less than 3.5 were removed, as were
areas of ‘mechanical noise’ or ‘high noise regions’ in the m/z ranges of (m/z = (74.05-
74.2); (90.50-90.58), (101.32-101.42); (101.6-102.1); (105.1-105.5); and (116.37 116.5)).
This process resulted in four stitched spectra per biological sample; the three best quality
replicates were then selected for further filtering. Replicate quality was primarily based on
the variation of relative intensity within SIM windows. The spectra of the three selected
technical replicates were then aligned and merged, with peaks being retained only if
present in at least two of the remaining three replicates, thus resulting in one spectrum per
biological sample. When aligning replicate spectra, peaks were considered to be the same
if they occurred within a 1.5 ppm error of one another along the m/z axis. The spectra of
all samples were then aligned and filtered with m/z peaks only being retained if they were
present in at least 80 % of all experimental samples. Due to the differing origin of the QC
samples, they were excluded from this process to avoid skewing the filter. When aligning
sample spectra, peaks were considered to be the same if they occurred within a 2.5 ppm
error of one another along the m/z axis. A blank filter was also applied; any of the
remaining sample peaks which were also detected within the extract blanks were removed
86
from all spectra. All spectral processing steps were completed in MATLAB (student
version 7, The Math-Works, Natick, MA). These processing steps yield a matrix of raw
peak intensity values, with columns corresponding to m/z values and rows corresponding
to samples, which require further processing before statistical analysis.
4.2.7 Probable Quotient Normalisation of m/z intensity matrices
To account for variation arising from differences in sample concentration, the resulting
filtered matrix was normalised via Probable Quotient Normalisation (PQN) (Dieterle et al.,
2006) using an in-house MATLAB script. Quotients of dilution were calculated by
dividing the intensity of each peak in a spectrum by the mean intensity for that peak across
all samples. The median quotient of the entire spectrum is then selected as the scaling
factor (most probable quotient) for that spectrum. Quotients were only calculated for
peaks that occurred in 100 % of all samples except QCs.
4.2.8 Missing value imputation by the k-nearest neighbour method
Due to the nature of the sample filter, some samples within the intensity matrix may not
have intensity values for peaks which are otherwise detected in the remaining samples. To
prevent miscalculation of fold changes, missing values were imputed using the k-nearest
neighbour (KNN) algorithm using an in-house MATLAB script (Hrydziuszko and Viant,
2011). Briefly, the top k (in this study k = 5) peaks with the most similar intensity profiles
across all samples were used to calculate a weighted average (the most similar peaks
being favoured) for that sample. This value was then imputed in the place of the missing
value. This normalised matrix with imputed missing values was used for the assessment
of fold changes in peak intensities across groups and for univariate analysis to determine
significantly changing peaks.

87
4.2.9 Generalised logarithm transformation for multivariate analysis
Peaks of naturally higher intensities are intrinsically prone to greater technical variation, in
terms of absolute values, than those which are naturally lower in intensity. This can skew
the results of multivariate statistical analysis. To counteract this, the normalised matrix
was transformed using the generalised logarithm transformation (Parsons et al., 2007).
This process uses a scaling factor (λ) derived from the QC samples i.e., samples between
which, theoretically, the only variation is technical and not biological. This process
stabilises technical variation and reduces dominance of large intensity peaks, allows for
better observation of biological differences in subsequent multivariate statistical analyses
such as PCA (Parsons et al., 2007).
4.2.10 Generation of calibration lists
In order to complete the processing workflow, a calibration list of robust peaks is required.
This list is generated from a preliminary run of the steps outlined above but with the
following exceptions. A signal:noise ratio of 10 was used instead of 3.5, only peaks
occurring within all three technical replicates of a sample were kept, and finally only peaks
which occurred in 100 % of samples were retained. This stringent filtering process
ensured the retention of robust m/z features within the D. magna or D. pulex metabolome.
Features retained from this process were putatively annotated using MI-Pack as outlined
below using the single peak search function. The final calibration lists were created using
a minimum of one successfully annotated m/z feature within each of the SIM windows.
The calibrants used in this chapter are listed in the Appendix (Table 9.3).
4.2.11 Assessment of MS data quality
The quality of mass spectral data was assessed using two methods. First the analytical
reproducibility (or precision) of the data was assessed through calculation of the median
Relative Standard Deviation (RSD) of QC spectra. Briefly, the RSD was calculated for
88
each peak remaining from MS spectral processing from the respective intensity values
within the QC sample population. The median RSD value was then taken as indication of
analytical reproducibility as outlined previously (Parsons et al., 2009). A median RSD of
<20% is deemed to be an acceptable level of reproducibility (Kirwan et al., 2014). The
median RSD was also calculated for each control and exposure group as well as for all
biological samples (not QCs) used within the study. Comparison of these values showed a
much lower median RSD between the QC samples in comparison to the RSD of all
biological samples; 12.0 % compared to 33.5 % respectively (Table 4.2) indicating that the
analytical variation observed in the dataset is much lower than the background biological
variation between unique replicates.. Next, the quality of the final processed dataset was
assessed through a multivariate quality assessment as described previously (Sangster et al.,
2006; Kirwan et al., 2014). Following the method outlined below (section 4.2.17), PCA
was conducted on all biological samples and QC samples. The degree to which QC
samples cluster relative to the variation in biological samples was then visualised as first
outlined by Sangster et al., 2006. The tight clustering of QC samples observed in Figure
4.2 relative to the wide spread of the biological samples clearly indicates that the analytical
variation within the dataset is small relative to the biological variation.
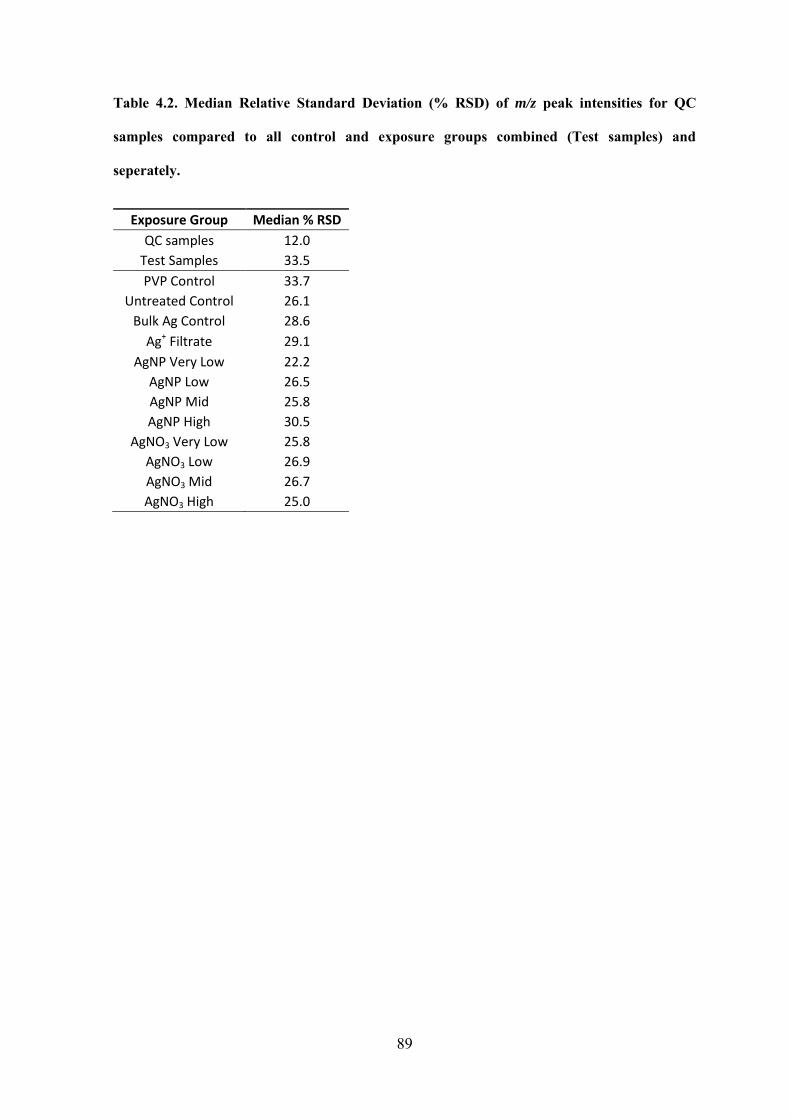
89
Table 4.2. Median Relative Standard Deviation (% RSD) of m/z peak intensities for QC
samples compared to all control and exposure groups combined (Test samples) and
seperately.
Exposure Group Median % RSD
QC samples 12.0
Test Samples 33.5
PVP Control 33.7
Untreated Control 26.1
Bulk Ag Control 28.6
Ag+ Filtrate 29.1
AgNP Very Low 22.2
AgNP Low 26.5
AgNP Mid 25.8
AgNP High 30.5
AgNO3 Very Low 25.8
AgNO3 Low 26.9
AgNO3 Mid 26.7
AgNO3 High 25.0
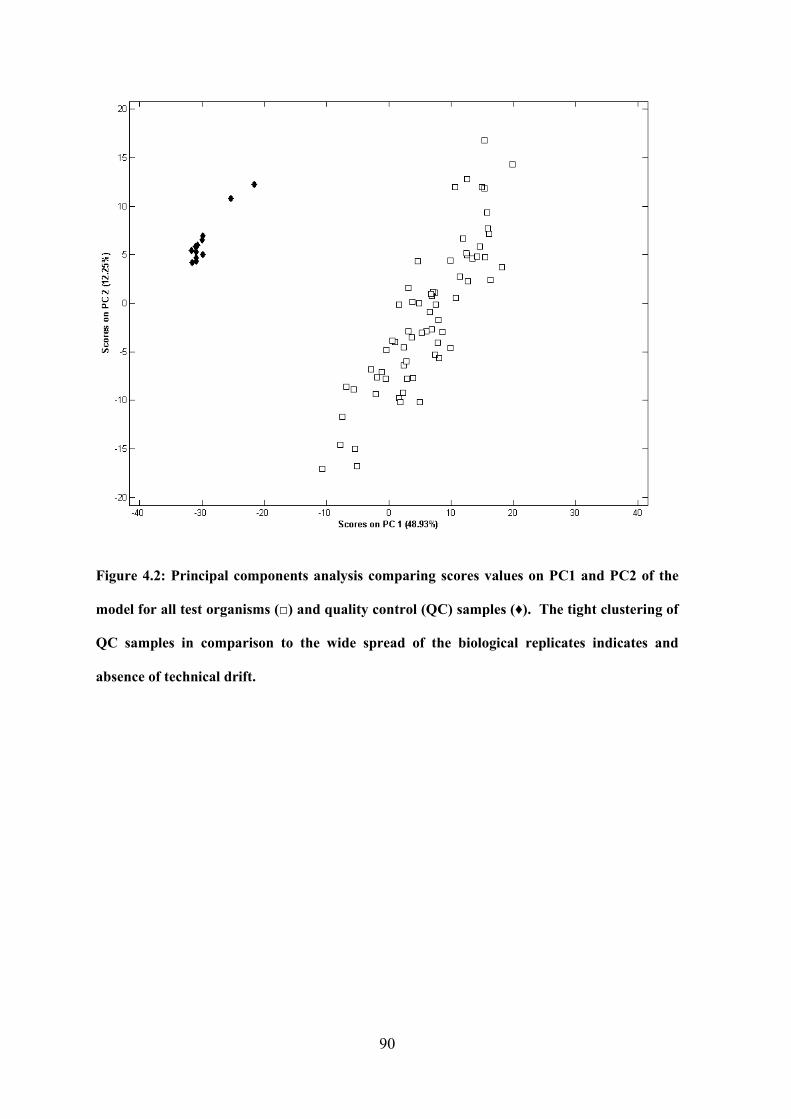
90
Figure 4.2: Principal components analysis comparing scores values on PC1 and PC2 of the
model for all test organisms () and quality control (QC) samples (♦). The tight clustering of
QC samples in comparison to the wide spread of the biological replicates indicates and
absence of technical drift.

91
4.2.12 Extraction of total RNA
The homogenate aliquot in RLT buffer was thawed on ice and RNA extraction continued
using a column-based extraction kit (RNeasy Mini Kit, QIAGEN) following
manufacturer’s instructions, including DNase1 treatment (RNase-Free DNase kit,
QIAGEN). Briefly, 350 µl 70 % v/v ethanol was mixed with thawed aliquots and then
spun through silica-based spin-columns (30 s, 8000 rcf) to allow RNA binding. Samples
were then washed three times in low salt, ethanol buffers before elution in 40 µl nuclease
free water. The quantity and quality of RNA was assessed using a spectrophotometer
(NanoDrop 1000, Thermo Scientific, Waltham, MA) using an analysis constant of 40 for
RNA. The integrity of all samples was measured using an Agilent RNA 6000 Nano Kit
and an Agilent 2100 Bioanalyser (Agilent Technologies, Santa Clara, CA).
4.2.13 Ethanol/Acetate precipitation of RNA
Any RNA extracts with an A260/A230 ratio (measured by nanodrop (Section 4.2.12) lower
than 1.5 were cleaned using the ethanol/acetate precipitation method and then re-measured.
Ethanol (100 %, 2 volumes, -20 °C) and sodium acetate (3 M, 0.1 volumes, pH 5.2) were
mixed with each extract before incubation at -80 °C for 1 h. Samples were then
centrifuged for 30 min at 4 °C and the supernatant was removed. The pellet was washed
with ethanol (70 % v/v) and centrifuged before being air dried for 30 min. Once dry the
RNA pellet was re-suspended in nuclease free water.
4.2.14 Amplification and Cy3-labelling of selected RNA samples
Only samples within the untreated, PVP and bulk control groups, the Ag+ High and Ag+
Low exposure groups and the AgNP High and AgNP Low exposure groups were selected
for microarray analysis. The One-Color RNA Spike-In Kit (Agilent Technologies) was
used to account for variation between the arrays as quality control. This kit contains a
mixture of 10 positive control transcripts at known concentrations which anneal to
92
complementary probes on the microarray. This kit is an invaluable form of quality
assurance, controlling for any abnormalities in the labelling and hybridisation procedure
including the potential interference AgNPs may have with fluorescent dyes in use. The
results of the QC probes were comparable across all groups, no differences were observed
between control groups, AgNP or AgNO3-exposed animals. One AgNP High failed QC as
a result of non-specific hybridisation and was removed from future analyses. Briefly, the
stock Agilent One Colour RNA Spike Mix concentrate was serially diluted four times
(1:20, 1:25, 1:20 and finally 1:4) then 2 µl of the final dilution was added to 50 ng of each
sample of total RNA. The labelling reaction was prepared using the one-colour Low Input
QuickAmp Labelling kit (Agilent Technologies), according to manufacturer’s instructions
using an input of 50 ng of spiked-RNA. This kit employs a double amplification strategy
in which the total RNA is first reverse-transcribed to cDNA which is then used to produce
the fluorescent Cy3-CTP labelled cRNA. The labelled, amplified cRNA was made up to
100 µl with nuclease free water and was purified using an RNeasy Mini Kit (QIAGEN).
Once purified, the labelled cRNA was quantified using the microarray measurement
function on the NanoDrop with an analysis constant of 40 for RNA. From these
measurements, the yield of cRNA (µg) and the specific activities of Cy3 per µg cRNA
were calculated. All samples were found to have a specific activity above the
recommended minimum value of 6 pmol Cy3 per µg cRNA.
4.2.15 Hybridisation and scanning of a custom D. magna microarray
The hybridisation and scanning of the microarray slides were conducted with supervision
from the Genomics Facility, University of Birmingham. Following purification, Cy3-
labelled cRNA samples (600 ng) were fragmented through addition of Agilent gene
expression blocking agent (5 µl) and fragmentation buffer (1 µl) (Agilent Technologies) in
a total reaction volume of 25 µl (made up waith nuclease free water) and incubated for
93
30 min at 60 °C. Fragmented cRNA was then immediately cooled on ice and mixed with
25 µl hybridisation buffer to stop fragmentation. Samples were hybridised to a custom
D. magna gene expression microarray (Design ID: 023710, Agilent Technologies) as used
previously (Poynton et al., 2012; Antczak et al., 2013; Scanlan et al., 2013). The array is
constructed from 15,000 unique, best-responding probes from a preliminary microarray
constructed from a D. magna expressed sequence tag database (Garcia-Reyero et al.,
2009). The hybridized microarrays were scanned with an Agilent Technologies Scanner
G2505B at 535 nm for Cy3. Scanned images were processed and results were extracted
using Feature Extraction software (Agilent Technologies).
4.2.16 Microarray data processing
Microarray data processing and analyses were performed within Genespring analytical
software (version GX7.3.1, Agilent Technologies). Prior to normalisation, low intensity
values (< 0.01) were set to a minimum value of 0.01 intensity units. Each measurement
was then normalised by the 50th percentile of all measurements within each individual
sample-array. Each gene-probe was normalised by the median of its measurements across
all sample-arrays. Genes with particularly low expression levels (< 40) were removed
with background noise, as were genes whose standard deviation exceeded 1.4 in greater
than 4 of the 7 exposure groups. The normalized microarray dataset were log2 transformed
prior to multivariate statistical analysis.
4.2.17 Principal components analysis of multivariate data
PCA was used to assess the variation of glog-transformed metabolic and log-transformed
transcriptional matrices in an unbiased manner. Prior to PCA model creation, glog or log-
transformed intensity values for each variable (m/z peak or gene probe respectively) were
mean centred. PCA models were then generated from mean-centred transformed matrices
with 4 PCs for each model using the PLS_Toolbox (version 6.0.1, Eigenvector Research,
94
Manson, WA) within MATLAB. The significance of differences between scores values
for each group was assessed along each PC by analysis of variance (ANOVA) using an in-
house script in MATLAB. The p-values generated by this test were corrected using a FDR
of 5 % to account for the multiple-testing of all PC scores (Benjamini and Hochberg,
1995). All QC samples were excluded from multivariate analyses.
4.2.18 Analysis of variance of individual peak intensities between exposure groups
One-way ANOVAs were used to determine those genes and m/z peaks that changed
significantly in intensity between exposure groups. Multivariate and univariate statistical
analyses indicated no significant differences between the untreated, PVP and bulk control
groups as outlined in section 4.3.1. For this analysis samples in the untreated, PVP and
bulk control groups were treated as a single group to identify only those variables which
changed significantly in response to Ag exposure. Briefly, mean intensity values of the
combined control and all exposure groups were compared by one-way ANOVAs for each
individual m/z peak or gene. Due to the large size of metabolomics and transcriptomics
datasets, the comparison of multiple variables in this manner is likely to induce a large
number of false positives. For example, using a significance value of 0.05 for each test
could potentially mean that of the multiple comparisons taking place, 5 % could be
incorrectly assigned a significant p-value. This false discovery rate is accounted for by
calculating a corrected (or adjusted) p-value (Benjamini and Hochberg, 1995). The p-
values generated from these tests were corrected using an FDR of 5 % to account for the
multiple testing hypothesis (Benjamini and Hochberg, 1995). QC samples were not
included in these tests.
4.2.19 AgNP and AgNO3 uptake and elimination studies
In a separate set of exposures to the omics-analyses outlined above, D. magna neonates
were exposed to nominal concentrations of 4.70 and 1.18 μg/l AgNPs as well as 0.44 and
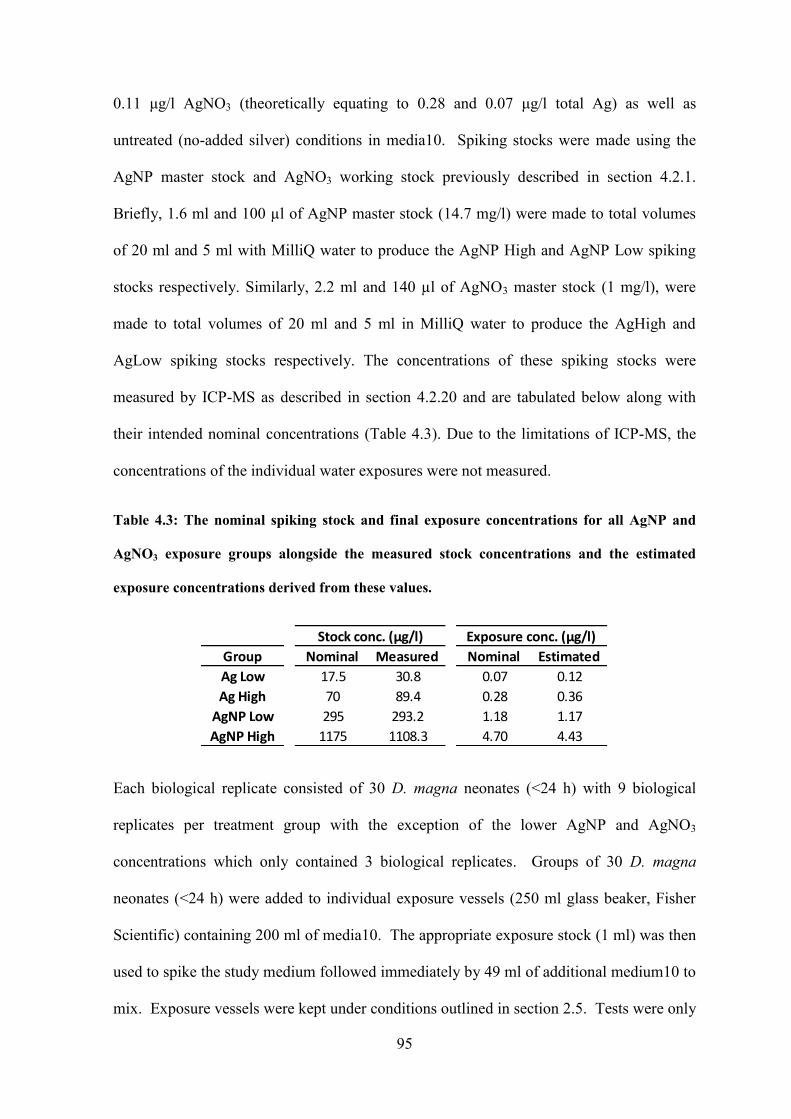
95
0.11 μg/l AgNO3 (theoretically equating to 0.28 and 0.07 μg/l total Ag) as well as
untreated (no-added silver) conditions in media10. Spiking stocks were made using the
AgNP master stock and AgNO3 working stock previously described in section 4.2.1.
Briefly, 1.6 ml and 100 µl of AgNP master stock (14.7 mg/l) were made to total volumes
of 20 ml and 5 ml with MilliQ water to produce the AgNP High and AgNP Low spiking
stocks respectively. Similarly, 2.2 ml and 140 µl of AgNO3 master stock (1 mg/l), were
made to total volumes of 20 ml and 5 ml in MilliQ water to produce the AgHigh and
AgLow spiking stocks respectively. The concentrations of these spiking stocks were
measured by ICP-MS as described in section 4.2.20 and are tabulated below along with
their intended nominal concentrations (Table 4.3). Due to the limitations of ICP-MS, the
concentrations of the individual water exposures were not measured.
Table 4.3: The nominal spiking stock and final exposure concentrations for all AgNP and
AgNO3 exposure groups alongside the measured stock concentrations and the estimated
exposure concentrations derived from these values.
Each biological replicate consisted of 30 D. magna neonates (<24 h) with 9 biological
replicates per treatment group with the exception of the lower AgNP and AgNO3
concentrations which only contained 3 biological replicates. Groups of 30 D. magna
neonates (<24 h) were added to individual exposure vessels (250 ml glass beaker, Fisher
Scientific) containing 200 ml of media10. The appropriate exposure stock (1 ml) was then
used to spike the study medium followed immediately by 49 ml of additional medium10 to
mix. Exposure vessels were kept under conditions outlined in section 2.5. Tests were only
Group Nominal Measured Nominal Estimated
Ag Low 17.5 30.8 0.07 0.12
Ag High 70 89.4 0.28 0.36
AgNP Low 295 293.2 1.18 1.17
AgNP High 1175 1108.3 4.70 4.43
Stock conc. (µg/l) Exposure conc. (µg/l)
96
considered valid if no more than 10 % of control animals were immobilised during the
exposure.
After the 24 h exposure period, neonates were filtered and rinsed with Milli-Q water to
remove any externally bound Ag (Khan et al., 2015). Three biological replicates from all
treatment conditions (Control, AgNP Low, AgNP High, AgNO3 Low and AgNO3 High)
were then blotted dry and transferred to pre-weighed, acid-washed 1.5 ml microfuge tubes.
Tissue wet-weight was then determined by difference before samples were flash frozen in
liquid nitrogen and stored at -80 °C prior to acid-digestion for ICP-MS analysis to
determine initial Ag burden.
The remaining replicates were transferred via an intermediate “wash” beaker of Milli-Q
water to a clean vessel of media10 with 0.5 ml algal feed to begin clearance of the gut
contents thus ending internal exposure (Khan et al., 2015). After 18 h depuration, 3
biological replicates from the three exposure conditions were filtered, rinsed with Milli-Q
water and then transferred into pre-weighed, acid-washed 1.5 ml Eppendorf tubes. Tissue
wet-weight was determined by difference. Samples were flash-frozen in liquid nitrogen
and then stored at -80 until needed for ICP-MS analysis. The exposure media of the
remaining exposures was replaced at 18 h and then every subsequent 24 h until the end of
the exposure. Fresh algal feed was added with every media change. After a total of 96 h,
the remaining three replicates of the control, AgNP High and AgNO3 High treatments
were harvested as described for 0 h and 18 h post-exposure.
4.2.20 Preparation of samples for ICP-MS analysis of internalised silver
Frozen neonates (2.4 – 3.5 mg tissue at T=0, 2.9 – 4.8 mg of tissue at T= 18 h and 12.0 –
17.8 mg tissue at T=96 h) were submerged in 100 µl of concentrated (69 %) trace-metal
grade nitric acid (Fisher Scientific), mixed by vortexing, and then allowed to digest
97
overnight. Once fully digested, samples were transferred to an acid-washed scintillation
vial and diluted to approx 1 % acid by addition of ultrapure water to a total volume of
6.9 ml. A digestion blank was prepared following the same method but with no Daphnia
included. The exposure stocks from section 4.2.19 were prepared for measurement in a
similar way; 100 µl of stock was digested in 100 µl of trace-metal HNO3 as described for
Daphnia samples. Once digested these stocks were diluted to a total volume of 6.9 ml. All
samples intended for measurement were shipped to the Swiss Federal Institute of Aquatic
Science and Technology (EAWAG) for ICP-MS analysis by Dr Smitha Pillai (EAWAG,
Dubendorf, Switzerland). The concentration of total Ag in all submitted samples was
measured by high-resolution ICP-MS (ELEMENT 2, Thermo Scientific) with a lower limit
of detection for Ag of 1 ng/l. Each sample was measured ten times from which an average
measurement was taken. Blanks were measured after every ten samples alongside two
references containing known concentrations of Ag. All blanks returned values below the
1 ng/l of total Ag detection limit. The results from the reference samples were used in the
normalisation of sample concentrations. The measured concentrations of the reference
samples were within acceptable ranges. The measured internal concentrations of silver of
individual samples were normalised by their individually measured sample wet-weight. A
1-way ANOVA was used on the same data followed by a Tukey post-hoc test to compare
the differences in Ag body-burdens between treatment groups. The uptake and data was
also analysed by 2-way ANOVA followed by Sidak’s multiple comparison test to compare
the effects of concentration and treatment type on Daphnid Ag body-burden. Depuration
data was analysed using a 2-way ANOVA followed by Sidak’s multiple comparison test to
compare the impact of total depuration time and treatment type on the body burden of Ag-
exposed Daphnia in terms of % initial body burden.
98
4.3 Result and Discussion
4.3.1 Exposure to the capping agent and bulk-Ag controls does not induce an adverse
transcriptional or metabolic response.
All neonates from the no-added silver, PVP and bulk silver (3 μm average diameter)
control survived the 24 h exposures indicating a valid experiment (Appendix Table 9.4).
Prior to analysis of toxicant exposures, the metabolic and transcriptional profiles of these
control groups were compared using PCA (Figure 4.3). In total, the 4 PCs that constituted
either model described approximately 61.24 % of the transcriptomics data and 71.85 % of
the metabolomics data, representing the greatest trends/patterns in the data. Scores
generated for the samples within each condition were compared by a 1-way ANOVA to
identify potential statistical differences between the groups. These comparisons were
performed for each of the 4 PCs within the multivariate model. Following adjustment for
multiple testing (Benjamini and Hochberg, 1995) all of the calculated p-values were
greater than 0.05 indicating no significant separation between the three controls groups
along any PC (Table 4.4). A univariate comparison of the relative intensities of genes-
spots or m/z peaks within the three groups of profiles indicated no significant changes in
expression or concentration. The results of these analyses indicate no difference between
the transcriptome and metabolome of these animals, implying that no adverse effects had
been induced in response to PVP or bulk-Ag exposure. With this in mind these three
groups will therefore be classed as a single “combined control” group for statistical
analyses of Ag exposed profiles to identify only those changes occurring as a result of
AgNP or AgNO3 exposure.
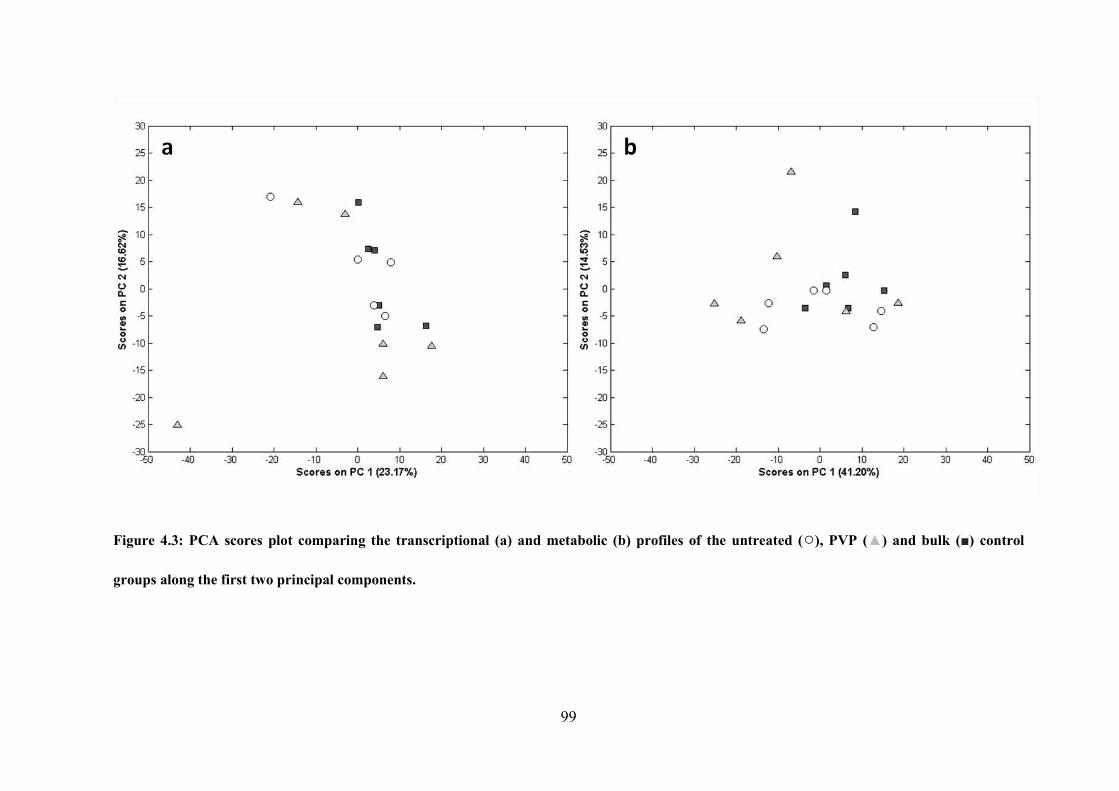
99
Figure 4.3: PCA scores plot comparing the transcriptional (a) and metabolic (b) profiles of the untreated (), PVP () and bulk () control
groups along the first two principal components.
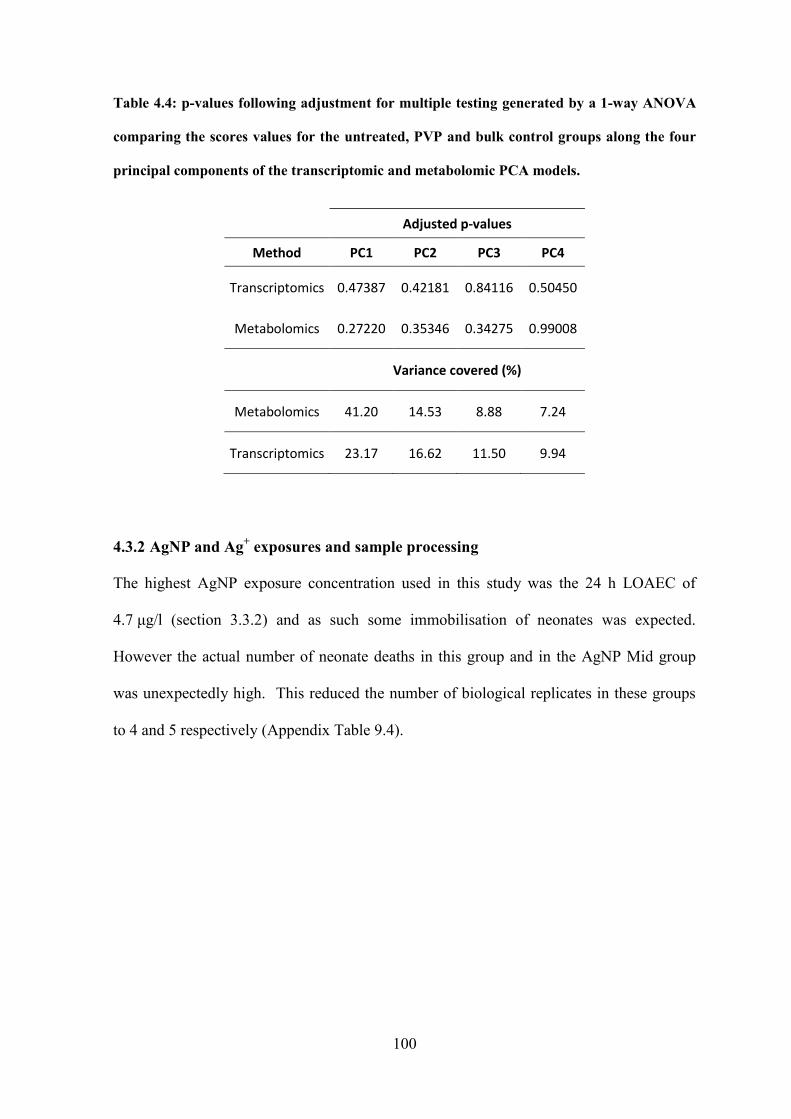
100
Table 4.4: p-values following adjustment for multiple testing generated by a 1-way ANOVA
comparing the scores values for the untreated, PVP and bulk control groups along the four
principal components of the transcriptomic and metabolomic PCA models.
Adjusted p-values Method PC1 PC2 PC3 PC4
Transcriptomics 0.47387 0.42181 0.84116 0.50450
Metabolomics 0.27220 0.35346 0.34275 0.99008
Variance covered (%)
Metabolomics 41.20 14.53 8.88 7.24
Transcriptomics 23.17 16.62 11.50 9.94
4.3.2 AgNP and Ag+ exposures and sample processing
The highest AgNP exposure concentration used in this study was the 24 h LOAEC of
4.7 μg/l (section 3.3.2) and as such some immobilisation of neonates was expected.
However the actual number of neonate deaths in this group and in the AgNP Mid group
was unexpectedly high. This reduced the number of biological replicates in these groups
to 4 and 5 respectively (Appendix Table 9.4).
101
Additionally, one biological replicate was lost from the Ag High exposure group due to a
loose tube cap during sample homogenisation. During the processing of transcriptomics
data, two arrays were removed from the study; an untreated control replicate produced a
“black hole”, whereby only the outer wells hybridised and one AgNP High replicate
showed substantial variation from the remaining samples in the group resulting from non-
specific hybridisation as indicated by the spike-in QC oligonucleotides. Both samples
were removed as the data they provided was considered unreliable and not a true
representation of the exposed animals’ transcripome. No samples were removed from the
metabolomics data during processing.
4.3.3 Ag NPs induce a dose-dependent perturbation to Daphnia gene transcription
and metabolism which is not fully accounted for by the Ag+ content of AgNP
exposures
After data acquisition and processing, PCA was used to assess the variation of the
transcriptional and metabolic profiles of all animals used in this study. Models consisting
of 4 PCs were created and scores values for PC1 and PC2, the PCs covering the greatest
variation, were plotted for both transcriptional (Figure 4.4) and metabolic (Figure 4.5)
profiles. The untreated, PVP and Bulk controls groups are indicated separately on the
plots but were treated as a combined control for all statistics. The raw and transformed
microarray data matrices produced from this work is available in the ArrayExpress
database (www.ebi.ac.uk/arrayexpress) using the accession number: E-MTAB-4041.
Likewise the FT-ICR data is obtainable from the MetaboLights database
(http://www.ebi.ac.uk/metabolights) using the accession number: MTBLS259.
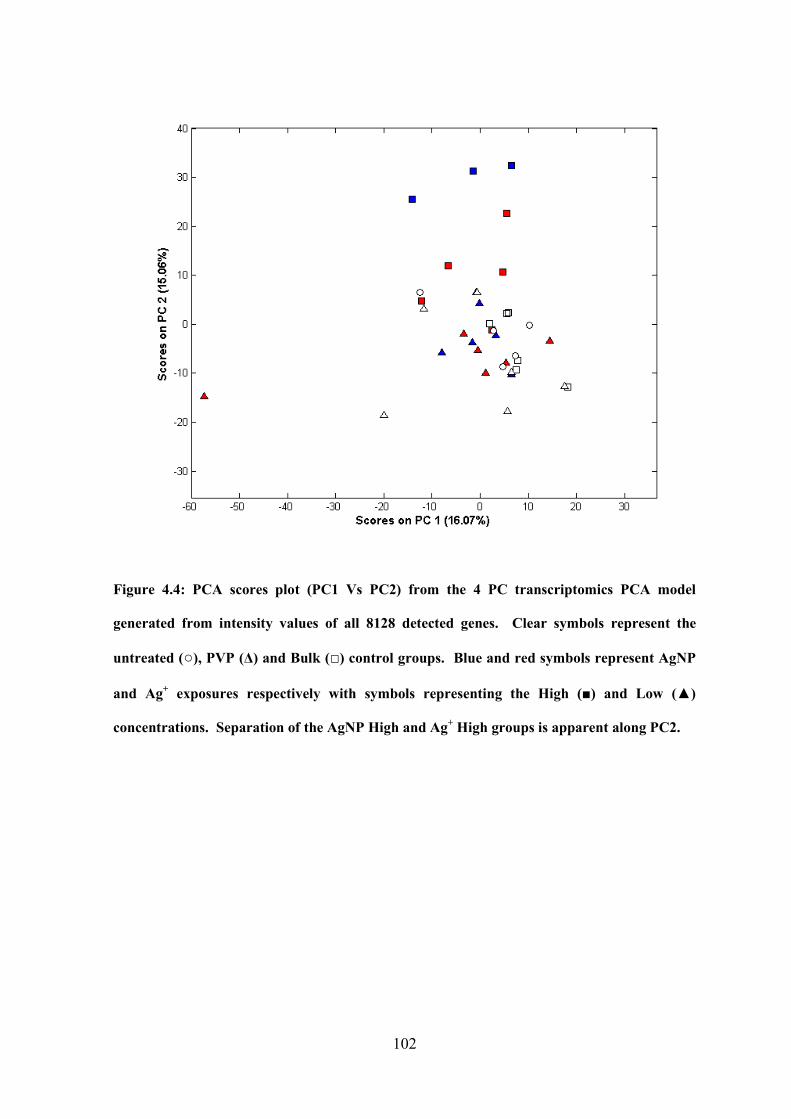
102
Figure 4.4: PCA scores plot (PC1 Vs PC2) from the 4 PC transcriptomics PCA model
generated from intensity values of all 8128 detected genes. Clear symbols represent the
untreated (), PVP (Δ) and Bulk () control groups. Blue and red symbols represent AgNP
and Ag+ exposures respectively with symbols representing the High () and Low ()
concentrations. Separation of the AgNP High and Ag+ High groups is apparent along PC2.
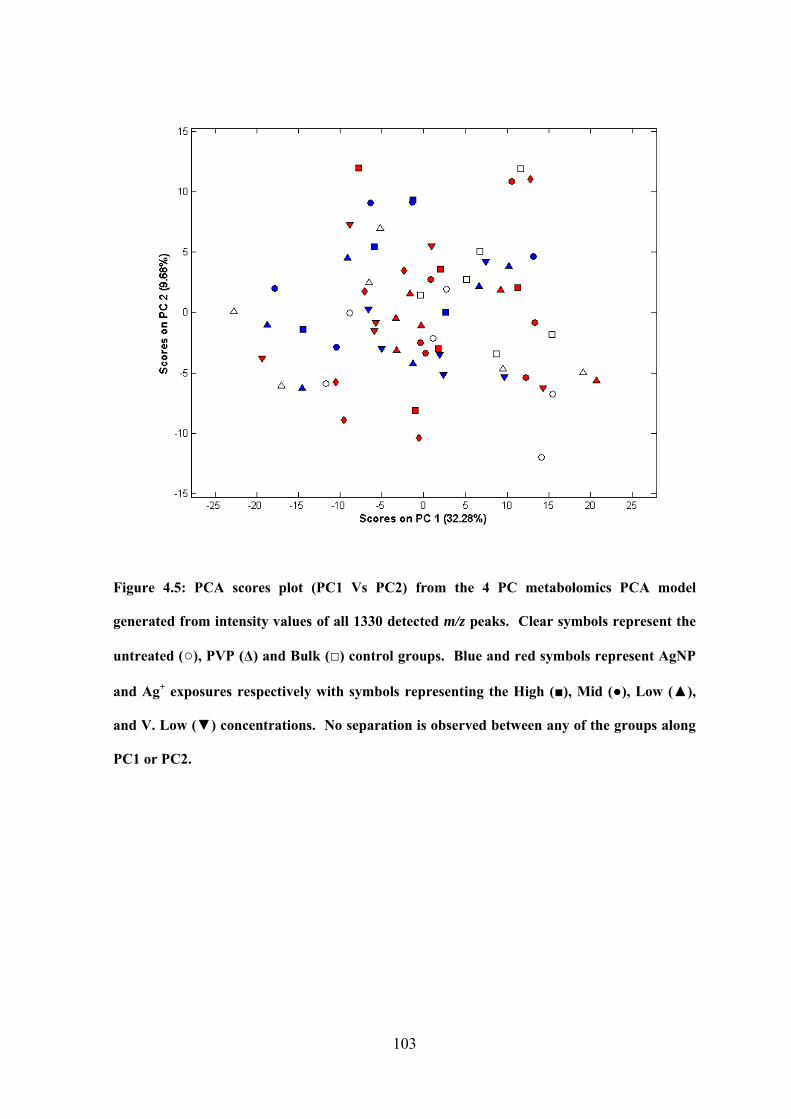
103
Figure 4.5: PCA scores plot (PC1 Vs PC2) from the 4 PC metabolomics PCA model
generated from intensity values of all 1330 detected m/z peaks. Clear symbols represent the
untreated (), PVP (Δ) and Bulk () control groups. Blue and red symbols represent AgNP
and Ag+ exposures respectively with symbols representing the High (), Mid (), Low (),
and V. Low () concentrations. No separation is observed between any of the groups along
PC1 or PC2.
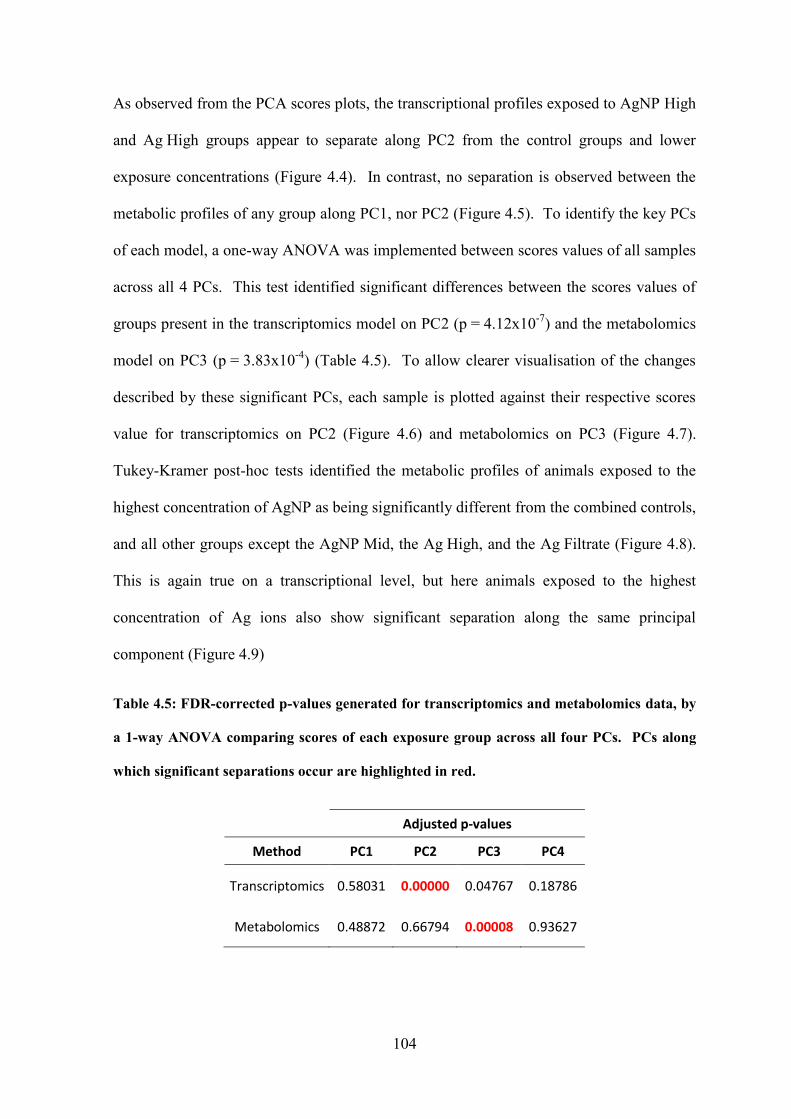
104
As observed from the PCA scores plots, the transcriptional profiles exposed to AgNP High
and Ag High groups appear to separate along PC2 from the control groups and lower
exposure concentrations (Figure 4.4). In contrast, no separation is observed between the
metabolic profiles of any group along PC1, nor PC2 (Figure 4.5). To identify the key PCs
of each model, a one-way ANOVA was implemented between scores values of all samples
across all 4 PCs. This test identified significant differences between the scores values of
groups present in the transcriptomics model on PC2 (p = 4.12x10⁻⁷) and the metabolomics
model on PC3 (p = 3.83x10⁻⁴) (Table 4.5). To allow clearer visualisation of the changes
described by these significant PCs, each sample is plotted against their respective scores
value for transcriptomics on PC2 (Figure 4.6) and metabolomics on PC3 (Figure 4.7).
Tukey-Kramer post-hoc tests identified the metabolic profiles of animals exposed to the
highest concentration of AgNP as being significantly different from the combined controls,
and all other groups except the AgNP Mid, the Ag High, and the Ag Filtrate (Figure 4.8).
This is again true on a transcriptional level, but here animals exposed to the highest
concentration of Ag ions also show significant separation along the same principal
component (Figure 4.9)
Table 4.5: FDR-corrected p-values generated for transcriptomics and metabolomics data, by
a 1-way ANOVA comparing scores of each exposure group across all four PCs. PCs along
which significant separations occur are highlighted in red.
Adjusted p-values
Method PC1 PC2 PC3 PC4
Transcriptomics 0.58031 0.00000 0.04767 0.18786
Metabolomics 0.48872 0.66794 0.00008 0.93627
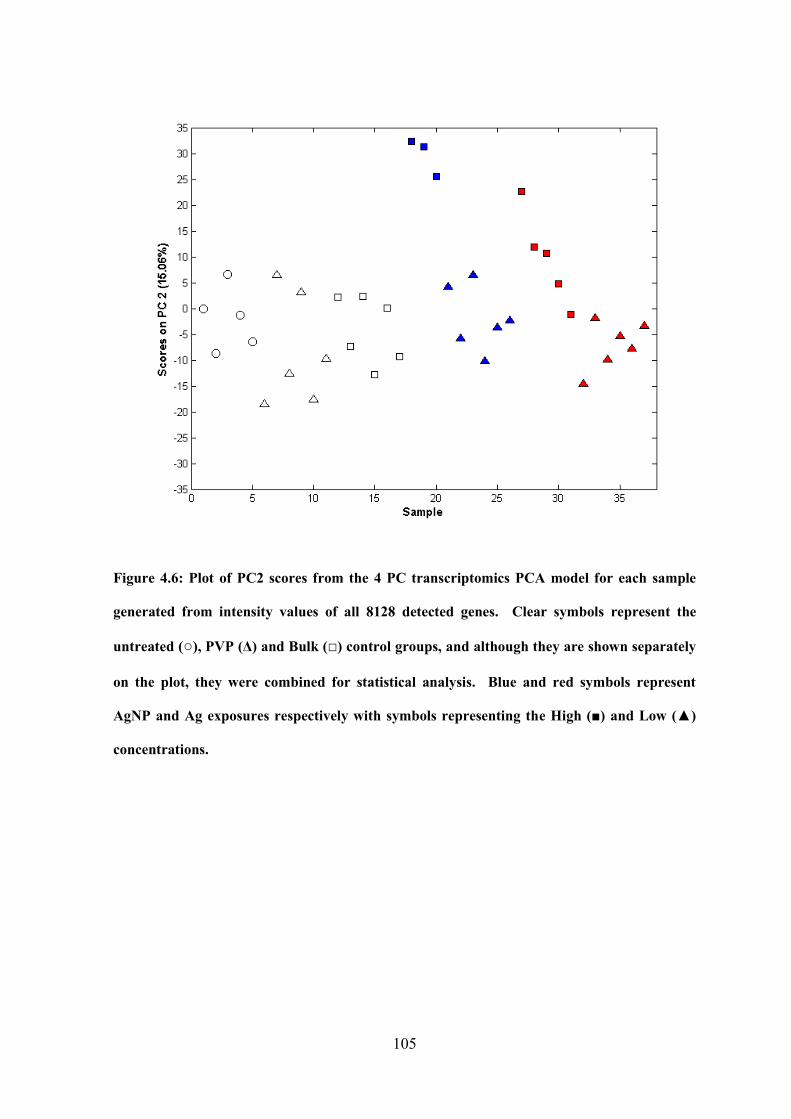
105
Figure 4.6: Plot of PC2 scores from the 4 PC transcriptomics PCA model for each sample
generated from intensity values of all 8128 detected genes. Clear symbols represent the
untreated (), PVP (Δ) and Bulk () control groups, and although they are shown separately
on the plot, they were combined for statistical analysis. Blue and red symbols represent
AgNP and Ag exposures respectively with symbols representing the High () and Low ()
concentrations.
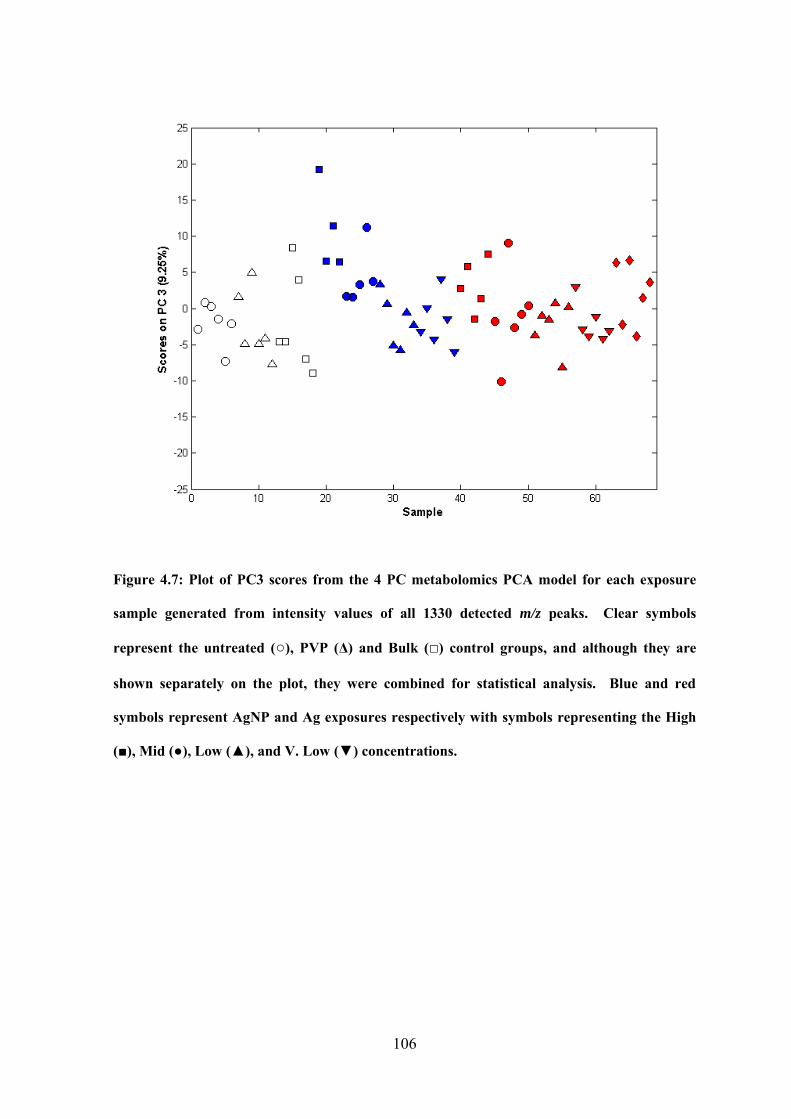
106
Figure 4.7: Plot of PC3 scores from the 4 PC metabolomics PCA model for each exposure
sample generated from intensity values of all 1330 detected m/z peaks. Clear symbols
represent the untreated (), PVP (Δ) and Bulk () control groups, and although they are
shown separately on the plot, they were combined for statistical analysis. Blue and red
symbols represent AgNP and Ag exposures respectively with symbols representing the High
(), Mid (), Low (), and V. Low () concentrations.
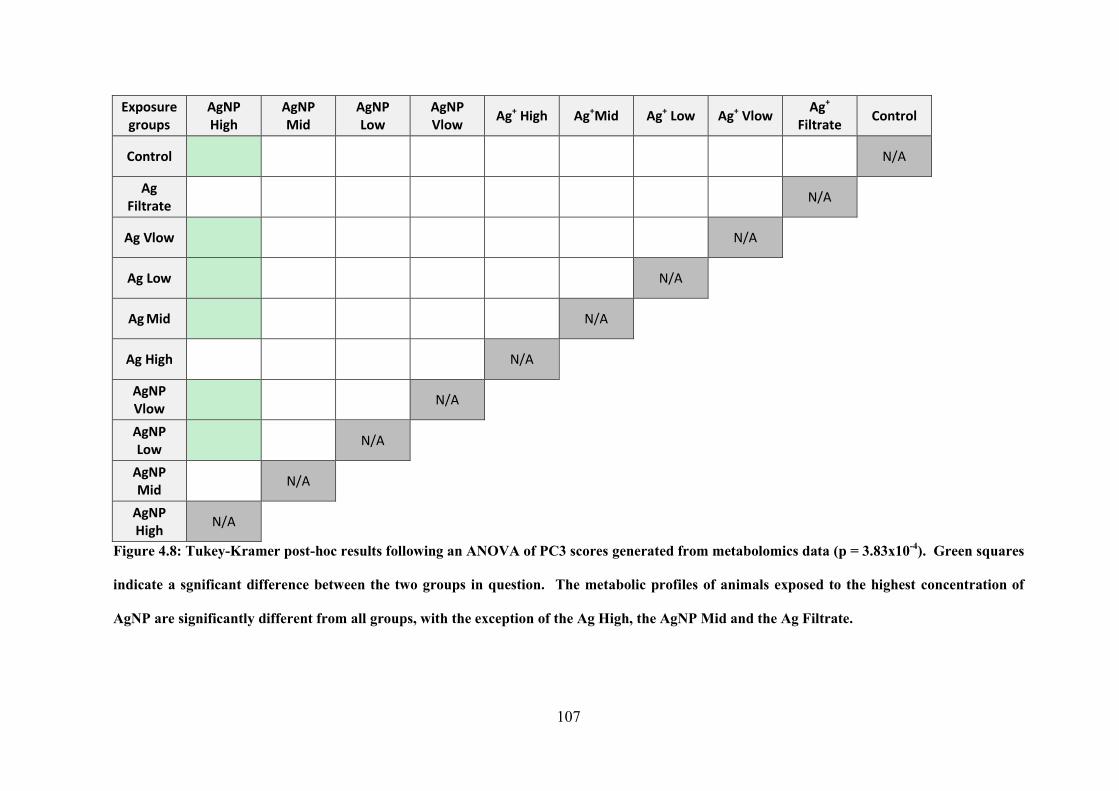
107
Exposure groups
AgNP High
AgNP Mid
AgNP Low
AgNP Vlow
Ag+ High Ag+Mid Ag+ Low Ag+ Vlow Ag+
Filtrate Control
Control N/A
Ag Filtrate
N/A
Ag Vlow N/A
Ag Low N/A
Ag Mid N/A
Ag High N/A
AgNP Vlow
N/A
AgNP Low
N/A
AgNP Mid
N/A
AgNP High
N/A
Figure 4.8: Tukey-Kramer post-hoc results following an ANOVA of PC3 scores generated from metabolomics data (p = 3.83x10⁻⁴). Green squares
indicate a sgnificant difference between the two groups in question. The metabolic profiles of animals exposed to the highest concentration of
AgNP are significantly different from all groups, with the exception of the Ag High, the AgNP Mid and the Ag Filtrate.
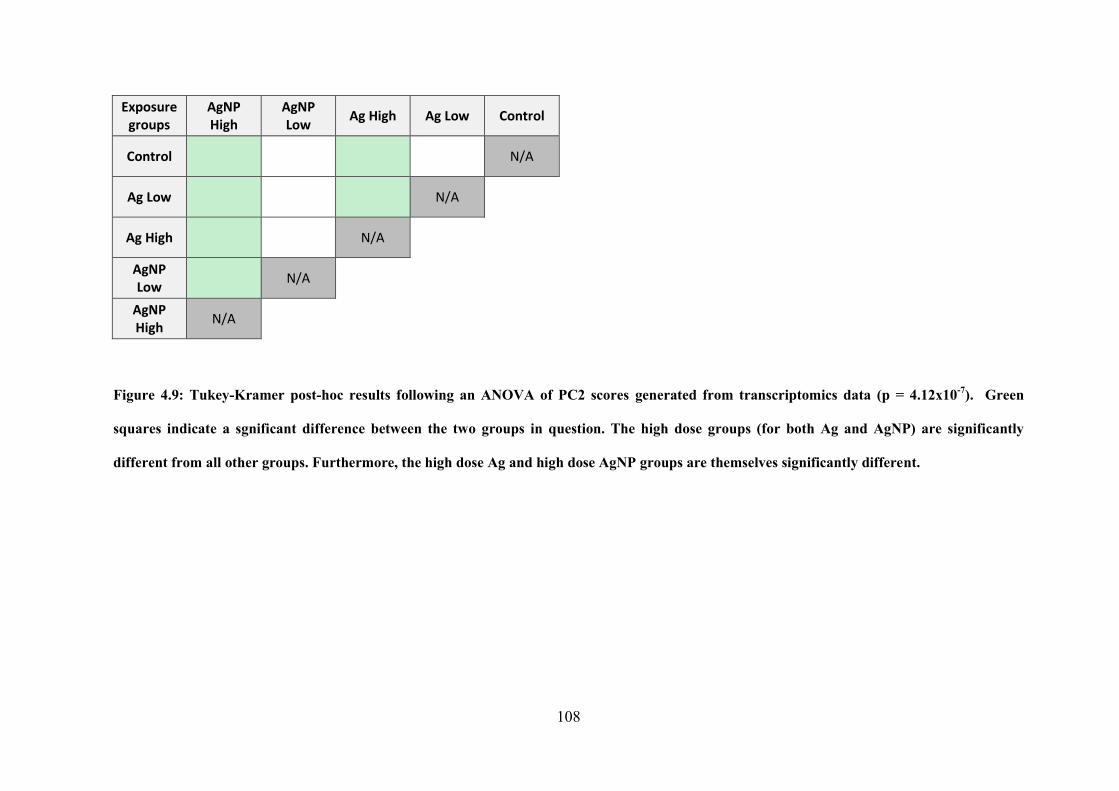
108
Exposure groups
AgNP High
AgNP Low
Ag High Ag Low Control
Control N/A
Ag Low N/A
Ag High N/A
AgNP Low
N/A
AgNP High
N/A
Figure 4.9: Tukey-Kramer post-hoc results following an ANOVA of PC2 scores generated from transcriptomics data (p = 4.12x10⁻⁷). Green
squares indicate a sgnificant difference between the two groups in question. The high dose groups (for both Ag and AgNP) are significantly
different from all other groups. Furthermore, the high dose Ag and high dose AgNP groups are themselves significantly different.
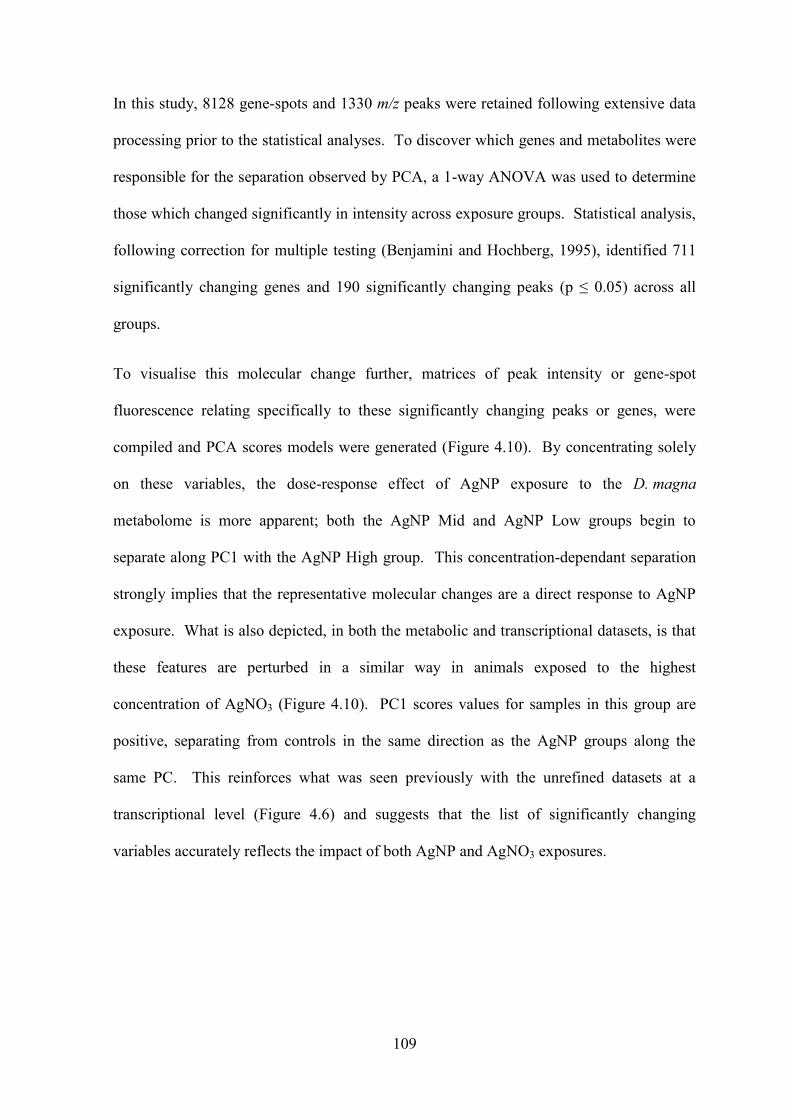
109
In this study, 8128 gene-spots and 1330 m/z peaks were retained following extensive data
processing prior to the statistical analyses. To discover which genes and metabolites were
responsible for the separation observed by PCA, a 1-way ANOVA was used to determine
those which changed significantly in intensity across exposure groups. Statistical analysis,
following correction for multiple testing (Benjamini and Hochberg, 1995), identified 711
significantly changing genes and 190 significantly changing peaks (p ≤ 0.05) across all
groups.
To visualise this molecular change further, matrices of peak intensity or gene-spot
fluorescence relating specifically to these significantly changing peaks or genes, were
compiled and PCA scores models were generated (Figure 4.10). By concentrating solely
on these variables, the dose-response effect of AgNP exposure to the D. magna
metabolome is more apparent; both the AgNP Mid and AgNP Low groups begin to
separate along PC1 with the AgNP High group. This concentration-dependant separation
strongly implies that the representative molecular changes are a direct response to AgNP
exposure. What is also depicted, in both the metabolic and transcriptional datasets, is that
these features are perturbed in a similar way in animals exposed to the highest
concentration of AgNO3 (Figure 4.10). PC1 scores values for samples in this group are
positive, separating from controls in the same direction as the AgNP groups along the
same PC. This reinforces what was seen previously with the unrefined datasets at a
transcriptional level (Figure 4.6) and suggests that the list of significantly changing
variables accurately reflects the impact of both AgNP and AgNO3 exposures.
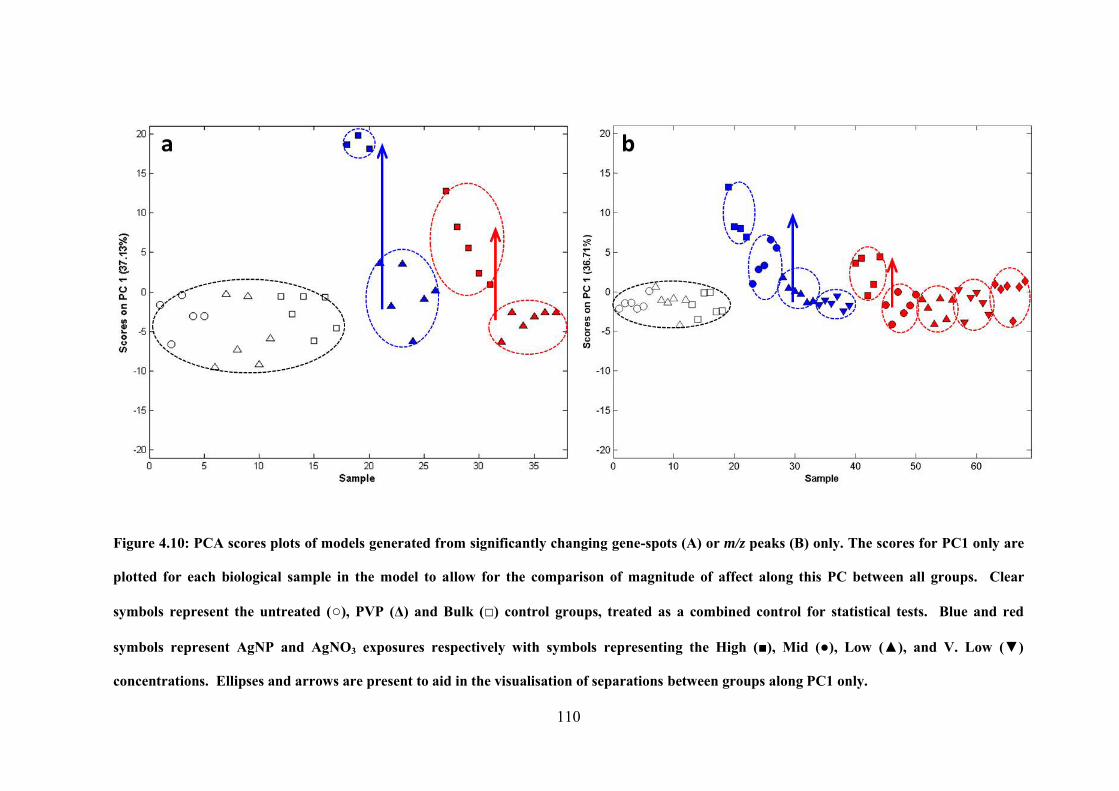
110
Figure 4.10: PCA scores plots of models generated from significantly changing gene-spots (A) or m/z peaks (B) only. The scores for PC1 only are
plotted for each biological sample in the model to allow for the comparison of magnitude of affect along this PC between all groups. Clear
symbols represent the untreated (), PVP (Δ) and Bulk () control groups, treated as a combined control for statistical tests. Blue and red
symbols represent AgNP and AgNO3 exposures respectively with symbols representing the High (), Mid (), Low (), and V. Low ()
concentrations. Ellipses and arrows are present to aid in the visualisation of separations between groups along PC1 only.
111
In the case of this study, PCA is analysing all possible related patterns of variance in the
transcriptional or metabolic profiles of animals; and then ranking these patterns as PCs in
order of total variance described. Each PC therefore represents a particular pattern of
changes in gene expression or metabolite concentration. Samples that generate similar
scores values on a particular PC are likely to have similar profiles. If members of two
exposure groups separate from the control in the same direction along a principal
component then it suggests that a similar response is being induced. This is what is
observed in the significant molecular response of animals exposed to the highest
concentrations of both forms of silver (Figure 4.10). When observing the significant
changes induced upon the transcriptome and the metabolome, the profiles of animals
exposed to the highest concentration of either AgNP or AgNO3 in both cases separate from
controls in the same positive direction along PC1. This implies that both AgNP and
dissolved Ag induce a similar transcriptional profile and also a similar metabolic profile,
though it is not possible at this stage to say if the two omics profiles are related. Along
with this shared exposure profile, there is a significant difference in the magnitude of
response between the transcriptional profiles of the AgNP High samples and their
dissolved Ag counterparts (Figure 4.9). This implies that at these concentrations, AgNPs
induce a greater level of response than exposures to the dissolved Ag fraction alone, though
the molecular responses induced by each form appear to be similar.
It is therefore unlikely that AgNPs and Ag+ induce toxicity by different mechanisms, as
this would have been represented by separation of the AgNP and AgNO3 exposure groups
along different PCs (e.g. AgNP on PC1 and AgNO3 on PC2) in PCA scores plots. The
similarities in the induced profiles could suggest that Ag+ is the mediator of toxicity for
AgNP. This would be consistent with previous studies that have shown a complete
reduction of AgNP toxicity following chelation of the free-ion form of Ag (Zhao and
112
Wang, 2011). If this was the case the greater magnitude of response observed for AgNP-
exposed animals could be the result of the Trojan-horse mechanism. This would mean that
the absorption and subsequent internal dissolution of AgNPs (either in the lumen of the gut
or within tissues) could result in a large internal concentration of toxic Ag+, with the
AgNPs themselves remaining relatively non-toxic. Alternatively this result could mean
that both AgNP and dissolved Ag induce toxicity independently, but that both forms of Ag
induce the same molecular profile changes. This would account for the greater magnitude
of response observed in AgNP-exposed animals, as the theoretical total Ag concentration
of AgNP exposures is greater than that of their counterpart AgNO3 exposures. Both
explanations would conform to the results of previous mechanistic investigations of the
two forms of silver which concluded that both species of Ag induced a similar molecular
response (Aerle et al., 2013; Ahn et al., 2014; De Matteis et al., 2015), including an NMR-
based metabolomics investigation in D. magna which showed agreement between the
overall molecular profiles induced by both forms of silver by PCA (Li et al., 2015a).
However, it has been observed previously that chelation of Ag+ in AgNP suspensions
results in a complete reduction of AgNP toxicity to D. magna (Kennedy et al., 2010; Zhao
and Wang, 2011; Newton et al., 2013) suggesting that AgNPs themselves have little-to-no
inherent toxicity compared to dissolved Ag. It is more likely that if AgNPs induced
toxicity independent of any released Ag+, the changes observed would be unique to those
induced by Ag+ which would be reflected in the transcriptional and metabolic profiles
observed by PCA. These differences were not observed, suggested that dissolved Ag is
the form responsible for AgNP toxicity.
4.3.4 AgNP likely enact toxicity via the digestive tract
The concentration of total Ag associated with D. magna following AgNP and AgNO3
exposures was investigated using ICP-MS to gain greater insight into the role of Ag uptake
113
in the mechanism of toxicity. AgNP and AgNO3 stocks used in sub-lethal uptake
exposures were measured by ICP-MS and the AgNO3 stocks were found to be slightly
higher than originally intended (Table 4.3). The Ag+ High stock is 8.06 % of the
AgNP High stock which is within 1 SD of the mean percentage dissolution at 24 h (5.68 %
± 2.87). The Ag+ Low stock is 10.50 % of its AgNP counterpart which is above the
originally intended range; this must be taken into account when interpreting results.
After a 24 h exposure, the concentration of associated silver was measured by ICP-MS,
and body burden was calculated in terms of µg of Ag per g of daphnid wet weight.
Animals exposed to the lowest concentrations of AgNP (1.17 µg/l) and dissolved Ag
(0.12 µg/l) were measured to have average body burdens of 0.4316 ± 0.7475 µg/l and
0.5443 ± 0.0605 µg/l respectively. Exposure to 4.43 µg/l of AgNP and 0.36 µg/l of
dissolved silver yielded respective D. magna body-burdens of 3.8402 ± 0.2695 µg/l and
1.9632 ± 0.3099 µg/l. The Ag body burden of animals exposed to the lowest
concentrations of AgNO3 and AgNP (0.12 µg/l and 1.17 µg/l respectively) were deemed as
not being significantly different to controls by a 1-way ANOVA followed by Dunnett’s
multiple comparison test. It is worth noting that two of the three AgNP Low biological
replicates failed to measure any silver associated with the exposed animals, whereas the
third measured 1.27 µg/g; this resulted in a SD value larger than the mean. At the highest
concentration AgNO3 (0.12 µg/l) AgNP (1.17 µg/l) exposures there is significantly more
(p < 0.0001) Ag associated with the animals upon exposure compared to control animals.
The relationship between total Ag exposure concentration and body-burden for AgNP and
AgNO3 exposed Daphnia is shown in Figure 4.11. With respect to the total concentration
of Ag in the exposure media, AgNO3 exposures result in a higher body burden of Ag
within the exposed animals than AgNPs, highlighting the difference in uptake rate and
bioavailability between the two species of silver.
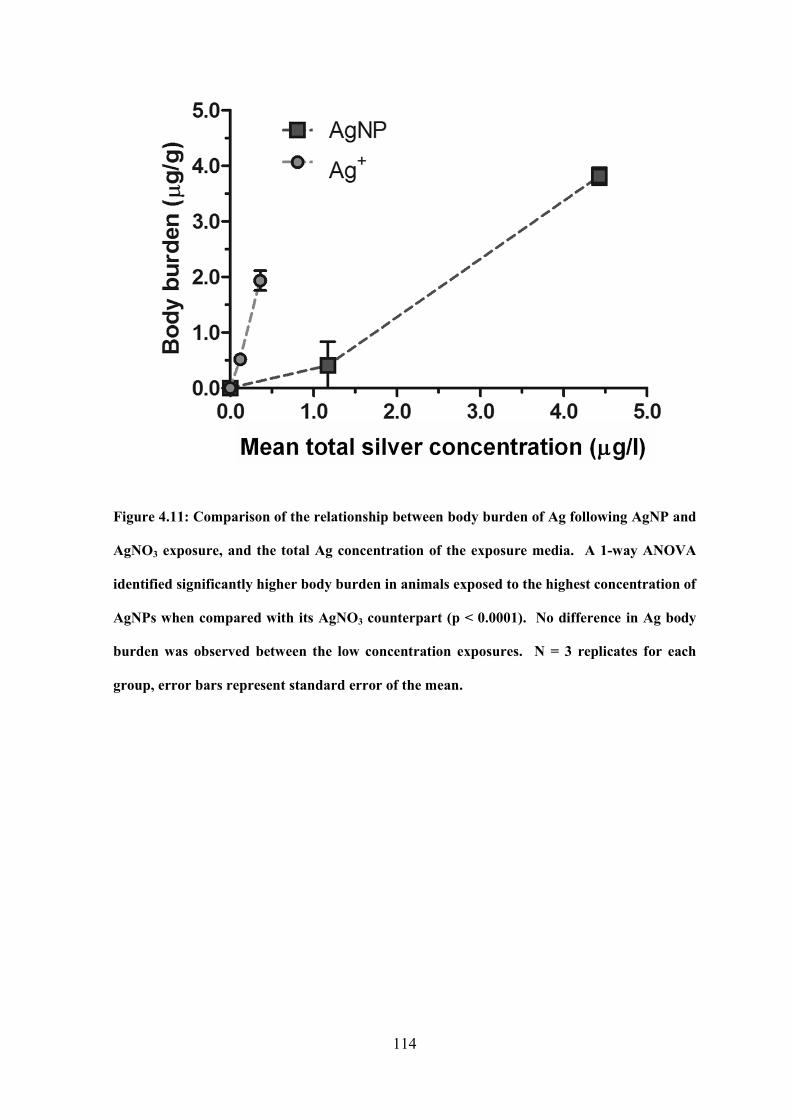
114
Figure 4.11: Comparison of the relationship between body burden of Ag following AgNP and
AgNO3 exposure, and the total Ag concentration of the exposure media. A 1-way ANOVA
identified significantly higher body burden in animals exposed to the highest concentration of
AgNPs when compared with its AgNO3 counterpart (p < 0.0001). No difference in Ag body
burden was observed between the low concentration exposures. N = 3 replicates for each
group, error bars represent standard error of the mean.
115
The total Ag concentrations of AgNO3 in this experiment were chosen to represent the
concentration of the dissolved Ag fraction of their respective AgNP exposures. In theory,
the AgNO3 Low and AgNP Low should contain the same concentrations of dissolved Ag.
Likewise this should be the case for the AgNO3 High and AgNP High groups. When
analysed by a 2-way ANOVA comparing these nominal treatment and concentration
goups, it was deemed that concentration of toxicant had a significant impact on the
resulting body-burden (p = 0.0063) and that animals exposed to AgNP yielded
significantly greater body-burdens than D. magna exposed to the respective dissolved
silver fraction alone (p < 0.0001) as depicted in Figure 4.12. This latter result suggests that
AgNPs must account for some of the total Ag measured within these organisms, if only
dissolved Ag was absorbed into or onto the animals (i.e., if the neonates did not or could
not ingest the nanoparticles), it would be more likely that there would be no significant
difference between the AgNP High and AgNO3 High exposures.
The methodology of this experiment included a “rinse” step with Milli-Q water prior to
measurement by ICP-MS in order to remove any Ag attached to the external surface of the
organisms. Because of this, it is likely that any Ag measured within the acid-digested
Daphnia samples was contained within the organism; however there is still a chance that
some Ag was attached to the carapace. The ingestion of AgNP by D. magna has been
observed previously through measurement of AgNP uptake and efflux using ICP-MS
(Zhao and Wang, 2010; Khan et al., 2015), and through secondary ion mass spectrometry
(SIMS), a MS-based imaging technique that successfully detected the presence of silver,
following AgNP exposure in the digestive tract of D. magna (Audinot et al., 2013).
However, this data cannot distinguish between the presence of Ag within the gut or
attached to the carapace of exposed Daphnia, and Ag that has accumulated within the
animal’s tissues.

116
Figure 4.12: Comparison of body burden of Ag following exposure to Low and High
concentrations of AgNO3 and AgNPs. A 2-way ANOVA followed by Sidak’s multiple
comparison test determined significantly higher body burdens observed in animals exposed
to AgNPs in comparison to their corresponding dissolved Ag fractions alone (p < 0.0001).
The concentration of toxicant was also deemed to have a significant impact on Ag body
burden (p = 0.0063). N = 3 replicates for each group, error bars represent standard deviation.
117
As an addition to the assessment of AgNP uptake into D. magna the elimination of both
AgNPs and AgNO3 were also measured (Figure 4.13). Following an exposure to
AgNP High and to the respective dissolved Ag fraction for 24 h, animals were
immediately transferred to clean media10 with algal feed to promote gut-clearance. The
concentration of silver within animals was measured at 18 h and again at 96 h (4 d) after
exposures had finished. Elimination was plotted as a percentage of absorbed total silver
(0 h) against time (Figure 4.13). The Ag body burden of animals at 0 h was measured to
be 3.8402 ± 0.2695 µg/l for AgNPs and 1.9632 ± 0.3099 µg/l for AgNO3. After an 18 h
depuration period, the body burden of animals that were exposed to AgNPs has reduced to
0.8805 ± 0.5645 µg/l, equating to 23.1 % of the 0 h concentration. Likewise after 18 h the
body burden of animals that were exposed to AgNO3 has reduced to 2.8 %. At the final
96 h time point, AgNP-exposed animals have a body burden of 0.0423 ± 0.0081, which is
approximately 2.2 % of the original body burden. The Ag body burden of Daphnia
exposed to AgNO3 is below the detection limit of the instrument, potentially indicating a
complete removal of all internal silver at this point.
The burden of silver within animals exposed to both AgNP and Ag+ ions reduces
significantly (p < 0.0001) 18 h following the end of exposure, and by 96 h post-exposure
the internalised silver is nearly completely removed. Due to the lack of data points, fitting
the data to a single-step or two-step depuration model was not possible, and the data
should be considered as preliminary. However, the resulting plot (Figure 4.13) is similar
in profile to those plotted previously by studies investigating the influx and efflux of
AgNP (Zhao and Wang, 2010; Khan et al., 2015) and gold nanoparticles (Khan et al.,
2014) in Daphnia magna. These previous efflux patterns are typically biphasic, with the
initial rapid phase describing the passage of NPs through the digestive tract and the
second, slower phase relating to the elimination of NPs which had either been absorbed
118
from the gut into the surrounding tissue or simply remain in the lumen (Khan et al., 2015).
In this study, the initial rapid removal of silver observed over the initial 18 h matches
previously published data (Khan et al., 2015), but 96 h after the end of exposure almost all
of the silver within the organism over the 24 h exposure period was completely cleared.
This differs to previous work which see approximately 10 % of the initial Ag content
remaining within exposed D. magna even as long as 5 days following exposure. This
suggests that in this study the silver may not be retained to a substantial degree within the
tissues of D. magna, but instead passes relatively rapidly through the organism.
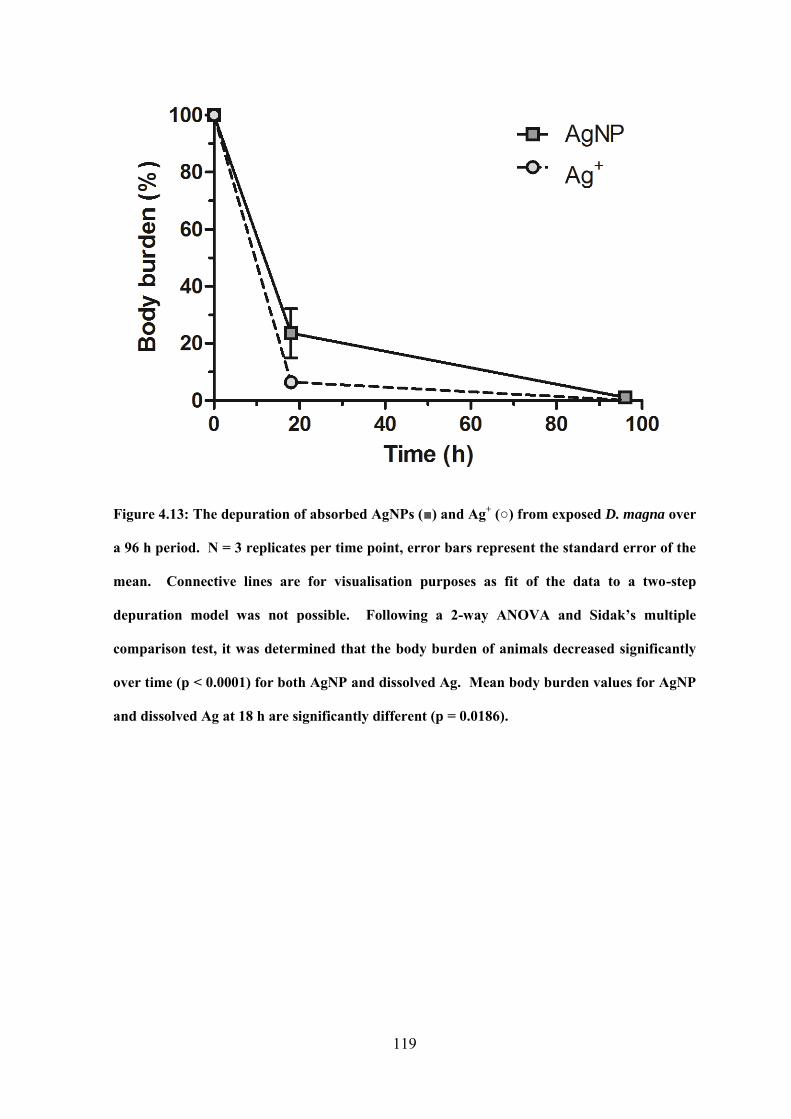
119
Figure 4.13: The depuration of absorbed AgNPs () and Ag+ () from exposed D. magna over
a 96 h period. N = 3 replicates per time point, error bars represent the standard error of the
mean. Connective lines are for visualisation purposes as fit of the data to a two-step
depuration model was not possible. Following a 2-way ANOVA and Sidak’s multiple
comparison test, it was determined that the body burden of animals decreased significantly
over time (p < 0.0001) for both AgNP and dissolved Ag. Mean body burden values for AgNP
and dissolved Ag at 18 h are significantly different (p = 0.0186).
120
4.4 Conclusion
The primary aim of this chapter was to determine which of three hypothetical mechanisms
proposed in the introduction to this chapter (Figure 4.1), if any, best described the role of
dissolved Ag in AgNP toxicity. From comparison of the transcriptional and metabolic
profiles of D. magna neonates exposed to AgNPs and dissolved Ag, the data suggests that
both forms of Ag induce similar overall molecular responses. These similarities in profiles
suggest that exposure to AgNPs induce the same molecular perturbations as exposure to
AgNO3, which would be consistent with dissolved Ag as the mediator of toxicity for
AgNP. This conclusion would be consistent with previous studies that have shown a
complete reduction of AgNP toxicity following chelation of the free-ion form of Ag (Zhao
and Wang, 2011). It is therefore likely that the dissolved silver fraction is responsible for
AgNP-induced toxicity as in mechanism 1 and 3 (Figure 4.1). However, the elevated Ag
body-burden and omics response observed for AgNP exposed animals compared to that of
animals exposed to the dissolved fraction alone suggests that although the dissolved silver
fraction is responsible for AgNP-induced toxicity, it is unlikely to do so following
dissolution external to the organisms. This data would therefore disprove hypothesised
mechanism 1.
The data presented in this chapter also does not fit fully with the second hypothetical
mechanism which suggested simultaneous, different, but potentially synergistic
mechanisms for AgNPs and dissolved Ag (Figure 4.1). Mechanism 2 hypothesises that
AgNPs and dissolved Ag ions both induce toxicity upon exposure through separate and
potentially synergistic mechanism. If the responses induced by the two forms of Ag were
different this would have been reflected in PCA of transcriptional and metabolic profiles;
the two forms of silver would have been seen to separate along separate PCs rather than to
differing magnitudes on the same PC. Unlike mechanism 1 above however, mechanism 2
121
cannot be ruled out completely. The limited annotation of the D. magna microarray and
the limitations in detecting many naturally low-level metabolites means it is still possible
that some significant differences between the two mechanisms exist but remain largely
undetected.
The combination of results from omics analyses and determination of total Ag body
burden would therefore better suit a Trojan-horse type mechanism (mechanism 3, Figure
4.1); whereby AgNPs are ingested by D. magna, resulting in a concentrated delivery of
Ag+ ions following AgNP dissolution within tissues or the lumen of the gut and an
elevated molecular response.
122
Chapter 5: Elucidating the molecular mode of action of silver
nanoparticles to Daphnia magna
5.1 Introduction
The molecular perturbations induced by Ag and AgNPs are still mostly uncharacterised
but a number of mechanistic studies in recent years have highlighted some key responses
and areas for further investigation. A potential limitation of these studies is their use of a
targeted, hypothesis-driven approach. An advantage of omics-technologies is the ability to
use a non-targeted approach for mechanistic investigation (Keun, 2006); measuring
hundreds of endpoints rather than focusing on a select few (Viant, 2009). This alternative
approach to study-design potentially allows for the generation of new hypotheses and the
identification of otherwise unconsidered mechanisms for investigation in cases where the
prior knowledge for the traditional targeted approach is still lacking; as is the case for
AgNPs. There are currently three high-thoughput “omics” analyses of AgNP and AgNO3
toxicity in D. magna; a microarray investigation into the impact of exposure on the
transcriptome (Poynton et al., 2012), a redox-proteomic approach using two-dimensional
electrophoresis (2DE) (Rainville et al., 2014), and a 1H-NMR-based analysis comparing
the overall impact on the metabolic profiles (Li et al., 2015a).
To investigate the transcriptional impact of AgNP exposures, the transcriptional profiles of
10 day old D. magna adults exposed to the 1/10 LC50 and the LC25 of citrate and PVP-
stabilised AgNPs, as well as the ¼ LC25 and ½ LC25 of AgNO3 were compared following a
24 h exposure (Poynton et al., 2012). Enrichment analysis of these profiles highlighted
several gene ontology (GO) terms as being enriched or over represented. AgNP were seen
to induce in increase in protein ubiquitination and proteolysis and in cellular signalling
processes, whereas AgNO3 exposure resulted in an increase in transcription of genes
123
related to energy production and cellular respiration as well as a decrease in those involved
in embryonic morphogenesis and segmentation, eye photoreceptor development and
reproduction and oogenesis (Poynton et al., 2012).
The proteomic investigation by Rainville et al. analysed the impact of a 24 h exposure to 5,
15, 20 and 30 µg/L of AgNPs and 0.4, 1.2 and 2.5 µg/L AgNO3 on the proteome of
D. magna by 2DE (Rainville et al., 2014). This exposure revealed that both forms of silver
induced an increase of protein-thiol content, but only AgNPs caused an increase of protein
carbonyls. The authors suggest that the increase in protein-thiol content is in response to
the presence of Ag+ ions within the organisms; to directly chelate the ions and decrease
their toxicity, or alternatively as a response to reduce toxicity by ROS. The increased
carbonyl content induced by AgNPs is thought to be an indication of AgNP-induced
oxidative stress and oxidation of cellular proteins (Rainville et al., 2014). Additionally,
MS/MS following 2D electrophoresis identified 4 of 8 features of interest as vitellogenin
fused with superoxide dismutase; a key enzyme in the response to reactive oxygen species
(ROS).
An NMR investigation into the impact of AgNP and AgNO3 exposure on the metabolic
profile of D. magna suggested that both forms of Ag induced the same metabolic
perturbations (Li et al., 2015a). Exposure to 2 and 10 µg/l of 10 nm AgNP showed
elevated levels of lactate and phosphocholine and depleted levels of 3-hydroxybutyrate,
arginine, lysine and choline (Li et al., 2015a).
By analysing samples using a combination of omics technologies, we can achieve an
understanding of the genes and metabolites involved in the global response to AgNP and
Ag+ exposure. However, lists of genes and metabolites tell us very little without wider
consideration for how they interact with one another. Pathway analysis allows a statistical
124
approach to decipher large lists of putative responsive genes or metabolites by putting
them into the context of known molecular interactions. Online tools are available for the
analysis of transcriptomics (http://david.abcc.ncifcrf.gov/) and metabolomics (Xia et al.,
2012) datasets individually as well as for integrated analysis (Kamburov et al., 2011). This
enables an objective, statistical approach to interpret interactions between genes and
metabolites of interest without having to resort to speculation (Cavill et al., 2011) or
dependence on prior knowledge. The results of these analyses can then be used to form
hypotheses on the response being observed. However, all current methods of pathway
analysis are not without their limitations and some prior knowledge is still needed for
successful interpretation of results.
The literature surrounding the genes, proteins and metabolites involved in response to
AgNP toxicity is expanding, following an increase in mechanistic investigations across
multiple cell lines and test organisms. (Comfort et al., 2014; Verano-Braga et al., 2014;
McQuillan and Shaw, 2014; Carrola et al., 2015). Mitotoxicity has been observed through
use of fluorescent dye-based assays in HeLa and A549 cells (De Matteis et al., 2015) and
through measurement of the impact of Ag exposure on H+ flux across the mitochondrial
membrane in D. magna (Stensberg et al., 2013). A quantitative proteomic analysis of
AgNP-exposed human colon carcinoma cells observed a down-regulation of mitochondrial
proteins, including those involved with the electron transport chain (Verano-Braga et al.,
2014). On a transcriptional level, significant down-regulation of genes encoding
complexes I, II, III and IV of the oxidative phosphorylation machinery have been observed
in zebrafish (Aerle et al., 2013). Studies in cell lines have measured the presence of ROS
following AgNP and AgNO3 exposure (Arora et al., 2009; Asharani et al., 2009;
Domingos et al., 2009; Chairuangkitti et al., 2013), potentially suggesting the direct
induction of oxidative stress by these two forms of silver. In some cases this production of
125
ROS has been linked to the aforementioned disruption of mitochondrial activity (Asharani
et al., 2009) as well as being linked to the induction of DNA damage and genotoxicity
(AshaRani et al., 2009). It has been observed that the principal response to Ag toxicity
across multiple model organsims is an increase in the production of metallothioneins and
other thiol-containing peptides (Ferguson et al., 1996; Chae et al., 2009; Meyer et al.,
2010; García-Alonso et al., 2011; Johari et al., 2015). The inhibition of RNA polymerase
by AgNP has been measured; Wang and colleagues demonstrated that exposure of
erythroid progenitor cells to AgNP resulted in the inhibition of RNA polymerase activity
and RNA transcription through the direct binding of AgNPs to the enzyme (Wang et al.,
2013). Ag exposure has also been seen to disrupt key cellular processes such as an
increase in calcium transients (Asharani et al., 2009), cell cycle arrest (De Matteis et al.,
2015) and impacts on transcription factors (Aerle et al., 2013). An NMR-based
metabolomics study has suggested Ag-induced perturbation to the purine metabolism
pathway (Hadrup et al., 2012) following detection of an increase in uric acid and allantoin
excretion in mice. AgNPs have been seen to exert indirect effects via serine/threonine
protein kinase (PAK), mitogen-activated protein kinase (MAPK), and phosphatase 2A
pathways (Verano-Braga et al., 2014).
In this Chapter, the markers of AgNP and AgNO3 exposure discovered in Chapter 4
underwent extensive annotation yielding robust putative identities. To statistically
interpret interactions between putative annotations, ORA was rigorously applied using
three online platforms: the Database for Annotation, Visualization and Integrated
Discovery (DAVID) (Huang et al., 2009), MetaboAnalyst (Xia et al., 2012) and Integrated
Molecular Pathway-Level Analyses (IMPaLA) (Kamburov et al., 2011) all of which search
different databases. This allowed the assessment of key putative interactions or pathways
that were perturbed in response to AgNP and Ag+ exposures. Significantly changing

126
putative identities involved in these interactions were then investigated further by RT-
qPCR and MS/MS to confirm gene expression levels and peak identity respectively.

127
5.2 Materials and Methods
5.2.1 Putative annotation of filtered genes and m/z peaks
The D. magna microarray was originally designed using a large expressed sequence tag
(EST) database and annotated by Poynton et al (2012). An initial BLASTX search of these
EST sequences (http://blast.ncbi.nlm.nih.gov/Blast.cgi) against the entire NCBI non-
redundant protein database gave the closest protein homologues to the microarray targets
using an e-value filter of 10-6. Further annotation was acquired through a BLASTX search
against the Daphnia pulex genome v1.0 (Colbourne et al., 2005). D. pulex protein
sequences corresponding with hits from this search were compared with human peptide
sequences, downloaded from Ensembl (Flicek et al., 2014) using BLASTp to find putative
human orthologues for pathway analysis. Gene ontology annotation was achieved using
Blast2GO (Götz et al., 2008). This method of annotation was adapted from previously
published methods (Williams et al., 2011; David et al., 2011; Poynton et al., 2012).
For FT-ICR mass spectrometry data, all filtered m/z values with corresponding average
raw intensities (non-normalised) were imputed into MI-Pack (Weber and Viant, 2010) to
generate possible empirical formulae and putative metabolite names for each m/z peak
using KEGG. Briefly, MI-Pack calculates accurate m/z values for common negative ions
([M-H]-, [M+35Cl]-, [M+37Cl]-, [M+Acetate (Ac)]-, [M+K-2H]- and [M+Na-2H]-) and
positive ions ([M+H]+, [M+Na]+, [M+39K]+, [M+41K]+) of all compounds within the
KEGG compounds database. It then attempts to match these values with the accurate mass
m/z values detected during the experiment using an error window of 1 ppm. The
transformation mapping algorithm (Weber and Viant, 2010) was used to increase
confidence in assigned putative metabolite names.
128
5.2.2 Over-representation analysis of transcriptomics datasets using DAVID
ORA was performed with putative orthologous human Ensembl gene IDs using the
DAVID (version 6.7). The input list consisted of all Ensemble IDs assigned the gene-
spots that were deemed to change significantly via 1-way ANOVA in the previous chapter
(Section 4.3.3). A list of all detected gene-spots with orthologous human Ensemble gene
IDs, regardless of significance, was used as a background comparison list. Fisher’s exact
test was used with a FDR of 0.05 to correct for the multiple-testing hypothesis (Benjamini
and Hochberg, 1995). Four pathway databases were used for their respective pathway
definitions: KEGG-Pathway, Reactome-Pathway, BIOCARTA and the Biological
Biochemical Image Database (BBID). Pathways relating to diseased states and first-tier
Reactome definitions that encompass many smaller pathways (e.g. ‘Metabolism’ or
‘Signal transduction’) were excluded. Only pathway definitions with a minimum of 3 hits
from the input list were retained.
5.2.3 Over-representation analysis of metabolomics datasets using MetaboAnalyst
ORA was applied using MetaboAnalyst (Version 2.0 (Xia et al. 2012)) to putatively
assigned KEGG IDs from the metabolomics dataset. An input list was formed from all
KEGG IDs that were assigned to m/z peaks deemed to change significantly via 1-way
ANOVA in the previous chapter (Section 4.3.3). A list of all putative KEGG IDs assigned
to any peak regardless of significance was assembled for use as a background reference
list. If a particular KEGG ID was assigned to multiple peaks only a single iteration of the
ID was used. Fisher’s exact test was used with a FDR of 0.05 to correct for the multiple-
testing hypothesis (Benjamini and Hochberg, 1995). Pathway definitions used were
obtained from KEGG. Only pathway definitions with a minimum of 3 hits from the input
list were retained.
129
5.2.4 Integrated over-representation pathway analysis of metabolomics and
transcriptomics datasets using IMPaLA
IMPaLA is an online analytical software tool that allows the combined pathway analysis of
transcriptomics and metabolomics datasets (Kamburov et al., 2011). ORA was performed
using input lists of the significantly changing Ensembl gene and KEGG compound IDs
generated in the previous chapter (Section 4.3.3). Background lists of all detected
Ensemble and KEGG IDs were used to avoid bias as above. IMPaLA applies Fisher’s
exact test independently for transcriptomics and metabolic datasets and then integrates the
resulting p-values using Fisher’s combined probability test (Cavill et al., 2011). These
‘joint-p’ values are then corrected using a FDR of 0.05 to account for the multiple testing
hypothesis (Benjamini and Hochberg, 1995). Pathways relating to diseased states and
first-tier Reactome definitions that encompass many smaller pathways (e.g. ‘Metabolism’
or ‘Signal transduction’) were excluded. Only pathway definitions with a minimum of 3
hits from each input list were retained.
5.2.5 Confirmation of gene changes in purine metabolism pathway by quantitative,
reverse transcriptase PCR
To validate the microarray data, Reverse-Transcriptase quantitative PCR (RT-qPCR) was
conducted on the four genes from the purine metabolism pathway whose expression was
discovered to have been altered significantly in response to AgNP exposure. The same
samples used for microarray analysis were used for validation by RT-qPCR.
5.2.6 Synthesis of cDNA
Prior to primer validation and RT-qPCR, cDNA was synthesised using a Tetro cDNA
synthesis kit (Bioline Reagents Limited, London, UK) according to manufacturer’s
instructions. RNA was first incubated with a mix of random hexamers (1 µl) for 2 minutes
at 65 °C to denature template RNA. For primer validation 500 ng of template RNA was
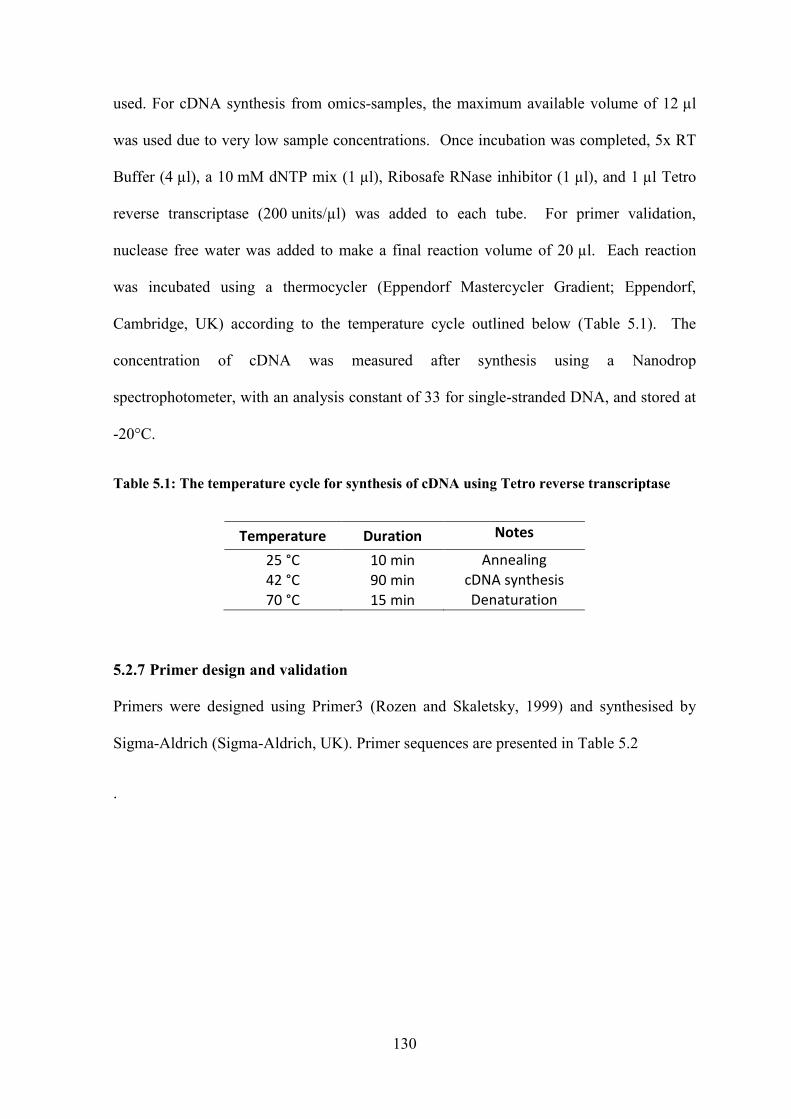
130
used. For cDNA synthesis from omics-samples, the maximum available volume of 12 µl
was used due to very low sample concentrations. Once incubation was completed, 5x RT
Buffer (4 µl), a 10 mM dNTP mix (1 µl), Ribosafe RNase inhibitor (1 µl), and 1 µl Tetro
reverse transcriptase (200 units/µl) was added to each tube. For primer validation,
nuclease free water was added to make a final reaction volume of 20 µl. Each reaction
was incubated using a thermocycler (Eppendorf Mastercycler Gradient; Eppendorf,
Cambridge, UK) according to the temperature cycle outlined below (Table 5.1). The
concentration of cDNA was measured after synthesis using a Nanodrop
spectrophotometer, with an analysis constant of 33 for single-stranded DNA, and stored at
-20°C.
Table 5.1: The temperature cycle for synthesis of cDNA using Tetro reverse transcriptase
Temperature Duration Notes
25 °C 10 min Annealing
42 °C 90 min cDNA synthesis
70 °C 15 min Denaturation
5.2.7 Primer design and validation
Primers were designed using Primer3 (Rozen and Skaletsky, 1999) and synthesised by
Sigma-Aldrich (Sigma-Aldrich, UK). Primer sequences are presented in Table 5.2
.
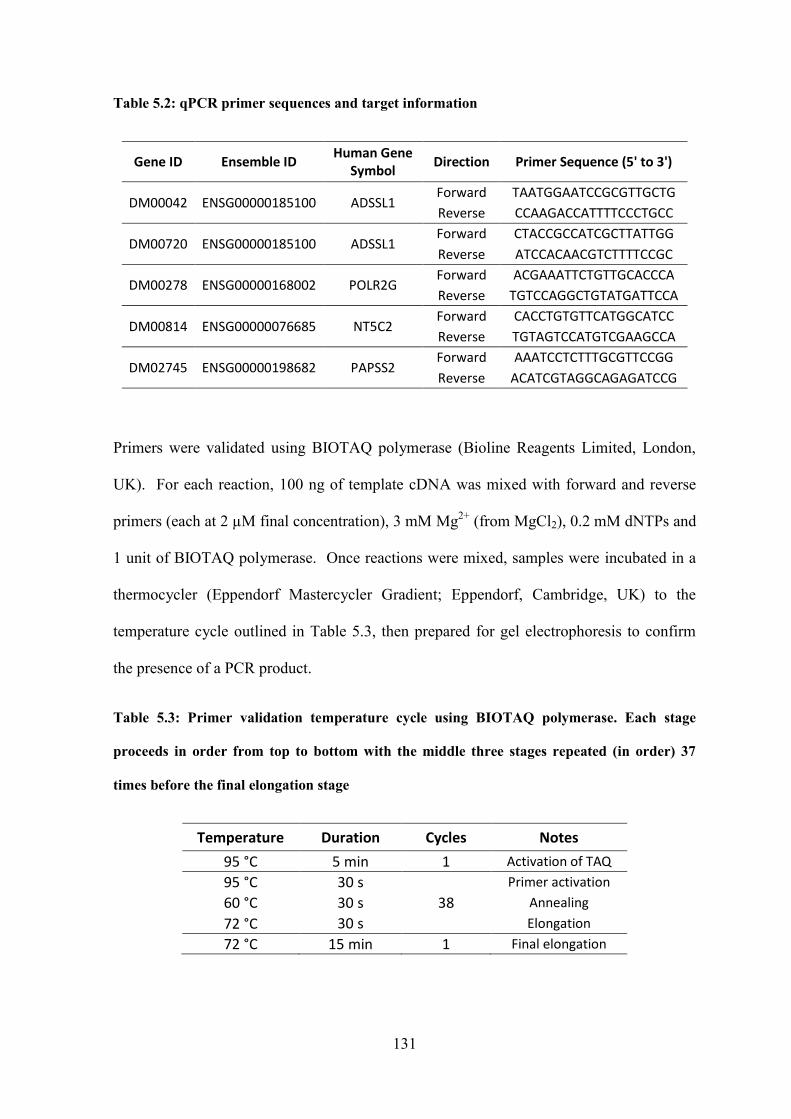
131
Table 5.2: qPCR primer sequences and target information
Gene ID Ensemble ID Human Gene
Symbol Direction Primer Sequence (5' to 3')
DM00042 ENSG00000185100 ADSSL1 Forward TAATGGAATCCGCGTTGCTG
Reverse CCAAGACCATTTTCCCTGCC
DM00720 ENSG00000185100 ADSSL1 Forward CTACCGCCATCGCTTATTGG
Reverse ATCCACAACGTCTTTTCCGC
DM00278 ENSG00000168002 POLR2G Forward ACGAAATTCTGTTGCACCCA
Reverse TGTCCAGGCTGTATGATTCCA
DM00814 ENSG00000076685 NT5C2 Forward CACCTGTGTTCATGGCATCC
Reverse TGTAGTCCATGTCGAAGCCA
DM02745 ENSG00000198682 PAPSS2 Forward AAATCCTCTTTGCGTTCCGG
Reverse ACATCGTAGGCAGAGATCCG
Primers were validated using BIOTAQ polymerase (Bioline Reagents Limited, London,
UK). For each reaction, 100 ng of template cDNA was mixed with forward and reverse
primers (each at 2 µM final concentration), 3 mM Mg2+ (from MgCl2), 0.2 mM dNTPs and
1 unit of BIOTAQ polymerase. Once reactions were mixed, samples were incubated in a
thermocycler (Eppendorf Mastercycler Gradient; Eppendorf, Cambridge, UK) to the
temperature cycle outlined in Table 5.3, then prepared for gel electrophoresis to confirm
the presence of a PCR product.
Table 5.3: Primer validation temperature cycle using BIOTAQ polymerase. Each stage
proceeds in order from top to bottom with the middle three stages repeated (in order) 37
times before the final elongation stage
Temperature Duration Cycles Notes
95 °C 5 min 1 Activation of TAQ
95 °C 30 s
38
Primer activation
60 °C 30 s Annealing
72 °C 30 s Elongation
72 °C 15 min 1 Final elongation
132
5.2.8 Agarose gel electrophoresis of PCR products
Agarose powder (Bioline Ltd, UK) was added to 1x TBE buffer (89 mM Tris base,
89 mM boric acid and 2 mM EDTA, adjusted to pH 8.0) with added SYBR Safe DNA gel
stain (1 µl per 10 ml of dissolved gel, Invitrogen, Life Technologies, CA, USA) and
dissolved by heating. Once poured and set in the electrophoresis tank, the gel was
submerged in 1x TBE Buffer. DNA samples and DNA molecular weight markers (100 bp,
New England Biolabs, USA) were mixed with loading dye (6x gel loading dye, orange;
New England Biolabs, USA) and loaded into the wells. Electrophoresis was performed at
80 V for 20-45 minutes and the gel was visualised by UV trans-illumination (Machine,
model, manufacturer). PCR products were confirmed by sequencing, as described in
section 5.2.9.
5.2.9 Purification and sequencing of PCR products
Prior to sequencing, PCR products were purified using a kit (QIAquick PCR purification
kit, QIAGEN) according to the manufacturer’s guidelines. Briefly, 5 µl of sodium acetate
and 250 ml buffer PB were added to the product and filtered through the QIAquick column
for 1 min at 13,000 rpm in a desk-top microfuge (5415D, Eppendorf). The column was
washed with 750 µl of buffer PF, the product was then eluted from the column in 50 µl
nuclease free water. Purified samples were sequenced by the Functional Genomics and
Proteomics Unit, (School of Biosciences, University of Birmingham, Birmingham, UK)
using an ABI3730 DNA analyser (Applied Biosystems, UK). Each sequencing reaction
was set up using 10 ng of the purified DNA samples and 0.4 µl of either reverse or forward
primers (10 pmol). The final volume was adjusted to 10 µl using sterile water. To
determine whether the custom primers had amplified the gene of interest, the sequences of
the amplified DNA fragments were imputed into BLAST
(http://blast.ncbi.nlm.nih.gov/Blast.cgi).
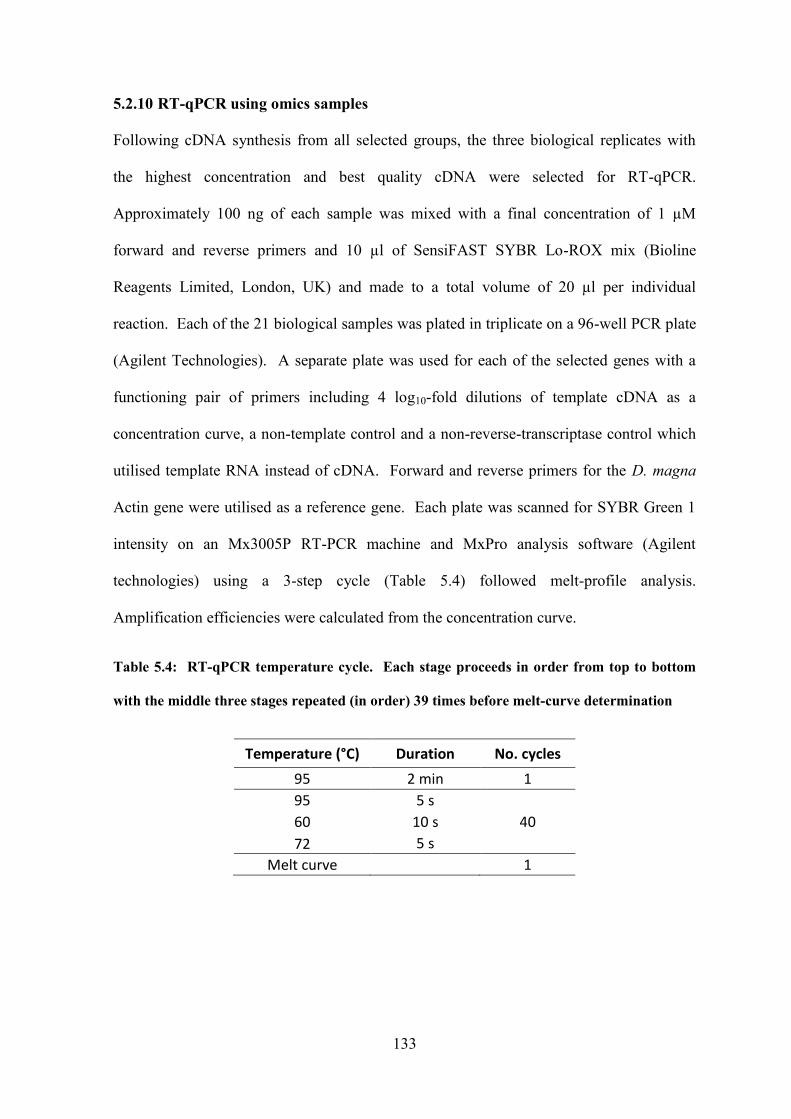
133
5.2.10 RT-qPCR using omics samples
Following cDNA synthesis from all selected groups, the three biological replicates with
the highest concentration and best quality cDNA were selected for RT-qPCR.
Approximately 100 ng of each sample was mixed with a final concentration of 1 µM
forward and reverse primers and 10 µl of SensiFAST SYBR Lo-ROX mix (Bioline
Reagents Limited, London, UK) and made to a total volume of 20 µl per individual
reaction. Each of the 21 biological samples was plated in triplicate on a 96-well PCR plate
(Agilent Technologies). A separate plate was used for each of the selected genes with a
functioning pair of primers including 4 log10-fold dilutions of template cDNA as a
concentration curve, a non-template control and a non-reverse-transcriptase control which
utilised template RNA instead of cDNA. Forward and reverse primers for the D. magna
Actin gene were utilised as a reference gene. Each plate was scanned for SYBR Green 1
intensity on an Mx3005P RT-PCR machine and MxPro analysis software (Agilent
technologies) using a 3-step cycle (Table 5.4) followed melt-profile analysis.
Amplification efficiencies were calculated from the concentration curve.
Table 5.4: RT-qPCR temperature cycle. Each stage proceeds in order from top to bottom
with the middle three stages repeated (in order) 39 times before melt-curve determination
Temperature (°C) Duration No. cycles
95 2 min 1
95 5 s
40 60 10 s
72 5 s
Melt curve 1
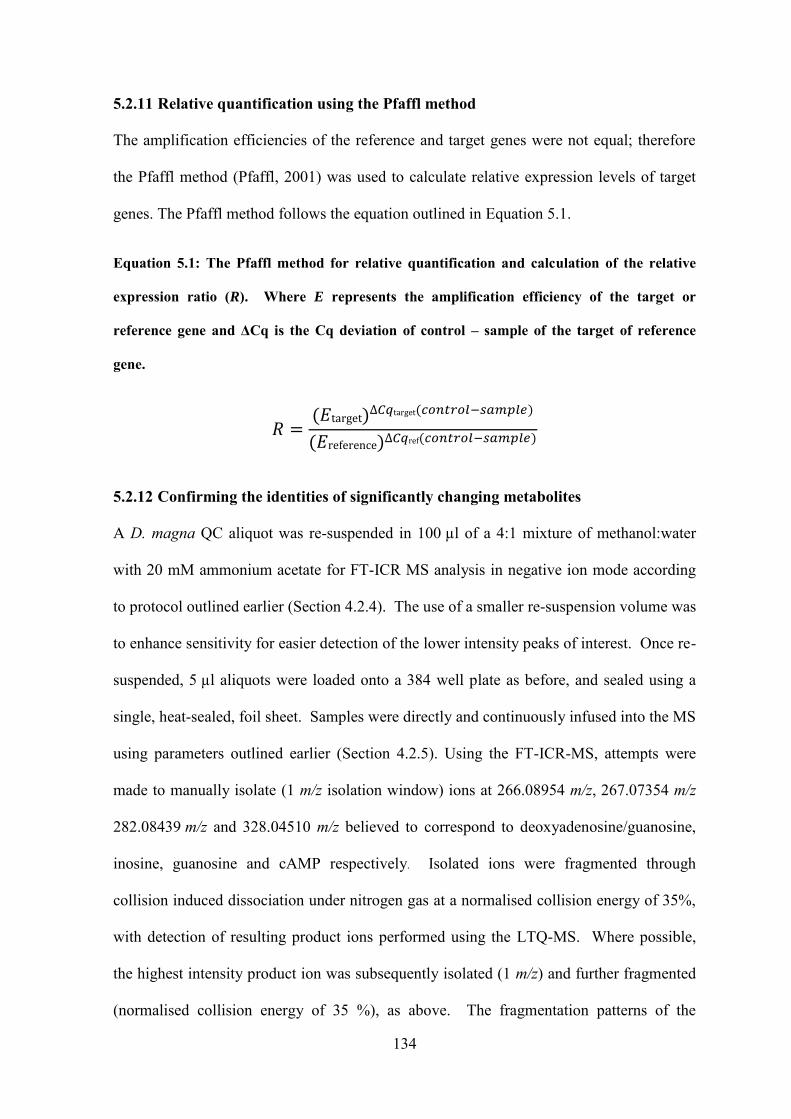
134
5.2.11 Relative quantification using the Pfaffl method
The amplification efficiencies of the reference and target genes were not equal; therefore
the Pfaffl method (Pfaffl, 2001) was used to calculate relative expression levels of target
genes. The Pfaffl method follows the equation outlined in Equation 5.1.
Equation 5.1: The Pfaffl method for relative quantification and calculation of the relative
expression ratio (R). Where E represents the amplification efficiency of the target or
reference gene and ΔCq is the Cq deviation of control – sample of the target of reference
gene.
𝑅 =(𝐸target)∆𝐶𝑞target(𝑐𝑜𝑛𝑡𝑟𝑜𝑙−𝑠𝑎𝑚𝑝𝑙𝑒)
(𝐸reference)∆𝐶𝑞ref(𝑐𝑜𝑛𝑡𝑟𝑜𝑙−𝑠𝑎𝑚𝑝𝑙𝑒)
5.2.12 Confirming the identities of significantly changing metabolites
A D. magna QC aliquot was re-suspended in 100 µl of a 4:1 mixture of methanol:water
with 20 mM ammonium acetate for FT-ICR MS analysis in negative ion mode according
to protocol outlined earlier (Section 4.2.4). The use of a smaller re-suspension volume was
to enhance sensitivity for easier detection of the lower intensity peaks of interest. Once re-
suspended, 5 µl aliquots were loaded onto a 384 well plate as before, and sealed using a
single, heat-sealed, foil sheet. Samples were directly and continuously infused into the MS
using parameters outlined earlier (Section 4.2.5). Using the FT-ICR-MS, attempts were
made to manually isolate (1 m/z isolation window) ions at 266.08954 m/z, 267.07354 m/z
282.08439 m/z and 328.04510 m/z believed to correspond to deoxyadenosine/guanosine,
inosine, guanosine and cAMP respectively. Isolated ions were fragmented through
collision induced dissociation under nitrogen gas at a normalised collision energy of 35%,
with detection of resulting product ions performed using the LTQ-MS. Where possible,
the highest intensity product ion was subsequently isolated (1 m/z) and further fragmented
(normalised collision energy of 35 %), as above. The fragmentation patterns of the

135
isolated peaks were compared to those reported in the available literature for purified
standards (Struck-Lewicka et al., 2014; Stentoft et al., 2014).
136
5.3 Result and Discussion
5.3.1 Putative annotation of molecular markers of AgNP exposure
After implementing the annotation processes outlined above (section 5.2.1), 4121 of the
8128 detected gene spots were identified as putative orthologues of human genes, and
were assigned human Ensembl gene IDs. Of these, 313 changed significantly in
expression upon exposure to AgNPs and a detailed list is available in the Appendix (Table
9.6). Despite the genome of D. magna being sequenced the data is not yet published or
available for public use. This situation will be partially responsible for the relatively low
level of annotation observed in this study; the other will be due to the many ‘species
specific’ genes that have no homologue in other model organisms (Colbourne et al., 2011).
Of the 1330 detected m/z peaks, only 145 were successfully assigned at least 1 empirical
formula with a minimum of 1 putative KEGG Compound ID. Of these, 26 had been
deemed to change significantly in intensity upon exposure to AgNPs. A full list of all
putatively annotated significantly changing m/z peaks can be found in the appendix (Table
9.7). Although the transformation mapping algorithm improves assignment of putative
IDs, many of the 145 successfully annotated m/z peaks had been assigned multiple
potential KEGG IDs. 361 KEGG IDs had been assigned in total, with 68 assigned to
significantly changing m/z values. Due to the nature of the data the true identity cannot be
assigned at this point so, for computational pathway analysis, all putative identities have to
be assumed to be equally possible.
137
5.3.2 Interpreting annotation: over-representation analysis of annotated variables
All 313 putative Ensemble IDs were imputed into DAVID for ORA against a background
of all detected putative Ensemble IDs using Fisher’s exact test. Pathway definitions from
KEGG-Pathway, Reactome-Pathway, BIOCARTA and BBID were used in the analysis.
Similarly, each of the 68 individual putative KEGG IDs assigned to each of the 31
generated empirical formulae were compiled and imputed into MetaboAnalyst for over-
representation pathway analysis again using Fisher’s exact test (Xia et al., 2012).
Following correction for multiple testing using a FDR of 0.05 (Benjamini and Hochberg,
1995), it was determined that none of the tested transcriptional or metabolic pathway
definitions were significantly enriched. It is worth noting however, that the galactose
metabolism pathway as defined by KEGG had an adjusted p-value of 0.0622 following
ORA via MetaboAnalyst.
The result of Fisher’s exact test directly depends upon the size of the background list used
for comparison. Due to the bottle-neck of metabolite identification, the number of
detected metabolites that can be putatively annotated is limited, resulting in a truncated
background list of hundreds of metabolites compared to the potential thousands that exist
in eukaryotic cells (Bouhifd et al., 2013). This, along with the limited annotation of the
D. magna microarray in use, could potentially reduce the efficiency of analysis making it
less likely for any one pathway to be statistically over-represented. Despite a lack of
significant over-representation, the data still holds information as to which pathways are
impacted by Ag exposure. To isolate potential pathways of interest, disease-related
pathways and first-tier Reactome pathways were removed, as were any pathway
definitions with < 4 hits from the input list. This shortlisted 22 transcriptional pathway
definitions (Table 5.5) and 6 metabolic pathway definitions (Table 5.6) which were
involved in the response to Ag toxicity.
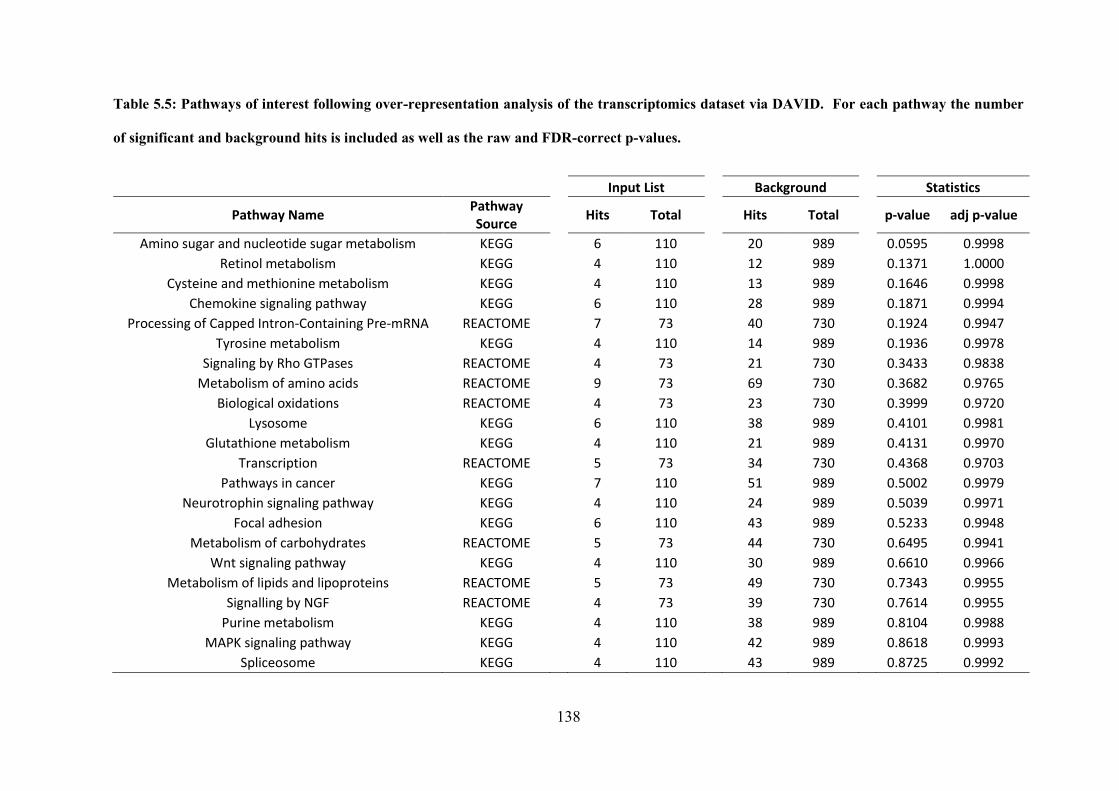
138
Table 5.5: Pathways of interest following over-representation analysis of the transcriptomics dataset via DAVID. For each pathway the number
of significant and background hits is included as well as the raw and FDR-correct p-values.
Input List Background Statistics
Pathway Name Pathway Source
Hits Total Hits Total p-value adj p-value
Amino sugar and nucleotide sugar metabolism KEGG 6 110 20 989 0.0595 0.9998 Retinol metabolism KEGG 4 110 12 989 0.1371 1.0000
Cysteine and methionine metabolism KEGG 4 110 13 989 0.1646 0.9998 Chemokine signaling pathway KEGG 6 110 28 989 0.1871 0.9994
Processing of Capped Intron-Containing Pre-mRNA REACTOME 7 73 40 730 0.1924 0.9947 Tyrosine metabolism KEGG 4 110 14 989 0.1936 0.9978
Signaling by Rho GTPases REACTOME 4 73 21 730 0.3433 0.9838 Metabolism of amino acids REACTOME 9 73 69 730 0.3682 0.9765
Biological oxidations REACTOME 4 73 23 730 0.3999 0.9720 Lysosome KEGG 6 110 38 989 0.4101 0.9981
Glutathione metabolism KEGG 4 110 21 989 0.4131 0.9970
Transcription REACTOME 5 73 34 730 0.4368 0.9703 Pathways in cancer KEGG 7 110 51 989 0.5002 0.9979
Neurotrophin signaling pathway KEGG 4 110 24 989 0.5039 0.9971 Focal adhesion KEGG 6 110 43 989 0.5233 0.9948
Metabolism of carbohydrates REACTOME 5 73 44 730 0.6495 0.9941 Wnt signaling pathway KEGG 4 110 30 989 0.6610 0.9966
Metabolism of lipids and lipoproteins REACTOME 5 73 49 730 0.7343 0.9955 Signalling by NGF REACTOME 4 73 39 730 0.7614 0.9955
Purine metabolism KEGG 4 110 38 989 0.8104 0.9988 MAPK signaling pathway KEGG 4 110 42 989 0.8618 0.9993
Spliceosome KEGG 4 110 43 989 0.8725 0.9992
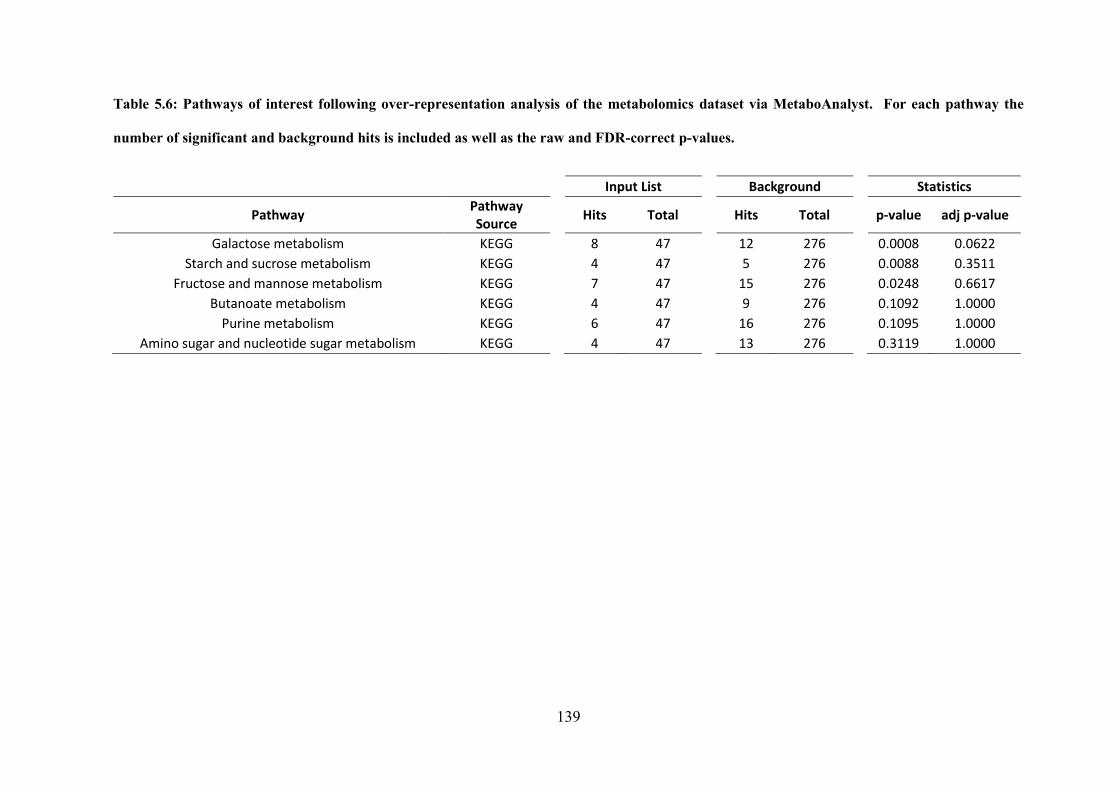
139
Table 5.6: Pathways of interest following over-representation analysis of the metabolomics dataset via MetaboAnalyst. For each pathway the
number of significant and background hits is included as well as the raw and FDR-correct p-values.
Input List Background Statistics
Pathway Pathway Source
Hits Total Hits Total p-value adj p-value
Galactose metabolism KEGG 8 47 12 276 0.0008 0.0622 Starch and sucrose metabolism KEGG 4 47 5 276 0.0088 0.3511
Fructose and mannose metabolism KEGG 7 47 15 276 0.0248 0.6617 Butanoate metabolism KEGG 4 47 9 276 0.1092 1.0000
Purine metabolism KEGG 6 47 16 276 0.1095 1.0000 Amino sugar and nucleotide sugar metabolism KEGG 4 47 13 276 0.3119 1.0000

140
As outlined in Table 5.5, the genes that were identified as being significantly up or down
regulated in response to Ag exposure are involved in many varied processes. These include
the metabolism and transport of small molecules such as hexose sugars and amino acids,
and signalling cascades involving MAP kinases, nerve growth factor, neurotrophin and
Rho-GTPases. The glutathione metabolism and cysteine and methionine metabolism
pathways both contain four gene products which alter significantly in response to Ag
exposure. Both glutathione and cysteine contain thiol groups and can act to both sequester
free metal ions including Ag+ and to protect against oxidative stress through the reduction
of ROS. The metabolic pathways outlined in Table 5.6 are involved in the metabolism of
dietary sugars as well as purines and amino-sugars and nucleotide sugars. This may
suggest an impact on energy metabolism and the production of ATP, processes which have
been seen to be impacted by Ag exposure previously.
While robust and informative, these two independent ORA alone do not give a definitive
image of the extent of overlap and interaction between the transcriptome and metabolome
of Ag-exposed Daphnia. It is possible to gain knowledge of these interactions through
conceptual integration of these lists based on published data, however this approach is
subjective and may result in potentially novel mechanisms being overlooked (Cavill et al.,
2011). As a more objective, statistical approach, integrated pathway analysis was used to
take the interactions between metabolites and genes into account. The KEGG Compound
IDs and the Ensembl Gene IDs putatively assigned to the significant, annotated MS peaks
and gene-probes respectively were compiled for ORA using IMPaLA (Kamburov et al.,
2011). ORA was implemented using Fisher’s exact test with a reference background of all
detected Ensembl Gene IDs and KEGG Compound IDs. After correcting for the multiple
testing hypothesis (Benjamini and Hochberg, 1995), it was again found that none of the
molecular-level pathways from the 12 tested databases were significantly over-represented
141
(Table 5.7). As with the results of DAVID and MetaboAnalyst, the result of ORA via
IMPaLA is restricted by the limitations in metabolite identification and the current level of
annotation of the D. magna microarray.
Despite the lack of significant over-representation, the results are informative as to the
pathways in which significantly altered metabolites and gene products are involved. To
isolate potential pathways of interest, those with ≥ 3 putative metabolites and ≥ 3 putative
genes were shortlisted. These parameters yielded 2 pathway definitions from KEGG, 1
from the Edinburgh Human Metabolic Network (EHMN), and 10 from the Reactome
database. To restrict the search further, pathways relating to diseased states were excluded
as well as first-tier Reactome definitions that encompass many smaller pathways (e.g.
‘Metabolism’ or ‘Signal transduction’). This second stage filter resulted in 11 pathway
definitions which are listed in Table 5.7. These suggest perturbations to the metabolism of
lipids, lipoproteins and fatty acids, the transport of small organic molecules, the
metabolism carbohydrates, signalling via G-protein coupled receptors and the metabolism
of purines.
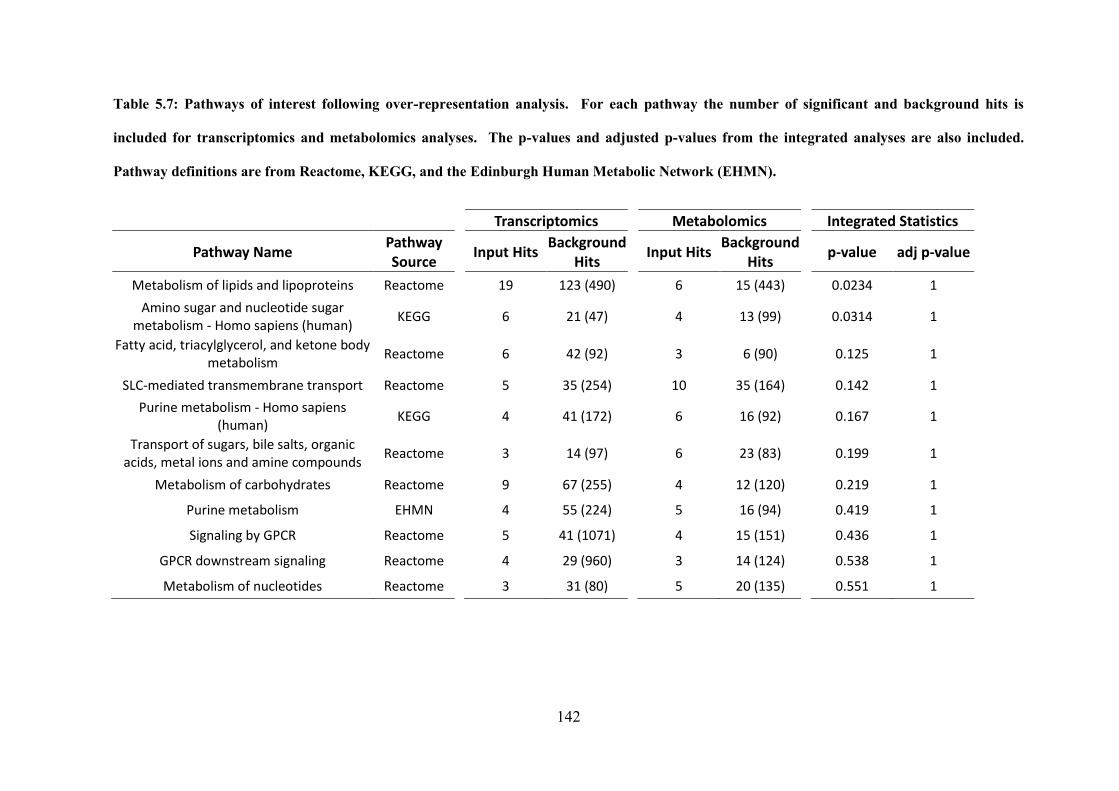
142
Table 5.7: Pathways of interest following over-representation analysis. For each pathway the number of significant and background hits is
included for transcriptomics and metabolomics analyses. The p-values and adjusted p-values from the integrated analyses are also included.
Pathway definitions are from Reactome, KEGG, and the Edinburgh Human Metabolic Network (EHMN).
Transcriptomics Metabolomics Integrated Statistics
Pathway Name Pathway Source
Input Hits Background
Hits Input Hits
Background Hits
p-value adj p-value
Metabolism of lipids and lipoproteins Reactome 19 123 (490) 6 15 (443) 0.0234 1
Amino sugar and nucleotide sugar metabolism - Homo sapiens (human)
KEGG 6 21 (47) 4 13 (99) 0.0314 1
Fatty acid, triacylglycerol, and ketone body metabolism
Reactome 6 42 (92) 3 6 (90) 0.125 1
SLC-mediated transmembrane transport Reactome 5 35 (254) 10 35 (164) 0.142 1
Purine metabolism - Homo sapiens (human)
KEGG 4 41 (172) 6 16 (92) 0.167 1
Transport of sugars, bile salts, organic acids, metal ions and amine compounds
Reactome 3 14 (97) 6 23 (83) 0.199 1
Metabolism of carbohydrates Reactome 9 67 (255) 4 12 (120) 0.219 1
Purine metabolism EHMN 4 55 (224) 5 16 (94) 0.419 1
Signaling by GPCR Reactome 5 41 (1071) 4 15 (151) 0.436 1
GPCR downstream signaling Reactome 4 29 (960) 3 14 (124) 0.538 1
Metabolism of nucleotides Reactome 3 31 (80) 5 20 (135) 0.551 1
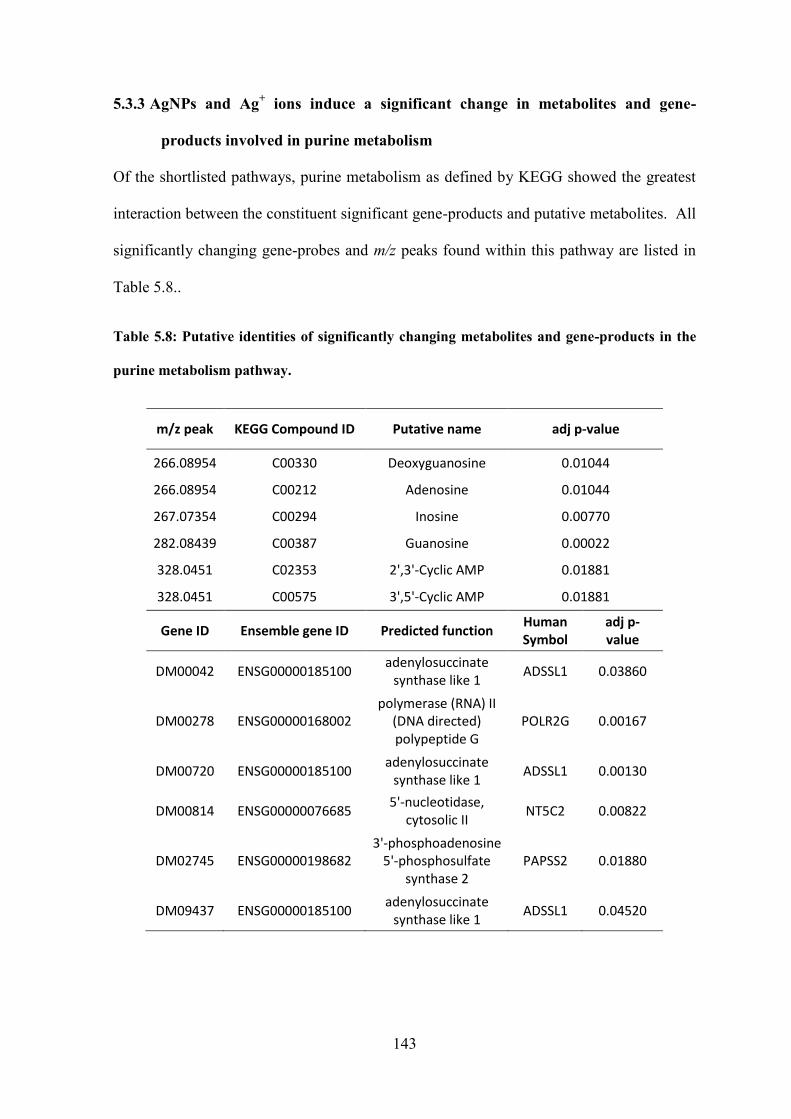
143
5.3.3 AgNPs and Ag+ ions induce a significant change in metabolites and gene-
products involved in purine metabolism
Of the shortlisted pathways, purine metabolism as defined by KEGG showed the greatest
interaction between the constituent significant gene-products and putative metabolites. All
significantly changing gene-probes and m/z peaks found within this pathway are listed in
Table 5.8..
Table 5.8: Putative identities of significantly changing metabolites and gene-products in the
purine metabolism pathway.
m/z peak KEGG Compound ID Putative name adj p-value
266.08954 C00330 Deoxyguanosine 0.01044
266.08954 C00212 Adenosine 0.01044
267.07354 C00294 Inosine 0.00770
282.08439 C00387 Guanosine 0.00022
328.0451 C02353 2',3'-Cyclic AMP 0.01881
328.0451 C00575 3',5'-Cyclic AMP 0.01881
Gene ID Ensemble gene ID Predicted function Human Symbol
adj p-value
DM00042 ENSG00000185100 adenylosuccinate
synthase like 1 ADSSL1 0.03860
DM00278 ENSG00000168002 polymerase (RNA) II
(DNA directed) polypeptide G
POLR2G 0.00167
DM00720 ENSG00000185100 adenylosuccinate
synthase like 1 ADSSL1 0.00130
DM00814 ENSG00000076685 5'-nucleotidase,
cytosolic II NT5C2 0.00822
DM02745 ENSG00000198682 3'-phosphoadenosine
5'-phosphosulfate synthase 2
PAPSS2 0.01880
DM09437 ENSG00000185100 adenylosuccinate
synthase like 1 ADSSL1 0.04520
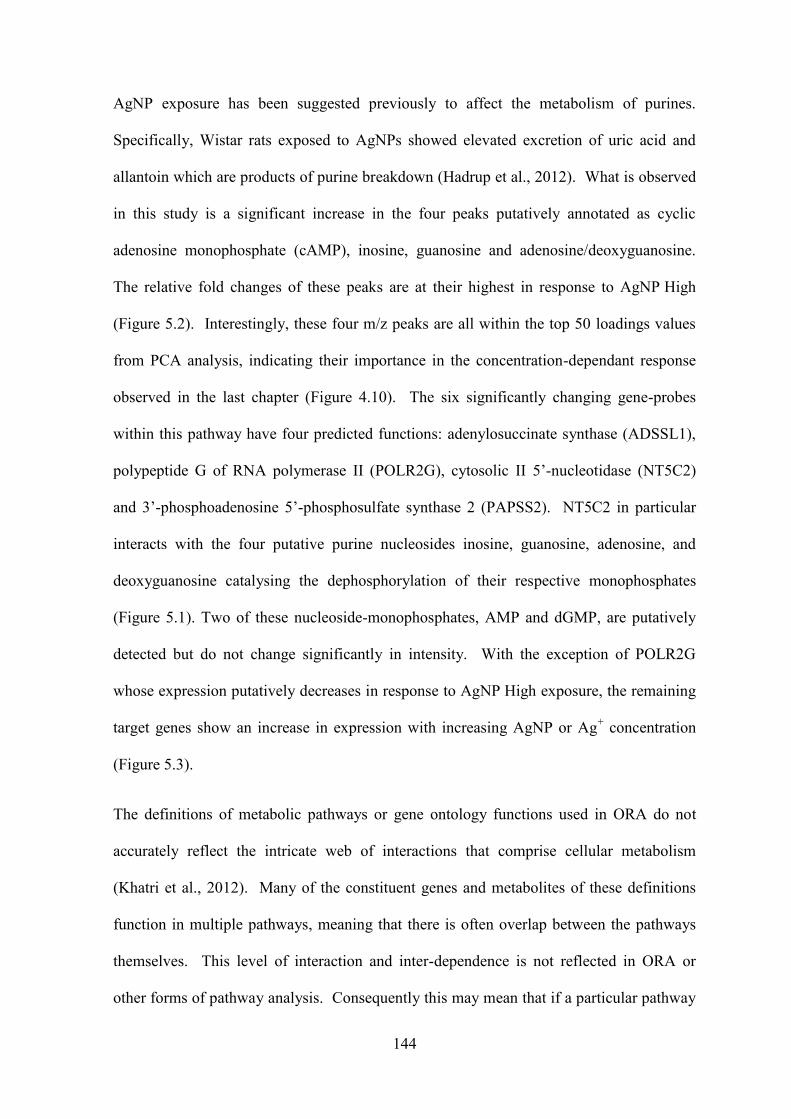
144
AgNP exposure has been suggested previously to affect the metabolism of purines.
Specifically, Wistar rats exposed to AgNPs showed elevated excretion of uric acid and
allantoin which are products of purine breakdown (Hadrup et al., 2012). What is observed
in this study is a significant increase in the four peaks putatively annotated as cyclic
adenosine monophosphate (cAMP), inosine, guanosine and adenosine/deoxyguanosine.
The relative fold changes of these peaks are at their highest in response to AgNP High
(Figure 5.2). Interestingly, these four m/z peaks are all within the top 50 loadings values
from PCA analysis, indicating their importance in the concentration-dependant response
observed in the last chapter (Figure 4.10). The six significantly changing gene-probes
within this pathway have four predicted functions: adenylosuccinate synthase (ADSSL1),
polypeptide G of RNA polymerase II (POLR2G), cytosolic II 5’-nucleotidase (NT5C2)
and 3’-phosphoadenosine 5’-phosphosulfate synthase 2 (PAPSS2). NT5C2 in particular
interacts with the four putative purine nucleosides inosine, guanosine, adenosine, and
deoxyguanosine catalysing the dephosphorylation of their respective monophosphates
(Figure 5.1). Two of these nucleoside-monophosphates, AMP and dGMP, are putatively
detected but do not change significantly in intensity. With the exception of POLR2G
whose expression putatively decreases in response to AgNP High exposure, the remaining
target genes show an increase in expression with increasing AgNP or Ag+ concentration
(Figure 5.3).
The definitions of metabolic pathways or gene ontology functions used in ORA do not
accurately reflect the intricate web of interactions that comprise cellular metabolism
(Khatri et al., 2012). Many of the constituent genes and metabolites of these definitions
function in multiple pathways, meaning that there is often overlap between the pathways
themselves. This level of interaction and inter-dependence is not reflected in ORA or
other forms of pathway analysis. Consequently this may mean that if a particular pathway
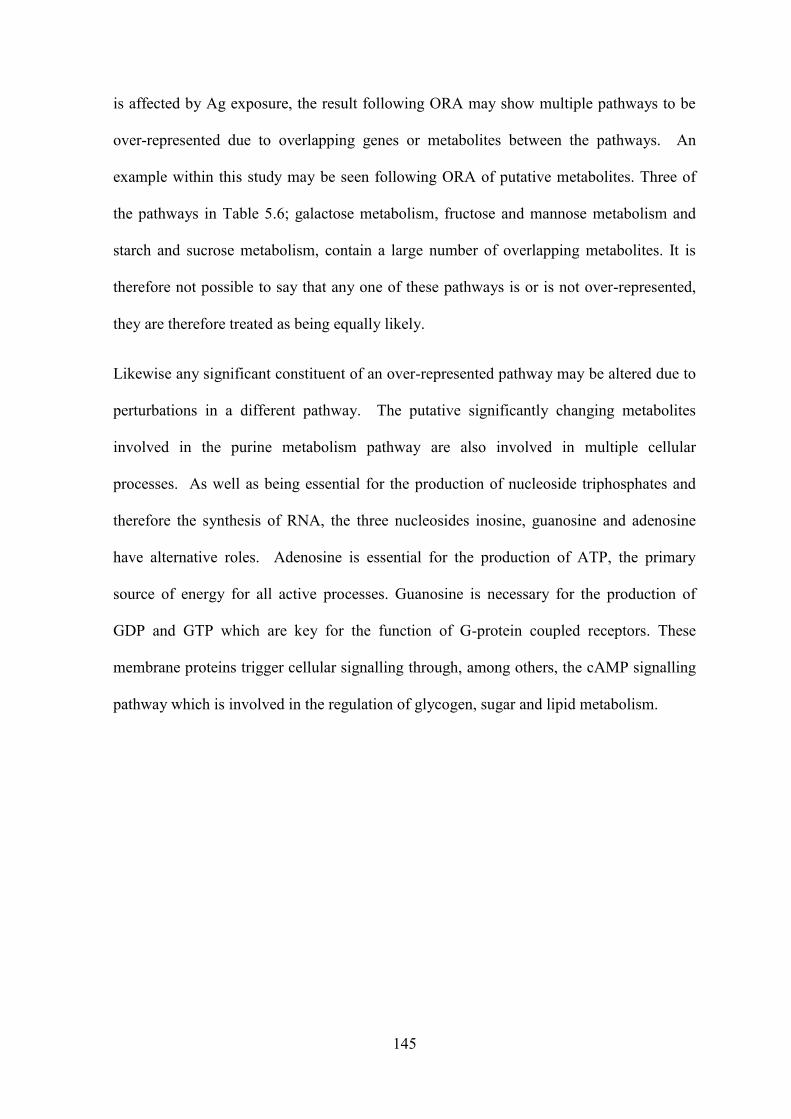
145
is affected by Ag exposure, the result following ORA may show multiple pathways to be
over-represented due to overlapping genes or metabolites between the pathways. An
example within this study may be seen following ORA of putative metabolites. Three of
the pathways in Table 5.6; galactose metabolism, fructose and mannose metabolism and
starch and sucrose metabolism, contain a large number of overlapping metabolites. It is
therefore not possible to say that any one of these pathways is or is not over-represented,
they are therefore treated as being equally likely.
Likewise any significant constituent of an over-represented pathway may be altered due to
perturbations in a different pathway. The putative significantly changing metabolites
involved in the purine metabolism pathway are also involved in multiple cellular
processes. As well as being essential for the production of nucleoside triphosphates and
therefore the synthesis of RNA, the three nucleosides inosine, guanosine and adenosine
have alternative roles. Adenosine is essential for the production of ATP, the primary
source of energy for all active processes. Guanosine is necessary for the production of
GDP and GTP which are key for the function of G-protein coupled receptors. These
membrane proteins trigger cellular signalling through, among others, the cAMP signalling
pathway which is involved in the regulation of glycogen, sugar and lipid metabolism.
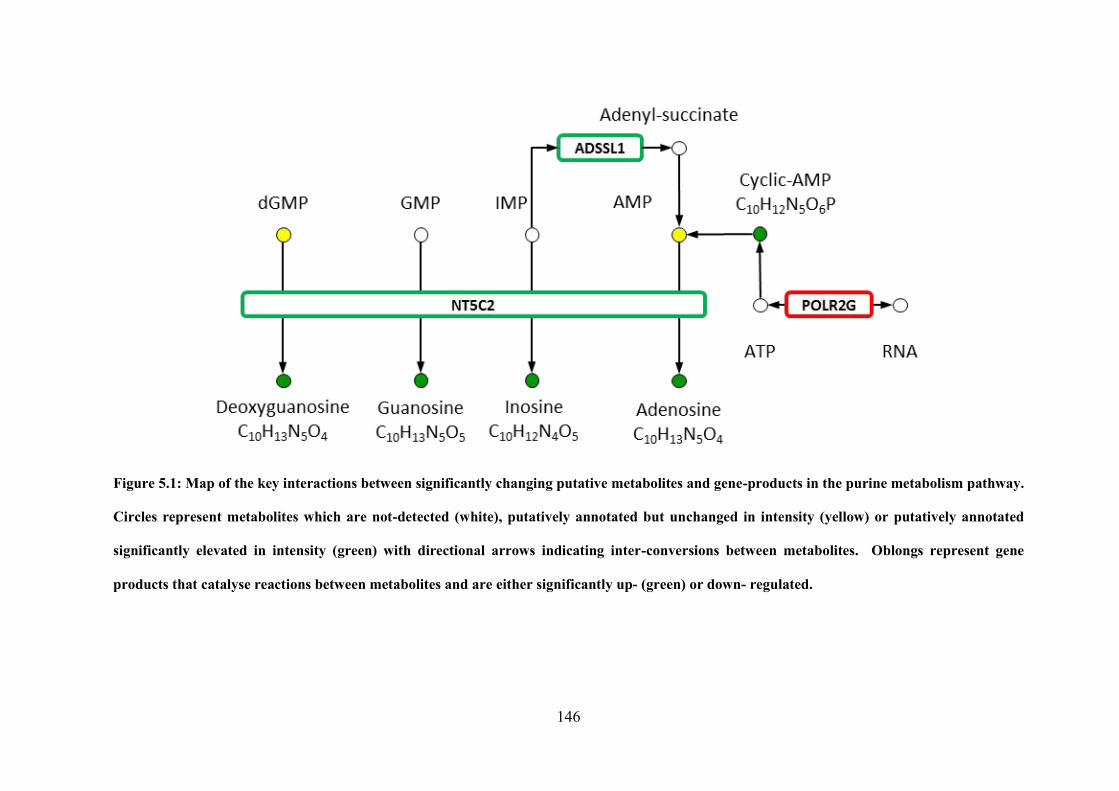
146
Figure 5.1: Map of the key interactions between significantly changing putative metabolites and gene-products in the purine metabolism pathway.
Circles represent metabolites which are not-detected (white), putatively annotated but unchanged in intensity (yellow) or putatively annotated
significantly elevated in intensity (green) with directional arrows indicating inter-conversions between metabolites. Oblongs represent gene
products that catalyse reactions between metabolites and are either significantly up- (green) or down- regulated.
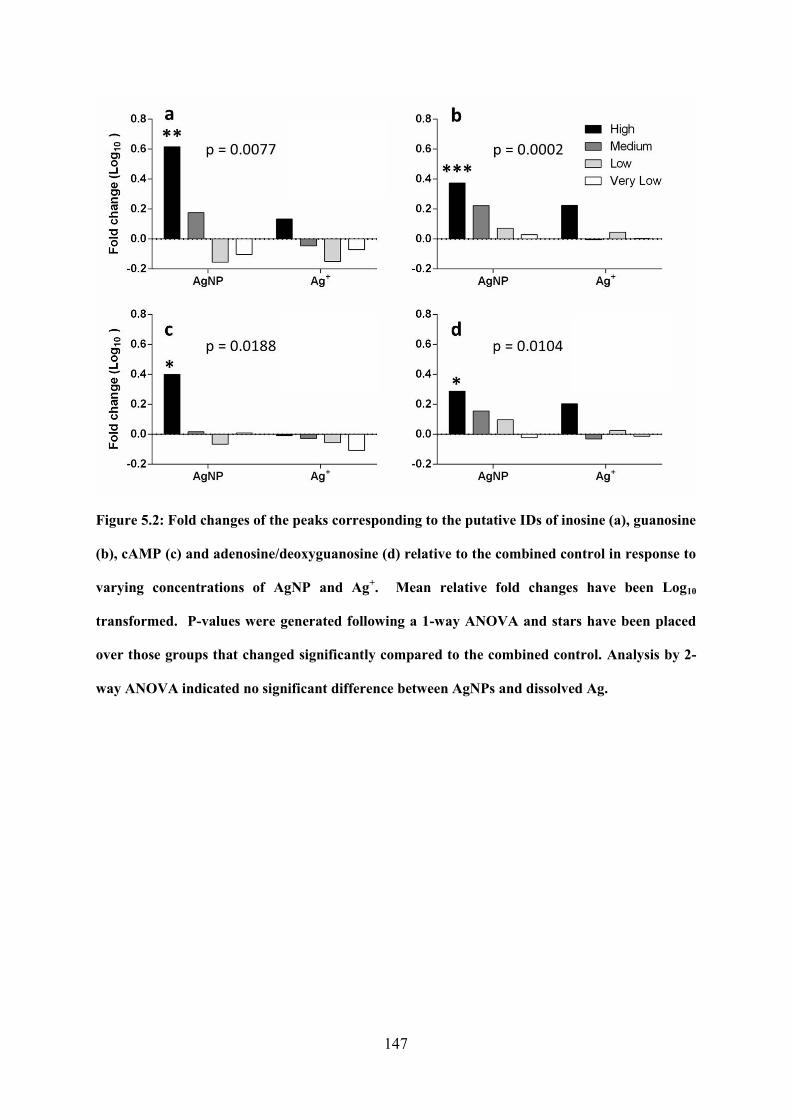
147
Figure 5.2: Fold changes of the peaks corresponding to the putative IDs of inosine (a), guanosine
(b), cAMP (c) and adenosine/deoxyguanosine (d) relative to the combined control in response to
varying concentrations of AgNP and Ag+. Mean relative fold changes have been Log10
transformed. P-values were generated following a 1-way ANOVA and stars have been placed
over those groups that changed significantly compared to the combined control. Analysis by 2-
way ANOVA indicated no significant difference between AgNPs and dissolved Ag.
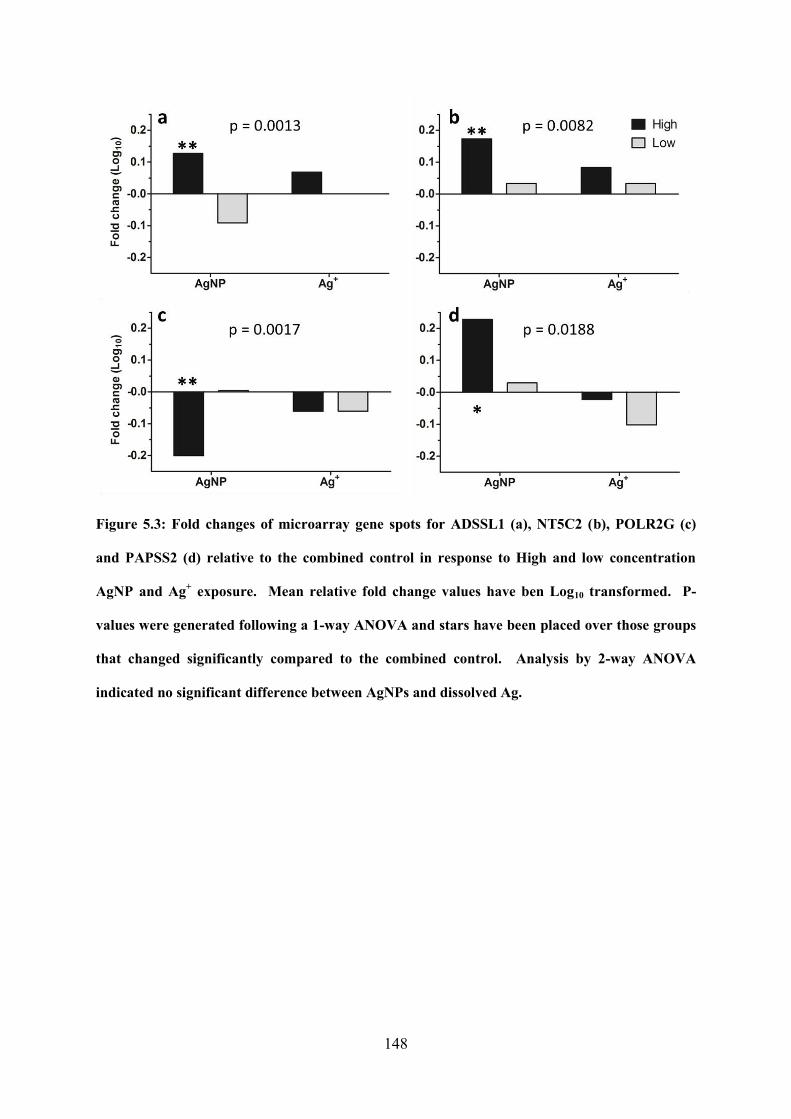
148
Figure 5.3: Fold changes of microarray gene spots for ADSSL1 (a), NT5C2 (b), POLR2G (c)
and PAPSS2 (d) relative to the combined control in response to High and low concentration
AgNP and Ag+ exposure. Mean relative fold change values have ben Log10 transformed. P-
values were generated following a 1-way ANOVA and stars have been placed over those groups
that changed significantly compared to the combined control. Analysis by 2-way ANOVA
indicated no significant difference between AgNPs and dissolved Ag.
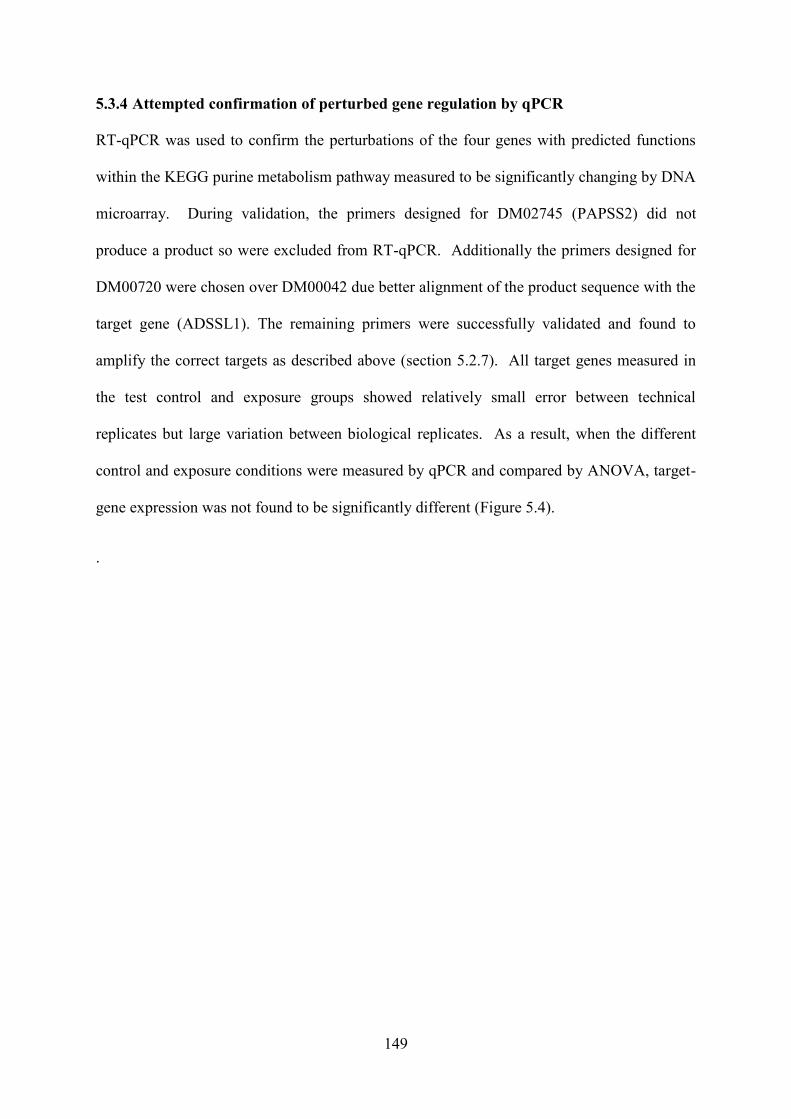
149
5.3.4 Attempted confirmation of perturbed gene regulation by qPCR
RT-qPCR was used to confirm the perturbations of the four genes with predicted functions
within the KEGG purine metabolism pathway measured to be significantly changing by DNA
microarray. During validation, the primers designed for DM02745 (PAPSS2) did not
produce a product so were excluded from RT-qPCR. Additionally the primers designed for
DM00720 were chosen over DM00042 due better alignment of the product sequence with the
target gene (ADSSL1). The remaining primers were successfully validated and found to
amplify the correct targets as described above (section 5.2.7). All target genes measured in
the test control and exposure groups showed relatively small error between technical
replicates but large variation between biological replicates. As a result, when the different
control and exposure conditions were measured by qPCR and compared by ANOVA, target-
gene expression was not found to be significantly different (Figure 5.4).
.
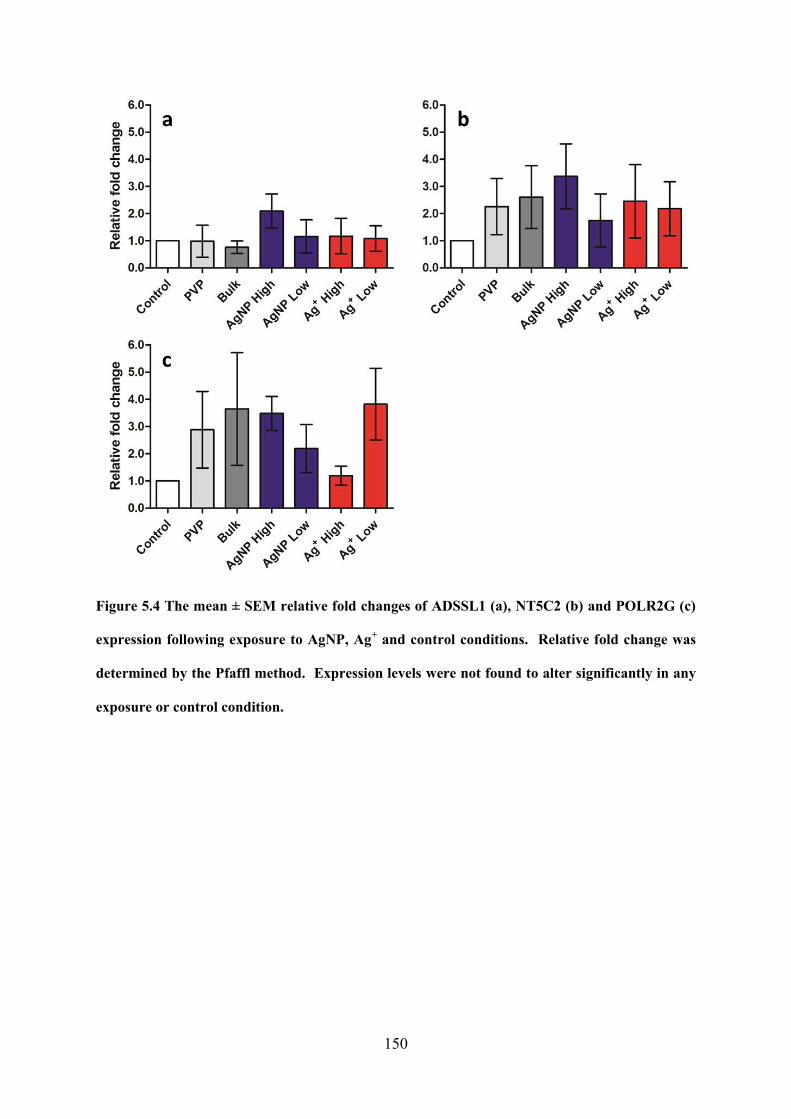
150
Figure 5.4 The mean ± SEM relative fold changes of ADSSL1 (a), NT5C2 (b) and POLR2G (c)
expression following exposure to AgNP, Ag+ and control conditions. Relative fold change was
determined by the Pfaffl method. Expression levels were not found to alter significantly in any
exposure or control condition.
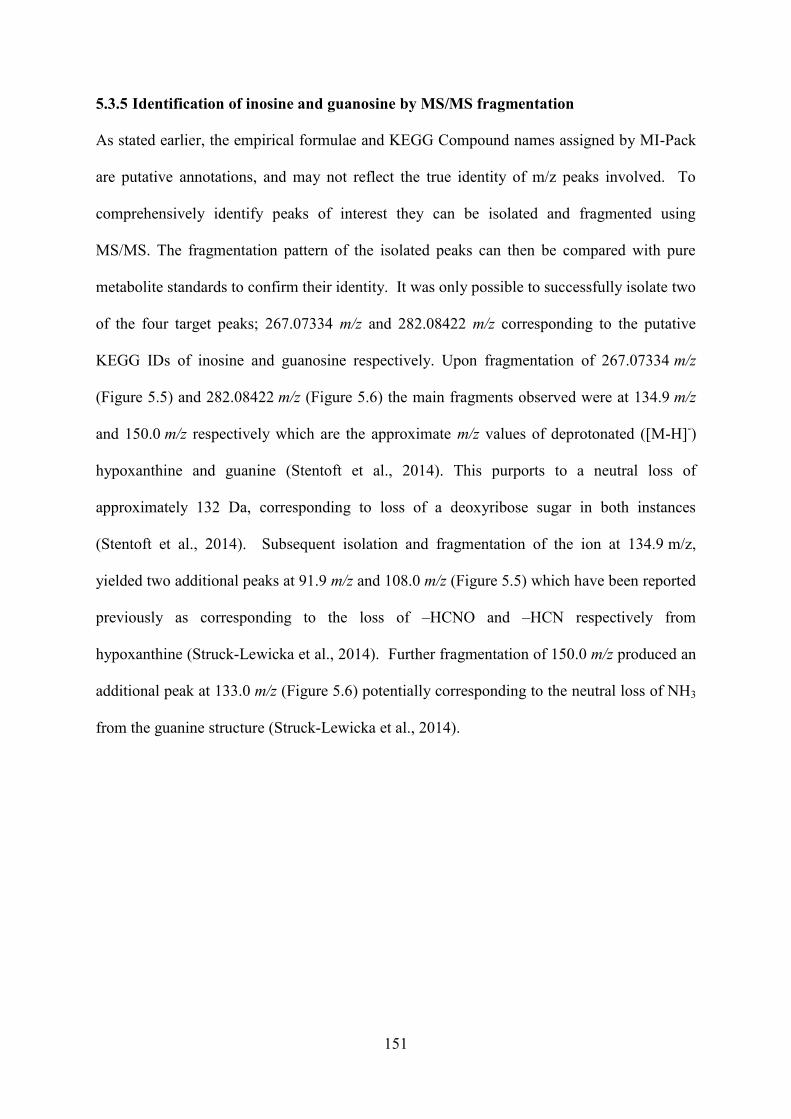
151
5.3.5 Identification of inosine and guanosine by MS/MS fragmentation
As stated earlier, the empirical formulae and KEGG Compound names assigned by MI-Pack
are putative annotations, and may not reflect the true identity of m/z peaks involved. To
comprehensively identify peaks of interest they can be isolated and fragmented using
MS/MS. The fragmentation pattern of the isolated peaks can then be compared with pure
metabolite standards to confirm their identity. It was only possible to successfully isolate two
of the four target peaks; 267.07334 m/z and 282.08422 m/z corresponding to the putative
KEGG IDs of inosine and guanosine respectively. Upon fragmentation of 267.07334 m/z
(Figure 5.5) and 282.08422 m/z (Figure 5.6) the main fragments observed were at 134.9 m/z
and 150.0 m/z respectively which are the approximate m/z values of deprotonated ([M-H]-)
hypoxanthine and guanine (Stentoft et al., 2014). This purports to a neutral loss of
approximately 132 Da, corresponding to loss of a deoxyribose sugar in both instances
(Stentoft et al., 2014). Subsequent isolation and fragmentation of the ion at 134.9 m/z,
yielded two additional peaks at 91.9 m/z and 108.0 m/z (Figure 5.5) which have been reported
previously as corresponding to the loss of –HCNO and –HCN respectively from
hypoxanthine (Struck-Lewicka et al., 2014). Further fragmentation of 150.0 m/z produced an
additional peak at 133.0 m/z (Figure 5.6) potentially corresponding to the neutral loss of NH3
from the guanine structure (Struck-Lewicka et al., 2014).
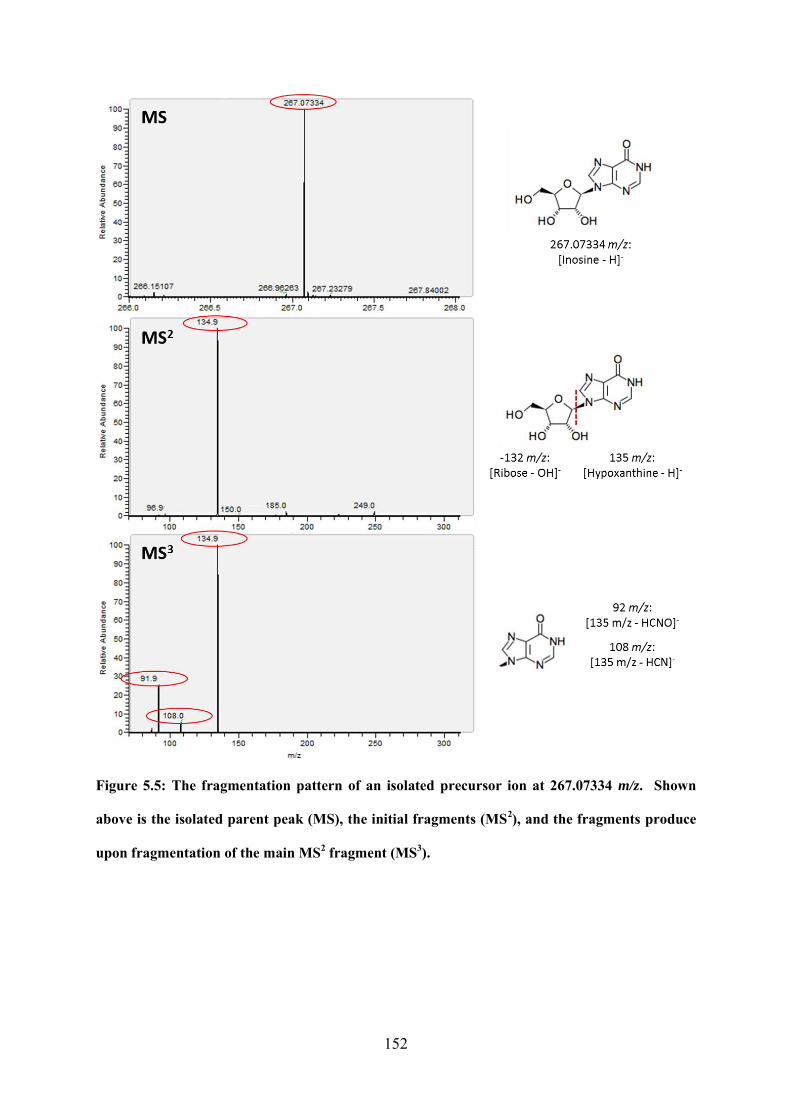
152
Figure 5.5: The fragmentation pattern of an isolated precursor ion at 267.07334 m/z. Shown
above is the isolated parent peak (MS), the initial fragments (MS2), and the fragments produce
upon fragmentation of the main MS2 fragment (MS3).
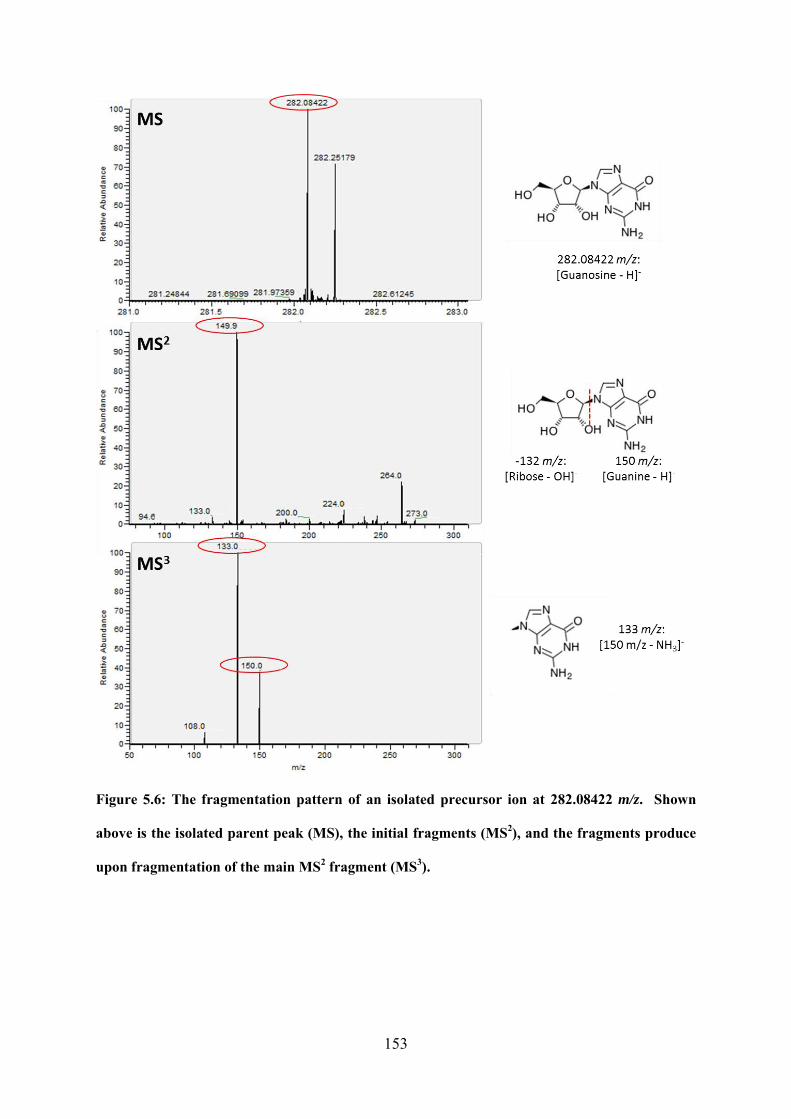
153
Figure 5.6: The fragmentation pattern of an isolated precursor ion at 282.08422 m/z. Shown
above is the isolated parent peak (MS), the initial fragments (MS2), and the fragments produce
upon fragmentation of the main MS2 fragment (MS3).
154
The similarities between the observed fragmentation patterns of these peaks to those
previously reported from purified standards (Struck-Lewicka et al., 2014; Stentoft et al.,
2014) heavily suggests that m/z 267.07334 and 282.08422 correspond to the [M-H]- ions of
inosine and guanosine respectively. As stated above, the peaks corresponding to these two
compounds, and to the putative identities of cAMP, adenosine and deoxyguanosine, are
within the top 50 PC3 loadings values generated in the previous chapter. This emphasizes the
importance of these compounds in the response induced by AgNP exposure, with inosine
ranked as the most important variable in the entire model.
Guanosine is a precursor for the synthesis of GTP; the substrate for G-protein coupled
receptors. As seen from ORA (Table 5.7), downstream G-protein coupled receptor signalling
pathways appeared to be affected following AgNP exposure. Related to this, the putative
metabolite cAMP, seen to increase significantly in response to AgNP exposure, is an
important second messenger molecule.
Both inosine and guanosine are ribonucleosides and as such are involved in the synthesis of
RNA. Guanosine is used in the synthesis of messenger, ribosomal and transfer RNA whereas
inosine is involved in the biosynthesis of some tRNA molecules (Elliott and Trewyn, 1984).
Their elevated production in response to AgNP and Ag+ exposure could simply be the result
of increased transcription and translation of proteins involved in the response to toxicant
exposure. The inhibition of RNA polymerase by AgNP has been previously observed;
Wang and colleagues demonstrated that exposure of erythroid progenitor cells to AgNP
resulted in the inhibition of RNA polymerase activity and RNA transcription through the
direct binding of AgNPs to the enzyme (Wang et al., 2013). This could explain the
significant increase in inosine and guanosine with respect to combined control groups;
inhibition of RNA polymerase could indirectly result in an accumulation of these metabolites
due to reduced RNA synthesis.
155
Alternatively inosine, guanosine and also adenosine have been previously reported to act as
cyto-protective compounds by combating oxidative stress (Jurkowitz et al., 1998; Módis et
al., 2009; Li et al., 2011; Cipriani et al., 2014). These compounds have been suggested to
have both anti-oxidant properties and induce the expression of DNA repair genes and the
production of antioxidants (Gudkov et al., 2006; Dal-Cim et al., 2012). It is therefore
possible that the increased production of inosine and guanosine is the result of AgNP or Ag+
induced oxidative stress.
5.4 Conclusions
The work presented in this chapter represents the first attempt to identify the molecular
response of D. magna to AgNP and Ag+ exposure using a combination of metabolomics and
transcriptomics techniques. In the previous chapter, microarray gene-spots and m/z peaks
that changed significantly in intensity were shortlisted, giving a list of the most important
variables in the molecular response to AgNP and Ag+ exposure. Here, those features were
successfully assigned putative identities, and pathway analysis was applied to identify
molecular pathways which had been putatively perturbed. Through use of IMPaLA, ORA
was simultaneously applied to the transcriptomics and metabolomics shortlists to statistically
integrate both levels of observation. The results of this analysis showed perturbation of genes
and metabolites involved in the metabolism of lipids and fatty acids, the transport of small
organic compounds, the metabolism of carbohydrates, G-protein coupled receptor signalling
and the metabolism of purines. Further investigation of these pathways showed substantial
interaction between the components on the purine metabolism pathway, with one enzyme in
particular (NT5C2) being responsible for the production of 4 putative compounds. Due to the
large variation of gene-expression between biological replicates, confirmation of significantly
156
altered expression for these genes by PCR was not successful. However, MS/MS
fragmentation gave greater confidence in the identity of m/z 267.07334 and m/z 282.08422 as
the purine nucleosides inosine and guanosine respectively. The remaining significant peaks
in this pathway could not be successfully isolated.
These two metabolites and the putative compounds adenosine and cAMP are within the top
50 PC3 loadings of the metabolomics PCA model produced in the last chapter. This indicates
that these compounds play an important role in the metabolic response of D. magna to AgNP
and Ag+ exposure. Exactly what role these two compounds play cannot be identified by this
study, but both compounds are involved in the synthesis of RNA and have also been reported
to have properties that protect cells from oxidative stress (Jurkowitz et al., 1998; Módis et al.,
2009). The latter role links with mechanisms of AgNP (AshaRani et al., 2009; Chairuangkitti
et al., 2013) and Ag+ (Yoshimaru et al., 2006; Cortese-Krott et al., 2009) toxicity suggested
in the literature involving the induction of oxidative stress. It could be possible that the
production of these compounds is increased for their signalling roles in an effort to increase
production of DNA damage repair and antioxidant enzymes (Dal-Cim et al., 2012).
However, it is possible the significant increase in these two metabolites is the result of RNA
polymerase inhibition, which is consistent with previously published findings (Wang et al.,
2013). In summary these two compounds represent good targets for future work
investigating the mechanism of AgNP-induced toxicity.
157
Chapter 6: Exploring the role of reactive oxygen species and oxidative
stress in Ag toxicity to D. magna
6.1 Introduction
Reactive oxygen species (ROS) are a group of short-lived chemically reactive oxygen-
containing molecules which include the superoxide radical (.O2-), hydroxyl radical (.OH),
hydrogen peroxide (H2O2) and singlet oxygen (1O2) (He et al., 2011). ROS are produced
naturally within mitochondria as a by-product of oxidative phosphorylation. During this
process some electrons can “leak” from the electron transport chain and interact with oxygen
leading to the formation of the superoxide radical (.O2-) (Campian et al., 2004). This process
is relatively infrequent under normal physiological conditions, with only 1-3% of oxygen
molecules within the mitochondria being converted into .O2- (Boveris and Chance, 1973; He
et al., 2011). Although .O2- has a relatively low reactivity, its presence propagates the
formation of other oxygen-containing radicals such as the hydroxyl radical (.OH) which
possesses the highest reduction potential of all biologically relevant ROS (Fu et al., 2014).
Normally, the production of this highly reactive and damaging species is kept in check by
endogenous antioxidant enzymes and molecules. The superoxide radical for example, is
converted to hydrogen peroxide and molecular oxygen by the anti-oxidant enzyme
superoxide dismutase (SOD) (Liochev and Fridovich, 2000). The resulting hydrogen
peroxide is then readily converted into water and molecular oxygen by the enzyme catalase
(Finkel and Holbrook, 2000). Antioxidants are small molecules which participate in redox
reactions to remove ROS and prevent their propagation and interaction with cellular
components. The most important antioxidant in eukaryotic cells is glutathione (GSH), a
tripeptide comprised of glutamic acid, cysteine and glycine (γ-glutamylcysteinylglycine)
which acts as a defence against ROS, reactive xenobiotics or other electrophiles such as Ag+.
158
Glutathione can reduce ROS directly through the thiol group of its cysteine residue resulting
in the removal of free ROS and the production of reduced glutathione (GSSG). Glutathione
is regenerated through the enzyme glutathione reductase which produces two molecules of
GSH from one molecule of GSSG. Glutathione can also sequester reactive species through
the actions of glutathione-S-transferase (GST), which catalyses the conjugation of GSH to
molecules such as such as peroxidised lipids and oxidises proteins (Strange et al., 2001). If
the production of ROS becomes excessive, cellular anti-oxidant systems can become
overwhelmed resulting in a state of oxidative stress (Finkel and Holbrook, 2000). Common
consequences of oxidative stress include damage to DNA, the oxidation of polyunsaturated
fatty acids in lipids (lipid peroxidation) and oxidation of amino acids in cellular proteins.
This can result in genotoxicity and mutations, as well as membrane and enzyme dysfunction
potentially leading to cytotoxicity and cell death.
Heavy metals induce the production of ROS through either the Fenton or Fenton-like
reactions (Equation 6.1) or the Haber-Weiss reaction (Equation 6.2) whereby the metal
catalyses the production of hydroxyl radicals from cellular hydrogen peroxide (Jomova and
Valko, 2011; Fu et al., 2014).
Equation 6.1: The Fenton reaction
𝐴𝑔0 + 𝐻2𝑂2 → 𝐴𝑔+ + ∙ 𝑂𝐻 + 𝑂𝐻−
Equation 6.2: The Haber-Weiss reaction
∙ 𝑂2− + 𝐻2𝑂2
𝐴𝑔0
→ 𝑂2 + 𝑂𝐻− + ∙ 𝑂𝐻
Ag is thought to induce the formation of ROS through a Fenton-like reaction such as that
outlined in Equation 6.1 resulting in the formation of Ag+ from Ag0 (He et al., 2011). The
Ag+ ion can then react with O2 causing the formation .O2- and reformation of Ag0. This Ag-
159
induced generation of ROS and oxidative stress has been measured in vitro and in vivo both
directly, through the detection of ROS via fluorescence-based biochemical assays (De
Matteis et al., 2015) and indirectly through measurement of down-stream effects such as
DNA damage (Asharani et al., 2009; De Matteis et al., 2015), protein oxidation (Rainville et
al., 2014) and the expression of antioxidant enzymes (Asharani et al., 2009; Poynton et al.,
2012). In vitro, exposure to AgNPs has been shown to cause a significant increase in
glutathione content and SOD activity within mouse hepatocytes (Arora et al., 2009). AgNP-
induced genotoxicity has also been detected via the comet assay following exposures to
human lung fibroblasts (AshaRani et al., 2009), human cervix carcinoma cells and human
lung carcinoma cells (De Matteis et al., 2015). Heme-oxygenase-1 (HMOX) has also been
measured to increase significantly in response to AgNP exposure by RT-qPCR (Asharani et
al., 2009) in human lung fibroblasts. In vivo, the disruption of mitochondrial activity and
oxidative phosphorylation has been observed following Ag exposure in C. elegans (Ahn et
al., 2014), D. magna (Stensberg et al., 2013; Scanlan et al., 2013) and D. rerio (Aerle et al.,
2013). The mitochondria are the principal location of oxygen within cells and as such are
often the primary site of ROS generation (Finkel and Holbrook, 2000). The presence of
AgNPs within these organelles is thought to result in an increased production of ROS that
ultimately leads to the disruption of energy production (Asharani et al., 2009; Verano-Braga
et al., 2014).
It is thought that exposure to Ag species induces oxidative stress in D. magna. Exposure to
AgNP was found to result in an increase of protein carbonylation (Rainville et al., 2014)
which the authors surmised as indicating protein oxidation caused by oxidative stress.
However the same study indicated that exposure to AgNPs and AgNO3 did not result in a
significant change of GST, catalase or GAPDH activity, which are known enzymatic
responses to excessive ROS production (Rainville et al., 2014). Targeted RT-qPCR also
160
failed to identify a significant increase in GST mRNA expression. However, AgNP and
AgNO3 exposed D. magna demonstrated a significant increase in the expression of a DNA
repair gene (REV1) in response to exposure to 1/10th of the LC50 and the LC25 of PVP-coated
AgNPs over 24 h (Poynton et al., 2012). A 1H NMR-based metabolomics investigation into
the response of D. magna to AgNP and AgNO3 exposure identified similar response profiles
in the metabolome of animals exposed to both forms of Ag (Li et al., 2015a). The response
included an increase in lactate and phosphocholine concentrations and a decrease in the
concentrations of glucose and certain amino acids, which the authors surmised as being an
indication of a disruption of energy metabolism and consequential oxidative stress (Li et al.,
2015a). Whether or not oxidative stress is induced by Ag species in D. magna is therefore
still a contested issue, it also remains unclear whether any previously detected indications of
oxidative stress are the direct result of the presence of Ag, or an inevitable consequence of
Ag-induced cell death.
In this chapter, D. magna neonates were exposed to the Low and Mid concentrations of
AgNP and AgNO3 used in Chapter 4, then subjected to targeted RT-qPCR analysis for three
biomarkers of oxidative stress: GST, SOD and HMOX. The expression of MT
(metallothionein) was also monitored as a positive control to confirm exposure and
internalisation of Ag, as an increase in MT transcription and protein abundance is a well-
documented response to both nanoparticle and dissolved Ag species exposure (see section
1.2). To confirm exposure to the intended concentrations of dissolved Ag and AgNP, the
total silver concentration of each individual exposure was measured by ICP-MS. DLS was
also used in an attempt to confirm the presence of particles in AgNP exposures, and absence
of particles in AgNO3 and control exposures. The aim of the work in this chapter was to test
the hypothesis proposed in Chapter 5 (section 5.4), that the observed increase in adenosine
and inosine production following Ag exposure is in response to oxidative stress. Particular

161
interest is given to HMOX, as its expression has been previously documented as being
elevated in response to guanosine exposure (Quincozes-Santos et al., 2014).
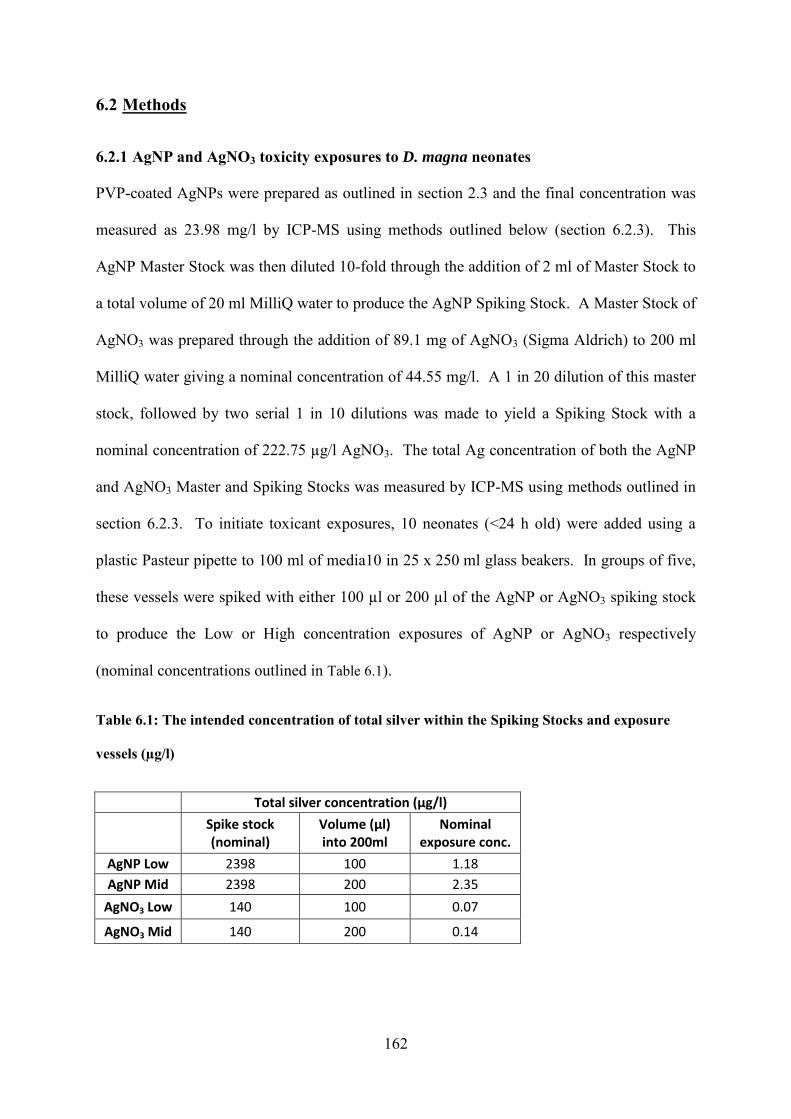
162
6.2 Methods
6.2.1 AgNP and AgNO3 toxicity exposures to D. magna neonates
PVP-coated AgNPs were prepared as outlined in section 2.3 and the final concentration was
measured as 23.98 mg/l by ICP-MS using methods outlined below (section 6.2.3). This
AgNP Master Stock was then diluted 10-fold through the addition of 2 ml of Master Stock to
a total volume of 20 ml MilliQ water to produce the AgNP Spiking Stock. A Master Stock of
AgNO3 was prepared through the addition of 89.1 mg of AgNO3 (Sigma Aldrich) to 200 ml
MilliQ water giving a nominal concentration of 44.55 mg/l. A 1 in 20 dilution of this master
stock, followed by two serial 1 in 10 dilutions was made to yield a Spiking Stock with a
nominal concentration of 222.75 µg/l AgNO3. The total Ag concentration of both the AgNP
and AgNO3 Master and Spiking Stocks was measured by ICP-MS using methods outlined in
section 6.2.3. To initiate toxicant exposures, 10 neonates (<24 h old) were added using a
plastic Pasteur pipette to 100 ml of media10 in 25 x 250 ml glass beakers. In groups of five,
these vessels were spiked with either 100 µl or 200 µl of the AgNP or AgNO3 spiking stock
to produce the Low or High concentration exposures of AgNP or AgNO3 respectively
(nominal concentrations outlined in Table 6.1).
Table 6.1: The intended concentration of total silver within the Spiking Stocks and exposure
vessels (µg/l)
Total silver concentration (µg/l)
Spike stock (nominal)
Volume (µl) into 200ml
Nominal exposure conc.
AgNP Low 2398 100 1.18
AgNP Mid 2398 200 2.35
AgNO3 Low 140 100 0.07
AgNO3 Mid 140 200 0.14
163
A no-added silver control was created through the addition of 200 µl MilliQ water to five
exposure vessels. Immediately following the addition of toxicant or MilliQ water, an
additional 100 ml of media10 was added to each vessel to mix and to bring the final
concentration to the intended nominal value (Table 6.1). Vessels were then covered with
Clingfilm and left for 24 h in the environmental conditions outlined above (section 2.5).
After 24 h, the exposures were terminated; the numbers of living and immobilised animals
per exposure vessel were counted, then the remaining living neonates were removed onto
gauze and transferred into a 2 ml Precellys homogenisation tube and flash-frozen in liquid
nitrogen. Precellys tubes were then stored at -80°C until required for the extraction of RNA.
6.2.2 Dynamic light scattering (DLS)
Immediately after exposure initiation, 1ml aliquots of dosed exposure media from three,
randomly selected vessels from the control, AgNP High and AgNO3 High groups were
transferred into a plastic cuvette for analysis by DLS. Particle size was measured using a
Zetasizer 5000 (Malvern Instruments, UK) at 20°C following a 120 s period to allow for
equilibration of temperature. The refractive index (0.54) and adsorption coefficient (3.99) for
silver samples were used to create the standard operating procedure for analysis using
Zetasizer software (Version 7.11, Malvern Instruments, UK).
The DLS technique shines a laser onto particles in suspension and determines their size from
the fluctuations in the intensity of scattered light. In this study DLS was used to measure
three parameters of particles within each solution: the z-average size (nm), the count rate and
the polydispersity index. The z-average size represents the average hydrodynamic diameter
of the particles in suspension; this value is most accurate with suspensions of spherical,
monodisperse particles. The count rate (or photon count rate) is simply the number of
detected photons which are reflected from the disperse particles. Particles with a particularly
low count rate (for example <100) could be of too low a concentration for successful

164
analysis. The polydispersity index ranges from 0 to 1 and is an indication of the size-
distribution of particles within the sample; a PDI greater than 0.7 is considered to have a very
broad particle size distribution and is probably unsuitable for measurement by DLS (Malvern
Instruments Ltd, 2011). Briefly, 5 replicate measurements were taken of each sample to
allow the calculation of mean values for the 3 measured parameters. The mean and standard
deviation for these parameters was calculated for the three biological replicates in each group
and differences between groups were compared by a 1-way ANOVA using a Tukey-Kramer
post-hoc test for multiple comparisons.
6.2.3 ICP-MS
After the exposure vessels were filled with dosed media, 500 µl of exposure water was
removed into a 40 ml glass vial (acid-washed) and digested in an additional 500 µl
concentrated, trace-metal grade HNO3 overnight in preparation for ICP-MS analysis.
Following digestion, samples were diluted to approximately 2 % (v/v) nitric acid through the
addition of 16 ml MilliQ water. The total Ag concentration of each water sample was
measured using an Agilent 7500ce with an Octopole Reaction system. Calibration was
performed between 0 – 50 ppb of Ag using 0, 1, 5, 10, 20 and 50 ppb standards. Silver
standards were prepared from a 1000 mg/l stock solution (VWR) in 2% nitric acid. A
calibration graph of counts (number) against concentration (µg/l) gave a correlation
coefficient (R2) of 1.000. An average was taken from 4 technical replicate measurements (in
ppb) for each sample of dosed media; these readings were then converted into a concentration
(in µg/l) from the calibration graph. The limit of detection for silver on this instrument was
0.02 ppb. To investigate the potential interference of media10 within the samples with the
measurement of dissolved total silver, two spike recovery tests were performed using aliquots
of a control replicate after it had first been measured. The first test using a final spike
concentration of 1 ppb gave a return reading of 1.05 ppb and the second using a final
165
concentration of 10 ppb gave a return reading of 10.07 ppb, indicating that the media
component had no impact on the measurements.
6.2.4 Extraction of RNA
RNA extractions were performed using the Absolutely RNA minprep kit (Agilent) to
manufacturer’s instructions for animal tissue samples. Briefly, frozen animals (10 neonates
per sample) were homogenised using a Precellys-24 ceramic bead-based homogeniser
(Stretton Scientific Ltd., UK) in 250 μl of guanidine-thiocyanate containing lysis buffer for
two 10 s bursts at 6400 rpm with a 15 s intermission. Homogenate was then transferred into
a nuclease-free 1.5 ml microfuge tube containing a further 250 µl of 70% ethanol and vortex
mixed. This mixture was then transferred to silica-based RNA-binding spin-columns and
spun in a centrifuge for 60 s at 8000 rcf to allow RNA binding. The spin-columns were then
washed with 600 µl of Low-salt buffer (60 s at 8000 rcf) and treated with DNase1 according
to manufacturer’s instructions. Once DNase treatment was completed the columns were
washed with 600 µl High-salt buffer then 600 µl of Low-salt buffer (each for 60 s at
8000 rcf). Finally samples were washed with 300 µl Low salt buffer (8000 rcf for 2 minutes)
and then dried by spinning (8000 rcf for 1 minute) without any additional buffer. Spin
columns were transferred to a 1.5 ml nuclease-free microfuge tube and RNA was eluted using
30 µl of elution buffer (10 mM Tris-HCl (pH 7.5) and 0.1 mM EDTA). The quantity and
quality of RNA was assessed using a spectrophotometer (NanoDrop 1000, Thermo Scientific,
Waltham, MA) with an analysis constant of 40 for RNA.
6.2.5 Synthesis of cDNA
Prior to primer validation and RT-qPCR, cDNA was synthesised using a Tetro cDNA
synthesis kit (Bioline Reagents Limited, London, UK) according to manufacturer’s
instructions. RNA was first incubated with a mix of random hexamers (1 µl) for 2 minutes at
65 °C to denature template RNA. Due to the relatively low yields of RNA extracted from
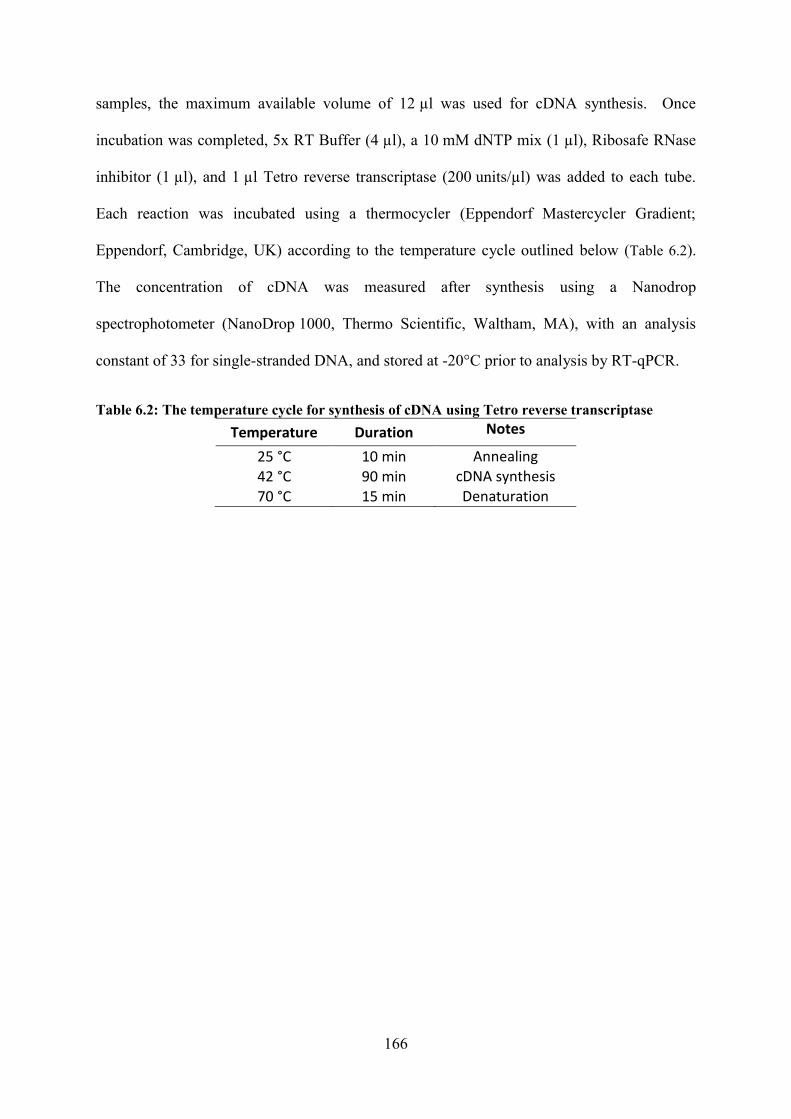
166
samples, the maximum available volume of 12 µl was used for cDNA synthesis. Once
incubation was completed, 5x RT Buffer (4 µl), a 10 mM dNTP mix (1 µl), Ribosafe RNase
inhibitor (1 µl), and 1 µl Tetro reverse transcriptase (200 units/µl) was added to each tube.
Each reaction was incubated using a thermocycler (Eppendorf Mastercycler Gradient;
Eppendorf, Cambridge, UK) according to the temperature cycle outlined below (Table 6.2).
The concentration of cDNA was measured after synthesis using a Nanodrop
spectrophotometer (NanoDrop 1000, Thermo Scientific, Waltham, MA), with an analysis
constant of 33 for single-stranded DNA, and stored at -20°C prior to analysis by RT-qPCR.
Table 6.2: The temperature cycle for synthesis of cDNA using Tetro reverse transcriptase Temperature Duration Notes
25 °C 10 min Annealing
42 °C 90 min cDNA synthesis
70 °C 15 min Denaturation
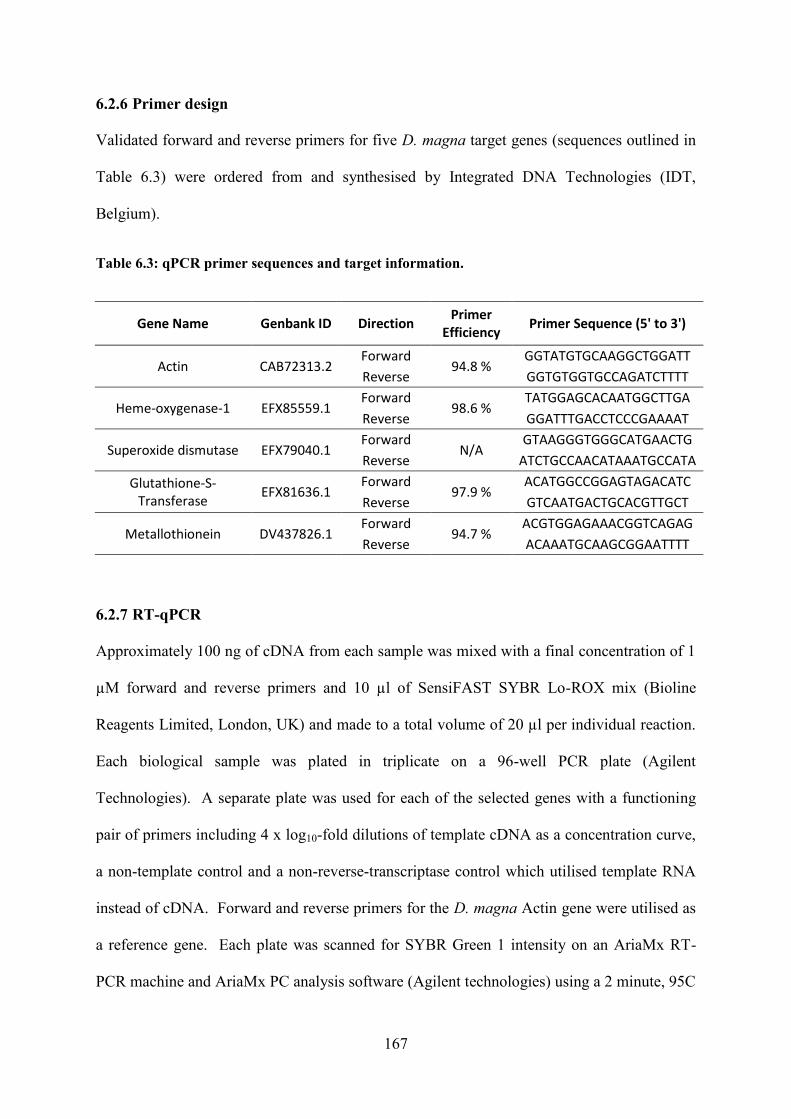
167
6.2.6 Primer design
Validated forward and reverse primers for five D. magna target genes (sequences outlined in
Table 6.3) were ordered from and synthesised by Integrated DNA Technologies (IDT,
Belgium).
Table 6.3: qPCR primer sequences and target information.
Gene Name Genbank ID Direction Primer
Efficiency Primer Sequence (5' to 3')
Actin CAB72313.2 Forward
94.8 % GGTATGTGCAAGGCTGGATT
Reverse GGTGTGGTGCCAGATCTTTT
Heme-oxygenase-1 EFX85559.1 Forward
98.6 % TATGGAGCACAATGGCTTGA
Reverse GGATTTGACCTCCCGAAAAT
Superoxide dismutase EFX79040.1 Forward
N/A GTAAGGGTGGGCATGAACTG
Reverse ATCTGCCAACATAAATGCCATA
Glutathione-S-Transferase
EFX81636.1 Forward
97.9 % ACATGGCCGGAGTAGACATC
Reverse GTCAATGACTGCACGTTGCT
Metallothionein DV437826.1 Forward
94.7 % ACGTGGAGAAACGGTCAGAG
Reverse ACAAATGCAAGCGGAATTTT
6.2.7 RT-qPCR
Approximately 100 ng of cDNA from each sample was mixed with a final concentration of 1
µM forward and reverse primers and 10 µl of SensiFAST SYBR Lo-ROX mix (Bioline
Reagents Limited, London, UK) and made to a total volume of 20 µl per individual reaction.
Each biological sample was plated in triplicate on a 96-well PCR plate (Agilent
Technologies). A separate plate was used for each of the selected genes with a functioning
pair of primers including 4 x log10-fold dilutions of template cDNA as a concentration curve,
a non-template control and a non-reverse-transcriptase control which utilised template RNA
instead of cDNA. Forward and reverse primers for the D. magna Actin gene were utilised as
a reference gene. Each plate was scanned for SYBR Green 1 intensity on an AriaMx RT-
PCR machine and AriaMx PC analysis software (Agilent technologies) using a 2 minute, 95C

168
hot start, a 3-step amplification cycle (Table 6.4). Melt-profile analysis was plotted for each
sample to ensure only a single product was amplified and primer dimers were not formed.
Table 6.4: RT-qPCR temperature cycle. Each stage proceeds in order from top to bottom with
the middle three stages repeated (in order) 39 times before melt-curve determination
Temperature (°C) Duration No. cycles
95 2 min 1 Hot start
95 5 s
40 3-step
amplification 60 10 s
72 5 s
95 30 s 1
Melt curve 65 30 s 1
95 30 s 1
The amplification efficiencies of the reference and target genes were not equal (Table 6.3);
therefore the Pfaffl method (Pfaffl, 2001) was used to calculate relative expression levels of
target genes. The Pfaffl method allows relative quantification of the expression of a target
gene in comparison to a reference gene (often called a housekeeping gene) and follows the
equation outlined in Equation 5.1. Briefly, the quantification cycle (Cq) of treated samples
was subtracted from the average background Cq taken from control samples to produce a ΔCq
for both the target and reference genes. The primer efficiency value for the target gene raised
to the power of its ΔCq is then divided by the primer efficiency value for the reference gene
raised to the power of its ΔCq. The result is a relative fold change of a target gene in treated
samples compared to control samples normalised by a reference gene. Differences between
groups were compared by a 1-way ANOVA using a Tukey-Kramer post-hoc test for multiple
comparisons. Any set of technical replicates with a standard deviation greater than 2 was
considered unreliable and as such was removed from statistical analysis.

169
Equation 6.3: The Pfaffl method for relative quantification and calculation of the relative
expression ratio (R). Where E represents the amplification efficiency of the target or reference
gene and ΔCq is the Cq deviation of control – sample of the target of reference gene.
𝑅 =(𝐸target)∆𝐶𝑞target(𝑐𝑜𝑛𝑡𝑟𝑜𝑙−𝑠𝑎𝑚𝑝𝑙𝑒)
(𝐸reference)∆𝐶𝑞ref(𝑐𝑜𝑛𝑡𝑟𝑜𝑙−𝑠𝑎𝑚𝑝𝑙𝑒)
170
6.3 Results and Discussion
6.3.1 Characterisation of dosed exposure media using DLS and ICP-MS
On preparation of the dosed exposure media, samples were taken for characterisation by DLS
and ICP-MS. DLS was used to characterise the size and presence of Ag particles within
dosed media and to confirm the presence of particles in AgNP exposures as well as the
absence of particles in AgNO3 and control exposures. ICP-MS was selected for its high
sensitivity and was used to determine the total Ag concentration within each exposure beaker
in order to confirm that animals were exposed to the intended concentration of Ag.
Low levels of large polydisperse particles were detected in every sample including the no-
added silver control. The z-average particle sizes were measured to be 976.00 ± 407.4 nm in
control samples, 722.20 ± 22.37 nm in the AgNP High group and 994.47 ± 371.09 nm in
AgNO3 High group (Figure 6.1 A). All samples gave similarly large PDI values; 0.6 ± 0.1,
0.7 ± 0.1 and 0.6 ± 0.2 for the control, AgNP High and AgNO3 High groups respectively
(Figure 6.1 B). The final measured parameter, the average photon count rate, was low in
each group; 138.83 ± 84.28 nm, 79.12 ± 16.25 nm and 146.00 ± 95.17 for the control, AgNP
and AgNO3 groups respectively (Figure 6.1 C). Following statistical analysis by 1-way
ANOVA, it was determined that there were no statistically significant differences between
mean values for particle size (p = 0.5396), PDI (p = 0.4895) or count rate (p = 0.5167).
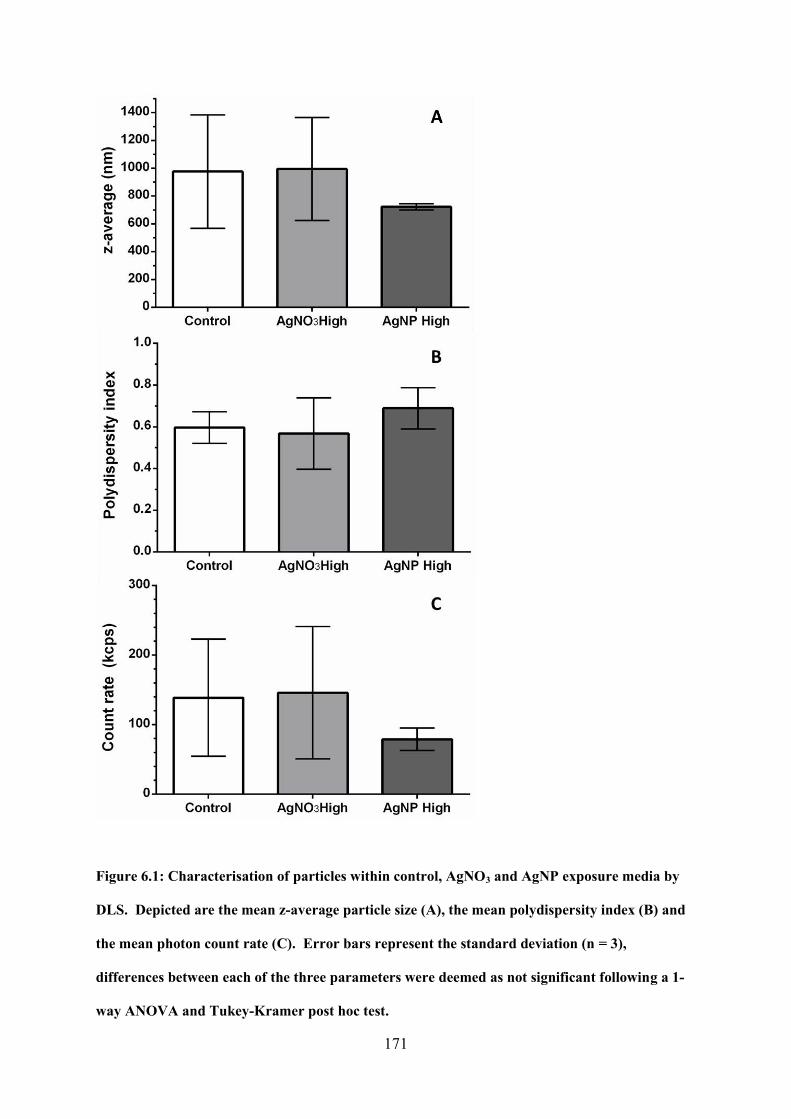
171
Figure 6.1: Characterisation of particles within control, AgNO3 and AgNP exposure media by
DLS. Depicted are the mean z-average particle size (A), the mean polydispersity index (B) and
the mean photon count rate (C). Error bars represent the standard deviation (n = 3),
differences between each of the three parameters were deemed as not significant following a 1-
way ANOVA and Tukey-Kramer post hoc test.
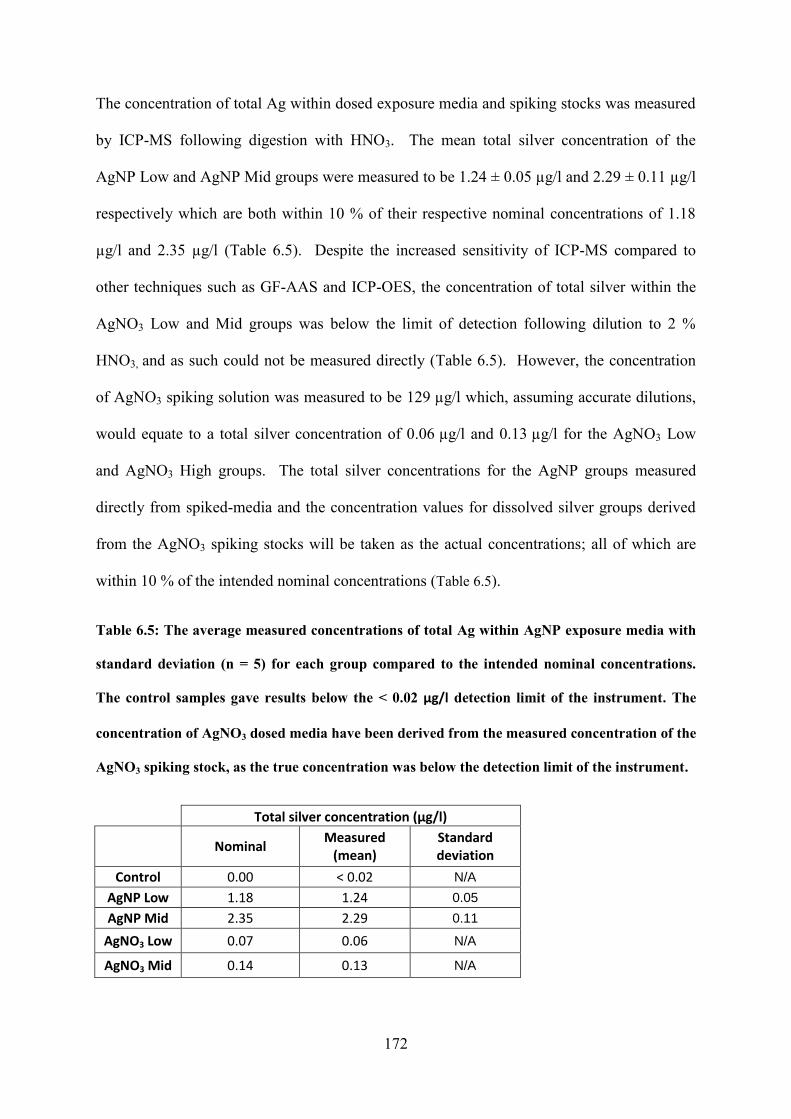
172
The concentration of total Ag within dosed exposure media and spiking stocks was measured
by ICP-MS following digestion with HNO3. The mean total silver concentration of the
AgNP Low and AgNP Mid groups were measured to be 1.24 ± 0.05 µg/l and 2.29 ± 0.11 µg/l
respectively which are both within 10 % of their respective nominal concentrations of 1.18
µg/l and 2.35 µg/l (Table 6.5). Despite the increased sensitivity of ICP-MS compared to
other techniques such as GF-AAS and ICP-OES, the concentration of total silver within the
AgNO3 Low and Mid groups was below the limit of detection following dilution to 2 %
HNO3, and as such could not be measured directly (Table 6.5). However, the concentration
of AgNO3 spiking solution was measured to be 129 µg/l which, assuming accurate dilutions,
would equate to a total silver concentration of 0.06 µg/l and 0.13 µg/l for the AgNO3 Low
and AgNO3 High groups. The total silver concentrations for the AgNP groups measured
directly from spiked-media and the concentration values for dissolved silver groups derived
from the AgNO3 spiking stocks will be taken as the actual concentrations; all of which are
within 10 % of the intended nominal concentrations (Table 6.5).
Table 6.5: The average measured concentrations of total Ag within AgNP exposure media with
standard deviation (n = 5) for each group compared to the intended nominal concentrations.
The control samples gave results below the < 0.02 µg/l detection limit of the instrument. The
concentration of AgNO3 dosed media have been derived from the measured concentration of the
AgNO3 spiking stock, as the true concentration was below the detection limit of the instrument.
Total silver concentration (µg/l)
Nominal
Measured (mean)
Standard deviation
Control 0.00 < 0.02 N/A
AgNP Low 1.18 1.24 0.05
AgNP Mid 2.35 2.29 0.11
AgNO3 Low 0.07 0.06 N/A
AgNO3 Mid 0.14 0.13 N/A
173
Across all three parameters measured by DLS, there were no significant differences in
particle content between the control and highest concentration AgNO3 and AgNP exposures.
The large average polydispersity indices measured for all three groups as well as the low
photon count rates give an indication that the samples are not suitable for measurement by
DLS (Malvern Instruments Ltd, 2011). However, the apparent detection of large polydisperse
particles could be caused by the genuine presence of particles within all groups. These
particles could be common to all three groups or different for each group. For example,
particles detected in the AgNP high group could be the result of particle aggregation between
the PVP-AgNPs present within the media. Particles detected in the AgNO3 exposure may be
the precipitation of insoluble AgCl formed by the reaction of Ag+ with Cl- present within
media10. Finally, particles present within the control group could be small dust particles or
natural organic matter transferred into the media with the animals. Alternatively, the
readings could be an artefact of the exposure medium, induced by light scattered by the
dissolved salts present within media10 and not by dissolved or nanoparticle silver.
Regardless, the absence of significant differences between the three measured parameters
indicates that DLS cannot distinguish between the particles present within the AgNP High
group and the control group. As such it is apparent that DLS is an inappropriate technique to
use at such low concentrations of Ag within media10 to confirm the presence or absence of
particles. A more appropriate method may be the use of an imaging technique such as
confocal microscopy or TEM to directly visualise the presence or absence of particles or
aggregates in exposure media.
The results of ICP-MS analysis confirm the presence of Ag within spiked exposure media.
The successful measurement of spike-recovery tests (Section 6.2.3) indicated that
measurements of Ag-spiked samples returning values less than the limit of detection are not
the result of interaction between the Ag and the exposure media. Therefore particles that are
174
present within the AgNP High group are likely either to be of too low a concentration to
accurately detect by DLS, as suggested by the low photon count rate, or are potentially
masked by the presence of naturally occurring particles common to all exposure groups.
6.3.2 Targeted analysis of antioxidant enzyme expression by RT-qPCR
Following a 24 h exposure period, no neonates were immobilised in the control, AgNO3 Low
and AgNO3 High groups. Both concentrations of AgNP exposure induced neonate
immobilisation; the lowest concentration induced partial immobilisation (44 % of the total
starting population) whereas the highest concentration induced total immobilisation of the
starting population, resulting in that group’s removal from the study (see Appendix Table
9.5). Surviving neonates from the AgNP Low group were still collected for extraction of
RNA and analysis by RT-qPCR alongside the other remaining three groups.
During analysis, no amplification was observed for reactions using primers for superoxide
dismutase (SOD). SYBR green melt-curve data for each sample showed a complete absence
of product; this remained true even with the highest amount of template used in the
concentration curve, suggesting the primers for this target gene were not viable. As such, the
expression of this particular target gene was not measured as was originally intended. The
primers for the remaining three target genes; glutathione-S-transferase (GST),
metallothionein (MT) and heme-oxygenase 1 (HMOX), were viable and measurement of
their expression was successful (Figure 6.2). During synthesis of cDNA, one replicate of the
AgNO3 Low group yielded 10 fold less cDNA than all other replicates. As such there was an
insufficient quantity for qPCR of this sample, reducing the replicate number for AgNO3 Low
to four for all three target genes. Equally, 2 biological replicates in the MT analysis (one
from AgNP Low and one from AgNO3 Mid) and one from HMOX analysis (AgNO3 Mid)
were excluded from statistical analyses for having standard deviations amongst technical
replicates greater than 2.0. Following log10 transformation, the fold-change of GST and

175
HMOX relative to control expression was deemed as statistically insignificant between all
groups by 1-way ANOVA and Tukey-Kramer post-hoc test (p = 0.7674 and p = 0.7913
respectively). Metallothionein expression however was seen to increase significantly relative
to control (p = 0.0287) upon exposure to the lowest concentration of AgNP (1.24 µg/l)
(Figure 6.2). The change in expression upon exposure to 0.06 and 0.13 µg/l AgNO3 was not
significant relative to control samples.

176
Figure 6.2: Relative gene expression of glutathione-S-transferase (GST), metallothionein (MT) and heme-oxygenase 1 (HMOX) in D. magna
following exposure to 1.19 µg/l of AgNP (AgNP Low), 0.06 µg/l and 0.13 µg/l of AgNO3 (AgNO3 Low and AgNO3 High respectively). Relative fold
changes calculated by the Pfaffl method have been log10 transformed prior to analysis ANOVA. Error bars represent the standard deviation of each
group (n = 3 for AgNP Low, n = 4 for AgNO3 Low and n = 4 for AgNO3). The * denotes a significant increase in MT expression relative to the
control group (p = 0.0287).
177
The significant increase in MT expression observed here conforms to previously reported
results in D. magna (Poynton et al., 2012; Rainville et al., 2014) and other in vivo models
(Ferguson et al., 1996; Chae et al., 2009; Meyer et al., 2010; García-Alonso et al., 2011;
Yang et al., 2012; Johari et al., 2015). This result suggests the successful internalisation of
Ag into D. magna cells upon exposure to AgNP. MT expression will be increased in
response to the presence of Ag within these cells in order to sequester Ag and Ag+ and
remove from the cell. The mean relative expression of MT in animals exposed to AgNO3
was increased when compared to control animals but deemed not to be significant
following a 1-way ANOVA (Figure 6.2). This result was unexpected as increased MT
expression and activity is a well-documented response to dissolved Ag exposure (Poynton
et al., 2012; Rainville et al., 2014; De Matteis et al., 2015; Arai et al., 2015). It should be
noted that the error on both mean values was large (Figure 6.2) and the non-significant
result may simply be caused by insufficient biological replicates and therefore be a false
negative. However in 2012, Poynton et al. also saw a significant increase in the
transcription of MT in response to commercial PVP-coated AgNPs (8.14 µg/l, 35 nm core
diameter), a result which again was not reciprocated upon exposure to 0.16 µg/l or 0.32
µg/l AgNO3. (Poynton et al., 2012).
The expression of both GST and HMOX was also observed to not change significantly
following exposure to both AgNPs and AgNO3. The role of GST in D. magna response to
Ag exposure has been measured previously by RT-qPCR (Poynton et al., 2012) and
through measurement of GST enzyme activity (Rainville et al., 2014). In both instances
GST was also seen to not increase significantly in response to Ag silver exposure. This is
in spite of evidence of oxidative stress being identified in the latter study (Rainville et al.,
2014). Despite being part of the response of certain cell lines to Ag exposure (Asharani et
al., 2009) HMOX expression does not appear to be a part of the response to Ag exposure
178
in D. magna (Figure 6.2). The lack of response observed from these two biomarkers of
oxidative stress suggests that this state is not induced by exposure to dissolved or
nanoparticle Ag. However, Ag-induced oxidative stress has been observed across multiple
bacterial (Lok et al., 2007; Choi and Hu, 2008; Hwang et al., 2008; Park et al., 2009) and
eukaryotic (Arora et al., 2009; Asharani et al., 2009; Domingos et al., 2009; Chairuangkitti
et al., 2013) cell lines as well as in multiple model organisms (Chae et al., 2009; Meyer et
al., 2010; García-Alonso et al., 2011; Yang et al., 2012; Johari et al., 2015). It is therefore
more likely that if oxidative stress is induced in D. magna, as has been reported (Poynton
et al., 2012; Rainville et al., 2014; Li et al., 2015a), GST and HOX transcription plays no
part in the response mechanism.
6.4 Conclusions
The targeted RT-qPCR conducted in this study suggests that although Ag is successfully
internalised, transcription of GST and HMOX are not involved in the response of
D. magna to Ag exposure. Despite the observation that two well-defined biomarkers of
cellular oxidative stress do not increase significantly in response to Ag exposure, the result
of this work does not categorically confirm that ROS generation plays no part in Ag
toxicity. The production of ROS by AgNP has been observed in many previous
publications, either through the direct catalysis of H2O2 degradation (He et al., 2011),
direct measurement of ROS production in vitro (Asharani et al., 2009; De Matteis et al.,
2015), or analysis of the damaging consequences of oxidative stress across multiple model
organisms (Chae et al., 2009; Meyer et al., 2010; García-Alonso et al., 2011; Yang et al.,
2012; Johari et al., 2015). The presence of ROS was not measured directly within this
study so it is still possible, as reported by previous publications, that Ag that is internalised
within the cells of D. magna induces the formation of ROS. MT is known to respond to
the presence of ROS, so it is possible that the significant increase of MT in this chapter is
179
instead in response to ROS generation and not solely the presence of Ag within the
organism’s cells. However with the other target genes in this chapter (HOX and GST)
remaining unresponsive to Ag exposure, it seems more likely that the significant response
of MT is metal-responsive and not in in response to oxidative stress.
One specific aim of this work was to investigate a hypothesis formed from the results of
Chapter 5 (section 5.4) that an observed significant increase in two purine nucleosides was
in response to oxidative stress. It had been previously documented that guanosine protects
against oxidative damage through the induction of HMOX (Quincozes-Santos et al., 2014).
The results from this chapter have shown that HMOX expression is not significantly
altered following exposure to both AgNPs and AgNO3. This means the observed
significant increase in purine nucleoside concentration does not result in elevated HMOX
expression, suggesting an alternate cause for their accumulation.
180
Chapter 7: General Discussion and future work
The aims set out at the start of this research (Section 1.5) were designed to investigate the
unknown mechanism of AgNP toxicity in the freshwater crustacean D. magna using a
dual-omics platform. The investigation took a non-targeted approach to help drive the
formation of hypotheses concerning the molecular perturbations and responses induced by
exposure to AgNP in comparison to AgNO3. This approach would allow the comparison
of the global molecular profiles of animals exposed to both forms of silver, allowing for
the determination of the role of dissolution in AgNP toxicity, and the elucidation of their
mechanisms of action. In addition, this thesis allowed the exploration of the possibility of
using non-targeted omics analyses as part of nanoparticle risk assessment.
7.1 The role of dissolution in AgNP toxicity
Although the exact role of AgNP dissolution in toxicity is still unconfirmed, there is
growing consensus among studies that would suggest a Trojan-horse like mechanism to be
the most applicable to AgNP induced toxicity. The Trojan-horse mechanism hypothesis
suggests AgNPs enact toxicity through the release of toxic Ag+ ions following uptake of
AgNP into the exposed cells or organisms. In D. magna, the presence of silver within
whole-body digests of exposed animals has been previously measured by ICP-MS (Khan
et al., 2015) and through use of radioisotopes (Zhao and Wang, 2012b). Secondary ion
mass spectrometry imaging techniques have identified the presence of Ag within the
lumen of the gut of AgNP-exposed animals which was seen to distribute into the
surrounding tissues over time (Audinot et al., 2013). ICP-MS measurements in Chapter 4
(section 4.3.4) supported this literature base by indicating a significantly greater
concentration of silver within AgNP exposed animals than those exposed to theoretical
concentration of the dissolved Ag fraction of AgNP exposures on its own. This result

181
potentially indicated the delivery of greater internal concentrations of dissolved silver than
would be if AgNPs only dissolved externally to the animals.
What has not been observed in the in vivo investigations mentioned above is the relative
proportions of the nanoparticle and dissolved species of the measured total Ag within
exposed D. magna. These proportions of Ag speciation would help towards showing that
AgNPs are adsorbed within D. magna then dissolve internally into Ag+, showing that
aspect of the Trojan-horse hypothesis to be possible. This type of investigation has been
examined in vitro, leading to the detection of AgNPs within endo-lysosomal structures
(Greulich et al., 2011; Arai et al., 2015; De Matteis et al., 2015) and the time-dependent
release of Ag+ following exposure to the acidic environment of these structures (De
Matteis et al., 2015). These observations indicate, at least in vitro, that the Trojan-horse
mechanism, in terms of uptake and dissolution, is possible.
The relative proportion of AgNP and dissolved Ag within AgNP-exposed D. magna could
be investigated through use of a combination of separation and measurement techniques as
have been implemented previously on D. magna exposure media (Shen et al., 2015). The
ICP-MS analysis of acid-digested D. magna exposed to AgNPs and AgNO3 presented in
Chapter 4 could be taken further through additional determination of the internal
concentration of total dissolved Ag by ICP-MS of acid-digested animals following
centrifugal ultrafiltration using a 30-kDa filter (Shen et al., 2015). The respective internal
AgNP concentration would be the resulting difference between these two total
measurements. Combination of these techniques with visualisation techniques such as
TEM or SIMS would be necessary to aid interpretation of whether any observed
dissolution would occur within the lumen of the gut or in the surrounding tissues.
182
What is still lacking from the literature, both in vitro and in vivo, is evidence of which of
the many forms of Ag is directly responsible for Ag-induced toxicity. The work in
Chapter 4 of this thesis adds to this body of literature, identifying similar molecular
profiles induced by both AgNP and dissolved Ag, which would agree with the hypothesis
that AgNPs induce toxicity through the internal or intracellular release of dissolved Ag.
This work suggests the involvement of dissolved Ag in AgNP toxicity. Also observed was
a significant difference in the magnitude of the perturbations induced by AgNPs and
AgNO3, which is a potential indication that the nanoparticle fraction has an additional
affect. Measurement of total Ag body burden in D. magna neonates exposed to AgNPs
and the respective dissolved Ag fraction alone showed a significantly elevated body
burden in AgNP-exposed animals. This potentially indicates the adsorption and possible
ingestion of AgNPs into the organism. Targeted RT-qPCR for the expression of
metallothionein indicated a significant increase in the gene’s expression following
exposure to the highest concentration of AgNP (Section 6.3.2). In the work described in
Chapter 6, this gene was targeted as a positive control for successful Ag cellular uptake, as
MT expression and activity is known to increase in response to Ag exposure to sequester
and remove the Ag from the cells This, coupled with the observation that both species of
Ag induce similar overall molecular responses, potentially indicates presence of Ag with
D. magna cells. This would be consistent with previously published findings in D. magna
(Zhao and Wang, 2012b; Stensberg et al., 2013), and in vitro (Park et al., 2010; Wang et
al., 2013) which conclude that AgNPs work through a Trojan-horse type mechanism by
acting as a vehicle for the delivery of the toxic Ag+ ion following cellular uptake.
It is probable that the observed difference in magnitude between molecular profiles
induced by AgNP and AgNO3 exposure is due to differences in the sites of absorption and
subsequent distribution of these forms of Ag. The relationship between total Ag exposure
183
concentration and the resulting body burden in D. magna potentially indicated a higher
rate of uptake when animals were exposed to AgNO3 compared to AgNPs (section 4.3.4).
This is not unexpected, as dissolved Ag is known to be more bioavailable than AgNPs due
to its more rapid method of cellular uptake. It is possible however that this potential
difference in uptake rate is the result of the different species of Ag targeting different sites.
It has been shown previously that dissolved Ag are absorbed by D. magna through the site
of gaseous exchange (Bianchini and Wood, 2003), and that AgNPs are thought to enter the
organism through the digestive tract (Zhao and Wang, 2010; Audinot et al., 2013). An
obvious direction in which to take this line of investigation further is through the use of
imaging techniques to identify and compared these sites of AgNP and dissolved Ag
absorption. Micro-proton induced X-ray emission (MicroPIXE) has been used previously
to observe and quantify the distribution of AgNPs ingested by the woodlouse Pocellio
scaber (Tkalec et al., 2011). An alternative technique would be SIMS imaging, which has
been used previously to visualise AgNPs, TiO2 NPs and SiO2 NPs within D. magna,
identifying the presence of AgNPs in the lumen of the digestive tract (Audinot et al.,
2013). Exposures identical to those outlined in Chapter 4 would allow the comparison of
the distribution of silver following AgNP exposure, or exposure to the dissolved Ag
fraction alone.
7.2 The molecular response of D. magna to Ag exposure
The background knowledge of the molecular perturbations induced by AgNPs is
comparatively low. AgNPs along with other nanomaterials therefore represent an ideal
opportunity to utilise omics-technologies for a non-targeted approach to determining their
mechanism of toxicity. Some studies to date have focused on biochemical interactions
known to be perturbed by Ag+; such as disruption of Na+ transport (Stensberg et al., 2013),
mitochondrial disruption (Almofti et al., 2003; Stensberg et al., 2013; Ahn et al., 2014) and

184
the formation of ROS with the subsequent induction of oxidative stress (Park et al., 2009;
Hsiao et al., 2015). This strategy, while a sensible start point, potentially provides only a
narrow scope on the molecular mechanism, leaving potential novel changes undiscovered.
Many omics investigations into AgNP toxicity have also centred their conclusions on the
mechanisms mentioned above (Poynton et al., 2012; Aerle et al., 2013; Rainville et al.,
2014; Verano-Braga et al., 2014; Li et al., 2015a; 2015b; Carrola et al., 2015), but several
have identified other components or pathways involved in the toxic response to AgNPs
that were previously unrecognised (Hadrup et al., 2012; Aerle et al., 2013; Verano-Braga
et al., 2014).
A quantitative proteomics investigation identified up-regulation of serine/threonine protein
kinase (PAK), mitogen-activated protein kinase (MAPK) and protein phosphatase 2A
(PP2A) subunits following exposure of human colon carcinoma cells to 100 nm citrate-
coated AgNPs (Verano-Braga et al., 2014). PAK and MAPK are both involved in
signalling cascades that result in caspase-dependent and caspase-independent apoptosis
respectively, and PP2A is involved in the regulation of the cell cycle. This study also
implied an increase in degradation of proteins by the ubiquitin-proteasome system,
possibly damage proteins, followed by the synthesis of replacement proteins (Verano-
Braga et al., 2014). In addition to concluding that both AgNPs and dissolved silver impact
oxidative phosphorylation and mitochondrial activity, Van Aerle et al. (2013) identified
significant down-regulation of proteasome subunit beta type-1 and up-regulation of
ribosomal protein S6 modification-like protein B, the authors suggested that together these
alterations imply an increased level of protein turnover due to oxidative damage (Aerle et
al., 2013). An NMR-based metabolomics study in rats measured an increased excretion of
uric acid and allantoin in urine following AgNP exposure, suggesting a disruption of
purine metabolism (Hadrup et al., 2012).
185
In Chapter 5, pathway analyses of the Ag-exposed D. magna identified perturbations in
transcription pathways involved in G-protein coupled receptor (GPCR) signalling and
signalling cascades involving MAP kinases, nerve growth factor, neurotrophin and Rho-
GTPases. This supports previous observations of MAPK up-regulation in AgNP-exposed
human colon carcinoma cells (Verano-Braga et al., 2014). GPCRs initiate cellular
signalling cascades through MAPKs that result in the regulation of genes involved in cell
growth and differentiation, as well as inflammation and apoptosis. The pathways involved
in the metabolism of dietary sugars as well as purines and amino-sugars and nucleotide
sugars were identified as being perturbed, potentially indicating the disruption of energy
production that has been repeatedly reported following AgNP exposure. The hypothesis-
generating ability of omics-technologies highlighted these pathways as potential
candidates for further investigation.
Integrated pathway analysis indicated the metabolic and transcriptional perturbations of
components within the purine metabolism pathway to be the most interconnected in
comparison to other impacted pathways. This was therefore chosen as the next line of
investigation within Chapter 5. The purine nucleosides inosine and guanosine were
identified as increasing significantly in D. magna in response to Ag exposure. A previous
NMR-based metabolomics study in rats measured an increased excretion of uric acid and
allantoin in urine following AgNP exposure, suggesting a disruption in the metabolism of
purine nucleosides (Hadrup et al., 2012). Besides this study, there have been few others
to focus on or identify this metabolic pathway in the AgNP response. The exact cause of
this increased production is unknown but seems unlikely to be in response to oxidative
stress as investigated in Chapter 6. Increasing guanosine production has been observed
previously to indirectly combat oxidative stress through stimulation of Heme-oxygenase1
(Quincozes-Santos et al., 2014). RT-qPCR performed as part of Chapter 6 showed no

186
significant change in the expression of HMOX or GST, two markers of oxidative stress,
following exposure of D. magna to AgNPs and AgNO3. The transcription (Poynton et al.,
2012) and enzyme activity (Rainville et al., 2014) of GST in D. magna has been measured
to be unchanged in response to AgNP exposure before, as have the activities of other well-
characterised markers of oxidative stress such as catalase and GAPDH (Rainville et al.,
2014). These results disprove the hypothesis proposed at the conclusion of Chapter 5 that
the observed increase in guanosine content is in response to Ag-induced oxidative stress
ultimately resulting in the stimulation of HMOX activity.
The production of ROS and induction of oxidative stress by AgNP is becoming a well-
established mechanism in mammalian cell lines and some model organisms, though the
evidence for oxidative stress in D. magna is somewhat conflicting and contradictory.
Oxidative stress has been suggested as a mechanism of AgNP toxicity in D. magna before,
but the direct measurement of Ag-induced ROS has only been attempted very recently
(Ulm et al., 2015). The result of this measurement was unclear, with no significant
production of ROS observed, though the author surmised that this may be the result of the
significant increase in GSH production observed alongside the ROS assay (Ulm et al.,
2015). It could be possible that the observed increased production of GSH may be in
response to the presence of Ag+ rather than ROS, as GSH non-specifically sequesters
electrophiles which include heavy metals. Additionally, due to the relatively low EC50 of
Ag species, any measurements of oxidative stress may not be caused directly by Ag, but
potentially as a by-product of Ag-induced hypoxia or the latter stages of cell death. It may
be the case that in D. magna, oxidative stress is not a primary mechanism of Ag toxicity; if
ROS are generated they may be dealt with through species specific enzymes which are
currently unknown.
187
It is also possible that the enzymes targeted in Chapter 6 might be involved in the response
to Ag exposure, but that no significant transcriptional change was seen after a 24 h
exposure. It could be that the transcriptional response of these enzymes occurs rapidly and
the altered transcription is missed 24 h after exposure. A time-course would be required to
rule out any transcriptional response from GST & HMOX entirely. Additional enzymes to
investigate would be catalase and SOD using alternative primers. Transcriptomics
analyses give no indication of protein activity and production, only the level of
transcription of their corresponding genes. Quantitative measurement of the presence and
activity of these enzymes would give a more direct indication of their roles in the response
of D. magna to Ag exposure.
It is possible that the significant increase in purine nucleosides observed in Chapter 5 are
not elevated as a result of increased anabolism, but rather decreased catabolism. For
example, many of these metabolites are involved in the production of nucleoside
triphosphates through oxidative phosphorylation, a process which has been seen to be
inhibited by Ag exposure (Li et al., 2015a; Carrola et al., 2015). These purine nucleosides
are all ultimately involved in the synthesis of RNA by RNA polymerase, which is
inhibited directly through the actions of AgNPs (Wang et al., 2013). A disruption of purine
metabolism has also been indicated before in rats (Hadrup et al., 2012) suggesting that this
particular response to Ag exposure may be conserved across multiple species, making it a
potential biomarker for screening in other organisms.
To investigate this mechanism further, a targeted approach by LC-MS could be used to
accurately quantify the production of inosine and guanosine as well as other putative
purine nucleosides which could not be isolated by FT-ICR MS. Coupled with ICP-MS
analysis of the same samples, the production of these metabolites could be correlated with
respect to silver body-burden, thus cementing their role in the MoA of AgNP toxicity. To
188
test the hypothesis that AgNP and AgNO3 exposure does not lead to excessive ROS
production in D. magna, the presence of ROS could be measured directly through use of
fluorescence-based assays as previously used in vitro (Chairuangkitti et al., 2013) and in
D. magna (Ma et al., 2012). This assay would need the use of a comparative positive
control for ROS production such as H2O2 for interpretation of results. The hypothesis
stated by Wang and colleagues (Wang et al., 2013) could be investigated further through
measurement of the expression and activity of RNA polymerase II. Correlation of this
activity over time with the concentration of purine nucleosides measured by LC-MS would
go further to confirming this mechanism of toxicity in D. magna.
7.3 The use of omics-technologies in nanoparticle risk assessment
Due to a relative absence of background knowledge with regards to the molecular changes
they induce, nanomaterials represent an ideal opportunity to utilise the high-throughput,
non-targeted approach of omics technologies for the investigation of mechanisms of
toxicity. This approach allows the capture of the entire molecular response providing a
solid basis of knowledge from which to create hypotheses and direct further testing.
This approach may result in the discovery in molecular perturbations that would go
potentially unnoticed by the traditional hypothesis-driven research. As discussed in
section 1.3.5, there are previous omics investigations into AgNP toxicity which have
discovered significant perturbations that are not traditionally associated with the toxicity of
dissolved Ag. The observations made in this thesis that Ag exposure results in an
accumulation of purine nucleosides that is not likely to be related to oxidative stress is
another example of the power of omics in molecular toxicity investigations. Although the
exact cause of the significant increase in guanosine and inosine requires further
investigation, these two metabolites have been highlighted as potential markers of Ag
189
exposure in D. magna. An ideal biomarker is considered to be a molecule that is
indicative of early toxicant exposure that can be detected in individual organisms and used
to predict population-level effects. A true success story of biomarkers in regulatory
ecotoxicology includes the discovery of vitellogenin as a biomarker of feminisation of
male fish following exposure to oestrogen-like compounds (Jobling et al. 1998).
Understanding of the exact mechanism of inosine and guanosine elevation following Ag
exposure will be required to cement these two metabolites as specific markers of Ag
exposure, as opposed to non-specific markers common to multiple mechanisms of toxicity.
Although useful for mechanistic investigations and the potential identification of
biomarkers, the routine application of omics technologies, as they stand, to environmental
risk assessment of new chemicals is an unlikely prospect. In order for it to become a
reality there are several technological obstacles that need to be surpassed. Firstly, a major
limitation of microarray transcriptomics is that they require a fully sequenced and
annotated genome for effective use in toxicogenomics. For example, the D. magna
microarray used in Chapter 4 only covers just under half of the total D. magna genome;
15,000 genes compared to approximately 31,000 genes (Colbourne et al., 2011). This
means that over half the genome remains unmeasured, which could include genes that alter
significantly and uniquely in expression following toxicant exposure to either AgNP or
AgNO3. Microarray transcriptomics, therefore, are not readily accessible for use with non-
model organisms. This particular limitation could potentially be overcome through the use
of the relatively new technology of RNA sequencing (RNA-seq). This technique converts
extracted RNA into a library of cDNA fragments which are sequenced in a high-
throughput manner (Wang et al 2009). A major advantage to this technique is that it is not
limited to the detection of transcripts that correspond to existing sequenced genomes, and
can therefore be used in non-model organisms.
190
Despite the increased sensitivity of FT-ICR MS compared to other metabolomics
techniques, many important naturally low-level metabolites may go undetected due to the
relatively low available biomass obtained from D. magna neonates. These limitations,
though unavoidable, mean that the possibility of an independant AgNP-toxicity
mechanism cannot be entirely ruled out, though from the data presented in Chapter 4 and
the literature discussed above (section 1.2.3) the observations made in this thesis support
the Trojan-horse mechanism. Untargeted, direct infusion FT-ICR metabolomics allows for
the detection of 1000’s of metabolites from biological samples. However, the major
limitation of this and all available metabolomics technologies is the subsequent
identification of these metabolites which remains a labour-intensive step (Dunn et al.,
2012). For example, there are a number of biological metabolites which have the same
molecular mass and potentially the same empirical formulae. Currently it is difficult to
discriminate between metabolites, making biological interpretation of some metabolic
profiles difficult. There have been developments in the automatic annotation of detected
metabolites in recent years (Weber and Viant, 2010; Xia et al., 2012) though there is still a
lack of metabolite information present in online libraries available for automated searches
(Dunn et al., 2012).
Despite the limitations in the available technologies, the high throughput analytical
methods present an opportunity in obtaining large quantities of toxicology data with
relatively low input. They also, as has been demonstrated in this thesis, can provide
unique insights into mechanisms of toxicity.
191
7.4 Concluding remarks
The data collected in this thesis suggests that although ultimately AgNP toxicity towards
D. magna is most likely induced by released Ag ions, there is a potential “nanostructure-
dependant biological activity” (Oberdörster et al., 2005a) relating to the Trojan-horse
mechanism. In a regulatory context this data could potentially be used in the argument for
separate regulatory framework for AgNPs. Ultimately however, it is suggested from this
work that the mechanisms of AgNP and AgNO3 toxicity are unlikely to be so different to
warrant different levels of regulation.
192
Chapter 8: References
Ackermann, M. and Strimmer, K. (2009) A general modular framework for gene set
enrichment analysis. BMC bioinformatics, 10: 47–66
Adam, N., Schmitt, C., Galceran, J., Companys, E., Vakurov, A., Wallace, R., Knapen, D.,
Blust, R. (2014) The chronic toxicity of ZnO nanoparticles and ZnCl2 to Daphnia magna
and the use of different methods to assess nanoparticle aggregation and dissolution.
Nanotoxicology, 8 (7): 709–17
Adams, N. and Kramer, J. (1998) Reactivity of Ag+ ion with thiol ligands in the presence
of iron sulfide. Environmental Toxicology and Chemistry, 17 (4): 625–629
Aerle, R., Lange, A., Moorhouse, A., Paszkiewicz, K., Ball, K., Johnston, B., de-Bastos,
E., Booth, T., Tyler, C., Santos, E. (2013) Molecular mechanisms of toxicity of silver
nanoparticles in zebrafish embryos. Environmental Science & Technology, 47: 8005–8014
Ahn, J.-M., Eom, H.-J., Yang, X., Meyer, J., Choi, J. (2014) Comparative toxicity of silver
nanoparticles on oxidative stress and DNA damage in the nematode, Caenorhabditis
elegans. Chemosphere, 108: 343–52
Allen, H., Impellitteri, C., Macke, D., Heckman, D., Poynton, H., Lazorchak, J.,
Govindaswamy, S., Roose, D., Nadagouda, M. (2010) Effects from filtration, capping
agents, and presence/absence of food on the toxicity of silver nanoparticles to Daphnia
magna. Environmental Toxicology and Chemistry, 29 (12): 2742–50
Allwood, J. and Goodacre, R. (2010) An introduction to liquid chromatography-mass
spectrometry instrumentation applied in plant metabolomic analyses. Phytochemical
Analysis : PCA, 21 (1): 33–47
193
Almofti, M., Ichikawa, T., Yamashita, K., Terada, H., Shinohara, Y. (2003) Silver ion
induces a cyclosporine A-insensitive permeability transition in rat liver mitochondria and
release of apoptogenic cytochrome c. Journal of Biochemistry, 134 (1): 43–49
Altshuler, I., Demiri, B., Xu, S., Constantin, A., Yan, N., Cristescu, M. (2011) An
integrated multi-disciplinary approach for studying multiple stressors in freshwater
ecosystems: Daphnia as a model organism. Integrative and Comparative Biology, 51 (4):
623–33
Antczak, P., Jo, H., Woo, S., Scanlan, L., Poynton, H., Loguinov, A., Chan, S., Falciani,
F., Vulpe, C. (2013) Molecular toxicity identification evaluation (mTIE) approach predicts
chemical exposure in Daphnia magna. Environmental Science and Technology, 47 (20):
11747–11756
Arai, Y., Miyayama, T. and Hirano, S. (2015) Difference in the toxicity mechanism
between ion and nanoparticle forms of silver in the mouse lung and in macrophages.
Toxicology, 328: 84–92
Arakawa, H., Neault, J. and Tajmir-Riahi, H. (2001) Silver(I) complexes with DNA and
RNA studied by Fourier transform infrared spectroscopy and capillary electrophoresis.
Biophysical Journal, 81 (3): 1580–1587
Arora, S., Jain, J., Rajwade, J., Paknikar, K. (2009) Interactions of silver nanoparticles
with primary mouse fibroblasts and liver cells. Toxicology and Applied Pharmacology,
236 (3): 310–8
Asghari, S., Johari, S., Lee, J., Kim, Y., Jeon, Y., Choi, H., Moon, M., Yu, I. (2012)
Toxicity of various silver nanoparticles compared to silver ions in Daphnia magna.
Journal of Nanobiotechnology, 10: 14
194
Asharani, P, Hande, M., and Valiyaveettil, S. (2009a) Anti-proliferative activity of silver
nanoparticles. BMC Cell Biology, 10: 65
Asharani, P. V, Mun, G., Hande, M., Valiyaveettil, S. (2009b) Cytotoxicity and
Genotoxicity of Silver., ACS Nano, 3 (2): 279–290
Audinot, J., Georgantzopoulou, A., Piret, J., Gutleb, A., Dowsett, D., Migeon, H.,
Hoffmann, L. (2013) Identification and localization of nanoparticles in tissues by mass
spectrometry. Surface and Interface Analysis, 45 (1): 230–233
Baalousha, M. and Lead, J. (2012) Rationalizing nanomaterial sizes measured by atomic
force microscopy, flow field-flow fractionation, and dynamic light scattering: sample
preparation, polydispersity, and particle structure. Environmental Science & Technology,
46 (11): 6134–6142
Badawy, A., Luxton, T., Silva, R., Scheckel, K., Suidan, M., Tolaymat, T. (2010) Impact
of environmental conditions (pH, ionic strength, and electrolyte type) on the surface
charge and aggregation of silver nanoparticles suspensions. Environmental Science &
Technology, 44 (4): 1260–1266
Behra, R., Sigg, L., Clift, M., Herzog, F., Minghetti, M., Johnston, B., Petri-Fink, A.
Rothen-Rutishauser, B. (2013) Bioavailability of silver nanoparticles and ions: from a
chemical and biochemical perspective. Journal of The Royal Society Interface, 10(87),.
Bekyarova, E., Fornasiero, P., Kaspar, J., Graziani, M. (1998) CO oxidation on Pd/CeO2-
ZrO2 Catalysis Today., 45: 179–183
Benjamini, Y. and Hochberg, Y. (1995) Controlling the false discovery rate: a practical
and powerful approach to multiple testing. Journal of the Royal Statistical Society. Series
B 57 (1): 289–300
195
Benn, T. and Westerhoff, P. (2008) Nanoparticle Silver Released into Water from
Commercially Available Sock Fabrics. Environmental Science & Technology, 42 (11):
4133–4139
Bhabra, G., Sood, A., Fisher, B., Cartwright, L., Saunders, M., Evans, W., Surprenant, A.,
Lopez-Castejon, G., Mann, S., Davis, S., Hails, L., Ingham, E., Verkade, P., Lane, J.,
Heesom, K., Newson, R., Case, C.(2009) Nanoparticles can cause DNA damage across a
cellular barrier. Nature Nanotechnology, 4 (12): 876–83
Bianchini, A. and Wood, C. (2003) Mechanism of acute silver toxicity in Daphnia magna.
Environmental Toxicology and Chemistry, 22 (6): 1361–1367
Bianchini, A. and Wood, C. (2008) Does sulfide or water hardness protect against chronic
silver toxicity in Daphnia magna? A critical assessment of the acute-to-chronic toxicity
ratio for silver. Ecotoxicology and Environmental Safety, 71 (1): 32–40
Bleeker, E., Jong, W., Geertsma, R., Groenewold, E., Heugens, E., Koer-Jacquemijns, M.,
Meent, D., Popma, J., Rietveld, A., Wijnhoven, S., Cassee, F., Oomen, A. (2013)
Considerations on the EU definition of a nanomaterial: science to support policy making.
Regulatory Toxicology and Pharmacology : RTP, 65 (1): 119–25
Bouhifd, M., Hartung, T., Hogberg, H., Kleensang, A., Zhao, L. (2013) Review:
toxicometabolomics. Journal of Applied Toxicology, 33 (12): 1365–83
Boveris, A. and Chance, B. (1973) The mitochondrial generation of hydrogen peroxide.
General properties and effect of hyperbaric oxygen. The Biochemical Journal, 134 (3):
707–16
196
Bradford, A., Handy, R., Readman, J., Atfield, A., Muhling, M. (2009) Impact of silver
nanoparticle contamination on the genetic diversity of natural bacterial assemblages in
estuarine sediments. Environmental Science and Technology, 43 (12): 4530–4536
Bragg, P. and Rainnie, D. (1974) The effect of silver ions on the respiratory chain of
Escherichia coli. Canadian Journal of Microbiology, 20 (6): 883–9
British Standards Institution (2007) Terminology for nanomaterials. PAS 136:2007. Text,
p. 16
Bruins, A. (1998) Mechanistic aspects of electrospray ionization. Journal of
Chromatography A, 794 (1-2): 345–357
Bunescu, A., Garric, J., Vollat, B., Canet-Soulas, E., Graveron-Demilly, D., Fauvelle, F.
(2010) In vivo proton HR-MAS NMR metabolic profile of the freshwater cladoceran
Daphnia magna. Molecular bioSystems, 6 (1): 121–5
Bury, N. and Wood, C., 1999. Mechanism of branchial apical silver uptake by rainbow
trout is via the proton-coupled Na+ channel. American Journal of Physiology-Regulatory,
Integrative and Comparative Physiology,277(5), pp.R1385-R1391.
Campian, J., Qian, M., Gao, X., Eaton, J. (2004) Oxygen tolerance and coupling of
mitochondrial electron transport. Journal of Biological Chemistry, 279 (45): 46580–46587
Campos, B., Garcia-Reyero, N., Rivetti, C., Escalon, L., Habib, T., Tauler, R., Tsakovski,
S., Pina, B., Barata, C. (2013) Identification of metabolic pathways in Daphnia magna
explaining hormetic effects of selective serotonin reuptake inhibitors and 4-nonylphenol
using transcriptomic and phenotypic responses. Environmental Science & Technology, 47
(16): 9434–43
197
Carrola, J., Bastos, V., Ferreira de Oliveira, J. , Oliveira, H., Santos, C., Gil, A., Duarte, I.
(2015) Insights into the impact of silver nanoparticles on human keratinocytes metabolism
through NMR metabolomics. Archives of Biochemistry and Biophysics, pp. 1–9
Cavill, R., Kamburov, A., Ellis, J., Athersuch, T., Blagrove, M., Herwig, R., Ebbels, T.,
Keun, H. (2011) Consensus-phenotype integration of transcriptomic and metabolomic data
implies a role for metabolism in the chemosensitivity of tumour cells. PLoS
Computational Biology, 7 (3): e1001113
Chae, Y., Pham, C., Lee, J., Bae, E., Yi, J., Gu, M. (2009) Evaluation of the toxic impact
of silver nanoparticles on Japanese medaka (Oryzias latipes). Aquatic Toxicology, 94 (4):
320–7
Chairuangkitti, P., Lawanprasert, S., Roytrakul, S., Aueviriyavit, S., Phummiratch, D.,
Kulthong, K., Chanvorachote, P., Maniratanachote, R. (2013) Silver nanoparticles induce
toxicity in A549 cells via ROS-dependent and ROS-independent pathways. Toxicology in
Vitro, 27 (1): 330–8
Chaloupka, K., Malam, Y. and Seifalian, A. (2010) Nanosilver as a new generation of
nanoproduct in biomedical applications. Trends in Biotechnology, 28 (11): 580–588
Chambers, C., Proctor, C. and Kabler, P. (1962) Bactericidal effect of low concentrations
of silver. American Water Works Association, 54 (2): 208–216
Chaudhry, Q., Scotter, M., Blackburn, J., Ross, B., Boxall, A., Castle, L., Aitken, R.,
Watkins, R. (2008) Applications and implications of nanotechnologies for the food sector.
Food Additives & Contaminants. 25 (3): 241–58
Chen, X. and Schluesener, H. (2008) Nanosilver: A nanoproduct in medical application.
Toxicology Letters, 176 (1): 1–12
198
Chladek, G., Mertas, A., Barszczewska-Rybarek, I., Nalewajek, T., Zmudzki, J., Krol, W.,
Lukaszczyk, J. (2011) Antifungal activity of denture soft lining material modified by silver
nanoparticles-a pilot study. International Journal of Molecular Sciences, 12 (7): 4735–44
Choi, O. and Hu, Z. (2008) Size dependent and reactive oxygen species related nanosilver
toxicity to nitrifying bacteria. Environmental Science & Technology, 42 (12): 4583–4588
Christian, P., Von der Kammer, F., Baalousha, M.,Hofmann, T. (2008) Nanoparticles:
structure, properties, preparation and behaviour in environmental media. Ecotoxicology, 17
(5): 326–43
Cipriani, S., Bakshi, R. and Schwarzschild, M. (2014) Protection by inosine in a cellular
model of Parkinson’s disease. Neuroscience, 274: 242–9
Colbourne, J., Pfrender, M. and Gilbert, D. (2011) The ecoresponsive genome of Daphnia
pulex. Science, 331 (6017): 555–561
Colbourne, J., Singan, V.. and Gilbert, D. (2005) wFleaBase: the Daphnia genome
database. BMC Bioinformatics, 6 (1): 45
Comfort, K., Maurer, E. and Hussain, S. (2014) Slow release of ions from internalized
silver nanoparticles modifies the epidermal growth factor signalling response. Colloids and
Surfaces B: Biointerfaces, 123: 136–142
Comisarow, M. and Melka, J. (1979) Error estimates for finite zero-filling in Fourier
transform spectrometry. Analytical Chemistry, 51 (13): 2198–2203
Cortese-Krott, M., Münchow, M., Pirev, E., Heßner, F., Bozkut, A., Uciechowski, P.,
Pallua, N., Kroncke, K., Suschek, C. (2009) Silver ions induce oxidative stress and
199
intracellular zinc release in human skin fibroblasts. Free Radical Biology and Medicine, 47
(11): 1570–7
Couvreur, P. (2013) Nanoparticles in drug delivery: past, present and future. Advanced
Drug Delivery Reviews, 65 (1): 21–3
Dal-Cim, T., Molz, S., Egea, J., Parada, E., Romero, A., Budni, J., Martin de Saavedra, M.,
Barrio, L., Tasca, C., López, M. (2012) Guanosine protects human neuroblastoma SH-
SY5Y cells against mitochondrial oxidative stress by inducing heme oxigenase-1 via
PI3K/Akt/GSK-3β pathway. Neurochemistry International, 61 (3): 397–404
David, R., Dakic, V., Williams, T., Winter, M., Chipman, J. (2011) Transcriptional
responses in neonate and adult Daphnia magna in relation to relative susceptibility to
genotoxicants. Aquatic Toxicology, 104 (3-4): 192–204
Dettmer, K., Aronov, P. and Hammock, B. (2007) Mass spectrometry-based
metabolomics. Mass Spectrometry Reviews, 26 (1): 51–78
Dieterle, F., Ross, A., Schlotterbeck, G., Senn, H. (2006) Probabilistic quotient
normalization as robust method to account for dilution of complex biological mixtures.
Application in 1H NMR metabonomics. Analytical Chemistry, 78 (13): 4281–90
Domingos, R., Baalousha, M., Ju-Nam, Y., Reid, M., Tufenkji, N., Lead, J., Leppard, G.,
Wilkinson, K. (2009) Characterizing manufactured nanoparticles in the environment:
multimethod determination of particle sizes. Environmental Science & Technology, 43
(19): 7277–7284
Donaldson, K., Stone, V., Tran, C., Kreyling, W., Borm, P. (2004) Nanotoxicology.
Occupational and Environmental Medicine, 61 (9): 727–8
200
Dunn, W., Erban, A., Weber, R., Creek, D., Brown, M., Breitling, R., Hankemeier, T.,
Goodacre, R., Neumann, S., Kopka, J., Viant, M. (2012) Mass appeal: metabolite
identification in mass spectrometry-focused untargeted metabolomics. Metabolomics, 9
(S1): 44–66
Ebert, D. (2005) Ecology, epidemiology and evolution of parasitism in Daphnia. Bethesda
(MD): National Center for Biotechnology Information
Elliott, M. and Trewyn, R. (1984) Inosine biosynthesis in transfer RNA by an enzymatic
insertion of hypoxanthine. The Journal of Biological Chemistry, 259 (4): 2407–10
Erickson, R., Brooke, L., Kahl, M.., Venter, F., Harting, S., Markee, T., Spehar, R. (1998)
Effects of laboratory test conditions on the toxicity of silver to aquatic organisms.
Enviromental Toxicology and Chemistry, 17 (4): 572–578
EU, (2011). Commission recommendation of 18 October 2011 on the definition of
nanomaterial (2011/696/EU). Official Journal of the European Union, L 275, 38–40.
Fabrega, J., Luoma, S., Tyler, C., Galloway, T., Lead, J. (2011) Silver nanoparticles:
behaviour and effects in the aquatic environment. Environment International, 37 (2): 517–
531
Ferguson, E., Leach, D. and Hogstrand, C. (1996) August. Metallothionein protects against
silver blockage of the Na+/K+-ATPase. Proceedings of the fourth International
Conference, Transport, Fate and Effects of Silver in the Environment (pp. 191-200).
Madison, WI: University of Wisconsin-Madison.
Fiehn, O. (2002) Metabolomics--the link between genotypes and phenotypes. Plant
Molecular Biology, 48 (1-2): 155–71
201
Finkel, T. and Holbrook, N. (2000) Oxidants, oxidative stress and the biology of ageing.
Nature, 408 (6809): 239–247
Flicek, P., Amode, M., Barrell, D., Beal, K., Billis, K., Brent, S., Varvalho-Silva, D.,
Clapham, P., Coates, G., Fitzgerald, S., Gil, L., Giron, C., Gordon, L., Hourlier, T., Hunt,
S., Johnson, N., Juettemann, T., Kahari, A., Keenan, S., Kulesha, E., Martin, F., Maurel,
T., McLaren, W., Murphy, D., Nag, R., Overduin, B., Pignatelli, M., Pritchard, B.,
Pritchard, E., Riat, H., Ruffier, M., Sheppard, D., Taylor, K., Thormann, A., Trevanion, S.,
Vullo, A., Wilder, S., Wilson, M., Zadissa, A., Aken, B., Birney, E., Cunningham, F.,
Harrow, J., Herrero, J., Hubbard, T., Kinsella, R., Muffato, M., Parker, A., Spudich, G.,
Yates, A., Zerbino, D., Searle, S. (2014) Ensembl 2014. Nucleic Acids Research, 42
(Database issue): D749–55
Fu, P., Xia, Q., Hwang, H.-M., Ray, P., Yu, H. (2014) Mechanisms of nanotoxicity:
generation of reactive oxygen species. Journal of Food and Drug Analysis, 22 (1): 64–75
Gaiser, B., Biswas, A., Rosenkranz, P., Jepson, M., Lead, J., Stone, V., Tyler, C.,
Fernandes, T. (2011) Effects of silver and cerium dioxide micro-and nano-sized particles
on Daphnia magna. Journal of Environmental Monitoring, 13 (5): 1227–1235
García-Alonso, J., Khan, F., Misra, S., Turmaine, M., Smith, B., Rainbow, P., Luoma, S.,
Valsami-Jones, E. (2011) Cellular internalization of silver nanoparticles in gut epithelia of
the estuarine polychaete Nereis diversicolor. Environmental Science & Technology, 45
(10): 4630–6
Garcia-Reyero, N., Poynton, H., Kennedy, A., Guan, X., Escalon, B., Chang, B.,
Varshavsky, J., Loguinov, A., Vulpe, C., Perkins, E. (2009) Biomarker discovery and
202
transcriptomic responses in Daphnia magna exposed to munitions constituents.
Environmental Science & Technology, 43 (11): 4188–93
Geiser, M., Rothen-Rutishauser, B., Kapp, N., Schurch, S., Kreyling, W., Schulz, H.,
Semmler, M., Hof, V., Heyder, J., Gehr, P. (2005) Ultrafine particles cross cellular
membranes by nonphagocytic mechanisms in lungs and in cultured cells. Environmental
Health Perspectives, 113 (11): 1555–1560
Geranio, L., Heuberger, M. and Nowack, B. (2009) The behavior of silver nanotextiles
during washing. Environmental Science & Technology, 43 (21): 8113–8118
Gottschalk, F., Sun, T. and Nowack, B. (2013) Environmental concentrations of
engineered nanomaterials: Review of modelling and analytical studies. Environmental
Pollution, 181: 287–300
Götz, S., García-Gómez, J.., Terol, J., Williams, T., Nagaraj, S., Nueda, M., Robles, M.,
Talon, M., Dopazo, J., Conesa, A. (2008) High-throughput functional annotation and data
mining with the Blast2GO suite. Nucleic Acids Research, 36 (10): 3420–35
Greulich, C., Diendorf, J., Simon, T., Eggeler, G., Epple, M., Koller, M. (2011) Uptake
and intracellular distribution of silver nanoparticles in human mesenchymal stem cells.
Acta Biomaterialia, 7 (1): 347–354
Groh, K., Dalkvist, T., Piccapietra, F., Behra, R., Suter, M., Schirmer, K. (2014) Critical
influence of chloride ions on silver ion-mediated acute toxicity of silver nanoparticles to
zebrafish embryos. Nanotoxicology, 5390: 1–11
Gudkov, S. , Shtarkman, I., Smirnova, V., Chernikov, A., Bruskov, V. (2006) Guanosine
and inosine as natural antioxidants and radioprotectors for mice exposed to lethal doses of
γ-radiation. Biochemistry, Biophysics, and Molecular Biology 407 (1): 47–50
203
De Gusseme, B., Hennebel, T., Christiaens, E., Saveyn, H., Verbeken, K., Fitts, J., Boon,
N., Verstraete, W. (2011) Virus disinfection in water by biogenic silver immobilized in
polyvinylidene fluoride membranes. Water Research, 45 (4): 1856–64
Hadrup, N., Lam, H., Loeschner, K., Mortensen, A., Larsen, E., Frandsen, H. (2012)
Nanoparticulate silver increases uric acid and allantoin excretion in rats, as identified by
metabolomics. Journal of Applied Toxicology, 32 (11): 929–33
He, D., Jones, A., Garg, S., Pham, N., Waite, T. (2011) Silver nanoparticle− reactive
oxygen species interactions: application of a charging− discharging model. The Journal of
Physical Chemistry C, 115: 5461–5468
Heckmann, L.-H., Sibly, R., Connon, R., Hooper, H., Hutchinson, T., Maund, S., Hill, C.,
Bouetard, A., Callaghan, A. (2008) Systems biology meets stress ecology: linking
molecular and organismal stress responses in Daphnia magna. Genome Biology, 9 (2):
R40
Hogstrand, C. and Wood, C. (1998) Toward a better understanding of the bioavailability,
physiology, and toxicity of silver in fish: Implications for water quality criteria.
Environmental Toxicology and Chemistry, 17 (4): 547–561
Hoheisel, S., Diamond, S. and Mount, D. (2012) Comparison of nanosilver and ionic silver
toxicity in Daphnia magna and Pimephales promelas. Environmental Toxicology and
Chemistry, 31 (11): 2557–63
Horbach, G., Van Den Brule, S., Magkoufopoulou, C., Vietti, G., Papoutsi, D., Leyns, L.,
Kirsch-Volders, M. (2014) The safety of nanomaterials: translation from academic
research to industrial and regulatory applications. Journal of Translational Toxicology, 1
(1): 40–45

204
Hrydziuszko, O. and Viant, M. (2011) Missing values in mass spectrometry based
metabolomics: an undervalued step in the data processing pipeline. Metabolomics, 8 (S1):
161–174
Hsiao, I.-L., Hsieh, Y.-K., Wang, C.-F., Chen, I.-C., Huang, Y.-J.. (2015) Trojan-horse
mechanism in the cellular uptake of silver nanoparticles verified by direct intra- and
extracellular silver speciation analysis. Enviromental Science and Technology, 49 (6):
3813–21
Huang, D., Sherman, B. and Lempicki, R. (2009) Systematic and integrative analysis of
large gene lists using DAVID bioinformatics resources. Nature Protocols, 4: 44–57
Hwang, E., Lee, J., Chae, Y., Kim, Y., Kim, B., Sang, B.-I., Gu, M. (2008) Analysis of the
toxic mode of action of silver nanoparticles using stress-specific bioluminescent bacteria.
Small, 4 (6): 746–750
ISO, Nanotechnologies – Terminology and definitions for nano-objects – Nanoparticle,
nanofibre and nanoplate. International Organisation for Standardisation (ISO), Genève,
Switserland, 2008.
Jiang, J., Oberdörster, G. and Biswas, P. (2008) Characterization of size, surface charge,
and agglomeration state of nanoparticle dispersions for toxicological studies. Journal of
Nanoparticle Research, 11 (1): 77–89
Johari, S., Kalbassi, M., Lee, S., Dong, M., Yu, I. (2015) Silver nanoparticles affects the
expression of biomarker genes mRNA in rainbow trout (Oncorhynchus mykiss).
Comparative Clinical Pathology
Johnson, A., Bowes, M., Crossley, A., Jarvie, H., Jurkschat, K., Jurgens, M., Lawlor, A.,
Park, B., Rowland, P., Spurgeon, D., Svensden, C., Thompson, I., Barnes, R., Williams,
205
R., Xu, N. (2011) An assessment of the fate, behaviour and environmental risk associated
with sunscreen TiO₂ nanoparticles in UK field scenarios. Science of the Total
Environment, 409 (13): 2503–10
Jomova, K. and Valko, M. (2011) Advances in metal-induced oxidative stress and human
disease. Toxicology, 283 (2-3): 65–87
Jung, W., Koo, H., Kim, K., Shin, S., Kim, S., Park, Y. (2008) Antibacterial activity and
mechanism of action of the silver ion in Staphylococcus aureus and Escherichia coli.
Applied and Environmental Microbiology, 74 (7): 2171–2178
Jurkowitz, M., Litsky, M., Browning, M., Hohl, C. (1998) Adenosine, inosine, and
guanosine protect glial cells during glucose deprivation and mitochondrial inhibition:
correlation between protection and ATP preservation. Journal of Neurochemistry, 71 (2):
535–48
Kaegi, R., Sinnet, B., Zuleeg, S., Hagendorfer, H., Mueller, E., Vonbank, R., Boller, M.,
Burkhardt, M. (2010) Release of silver nanoparticles from outdoor facades. Environmental
Pollution, 158 (9): 2900–2905
Kamburov, A., Cavill, R., Ebbels, T., Herwig, R., Keun, H. (2011) Integrated pathway-
level analysis of transcriptomics and metabolomics data with IMPaLA. Bioinformatics, 27
(20): 2917–8
Keating, K. and Dagbusan, B. (1984) Effect of selenium deficiency on cuticle integrity in
the Cladocera (Crustacea). Proceedings of the National Academy of Sciences of the United
States of America, 81 (11): 3433–7
206
Kennedy, A., Hull, M., Bednar, A., Goss, J., Gunter, J., Bouldin, J., Vikesland, P.,
Steevens, J. (2010) Fractionating nanosilver: importance for determining toxicity to
aquatic test organisms. Environmental Science & Technology, 44 (24): 9571–9577
Keun, H. (2006) Metabonomic modeling of drug toxicity. Pharmacology & Therapeutics,
109 (1-2): 92–106
Khan, F., Kennaway, G., Croteau, M.-N., Dybowska, A., Smith, B., Nogueira, A.,
Rainbow, P., Luoma, S., Valsami-Jones, E. (2014) In vivo retention of ingested Au NPs by
Daphnia magna: no evidence for trans-epithelial alimentary uptake. Chemosphere, 100:
97–104
Khan, F., Paul, K., Dybowska, A., Valsami-Jones, E., Lead, J., Stone, V., Fernandes, T.
(2015) Accumulation dynamics and acute toxicity of silver nanoparticles to Daphnia
magna and Lumbriculus variegatus: Implications for metal modelling approaches.
Environmental Science & Technology, pp. 4389–4397
Khatri, P., Sirota, M. and Butte, A. (2012) Ten years of pathway analysis: current
approaches and outstanding challenges. PLoS Computational Biology, 8 (2): e1002375
Kim, J., Kim, S. and Lee, S. (2011) Differentiation of the toxicities of silver nanoparticles
and silver ions to the Japanese medaka (Oryzias latipes) and the cladoceran Daphnia
magna. Nanotoxicology, 5 (2): 208–14
Kind, T. and Fiehn, O. (2006) Metabolomic database annotations via query of elemental
compositions: mass accuracy is insufficient even at less than 1 ppm. BMC Bioinformatics,
7: 234
207
Kirwan, J., Weber, R., Broadhurst, D., Viant, M. (2014) Direct infusion mass spectrometry
metabolomics dataset: a benchmark for data processing and quality control. Scientific
Data, 1: 1–13
Kreyling, W., Semmler-Behnke, M. and Chaudhry, Q. (2010) A complementary definition
of nanomaterial. Nano Today, 5 (3): 165–168
Lampert, W. (2011) Daphnia: Development of a Model Organism in Ecology and
Evolution.
Le, T.-H., Lim, E.-S., Hong, N.-H., Lee, S.-K., Shim, Y., Hwang, J., Kim, Y.-H., Min, J.
(2013) Proteomic analysis in Daphnia magna exposed to As(III), As(V) and Cd heavy
metals and their binary mixtures for screening potential biomarkers. Chemosphere, 93
(10): 2341–8
Leblanc, G., Mastone, J., Paradice, A., Wilson, B., Haines Jr, B. Robillard, K., (1984). The
influence of speciation on the toxicity of silver to fathead minnow (Pimephales
promelas). Environmental Toxicology and Chemistry, 3(1), pp.37-46.
Lenz, E. and Wilson, I. (2007) Analytical strategies in metabonomics. Journal of Proteome
Research, 6 (2): 443–58
Li, H., Yan, Z., Zhu, J., Yang, J., He, J. (2011) Neuroprotective effects of resveratrol on
ischemic injury mediated by improving brain energy metabolism and alleviating oxidative
stress in rats. Neuropharmacology, 60 (2-3): 252–8
Li, L., Wu, H., Ji, C., Gestel, C., Allen, H., Peijnenburg, W. (2015a) A metabolomic study
on the responses of Daphnia magna exposed to silver nitrate and coated silver
nanoparticles. Ecotoxicology and Environmental Safety, 119: 66–73
208
Li, L., Wu, H., Peijnenburg, W., Gestel, C. (2015b) Both released silver ions and
particulate Ag contribute to the toxicity of AgNPs to earthworm Eisenia fetida.
Nanotoxicology, 9 (6): 792–801
Liau, S., Read, D., Pugh, W., Furr, J., Russell, A. (1997) Interaction of silver nitrate with
readily identifiable groups: relationship to the antibacterial action of silver ions. Letters in
Applied Microbiology, 25 (4): 279–83
Liochev, S. and Fridovich, I. (2000) Copper- and zinc-containing superoxide dismutase
can act as a superoxide reductase and a superoxide oxidase. The Journal of Biological
Chemistry, 275 (49): 38482–5
Lok, C.-N., Ho, C.-M., Chen, R., He, Q.-Y., Yu, W.-Y., Sun, H., Kwong-Hang, P., Chiu,
J.-F., Che, C.-M. (2007) Silver nanoparticles: partial oxidation and antibacterial activities.
Journal of Biological Inorganic Chemistry, 12 (4): 527–34
Lubick, N. (2008) Nanosilver toxicity: ions, nanoparticlessor both. Environmental Science
& Technology, 42 (23): 8959–8964
Luoma, S. (2008) Silver nanotechnologies and the environment. The Project on Emerging
Nanotechnologies Report, (15)
Ma, H., Brennan, A. and Diamond, S. (2012) Photocatalytic reactive oxygen species
production and phototoxicity of titanium dioxide nanoparticles are dependent on the solar
ultraviolet radiation spectrum. Environmental Toxicology and Chemistry, 31 (9): 2099–
107
Malvern Instruments Ltd (2011) Inform white paper dynamic light scattering. Malvern
Guides, pp. 1–6
209
Martins, J., Oliva Teles, L. and Vasconcelos, V. (2007) Assays with Daphnia magna and
Danio rerio as alert systems in aquatic toxicology. Environment International, 33 (3):
414–25
De Matteis, V., Malvindi, M., Galeone, A., Brunetti, V., Luca, E., Kote, S., Kshirsagar, P.,
Sabella, S., Bardi, G., Pompa, P. (2015) Negligible particle-specific toxicity mechanism of
silver nanoparticles: The role of Ag+ ion release in the cytosol. Nanomedicine:
Nanotechnology, Biology and Medicine, 11 (3): 731–739
McQuillan, J. and Shaw, A.. (2014) Differential gene regulation in the Ag nanoparticle and
Ag+-induced silver stress response in Escherichia coli: A full transcriptomic profile.
Nanotoxicology, 5390 (I): 1–8
Meyer, J., Lord, C., Yang, X., Turner, E., Badireddy, A., Marinakos, S., Chilkoti, A.,
Wiesner, M., Auffan, M. (2010) Intracellular uptake and associated toxicity of silver
nanoparticles in Caenorhabditis elegans. Aquatic Toxicology, 100 (2): 140–50
Mijnendonckx, K., Leys, N., Mahillon, J., Silver, S., Houdt, R. (2013) Antimicrobial
silver: uses, toxicity and potential for resistance. Biometals, 26 (4): 609–21
Módis, K., Gero, D., Nagy, N., Szoleczky, P., Toth, Z., Szabo, C. (2009) Cytoprotective
effects of adenosine and inosine in an in vitro model of acute tubular necrosis. British
Journal of Pharmacology, 158 (6): 1565–78
Moore, M. (2006) Do nanoparticles present ecotoxicological risks for the health of the
aquatic environment? Environment International, 32 (8): 967–76
Morgan, I., Henryb, P. and Wood, C. (1997) The mechanism of acute silver nitrate toxicity
in freshwater rainbow trout (Oncorhynchus mykiss) is inhibition of gill Na+ and Cl-
transport. Aquatic Toxicology, 38: 145–163
210
Mueller, N. and Nowack, B. (2008) Exposure modeling of engineered nanoparticles in the
environment. Environmental Science & Technology, 42 (12): 4447–53
Nagato, E., D’eon, J., Lankadurai, B., Poirier, D., Reiner, E., Simpson, A., Simpson, M.
(2013) 1H NMR-based metabolomics investigation of Daphnia magna responses to sub-
lethal exposure to arsenic, copper and lithium. Chemosphere, 93 (2): 331–7
Nam, H., Kwon, S., Chung, H., Lee, S.-Y., Kwon, S.-H., Jeon, H., Kim, Y., Park, J., Kim,
J., Her, S., Oh, Y.-K., Kwon, I., Kim, K., Jeong, S. (2009) Cellular uptake mechanism and
intracellular fate of hydrophobically modified glycol chitosan nanoparticles. Journal of
Controlled Release, 135 (3): 259–267
Newton, K., Puppala, H., Kitchens, C., Colvin, V., Klaine, S. (2013) Silver nanoparticle
toxicity to Daphnia magna is a function of dissolved silver concentration. Environmental
Toxicology and Chemistry, 32 (10): 2356–64
Nguyen, D., Arpat, B., Wang, N., Carroll, R. (2002) DNA microarray experiments:
biological and technological aspects. Biometrics, 58 (4): 701–17
Notter, D. a., Mitrano, D. and Nowack, B. (2014) Are nanosized or dissolved metals more
toxic in the environment? A meta-analysis. Environmental Toxicology and Chemistry, 33
(12): 2733–2739
Nowack, B., Krug, H. and Height, M. (2011) 120 Years of nanosilver history: Implications
for policy makers. Environmental Science & Technology, 45 (4): 1177–83
Nuwaysir, E., Bittner, M., Trent, J., Barret, C., Afshari, C. (1999) Microarrays and
toxicology: the advent of toxicogenomics. Molecular Carcinogenesis, 24 (3): 153–9
211
Oberdörster, G., Maynard, A., Donaldson, K., Castranova, V., Fitzpatrick, J., Ausman, K.,
Carter, J., Karn, B., Kreyling, W., Lai, D., Olin, S., Monterio-Riviere, N., Warheit, D.,
Yang, H. (2005a) Principles for characterizing the potential human health effects from
exposure to nanomaterials: elements of a screening strategy. Particle and Fibre
Toxicology, 2 (1): 8
Oberdörster, G., Oberdörster, E. and Oberdörster, J. (2005b) Nanotoxicology: an emerging
discipline evolving from studies of ultrafine particles. Environmental Health Perspectives,
113 (7): 823–839
OECD (2004), Test No. 202: Daphnia sp. Acute Immobilisation Test, OECD Guidelines
for the Testing of Chemicals, Section 2, OECD Publishing, Paris.
Otte, K., Fröhlich, T., Arnold, G., Laforsch, C. (2014) Proteomic analysis of Daphnia
magna hints at molecular pathways involved in defensive plastic responses. BMC
Genomics, 15: 306
Park, E.-J., Yi, J., Kim, Y., Choi, K., Park, K. (2010) Silver nanoparticles induce
cytotoxicity by a Trojan-horse type mechanism. Toxicology in Vitro, 24 (3): 872–8
Park, H.-J., Kim, J., Kim, J., Lee, J.-H., Hahn, J.-S., Gu, M., Yoon, J. (2009) Silver-ion-
mediated reactive oxygen species generation affecting bactericidal activity. Water
Research, 43 (4): 1027–1032
Parkin, I. and Palgrave, R. (2005) Self-cleaning coatings. Journal of Materials Chemistry,
15 (17): 1689
Parsons, H., Ekman, D., Collette, T., Viant, M. (2009) Spectral relative standard deviation:
a practical benchmark in metabolomics. The Analyst, 134 (3): 478–85
212
Parsons, H., Ludwig, C., Günther, U., Viant, M. (2007) Improved classification accuracy
in 1- and 2-dimensional NMR metabolomics data using the variance stabilising generalised
logarithm transformation. BMC Bioinformatics, 8: 234
Payne, T., Southam, A., Arvanitis, T., Viant, M. (2009) A signal filtering method for
improved quantification and noise discrimination in fourier transform ion cyclotron
resonance mass spectrometry-based metabolomics data. Journal of the American Society
for Mass Spectrometry, 20 (6): 1087–95
Pfaffl, M.W. (2001) A new mathematical model for relative quantification in real-time RT-
PCR. Nucleic Acids Research, 29 (9): e45
Piccapietra, F. (2012) Colloidal stability of silver nanoparticles and their interactions with
the alga Chlamydomonas reinhardtii (Doctoral dissertation, Diss., Eidgenössische
Technische Hochschule ETH Zürich, Nr. 20365, 2012).
Piña, B. and Barata, C. (2011) A genomic and ecotoxicological perspective of DNA array
studies in aquatic environmental risk assessment. Aquatic Toxicology, 105 (3-4 Suppl):
40–9
Poynton, H.C., Lazorchak, J.M., Impellitteri, C. a, et al. (2011a) Differential gene
expression in Daphnia magna suggests distinct modes of action and bioavailability for
ZnO nanoparticles and Zn ions. Environmental Science & Technology, 45 (2): 762–8
Poynton, H., Lazorchak, J., Impellitteri, C., Smith, M., Rogers, K., Patra, M., Hammer, K.,
Allen, H., Vulpe, C. (2012) Toxicogenomic responses of nanotoxicity in Daphnia magna
exposed to silver nitrate and coated silver nanoparticles. Environmental Science &
Technology, 46 (11): 6288–96
213
Poynton, H., Taylor, N., Hicks, J., Colson, K., Chan, S., Clark, C., Scanlan, L., Loguinov,
A., Vulpe, C., Viant, M. (2011b) Metabolomics of microliter hemolymph samples enables
an improved understanding of the combined metabolic and transcriptional responses of
Daphnia magna to cadmium. Environmental Science & Technology, 45 (8): 3710–7
Purcell, T. and Peters, J. (1998) Sources of silver in the environment. Environmental
Toxicology and Chemistry, 17 (4): 539–546
Quincozes-Santos, A., Bobermin, L., Souza, D., Bellaver, B., Goncalves, C.-A., Souza, D.
(2014) Guanosine protects C6 astroglial cells against azide-induced oxidative damage: A
putative role of heme oxygenase 1. Journal of Neurochemistry, 130 (1): 61–74
Rai, M., Yadav, A. and Gade, A. (2009) Silver nanoparticles as a new generation of
antimicrobials. Biotechnology Advances, 27 (1): 76–83
Rai, M., Deshmukh, S., Ingle, P., Gade, A. (2012) Silver nanoparticles: the powerful
nanoweapon against multidrug-resistant bacteria. Journal of Applied Microbiology, 112
(5): 841–52
Rainville, L.-C., Carolan, D., Varela, A., Doyle, H., Sheehan, D. (2014) Proteomic
evaluation of citrate-coated silver nanoparticles toxicity in Daphnia magna. The Analyst,
139 (7): 1678–86
Ratte, H. (1999) Bioaccumulation and toxicity of silver compounds: A review.
Environmental Toxicology and Chemistry, 18 (1): 89–108
Ribeiro, F., Gallego-Urrea, J., Jurkschat, K., Crossley, A., Hassellov, M., Taylor, C.,
Soares, A., Loureiro, S. (2014) Silver nanoparticles and silver nitrate induce high toxicity
to Pseudokirchneriella subcapitata, Daphnia magna and Danio rerio. The Science of the
Total Environment, 466-467: 232–41
214
Rivetti, C., Campos, B., Faria, M., Catala, N., Malik, A., Munoz, I., Tauler, R., Soares, A.,
Osorio, V., Perez, S., Gorga, M., Petrovic, M., Mastroianni, N., Alda, M., Masia, A.,
Campo, J., Pico, Y., Guasc, H., Barcelo, D., Barata, C. (2014) Transcriptomic, biochemical
and individual markers in transplanted Daphnia magna to characterize impacts in the field.
The Science of the Total Environment
Robertson, D. (2005) Metabonomics in toxicology: A review. Toxicological Sciences, 85
(2): 809–822
Robertson, D., Reily, M. and Baker, J. (2007) Metabonomics in pharmaceutical discovery
and development. Journal of Proteome Research, 6 (2): 526–39
Rogers, J., Parkinson, C., Choi, Y., Speshock, J., Hussain, S. (2008) A preliminary
assessment of silver nanoparticle inhibition of monkeypox virus plaque formation.
Nanoscale Research Letters, 3 (4): 129–133
Römer, I., Gavin, A., White, T., Merrifield, R., Chipman, J., Viant, M., Lead, J. (2013)
The critical importance of defined media conditions in Daphnia magna nanotoxicity
studies. Toxicology Letters, 223 (1): 103–8
Römer, I., White, T., Baalousha, M., Chipman, K., Viant, M., Lead, J. (2011) Aggregation
and dispersion of silver nanoparticles in exposure media for aquatic toxicity tests. Journal
of Chromatography. A, 1218 (27): 4226–33
Roy, I. and Vij, N. (2010) Nanodelivery in airway diseases: challenges and therapeutic
applications. Nanomedicine : Nanotechnology, Biology, and Medicine, 6 (2): 237–44
Rozen, S. and Skaletsky, H. (1999) Primer3 on the WWW for general users and for
biologist programmers. Bioinformatics Methods and Protocols
215
Russell, A. and Hugo, W. (1994) Antimicrobial activity and action of silver. Progress in
medicinal chemistry, 31, p.351.
Ryman-Rasmussen, J., Cesta, M., Brody, A., Shipley-Phillips, J., Everitt, J., Tewksbury,
E., Moss, O., Wong, B., Dodd, D., Andersen, M., Bonner, J. (2009) Inhaled carbon
nanotubes reach the subpleural tissue in mice. Nature Nanotechnology, 4 (11): 747–51
Sangster, T., Major, H., Plumb, R., Wilson, A., Wilson, I. (2006) A pragmatic and readily
implemented quality control strategy for HPLC-MS and GC-MS-based metabonomic
analysis. The Analyst, 131 (10): 1075–1078
Scanlan, L., Reed, R., Loguinov, A., Antczak, P., Tagmount, A., Aloni, S., Nowinski, D.,
Luong, P., Tran, C., Karunaratne, N., Pham, D., Lin, X., Falciani, F., Higging, C.,
Ranville, J., Vulpe, C., Gilbert, B. (2013) Silver nanowire exposure results in
internalization and toxicity to Daphnia magna. ACS Nano, 7 (12): 10681–94
SCENIHR, Opinion on the scientific basis for the definition of the term ‘‘nanomaterial’’.
Scientific Committee on Emerging and Newly Identified Health Risks (SCENIHR),
European Commission Brussels, Belgium, 2010
Schirmer, K., Fischer, B., Madureira, D., Pillai, S. (2010) Transcriptomics in
ecotoxicology. Analytical and Bioanalytical Chemistry, 397 (3): 917–23
Scown, T., Santos, E., Johnston, B., Gaiser, B., Baalousha, M., Mitov, S., Lead, J., Stone,
V., Fernandes, T., Jepson, M., Aerle, R., Tyler, C. (2010) Effects of aqueous exposure to
silver nanoparticles of different sizes in rainbow trout. Toxicological Sciences, 115 (2):
521–34
216
Seaton, A., Tran, L., Aitken, R., Donaldson, K. (2010) Nanoparticles, human health hazard
and regulation. Journal of the Royal Society, Interface, 7 Suppl 1 (September 2009):
S119–29
Shen, M.-H., Zhou, X.-X., Yang, X.-Y., Chao, J.-B., Liu, R., Liu, J.-F. (2015) Exposure
medium: key in identifying free Ag+ as the exclusive species of silver nanoparticles with
acute toxicity to Daphnia magna. Scientific Reports, 5: 9674
Skjolding, L., Kern, K., Hjorth, R., Hartmann, N., Overgaard, S., Ma, G., Veinot, J., Baun,
A. (2014) Uptake and depuration of gold nanoparticles in Daphnia magna. Ecotoxicology,
23 (7): 1172–83
Southam, A., Payne, T., Cooper, H., Arvanitis, T., Viant, M. (2007) Dynamic range and
mass accuracy of wide-scan direct infusion nanoelectrospray fourier transform ion
cyclotron resonance mass spectrometry-based metabolomics increased by the spectral
stitching method. Analytical Chemistry, 79 (12): 4595–4602
Stebounova, L., Guio, E. and Grassian, V. (2011) Silver nanoparticles in simulated
biological media: A study of aggregation, sedimentation, and dissolution. Journal of
Nanoparticle Research, 13 (1): 233–244
Stensberg, M., Madangopal, R., Yale, G., Wei, W., Ochoa-Acuna, H., Wei, A. Mclamore,
E., Rickus, J., Porterfield, D., Sepulveda, M. (2013) Silver nanoparticle-specific
mitotoxicity in Daphnia magna. Nanotoxicology, (April): 1–10
Stentoft, C., Vestergaard, M., Løvendahl, P., Kristensen, N., Moorby, J., Jensen, S. (2014)
Simultaneous quantification of purine and pyrimidine bases, nucleosides and their
degradation products in bovine blood plasma by high performance liquid chromatography
tandem mass spectrometry. Journal of Chromatography. A, 1356: 197–210
217
Stevenson, A., Bea, D., Civit, S., Contera, S., Cerveto, A., Trigueros, S. (2012) Three
strategies to stabilise nearly monodispersed silver nanoparticles in aqueous solution.
Nanoscale Research Letters, 7 (1): 151
Strange, R., Spiteri, M., Ramachandran, S., Fryer, A. (2001) Glutathione-S-transferase
family of enzymes. Mutation Research, 482 (1-2): 21–26
Struck-Lewicka, W., Kaliszan, R. and Markuszewski, M. (2014) Analysis of urinary
nucleosides as potential cancer markers determined using LC-MS technique. Journal of
Pharmaceutical and Biomedical Analysis
Tatarazako, N. and Oda, S. (2007) The water flea Daphnia magna (Crustacea, Cladocera)
as a test species for screening and evaluation of chemicals with endocrine disrupting
effects on crustaceans. Ecotoxicology, 16 (1): 197–203
Taylor, N., Weber, R., Southam, A., Payne, T., Hrydziuszko, O., Arvanitis, T., Viant, M.
(2009) A new approach to toxicity testing in Daphnia magna: application of high
throughput FT-ICR mass spectrometry metabolomics. Metabolomics, 5 (1): 44–58
Taylor, N., Weber, R., White, T., Viant, M. (2010) Discriminating between different acute
chemical toxicities via changes in the daphnid metabolome. Toxicological Sciences, 118
(1): 307–17
Tejamaya, M., Römer, I., Merrifield, R., Lead, J. (2012) Stability of citrate, PVP, and PEG
coated silver nanoparticles in ecotoxicology media. Environmental Science & Technology,
46 (13): 7011–7017
Tkalec, Ž., Drobne, D., Vogel-Mikuš, K., Pongrac, P., Regvar, M., Strus, J., Pelicon, P.,
Vavpetic, P., Grlj, N., Remskar, M. (2011) Micro-PIXE study of Ag in digestive glands of
218
a nano-Ag fed arthropod (Porcellio scaber, Isopoda, Crustacea). Nuclear Instruments and
Methods in Physics Research B, 269 (20): 2286–2291
Ulm, L., Krivohlavek, A., Jurašin, D., Ljubojevic, M., Sinko, G., Crnkovic, T., Zuntar, I.,
Sikic, S., Vrcek, I., (2015) Response of biochemical biomarkers in the aquatic crustacean
Daphnia magna exposed to silver nanoparticles. Environmental Science and Pollution
Research
Vance, M., Kuiken, T., Vejerano, E., McGinnis, S., Hochella, M., Rejeski, D., Hull, M.
(2015) Nanotechnology in the real world: Redeveloping the nanomaterial consumer
products inventory. Beilstein Journal of Nanotechnology, 6 (October 2013): 1769–1780
Verano-Braga, T., Miethling-Graff, R., Wojdyla, K., Rogowska-Wrzesinska, A., Brewer,
J., Erdmann, H., Kjeldsen, F. (2014) Insights into the cellular response triggered by silver
nanoparticles using quantitative proteomics. ACS Nano, 8 (3): 2161–75
Viant, M. (2008) Recent developments in environmental metabolomics. Molecular
BioSystems, 4 (10): 980–6
Viant, M. (2009) Applications of metabolomics to the environmental sciences.
Metabolomics, 5 (1): 1–2
Viant, M., Bearden, D., Bundy, J., Burton, I., Collette, T., Ekman, D., Ezernieks, V.,
Karakach, T., Lin, C., Rochfort, S., De Ropp, J., Teng, Q., Tjeerdema, R., Walter, J., Wu,
H. (2009) International NMR-based environmental metabolomics intercomparison
exercise. Environmental Science & Technology, 43 (1): 219–25
Viant, M. and Sommer, U. (2012) Mass spectrometry based environmental metabolomics:
a primer and review. Metabolomics, 9 (S1): 144–158
219
Wang, Z., Liu, S., Ma, J., Qu, G., Wang, X., Yu, S., He, J., Liu, J., Xia, T., Jiang, G.-B.
(2013) Silver nanoparticles induced RNA polymerase-silver binding and RNA
transcription inhibition in erythroid progenitor cells. ACS Nano, 7 (5): 4171–86
Wardak, A., Gorman, M., Swami, N., Rejeski, D. (2007) Environmental regulation of
nanotechnology and the TSCA. IEEE Technology and Society Magazine, 26 (2): 48–56
Watanabe, H., Takahashi, E., Nakamura, Y., Oda, S., Tatarazako, N., Iguchi, T. (2007)
Development of a Daphnia magna DNA microarray for evaluating the toxicity of
environmental chemicals. Environmental Toxicology and Chemistry, 26 (4): 669–76
Weber, R., Southam, A., Sommer, U., Viant, M. (2011) Characterization of isotopic
abundance measurements in high resolution FT-ICR and Orbitrap mass spectra for
improved confidence of metabolite identification. Analytical Chemistry, 83 (10): 3737–
3743
Weber, R. and Viant, M. (2010) MI-Pack: Increased confidence of metabolite
identification in mass spectra by integrating accurate masses and metabolic pathways.
Chemometrics and Intelligent Laboratory Systems, 104 (1): 75–82
White, T. (2013) Assessing toxicity in Daphnia magna : an oxidative lipidomic approach.
Doctoral thesis, University of Birmingham.
Williams, T., Turan, N., Diab, A., Wu, H., Mackenzie, C., Bartie, K., Hrydziuszko, O.,
Lyons, B., Stentiford, G., Herbert, J., Abraham, J., Katsiadaki, I., Leaver, M., Taggart, J.,
George, S., Viant, M., Chipman, K., Falciani, F. (2011) Towards a system level
understanding of non-model organisms sampled from the environment: a network biology
approach. PLoS Computational Biology, 7 (8): e1002126
220
Wise, B., Gallagher, N., Bro, R., Shaver, J., Windig, W. and Koch, R. (2007) PLS Toolbox
4.0. Eigenvector Research Incorporated, 3905.
Wood, C. (1999) Physiology and modeling of mechanisms of silver uptake and toxicity in
fish. Environmental Toxicology and Chemistry, 18 (1): 71–83
Wu, H., Southam, A., Hines, A., Viant, M. (2008) High-throughput tissue extraction
protocol for NMR- and MS-based metabolomics. Analytical Biochemistry, 372 (2): 204–
12
Xia, J., Mandal, R., Sinelnikov, I., Broadhurst, D., Wishart, D. (2012) MetaboAnalyst 2.0-
-a comprehensive server for metabolomic data analysis. Nucleic Acids Research, 40 (Web
Server issue): W127–33
Xia, J. and Wishart, D. (2010) MetPA: a web-based metabolomics tool for pathway
analysis and visualization. Bioinformatics, 26 (18): 2342–4
Yang, X., Gondikas, A., Marinakos, S., Auffan, M., Liu, J., Hsu-Kim, H., Meyer, J. (2012)
Mechanism of silver nanoparticle toxicity is dependent on dissolved silver and surface
coating in Caenorhabditis elegans. Environmental Science & Technology, 46 (2): 1119–27
Yoshimaru, T., Suzuki, Y., Inoue, T., Niide, O., Ra, C. (2006) Silver activates mast cells
through reactive oxygen species production and a thiol-sensitive store-independent Ca2+
influx. Free Radical Biology and Medicine, 40 (11): 1949–1959
Yudkin, J. (1937) The effect of silver ions on some enzymes of Bacterium coli.
Enzymologia, 2: 161–170
Zhao, C.-M. and Wang, W.-X. (2010) Biokinetic uptake and efflux of silver nanoparticles
in Daphnia magna. Environmental Science & Technology, 44 (19): 7699–704
221
Zhao, C.-M. and Wang, W.-X. (2011) Comparison of acute and chronic toxicity of silver
nanoparticles and silver nitrate to Daphnia magna. Environmental Toxicology and
Chemistry, 30 (4): 885–92
Zhao, C.-M. and Wang, W.-X. (2012a) Importance of surface coatings and soluble silver
in silver nanoparticles toxicity to Daphnia magna. Nanotoxicology, 6 (4): 361–70
Zhao, C.-M. and Wang, W.-X. (2012b) Size-dependent uptake of silver nanoparticles in
Daphnia magna. Environmental Science & Technology, 46 (20): 11345–51
Zhao, C.-M. and Wang, W.-X. (2013) Regulation of sodium and calcium in Daphnia
magna exposed to silver nanoparticles. Environmental Toxicology and Chemistry, 32 (4):
913–9
Zhao, F., Zhao, Y., Liu, Y., Chang, X., Chen, C., Zhao, Y. (2011) Cellular uptake,
intracellular trafficking, and cytotoxicity of nanomaterials. Small, 7 (10): 1322–1337
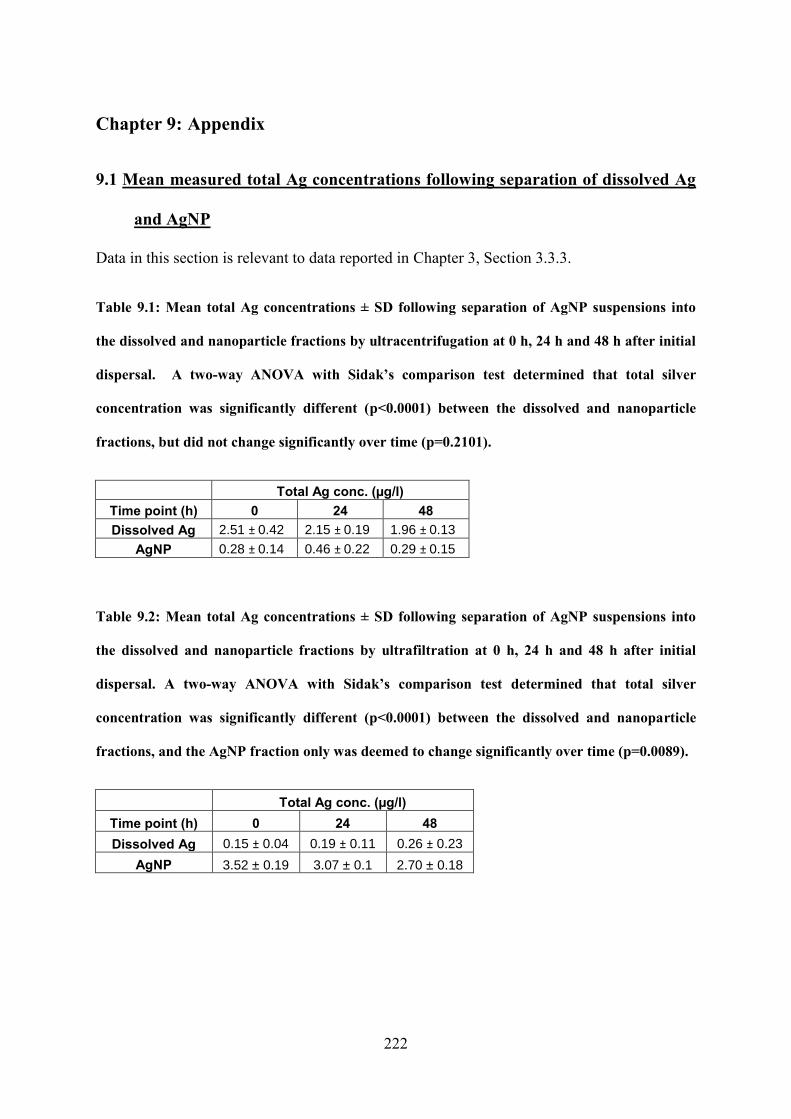
222
Chapter 9: Appendix
9.1 Mean measured total Ag concentrations following separation of dissolved Ag
and AgNP
Data in this section is relevant to data reported in Chapter 3, Section 3.3.3.
Table 9.1: Mean total Ag concentrations ± SD following separation of AgNP suspensions into
the dissolved and nanoparticle fractions by ultracentrifugation at 0 h, 24 h and 48 h after initial
dispersal. A two-way ANOVA with Sidak’s comparison test determined that total silver
concentration was significantly different (p<0.0001) between the dissolved and nanoparticle
fractions, but did not change significantly over time (p=0.2101).
Total Ag conc. (µg/l) Time point (h) 0 24 48 Dissolved Ag 2.51 ± 0.42 2.15 ± 0.19 1.96 ± 0.13
AgNP 0.28 ± 0.14 0.46 ± 0.22 0.29 ± 0.15
Table 9.2: Mean total Ag concentrations ± SD following separation of AgNP suspensions into
the dissolved and nanoparticle fractions by ultrafiltration at 0 h, 24 h and 48 h after initial
dispersal. A two-way ANOVA with Sidak’s comparison test determined that total silver
concentration was significantly different (p<0.0001) between the dissolved and nanoparticle
fractions, and the AgNP fraction only was deemed to change significantly over time (p=0.0089).
Total Ag conc. (µg/l) Time point (h) 0 24 48 Dissolved Ag 0.15 ± 0.04 0.19 ± 0.11 0.26 ± 0.23
AgNP 3.52 ± 0.19 3.07 ± 0.1 2.70 ± 0.18
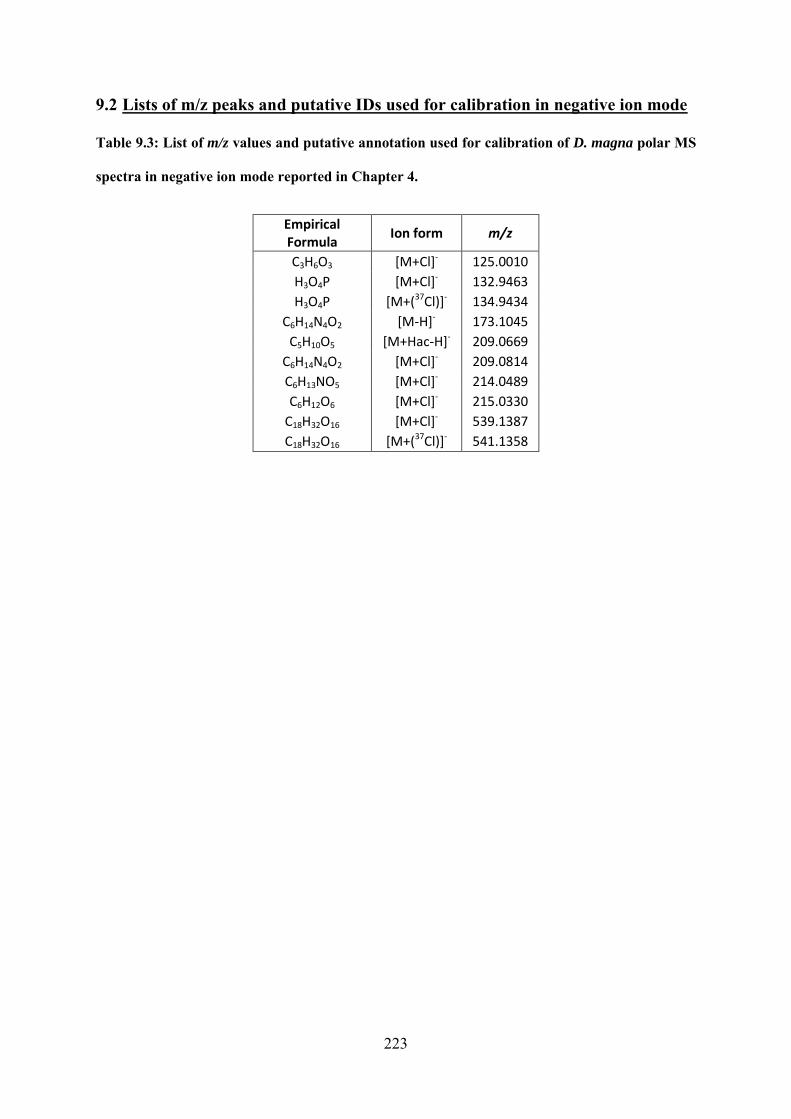
223
9.2 Lists of m/z peaks and putative IDs used for calibration in negative ion mode
Table 9.3: List of m/z values and putative annotation used for calibration of D. magna polar MS
spectra in negative ion mode reported in Chapter 4.
Empirical Formula
Ion form m/z
C3H6O3 [M+Cl]- 125.0010 H3O4P [M+Cl]- 132.9463 H3O4P [M+(37Cl)]- 134.9434
C6H14N4O2 [M-H]- 173.1045 C5H10O5 [M+Hac-H]- 209.0669
C6H14N4O2 [M+Cl]- 209.0814 C6H13NO5 [M+Cl]- 214.0489 C6H12O6 [M+Cl]- 215.0330
C18H32O16 [M+Cl]- 539.1387 C18H32O16 [M+(37Cl)]- 541.1358
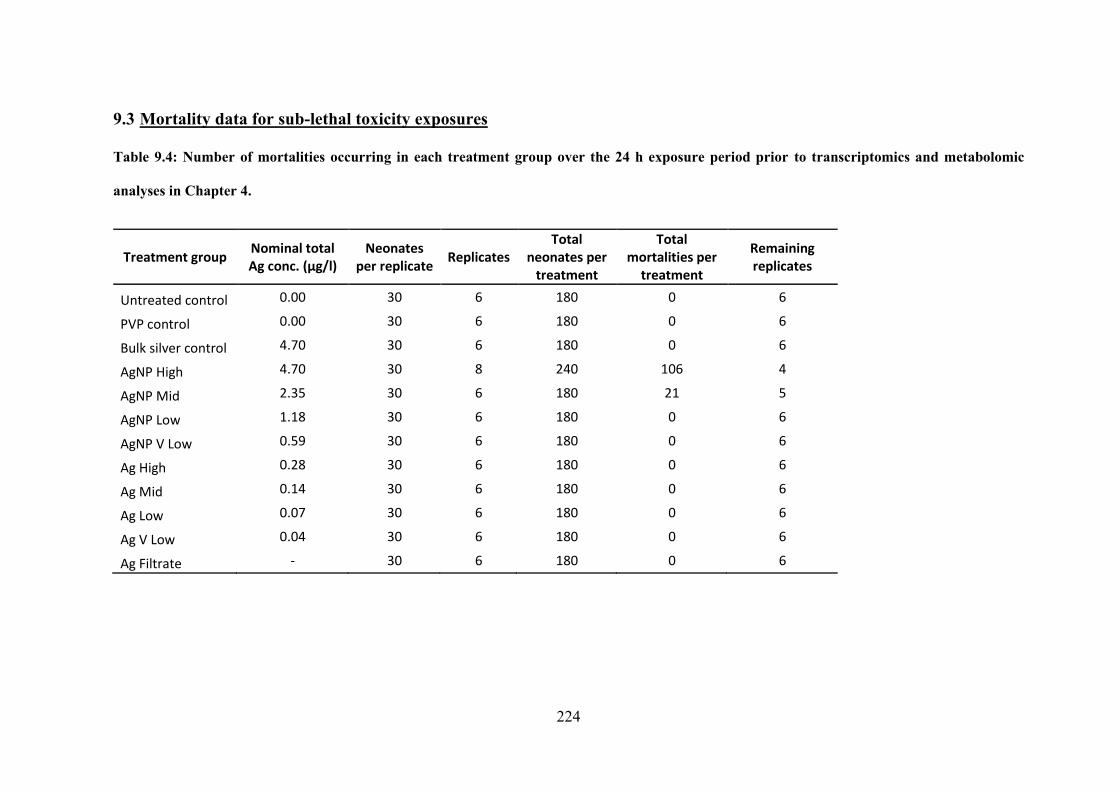
224
9.3 Mortality data for sub-lethal toxicity exposures
Table 9.4: Number of mortalities occurring in each treatment group over the 24 h exposure period prior to transcriptomics and metabolomic
analyses in Chapter 4.
Treatment group Nominal total Ag conc. (µg/l)
Neonates per replicate
Replicates Total
neonates per treatment
Total mortalities per
treatment
Remaining replicates
Untreated control 0.00 30 6 180 0 6
PVP control 0.00 30 6 180 0 6
Bulk silver control 4.70 30 6 180 0 6
AgNP High 4.70 30 8 240 106 4
AgNP Mid 2.35 30 6 180 21 5
AgNP Low 1.18 30 6 180 0 6
AgNP V Low 0.59 30 6 180 0 6
Ag High 0.28 30 6 180 0 6
Ag Mid 0.14 30 6 180 0 6
Ag Low 0.07 30 6 180 0 6
Ag V Low 0.04 30 6 180 0 6
Ag Filtrate - 30 6 180 0 6
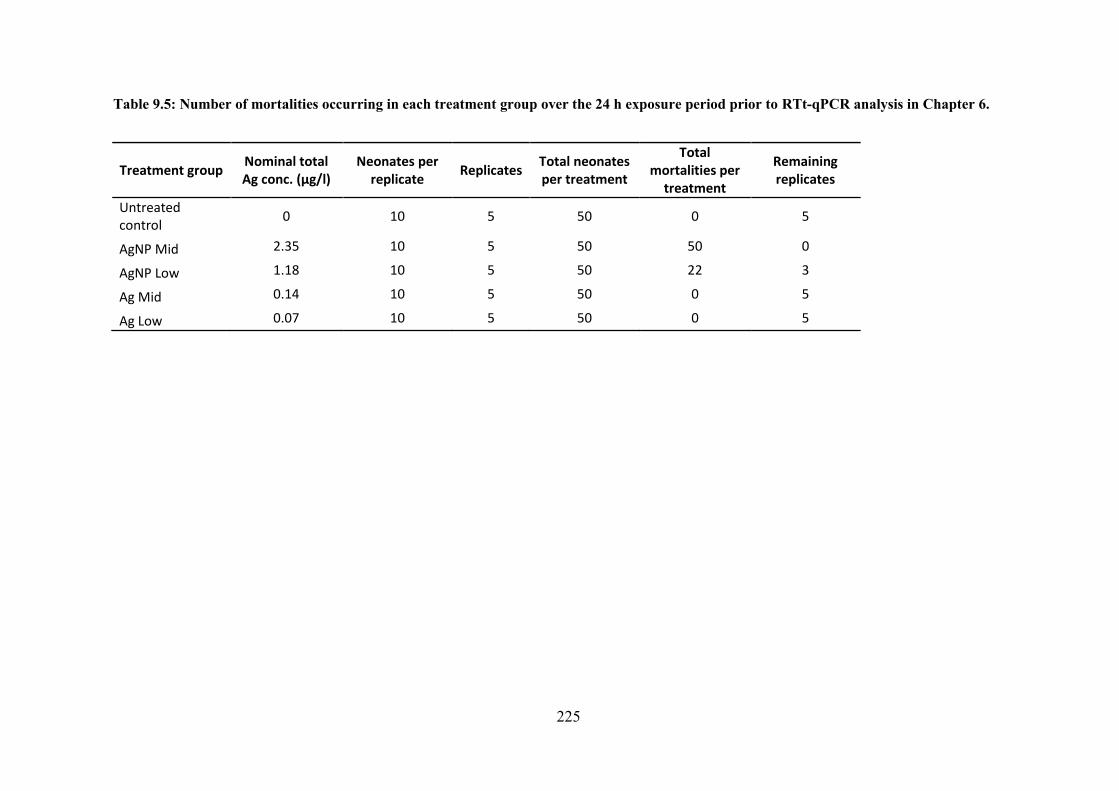
225
Table 9.5: Number of mortalities occurring in each treatment group over the 24 h exposure period prior to RTt-qPCR analysis in Chapter 6.
Treatment group Nominal total Ag conc. (µg/l)
Neonates per replicate
Replicates Total neonates per treatment
Total mortalities per
treatment
Remaining replicates
Untreated control
0 10 5 50 0 5
AgNP Mid 2.35 10 5 50 50 0
AgNP Low 1.18 10 5 50 22 3
Ag Mid 0.14 10 5 50 0 5
Ag Low 0.07 10 5 50 0 5

226
9.4 Tables of annotated variables that change significantly in intensity in response to AgNP and Ag+ exposure
Table 9.6: List of significantly changing gene-spots with putative human analogue Ensembl gene IDs reported in Chapter 5. P-values are included
after correcting for the multiple-testing hypothesis. FC AgNP refers to the fold increase as calculated for the AgNP High group.
Observed Statistics Ensemble: Human Orthologues
Gene ID P-value FC AgNP High Human Ensembl
gene code Human Symbol Putative Human Function
DM00071 0.00000 3.4743 ENSG00000109971 HSPA8 heat shock 70kDa protein 8
DM01384 0.00000 0.4075 ENSG00000159640 ACE angiotensin I converting enzyme
(peptidyl-dipeptidase A) 1
DM03092 0.00001 6.5768 ENSG00000064703 DDX20 DEAD (Asp-Glu-Ala-Asp) box
polypeptide 20
DM02355 0.00001 3.9502 ENSG00000157326 DHRS4 dehydrogenase/reductase (SDR
family) member 4
DM04280 0.00001 0.6873 ENSG00000100902 PSMA6 proteasome (prosome, macropain)
subunit, alpha type, 6
DM05899 0.00001 0.2121 ENSG00000119471 HSDL2 hydroxysteroid dehydrogenase like 2
DM01056 0.00001 3.1685 ENSG00000155016 CYP2U1 cytochrome P450, family 2, subfamily U, polypeptide 1
DM02516 0.00002 0.4515 ENSG00000067167 TRAM1 translocation associated membrane
protein 1
DM04714 0.00002 2.9871 ENSG00000003436 TFPI tissue factor pathway inhibitor
(lipoprotein-associated coagulation inhibitor)
DM12060 0.00002 0.5487 ENSG00000185420 SMYD3 SET and MYND domain containing 3
DM01303 0.00002 0.4776 ENSG00000187546 AGMO alkylglycerol monooxygenase
DM03602 0.00003 0.6865 ENSG00000108479 GALK1 galactokinase 1
DM12557 0.00003 0.6622 ENSG00000167740 CYB5D2 cytochrome b5 domain containing 2
DM02250 0.00003 0.6092 ENSG00000178537 SLC25A20 solute carrier family 25
(carnitine/acylcarnitine translocase), member 20
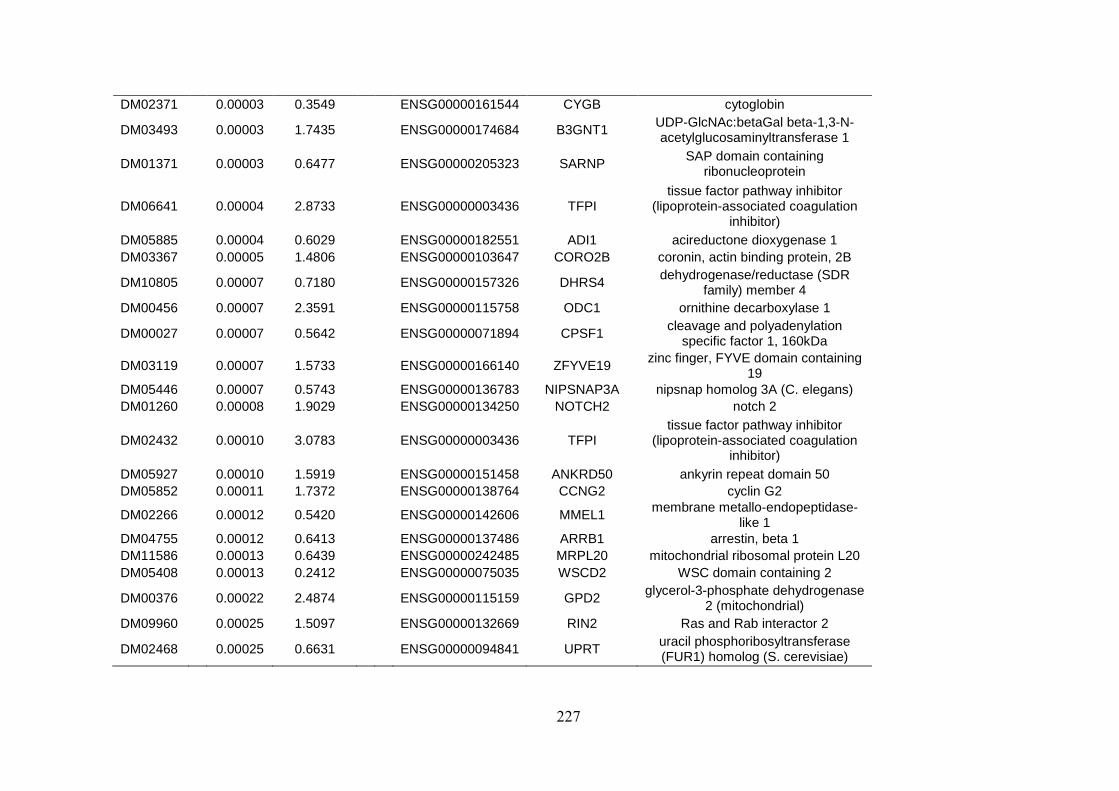
227
DM02371 0.00003 0.3549 ENSG00000161544 CYGB cytoglobin
DM03493 0.00003 1.7435 ENSG00000174684 B3GNT1 UDP-GlcNAc:betaGal beta-1,3-N-acetylglucosaminyltransferase 1
DM01371 0.00003 0.6477 ENSG00000205323 SARNP SAP domain containing
ribonucleoprotein
DM06641 0.00004 2.8733 ENSG00000003436 TFPI tissue factor pathway inhibitor
(lipoprotein-associated coagulation inhibitor)
DM05885 0.00004 0.6029 ENSG00000182551 ADI1 acireductone dioxygenase 1
DM03367 0.00005 1.4806 ENSG00000103647 CORO2B coronin, actin binding protein, 2B
DM10805 0.00007 0.7180 ENSG00000157326 DHRS4 dehydrogenase/reductase (SDR
family) member 4
DM00456 0.00007 2.3591 ENSG00000115758 ODC1 ornithine decarboxylase 1
DM00027 0.00007 0.5642 ENSG00000071894 CPSF1 cleavage and polyadenylation
specific factor 1, 160kDa
DM03119 0.00007 1.5733 ENSG00000166140 ZFYVE19 zinc finger, FYVE domain containing
19
DM05446 0.00007 0.5743 ENSG00000136783 NIPSNAP3A nipsnap homolog 3A (C. elegans)
DM01260 0.00008 1.9029 ENSG00000134250 NOTCH2 notch 2
DM02432 0.00010 3.0783 ENSG00000003436 TFPI tissue factor pathway inhibitor
(lipoprotein-associated coagulation inhibitor)
DM05927 0.00010 1.5919 ENSG00000151458 ANKRD50 ankyrin repeat domain 50
DM05852 0.00011 1.7372 ENSG00000138764 CCNG2 cyclin G2
DM02266 0.00012 0.5420 ENSG00000142606 MMEL1 membrane metallo-endopeptidase-
like 1
DM04755 0.00012 0.6413 ENSG00000137486 ARRB1 arrestin, beta 1
DM11586 0.00013 0.6439 ENSG00000242485 MRPL20 mitochondrial ribosomal protein L20
DM05408 0.00013 0.2412 ENSG00000075035 WSCD2 WSC domain containing 2
DM00376 0.00022 2.4874 ENSG00000115159 GPD2 glycerol-3-phosphate dehydrogenase
2 (mitochondrial)
DM09960 0.00025 1.5097 ENSG00000132669 RIN2 Ras and Rab interactor 2
DM02468 0.00025 0.6631 ENSG00000094841 UPRT uracil phosphoribosyltransferase (FUR1) homolog (S. cerevisiae)
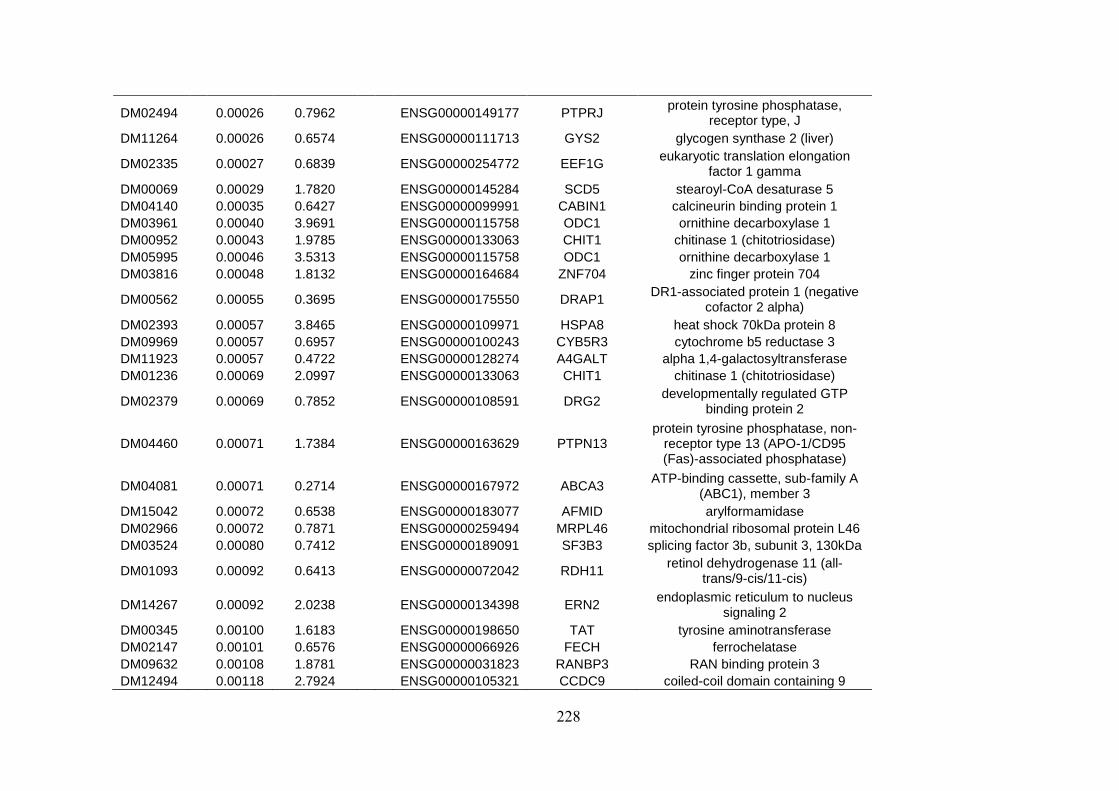
228
DM02494 0.00026 0.7962 ENSG00000149177 PTPRJ protein tyrosine phosphatase,
receptor type, J
DM11264 0.00026 0.6574 ENSG00000111713 GYS2 glycogen synthase 2 (liver)
DM02335 0.00027 0.6839 ENSG00000254772 EEF1G eukaryotic translation elongation
factor 1 gamma
DM00069 0.00029 1.7820 ENSG00000145284 SCD5 stearoyl-CoA desaturase 5
DM04140 0.00035 0.6427 ENSG00000099991 CABIN1 calcineurin binding protein 1
DM03961 0.00040 3.9691 ENSG00000115758 ODC1 ornithine decarboxylase 1
DM00952 0.00043 1.9785 ENSG00000133063 CHIT1 chitinase 1 (chitotriosidase)
DM05995 0.00046 3.5313 ENSG00000115758 ODC1 ornithine decarboxylase 1
DM03816 0.00048 1.8132 ENSG00000164684 ZNF704 zinc finger protein 704
DM00562 0.00055 0.3695 ENSG00000175550 DRAP1 DR1-associated protein 1 (negative
cofactor 2 alpha)
DM02393 0.00057 3.8465 ENSG00000109971 HSPA8 heat shock 70kDa protein 8
DM09969 0.00057 0.6957 ENSG00000100243 CYB5R3 cytochrome b5 reductase 3
DM11923 0.00057 0.4722 ENSG00000128274 A4GALT alpha 1,4-galactosyltransferase
DM01236 0.00069 2.0997 ENSG00000133063 CHIT1 chitinase 1 (chitotriosidase)
DM02379 0.00069 0.7852 ENSG00000108591 DRG2 developmentally regulated GTP
binding protein 2
DM04460 0.00071 1.7384 ENSG00000163629 PTPN13 protein tyrosine phosphatase, non-
receptor type 13 (APO-1/CD95 (Fas)-associated phosphatase)
DM04081 0.00071 0.2714 ENSG00000167972 ABCA3 ATP-binding cassette, sub-family A
(ABC1), member 3
DM15042 0.00072 0.6538 ENSG00000183077 AFMID arylformamidase
DM02966 0.00072 0.7871 ENSG00000259494 MRPL46 mitochondrial ribosomal protein L46
DM03524 0.00080 0.7412 ENSG00000189091 SF3B3 splicing factor 3b, subunit 3, 130kDa
DM01093 0.00092 0.6413 ENSG00000072042 RDH11 retinol dehydrogenase 11 (all-
trans/9-cis/11-cis)
DM14267 0.00092 2.0238 ENSG00000134398 ERN2 endoplasmic reticulum to nucleus
signaling 2
DM00345 0.00100 1.6183 ENSG00000198650 TAT tyrosine aminotransferase
DM02147 0.00101 0.6576 ENSG00000066926 FECH ferrochelatase
DM09632 0.00108 1.8781 ENSG00000031823 RANBP3 RAN binding protein 3
DM12494 0.00118 2.7924 ENSG00000105321 CCDC9 coiled-coil domain containing 9
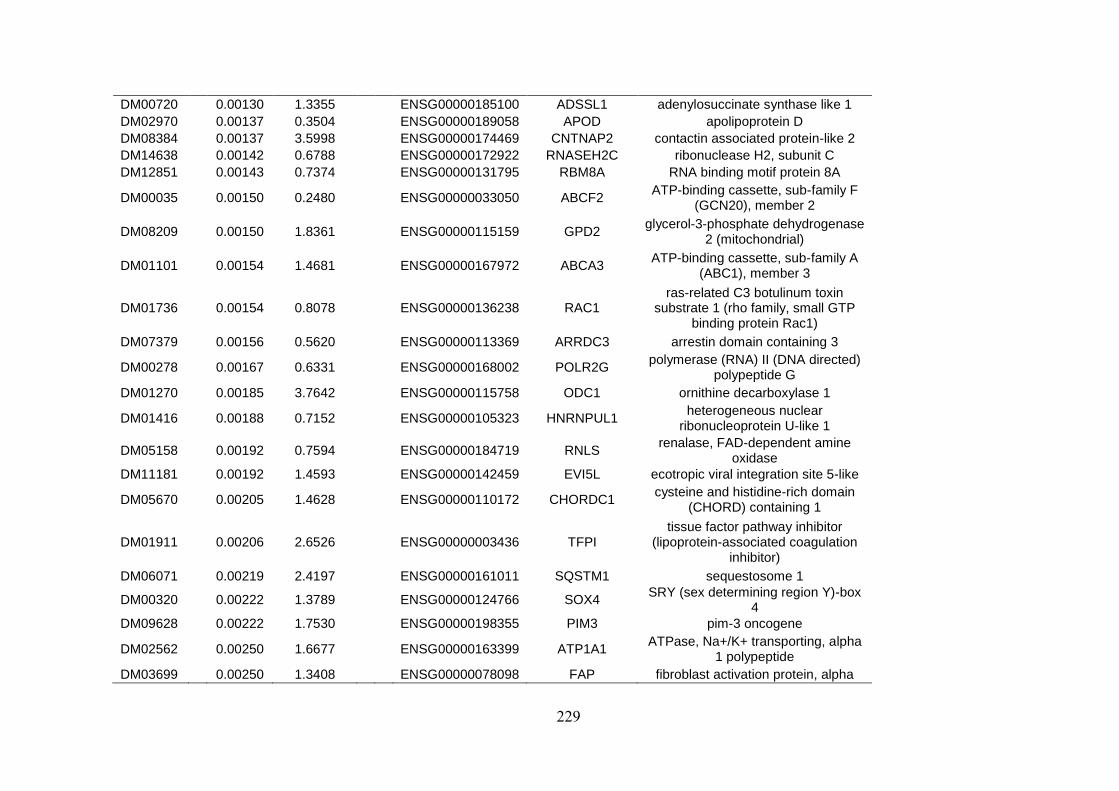
229
DM00720 0.00130 1.3355 ENSG00000185100 ADSSL1 adenylosuccinate synthase like 1
DM02970 0.00137 0.3504 ENSG00000189058 APOD apolipoprotein D
DM08384 0.00137 3.5998 ENSG00000174469 CNTNAP2 contactin associated protein-like 2
DM14638 0.00142 0.6788 ENSG00000172922 RNASEH2C ribonuclease H2, subunit C
DM12851 0.00143 0.7374 ENSG00000131795 RBM8A RNA binding motif protein 8A
DM00035 0.00150 0.2480 ENSG00000033050 ABCF2 ATP-binding cassette, sub-family F
(GCN20), member 2
DM08209 0.00150 1.8361 ENSG00000115159 GPD2 glycerol-3-phosphate dehydrogenase
2 (mitochondrial)
DM01101 0.00154 1.4681 ENSG00000167972 ABCA3 ATP-binding cassette, sub-family A
(ABC1), member 3
DM01736 0.00154 0.8078 ENSG00000136238 RAC1 ras-related C3 botulinum toxin
substrate 1 (rho family, small GTP binding protein Rac1)
DM07379 0.00156 0.5620 ENSG00000113369 ARRDC3 arrestin domain containing 3
DM00278 0.00167 0.6331 ENSG00000168002 POLR2G polymerase (RNA) II (DNA directed)
polypeptide G
DM01270 0.00185 3.7642 ENSG00000115758 ODC1 ornithine decarboxylase 1
DM01416 0.00188 0.7152 ENSG00000105323 HNRNPUL1 heterogeneous nuclear
ribonucleoprotein U-like 1
DM05158 0.00192 0.7594 ENSG00000184719 RNLS renalase, FAD-dependent amine
oxidase
DM11181 0.00192 1.4593 ENSG00000142459 EVI5L ecotropic viral integration site 5-like
DM05670 0.00205 1.4628 ENSG00000110172 CHORDC1 cysteine and histidine-rich domain
(CHORD) containing 1
DM01911 0.00206 2.6526 ENSG00000003436 TFPI tissue factor pathway inhibitor
(lipoprotein-associated coagulation inhibitor)
DM06071 0.00219 2.4197 ENSG00000161011 SQSTM1 sequestosome 1
DM00320 0.00222 1.3789 ENSG00000124766 SOX4 SRY (sex determining region Y)-box
4
DM09628 0.00222 1.7530 ENSG00000198355 PIM3 pim-3 oncogene
DM02562 0.00250 1.6677 ENSG00000163399 ATP1A1 ATPase, Na+/K+ transporting, alpha
1 polypeptide
DM03699 0.00250 1.3408 ENSG00000078098 FAP fibroblast activation protein, alpha
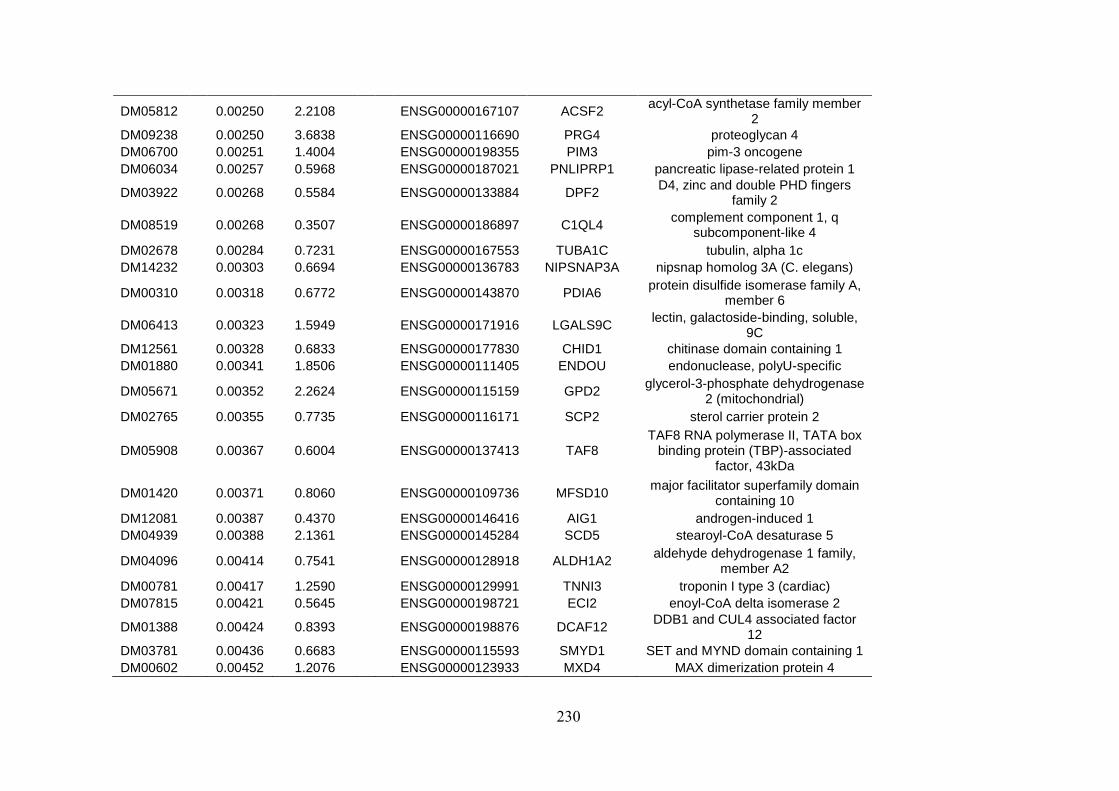
230
DM05812 0.00250 2.2108 ENSG00000167107 ACSF2 acyl-CoA synthetase family member
2
DM09238 0.00250 3.6838 ENSG00000116690 PRG4 proteoglycan 4
DM06700 0.00251 1.4004 ENSG00000198355 PIM3 pim-3 oncogene
DM06034 0.00257 0.5968 ENSG00000187021 PNLIPRP1 pancreatic lipase-related protein 1
DM03922 0.00268 0.5584 ENSG00000133884 DPF2 D4, zinc and double PHD fingers
family 2
DM08519 0.00268 0.3507 ENSG00000186897 C1QL4 complement component 1, q
subcomponent-like 4
DM02678 0.00284 0.7231 ENSG00000167553 TUBA1C tubulin, alpha 1c
DM14232 0.00303 0.6694 ENSG00000136783 NIPSNAP3A nipsnap homolog 3A (C. elegans)
DM00310 0.00318 0.6772 ENSG00000143870 PDIA6 protein disulfide isomerase family A,
member 6
DM06413 0.00323 1.5949 ENSG00000171916 LGALS9C lectin, galactoside-binding, soluble,
9C
DM12561 0.00328 0.6833 ENSG00000177830 CHID1 chitinase domain containing 1
DM01880 0.00341 1.8506 ENSG00000111405 ENDOU endonuclease, polyU-specific
DM05671 0.00352 2.2624 ENSG00000115159 GPD2 glycerol-3-phosphate dehydrogenase
2 (mitochondrial)
DM02765 0.00355 0.7735 ENSG00000116171 SCP2 sterol carrier protein 2
DM05908 0.00367 0.6004 ENSG00000137413 TAF8 TAF8 RNA polymerase II, TATA box
binding protein (TBP)-associated factor, 43kDa
DM01420 0.00371 0.8060 ENSG00000109736 MFSD10 major facilitator superfamily domain
containing 10
DM12081 0.00387 0.4370 ENSG00000146416 AIG1 androgen-induced 1
DM04939 0.00388 2.1361 ENSG00000145284 SCD5 stearoyl-CoA desaturase 5
DM04096 0.00414 0.7541 ENSG00000128918 ALDH1A2 aldehyde dehydrogenase 1 family,
member A2
DM00781 0.00417 1.2590 ENSG00000129991 TNNI3 troponin I type 3 (cardiac)
DM07815 0.00421 0.5645 ENSG00000198721 ECI2 enoyl-CoA delta isomerase 2
DM01388 0.00424 0.8393 ENSG00000198876 DCAF12 DDB1 and CUL4 associated factor
12
DM03781 0.00436 0.6683 ENSG00000115593 SMYD1 SET and MYND domain containing 1
DM00602 0.00452 1.2076 ENSG00000123933 MXD4 MAX dimerization protein 4
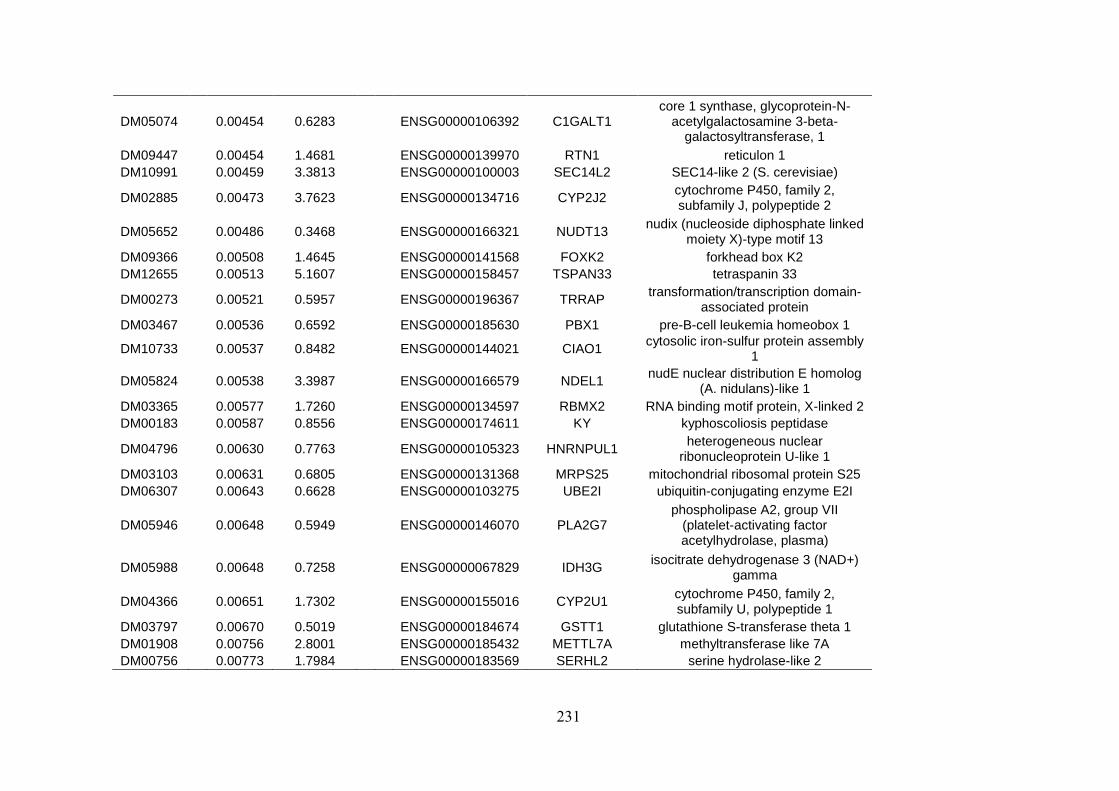
231
DM05074 0.00454 0.6283 ENSG00000106392 C1GALT1 core 1 synthase, glycoprotein-N-
acetylgalactosamine 3-beta-galactosyltransferase, 1
DM09447 0.00454 1.4681 ENSG00000139970 RTN1 reticulon 1
DM10991 0.00459 3.3813 ENSG00000100003 SEC14L2 SEC14-like 2 (S. cerevisiae)
DM02885 0.00473 3.7623 ENSG00000134716 CYP2J2 cytochrome P450, family 2, subfamily J, polypeptide 2
DM05652 0.00486 0.3468 ENSG00000166321 NUDT13 nudix (nucleoside diphosphate linked
moiety X)-type motif 13
DM09366 0.00508 1.4645 ENSG00000141568 FOXK2 forkhead box K2
DM12655 0.00513 5.1607 ENSG00000158457 TSPAN33 tetraspanin 33
DM00273 0.00521 0.5957 ENSG00000196367 TRRAP transformation/transcription domain-
associated protein
DM03467 0.00536 0.6592 ENSG00000185630 PBX1 pre-B-cell leukemia homeobox 1
DM10733 0.00537 0.8482 ENSG00000144021 CIAO1 cytosolic iron-sulfur protein assembly
1
DM05824 0.00538 3.3987 ENSG00000166579 NDEL1 nudE nuclear distribution E homolog
(A. nidulans)-like 1
DM03365 0.00577 1.7260 ENSG00000134597 RBMX2 RNA binding motif protein, X-linked 2
DM00183 0.00587 0.8556 ENSG00000174611 KY kyphoscoliosis peptidase
DM04796 0.00630 0.7763 ENSG00000105323 HNRNPUL1 heterogeneous nuclear
ribonucleoprotein U-like 1
DM03103 0.00631 0.6805 ENSG00000131368 MRPS25 mitochondrial ribosomal protein S25
DM06307 0.00643 0.6628 ENSG00000103275 UBE2I ubiquitin-conjugating enzyme E2I
DM05946 0.00648 0.5949 ENSG00000146070 PLA2G7 phospholipase A2, group VII
(platelet-activating factor acetylhydrolase, plasma)
DM05988 0.00648 0.7258 ENSG00000067829 IDH3G isocitrate dehydrogenase 3 (NAD+)
gamma
DM04366 0.00651 1.7302 ENSG00000155016 CYP2U1 cytochrome P450, family 2, subfamily U, polypeptide 1
DM03797 0.00670 0.5019 ENSG00000184674 GSTT1 glutathione S-transferase theta 1
DM01908 0.00756 2.8001 ENSG00000185432 METTL7A methyltransferase like 7A
DM00756 0.00773 1.7984 ENSG00000183569 SERHL2 serine hydrolase-like 2
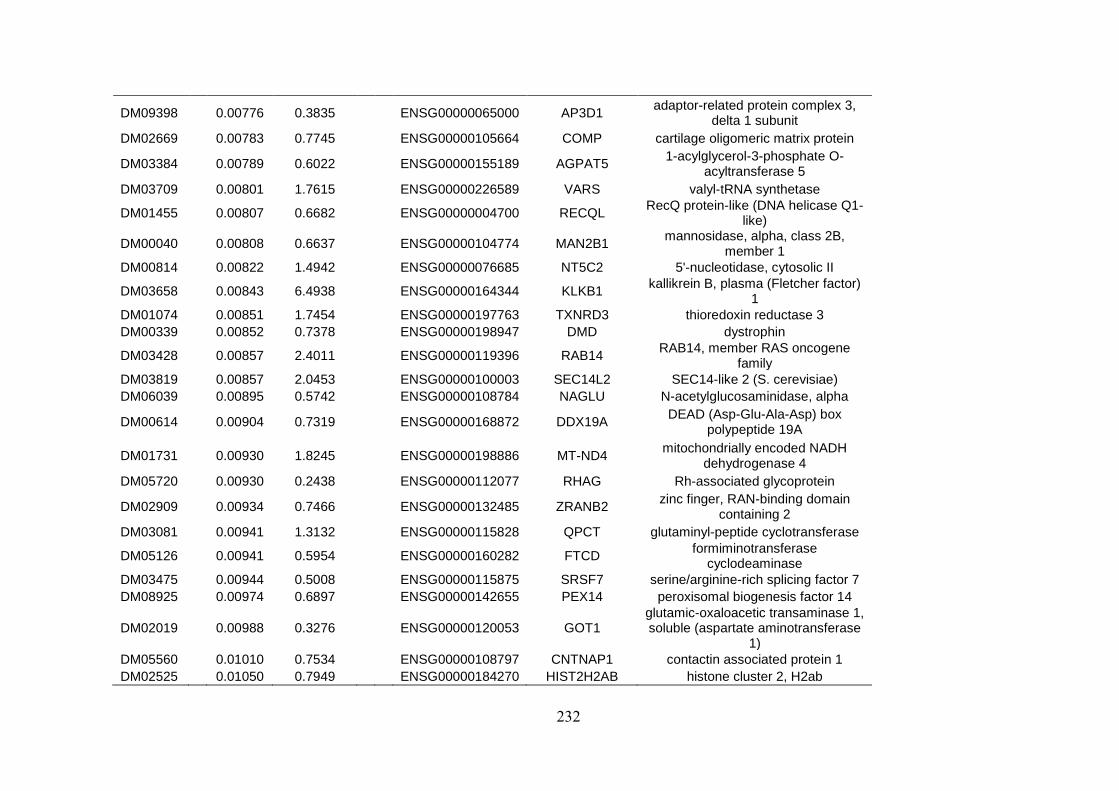
232
DM09398 0.00776 0.3835 ENSG00000065000 AP3D1 adaptor-related protein complex 3,
delta 1 subunit
DM02669 0.00783 0.7745 ENSG00000105664 COMP cartilage oligomeric matrix protein
DM03384 0.00789 0.6022 ENSG00000155189 AGPAT5 1-acylglycerol-3-phosphate O-
acyltransferase 5
DM03709 0.00801 1.7615 ENSG00000226589 VARS valyl-tRNA synthetase
DM01455 0.00807 0.6682 ENSG00000004700 RECQL RecQ protein-like (DNA helicase Q1-
like)
DM00040 0.00808 0.6637 ENSG00000104774 MAN2B1 mannosidase, alpha, class 2B,
member 1
DM00814 0.00822 1.4942 ENSG00000076685 NT5C2 5'-nucleotidase, cytosolic II
DM03658 0.00843 6.4938 ENSG00000164344 KLKB1 kallikrein B, plasma (Fletcher factor)
1
DM01074 0.00851 1.7454 ENSG00000197763 TXNRD3 thioredoxin reductase 3
DM00339 0.00852 0.7378 ENSG00000198947 DMD dystrophin
DM03428 0.00857 2.4011 ENSG00000119396 RAB14 RAB14, member RAS oncogene
family
DM03819 0.00857 2.0453 ENSG00000100003 SEC14L2 SEC14-like 2 (S. cerevisiae)
DM06039 0.00895 0.5742 ENSG00000108784 NAGLU N-acetylglucosaminidase, alpha
DM00614 0.00904 0.7319 ENSG00000168872 DDX19A DEAD (Asp-Glu-Ala-Asp) box
polypeptide 19A
DM01731 0.00930 1.8245 ENSG00000198886 MT-ND4 mitochondrially encoded NADH
dehydrogenase 4
DM05720 0.00930 0.2438 ENSG00000112077 RHAG Rh-associated glycoprotein
DM02909 0.00934 0.7466 ENSG00000132485 ZRANB2 zinc finger, RAN-binding domain
containing 2
DM03081 0.00941 1.3132 ENSG00000115828 QPCT glutaminyl-peptide cyclotransferase
DM05126 0.00941 0.5954 ENSG00000160282 FTCD formiminotransferase
cyclodeaminase
DM03475 0.00944 0.5008 ENSG00000115875 SRSF7 serine/arginine-rich splicing factor 7
DM08925 0.00974 0.6897 ENSG00000142655 PEX14 peroxisomal biogenesis factor 14
DM02019 0.00988 0.3276 ENSG00000120053 GOT1 glutamic-oxaloacetic transaminase 1, soluble (aspartate aminotransferase
1)
DM05560 0.01010 0.7534 ENSG00000108797 CNTNAP1 contactin associated protein 1
DM02525 0.01050 0.7949 ENSG00000184270 HIST2H2AB histone cluster 2, H2ab
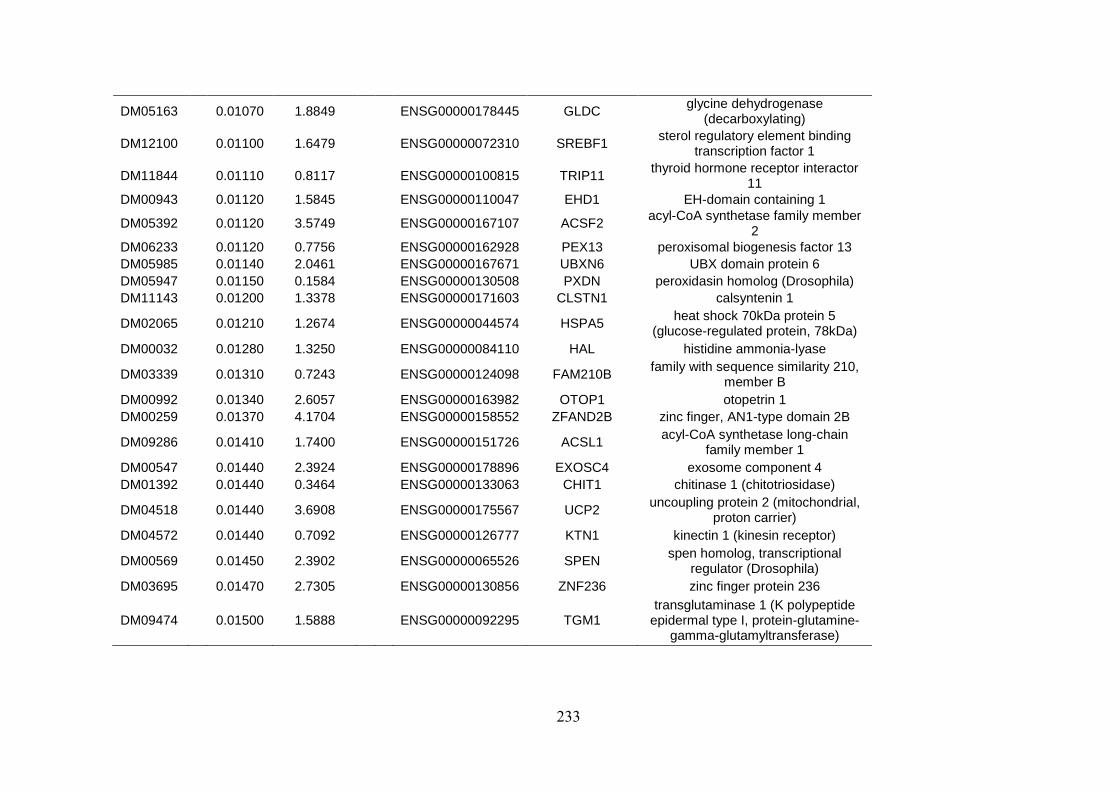
233
DM05163 0.01070 1.8849 ENSG00000178445 GLDC glycine dehydrogenase
(decarboxylating)
DM12100 0.01100 1.6479 ENSG00000072310 SREBF1 sterol regulatory element binding
transcription factor 1
DM11844 0.01110 0.8117 ENSG00000100815 TRIP11 thyroid hormone receptor interactor
11
DM00943 0.01120 1.5845 ENSG00000110047 EHD1 EH-domain containing 1
DM05392 0.01120 3.5749 ENSG00000167107 ACSF2 acyl-CoA synthetase family member
2
DM06233 0.01120 0.7756 ENSG00000162928 PEX13 peroxisomal biogenesis factor 13
DM05985 0.01140 2.0461 ENSG00000167671 UBXN6 UBX domain protein 6
DM05947 0.01150 0.1584 ENSG00000130508 PXDN peroxidasin homolog (Drosophila)
DM11143 0.01200 1.3378 ENSG00000171603 CLSTN1 calsyntenin 1
DM02065 0.01210 1.2674 ENSG00000044574 HSPA5 heat shock 70kDa protein 5
(glucose-regulated protein, 78kDa)
DM00032 0.01280 1.3250 ENSG00000084110 HAL histidine ammonia-lyase
DM03339 0.01310 0.7243 ENSG00000124098 FAM210B family with sequence similarity 210,
member B
DM00992 0.01340 2.6057 ENSG00000163982 OTOP1 otopetrin 1
DM00259 0.01370 4.1704 ENSG00000158552 ZFAND2B zinc finger, AN1-type domain 2B
DM09286 0.01410 1.7400 ENSG00000151726 ACSL1 acyl-CoA synthetase long-chain
family member 1
DM00547 0.01440 2.3924 ENSG00000178896 EXOSC4 exosome component 4
DM01392 0.01440 0.3464 ENSG00000133063 CHIT1 chitinase 1 (chitotriosidase)
DM04518 0.01440 3.6908 ENSG00000175567 UCP2 uncoupling protein 2 (mitochondrial,
proton carrier)
DM04572 0.01440 0.7092 ENSG00000126777 KTN1 kinectin 1 (kinesin receptor)
DM00569 0.01450 2.3902 ENSG00000065526 SPEN spen homolog, transcriptional
regulator (Drosophila)
DM03695 0.01470 2.7305 ENSG00000130856 ZNF236 zinc finger protein 236
DM09474 0.01500 1.5888 ENSG00000092295 TGM1 transglutaminase 1 (K polypeptide
epidermal type I, protein-glutamine-gamma-glutamyltransferase)
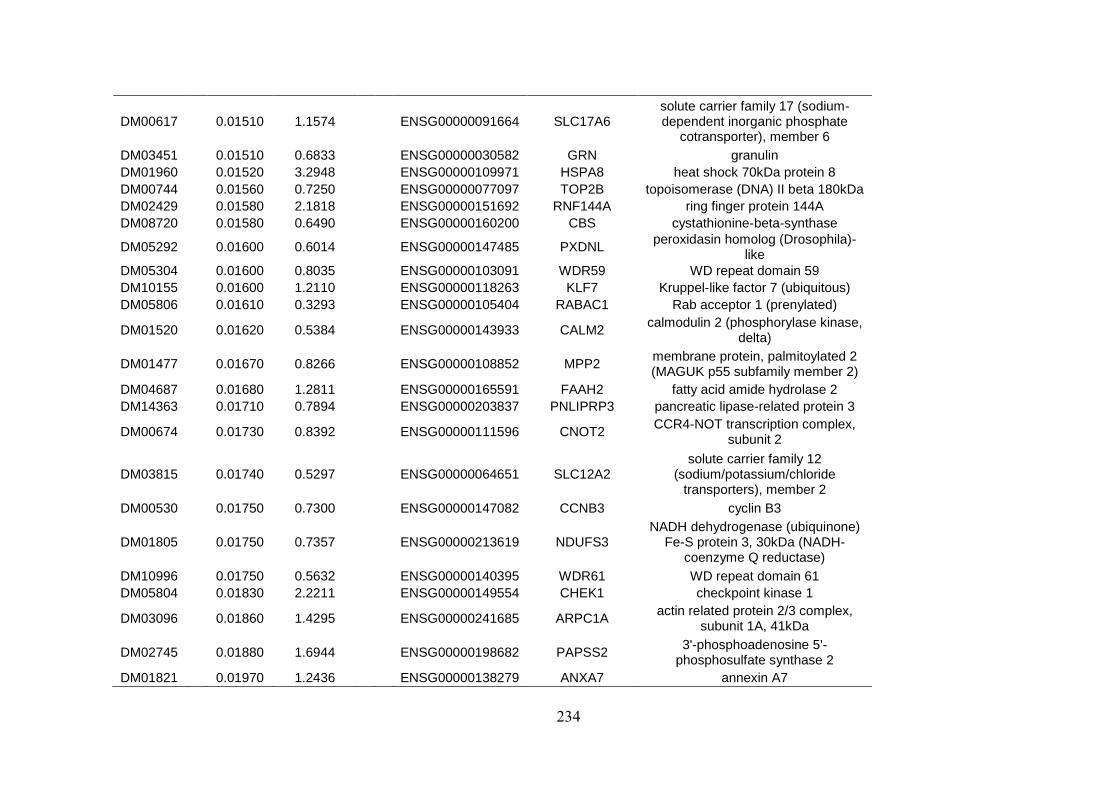
234
DM00617 0.01510 1.1574 ENSG00000091664 SLC17A6 solute carrier family 17 (sodium-dependent inorganic phosphate
cotransporter), member 6
DM03451 0.01510 0.6833 ENSG00000030582 GRN granulin
DM01960 0.01520 3.2948 ENSG00000109971 HSPA8 heat shock 70kDa protein 8
DM00744 0.01560 0.7250 ENSG00000077097 TOP2B topoisomerase (DNA) II beta 180kDa
DM02429 0.01580 2.1818 ENSG00000151692 RNF144A ring finger protein 144A
DM08720 0.01580 0.6490 ENSG00000160200 CBS cystathionine-beta-synthase
DM05292 0.01600 0.6014 ENSG00000147485 PXDNL peroxidasin homolog (Drosophila)-
like
DM05304 0.01600 0.8035 ENSG00000103091 WDR59 WD repeat domain 59
DM10155 0.01600 1.2110 ENSG00000118263 KLF7 Kruppel-like factor 7 (ubiquitous)
DM05806 0.01610 0.3293 ENSG00000105404 RABAC1 Rab acceptor 1 (prenylated)
DM01520 0.01620 0.5384 ENSG00000143933 CALM2 calmodulin 2 (phosphorylase kinase,
delta)
DM01477 0.01670 0.8266 ENSG00000108852 MPP2 membrane protein, palmitoylated 2 (MAGUK p55 subfamily member 2)
DM04687 0.01680 1.2811 ENSG00000165591 FAAH2 fatty acid amide hydrolase 2
DM14363 0.01710 0.7894 ENSG00000203837 PNLIPRP3 pancreatic lipase-related protein 3
DM00674 0.01730 0.8392 ENSG00000111596 CNOT2 CCR4-NOT transcription complex,
subunit 2
DM03815 0.01740 0.5297 ENSG00000064651 SLC12A2 solute carrier family 12
(sodium/potassium/chloride transporters), member 2
DM00530 0.01750 0.7300 ENSG00000147082 CCNB3 cyclin B3
DM01805 0.01750 0.7357 ENSG00000213619 NDUFS3 NADH dehydrogenase (ubiquinone)
Fe-S protein 3, 30kDa (NADH-coenzyme Q reductase)
DM10996 0.01750 0.5632 ENSG00000140395 WDR61 WD repeat domain 61
DM05804 0.01830 2.2211 ENSG00000149554 CHEK1 checkpoint kinase 1
DM03096 0.01860 1.4295 ENSG00000241685 ARPC1A actin related protein 2/3 complex,
subunit 1A, 41kDa
DM02745 0.01880 1.6944 ENSG00000198682 PAPSS2 3'-phosphoadenosine 5'-
phosphosulfate synthase 2
DM01821 0.01970 1.2436 ENSG00000138279 ANXA7 annexin A7
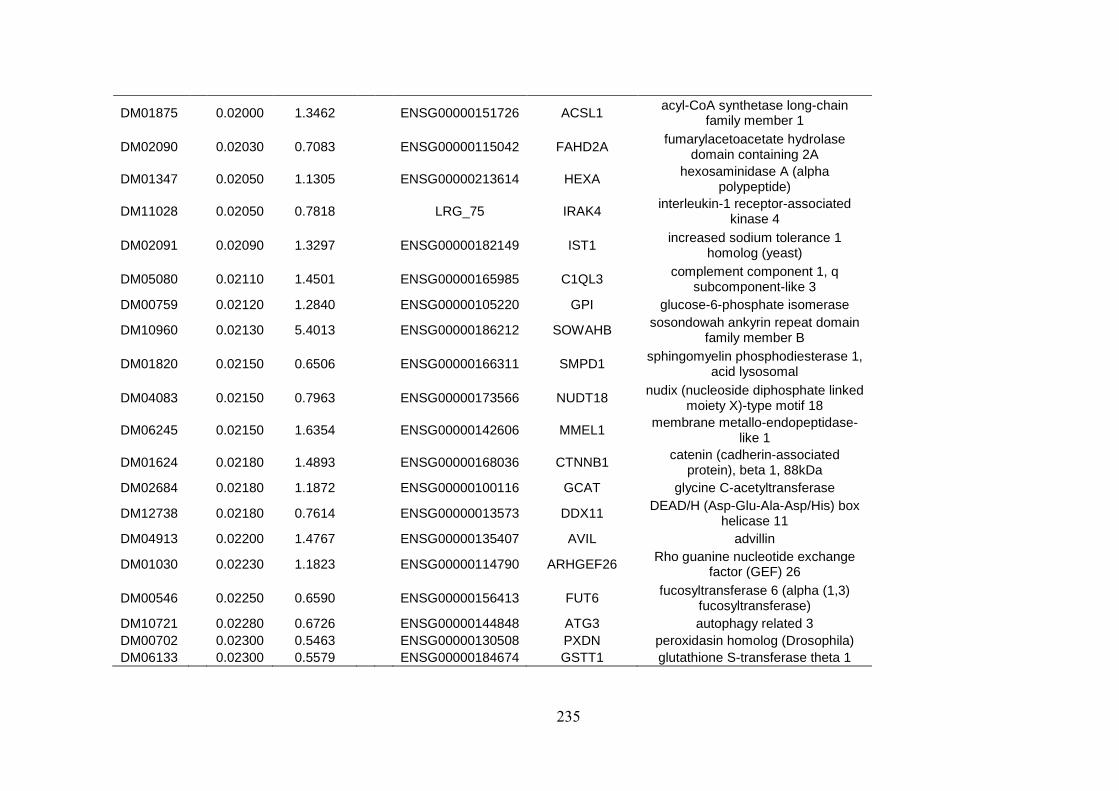
235
DM01875 0.02000 1.3462 ENSG00000151726 ACSL1 acyl-CoA synthetase long-chain
family member 1
DM02090 0.02030 0.7083 ENSG00000115042 FAHD2A fumarylacetoacetate hydrolase
domain containing 2A
DM01347 0.02050 1.1305 ENSG00000213614 HEXA hexosaminidase A (alpha
polypeptide)
DM11028 0.02050 0.7818 LRG_75 IRAK4 interleukin-1 receptor-associated
kinase 4
DM02091 0.02090 1.3297 ENSG00000182149 IST1 increased sodium tolerance 1
homolog (yeast)
DM05080 0.02110 1.4501 ENSG00000165985 C1QL3 complement component 1, q
subcomponent-like 3
DM00759 0.02120 1.2840 ENSG00000105220 GPI glucose-6-phosphate isomerase
DM10960 0.02130 5.4013 ENSG00000186212 SOWAHB sosondowah ankyrin repeat domain
family member B
DM01820 0.02150 0.6506 ENSG00000166311 SMPD1 sphingomyelin phosphodiesterase 1,
acid lysosomal
DM04083 0.02150 0.7963 ENSG00000173566 NUDT18 nudix (nucleoside diphosphate linked
moiety X)-type motif 18
DM06245 0.02150 1.6354 ENSG00000142606 MMEL1 membrane metallo-endopeptidase-
like 1
DM01624 0.02180 1.4893 ENSG00000168036 CTNNB1 catenin (cadherin-associated
protein), beta 1, 88kDa
DM02684 0.02180 1.1872 ENSG00000100116 GCAT glycine C-acetyltransferase
DM12738 0.02180 0.7614 ENSG00000013573 DDX11 DEAD/H (Asp-Glu-Ala-Asp/His) box
helicase 11
DM04913 0.02200 1.4767 ENSG00000135407 AVIL advillin
DM01030 0.02230 1.1823 ENSG00000114790 ARHGEF26 Rho guanine nucleotide exchange
factor (GEF) 26
DM00546 0.02250 0.6590 ENSG00000156413 FUT6 fucosyltransferase 6 (alpha (1,3)
fucosyltransferase)
DM10721 0.02280 0.6726 ENSG00000144848 ATG3 autophagy related 3
DM00702 0.02300 0.5463 ENSG00000130508 PXDN peroxidasin homolog (Drosophila)
DM06133 0.02300 0.5579 ENSG00000184674 GSTT1 glutathione S-transferase theta 1
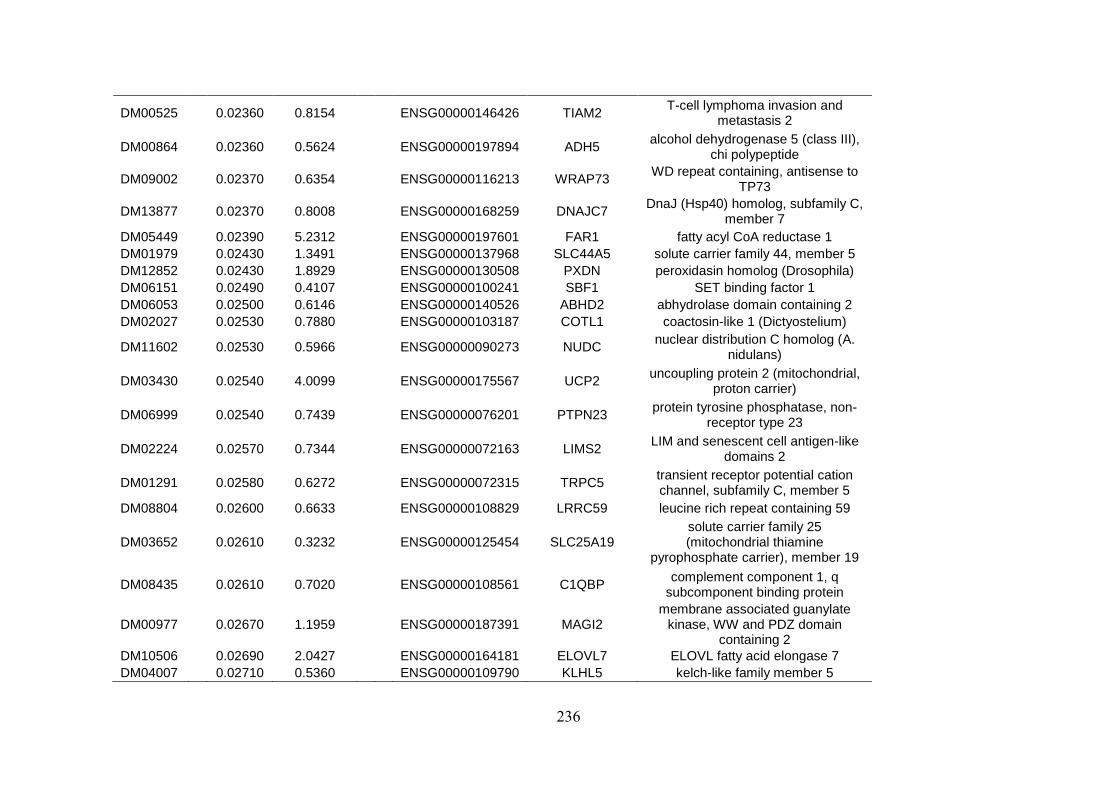
236
DM00525 0.02360 0.8154 ENSG00000146426 TIAM2 T-cell lymphoma invasion and
metastasis 2
DM00864 0.02360 0.5624 ENSG00000197894 ADH5 alcohol dehydrogenase 5 (class III),
chi polypeptide
DM09002 0.02370 0.6354 ENSG00000116213 WRAP73 WD repeat containing, antisense to
TP73
DM13877 0.02370 0.8008 ENSG00000168259 DNAJC7 DnaJ (Hsp40) homolog, subfamily C,
member 7
DM05449 0.02390 5.2312 ENSG00000197601 FAR1 fatty acyl CoA reductase 1
DM01979 0.02430 1.3491 ENSG00000137968 SLC44A5 solute carrier family 44, member 5
DM12852 0.02430 1.8929 ENSG00000130508 PXDN peroxidasin homolog (Drosophila)
DM06151 0.02490 0.4107 ENSG00000100241 SBF1 SET binding factor 1
DM06053 0.02500 0.6146 ENSG00000140526 ABHD2 abhydrolase domain containing 2
DM02027 0.02530 0.7880 ENSG00000103187 COTL1 coactosin-like 1 (Dictyostelium)
DM11602 0.02530 0.5966 ENSG00000090273 NUDC nuclear distribution C homolog (A.
nidulans)
DM03430 0.02540 4.0099 ENSG00000175567 UCP2 uncoupling protein 2 (mitochondrial,
proton carrier)
DM06999 0.02540 0.7439 ENSG00000076201 PTPN23 protein tyrosine phosphatase, non-
receptor type 23
DM02224 0.02570 0.7344 ENSG00000072163 LIMS2 LIM and senescent cell antigen-like
domains 2
DM01291 0.02580 0.6272 ENSG00000072315 TRPC5 transient receptor potential cation channel, subfamily C, member 5
DM08804 0.02600 0.6633 ENSG00000108829 LRRC59 leucine rich repeat containing 59
DM03652 0.02610 0.3232 ENSG00000125454 SLC25A19 solute carrier family 25 (mitochondrial thiamine
pyrophosphate carrier), member 19
DM08435 0.02610 0.7020 ENSG00000108561 C1QBP complement component 1, q
subcomponent binding protein
DM00977 0.02670 1.1959 ENSG00000187391 MAGI2 membrane associated guanylate
kinase, WW and PDZ domain containing 2
DM10506 0.02690 2.0427 ENSG00000164181 ELOVL7 ELOVL fatty acid elongase 7
DM04007 0.02710 0.5360 ENSG00000109790 KLHL5 kelch-like family member 5
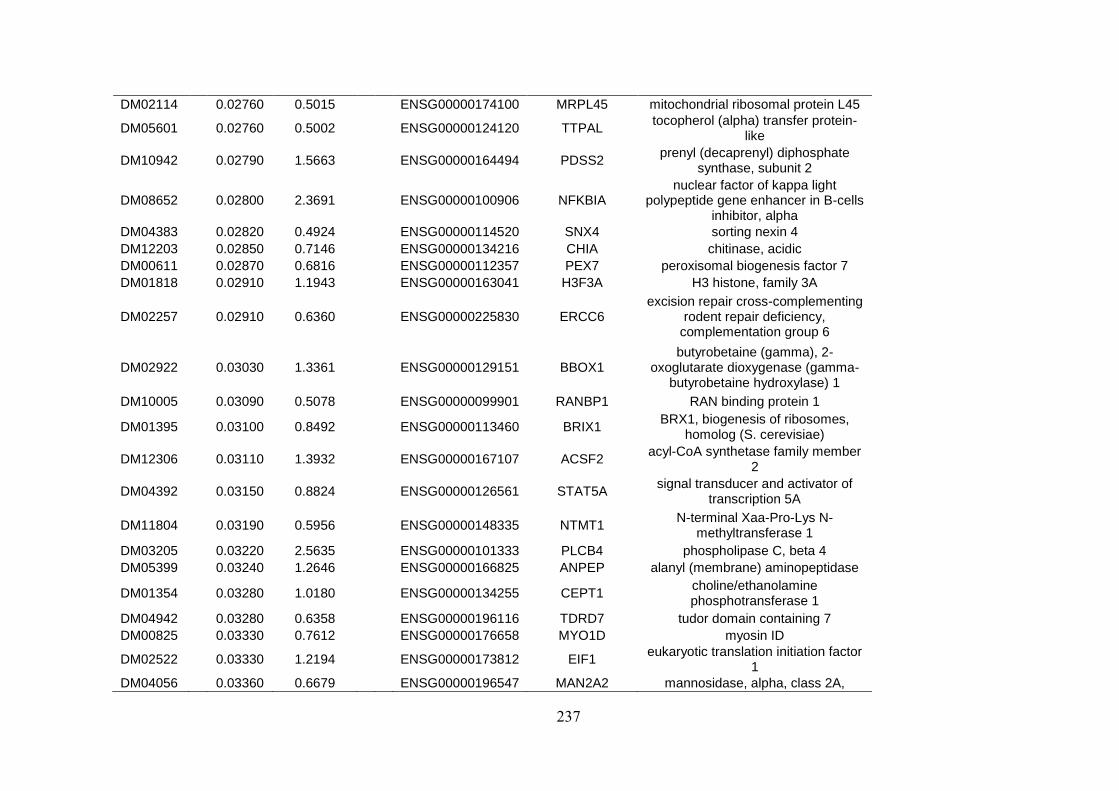
237
DM02114 0.02760 0.5015 ENSG00000174100 MRPL45 mitochondrial ribosomal protein L45
DM05601 0.02760 0.5002 ENSG00000124120 TTPAL tocopherol (alpha) transfer protein-
like
DM10942 0.02790 1.5663 ENSG00000164494 PDSS2 prenyl (decaprenyl) diphosphate
synthase, subunit 2
DM08652 0.02800 2.3691 ENSG00000100906 NFKBIA nuclear factor of kappa light
polypeptide gene enhancer in B-cells inhibitor, alpha
DM04383 0.02820 0.4924 ENSG00000114520 SNX4 sorting nexin 4
DM12203 0.02850 0.7146 ENSG00000134216 CHIA chitinase, acidic
DM00611 0.02870 0.6816 ENSG00000112357 PEX7 peroxisomal biogenesis factor 7
DM01818 0.02910 1.1943 ENSG00000163041 H3F3A H3 histone, family 3A
DM02257 0.02910 0.6360 ENSG00000225830 ERCC6 excision repair cross-complementing
rodent repair deficiency, complementation group 6
DM02922 0.03030 1.3361 ENSG00000129151 BBOX1 butyrobetaine (gamma), 2-
oxoglutarate dioxygenase (gamma-butyrobetaine hydroxylase) 1
DM10005 0.03090 0.5078 ENSG00000099901 RANBP1 RAN binding protein 1
DM01395 0.03100 0.8492 ENSG00000113460 BRIX1 BRX1, biogenesis of ribosomes,
homolog (S. cerevisiae)
DM12306 0.03110 1.3932 ENSG00000167107 ACSF2 acyl-CoA synthetase family member
2
DM04392 0.03150 0.8824 ENSG00000126561 STAT5A signal transducer and activator of
transcription 5A
DM11804 0.03190 0.5956 ENSG00000148335 NTMT1 N-terminal Xaa-Pro-Lys N-
methyltransferase 1
DM03205 0.03220 2.5635 ENSG00000101333 PLCB4 phospholipase C, beta 4
DM05399 0.03240 1.2646 ENSG00000166825 ANPEP alanyl (membrane) aminopeptidase
DM01354 0.03280 1.0180 ENSG00000134255 CEPT1 choline/ethanolamine phosphotransferase 1
DM04942 0.03280 0.6358 ENSG00000196116 TDRD7 tudor domain containing 7
DM00825 0.03330 0.7612 ENSG00000176658 MYO1D myosin ID
DM02522 0.03330 1.2194 ENSG00000173812 EIF1 eukaryotic translation initiation factor
1
DM04056 0.03360 0.6679 ENSG00000196547 MAN2A2 mannosidase, alpha, class 2A,
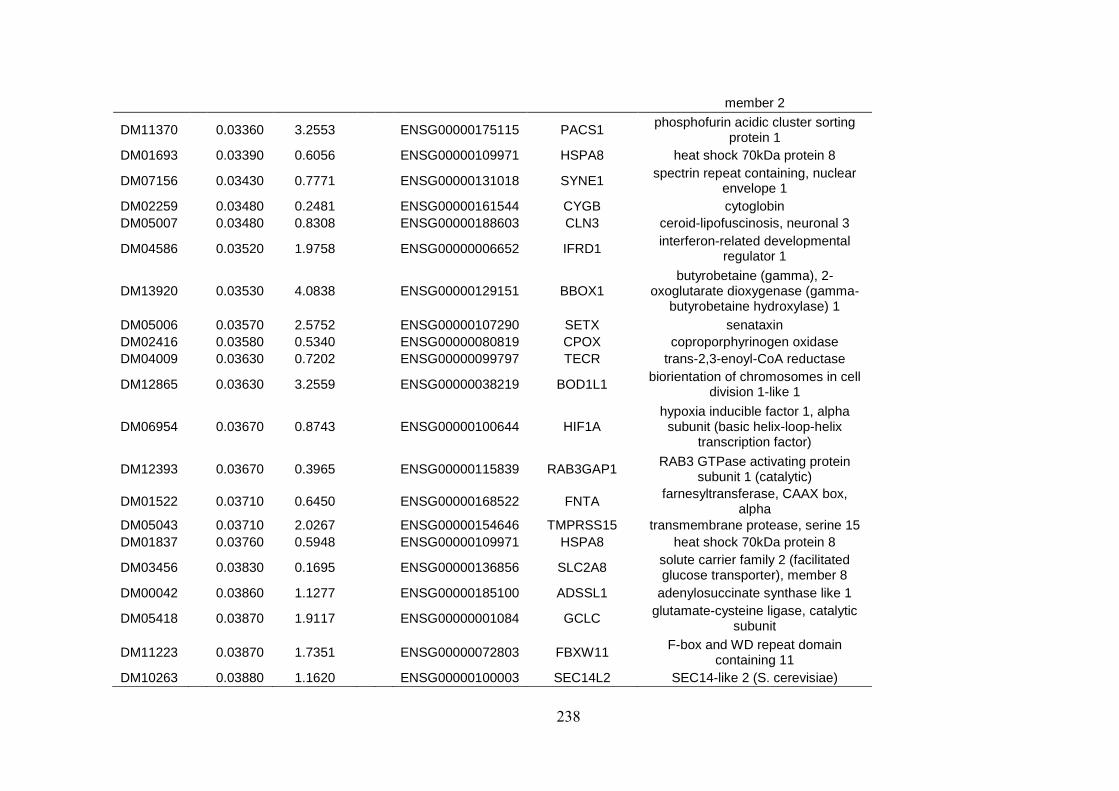
238
member 2
DM11370 0.03360 3.2553 ENSG00000175115 PACS1 phosphofurin acidic cluster sorting
protein 1
DM01693 0.03390 0.6056 ENSG00000109971 HSPA8 heat shock 70kDa protein 8
DM07156 0.03430 0.7771 ENSG00000131018 SYNE1 spectrin repeat containing, nuclear
envelope 1
DM02259 0.03480 0.2481 ENSG00000161544 CYGB cytoglobin
DM05007 0.03480 0.8308 ENSG00000188603 CLN3 ceroid-lipofuscinosis, neuronal 3
DM04586 0.03520 1.9758 ENSG00000006652 IFRD1 interferon-related developmental
regulator 1
DM13920 0.03530 4.0838 ENSG00000129151 BBOX1 butyrobetaine (gamma), 2-
oxoglutarate dioxygenase (gamma-butyrobetaine hydroxylase) 1
DM05006 0.03570 2.5752 ENSG00000107290 SETX senataxin
DM02416 0.03580 0.5340 ENSG00000080819 CPOX coproporphyrinogen oxidase
DM04009 0.03630 0.7202 ENSG00000099797 TECR trans-2,3-enoyl-CoA reductase
DM12865 0.03630 3.2559 ENSG00000038219 BOD1L1 biorientation of chromosomes in cell
division 1-like 1
DM06954 0.03670 0.8743 ENSG00000100644 HIF1A hypoxia inducible factor 1, alpha
subunit (basic helix-loop-helix transcription factor)
DM12393 0.03670 0.3965 ENSG00000115839 RAB3GAP1 RAB3 GTPase activating protein
subunit 1 (catalytic)
DM01522 0.03710 0.6450 ENSG00000168522 FNTA farnesyltransferase, CAAX box,
alpha
DM05043 0.03710 2.0267 ENSG00000154646 TMPRSS15 transmembrane protease, serine 15
DM01837 0.03760 0.5948 ENSG00000109971 HSPA8 heat shock 70kDa protein 8
DM03456 0.03830 0.1695 ENSG00000136856 SLC2A8 solute carrier family 2 (facilitated glucose transporter), member 8
DM00042 0.03860 1.1277 ENSG00000185100 ADSSL1 adenylosuccinate synthase like 1
DM05418 0.03870 1.9117 ENSG00000001084 GCLC glutamate-cysteine ligase, catalytic
subunit
DM11223 0.03870 1.7351 ENSG00000072803 FBXW11 F-box and WD repeat domain
containing 11
DM10263 0.03880 1.1620 ENSG00000100003 SEC14L2 SEC14-like 2 (S. cerevisiae)
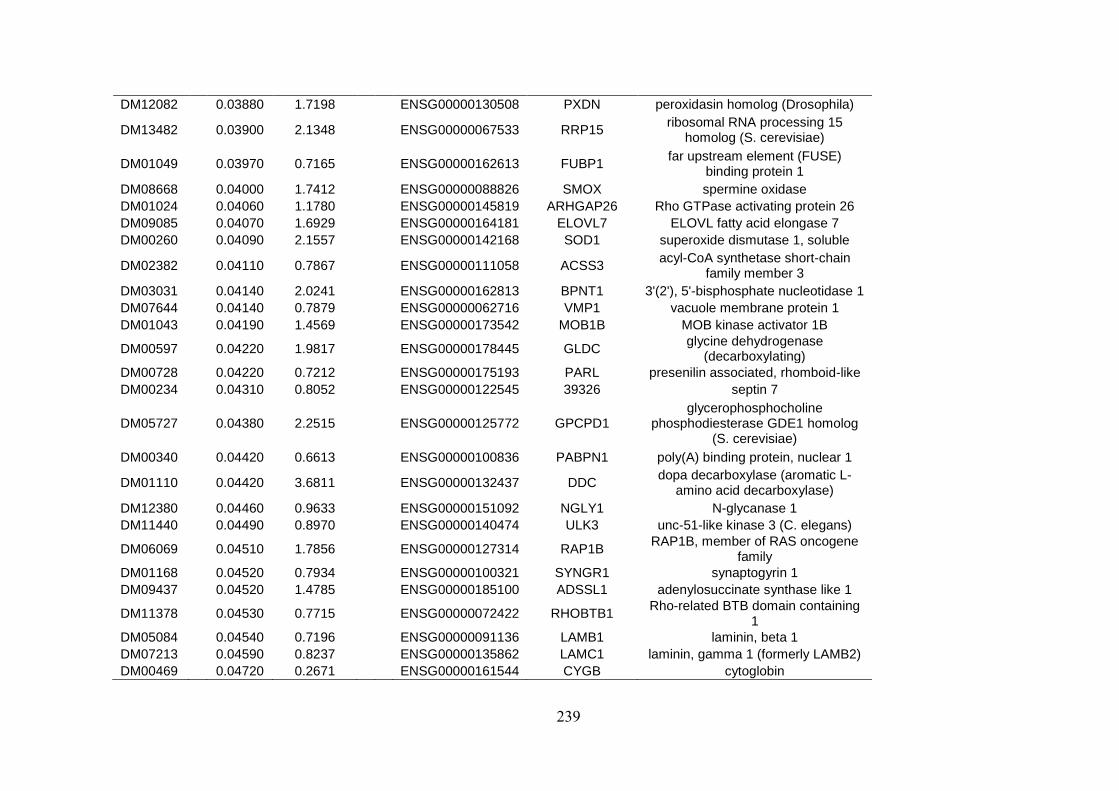
239
DM12082 0.03880 1.7198 ENSG00000130508 PXDN peroxidasin homolog (Drosophila)
DM13482 0.03900 2.1348 ENSG00000067533 RRP15 ribosomal RNA processing 15
homolog (S. cerevisiae)
DM01049 0.03970 0.7165 ENSG00000162613 FUBP1 far upstream element (FUSE)
binding protein 1
DM08668 0.04000 1.7412 ENSG00000088826 SMOX spermine oxidase
DM01024 0.04060 1.1780 ENSG00000145819 ARHGAP26 Rho GTPase activating protein 26
DM09085 0.04070 1.6929 ENSG00000164181 ELOVL7 ELOVL fatty acid elongase 7
DM00260 0.04090 2.1557 ENSG00000142168 SOD1 superoxide dismutase 1, soluble
DM02382 0.04110 0.7867 ENSG00000111058 ACSS3 acyl-CoA synthetase short-chain
family member 3
DM03031 0.04140 2.0241 ENSG00000162813 BPNT1 3'(2'), 5'-bisphosphate nucleotidase 1
DM07644 0.04140 0.7879 ENSG00000062716 VMP1 vacuole membrane protein 1
DM01043 0.04190 1.4569 ENSG00000173542 MOB1B MOB kinase activator 1B
DM00597 0.04220 1.9817 ENSG00000178445 GLDC glycine dehydrogenase
(decarboxylating)
DM00728 0.04220 0.7212 ENSG00000175193 PARL presenilin associated, rhomboid-like
DM00234 0.04310 0.8052 ENSG00000122545 39326 septin 7
DM05727 0.04380 2.2515 ENSG00000125772 GPCPD1 glycerophosphocholine
phosphodiesterase GDE1 homolog (S. cerevisiae)
DM00340 0.04420 0.6613 ENSG00000100836 PABPN1 poly(A) binding protein, nuclear 1
DM01110 0.04420 3.6811 ENSG00000132437 DDC dopa decarboxylase (aromatic L-
amino acid decarboxylase)
DM12380 0.04460 0.9633 ENSG00000151092 NGLY1 N-glycanase 1
DM11440 0.04490 0.8970 ENSG00000140474 ULK3 unc-51-like kinase 3 (C. elegans)
DM06069 0.04510 1.7856 ENSG00000127314 RAP1B RAP1B, member of RAS oncogene
family
DM01168 0.04520 0.7934 ENSG00000100321 SYNGR1 synaptogyrin 1
DM09437 0.04520 1.4785 ENSG00000185100 ADSSL1 adenylosuccinate synthase like 1
DM11378 0.04530 0.7715 ENSG00000072422 RHOBTB1 Rho-related BTB domain containing
1
DM05084 0.04540 0.7196 ENSG00000091136 LAMB1 laminin, beta 1
DM07213 0.04590 0.8237 ENSG00000135862 LAMC1 laminin, gamma 1 (formerly LAMB2)
DM00469 0.04720 0.2671 ENSG00000161544 CYGB cytoglobin

240
DM04850 0.04780 0.7455 ENSG00000116260 QSOX1 quiescin Q6 sulfhydryl oxidase 1
DM00780 0.04830 0.7994 ENSG00000120063 GNA13 guanine nucleotide binding protein
(G protein), alpha 13
DM00932 0.04880 0.7501 ENSG00000183044 ABAT 4-aminobutyrate aminotransferase
DM03407 0.04890 0.8409 ENSG00000104969 SGTA small glutamine-rich tetratricopeptide
repeat (TPR)-containing, alpha
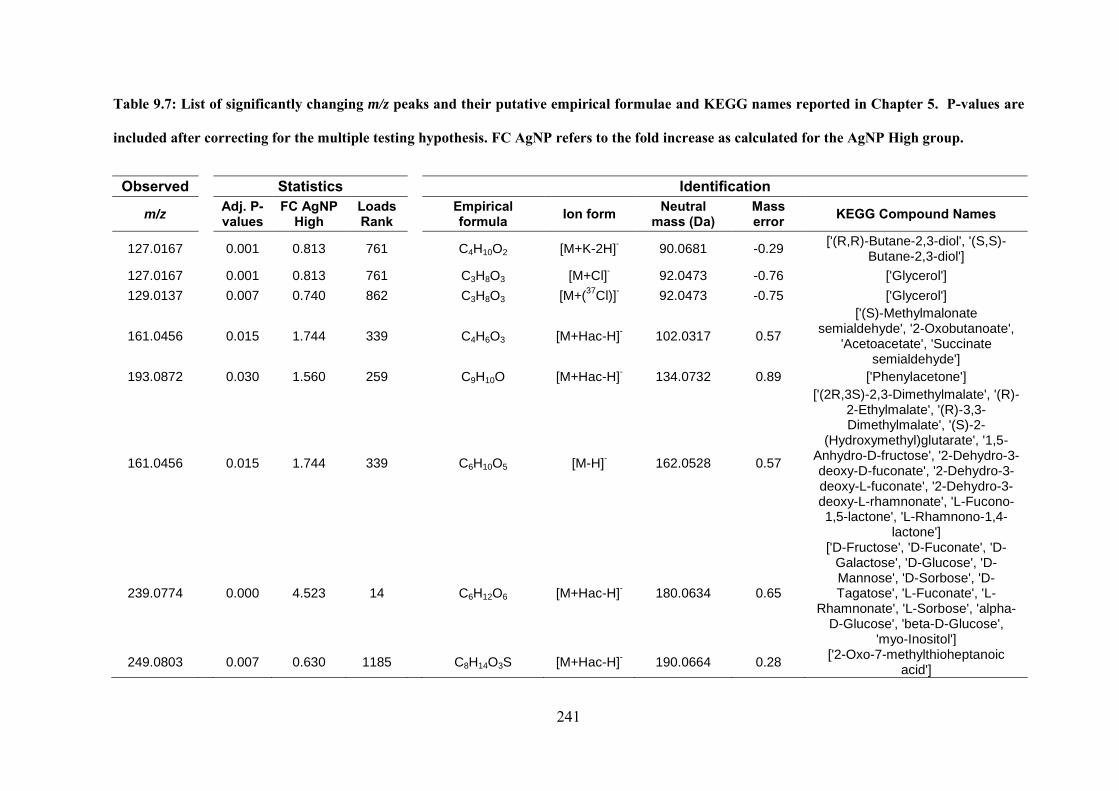
241
Table 9.7: List of significantly changing m/z peaks and their putative empirical formulae and KEGG names reported in Chapter 5. P-values are
included after correcting for the multiple testing hypothesis. FC AgNP refers to the fold increase as calculated for the AgNP High group.
Observed Statistics Identification m/z Adj. P-
values FC AgNP
High Loads Rank Empirical
formula Ion form Neutral mass (Da)
Mass error KEGG Compound Names
127.0167 0.001 0.813 761 C4H10O2 [M+K-2H]- 90.0681 -0.29
['(R,R)-Butane-2,3-diol', '(S,S)-Butane-2,3-diol']
127.0167 0.001 0.813 761 C3H8O3 [M+Cl]- 92.0473 -0.76 ['Glycerol']
129.0137 0.007 0.740 862 C3H8O3 [M+(37
Cl)]- 92.0473 -0.75 ['Glycerol']
161.0456 0.015 1.744 339 C4H6O3 [M+Hac-H]- 102.0317 0.57
['(S)-Methylmalonate semialdehyde', '2-Oxobutanoate',
'Acetoacetate', 'Succinate semialdehyde']
193.0872 0.030 1.560 259 C9H10O [M+Hac-H]- 134.0732 0.89 ['Phenylacetone']
161.0456 0.015 1.744 339 C6H10O5 [M-H]- 162.0528 0.57
['(2R,3S)-2,3-Dimethylmalate', '(R)-2-Ethylmalate', '(R)-3,3-Dimethylmalate', '(S)-2-
(Hydroxymethyl)glutarate', '1,5-Anhydro-D-fructose', '2-Dehydro-3-deoxy-D-fuconate', '2-Dehydro-3-deoxy-L-fuconate', '2-Dehydro-3-deoxy-L-rhamnonate', 'L-Fucono-1,5-lactone', 'L-Rhamnono-1,4-
lactone']
239.0774 0.000 4.523 14 C6H12O6 [M+Hac-H]- 180.0634 0.65
['D-Fructose', 'D-Fuconate', 'D-Galactose', 'D-Glucose', 'D-Mannose', 'D-Sorbose', 'D-Tagatose', 'L-Fuconate', 'L-
Rhamnonate', 'L-Sorbose', 'alpha-D-Glucose', 'beta-D-Glucose',
'myo-Inositol']
249.0803 0.007 0.630 1185 C8H14O3S [M+Hac-H]- 190.0664 0.28
['2-Oxo-7-methylthioheptanoic acid']
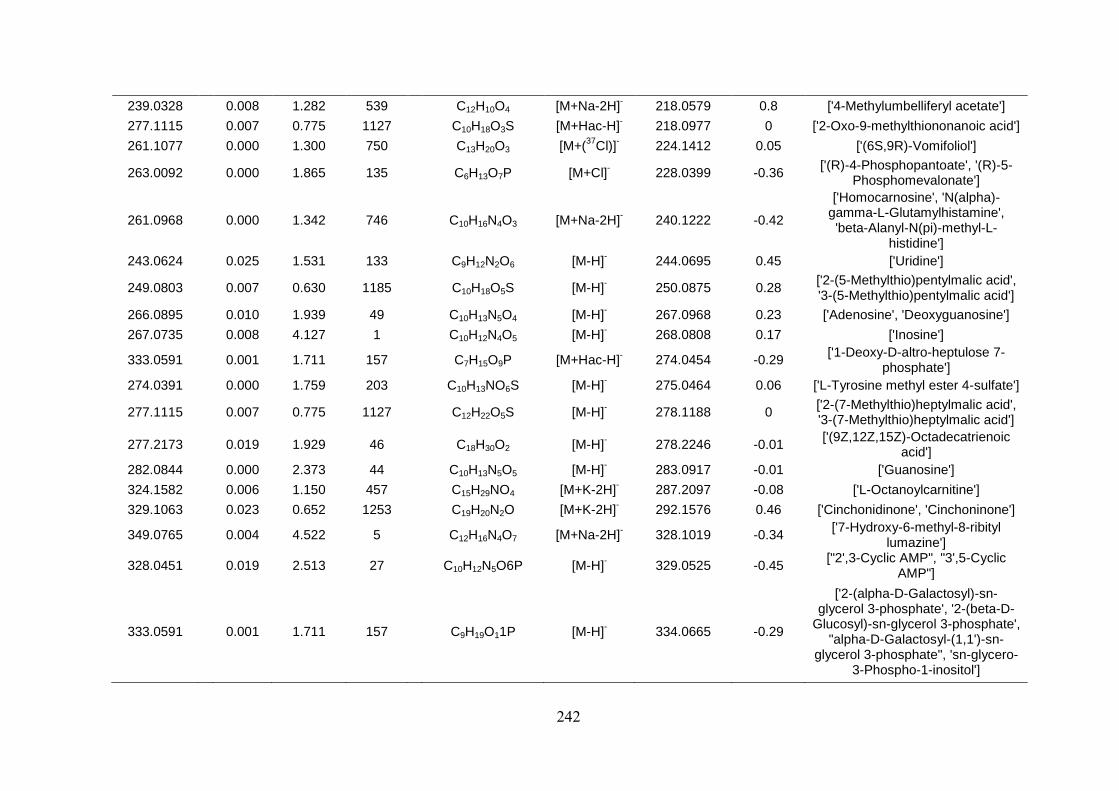
242
239.0328 0.008 1.282 539 C12H10O4 [M+Na-2H]- 218.0579 0.8 ['4-Methylumbelliferyl acetate']
277.1115 0.007 0.775 1127 C10H18O3S [M+Hac-H]- 218.0977 0 ['2-Oxo-9-methylthiononanoic acid']
261.1077 0.000 1.300 750 C13H20O3 [M+(37
Cl)]- 224.1412 0.05 ['(6S,9R)-Vomifoliol']
263.0092 0.000 1.865 135 C6H13O7P [M+Cl]- 228.0399 -0.36
['(R)-4-Phosphopantoate', '(R)-5-Phosphomevalonate']
261.0968 0.000 1.342 746 C10H16N4O3 [M+Na-2H]- 240.1222 -0.42
['Homocarnosine', 'N(alpha)-gamma-L-Glutamylhistamine', 'beta-Alanyl-N(pi)-methyl-L-
histidine']
243.0624 0.025 1.531 133 C9H12N2O6 [M-H]- 244.0695 0.45 ['Uridine']
249.0803 0.007 0.630 1185 C10H18O5S [M-H]- 250.0875 0.28
['2-(5-Methylthio)pentylmalic acid', '3-(5-Methylthio)pentylmalic acid']
266.0895 0.010 1.939 49 C10H13N5O4 [M-H]- 267.0968 0.23 ['Adenosine', 'Deoxyguanosine']
267.0735 0.008 4.127 1 C10H12N4O5 [M-H]- 268.0808 0.17 ['Inosine']
333.0591 0.001 1.711 157 C7H15O9P [M+Hac-H]- 274.0454 -0.29
['1-Deoxy-D-altro-heptulose 7-phosphate']
274.0391 0.000 1.759 203 C10H13NO6S [M-H]- 275.0464 0.06 ['L-Tyrosine methyl ester 4-sulfate']
277.1115 0.007 0.775 1127 C12H22O5S [M-H]- 278.1188 0
['2-(7-Methylthio)heptylmalic acid', '3-(7-Methylthio)heptylmalic acid']
277.2173 0.019 1.929 46 C18H30O2 [M-H]- 278.2246 -0.01
['(9Z,12Z,15Z)-Octadecatrienoic acid']
282.0844 0.000 2.373 44 C10H13N5O5 [M-H]- 283.0917 -0.01 ['Guanosine']
324.1582 0.006 1.150 457 C15H29NO4 [M+K-2H]- 287.2097 -0.08 ['L-Octanoylcarnitine']
329.1063 0.023 0.652 1253 C19H20N2O [M+K-2H]- 292.1576 0.46 ['Cinchonidinone', 'Cinchoninone']
349.0765 0.004 4.522 5 C12H16N4O7 [M+Na-2H]- 328.1019 -0.34
['7-Hydroxy-6-methyl-8-ribityl lumazine']
328.0451 0.019 2.513 27 C10H12N5O6P [M-H]- 329.0525 -0.45
["2',3-Cyclic AMP", "3',5-Cyclic AMP"]
333.0591 0.001 1.711 157 C9H19O11P [M-H]- 334.0665 -0.29
['2-(alpha-D-Galactosyl)-sn-glycerol 3-phosphate', '2-(beta-D-
Glucosyl)-sn-glycerol 3-phosphate', "alpha-D-Galactosyl-(1,1')-sn-
glycerol 3-phosphate", 'sn-glycero-3-Phospho-1-inositol']
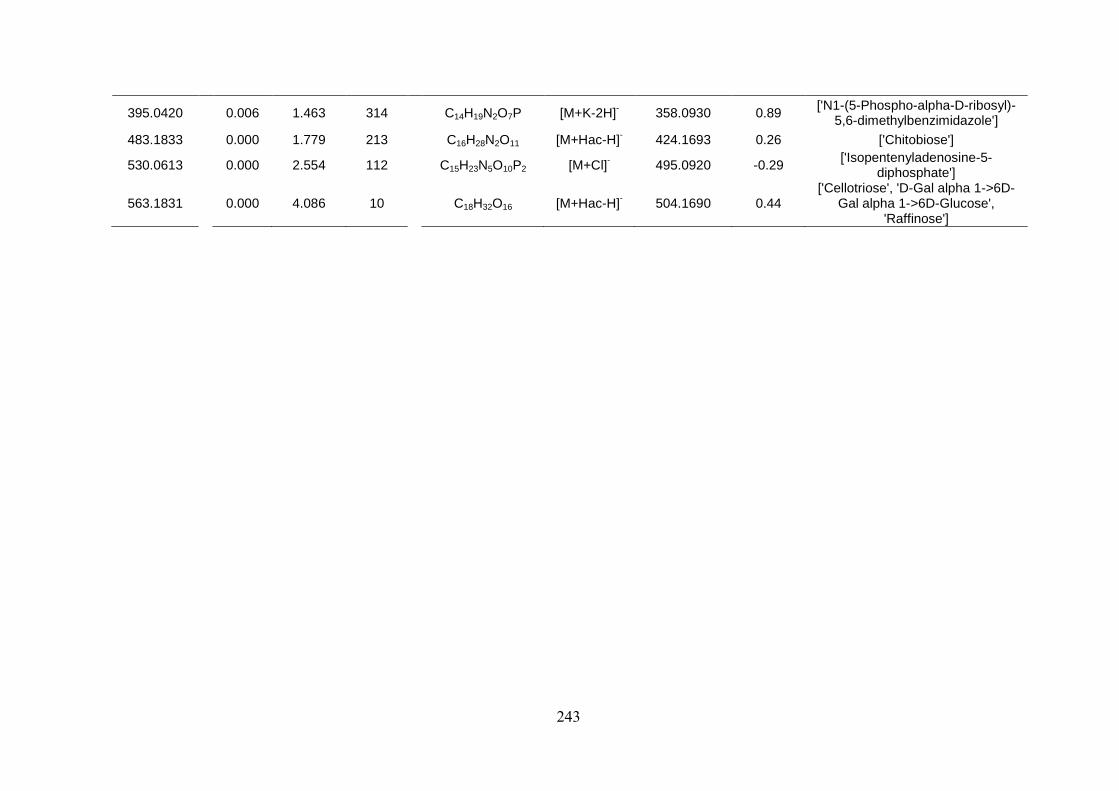
243
395.0420 0.006 1.463 314 C14H19N2O7P [M+K-2H]- 358.0930 0.89
['N1-(5-Phospho-alpha-D-ribosyl)-5,6-dimethylbenzimidazole']
483.1833 0.000 1.779 213 C16H28N2O11 [M+Hac-H]- 424.1693 0.26 ['Chitobiose']
530.0613 0.000 2.554 112 C15H23N5O10P2 [M+Cl]- 495.0920 -0.29
['Isopentenyladenosine-5-diphosphate']
563.1831 0.000 4.086 10 C18H32O16 [M+Hac-H]- 504.1690 0.44
['Cellotriose', 'D-Gal alpha 1->6D-Gal alpha 1->6D-Glucose',
'Raffinose']