Embed Size (px)
Citation preview

A dissertation submitted to the Faculty of Health Sciences, School of Clinical
Medicine
Department of Internal Medicine, University of The Witwatersrand,
Johannesburg in fulfilment of the
Degree of Masters of Science in Medicine
Johannesburg 2015
Student: Thandiwe Msibi
Supervisor : Dr Clement Penny
The effects of inhibiting the Notch signalling pathway in triple negative
breast cancer cell lines

ii
DECLARATION
I declare that this dissertation is my own, unaided work. It is being submitted for the
degree of Master of Science in Medicine, to the University of the Witwatersrand,
Johannesburg. It has not been submitted before for any degree or examination at any other
university.
Student signature:
On the day of 2015

iii
DEDICATION
“FOR MY MOTHER GALLINAH CAROLINE MSIBI”

iv
Publications and presentations arising from dissertation
T.Msibi., P.Ruff., C.Penny., Investigating the Notch signalling pathway in Triple
Negative Breast Cancer. Poster presentation at MBRT conference held at the
University of the Witwatersrand Johannesburg 4th
December 2013.
T.Msibi., P.Ruff., C.Penny., Notch signal pathway in Triple Negative Breast
Cancer. Poster presentation at the Faculty of science research day symposium held
at the University of the Witwatersrand Johannesburg 17th
September 2014
T.Msibi., P.Ruff., C.Penny., Notch signalling pathway in Triple Negative Breast
Cancer. Poster presentation at MBRT conference held at the University of the
Witwatersrand Johannesburg 4th
December 2014.

v
ABSTRACT
The molecular pathology of triple negative breast cancer (TNBC) is poorly understood,
consequently, no successful forms of therapy have been developed. Thus an improvement
of knowledge and subsequently the discovery of novel treatments for the disease are
imperative. It has been found that deregulation of the Notch signalling pathway promotes
tumourigenesis in breast tissue. Therefore, it was of interest here to investigate whether the
Notch signalling pathway is deregulated in TNBC and whether its abrogation affects the
proliferation and migration of TNBC cell lines. The normal growth characteristics of
MCF-7 cells (hormone sensitive) were compared to those of MDA-MB-231 and MDA-
MB-436 (both hormone insensitive) cell lines and were determined by real-time cell
impedance assays, using the ―xCELLigence‖ instrument. Thereafter, cells were treated
with gamma secretase inhibitors (GSI) of the Notch signalling pathway. The MCF-7 cell
line proliferated faster than the MDA-MB-231 and MDA-MB-436 cell lines. The
proliferation of the MDA-MB-231 and MDA-MB-436 cell lines decreased significantly
following treatment with inhibitors. Confocal microscopy was used to assess levels of the
Notch intracellular component (a gamma secretase cleavage product) and E-cadherin (a
breast tumour suppressor marker), pre- and post- treatment. Prior to drug treatments,
confocal microscopy showed that the Notch intracellular component was highly expressed
in the MDA-MB-231 cell line, and it was low in the MDA-MB-436 cell line, compared to
the MCF-7 cell line. Following drug treatments, confocal microscopy showed a decreased
expression of the Notch intracellular component in all three cell lines. Prior to drug
treatment only the MCF-7 cell line expressed E-cadherin which was reduced post
treatment. Subsequently the cell migration assays revealed that migration is reduced post-

vi
drug treatment in all three cell lines, despite no statistical significance. Overall the MDA-
MB-231 and MDA-MB-436 cell lines were more significantly sensitive to the gamma
secretase inhibitors compared to the MCF-7 cell lines. Therefore these observations
suggest that the Notch signalling pathway is a plausible novel therapeutic target in the
treatment of TNBC.

vii
ACKNOWLEDGEMENTS
I would like to thank the following groups and persons who made this work possible.
To my supervisor Dr Clement Penny, for your encouragement and advising me throughout
the duration of this project, I will always be grateful for the opportunity you gave me.
Being in your lab was an experience of a lifetime. God bless you.
To the head of the Research lab Dr Raquel Duarte, for being there for me when I needed
someone the most, you were like a lab mother and I will pray that God blesses you thrice
more than you have blessed me.
To my labmates/friends (in alphabetical order):
Aadilah Omar, Alex Kasembeli, Andrea Papadoupalous, Brenda Milner, Ezio Fok,
Kiashanee Moodley, Lerato Mpye, Natasia Kruger, Nicole Crawford, and Therese Dix
Peek. You guys were the best lab group I have ever been in; I appreciated and still
appreciate the love and support I received from you guys. Thank you for all the help you
each gave me in the lab and with other things. I will miss you all.

viii
To the Department of Anatomy:
Ms Pamela Sharp, Ms Hasiena Ali, Ms Tanya Augustine and their students. Thank you for
allowing me to use your facilities and giving me advice on my work.
To the following funding agencies:
Mintek Dr Raymond Hewer who provided NRF sourced funding
Faculty Research Committee, Faculty of Health Sciences, University of the
Witwatersrand
Postgraduate Merit Scholarship, University of the Witwatersrand
To my siblings Fakazi and Mlungisi you two are the best brothers a sister could ever wish
for. I pray that you go as far as you can with your dreams. To the rest of my family, thank
you for always believing me in me and keeping me in your prayers.
―Follow your Bliss and the Universe will open doors for you where there were only walls‖-
Joseph Campbell (1904-1987)

ix
TABLE OF CONTENTS
DECLARATION ............................................................................................................................................. II
DEDICATION .............................................................................................................................................. III
PUBLICATIONS AND PRESENTATIONS ARISING FROM DISSERTATION ........................................................ IV
ABSTRACT ................................................................................................................................................... V
ACKNOWLEDGEMENTS ............................................................................................................................. VII
LIST OF FIGURES .......................................................................................................................................... XVI
LIST OF TABLES ............................................................................................................................................. XX
LIST OF ABBREVIATIONS ............................................................................................................................. XXIII
CHAPTER 1: INTRODUCTION ....................................................................................................................... 1
1.1 REVIEW OF LITERATURE ................................................................................................................................. 1
1.1.1 Breast cancer statistics and classification ........................................................................................ 1
1.1.2 What is Triple negative breast cancer? ............................................................................................ 3
1.1.2.1 The difference between the Basal-like breast cancer and Triple negative breast cancer ......................... 3
1.1.2.2 Molecular classification of Triple negative breast cancer .......................................................................... 4
1.1.2.3 Epidemiology and risk factors for Triple negative breast cancer ............................................................... 8
1.1.2.3.1 Racial disparities ................................................................................................................................ 8

x
1.1.2.3.2 Genetic risk factors ............................................................................................................................ 9
1.1.2.3.3 Reproductive risk factors ................................................................................................................. 10
1.1.2.3.4 Anthropometric risk factors ............................................................................................................. 11
1.1.2.3.5 Socioeconomic status risk factors .................................................................................................... 13
1.1.3 Current and novel treatment options ............................................................................................ 14
1.1.4 The Notch signalling pathway ....................................................................................................... 17
1.1.4.1 The structure of the Notch receptors and their ligands .......................................................................... 18
1.1.4.1.1 Notch receptors ............................................................................................................................... 18
1.1.4.1.2 Notch ligands ................................................................................................................................... 19
1.1.4.1.3 Notch signal transduction ................................................................................................................ 22
1.1.5 Notch signalling in breast cancer ................................................................................................... 25
1.1.6 Strategies to target Notch signal pathway in Triple negative breast cancer ................................. 28
1.1.6.1 Notch1 and Delta-like 4 monoclonal antibodies ...................................................................................... 29
1.1.6.2 Notch-1 siRNA .......................................................................................................................................... 30
1.1.6.3 ƴ-Secretase inhibitors .............................................................................................................................. 31
1.2 EXPERIMENTAL APPROACH AND RATIONALE ..................................................................................................... 34
1.2.1 Experimental approach .................................................................................................................. 34
1.2.1.1 Notch pathway inhibition ........................................................................................................................ 34

xi
1.2.1.2 Cellular proliferation and viability ........................................................................................................... 35
1.2.1.3 Evaluating cell morphology and migration .............................................................................................. 40
1.2.2 Rationale ........................................................................................................................................ 41
1.2.2.1 Aims and objectives ................................................................................................................................. 42
1.2.2.1.1 Aim ................................................................................................................................................... 42
1.2.2.1.2 Objectives ........................................................................................................................................ 42
CHAPTER 2: MATERIALS AND METHODS ................................................................................................... 43
2.1 MAMMALIAN CELL LINES AND CELL CULTURE MAINTENANCE ............................................................................... 44
2.1.1 Cell lines ......................................................................................................................................... 44
2.1.2 Cell culture maintenance ............................................................................................................... 45
2.2 ANALYSIS OF CELLULAR PROLIFERATION ........................................................................................................... 46
2.2.1 Normal growth curve profiling ....................................................................................................... 46
2.2.2 Cell viability and proliferation assays ............................................................................................ 47
2.2.2.1 xCelligence-proliferation and viability assay ............................................................................................ 47
2.2.2.2 Trypan blue exclusion cell viability assay ................................................................................................. 48
2.3 CONFOCAL IMMUNOFLUORESCENCE MICROSCOPY ............................................................................................ 49
2.3.1 Immunofluorescence staining ........................................................................................................ 51
2.3.1.1 Cell preparation ....................................................................................................................................... 51

xii
2.3.1.2 Primary and Secondary antibody staining ............................................................................................... 52
2.3.1.3 Nuclear staining ....................................................................................................................................... 52
2.3.1.4 Z-sectioning and 3 dimensional reconstruction analysis ......................................................................... 53
2.4 CELL MIGRATION STUDY ............................................................................................................................... 53
2.4.1 Cell migration assay ....................................................................................................................... 54
2.5 DATA ANALYSIS .......................................................................................................................................... 55
CHAPTER 3: RESULTS................................................................................................................................. 56
3.1 DETERMINATION OF THE ACTIVITY OF NOTCH AND THE EFFECT OF GAMMA SECRETASE INHIBITION .............................. 56
3.1.1 Notch signalling is active in breast cancer cells and NIC expression decreases post- inhibitor
treatment ................................................................................................................................................ 56
3.2 EFFECT OF NOTCH ON BREAST CANCER CELLS ................................................................................................... 59
3.2.1 Oestrogen receptor positive cells grow more rapidly compared to TNBC cell lines ....................... 59
3.2.2 Notch signal pathway inhibition decreases cell proliferation and viability in breast cancer cells . 61
3.2.2.1 Trypan blue assay cell viability ................................................................................................................. 61
3.2.2.2 xCelligence-RTCA cell proliferation and viability ..................................................................................... 64
3.3 EFFECT ON CELL MORPHOLOGY AND CELL MIGRATION ........................................................................................ 68
3.3.1 Notch inhibition decreases expression of E-cadherin in MCF-7 cells and alters cell morphology in
MDA-MB-231 and MDA-MB-436 cell lines. ............................................................................................ 68

xiii
3.3.1.1 The expression of E-cadherin in human breast cancer cells .................................................................... 68
3.3.1.2 The morphology of human breast cancer cells ........................................................................................ 69
3.3.2 Notch inhibition does not affect cell migration in BC cell lines. .................................................... 75
CHAPTER 4: DISCUSSION ........................................................................................................................... 82
4.1 NOTCH EXPRESSION AND ACTIVITY ................................................................................................................. 82
4.2 THE CELLULAR GROWTH, PROLIFERATION AND VIABILITY OF HUMAN BREAST CANCER CELLS ....................................... 84
4.2.1 Classical end-point assay versus real-time cell analysis assay ....................................................... 86
4.3 NOTCH AND CELL MIGRATION AND MORPHOLOGY ............................................................................................. 86
4.4 CONCLUSION ............................................................................................................................................. 88
CHAPTER 5: PERSPECTIVES AND FUTURE WORK ....................................................................................... 90
5.1 PROPOSED APPROACH FOR FUTURE WORK ....................................................................................................... 90
CHAPTER 6: REFERENCES .......................................................................................................................... 92
6.1. JOURNAL ARTICLES ............................................................................................................................ 92
6.2 E-REFERENCES ..................................................................................................................................... 112
APPENDIX A: PROTOCOLS ....................................................................................................................... 113
A.1 PREPARATION OF SOLUTIONS AND REAGENTS ................................................................................................. 113
A.1.1 1X Phosphate Buffered Solution (PBS) ......................................................................................... 113

xiv
A.1.2 Blocking buffer ............................................................................................................................. 113
A.1.3 Fixing Solution/Buffer .................................................................................................................. 113
A.1.4 Permeabilisation solution/Buffer ................................................................................................. 113
A.1.5 F-actin cytoskeleton staining solution ......................................................................................... 113
A.1.6 Nuclear stain ................................................................................................................................ 114
A.1.7 Cell culture media ........................................................................................................................ 114
A.1.8 Freezing media and thawing media ............................................................................................ 115
A.2 PHARMACOLOGICAL INHIBITOR CONCENTRATION CALCULATIONS ....................................................................... 115
A.2.1 DAPT stock solution ..................................................................................................................... 115
A.2.2 DBZ stock solution ....................................................................................................................... 116
APPENDIX B: CELL CULTURE MAINTENANCE AND ETHICS ....................................................................... 117
B.1 CELL SUB-CULTURE ................................................................................................................................... 117
B.2 CELL FREEZING ........................................................................................................................................ 117
B.3 CELL THAWING ........................................................................................................................................ 118
B.4 CELL COUNTING ....................................................................................................................................... 118
B.5 ETHIC WAIVER ......................................................................................................................................... 119
APPENDIX C: CELL GROWTH, PROLIFERATION AND VIABILITY RAW DATA .............................................. 121

xv
C.1 NORMAL GROWTH PROFILE CELL NUMBER OPTIMISATION ................................................................................. 121
C.2 TRYPAN BLUE ASSAY AND CELL VIABILITY DRUG CONCENTRATION OPTIMISATION ................................................... 123
C.2.2 Trypan Blue viability assay ........................................................................................................... 123
C.2.3 Cell proliferation raw data ........................................................................................................... 125
APPENDIX D: INDIRECT IMMUNOFLUORESCENCE ................................................................................... 127
D.1 NEGATIVE CONTROLS FOR THE NOTCH-1 INTRACELLULAR COMPONENT SIGNALLING EXPRESSION AND LOCALISATION ... 127
D.2 Negative controls for the expression and localisation of E-cadherin ............................................. 134
D.3 MCF-7 cell line E-cadherin expression ............................................................................................ 140
APPENDIX E: SCRATCH/MIGRATION ASSAY ANALYSIS ............................................................................ 141
E.1 CALCULATIONS OF CELL MIGRATION ............................................................................................................. 141
E.2 RAW DATA FOR GAP CLOSURE PLOTS ............................................................................................................ 143
APPENDIX F: STATISTICAL ANALYSES AND TURN-IT-IN REPORT .............................................................. 147

xvi
LIST OF FIGURES
1.1 Summary of the two different methodological approaches applied to sub-
classify TNBC.
7
1.2 Schematic representation of a TNBC tumour; the current challenge in its
treatment and management.
16
1.3 Diagrammatic representations of the Notch receptor and Notch-ligand. 21
1.4 A Schematic representation of the Notch pathway. 24
1.5 Potential Therapeutic targets for Notch in Triple negative Breast cancer. 33
1.6 A diagrammatic representation of the cell-electrode interaction in an E-
plate.
37
1.7 Schematic diagrams showing the difference between classical endpoint
assay and the xCELLigence RTCA technology.
39
2.1 Flow diagram representation of methodology applied in this study. 43
2.2 Principal of the confocal laser microscope 50
3.1 Notch signalling is active in breast cancer cells and its expression decreases
post inhibitor treatment
58
3.2 Normal cell growth profile of hormone receptor positive cell line (MCF-7)
compared to hormone receptor negative positive cell line (MDA-MB-231
and MDA-MB-436).
60
3.3 TB assay cell viability of breast cancer cells. 63
3.4 GSI treatment inhibits cell proliferation of MCF-7 breast cancer cell lines. 65
3.5 GSI treatment inhibits cell proliferation of MDA-MB-231 breast cancer cell
lines.
66

xvii
3.6 GSI treatment inhibits cell proliferation of MDA-MB-436 breast cancer cell
line.
67
3.7.a Effects of Notch inhibition on the expression of E-cadherin and cell
morphology in permeabilised cells.
71
3.7.b 3D projection, generated from Z-sectioning; Zeiss LSM 780 permeabilised
cells.
72
3.8.a Effects of Notch inhibition on the expression of E-cadherin and cell
morphology in non-permeabilised cells.
73
3.8.b 3D projection, generated from Z-sectioning; Zeiss LSM 780 non-
permeabilised
74
3.9.a Notch inhibition does not affect cell migration in MCF-7 cell line 76
3.9.b A plot representing the gap closure in Notch inhibited MCF7 cells. 77
3.10.a Notch inhibition does not affect cell migration in MDA-MB-231 cell line. 78
3.10.b A plot representing the gap closure in Notch inhibited MDA-MB-231 cells. 79
3.11.a Notch inhibition does not affect cell migration in MDA-MB-436 cell line. 80
3.11.b A plot representing the gap closure in Notch inhibited MDA-MB-436 cells 81
5.1 Diagram representing the methodology for future work. 91
C.1 Optimising cell seeding density of MCF-7 cell line 121
C.2 Optimising cell seeding density of MDA-MB-231cell line. 122
C.3 Optimising cell seeding density of MDA-MB-436 cell line 122
C.4 Real-time cell proliferation and viability of the MCF-7 cell line over 88
hours.
125
C.5 Real-time cell proliferation and viability of the MD-MB-231 cell line over 125
xviii
200 hours.
C.6 Real-time cell proliferation and viability of the MDA-MB-231 cell line over
119 hours.
126
D.1.a Negative controls of MCF-7 cell line in confocal microscopy. 128
D.1.b Negative controls of MCF-7 cell line in confocal microscopy. 129
D.2.a Negative controls of MDA-MB-231cell line in confocal microscopy. 130
D.2.b Negative controls of MDA-MB-231cell line in confocal microscopy. 131
D.3.a Negative controls of MDA-MB-436 cell line in confocal microscopy. 132
D.3.b Negative controls of MDA-MB-436 cell line in confocal microscopy. 133
D.4.a E-cadherin negative controls of MCF-7cell line in confocal microscopy. 134
D.4.b E-cadherin negative controls of MCF-7cell line in confocal microscopy. 135
D.5.a E-cadherin negative controls of MDA-MB-231cell line in confocal
microscopy.
136
D.5.b E-cadherin negative controls of MDA-MB-231cell line in confocal
microscopy.
137
D.6.a E-cadherin negative controls of MDA-MB-436 cell line in confocal
microscopy.
138
D.6.b E-cadherin negative controls of MDA-MB-436 cell line in confocal
microscopy.
139
D.7 The E-cadherin expression and localisation in MCF-7 cell line. 140
E.1 Scratch image analyses. 141
E.2 Scratch image analyses 142
E.3 Scratch image analyses. 142

xix
E.4 Scratch image analyses. 143

xx
LIST OF TABLES
1.1 Molecular classification of the five major breast cancer subtypes. 3
1.2 Clinical characteristics of the Triple Negative Breast Cancer phenotype (as
described by Dent et.al, 2007.
15
2.1 A summary of the characteristics of the breast cell lines. 45
2.2 Optimised cell seeding density for xCelligence studies. 46
A.1 Media preparation for MCF-7, MDA-MB-231 and MDA-MB-436 cell lines. 114
C.1 Dilution series for cell seeding densities for growth signature optimisation. 121
C.2 Average percentage values of MCF-7 cell viability. 123
C.3 Standard deviation values of MCF-7 cell viability. 123
C.4 Average percentage values of MDA-MB-231 cell viability. 123
C.5 Standard deviation values of MDA-MB-231 cell viability. 124
C.6 Average percentage values of MDA-MB-436 cell viability. 124
C.7 Standard deviation values of MDA-MB-436 cell viability. 124
E.1 The average distances of MCF-7 cell line pixel/µm calculated on ImageJ. 143
E.2 The standard deviations of MCF-7 cell line pixel/µm calculated on ImageJ. 144
E.3 The average distances of MDA-MB-231 cell line pixel/µm calculated on
ImageJ.
144
E.4 The standard deviation MDA-MB-231cell line pixel/µm calculated on ImageJ. 145
E.5 The averages distances of MDA-MB-436 cell line pixel/µm calculated on
ImageJ.
145
E.6 The standard deviations of MDA-MB-436 cell line pixel/µm calculated on
ImageJ.
146

xxi
F.1 Results from the Kruskal-Wallis test of the effect of DBZ on MCF-7, MDA-
MB-231 and MDA-MB-436 cell lines.
147
F.2 Results from the Kruskal-Wallis test of the effect of DAPT on MCF-7, MDA-
MB-231, and MDA-MB436 cell lines.
148
F.3 Results from the Kruskal-Wallis test of the normal growth curves of MCF-7,
MDA-MB-231, and MDA-MB-436 cell lines.
148
F.4 Results from the unpaired student’s t-test between the growth curves of MCF-
7 and MDA-MB-231 cell lines.
149
F.5 Results from the unpaired student’s t-test between the growth curves of MCF-
7 and MDA-MB-436.
150
F.6 Results from the unpaired student’s t-test between the effects of DAPT on the
cell proliferation and viability of the MCF-7 and MDA-MB-231 cell lines.
151
F.7 Results from the unpaired student’s t-test between the effects of DAPT on the
cell proliferation and viability of the MCF-7 and MDA-MB-436 cell lines.
152
F.8 Results from the unpaired student’s t-test between the effects of DBZ on the
cell proliferation and viability of the MCF-7 and MDA-MB-231 cell lines.
153
F.9 Results from the unpaired student’s t-test between the effects of DBZ on the
cell proliferation and viability of the MCF-7 and MDA-MB-436 cell lines.
154
F.10 Results from the paired student’s t-test between the effects of DAPT vs DBZ
on the cell proliferation and viability of the MCF-7 cell line.
155
F.11 Results from the paired student’s t-test between the effects of DAPT vs DBZ
on the cell proliferation and viability of the MDA-MB-231 cell line.
156
F.12 Results from the paired student’s t-test between the effects of DAPT vs DBZ 157

xxii
on the cell proliferation and viability of the MDA-MB-436 cell line.
F.13 Results from the Kruskal-Wallis test on the cell migration of MCF-7 cell
lines.
158
F.14 Results from the Kruskal-Wallis t-test on the cell proliferation and viability of
the MDA-MB-231 cell line.
158
F.15 Results from the Kruskal-Wallis t-test on the cell migration of the MDA-MB-
436 cell line.
159
F.16 Results from the paired student’s t-test between the effects of DAPT vs DBZ
on the cell migration of the MCF-7 cell line.
160
F.17 Results from the paired student’s t-test between the effects of DAPT vs DBZ
on the cell proliferation and viability of the MDA-MB-436 cell line.
161
F.18 Results from the paired student’s t-test between the effects of DAPT vs DBZ
on the cell proliferation and viability of the MDA-MB-231 cell line.
162

xxiii
LIST OF ABBREVIATIONS
3D 3 dimension
AAW
APH1
African American Women
Anterior pharnx-defective 1
ADAM A Disintergrin Metalloprotease
ANK Ankyrin
ATCC American Type Cell Culture
BC Breast cancer
BL1 Basal Like 1
BL2 Basal Like 2
BLBC Basal Like Breast Cancer
BMI Body Mass Index
BSA Bovine Serum Albumin
BSA Bovine serum albumin
BWHS Black Women’s Health Study
CBCP Clinical Breast Care Project
CBF-1 C-promoter binding factor-1
CHBH Chris-Hani Baragwanath Hospital
CI Cell Index
CK Cytokeratin
CRD Cysteine Rich Domain
CSC Cancer Stem Cell
CW Caucasian women

xxiv
DAPT N-(N-3,5-Diflurophenacetyl-L-alanyl)-S-phenyl glycine t-Butyl Ester
DBZ N-[(1S)-2-[[(7S)-6,7-Dihydro-5-5methyl-6-oxo-5H-dibenz[b,d]
azepin-7-yl]amino-1-methyl-2-oxoethyl]-
3,difluorobenzeneacetamide
DMSO Dimethyl Sulphoxide
DOS Delta and OSM-11-like repeats
DSL Delta/serrate/lag-2
DsRNA Double stranded
E-cadherin Epithelial Cadherin
EDTA Ethylenediaminetetraacetic acid
EGF Epithelial Growth Factor
EGFR Epithelial Growth Factor Receptor
EMT Epithelial-to-mesenchymal transition
E-plates Electronic plates
ER Oestrogen Receptor
RER Rough endoplasmic Reticulum
FBS Foetal Bovine Serum
FDA Food and Drug Administration
GSI ƴ-Secretase Inhibitor
GTPase Guanosine triphosphate hydrolase
HD Heterodimerization
HER-2 Human Epidermal Growth Factor-2
IHC Immunohistochemistry

xxv
L-15 Leibovitz
LAR Luminal Androgen Receptor
LNR Lin12-Notch Repeats
mAb monoclonal antibody
MAML Mastermind-like
MCF-7 Michigan Cancer Foundation–7
MDA-MB-231 M.D Anderson-Metastatic Breast-231
MDA-MB-436 M.D Anderson-Metastatic Breast-436
miRNA Micro-ribonucleic acids
ML Mesenchymal Like
MNNL Module at the N-terminus of Notch Ligand
mRNA messenger ribonucleic Acid
MSL Mesenchymal Stem Like
N1IC Notch-1 Intracellular Component
N-cadherin Neural Cadherin
NEC Notch Extracellular Component
NIC Notch Intracellular Component
N1IC Notch-1 Intracellular Component
NLS Notch Localising Sequence
NRR Negative Regulatory Region
NTM Notch transmembrane
OC Oral contraceptives
PBS Phosphate Buffered Saline

xxvi
PDZL post synaptic density protein (PSD95), Drosophila disc large tumor
suppressor (Dlg1), and zonula occludens-1 protein (zo-1) Ligand
PEN2 Presenilin enhancer 2
PR Progesterone Receptor
RAM RBPjk Association Module
RBPJκ Recombination signal-binding protein for immunoglobulin kappa j
RER Rough endoplasmic reticulum
RIP Regulated Intramembrane Proteolysis
RISC RNA Induced Silencing Complex
RNA Ribonucleic acid
RNAi RNA interference
RT Room Temperature
RTCA Real Time Cell Analysis
SA South Africa
SDV Standard Deviation
SES Socioeconomic status
siRNA short interfering RNA
TAD Transactivation Domain
T-ALL T-cell Acute Lymphoblastic Leukemia/Lymphoma
TB Trypan Blue
TNBC Triple Negative Breast Cancer
USA United States of America
Ƴ-secretase Gamma secretase

1
CHAPTER 1: INTRODUCTION
1.1 Review of literature
1.1.1 Breast cancer statistics and classification
Breast cancer (BC) is the most common cause of cancer related deaths among women
worldwide and it is now estimated that it represents one in four cancers afflicting women
Ferlay et al. (2015). The most recent GLOBOCAN study reveals that BC incidences have
risen by approximately 20% between 2008 and 2012 (Ferlay et al., 2015). In South Africa
(SA), it is estimated that one in thirty five women will be diagnosed with the disease
making it the leading cause of cancer related deaths in South African women (CANSA,
2014).
BC is a heterogeneous complex of diseases that have been classified into five subtypes
namely: Luminal A; Luminal B; Human epidermal growth factor-2 receptor (HER-2)
positive (HER-2+); Normal breast-like and Basal-like BC (BLBC) (see Table 1.1) (Sotiriou
and Pusztai, 2009, Perou et al., 2000, Sorlie et al., 2003). The classification was based on
gene expression patterns, wherein each subtype displayed distinct biological features
(Yersal and Barutca, 2014, Rakha and Ellis, 2011), which give rise to the differences in the

2
response patterns to various treatment modalities and to clinical outcomes (Yersal and
Barutca, 2014, Liu et al., 2014).
The Luminal subtype arises from the luminal epithelium of the breast ducts and is sub-
classified into Luminal A and Luminal B breast tumours (Vuong et al., 2014). While both
express oestrogen receptors (ER) and progesterone receptors (PR), the Luminal A tumours
have higher levels of ER, compared to the Luminal B tumours (Sorlie et al., 2001, Zhang
et al., 2014). Furthermore, the Luminal A tumours have a lower proliferation index and are
highly sensitive to current endocrine therapeutics and to aromatase inhibitors (Ignatiadis
and Sotiriou, 2013). The Luminal B tumours express HER-2, thus these tumours have a
higher proliferative index than Luminal A tumours (Zhang et al., 2014). This feature
enhances their sensitivity to current anti-HER-2 therapies (Network, 2012, Ignatiadis and
Sotiriou, 2013).
Those tumours classified as normal breast-like, express genes characteristic of adipose
tissues, and are negative for the basal myoepithelial markers, cytokeratin (CK) 5 and
epithelial growth factor receptor (EGFR) (Yersal and Barutca, 2014, Vuong et al., 2014).
This subtype however, remains controversial, as some researchers believe that it very
likely represents normal breast cell samples that have been contaminated during technical
work (Weigelt et al., 2010).
The last subtype is the BLBC subtype. These tumours which originate from the basal
myoepithelium are the most aggressive of all the tumour subtypes. They express high
levels of basal myoepithelial markers, such as, CK5, CK14, CK17 and laminin; and they

3
lack the expression of ER, PR and HER-2 receptor, a feature described as ―triple
negativity‖. Currently, there is no specific therapy for BLBC tumours.
Table 1.1: Molecular classification of the five major breast cancers subtypes (Sorlie et al.,
2003).
Subtypes Molecular classification Prevalence
Luminal A ER+/PR
+/HER-2
- 50-60%
Luminal B ER+/PR
+/HER-2
+ 15-20%
HER-2 Positive ER
-/PR
-/HER-2
+ 15-20%
Basal-like ER-/PR
-/HER-2
- 8-37%
Normal like ER-/PR-HER-2- / CK5- 5- 10%
1.1.2 What is Triple negative breast cancer?
1.1.2.1 The difference between the Basal-like breast cancer and Triple negative breast
cancer
BLBCs are the most aggressive BC subtype of the five discussed. They are diagnosed
more frequently in young women of African ancestry (Badve et al., 2011). As mentioned
above, a characteristic feature of BLBC is the lack of ER, PR, and HER-2 expression. In
the research setting, this disease is defined via gene expression array analysis (Perou et al.,
2000). Since this approach is economically unfeasible in the clinical setting,
immunohistochemical (IHC) analyses of hormone and growth receptors are used as
markers for BLBC. As a consequence of this approach, BLBC became more commonly

4
known as triple negative breast cancer (TNBC) (Prat et al., 2013). However, research has
demonstrated that as there is approximately 25% discordance between BLBC and TNBC,
as not all BLBC are TNBC and vice versa (Yersal and Barutca, 2014, Prat et al., 2013).
Microarray based studies on 12 publicly available TNBC data sets, which were composed
of TNBC human tumours and TNBC cell lines revealed that only 70-80% of the tumours
possessed the basal like phenotype and 20-30% were either luminal or had basoluminal
phenotypes (Prat et al., 2013).Other microarray studies demonstrated that between 50-75%
of TNBC tumours were of the basal like phenotype (Rakha et al., 2009, Perou, 2011,
Nielsen et al., 2004). Moreover, up to 45% of BLBCs expressed the ER, PR and HER-2
and 40-80% of TNBC expressed basal markers (Carey et al., 2010). It is also noted that a
characteristic feature of the controversial normal breast-like tumours, lack ER, PR and
HER-2 expression, which implies that they may also be considered ―triple negative‖.
Evidently, research has shown that TNBC is not a reliable surrogate for BLBC and
therefore, the terms should not to be used synonymously (Prat et al., 2013, Rakha et al.,
2009).
Therefore, TNBCs are defined as breast tumours that lack ER, PR and HER-2 expression,
and may fall into any of the other BC subtypes (Perou, 2011, Eiermann et al., 2012, Prat
and Perou, 2011) .
1.1.2.2 Molecular classification of Triple negative breast cancer
The heterogeneity of this group has lead researchers to the inclination that TNBC may be
comprised of a variety of molecularly distinct subgroups (Prat and Perou, 2011). In this
regard the most prominent publication is by Lehmann and colleagues who analysed

5
ribonucleic acid (RNA) expression from 14 BC gene expression datasets that used breast
tumours from women in the United States of America (USA), Europe and China as a
training set, to develop gene signatures for TNBC subgroups (Lehmann et al., 2011).
Through their analyses 2,188 genes from 386 TNBC tumours were identified (Lehmann et
al., 2011). Consensus and k-means clustering of the tumour profiles revealed that there
were six TNBC sub-groups which consisted of Basal-like 1 (BL1), Basal-like 2 (BL2),
Mesenchymal like (ML), Mesenchymal stem like (MSL), and Luminal Androgen Receptor
(LAR) (summarised Figure 1.1) (Lehmann et al., 2011) .
Other researchers have employed different approaches to investigate or validate the
―TNBC sub-group‖ hypothesis (Prat et al., 2013). Elsawaf and colleagues demonstrated
that there are four distinct TNBC subgroups (Elsawaf et al., 2013). By using IHC
combined with hierarchical clustering, they analysed 147 patient derived TNBC tumours,
to assess the expression of basal and luminal cytokeratins. The subgroups were classified
as Basal A, Basal B, Basoluminal and Luminal, with respect to the predominant pattern of
cytokeratin expression (Figure 1.1) (Elsawaf et al., 2013).
Each of these studies employed a different approach to test the hypothesis, each having
advantages and disadvantages. The Lehmann study was larger and distinguished their
subgroups based on the identification and clustering of 2,188 genes. In contrast, the
Elsawaf study was smaller and evaluated the biomarker expression patterns on the
tumours. The former study is more statistically and biologically powerful versus the latter.
However, the Elsawaf approach is more economically and practically feasible for routine
clinical diagnostics, more especially in an African setting.

6
Furthermore, Prat and colleagues (Prat et al., 2010) identified another sub-group
characterised by lower claudin expression levels through micro-ribonucleic acid (miRNA)
expression analyses. Claudins represent a group of cell adhesion molecules that are
associated with the formation and stabilisation of tight junctions (Escudero-Esparza et al.,
2011). These tumours were observed to be most aggressive compared to other subgroups
(Prat et al., 2010). The clinical relevance of this subgroup as well as the aforementioned
groupings is still under investigation, since subject of TNBC sub-classification is
controversial.
Therefore, further research is warranted in order to reach a general consensus as to which
approach is best suited to determine the molecular subgroup of a tumour. It is imperative
that both the researcher and clinician agree to avoid tumour misclassifications, when
diagnosing patients or when beginning a clinical trial or laboratory research.
Despite the controversy, the research discussed provides valuable information concerning
the complicated nature of TNBC and it is this complexity in addition to the lack of
hormone and growth receptor expression as to why TNBC remains a challenge to treat and
manage.

7
Figure 1.1 Summary of the two different methodological approaches applied to sub-classify
TNBC. Immunohistochemical analyses of 147 TNBC tumours (red) based on hierarchical
clustering of predominant patterns of basal and luminal cytokeratins revealed four distinct
subgroups Basal A; Basal B; Basoluminal and Luminal TNBCs. Gene expression analyses of 337
TNBC tumours (blue) were analysed by k-means and consensus clustering of 2,188 genes. The six
distinct sub-groups identified in this study were Basal-like 1 (BL1); Basal-like 2 (BL2),
Mesenchymal-stem-like (MSL); Mesenchymal (M) and Luminal Androgen Receptor (LAR)
(Elsawaf et al., 2013, Lehmann et al., 2011) .To-date the sub-classification of TNBC tumours is a
topic of debate.[Diagram was created on Microsoft PowerPoint, 2010; Msibi, 2015]

8
1.1.2.3 Epidemiology and risk factors for Triple negative breast cancer
1.1.2.3.1 Racial disparities
It has been reported that TNBC is more prevalent in young black women compared to
women of other races (Swede et al., 2011, Galukande et al., 2014). Stead and colleagues
published data, collected from 415 female patients with invasive BC between 1998 and
2006(Stead et al., 2009). This study consisted of an ethnically diverse population. It was
observed that TNBC constitutes 20% of all tumours and 64% of these were tumours
obtained from pre-menopausal black patients (age less than 50 years). The Clinical Breast
Care Project (CBCP) studied the racial disparities between African American women
(AAW) and Caucasian women (CW) with BC (Sturtz et al., 2014). It was found that
TNBC diagnosis was significantly higher in AAW (28%) compared to CW (12%) (Sturtz
et al., 2014). Most epidemiological studies on the disease have been conducted in the
Western and European countries.
Hitherto only two BC subtype studies have been published in SA. McCormack and
colleagues examined the BC characteristics of 1,092 patients who attended Chris-Hani
Baragwanath Hospital (CHBH), between 2006 and 2012(McCormack et al., 2013). From a
racially diverse population they observed that TNBC was most prevalent in black women.
The data is comparable to that obtained from USA based studies. Although informative,
this study was limited to patients attending CHBH. A larger study with 10,047 BC patients
from SA and Namibia was conducted between 2011 and 2013(Dickens et al., 2014a). The
data concurred with others, that is, TNBC is more prevalent in black women and
statistically it represents 17.4% - 21.9% of all BCs (Dickens et al., 2014a).

9
In other sub-Saharan countries epidemiological studies are few and small (Sayed et al.,
2014, Eng et al., 2014). This emphasises the need for extensive epidemiological data
collection in SA, as well as the rest of the sub-continent.
1.1.2.3.2 Genetic risk factors
Genomic instability and mutation is an enabling hallmark of tumorigenesis (Hanahan and
Weinberg, 2011). Mutations in the genes enhance the susceptibility of cancer. Certain gene
mutations are associated with particular cancers. The breast cancer susceptibility (BRCA)
gene is a well-known BC gene. It’s been reported that women with a BRCA1 mutation
have a more than 50% chance of development of TNBC (Zhang et al., 2012, Haiman et al.,
2011). In the Hellenic Cooperative Oncology Group study (HCOG), it was found that, that
there were 65 deleterious BRCA1 mutations among the 403 TNBC patients that
participated (Fostira et al., 2012). Additionally when the age at onset of the disease was
considered, BRCA1 carriers increased dramatically with some 27% of women with TNBC
diagnosed at or before the age of 50, whilst 36% diagnosed at or before the age of 40 had a
BRCA1 mutation (Fostira et al., 2012). A report on similar observations was provided in a
cohort of 469 TNBC patients (70% Caucasian and 19% AAW), 31% of the group had a
BRCA1 and BRCA2 mutation (Greenup et al., 2013). When age at diagnosis was taken
into account, the likeli-hood of carrying a BRCA1 or BRCA2 mutation increased (Greenup
et al., 2013).
Couch et al. assessed the frequency of mutation in 17 BC predisposition genes among
1.824 TNBC patients when unselected for family history (Couch et al., 2015). Across the
cohort, 14.6% of women had at least 1 deleterious gene mutation, predominantly BRCA1,

10
identified in 8.5% and BRCA2 identified in 2.7 % (Couch et al., 2015). Sporadic TNBC
cases with BRCA1/2 mutations were strongly associated with younger age (Couch et al.,
2015). Furthermore the study discovered that the 15 other mutations were present at
varying degrees in 3.7% of the women (Couch et al., 2015). The most frequent after
BRCA1/2, were mutations in the Partner and Localizer of BRCA2 (PALB2) gene found in
21 patients (1.2%) (Couch et al., 2015). The Couch study concurs with the HCOG study as
38 % of mutations were found in women younger than 40 and the presence of mutation
was associated with diagnosis at a significantly young age.
In view of the high prevalence of TNBC in women of African ancestry than of European
ancestry, genetics researchers have undertaken the task to discover gene susceptibility loci
for this subtype of BC. A Meta-analysis of genome-wide association studies (GWAS) of
ER negative BC in a mixed population of African and European ancestry identified a novel
TERT-rs10069690 SNP in chromosome 5P15 for TNBC risk; however, allele frequency of
rs10069690 was greater in women of African than of European ancestry (Haiman et al.,
2011). The data was confirmed in the Black Women’s Health Study (BWHS) in which
only AAWs were examined (1199 cases and 1948 controls) (Palmer et al., 2013). While
the functional significance of the findings are unknown, the results do however support a
genetic cause of TNBC that might partly contribute to racial or ethnic origin differences in
the incidence of the disease (Palmer et al., 2013).
1.1.2.3.3 Reproductive risk factors
Reproductive factors are among the earliest and most well established BC risk factors.
However, there are a few studies that evaluate the effects of these factors on the risk of

11
developing any one of the BC subtypes. It has been shown that early parity correlates with
a reduced risk of TNBC and an increase in the overall survival of the patients (Ma et al.,
2010, Li et al., 2013). It has also been reported that longer duration of breastfeeding has
protective effects on TNBC (Li et al., 2013, Sturtz et al., 2014, Ma et al., 2010).
The use of oral contraceptives (OC) has been associated with an increased risk of TNBC.
Rosenberg and colleagues conducted a prospective follow-up study of the BWHS and
found that the use of OCs caused a 2.5 fold increase in the risk of TNBC (Rosenberg et al.,
2010). Others report that longer duration of contraceptive use caused an increase risk,
compared to women who had never used OCs (Dolle et al., 2009, Beaber et al., 2014, Li et
al., 2013). However, Turkoz and colleagues conducted a cross-sectional retrospective
study with 2005 women and discovered that OC, hormone replacement therapy and in vitro
fertilisation had no significant impact on TNBC outcome and survival, regardless of
menopausal status (Turkoz et al., 2013).
A great deal of research on the effects of reproductive factors and their association with
TNBC development and patient prognosis must be undertaken, in order to prevent, treat
and manage the disease effectively (discussed further below).
1.1.2.3.4 Anthropometric risk factors
Research has shown that women with a higher body mass index (BMI) are at a greater risk
of developing BC. It is thought that the association appears to be driven by distinct
molecular mechanisms which are based on a woman’s menopausal status (Pierobon and
Frankenfeld, 2013). In post-menopausal women, upper body obesity is associated with the

12
risk of developing BC. The same cannot be conclusively stated about pre-menopausal
women (Pierobon and Frankenfeld, 2013). Clinically post-menopausal women often
present with a less aggressive phenotype and with oestrogen dependent tumours, which are
most likely driven by steroidal hormones produced by the adipocytes (Rose and Vona-
Davis, 2010).On the other hand, pre-menopausal women who develop BC often present
with more aggressive tumours that are hormone-independent (Rose and Vona-Davis,
2010).
Evidence to suggest that obesity is associated with TNBC is contradictory. A retrospective
study which included 448 TNBC patients found that a higher BMI was more prevalent
among AAWs, however there was no significant difference associated with the disease
within the three (normal weight, overweight and obese) BMI groups with regards to age at
diagnosis, menopausal status or pathological tumour stage or grade (Tait et al., 2014).
Similar findings were observed by Dawood and colleagues, where overweight and obese
women were predominantly AAW and their height, weight and waist-to-hip ratio were not
associated with TNBC (Dawood et al., 2012). Moreover a prospective study showed that
higher BMI is mostly associated with AAWs (Mowad et al., 2013). Although obese
patients had presented with significantly larger tumours and higher T-stage, recurrence and
death were not significantly different among the three BM1 groups that were assessed
(Mowad et al., 2013).
Contradictory to the above mentioned studies, the retrospective study by Turkoz and
colleagues showed that overweight and obese pre-menopausal women had a significantly
higher risk of developing TNBC (Turkoz et al., 2013). Another population based case

13
control study which analysed the BMI change of women from the age of 18-44 years
demonstrated that obesity was associated with increased risk of TNBC among parous
women only (Kawai et al., 2014).
In a meta-analysis, in which 11 studies were examined, it was discovered that the
association between TNBC and obesity is dependent on menopausal status (Pierobon and
Frankenfeld, 2013). In pre-menopausal women a BMI of 30 or more resulted in a
significant increase risk of developing TNBC; however, in post-menopausal women the
same BMI did not increase the risk (Pierobon and Frankenfeld, 2013). Looking at the
studies overall, it is clearly necessary to undertake further research on the role of
anthropometry and its role in TNBC development together with overall patient survival.
Moreover further investigations are needed to evaluate the molecular mechanisms that link
obesity and its relationship with TNBC.
1.1.2.3.5 Socioeconomic status risk factors
Socioeconomic status (SES) is intrinsically linked with lifestyle behaviours, including
physical activity, diet, reproductive experiences, such as having more children and
screening behaviours, which vary in prevalence across different populations of
women(Brewster et al., Dunn et al., 2010) . It has been shown that women with lower
income brackets are often black and they generally tend to have more children than women
from more affluent backgrounds (Davies et al., 2013, Sineshaw et al., 2014, Shariff-Marco
et al., 2014). Also their survival outcome after cancer treatment is lower than that of
women from a higher income bracket (Shariff-Marco et al., 2014).

14
In a cohort of 1,000 women, it was discovered that of BC patients diagnosed at CHBH,
those who lived farther away and whom were from low income brackets presented with
late stage BC diagnosis, compared to their wealthier counterparts (Dickens et al., 2014b).
Further it was seen that other contributing factors that resulted in delayed diagnosis
included a lack of education concerning where to go to seek help, poor knowledge of
symptoms, lack of breast awareness, fear and beliefs held on the causes of cancer and
whether it is curable (Dickens et al., 2014b). Internationally it has been shown that in
general women from poor backgrounds or rural areas are most likely to present with more
aggressive forms of BC, due to lack of access to healthcare (Davies et al., 2013,
Seneviratne et al., 2015, Newman et al., 2006). In terms of studies concerning the effect of
low SES on the disease, data from the California Cancer Registry showed that irrespective
of race or ethnic origin, women living in areas of low SES were more likely than women
living in areas of high SES to be diagnosed with TNBC than any other type of BC (Parise
and Caggiano, 2013).
These observations may be one of the contributing factors as to why TNBC is mostly
prevalent in women AAWs and other African women in other countries.
1.1.3 Current and novel treatment options
At present there are no Food and Drug Administration (FDA) approved drugs for the
treatment of BC (Andre and Zielinski, 2012). Currently, surgery, radiation and
chemotherapy are the only treatment options available (Yagata et al., 2011), however,
some challenges remain (see Figure 1.2). Although chemotherapy is associated with a
complete pathological response in some patients, other patients do not respond and may

15
relapse often resulting in worse overall survival (Gluz et al., 2009, Cortazar et al., 2014).
Population based studies on TNBC have shown that the disease is more aggressive than
other forms of BC(Lee et al., 2014, Yagata et al., 2011). These studies have also shown
that there is a higher risk of recurrence within the first three years after initial treatment and
that the majority of deaths occur within the first five years (Dent et al., 2007, Bayoumi et
al., 2014, Solin et al., 2009, Pogoda et al., 2013) (Table 1.2).
Table 1.2: Clinical characteristics of the Triple Negative Breast Cancer phenotype (as
described by (Dent et al., 2007).
Often present as interval cancers
Rapid rise in risk of recurrence following diagnosis
Distal recurrence rarely preceded by local recurrence
Increased mortality rate in the first 5years
Rapid progression from distant recurrence
Weak relationship between tumour size and node status
Peak risk of recurrence at 1-3 years
Local recurrence not predictive of distal recurrence
Majority of deaths occur in first 5 years

16
Figure 1.2.Schematic representation of a TNBC tumour; the current challenge in its
treatment and management. A) The normal breast tissue expresses oestrogen receptors (ER,
green), progesterone receptors (PR, yellow) and human epidermal growth factor-2 receptors (HER-
2, red). B) A TNBC tumour lacks the expression of the hormone receptor and the growth factor
receptor. C) Endocrine (mauve), radiation (silver) and chemo (blue) therapy are ineffective in
tumour treatment. D) Ineffective treatment leads to continuous growth. [Diagram was created in
Microsoft PowerPoint, 2010; Msibi, 2014].

17
There are many obstacles encountered in the treatment and management of TNBC. These
include: a lack of targeted therapies, an absence of reliable prognostic and diagnostic
markers coupled with a poor knowledge of the mechanism of pathology of the disease
(Podo et al., 2010). These challenges surrounding TNBC have drawn a lot of attention
from cancer researchers. The mission is to discover and develop novel therapeutics to treat
and manage the disease effectively.
Novel approaches proposed in the literature include among others, the use of monoclonal
antibodies (mAb), targeting of angiogenesis, targeting DNA repair and damage
mechanisms , cell signalling pathways and cancer stem cells (CSCs) (Yagata et al., 2011,
Koziol et al., 2012, Aulmann et al., 2010, Miki et al., 2014) . However, thus far none of
these have been particularly successful. This emphasises the crucial need to better
understand the mechanisms of TNBC pathogenesis as this will subsequently lead to the
development of more effective novel therapeutics. In this regard, it is suggested here that
the Notch signalling pathway is worthy of investigation as a potential therapeutic target.
The importance of this pathway, and its role in BC development, is described below.
1.1.4 The Notch signalling pathway
The elucidation of the Notch signalling pathway began in 1913 when John Smith Dexter
observed that a mutation of a particular gene in Drosophila ampelophila resulted in the
development of a notch at the end of the fly’s wings. Consequently, he called them
―perfect Notched‖. Subsequently, in 1917, Thomas Hunt Morgan identified the alleles of
the fly gene now known as NOTCH. The gene was eventually cloned and definitively
identified during 1985-1986 (Olsauskas-Kuprys et al., 2013, Wharton et al.,

18
1985, Kidd et al., 1986). Since then, research has shown that the pathway is transduced via
receptor-ligand activation, when neighbouring cells come into contact with one
another(Kopan and Ilagan, 2009). The pathway is involved in multiple cellular processes,
including cell fate decisions, tissue homeostasis and stem cell maintenance (Takebe et al.,
2014, Ntziachristos et al., 2014, Bolos et al., 2007) .
1.1.4.1 The structure of the Notch receptors and their ligands
1.1.4.1.1 Notch receptors
There are four trans-membrane Notch receptors in mammals; these being termed NOTCH1
to 4, (Figure 1.3). The receptors are comprised of 29-36 tandem epidermal growth factor
like-repeats (EGF) (Kopan and Ilagan, 2009). Many of the repeats are bound to calcium
that determines the structure and affinity of the receptors to its ligand (Chillakuri et al.,
2012). A negative regulatory region (NRR) that inhibits the activation of the receptor in the
absence of a ligand follows the EGF repeats (Olsauskas-Kuprys et al., 2013, Chillakuri et
al., 2012). The NRR region consists of three cysteine-rich Lin12-Notch repeats (LNR) and
a heterodimerization domain (HD) (Stanley and Okajima, 2010, Chillakuri et al., 2012).
Together, the repeats and the NRR form the Notch extracellular component (NEC) (Kopan
and Ilagan, 2009, Chillakuri et al., 2012).
The Notch intracellular component (NIC) is comprised of the recombination signal binding
protein for immunoglobulin kappa j (RBPjk) association module (RAM) domain that
contains 12-20 amino-acids (Kopan and Ilagan, 2009). The RAM together with the LNR

19
and HD form the Notch transmembrane (NTM) domain. RAM is also linked to seven
ankyrin (ANK) repeats by a long and unstructured linker containing one Notch localising
sequence (NLS) followed by bipartite NLS(Kopan and Ilagan, 2009) . In the NOTCH-1
and NOTCH-2 receptor, these are then followed by an evolutionarily divergent
transactivation domain (TAD); this region is however, absent in NOTCH-3 and NOTCH-4
(Kopan and Ilagan, 2009, Chillakuri et al., 2012). The TAD is followed by a conserved
proline/glutamic acid/serine/threonine-rich motif (PEST) which contains degrons that
regulate the stability of NIC (Chillakuri et al., 2012) .
1.1.4.1.2 Notch ligands
There are five ligands, including JAGGED 1 to 2 and DELTA-LIKE 1, 3, and 4, all of
which are classified as type 1 transmembrane proteins that belong to the Delta-like and
Serrate/Jagged families(Stanley and Okajima, 2010). They are characterised by three
related structural motifs (Chillakuri et al., 2012). The N-terminus consists of a module of
an unknown structure that is stabilised by a disulphide bond called Module at the N-
terminus of Notch Ligands (MNNL). This module precedes the delta/serrate/lag-2 (DSL)
motif, which is followed by specialised tandem EGF repeats known as Delta and OSM-
11-like repeats or DOS(Kopan and Ilagan, 2009) . The DOS is followed by calcium
binding and non-calcium binding EGF-like repeats; the repeats range in number from 16
(Jagged family) to 5-9 (delta-family). A cysteine rich domain (CRD) which is only present
in the Jagged family precedes the EGF repeats. The intracellular component of the ligand
is a post synaptic density protein (PSD95), Drosophila disc large tumour suppressor
(Dlg1), and zonula occludens-1 protein (zo-1) Ligand (PDZL) domain that is present only

20
on JAGGED-1 and DELTA-LIKE-1 and 4. This domain facilitates the integration of
proteins at the adherens junction to promote cell-cell adhesion and inhibit cell motility.

21
Figure 1.3 Diagrammatic representations of the Notch receptor and Notch-ligand. The
extracellular domain of the receptor is comprised of epithelial growth factor like (EGF) repeats and
calcium repeats and the negative regulatory region (NRR). The transmembrane domain is
composed of the lin12-notch repeats (LNR) and heterodimerization (HD) of the NRR and the
RBPjk Association Module (RAM) component of the notch intracellular component (NIC). The
intracellular component is comprised of the RAM, ankyrin repeats (ANK), transactivation domain
(TAD) and proline/glutamic acid/serine/threonine-rich (PEST) domains. The Notch ligand is
comprised of the module at the n-terminus of notch ligand (MNNL) which precedes the
delta/serrate/lag-2 (DSL) domain. The domain is preceded by the EGF repeats. These regions all
form the extracellular domain of the ligand. The Intracellular domain consists of the cysteine rich
domain and the post synaptic density protein (PSD95), Drosophila disc large tumor suppressor
(Dlg1), and zonula occludens-1 protein (zo-1) Ligand (PDZL) domain. [Diagram was created on
Microsoft PowerPoint, 2010; Msibi, 2015]

22
1.1.4.1.3 Notch signal transduction
The NOTCH receptors (see Figure 1.3) are derived from large (>300 kD) precursor
polypeptides in the rough endoplasmic reticulum (RER) (Figure 1.4). The precursor
molecule is subjected to post-translational modifications before reaching maturation. The
molecule is glycosylated by O-fucose on its EGF repeats. The addition of O-linked Fucose
is mediated by O-fucosyl transferase 1. The NOTCH precursor is then transported to the
trans-Golgi apparatus by the guanosine triphosphate hydrolase (GTPase) Rab-protein 6.
There, the O-fucose is extended by the addition of carbohydrate chains on the serine and
threonine residues, the elongation is mediated by the fringe family, specifically the β1, 3-N
acetylglucosaminyl-transferases Lunatic, Manic or Radical.
The modification by the fringe proteins controls the ligand-mediated activation. The fully
modified Notch pre-protein then experiences its first of three proteolytic cleavages in the
Golgi. A Furin-like convertase (at site 1) (Figure 1.4) creates the first cleavage at the N and
C terminus of the protein which forms the mature NOTCH receptor. The receptor is then
transported to the plasma membrane where it interacts with its membrane-associated ligand
(Figure 1.4). Upon ligand-receptor engagement, a second cleavage is initiated by a
disintegrin metalloproteases 10 and 17 (ADAM 10 and ADAM 17, respectively) (at site 2)
(Figure 1.4). which releases the NEC to be trans-endocytosed into the ligand-expressing
cell. This then leaves NTM vulnerable to the third and final cleavage by Gamma-secretase
(γ-secretase) (at site 3) (Figure 1.4) complex, liberating the NIC. The component is then
trans-located into the nucleus where it forms a transcriptional activated complex with the
following: DNA-binding factor, C-promoter binding factor-1(CBF-1), a constitutive
23
transcriptional repressor, a displacing co-repressor and recruiting co-activators such as
Mastermind-like (MAML) (Figure 1.4). Formation of these complexes results in the
expression of various NOTCH target genes, such as HES/HEY family genes and C-MYC,
which are involved in cell growth, differentiation, and survival (Figure 1.4).
Notch activates many genes associated with cell differentiation and/or survival. Following
receptor-ligand binding, NIC bound to CBF-1 in the nucleus at the time of receptor
activation is marked for proteosomal degradation by the E3 ubiquitin ligases Numb and
Itch. The deregulation of this pathway is associated with cancer and developmental
disorders.

24
Figure 1.4 A Schematic representation of the Notch pathway. Notch precursor protein is
glycosylated in the rough endoplasmic reticulum (RER) and transported to the Golgi-apparatus
where it is cleaved by Furin-like convertase (S1). This cleavage results in a mature NOTCH
receptor being placed on the plasma membrane where it awaits ligand activation. A Disintegrin
Metalloprotease (ADAM) makes the second cleavage causing receptor vulnerability to cleavage by
gamma secretase (γ-secretase) (S3). The third cleavage results in the generation of the notch
intracellular component (NIC), which is translocated into the nucleus where it binds with C-
promoter binding factor-1 (CBF-1), thus repressing or activating target gene expression such as
HEYS/HES;C-MYC;P21;BCL-2;CYCLIN D1 [Diagram was created in Microsoft PowerPoint,
2010; Msibi; 2015].

25
1.1.5 Notch signalling in breast cancer
The earliest indication that Notch signalling plays a role in human carcinogenesis was
observed in 1991 in T-cell acute Lymphoblastic Leukaemia/Lymphoma (T-ALL) (Ellisen
et al., 1991). It was found that the NOTCH-1 chromosomal translocation t(7;9)(q34;q34.3),
which is responsible for producing NRR, was altered thus causing defects in the
signal(Ellisen et al., 1991).Subsequently, NOTCH-1 gain-of-function mutations were
discovered in approximately 50% of T-ALL and in other haematologic cancers (Aster et
al., 2011).Furthermore, aberrant NOTCH signalling has been detected in many solid
tumours for example, cervical, colon, liver, lung, pancreatic, prostate, ovarian and renal
cancers(Rose et al., 2010, Wang et al., 2010, Du et al., 2012, Yong et al., 2011, Gao et al.,
2014, Theys et al., 2013, Shao et al., 2012) . Of particular interest here is the function of
the Notch signal in BC development.
Evidence that Notch receptors are possible breast oncogenes was first seen in experiments
conducted on mice, where activation of NOTCH-1 and NOTCH-4 via mouse mammary
tumour virus induced neoplasms. Moreover, the up-regulation of NOTCH-4 resulted in the
transformation of mammary epithelium in vitro and in vivo (Farnie and Clarke, 2007). In
humans, the first direct correlation of dysregulated Notch signal and breast malignancy
was published by Reedijk et al. in 2005 (Reedijk et al., 2005).Using
immunohistochemistry, the group’s findings suggested that high expression of the
NOTCH-1 receptor, together with the ligand JAGGED-1, correlated with poor BC
prognosis and overall survival. They also noted that the overexpression was more
prominent in ER negative tumours than ER positive ones (Reedijk et al., 2005). In an
independent study by Dickson and colleagues, the expression of miRNAs was evaluated

26
using in-situ hybridisation (Dickson et al., 2007). Their findings verified those obtained by
Reedijk and colleagues, as they were able to show that high levels of JAGGED-1
correlated with a lower five year survival rate in BC patients (Reedijk et al., 2005) . These
data were reinforced by Speiser et al. (2012) who demonstrated that TNBC tumours
express high levels of NOTCH-1 and NOTCH-4. However; their study did not prove that
high expression levels of these receptors are correlated with poor clinical outcome (Speiser
et al., 2012). The limitation of their study was a small sample size of 50 tumours.
Research on NOTCH-2 and NOTCH-3 is scarce, with approximately two studies that
directly investigated the role of NOTCH-2 in human BC and only one study that
investigated NOTCH-3. In 2004, Parr et al. suggested that NOTCH-2 activation increased
tumour survival and that tumours expressing higher levels of this receptor were well
differentiated compared those that expressed NOTCH-1(Parr et al., 2004). The tumour
xenografts from ER negative cells displayed slowed growth when NOTCH-2 was up-
regulated (O'Neill et al., 2007). These data imply that NOTCH-2 is a tumour suppressor
gene in the breast.
Yamaguchi and colleagues reported that in HER-2 negative
BC cell lines, down-regulation
of NOTCH-3 resulted in suppressed proliferation and increased apoptosis (Yamaguchi et
al., 2008). Evidently, Notch signal activation appeared to be a ―double edged sword‖
where it can either exert oncogenic or tumour suppressive effects depending on the
receptor that is activated (Capaccione and Pine, 2013, Roy et al., 2007, Lobry et al., 2014).
However, the role that the Notch signal plays within each BC subtype remains unclear
since most of the available data relates to ER positive BC. Moreover, the relationships

27
between ER, PR, HER-2 and Notch are uncertain as data is limited. It has however been
suggested that oestrogen plays a role in the regulation of Notch signalling.
This notion was extrapolated from a study by Rizzo et al. (2009) (Rizzo et al., 2009). They
reported that oestrogen deprivation of the ER
positive cell line Michigan Cancer
Foundation – 7 (MCF7) resulted in increased NOTCH-1 activity (Rizzo et al., 2009).
Osipo et al. (2008) demonstrated that HER-2 overexpressing cells had low Notch
transcriptional activity compared to HER-2 negative cells (Osipo et al., 2008).
Subsequently, in 2009, Korkaya and Wicha suggested the following concerning the
relationship between HER-2 overexpression and Notch pathway activity (Korkaya and
Wicha, 2009):
1. The HER-2 promoter contains Notch binding sequences
2. HER-2 overexpressing cells display activated Notch signal
3. Inhibition of the Notch signal using an siRNA or γ-secretase inhibitors results in
the down-regulation of HER-2 expression, resulting in decreased mammo- sphere
formation
In the same year, Graham et al. (2009) demonstrated that in normal breast cells,
progesterone increased the expression of DELTA-LIKE 1 and 3 ligands which showed that
a lack of progesterone may decrease the activity of the Notch pathway(Graham et al.,
2009). Other factors that may influence Notch pathway activity include hypoxia and cross
talk with other pathways such as WNT, Sonic hedgehog and Ras(Kikuchi et al., 2011, Han
et al., 2011). Taken together, the literature shows that aberrant Notch signalling has
tumourigenic effects on the breast, and that additional data is required in order to

28
understand its function in TNBC. Supplementary data may add to the rationale to target
Notch signal as a therapeutic strategy in treating TNBC, as this cancer currently lacks FDA
approved agents.
1.1.6 Strategies to target Notch signal pathway in Triple negative breast cancer
As there is a lack of targeted therapeutic agents for treating TNBC, and that there is strong
evidence suggesting that the aberrant Notch signalling pathway is a key event in the
aetiology of BC, targeted therapies aimed at modulating the pathway in TNBC are
emerging. In 2008, Rizzo, et al. rationalised targeting the pathway based on the reasons
mentioned below:
Firstly, as the cascade is triggered by a receptor-ligand interaction that does not
require an enzymatic amplification step, the ―signal intensity‖ can be modulated
very precisely by cellular regulatory mechanisms. Therefore, the downstream
effects of Notch activation are exquisitely dose dependent (Rizzo et al.,2008b) .
Furthermore, complete shutdown of the pathway may not be necessary to achieve a
therapeutic effect.
Secondly, the intracellular half-life of the active form Notch is generally very short
and-
Thirdly, the effects of Notch are remarkably context dependent as each receptor
exerts a different effect on the breast cells.
There are three main strategies to modulate the signal proposed as treatment options in
TNBC, including the administration of mAbs, short interfering RNAs (siRNA) and γ-
29
secretase inhibitors (GSI) (see Figure 1.5); and each of these approaches are explained
below.
1.1.6.1 Notch1 and Delta-like 4 monoclonal antibodies
The overexpression of NOTCH receptors and ligands makes mAb therapy an attractive
treatment option, as they are effective in eliminating tumour cells and have a low toxicity
profile (Shuptrine et al., 2012). Furthermore, mAbs are designed to target tumours through
specific or associated antigens, without the need for hepatic metabolism. An ideal example
of a successful mAb in BC therapy is Trastuzumab which is administered to patients with
ER positive BC, in combination with chemotherapy. Attempts to address the potential use
of Notch mAbs have been made by a few research groups.
Qui and collegues, developed neutralising antibodies against human NOTCH-1(Qiu et al.,
2013). They found that inhibiting the pathway with mAbs resulted in decreased expression
of NOTCH-1 signal target genes in ER negative BC cells (Qiu et al., 2013). They also
reported that blocking the signal enhanced the anti-tumour efficacy of Docetaxel. Sharma
and colleagues characterised and determined the effects of several mAbs on ligand binding
and consequent receptor activation (Sharma et al., 2012). They observed that a mAb
specific to the EGF repeats 11 to 12, appeared to be the most effective in inhibiting
JAGGED-1 and DELTA-LIKE-4 binding to the NOTCH-1 receptor (Sharma et al., 2012).
Subsequently, these antibodies reduced the CSC population present in BC cell lines, as
well as the expression of NOTCH-1 target genes. Since breast tumours co-express NOTCH
receptors, mAb therapy is highly attractive, as a specific receptor and/or receptors may be

30
targeted effectively, eliminating the need to ―shut down‖ the entire pathway. Currently, the
use of Notch mAbs for the treatment of TNBC has not been used in clinical trials.
1.1.6.2 Notch-1 siRNA
RNA interference (RNAi) is an evolutionary conserved post-transcriptional gene-silencing
pathway that was first discovered in the nematode (Fire et al., 1998). It may be modulated
by double stranded RNA (dsRNA) molecules which are 21-23 nucleotides in length, and
are referred to as short interfering RNAs (siRNAs) (Karagiannis and El-Osta, 2005) .
Briefly, double stranded (dsRNA) is cleaved into siRNAs by the enzyme dicer and its
associated proteins. One strand, the guide strand, is integrated into the RNA induced
silencing complex (RISC), whereas the other strand is subjected to degradation. The guide
strand binds to a complementary mRNA which triggers its degradation by RISC.
The siRNAs are designed to interfere with the expression of specific genes, to ultimately
knock-down gene expression. The knock-down of NOTCH-1 or NOTCH-4 has strong anti-
proliferative effects in BC cell lines (Rizzo et al., 2008a). Zang and colleague reported that
down-regulating the expression of the NOTCH-1 receptor results in an increase in chemo-
sensitivity (Zang et al., 2010). These results show that siRNA may be a promising target
for BC treatment. However, the tissue and organ specific delivery; of siRNAs remains a
challenge. The central considerations include chemical modification and delivery strategy;
and here as appropriate chemical modifications help siRNA duplexes avoid immune-
stimulation and allow them to withstand degradation from nucleases. However, efficient
and tissue specific delivery may be the biggest challenge in the application of siRNA to

31
humans. To date, there are no clinical trials that have utilised NOTCH siRNAs in BC
patients.
1.1.6.3 ƴ-Secretase inhibitors
Ƴ-secretase is an intramembrane aspartyl protease with a molecular weight of
approximately 230 kiloDaltons (Wolfe, 2009, Lu et al., 2014). This is composed of four
subunits those are: Nicastrin, presenilin enhancer 2 (PEN2); presenilin; and anterior
pharnx-defective 1(APH1) (Golde et al., 2013). It cleaves more than 30 type 1
transmembrane proteins within their membrane spanning regions (Lu et al., 2014, Tolia
and De Strooper, 2009) and these cleaved products serve as signalling molecules. This
process is known as regulated intramembrane proteolysis (RIP) (Lu et al., 2014). Two of
its most extensively studied substrates are the amyloid precursor protein and the NOTCH
receptors (Lewis et al., 2003, 2014, Kim et al., 2004). Other substrates include HER-2,
epithelial cadherin (E-cadherin), Neural cadherin (N-cadherin), CD44, Nectin-1 and the
low density lipoproteins receptor (Wolfe, 2009). In the Notch pathway, it participates in
the final cleavage of the NOTCH receptor resulting in a NIC which is translocated to the
nucleus where it activates target gene expression (see Figure 1.4). Inhibiting this cleavage
step with small molecules could prove beneficial as it has previously been demonstrated
that targeting Notch with GSI suppressed survivin levels, induced apoptosis, abolished
colony formation of BC cells on soft agar and inhibited metastatic tumour growth in mice
(Lee et al., 2008b). Furthermore, other studies have shown that cell proliferation decreases
with GSI treatment in ER negative cell lines (Han et al., 2009, McClements et al., 2013,
Wang et al., 2010).

32
GSIs are divided into the following three classes: peptide isosteres, azepines and
sulphonamides. They may further be classified as Type 1 and 2 depending on their
structure and binding site (Olsauskas-Kuprys et al., 2013). Type 1 GSIs are transition-state
analogues, peptide isosteres that mimic the transition state of a substrate’s cleavage by γ-
secretase and competitively bind to the catalytic active site of presenilins (Olsauskas-
Kuprys et al., 2013). Type 2 GSIs are small non-transitional-state inhibitory molecules that
bind non-competitively to a site other than the active site, possibly at the interface of the γ-
secretase complex dimer (Olsauskas-Kuprys et al., 2013). These inhibitors target all four
NOTCH receptors, as well as other substrates; these side interactions may result in
gastrointestinal toxicities (Takebe et al., 2014, Espinoza and Miele, 2013). However, it has
been shown that glucocorticoid administration protects against GSI-induced gut toxicity, as
they antagonise the effects of NOTCH receptor inhibition in the intestinal epithelium. Thus
combining GSIs and glucocorticoids may improve the safety of GSIs when treating human
cancers (Wei et al., 2010) .

33
Figure 1.5 Potential Therapeutic targets for Notch in Triple negative Breast cancer. . The
pathway may be targeted by either: inhibiting receptor-ligand binding with monoclonal antibodies,
which would prevent activation of specific genes depending on which of the four receptors or five
ligands are targeted. Site2 (S2) may be blocked with mAb; siRNA. Site (S3) may be inhibited with
gamma secretase inhibitors. [Diagram was created on Microsoft Powerpoint 2010 (Msibi, 2015)].

34
1.2 Experimental approach and rationale
In view of the current literature on the Notch signal pathway and its association with
TNBC, it is valid to further investigate its effects on the manifestation and progression of
the disease.
Differences between Notch signalling in TNBC and Notch signalling in receptor positive
BC since as mentioned earlier majority of the research has been aimed at receptor positive
BC and there is also the thought that absence of oestrogen intensifies the signal. The
methodological approach applied in this study is briefly discussed below.
1.2.1 Experimental approach
To interrogate the effects of the pathway on TNBC, an in vitro approach will be employed.
Receptor negative cells that represent TNBC will be evaluated in comparison with receptor
positive cells which represent hormone sensitive BC. The receptor positive cells are treated
as the control group while the receptor negative group is treated as the experimental group.
1.2.1.1 Notch pathway inhibition
The pathway will be evaluated by inhibiting the pathway with pharmacological inhibitors
N-(N-3,5-Diflurophenacetyl-L-alanyl)-S-phenyl glycine t-Butyl Ester (DAPT) and N-
[(1S)-2-[[(7S)-6,7-Dihydro-5-5methyl-6-oxo-5H-dibenz[b,d] azepin-7-yl]amino-1-methyl-
2-oxoethyl]-3,difluorobenzeneacetamide (DBZ). Although both are classified as an
azapines, they represent a non-transitional state analogue and a transitional state analogue
(a competitive and non-competitive inhibitor) respectively.

35
1.2.1.2 Cellular proliferation and viability
The effects of Notch pathway inhibition on cell proliferation and viability of the cell lines,
in response to pharmacological inhibition will be evaluated by cell impedance assays,
using the xCELLigence (Roche Diagnostics, ACEA Biosciences Inc., USA) real time cell
analyses (RTCA), hereafter referred to as xCELLigence assays.
The xCELLigence (Roche) instrument is a microelectronic biosensor system that monitors
cell behaviour in real time, by measuring the resistance which is conferred by cells as they
attach and spread on electronic plates (E-plates). The E-plate consisting of 16 individual
wells has gold electrodes at the base of each well, that sense resistance. This resistance is
referred to as impedance, which is defined as the measure of the total opposition to the
electric current flow in an alternating current circuit, made up of two components: the
ohmic resistance and reactance (Figure 1.6). To quantify the status of cells based on
impedance, a parameter termed the Cell Index (CI) is derived according to the equation: CI
= max (Rcell (fi) / Rb(fi) – 1) i= 1,….N; where Rb(f) and Rcell represents the frequency-
dependant electrode resistances with cells and without cells respectively; and N represents
the number of the frequency points at which the impedance is measured. Thus the CI is a
quantitative measure of the overall status of the cells in a particular well, wherein an
increase in the number of cells that attach and spread on the electrode surface confers an
increase in the CI. There are several advantages of this technology compared to so-called
end-point assays (see Figure 1.6 below):
That it is a label-free detection system, resulting in minimal interference with normal cell
function.

36
Since measurement is read in real time, the physiological effects of any compound can be
assessed immediately as compared to an end-point assay, where cells are usually harvested
and results are read after a certain amount of hours (Figure 1.7).
It can be used to gather information on different cellular processes, such as, cell
proliferation, migration, compound-mediated cytotoxicity, apoptosis, and real-time
detection of viral cytopathic effects, cell adhesion, cell viability and proliferation.
The main disadvantage of this system is that it expensive and thus other simple assays are
applied to first optimise compound concentrations. In the present study the alternative
assay used to test drug concentrations was the Trypan Blue (TB) exclusion dye assay - a
classical end-point assay (see Figure 1.7 below).

37
Figure 1.6 A diagrammatic representation of the cell-electrode interaction in an E-plate.
Impedance increases as cells attach and divide. Panel A) as there are no cells attached to the gold
electrode there is therefore no resistance to the electrical current (arrows) flowing through the
electrode. As one cell attaches, the current decreases; and as two cells attach and spread there is a
further decrease in current. Panel B) The impedance (resistance) equals zero as there are no cells
attached to the electrode; as a cell attaches the resistance is increased and doubles when two cells
attach. The impedance is further increased by the strength of cell attachment to the electrode.
[Diagram was created on Microsoft Powerpoint, 2010; Msibi, 2014] and was adapted from
www.Roche.com.
38
The TB exclusion assay is a simple and inexpensive test that is used to determine cell
viability. TB is impermeable to live cell membranes, a property that is exploited by this
assay. The live cells (viable) will exclude the dye, whereas dead cells (non-viable) take it
in. Essentially, a cell suspension is produced and cells treated with TB are counted in a
haemocytometer viewed under a microscope, allowing for the calculation of the percentage
of viable (unstained cells) and non-viable (stained) cells. The TB assay thus provides for
an effective test to assess drug concentration in relation to cell viability. A schematic
representation of end-point versus real time assays is shown below (see Figure 1.7).

39
Figure 1.7 Schematic diagrams showing the difference between classical endpoint assay and
the xCELLigence RTCA technology. In a classical end-point assay there is a period termed the
―black box‖ in which the physiological effects of the inhibitor can’t be monitored or collected. Data
is only gathered after cell harvesting. In the xCelligence-RTCA system, there is no ―black box‖,
and cells may be monitored and data evaluated in real-time. [Diagrams were created on Microsoft
Powerpoint, 2010; Msibi, 2014].

40
1.2.1.3 Evaluating cell morphology and migration
Morphology and migration will be assessed by fluorescence and immunofluorescence
microscopy, specifically by monitoring alterations in the expression of the F-actin
cytoskeleton and the cell adhesion protein, E-cadherin. The F-actin cytoskeleton is critical
for cell motility, cell division, organelle movement, cell signaling and the establishment
and maintenance of cell junctions and cell shape (Doherty and McMahon, 2008). As the
cytoskeleton maintains the integrity of the cell its disruption can cause cellular arrest, as
well changes in the cell shape can interrupt communication amongst cells (Heng and Koh,
2010). The result is that any pathway that is dependent on paracrine signaling may become
aberrant.
E-cadherin is a homophilic cell-to-cell adhesion protein localized to the adherens junctions
of all epithelial cells (Kalluri and Weinberg, 2009). Its cytoplasmic domain effectively
creates a bridge between the cytoskeleton of adjacent cells by interacting with both cortical
actin filaments and the microtubule network (Yilmaz and Christofori, 2009). Amongst its
different functions it also serves as a tumor suppressor protein (Baranwal and Alahari,
2009).. Loss of E-cadherin results in invasion and migration therefore in this study the
presence of the protein will be used as a marker for migration potential of the cells, that is
cells that express the protein should be less invasive than those that do not.
The migration potential of each cell line will be assessed by employing the scratch assay.

41
1.2.2 Rationale
Determining the effects of Notch signalling on these aspects of cellular function, will
provide an insight into the probable role that the signal plays in TNBC tumour progression.
Additionally, while it has been shown that oestrogen inhibits Notch activity, there is
however little evidence to support this. Investigating the role of Notch inhibition in TNBC
versus ER positive BC, would improve our understanding of its functional role in TNBC
development. This would allow for the development of novel therapeutics that specifically
target the modulatory components of the Notch signalling pathway in patients with TNBC.
Here, the potential role of Notch signalling is queried in TNBC and more specifically, its
validity as a therapeutic target.

42
1.2.2.1 Aims and objectives
1.2.2.1.1 Aim
To evaluate the functional role of the Notch signalling pathway in triple negative (hormone
insensitive) breast cancer cell lines.
1.2.2.1.2 Objectives
1. Profile the cellular growth of the hormone sensitive Michigan Cancer Foundation –
7 (MCF7) breast cancer cell line, relative to the hormone insensitive M.D
Anderson- Metastatic Breast -231 (MDA-MB-231) and M.D Anderson-Metastatic
Breast-436 (MDA-MB 436) cell lines, using cell impedance assays.
2. Determine the effects of pharmacological inhibition on cell growth patterns in the
aforementioned cell lines, using cell impedance assays
3. Determine the protein expression of NIC and E-cadherin pre- and post-
pharmacological inhibition of the Notch signal.
4. Determine the effects of Notch signal inhibition on cell migration using scratch
assays.
5. Determine the effects of Notch signal inhibition on the F-actin cytoskeleton.

43
CHAPTER 2: MATERIALS AND METHODS
The overall summary of the experimental approach used here is presented in the diagram
below (Figure 2.1).
Tissue culture maintenance of hormone sensitive MCF-7, hormone
insensitive MDA-MB-231 and MDA-MB-436 cell line. In appropriate media
Growth profiling with xCelligence
Notch pathway inhibition by gamma secretase inhibitors DAPT and DBZ
Confocal Microscopy
Data analysis. Statistics Non parametric tests one-way ANOVA, Kruskal Wallis
test
Proliferation assay with
xCelligence
Migration assay
Figure 2.1. Flow diagram representation of methodology applied in this study. Cell lines were
cultured and maintained in appropriate conditions. Thereafter their normal growth patterns were
monitored in real time using cell impedance assays (xCELLigence, Roche). Cells were treated with
the pharmacological gamma secretase inhibitors, N-[(1S)-2-[[(7S)-6,7-Dihydro-5-methyl-6-oxo-
5H-dibenz[b,d]azepin-7-yl]amino]-1-methyl-2-oxoethyl]-3,difluorobenzeneacetamide (DBZ) and
N-(N-3, 5-Diflurophenacetyl-L-alanyl))-S-phenyl glycine t-Butyl Ester (DAPT), respectively.
The subsequent pharmacological effects on cell proliferation, migration, and protein expression
were assessed by each of xCelligence, scratch/migration assays and confocal microscopy,
respectively. All data was analysed using Graph Pad Prism v5. Non-parametric tests, including
One-way ANOVA and the Kruskal Wallis test were used for statistical analyses. Detailed protocols
are in appendice A. [Diagram was created on Coreldraw version 12 (Msibi 2014)].
44
2.1 Mammalian cell lines and cell culture maintenance
As mammalian cell culture utilising commercially acquired cell lines were used to study
the Notch pathway in vitro, human ethics clearance was not required (see ethics waiver-
Appendix B.5).
2.1.1 Cell lines
All cell lines were procured from the American Type Cell Culture (ATCC, USA). A
hormone sensitive BC cell line, MCF7 and two hormone insensitive BC cell lines, MDA-
MB-231 and MDA-MB-436 were utilised in this study. These cell lines are described
below and are summarised in Table 2.1:
The MCF-7 cell line is an invasive ductal adenocarcinoma breast cell line,
originally isolated from a metastatic site via pleural effusion in 1970 from a 69
year-old female Caucasian (Holliday and Spiers, 2011, Soule et al., 1973). In the
present study it was used as the control group because it expresses ER, PR and
HER-2 (which is not overexpressed)
Both the MDA-MB-231 and MDA-MB-436 cells are invasive ductal
adenocarcinoma breast cell lines, which were isolated from a metastatic site via
pleural effusion from 51-year old and 43-year old female Caucasians, respectively
(Brinkley et al., 1980, Chavez at al., 2010). Here they were used as the
experimental group, since they lack ER, PR and HER-2 and thus represent TNBC.

45
Table 2.1: A summary of the characteristics of the breast cell lines.
Cell line Hormone receptor status Ethnicity Age Phenotype Group
MCF-7 ER+ PR+ HER-2 + (not
overexpressed)
Caucasian 69 Luminal
epithelial
control
MDA-
MB-231
ER-.PR-,HER-2- Caucasian 51 Basal
epithelial
experimental
MDA-
MB-436
ER-,PR-,HER-2- Caucasian 43 Basal
epithelial
experimental
2.1.2 Cell culture maintenance
The cell lines mentioned above were grown and maintained in cell culture flasks (SPL-Life
Sciences) and were incubated at 37 C in 5% CO2 (ThermoForm series ll water jacketed
CO2 Incubator [HEPA FILTER]). The MCF-7 and MDA-MB-231 cell lines were grown in
DMEM-F12 (#BE12-719F, Biowhittaker® Lonza,USA) medium supplemented with 10%
(v/v) foetal bovine serum (FBS) (#SV30160.03, HYCLONE®, USA) and 1% (v/v)
antibiotic penicillin/streptomycin (#17-602E, Biowhittaker®
Lonza, USA).
The MDA-MB-436 cell line was cultured in Leibovitz media (L-15) (#BE12-700F,
Biowhittaker® Lonza,USA), supplemented with 10% (v/v) FBS, 0.1% (v/v) human insulin
(#19278,Sigma Life Sciences, USA), 0.08% L-glutamine (#G7513, Sigma Life Sciences,
USA) and 1% (v/v) antibiotic penicillin/streptomycin (#17-602E, Biowhittaker ®
Lonza,
USA). Cell growth media was changed every 3 days and confluency was monitored with
an inverted phase contrast microscope (Carl Zeiss Axiovert 25).

46
2.2 Analysis of cellular proliferation
2.2.1 Normal growth curve profiling
As a first approach, normal growth signatures of each cell line were monitored with
xCelligence-RTCA (Roche) both to assess individual differences in growth patterns and to
compare the growth patterns of TNBC cell lines versus the hormone sensitive cell line.
Cells were grown in culture flasks until they reached 80% - 90% confluence. They were
then trypsinized to create a single suspension and counted using an automated cell counter
(Bio-Rad) (see Appendix B.1 and B.4). The cell count for each cell line was adjusted to an
optimised seeding density (see Table 2.2 and optimisation in Appendix C.1).
Table 2.2: Optimised cell seeding density for xCelligence studies.
CELL LINE SEEDING DENSITY cells/ml
MCF-7 10000
MDA-MB-231 5000
MDA-MB-436 5000
A volume of 100µl of culture medium, appropriate to the particular cell line, was added
into each well of a 16–well E-plate (ACEA, San Diago). Prior to initiating an experiment,
with the addition of cells, a reading of this complete drug-free medium was taken as a
background scan; this was done for 1min. Thereafter 100µl of cell suspension was added to
each well and mixed thoroughly with the medium to give a final volume of 200µl per well.
The E-Plates were incubated at 37 C and 5 CO2 to allow cells to adhere to the bottom of
the well surface for 45mins, as advised by Roche. Thereafter the plates were inserted on

47
the instrument’s docking port and the monitoring system was set to record readings every
30mins for a total of 200hrs.
2.2.2 Cell viability and proliferation assays
To determine the effects of Notch pathway inhibition in BC cells, two γ-secretase
inhibitors , DAPT (#D5942-5mg; Sigma Life Sciences) and DBZ (Tocris Biosciences,
Bristol UK) were evaluated. Dimethyl Sulfoxide (DMSO) was used to dissolve the
lyophilised form of the inhibitors and thus was included here as the vehicle control at
0.2%. The xCELLigence (Roche) instrument was employed to assess the effects of each
inhibitor on the cell proliferation and viability. In addition the TB exclusion-dye assay was
performed for the purposes of comparing it to xCelligence cell viability data and to
optimise inhibitor concentrations.
2.2.2.1 xCelligence-proliferation and viability assay
All the steps of the normal growth profiling assay were followed, as described above. Cells
were cultured in complete medium for 22-24 hours; and then wells of the E-plates were
rinsed 3 times with 200µl of Phosphate Buffered Saline (PBS) (# P4417-100TAB; Sigma
Life Sciences). Next 200µl of serum-free media was added to each well. The addition of
serum-free media was done for the purpose of serum starvation, a process that arrests cells
in G1/G0 phase of the cell cycle (Weinberg and Lundberg, 1999). Synchronizing the cells
at the same phase of the cycle allows them to re-enter the cycle, once they are cultured
again with serum containing medium.

48
Following serum starvation, wells were rinsed once with PBS and then 200ul of complete
medium containing either 20µM of DAPT, 20µM DBZ, 20µl DMSO (vehicle control) or
complete drug-free medium (untreated control) was added to the wells. The plates were
incubated at 37 C in 5% CO2 in air for 48 hours, with impedance readings being recorded
every 30mins.
2.2.2.2 Trypan blue exclusion cell viability assay
In the TB exclusion assay cells were grown in 12 well cell culture plates (SPL Life
Sciences), at a seeding density of 2 x 10³
cells/well. After 22-24 hours, the cells were
rinsed 3 times with 1ml of sterile PBS. After this, 1ml of serum-free media was added to
each well, to serum starve for 18-20 hours. Following serum starvation, wells were washed
once with PBS, then 1ml of complete medium containing one of either 20µM of DAPT,
20µM DBZ, or 20µl DMSO (vehicle control) was added. In the case of untreated controls,
complete drug-free media (untreated control) was added to wells. Then cells were
incubated at 37 C in 5% CO2 in air for 48 hours. Thereafter the wells were rinsed 3 times
with PBS, and the cells were trypsinized with 200µl of trypsin/EDTA for 3mins. After
neutralizing the trypsin solution with complete medium, the cells were pelleted by
centrifuging in 1ml Eppendorf tubes at 800rpm for 3mins; the supernatant was discarded
and the cell pellet was re-suspended in 200µl of serum-free media to prepare for cell
counting (TB binds to serum proteins, hence the use of serum-free media). Thereafter 10ul
of TB was mixed with 10ul of cell suspension, making a 20ul mixture and 10ul of this
mixture was loaded onto the haemocytometer. Cells were counted and viability was
calculated by the formula: Percentage viability = [1.00 – (Number of non-viable cells ÷
Number of total cells)] × 100

49
2.3 Confocal immunofluorescence microscopy
The immunofluorescence staining technique makes use of antibodies to locate and identify
the expression patterns of proteins in cells. A primary antibody will bind specifically to an
antigen and a secondary antibody conjugated to a fluorochrome then binds to the primary
antibody (Fritschy and Härtig, 2001). This binding allows for the detection of the target
protein. When the fluorochrome absorbs high energy light it is excited and fluoresces at its
characteristic emission wavelength, thus making it possible to detect the antibody-antigen
complex (Fritschy and Härtig, 2001). The fluorescent proteins are viewed with a
fluorescence microscope. There are different types of fluorescence microscopes and here a
confocal scanning laser microscope was used. A confocal microscope (Figure 2.2)
provides high resolution images and three dimensional reconstructions of specimens, and
enables the co-localisation of two or more proteins on the same specimen.

50
Figure 2.2. Principal of the confocal laser microscope. Light from a laser beam passes through
the aperture, whereupon this light is then focused by the objective lens into the surface of a
specimen. The reflection from the specimen passes back through the objective lens. The beam
splitter separates a portion of the light. The light passes through the pinhole into the photomultiplier
that then detects the intensity of the light. The light signal is transformed into an electrical signal
that is read by the computer. [Diagrams were created on Microsoft Powerpoint 2010 (Msibi 2015)].

51
Here, the cellular expression and localisation of NIC and E-cadherin proteins within each
cell line were assessed. Also, possible changes in cellular morphology were evaluated
following treatment with the Notch inhibitors.
2.3.1 Immunofluorescence staining
2.3.1.1 Cell preparation
Cells were grown in appropriate media on sterile glass coverslips in 6 well culture plates
(SPL Life Sciences) and were allowed to reach 50% confluence. Once the required cell
confluence had been reached, cells were rinsed in PBS and medium was replenished with
serum-free medium. This allowed for serum starvation which was done for 18-20hrs.
Following this, cells were treated with complete medium containing 20µM DAPT, 20µM
DBZ or 20µl of DMSO (vehicle control), or treated with complete medium alone
(untreated control) and were incubated for 48 hours at 37 C in 5% CO2 in air.
After the 48 hour incubation period, the cells were rinsed 3 times with 1ml of PBS; then
fixed for 15mins in an incubator at 37 C in pre-warmed 3% PBS-formaldehyde solution
(Appendices A.1.3) and were subsequently rinsed 3 times with 1ml of PBS.
In order to allow for intracellular staining and to block non-specific antibody binding, the
cells were permeabilized with warm PBS-BSA (Santa Cruz Biotechnology) containing
Triton X-100 (Appendix A.1.4) for 5mins at room temperature (RT). Triton X-100 is a
detergent that permeabilizes cell membranes, whilst BSA binds antigenic sites and blocks
non-specific antibody binding. After permeabilising, the cells were rinsed 3 times with
PBS to remove excess Triton X-100.

52
2.3.1.2 Primary and Secondary antibody staining
The cells were incubated overnight at37 C with 100µl of the following primary antibodies:
rabbit-Anti-Notch-1 intracellular component domain (#07-1231; Merck Millipore) or
purified mouse anti-E-cadherin (#610181; BD Transduction Laboratories ™) optimally
diluted at 1:200 and 1:2500, respectively in warm PBS-BSA buffer. An additional negative
control was to include the primary antibody incubation step, but to exclude the secondary
antibody, substituting this with PBS-BSA.
The following morning the cells were rinsed with pre-warmed PBS-BSA 5 times with 1
min incubations. Next the cells were incubated in a dark cupboard for 1hr at RT with 100µl
of one of the following secondary antibodies: donkey anti-rabbit IgG (H+L) Alexa Fluor®
488 (# A21203 Invitrogen) or donkey anti-mouse IgG (H+L) Alexa Fluor® 549 (#A21203
Invitrogen) diluted at 1:200 and 1:2500, respectively in 0.05% PBS-BSA. After 30mins
into the secondary antibody incubation period, slides were further incubated with an
additional 100µl of Cyto-painter Phalloidin iFluor 488 Reagent (# ab176753; ABCAM ®
)
to stain the F-actin cytoskeleton. Phalloidin is a heptapeptide that binds to F-actin. It
stabilizes the filaments thereby preventing depolymerisation of actin fibers. An additional
negative control was to include the secondary antibody incubation step, but to exclude the
primary antibody, substituting this with PBS-BSA.
2.3.1.3 Nuclear staining
Subsequent to the secondary antibody and F-actin staining, the cells were rinsed 5 times
with pre-warmed PBS-BSA at 1min incubations. The cells were then incubated in a dark
cupboard for a further 5mins with a 100µl solution of 4’, 6-diamidino-2-phenylindole

53
(DAPI) (#236276; Cell Biology Boehringer Mannheim, Germany) at RT. The cells were
then rinsed 5 times at 1min incubations with PBS. Next, the coverslips were mounted onto
glass slides with Fluorogel Mount (#17985-10, Electron Microscopy Sciences) and were
left to dry in the dark for a few hours. These were then placed in a box and stored at 4 C,
till viewing the next day on a Carl Zeiss LSM 780 Confocal Microscope (63 X
Magnification).
2.3.1.4 Z-sectioning and 3 dimensional reconstruction analysis
The properties of the confocal laser scanning microscope allow for the optical sectioning in
the Z- axis. The pinhole, a small, adjustable diaphram placed in front of the PMT (see
Figure 2.2), eliminates unwanted light from out-of-focus areas. Capturing a series, or stack,
of images focused at regularly placed intervals through the depth of an object of interest
allows one to subsequently create renderings to visualise the entire sample in 3 dimensions
(3D). Z-stacking of specimens was recorded using the Z-stack mode of the Carl Zeiss LSM
780 Confocal microscope (63X Magnification) (Appendix D).
2.4 Cell migration study
To assess cell migration the scratch assay technique was used. Here cells are seeded onto a
sterile glass coverslip and grown to confluence. A cell-free area referred to as a ―gap‖ was
created by scoring through the cell monolayer with a sterile plastic pipette tip (Kramer et
al., 2013). The gap closure by cell migration is then monitored by microscopy over a
specific period of time. This assay can directly reflect the cell dynamics and cell contacts
that are involved in cellular migration (Liang et al., 2007, Kramer et al., 2013). Thus the

54
time it takes for the gap to close is an indication of the migration potential of the cell line
(Liang et al., 2007).
2.4.1 Cell migration assay
Approximately 50000 cells/ml (in appropriate culture media) were seeded onto heat
sterilised glass coverslips contained in each well of a 6 well cell culture plate (SPL Life
Sciences) and were allowed to reach 100% confluence. The coverslips were then rinsed 3
times with PBS and 1ml of serum-free medium was then added, to facilitate 18-20 hours of
serum starvation; subsequently the serum-free medium was removed and the wells were
rinsed once with PBS. Next, the coverslip was scored or scratched through the confluent
monolayer of cells with a sterile (200 µl) pipette tip to create a cell-free area. Following
this, the coverslip was rinsed once with PBS to remove any cell remnants from the scored
area. Thereafter 1 ml of complete medium containing either 20 µM DAPT, 20 µM DBZ, or
20 µl DMSO (vehicle control) or 1 ml of complete drug-free medium (untreated control)
was added to each well. The gap closure was monitored every 2 hours for 48 hours to
analyse the cell migration distance over time, this with an inverted microscope (Olympus
IX71), and viewed under a 4X objective. The images were captured with an Olympus
CKX41 camera. The extent of migration of cells into the gap was calculated at three points
(Appendix E.1); the quantification of the relative closure of the gap was undertaken and
compared with that of the control by using ImageJ software; pixels were converted to µm
to obtain the value pixels/µm (Appendix E.1).

55
2.5 Data analysis
Experiments were performed in biological triplicates. All average and standard deviation
(SDV) values were calculated in Microsoft Excel 2010 and were exported to Graph Pad
PrismPad Prism, version 5. To evaluate the statistical difference between normal growth CI
values of all three cell lines, non-parametric ANOVA analysis, followed by the Kruskal
Wallis test were performed. To assess the effect of GSI between MCF-7 and MDA-MB-
231 or MCF-7 and MDA-MB-436, an unpaired Student’s t-test was calculated with 95%
confidence. Finally, to evaluate the effects of the different GSIs on a cell line, a paired
Student’s t-test was calculated with 95% confidence. A p-value that was <0.05 was
considered significant.

56
CHAPTER 3: RESULTS
3.1 Determination of the activity of Notch and the effect of gamma
secretase inhibition
3.1.1 Notch signalling is active in breast cancer cells and NIC expression decreases
post- inhibitor treatment
To determine the activity of Notch signalling in human BC cells and the expression and
localisation of NIC within the cells, indirect immunofluorescence was used. BC cells were
stained with an anti-NIC antibody, the cleaved product of γ-secretase which represents the
activity of the pathway (Figure 1.4). This (NIC) was then localised using a secondary
antibody conjugated to a fluorescent Alexa Fluor dye. In order to control for non-specific
antibody binding, negative controls were carried out, wherein either the primary or the
secondary antibody was omitted and substituted with PBS. These controls effectively
showed a lack of non-specific primary or secondary antibody binding (see Appendix D.1).
Following serum starvation the cells were then treated with 20µM DAPT, 20µM DBZ,
20µl DMSO (vehicle control) or complete drug-free (untreated) medium , respectively, for
48hrs. The MCF-7 cell line demonstrated specific NIC (green) localisation, which
appeared as discrete punctate areas on the nucleus (blue), being specifically associated
with the nucleoli, the expression of which decreases when treated with each inhibitor
(Figure 3.1-panel A- L arrows). In addition there is also some perinuclear staining that was
observed.

57
In all the cell lines DAPT treatment results in a more drastic decrease of the NIC signal
compared to DBZ and DMSO. The MDA-MB-436 cell lines show the same NIC-nucleoli
localisation, but with a lower expression than in the MCF-7 drug treated cells (Figure 3.1-
panel I) and untreated cells. DAPT in these cells also causes a marked decrease in NIC
expression compared to treatment with each of DBZ and DMSO (Figure 3.1 panel J-L).
In the MDA-MB-231 cell line, NIC expression was raised, being concentrated both in a the
perinuclear staining pattern and also being dispersed over the nucleus, largely masking the
nucleoli that are visible in the nuclei of the other two cell lines (Figure 3.1 panel E-F). The
nucleoli following NIC localisation are only faintly visible post-GSI treatment; and
furthermore, both GSI’s cause a dramatic decrease in nucleoli associated expression of
NIC in the MDA-MB-231 cell line (Figure 3.1 panel G-H).

58
Figure 3.1. Notch signalling is active in breast cancer cells and its expression decreases post
inhibitor treatment. Cells were treated with 20µM of either DAPT or DBZ. DMSO was used as a
vehicle control. Each drug inhibits the pathway as the NIC signal represented by positively staining
green nucleoli, decreases post-treatment. DAPT decreased the expression of NIC in MDA-MB-436
(Panel I-L) and MCF-7 (Panel A-D) cell lines, respectively. Both DAPT and DBZ decrease the
expression of NIC in MDA-MB231 (Panel E-H). [Cells were stained with donkey anti-rabbit IgG
(H+L) Alexa Fluo® 488 (# A21203 Invitrogen) to detect NIC (green) and DAPI for the
nucleus(blue); and visualised using a Carl Zeiss LSM 780 Confocal Microscope, 63X objective.].
Key: A-D= MCF-7; E-H= MDA-MB231; I-L=MDA-MB436 NIC= Notch Intracellular Component
NU=Nucleus

59
3.2 Effect of Notch on breast cancer cells
3.2.1 Oestrogen receptor positive cells grow more rapidly compared to TNBC cell lines
Following on the evaluation of Notch activity, through NIC expression in the hormone
insensitive and hormone responsive BC cell lines, it was of interest to determine the
potential effects of the pathway on cell proliferation.
Firstly, cell impedance assays using the xCelligence instrument (Roche) were used to
evaluate the normal growth profiles of each cell line. The curves presented below (Figure
3.2) represent 3-repeats for each cell line. The MCF-7 cell line (blue) has a cell index (CI)
of 6.9836 at 74.5hrs, which is the highest among the three cell lines. The MDA-MB-
231(red) and MDA-MB-436 (green) cell lines have a CI of 1.9799 and 3.1712 respectively
(Figure 3.2). The MCF-7 cells grow exponentially (log phase) for 20 hours before
beginning to plateau. These cells grow significantly (p<0.001, ANOVA, Kruskal Wallis
test) faster, compared to, the MDA-MB-231 and MDA-MB-436 cell lines, which grow
exponentially for 22 hours, before they begin to plateau (Figure 3.2).

60
Figure 3.2 Normal cell growth profile of hormone receptor positive cell line (MCF-7)
compared to hormone receptor negative positive cell line (MDA-MB-231 and MDA-MB-436). Cell impedance shows that MCF-7 (blue) has higher cell index compared to MDA-MB-231 (red)
and MDA-MB-436 (green). The MCF-7 cell line has a significantly faster growth curve (p<0.001,
ANOVA, Kruskal Wallis test) compared to MDA-MB-231 and MDA-MB-436 cell lines. Error
bars represent standard deviation of N=3.

61
3.2.2 Notch signal pathway inhibition decreases cell proliferation and viability in
breast cancer cells
To determine the effects of Notch signalling on cell proliferation and viability, GSI’s were
used. Prior to drug treatment, each of the cell lines were serum starved (Appendix C.3) and
then treated with 20µM DAPT, 20µM DBZ, and 20µl DMSO (vehicle control) or complete
drug-free medium (media control), respectively. As an initial assessment of the
pharmacological activity of the GSI’s on cell growth, the end-point TB cell viability assay
was employed. This was then compared with the real-time measurements of cell viability
measured with the xCelligence-RTCA instrument (Roche).
3.2.2.1 Trypan blue assay cell viability
The results of the TB assay show that cell viability decreases non-significantly with DBZ
treatment in all cell lines, after 48hrs of treatment (Figure 3.3). Treatment with DAPT
resulted in a 67% cell viability of the MDA-MB-231 cell line. The viability is less
compared with the 87.68% and 96.67% of the MCF-7 and MDA-MB-436 cell lines,
respectively.
All three cell lines were sensitive to DBZ, with a 29% , 27.67% and 22.22% decrease in
cell viability of MCF-7, MDA-MB-231 and MDA-MB-436 cell lines respectively (Figure
3.3). Despite observing this trend of sensitivity, the effect of each treatment on each cell
line was not statistically significant (p> 0.05, ANOVA, Kruskal Wallis test). Nevertheless
a comparison between the DBZ and DAPT treatments shows that the effects of these drugs
were significantly different (p<0.05, paired Student’s t-test) in the MDA-MB-231cells.
However, their pharmacological effects were indifferent in both of the MCF-7 and MDA-

62
MB-436 cell lines, respectively (p> 0.05, paired Student’s t-test). There is no significant
difference between the DMSO vehicle control and Media control, indicating that DMSO
does not have anti-proliferative effects on each cell line.

63
Figure 3.3 TB assay cell viability of breast cancer cells. TB assay following 48hrs of GSI
treatment shows that DBZ decreased cell proliferation in MCF-7(blue), MDA-MB-231(red) and
MDA-MB-436(green), cell lines although not significantly (p>0.05, paired Student’s t-test). The
proliferation of the MDA-MB-231 cell lines was significantly affected by DAPT (p<0.05, paired
Student’s t-test). Overall, GSI treatment did not cause a statistically significant decrease in cell
viability (p> 0.05 ANOVA, Kruskal Wallis test) in all three cell lines. Error bars represent standard
deviation of N=3.

64
3.2.2.2 xCelligence-RTCA cell proliferation and viability
In assessing cell viability and cell proliferation using xCelligence, at the end of 48hrs of
drug treatment the CI for the MCF-7 cell line was 1.7920 when treated with DAPT which
was significantly less, compared to a CI of 2.6847 than when treated with DBZ (p < 0.05
paired, Student’s t-test). In comparison, the proliferation and viability of the MDA-MB-
231 and MDA-MB-436 cell lines was significantly more decreased by DBZ, with CI’s of
0.3704 and 0.4958 , respectively (p< 0.05 paired Student’s t-test), when compared to the
CI’s of 0.4360 and 0.67503, after DAPT treatment.
With a CI of 3.3671, 0.4800 and 0.8200 for MCF-7, MDA-MB-231 and MDA-MB-436,
respectively, the vehicle control DMSO decreases cell viability and proliferation.
However, this was not as significant as the recorded effects of GSI’s on each of the cell
lines (Figure 3.4, 3.5 and 3.6). Overall the results show that decrease of both cell viability
and proliferation following inhibition of Notch was statistically significant in the TNBC
cell lines compared to the receptor positive cell line (p<0.001, ANOVA, Kruskal Wallis
test).
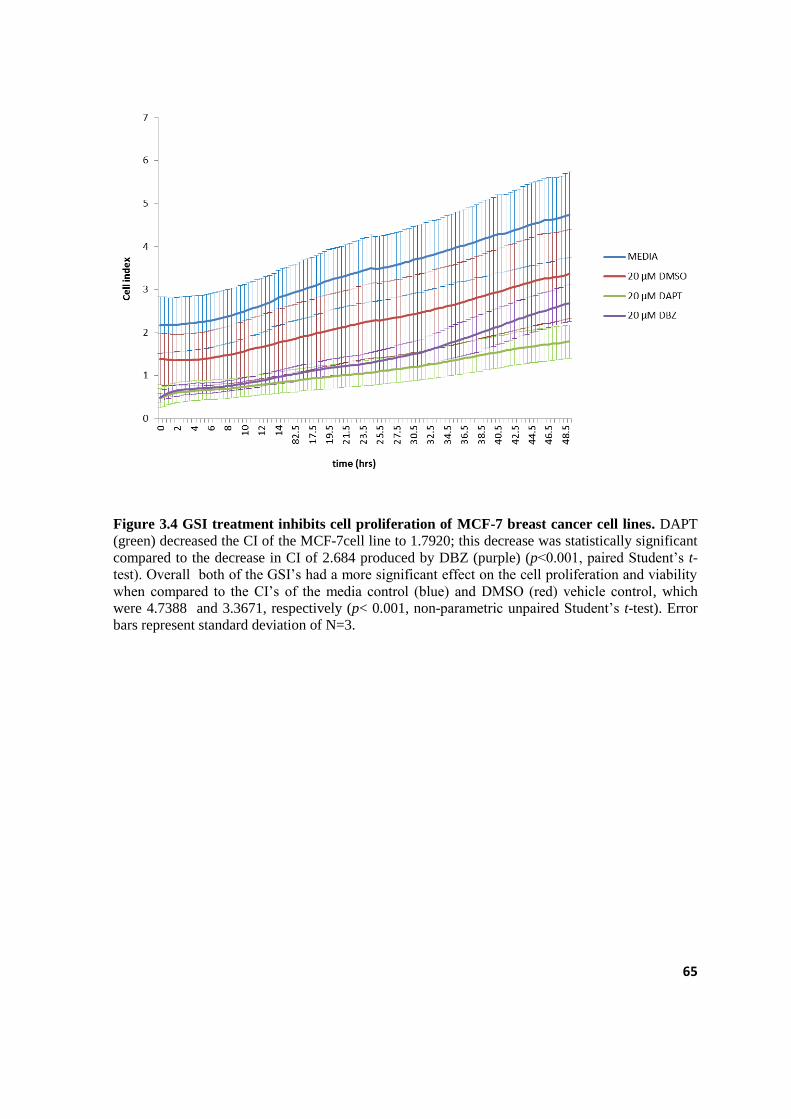
65
Figure 3.4 GSI treatment inhibits cell proliferation of MCF-7 breast cancer cell lines. DAPT
(green) decreased the CI of the MCF-7cell line to 1.7920; this decrease was statistically significant
compared to the decrease in CI of 2.684 produced by DBZ (purple) (p<0.001, paired Student’s t-
test). Overall both of the GSI’s had a more significant effect on the cell proliferation and viability
when compared to the CI’s of the media control (blue) and DMSO (red) vehicle control, which
were 4.7388 and 3.3671, respectively (p< 0.001, non-parametric unpaired Student’s t-test). Error
bars represent standard deviation of N=3.

66
Figure 3.5 GSI treatment inhibits cell proliferation of MDA-MB-231 breast cancer cell lines.
DBZ (purple) decreased the CI of the MDA-MB-231 cell line to 0.3704; this decrease was
statistically significant compared to the decrease in CI of 0.4360 produced by DAPT (p<0.001,
paired, Student’s t-test). Overall both of the GSI’s had a more significant effect on the cell
proliferation and viability when compared to the CI’s of the media control (blue) and DMSO (red)
vehicle control, these were 0.9860 and 0.4800, respectively (p< 0.001, non-parametric unpaired,
Student’s t-test). Error bars represent standard deviation of N=3.

67
Figure 3.6 GSI treatment inhibits cell proliferation of MDA-MB-436 breast cancer cell line.
DBZ (purple) decreased the CI of the MDA-MB-436 cell line to 0.4958; this decrease was
statistically significant compared to the decrease in CI of 0.6750 produced by DAPT (green)
(p<0.001, paired Student’s t-test). Overall both of the GSI’s had a more significant effect on the
cell proliferation and viability when compared to the CI’s of the media control (blue) and DMSO
(red) vehicle control, which were 0.945 and 0.8200 respectively (p< 0.001, non-parametric
unpaired Student’s t-test). Error bars represent standard deviation of N=3.

68
3.3 Effect on cell morphology and cell migration
3.3.1 Notch inhibition decreases expression of E-cadherin in MCF-7 cells and alters cell
morphology in MDA-MB-231 and MDA-MB-436 cell lines.
3.3.1.1 The expression of E-cadherin in human breast cancer cells
To evaluate the potential of Notch inhibition on a marker of cell adhesion and migration
indirect immunofluorescence was used to detect the BC tumour invasion marker E-
cadherin (Figure 3.7 and 3.8) (Singhai et al., 2011). This was done to assess whether there
is a change in the expression and localisation of E-cadherin in BC cells post drug-
treatment. The cell membranes were either permeabilized or not permeabilized, to assess
intracellular localisation or cell surface localisation, respectively. To further assess the
precise localisation of the markers of interest, Z-section sectioning and 3D surface
projections of the cells were analysed.
In the permeabilised cell group, E-cadherin is highly expressed in the MCF-7 cell line
within the cytoplasm, the nucleus and the cell membrane (supplementary image in
Appendix D.3). Its expression decreases when treated with GSI, whereby DBZ causes a
greater decrease compared to DAPT treatment (Figure 3.7-a panel A-D; Figure 3.7-b panel
A-D; Figure 3.8-c panel A-D and Figure 3.8-d panel A-D).
The MDA-MB-231 cell line appeared not to express E-cadherin pre-treatment, indicating
that it is a highly invasive cell line and that it has a high migration potential. Post GSI
treatment, its expression was not up-regulated (Figure 3.7-a panel E-H; Figure 3.7-b panel
E-H). Similarly the MDA-MB-436 cell line does not appear to express E-cadherin and

69
treatment with GSIs did not alter this status (Figure 3.7-a panel I-L; Figure 3.7-b panel I-
L).
The non-permeabilised cell group shows a similar staining pattern for E-cadherin
expression in all the cell lines, as recorded for the permeabilised breast cell group. The
MDA-MB-231 and MDA-MB-436 cell lines lacked any E-cadherin expression at any
intracellular location (Figure 3.8-a panel E-H; Figure 3.8-b panel E-H; Figure 3.8-a panel
I-L; Figure 3.8-b panel I-L).
3.3.1.2 The morphology of human breast cancer cells
Next, to determine the effect of GSIs on the cytoskeleton, indirect immunofluorescence
was used to visualize the F-actin cytoskeleton with fluorescently labelled phalloidin
(Figure 3.7-a; Figure 3.7-b; Figure 3.8-a and Figure 3.8-b). Following drug treatment, the
F-actin cytoskeleton of the MCF-7 cell line was apparently not adversely affected by the
GSIs. Although the cells appear slightly detached from each other (Figure 3.7-a panel B,
C), their shape remains the same, as in the untreated control (Figure 3.7-a panel A).
In MDA-MB-231 cells DBZ caused a change in the distribution of F-actin, as it appears
aggregated around the nucleus (Figure 3.7-a and 3.7-b panel; Figure 3.8-a and 3.8-b panel
H) which results in a change in cell shape from a fibroblast shape (Figure 3.7-a panel E and
Figure 3.8-a panel E) when untreated to a more round shape post-treatment. With DAPT
treatment the F-actin cytoskeleton aggregates adjacent to the nucleus (Figure 3.7-a panel G
and Figure 3.7-b panel G) however, this was not observed in the non-permeabilised cells
(Figure 3.8-a panel G and Figure 3.8-b panel G). The cytoplasmic stress fibers are lost as
well as a result of DBZ and DAPT treatment (Figure 3.7-a panel E-H).

70
The F-actin cytoskeleton in the MDA-MB-436 cells is aggregated adjacent to the nucleus
(Figure 3.7-a panel I-L; Figure 3.7-b panel I-L; Figure 3.8-a panel I-L and Figure 3.8-b),
this is not affected by drug treatment. There is also nuclear localisation of F-actin
observed, in DBZ treated non-permeabilised cells (Figure 3.8-a panel J, L and Figure 3.8-b
panel J, L).The cytoplasmic stress fibers of these cells decrease post-treatment and there is
in an increase in filapodia in the DAPT (Figure 3.7-a panel K) treated cells.

71
Figure 3.7 a) Effects of Notch inhibition on the expression of E-cadherin and cell morphology
in permeabilised cells Permeabilised E-cadherin (red) expression decreases with inhibitor
treatment (panel A-D). DBZ causes a decrease in E-cadherin expression in MCF-7 cells (panel D)
whereas, F-actin (green) is relatively unaffected by either inhibitor (panel C and D). MDA-MB-231
cells lack E-cadherin signal post-treatment with DAPT/DBZ (panel E-H). Furthermore, the
distribution of F-actin within these cells is altered post-treatment (panel G and H), indicating a
change in cell morphology. F-actin appears punctate in MDA-MB-436 (panel I-L) and MDA-MB-
231 (panel G).
Key: NU= nucleus; E-cad=E-cadherin; CJ= Cell Junction; A-F= MCF-7; E-H=MDA-MB231;
I-L=MDA-MB436

72
Figure 3.7 b) 3D projections, generated from Z-sectioning; Zeiss LSM 780 permeabilised
cells. The YZ3 dimensional projection images of the cell lines seen which are represented in figure
3.7-a. Here membrane staining of E-cadherin in the MCF-7 cell line is clearly visible (panel A-D)
and there is aggregation of F-actin adjacent to the nucleus visible in the MDA-MB-231 (panel E-H)
and MDA-MB436 cell lines (panel I-L).
Key: NU= nucleus; E-cad=E-cadherin; CJ= Cell Junction; A-F= MCF-7; E-H=MDA-MB231; I-
L=MDA-MB436

73
Figure 3.8 a) Effects of Notch inhibition on the expression of E-cadherin and cell
morphology in non-permeabilised cells. Non-Permeabilised E-cadherin (red) expression
decreases with inhibitor treatment (panel A-D). DBZ causes a decrease in E-cadherin
expression in MCF-7 cells (panel D) whereas, F-actin (green) is relatively unaffected by
either inhibitor (panel A-D). MDA-MB-231 cells lack E-cadherin signal post-treatment
with DAPT/DBZ (panel E-H). Furthermore, the distribution of F-actin within these cells is
altered post-treatment, indicating a change in cell morphology. F-actin appears punctate in MDA-
MB-436 (panel I-L) and MDA-MB-231 (panel E, F).
Key: NU= nucleus; E-cad=E-cadherin; CJ= Cell Junction; A-F= MCF-7; E-H=MDA-MB231; I-
L=MDA-MB436

74
Figure 3.8 b) 3D projection, generated from Z-sectioning; Zeiss LSM 780 non-permebilised The YZ 3 dimensional projection images of the cell lines seen which are represented in Figure 3.8-
c. Here perinuclear staining of E-cadherin in MCF-7 cells (panel A-D) is clearly visible.
Perinuclear and nuclear actin is visible in the MDA-MB-436 cell line (panel I-L).
Key: NU= nucleus; E-cad=E-cadherin; CJ= Cell Junction; A-F= MCF-7; E-H=MDA-MB231; I-
L=MDA-MB436

75
3.3.2 Notch inhibition does not affect cell migration in BC cell lines.
A scratch/migration assay was used to evaluate the effects of Notch signal pathway
inhibition on cell migration. The distance the cells moved was recorded every 2hrs. This
data is represented below by images of a scratch/migration assay and a plot of cell
migration (gap closure) over time, for each respective treatment.
After 48 hours of treatment with GSI, cell migration of the MCF-7 hormone sensitive cell
line is not significantly different from either the untreated or the vehicle control (Figure
3.9). Similarly the migration of MDA-MB-231 (Figure 3.10) and MDA-MB-436 (Figure
3.11) cell lines is not significantly different, when compared to their respective vehicle and
untreated controls.

76
Figure 3.9.a) Notch inhibition does not affect cell migration in MCF-7 cell line. Scratch assay
of MCF-7, gap closure was not significantly affected by the DMSO vehicle control and GSI
treatment at 48hrs. The white arrow indicates the cell free area that was measured over time. The
gap closure is represented in plots below. (4X magnification)

77
Figure 3.9 b) A plot representing the gap closure in Notch inhibited MCF7 cells. Gap closure
was not significantly affected by either GSI treatment at 48hrs (p>0.05, paired Student’s t-test) and
was not significantly different from the controls (p>0.05, ANOVA, Kruskal Wallis test). Error Bars
represent standard deviation of N=3

78
Figure 3.10.a) Notch inhibition does not affect cell migration in MDA-MB-231 cell line.
Scratch assay of MDA-MB-231, gap closure appears to have been inhibited by the DMO vehicle
control and DAPT at 48hrs. Treatment with DBZ appears to have little effect on the cell line. The
white arrow indicates the cell free area that was measured over time. The gap closure is represented
in plots below. (4X magnification)

79
Figure 3.10 b) A plot representing the gap closure in Notch inhibited MDA-MB-231 cells.Gap
closure was not significantly affected by either GSI treatment (p>0.05, paired, Student’s t-test) and
was not significantly different from the controls (p>0.05, ANOVA, Kruskal Wallis test) at 48hrs.
Error Bars represent standard deviation of N=3

80
Figure 3.11.a) Notch inhibition does not affect cell migration in MDA-MB-436 cell line.
Scratch assay of MDA-MB-436 cells. Gap closure was not significantly affected by the DMSO
vehicle control and GSI treatment at 48hrs. The white arrow indicates the cell free area that was
measured over time. The gap closure is represented in plots below. (4X magnification)
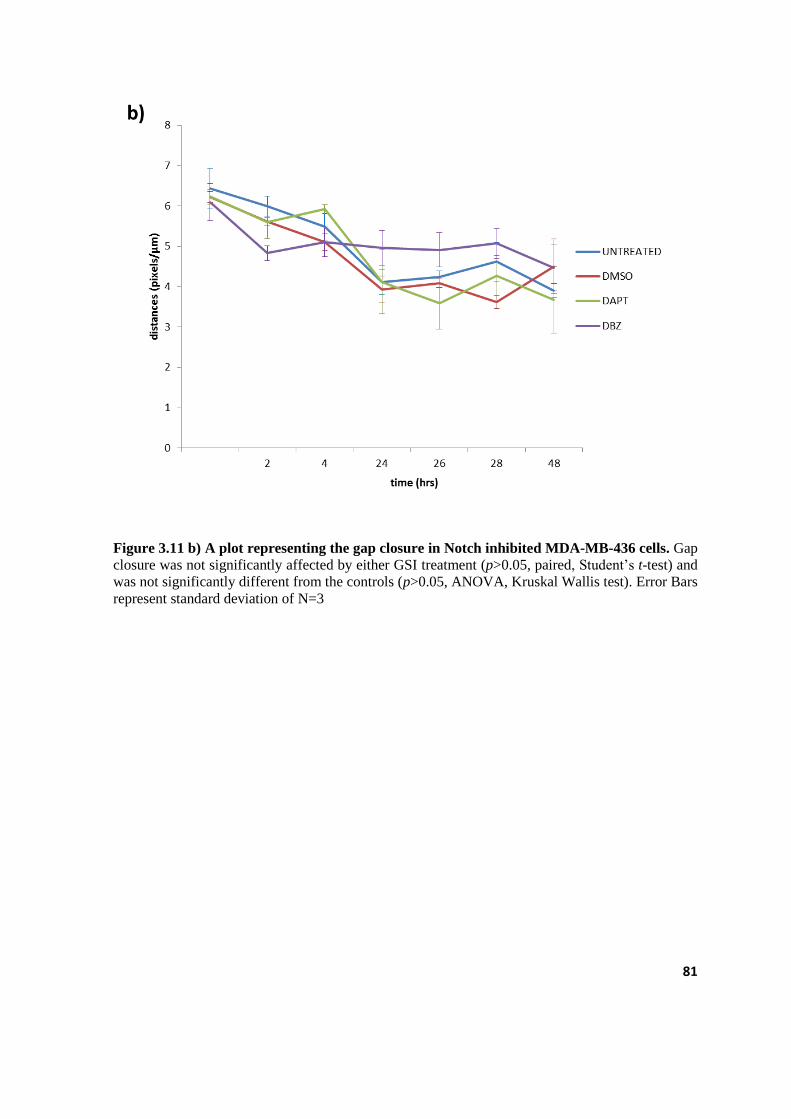
81
Figure 3.11 b) A plot representing the gap closure in Notch inhibited MDA-MB-436 cells. Gap
closure was not significantly affected by either GSI treatment (p>0.05, paired, Student’s t-test) and
was not significantly different from the controls (p>0.05, ANOVA, Kruskal Wallis test). Error Bars
represent standard deviation of N=3

82
CHAPTER 4: DISCUSSION
It has been reported by Rizzo and colleagues that, the Notch signalling pathway is
deregulated in BC and that it is activated in the absence of oestrogen (Rizzo et al., 2009). .
However to- date studies that confirm or challenge this have been few and far between.
Moreover, studies that explore the relationship between Notch signalling and cell
migration are sparse. In general research on the functional role of the Notch signalling
pathway in TNBC is limited. The pertinent findings relating to Notch signalling in TNBC
are discussed below.
4.1 Notch expression and activity
The subcellular localisation of NIC may be a morphological illustration of the functional
activity of notch in the cell (Speiser et al., 2013). NIC is released into the cytoplasm once it
has been cleaved by γ-secretase. Whilst it is in the cytoplasm, NIC is inactive and thus the
signal has yet to exert its effects on gene expression. However, once translocated to the
nucleus subsequent binding to DNA binding factors then allows for Notch target gene
activation. Therefore accumulation of NIC in the cytoplasm indicates an inactive Notch
signal, whilst an accumulation of NIC in the nucleus represents the active form.
When comparing the expression and localisation of NIC1 in hormone receptor positive cell
lines to that of hormone insensitive cells, prior to γ-secretase inhibition, there was a
similarity between the localisation of NIC1 in both the MCF-7 and MDA-MB-436 cell
lines; as this factor is present within the nucleus and it is specifically associated with the
nucleoli (Figure 3.1). This may be a good indication of the formation of the transcriptional

83
complex together with the DNA binding factors. While NIC1 was localised to the nucleoli
of both cell lines, it differed in expression intensity; the MCF-7 cell line displayed more
densely stained nucleoli compared to the MDA-MB-436 cell line, suggesting that Notch is
more active in hormone receptor positive cells and less active in the hormone insensitive
cells.
The localisation and expression of NIC1 in the MDA-MB-231 cell line was quite different
to the above-mentioned cell lines; in these, NIC1 was both concentrated in a perinuclear
aggregation on one side of the nucleus, suggestive of a Golgi/endoplasmic reticulum
association, and was also densely scattered over the nuclear membrane, effectively
masking the nucleoli. The observation suggests that the pathway is hyperactive in those
cells.
Interestingly, though both the MB-MDA-231 and the MDA-MB-436 cell lines are TNBC
models (Chavez et al., 2010), they express NIC differently. This may be seen as supporting
evidence that there may indeed be subtypes of TNBC; this however is still quite
controversial. It may also indicate that Notch activity is different within each subtype. This
could indicate that oestrogen may not be an inhibitor of Notch, but rather that there may be
crosstalk between Notch and other pathways that influence its activity. One such candidate
may be the Wnt pathway; and, the MDA-MB-231 cell line possesses the WNT7B
oncogene that is part of a large family of genes that regulate the WNT pathway (Huguet et
al., 1994). Moreover, the deregulation of WNT is associated with BC, and it has been
proposed that is involved in crosstalk with Notch signalling (Guo et al., 2011, Ayyanan et
al., 2006, Yamaguchi et al., 2014, Visvader, 2009).
84
It is suggested here that the presence of the WNT oncogene in the MDA-MB-231 cell lines
may be a factor influencing the up-regulation of Notch. In contrast the MDA-MB-436 cell
line does not possess this gene, but Notch is down-regulated in these cells, which may
indicate that in this instance a lack of oestrogen, may be causing deregulation in Notch
activity in these cells. However, the MDA-MB-436 data obtained in the present study
challenges the hypothesis that a lack of oestrogen increases Notch activity proposed by
Rizzo et. al (2009) (Rizzo et al., 2009) , who based this notion on the observed increase in
Notch activity when MCF-7 cell lines were deprived of oestrogen, or when oestrogen is
antagonized by selective ER modulators. In contrast, however the findings observed here
from the MDA-MB-231 cell lines agree with their data in experimentally oestrogen
deprived MCF-7 cells, where NOTCH-1 could be detected in both the cytoplasm and
nucleus. To date there is no report in the literature referring to the distribution of NIC1 in
MDA-MB-436 cell lines (Bolos et al., 2007).
It is important to note here that the distribution of NIC1 alone is evaluated. Neither the
distribution of NOTCH-2 intracellular component, NOTCH-3 intracellular component nor
NOTCH-4 intracellular components were assessed. The expression and localisation of each
of these could be remarkably different in each of the cell lines, since BC cells have been
reported to co-express Notch receptors .
4.2 The cellular growth, proliferation and viability of human breast
cancer cells
As recorded here, the hormone and growth receptor positive cells grow significantly faster
than their receptor negative counterparts. This is somewhat expected as hormones and

85
growth factors are known to promote growth and proliferation of breast cells in vivo
(Tarulli et al., 2014, Yarden, 2001, Sibilia et al., 2007). Although receptor positive BC
grows much faster than TNBC, the latter is reportedly a more aggressive cancer (Dent et
al., 2007). Therefore it is apparent that there are factors other than the presence of key
breast cell receptors that are perpetuating TNBC tumours.
From this it was hypothesised that deregulated Notch signalling may be a key factor in
TNBC cell proliferation and the cell lines were thus treated with GSIs. Notably the TNBC
cell lines were more sensitive to GSI treatment when compared with receptor positive cell
lines. These data corroborate the results presented by Lee et.al (2008) who found that GSI
treatment of the MCF-7 and MDA-MB-231 cell lines decreased cell proliferation, to a
greater effect in the MDA-MB-231 cell line (Lee et al., 2008a) . Also in the same study
they found that GSI treatment abolished colony formation of MDA-MB-231 cells on soft
agar, at the magnitude of three orders more than the MCF-7 cell line. In another study by
Rizzo et .al (2009) GSI treatment of MDA-MB-231cells had strong anti-proliferative
effects and when combined with Tamoxifen, GSI caused significant growth inhibitory
effects (Rizzo et al., 2009). Additionally the combination of the GSI, PF-03084014 with
docetaxel resulted in a decrease in tumour size and a reversal of chemo-resistance in
TNBC xenograft models (Zhang et al., 2013). A preclinical study on breast tumours from
30 patients with advanced BC of an unspecified subtype showed that a combination of the
GSI, MK-0725 and docetaxel reduced the numbers of BC CSCs (Schott et al., 2013).
Currently, there are three on going GSI/Notch pathway based clinical studies, two of which
are specifically on TNBC (www.clinicaltrials.gov). One study is investigating the effects
and the best dose of the GSI inhibitor, R04929097 when combined with paclitaxel and

86
carboplatin in patients with stage II and stage III TNBC (www.clinicaltrials.gov). The
other investigates how well the same inhibitor will fair in treating patients with metastatic
or recurrent TNBC. Overall, the findings reported on here concur with the literature having
shown that GSI is effective in reducing TNBC cell proliferation and viability
4.2.1 Classical end-point assay versus real-time cell analysis assay
The TB classical end-point assay revealed that the GSIs do not affect cell viability of the
MCF-7 and MDA-MB-436 cell lines, while the cell viability of MDA-MB-231 cell lines
was significantly affected. These results differ from those produced by the RTCA system;
this assay reveals that all cell lines are significantly affected by the GSI, demonstrating the
sensitivity of evaluating cellular responses in real time. As well because it monitors cell
behavior over time it is able to detect both cell viability and cell proliferation.
4.3 Notch and cell migration and morphology
In order to investigate the effect of inhibiting Notch on cell migration, the expression of the
invasion and metastasis suppressor protein E-cadherin (Baranwal and Alahari, 2009) was
assessed. Its normal physiologic process includes tissue morphology and epithelial-to-
mesenchymal transition (EMT), wherein cells lose their epithelial characteristics and
acquire mesenchymal features (Abdulla et al., 2013). Since the activation of invasion and
metastasis are a particular hallmark of cancer, E-cadherin expression is thus considered a
good marker for BC malignancy (Hanahan and Weinberg, 2011).
The receptor positive BC cells displayed a greater E-cadherin expression, which decreases
when cells are treated with GSIs. The TNBC cell lines did not exhibit E-cadherin

87
expression and upon treatment with GSI it is not up-regulated in TNBC cells. The data
observed here corroborate Chen et al. (2010) who report that an overexpression of NIC1
inhibits E-cadherin, in MDA-MB-231 because prior experiments show that MDA-MB-231
cell line overexpress NIC1 (Figure 3.1) (Chen et al., 2010) . However, in contrast, when
tumour xenografts from MDA-MB-231 cell lines were treated with GSI,
immunohistochemical evaluation demonstrated an increase in E-cadherin expression, due
to the GSI preventing its proteolysis (Leong et al., 2007).
While in the present study it may then be hypothesised that a decrease in Notch could
result in E-cadherin up-regulation, this however was not apparent in the MDA-MB-436
cell line; instead E-cadherin expression was not detected. This suggests that possibly in
some types of TNBC cell lines Notch and E-cadherin expression are independent or
dependant on each other. This is a further example of the different behaviours of TNBC
cell types and also provides evidence that the deregulation of the signal is different in
TNBC tumours.
Furthermore it is shown here that GSI treatment causes a disruption in the F-actin
cytoskeleton in the TNBC cell lines, with DBZ affecting the F-actin cytoskeleton of the
MDA-MB-231 cell line more so than DAPT treatment. This may be an indication that
Notch deregulation may have adverse effects on the integrity of the F-actin cytoskeleton.
Disruption of the cytoskeleton could disturb proper cellular function, such as cell motility
and cell signalling. This in turn may possibly affect the ability of the cells to migrate as
well as their ability to effectively communicate with neighbouring cells. As the cellular
junctions are disturbed it’s most likely that activation of the Notch signal is aberrant. From

88
the literature it still unclear as to what effect Notch inhibition has on the F-actin
cytoskeleton.
The migration/scratch assay showed that pre-GSI treatment, MCF-7 cells had a far greater
gap closure after 48hrs, when compared to TNBC cell lines, which showed less migration,
especially the MDA-MB-436 cells. Post-treatment, the results were similar, wherein MCF-
7 cell migration was greater after 48hrs, compared to cell migration of the TNBC’s. Within
each cell line regardless of treatment, however, the difference in cell migration was not
statistically significant. A possible explanation for this result is that migration was studied
under normoxic cell culture conditions. Other studies however have concluded that
hypoxia activates Notch signal induced migration (Chen et al., 2010). The data obtained
here also contradicts another study which reported that Notch inhibition of MDA-MB-231
cells by DAPT and R04929097 GSIs increases E-cadherin expression together with a
reduction in their invasive capacity (Bolos et al., 2013). It has been reported that
knockdown of Notch-1 exhibited limited wound closure activity even after 48hrs (Zhao et
al., 2014).
4.4 Conclusion
The data presented here show that Notch activity is more stable in hormone receptor
positive MCF-7 cell line compared to TNBC cell lines. Moreover, while GSIs are effective
in decreasing the cell proliferation of both subtypes of BC, TNBC were however the most
sensitive to them.
Sensitivity to ER status does not seem to be a strict regulator of Notch activity as each
TNBC cell model seemed to express Notch in a different manner. Although not statistically

89
significant, cell migration did decrease with Notch inhibition and further work is required
to reach a definitive conclusion relating to Notch and migration.

90
CHAPTER 5: PERSPECTIVES AND FUTURE WORK
Although we demonstrate here that the Notch signal may be dysfunctional in TNBC, the
effects of neither NOTCH-1 upregulation nor NOTCH- receptor knockdown were
assessed, as this was beyond the scope of the study. In particular the modulation of the
NOTCH-1 gene will allow for the testing of the hypothesis that NOTCH-1 expression
regulates for cell proliferation in TNBCs. Moreover, it may be important to replicate the
present studies under hypoxic conditions, since it is reported in the literature that this
activates Notch, causing an increased BC cell migration. Such an approach may be of some
consequence since hypoxia rather than normoxia may be indicative of the in vivo tumour
environment.
5.1 Proposed approach for future work
To further elucidate the role of the Notch pathway, it is proposed that further in vitro
studies be carried out with MCF-7 and T47D cell line as the receptor positive BC
representative cell line and MDA-MB-231 and MDA-MB-436 cell lines as the TNBC
representative cell line. To assess the effects of Notch-1 down-regulation on cell
proliferation and migration, siRNA knockdown of the NOTCH-1 gene should be carried
out and monitored using the RTCA system. Moreover, an effective means to determine
more precisely the effects of NOTCH-1 activity would be an inducible system of NOTCH-
1 expression. In association with this, it may be important to evaluate further changes in
cell adhesion proteins, such as integrins and other EMT markers, for example Vimentin

91
Each experiment would be performed under both normoxic and hypoxic conditions to
further understand the relationship between Notch and BC cell migration. Below is a
diagram of the proposed scheme for future work (Figure 5.1). In summary fine control of
Notch gene expression will provide for a better understanding of Notch expression in
breast cancer.
Figure 5.1. Diagram representing the methodology for future work. BC cell lines will
maintained in appropriate media.Notch-1 expression induced using a NIC1 inducible clone.
Knockdown of NOTCH-1 may be done using siRNA and the effects thereafter, can be evaluated
using xCelligence, Western-blot and confocal immunofluorescence.
92
CHAPTER 6: REFERENCES
6.1. Journal articles
1. ABDULLA, T., LUNA-ZURITA, L., DE LA POMPA, J. L., SCHLEICH, J. M. &
SUMMERS, R. 2013. Epithelial to mesenchymal transition-the roles of cell
morphology, labile adhesion and junctional coupling. Computer Methods Programs
Biomedicine, 111, 435-46.
2. ANDRE, F. & ZIELINSKI, C. C. 2012. Optimal strategies for the treatment of
metastatic triple-negative breast cancer with currently approved agents. Annals of
Oncology, 23, vi46-51.
3. ASTER, J. C., BLACKLOW, S. C. & PEAR, W. S. 2011. Notch signalling in T-
cell lymphoblastic leukaemia/lymphoma and other haematological malignancies.
The Journal of Pathology, 223, 262-73.
4. AULMANN, S., WALDBURGER, N., PENZEL, R., ANDRULIS, M.,
SCHIRMACHER, P. & SINN, H. P. 2010. Reduction of CD44(+)/CD24(-) breast
cancer cells by conventional cytotoxic chemotherapy. Human Pathology, 41, 574-
81.
5. AYYANAN, A., CIVENNI, G., CIARLONI, L., MOREL, C., MUELLER, N.,
LEFORT, K., MANDINOVA, A., RAFFOUL, W., FICHE, M., DOTTO, G. P. &
BRISKEN, C. 2006. Increased Wnt signaling triggers oncogenic conversion of
human breast epithelial cells by a Notch-dependent mechanism. Proceeding of the
National Academy of Science U S A, 103, 3799-804.
6. BADVE, S., DABBS, D. J., SCHNITT, S. J., BAEHNER, F. L., DECKER, T.,
EUSEBI, V., FOX, S. B., ICHIHARA, S., JACQUEMIER, J., LAKHANI, S. R.,
PALACIOS, J., RAKHA, E. A., RICHARDSON, A. L., SCHMITT, F. C., TAN, P.
H., TSE, G. M., WEIGELT, B., ELLIS, I. O. & REIS-FILHO, J. S. 2011. Basal-
like and triple-negative breast cancers: a critical review with an emphasis on the
implications for pathologists and oncologists. Modern Pathology, 24, 157-67.
93
7. BARANWAL, S. & ALAHARI, S. K. 2009. Molecular mechanisms controlling E-
cadherin expression in breast cancer. Biochemical and Biophysical Research
Communications, 384, 6-11.
8. BAYOUMI, Y., ABDELSAMIE, A., ABDELSAID, A. & RADWAN, A. 2014.
Locoregional recurrence of triple-negative breast cancer: effect of type of surgery
and adjuvant postoperative radiotherapy. Breast Cancer, 6, 151-8.
9. BEABER, E. F., MALONE, K. E., TANG, M. T., BARLOW, W. E., PORTER, P.
L., DALING, J. R. & LI, C. I. 2014. Oral contraceptives and breast cancer risk
overall and by molecular subtype among young women. Cancer Epidemiology
Biomarkers and Prevention, 23, 755-64.
10. BOLOS, V., GREGO-BESSA, J. & DE LA POMPA, J. L. 2007. Notch signaling in
development and cancer. Endocrine Reviews, 28, 339-63.
11. BOLOS, V., MIRA, E., MARTINEZ-POVEDA, B., LUXAN, G., CANAMERO,
M., MARTINEZ, A. C., MANES, S. & DE LA POMPA, J. L. 2013. Notch
activation stimulates migration of breast cancer cells and promotes tumor growth.
Breast Cancer Research, 15.
12. BREWSTER, A. M., CHAVEZ-MACGREGOR, M. & BROWN, P. Epidemiology,
biology, and treatment of triple-negative breast cancer in women of African
ancestry, Lancet Oncology. 2014 Dec;15(13):e625-e634. doi: 10.1016/S1470-
2045(14)70364-X. Epub 2014 Nov 24.
13. BRINKLEY, B. R., BEALL, P. T., WIBLE, L. J., MACE, M. L., TURNER, D. S.
& CAILLEAU, R. M. 1980. Variations in cell form and cytoskeleton in human
breast carcinoma cells in vitro. Cancer Research, 40, 3118-29.
14. CAPACCIONE, K. M. & PINE, S. R. 2013. The Notch signaling pathway as a
mediator of tumor survival. Carcinogenesis, 34, 1420-30.
15. CAREY, L., WINER, E., VIALE, G., CAMERON, D. & GIANNI, L. 2010. Triple-
negative breast cancer: disease entity or title of convenience? Nature Reviews
Clinical Oncology, 7, 683-92.
16. CHAVEZ, K. J., GARIMELLA, S. V. & LIPKOWITZ, S. 2010. Triple negative
breast cancer cell lines: one tool in the search for better treatment of triple negative
breast cancer. Breast Disease, 32, 35-48.

94
17. CHEN, J., IMANAKA, N., CHEN, J. & GRIFFIN, J. D. 2010. Hypoxia potentiates
Notch signaling in breast cancer leading to decreased E-cadherin expression and
increased cell migration and invasion. British Journal of Cancer, 102, 351-60.
18. CHILLAKURI, C. R., SHEPPARD, D., LEA, S. M. & HANDFORD, P. A. 2012.
Notch receptor-ligand binding and activation: insights from molecular studies.
Seminars in Cell and Developmental Biology, 23, 421-8.
19. CORTAZAR, P., ZHANG, L., UNTCH, M., MEHTA, K., COSTANTINO, J. P.,
WOLMARK, N., BONNEFOI, H., CAMERON, D., GIANNI, L., VALAGUSSA,
P., SWAIN, S. M., PROWELL, T., LOIBL, S., WICKERHAM, D. L.,
BOGAERTS, J., BASELGA, J., PEROU, C., BLUMENTHAL, G., BLOHMER, J.,
MAMOUNAS, E. P., BERGH, J., SEMIGLAZOV, V., JUSTICE, R.,
EIDTMANN, H., PAIK, S., PICCART, M., SRIDHARA, R., FASCHING, P. A.,
SLAETS, L., TANG, S., GERBER, B., GEYER, C. E., JR., PAZDUR, R.,
DITSCH, N., RASTOGI, P., EIERMANN, W. & VON MINCKWITZ, G. 2014.
Pathological complete response and long-term clinical benefit in breast cancer: the
CTNeoBC pooled analysis. Lancet, 384, 164-72.
20. COUCH, F. J., HART, S. N., SHARMA, P., TOLAND, A. E., WANG, X.,
MIRON, P., OLSON, J. E., GODWIN, A. K., PANKRATZ, V. S., OLSWOLD, C.,
SLETTEDAHL, S., HALLBERG, E., GUIDUGLI, L., DAVILA, J. I.,
BECKMANN, M. W., JANNI, W., RACK, B., EKICI, A. B., SLAMON, D. J.,
KONSTANTOPOULOU, I., FOSTIRA, F., VRATIMOS, A., FOUNTZILAS, G.,
PELTTARI, L. M., TAPPER, W. J., DURCAN, L., CROSS, S. S., PILARSKI, R.,
SHAPIRO, C. L., KLEMP, J., YAO, S., GARBER, J., COX, A., BRAUCH, H.,
AMBROSONE, C., NEVANLINNA, H., YANNOUKAKOS, D., SLAGER, S. L.,
VACHON, C. M., ECCLES, D. M. & FASCHING, P. A. 2015. Inherited mutations
in 17 breast cancer susceptibility genes among a large triple-negative breast cancer
cohort unselected for family history of breast cancer. Journal of Clinical Oncology,
33, 304-11.
21. DAVIES, E. A., RENSHAW, C., DIXON, S., MOLLER, H. & COUPLAND, V.
H. 2013. Socioeconomic and ethnic inequalities in screen-detected breast cancer in
London. Journal of Public Health, 35, 607-15.

95
22. DAWOOD, S., LEI, X., LITTON, J. K., BUCHHOLZ, T. A., HORTOBAGYI, G.
N. & GONZALEZ-ANGULO, A. M. 2012. Impact of body mass index on survival
outcome among women with early stage triple-negative breast cancer. Clinical
Breast Cancer, 12, 364-72.
23. DENT, R., TRUDEAU, M., PRITCHARD, K. I., HANNA, W. M., KAHN, H. K.,
SAWKA, C. A., LICKLEY, L. A., RAWLINSON, E., SUN, P. & NAROD, S. A.
2007. Triple-negative breast cancer: clinical features and patterns of recurrence.
Clinical Cancer Research, 13, 4429-34.
24. DEXTER, J. S. 1914. The Analysis of a Case of Continuous Variation in
Drosophila by a Study of Its Linkage Relations. The American Naturalist, 48, 712-
758.
25. DICKENS, C., DUARTE, R., ZIETSMAN, A., CUBASCH, H., KELLETT, P.,
SCHUZ, J., KIELKOWSKI, D. & MCCORMACK, V. 2014a. Racial comparison
of receptor-defined breast cancer in southern african women: subtype prevalence
and age-incidence analysis of nationwide cancer registry data. Cancer
Epidemiology Biomarkers and Prevention, 23, 2311-21.
26. DICKENS, C., JOFFE, M., JACOBSON, J., VENTER, F., SCHUZ, J.,
CUBASCH, H. & MCCORMACK, V. 2014b. Stage at breast cancer diagnosis and
distance from diagnostic hospital in a periurban setting: a South African public
hospital case series of over 1,000 women. International Journal of Cancer, 135,
2173-82.
27. DICKSON, B. C., MULLIGAN, A. M., ZHANG, H., LOCKWOOD, G.,
O'MALLEY, F. P., EGAN, S. E. & REEDIJK, M. 2007. High-level JAG1 mRNA
and protein predict poor outcome in breast cancer. Modern Pathology, 20, 685-93.
28. DOHERTY, G. J. & MCMAHON, H. T. 2008. Mediation, modulation, and
consequences of membrane-cytoskeleton interactions. Annual Reviews of
Biophysics, 37, 65-95.
29. DOLLE, J. M., DALING, J. R., WHITE, E., BRINTON, L. A., DOODY, D. R.,
PORTER, P. L. & MALONE, K. E. 2009. Risk factors for triple-negative breast
cancer in women under the age of 45 years. Cancer Epidemiology Biomarkers and
Prevention, 18, 1157-66.

96
30. DU, R., SUN, W., XIA, L., ZHAO, A., YU, Y., ZHAO, L., WANG, H., HUANG,
C. & SUN, S. 2012. Hypoxia-induced down-regulation of microRNA-34a promotes
EMT by targeting the Notch signaling pathway in tubular epithelial cells. PLoS
One, 7, 17.
31. DUNN, B. K., AGURS-COLLINS, T., BROWNE, D., LUBET, R. & JOHNSON,
K. A. 2010. Health disparities in breast cancer: biology meets socioeconomic
status. Breast Cancer Research and Treatment, 121, 281-92.
32. EIERMANN, W., BERGH, J., CARDOSO, F., CONTE, P., CROWN, J., CURTIN,
N. J., GLIGOROV, J., GUSTERSON, B., JOENSUU, H., LINDERHOLM, B. K.,
MARTIN, M., PENAULT-LLORCA, F., PESTALOZZI, B. C., RAZIS, E.,
SOTIRIOU, C., TJULANDIN, S. & VIALE, G. 2012. Triple negative breast
cancer: Proposals for a pragmatic definition and implications for patient
management and trial design. The Breast, 21, 20-26.
33. ELLISEN, L. W., BIRD, J., WEST, D. C., SORENG, A. L., REYNOLDS, T. C.,
SMITH, S. D. & SKLAR, J. 1991. TAN-1, the human homolog of the Drosophila
notch gene, is broken by chromosomal translocations in T lymphoblastic
neoplasms. Cell, 66, 649-61.
34. ELSAWAF, Z., SINN, H. P., ROM, J., BERMEJO, J. L., SCHNEEWEISS, A. &
AULMANN, S. 2013. Biological subtypes of triple-negative breast cancer are
associated with distinct morphological changes and clinical behaviour. Breast, 22,
986-92.
35. ENG, A., MCCORMACK, V. & DOS-SANTOS-SILVA, I. 2014. Receptor-
defined subtypes of breast cancer in indigenous populations in Africa: a systematic
review and meta-analysis. PLoS Medicine, 11.
36. ESCUDERO-ESPARZA, A., JIANG, W. G. & MARTIN, T. A. 2011. The Claudin
family and its role in cancer and metastasis. Front Biosciences, 16, 1069-83.
37. ESPINOZA, I. & MIELE, L. 2013. Notch inhibitors for cancer treatment.
Pharmacology & Therapeutics, 139, 95-110.
38. FARNIE, G. & CLARKE, R. 2007. Mammary Stem Cells and Breast Cancer—
Role of Notch Signalling. Stem Cell Reviews, 3, 169-175.

97
39. FERLAY, J., SOERJOMATARAM, I., DIKSHIT, R., ESER, S., MATHERS, C.,
REBELO, M., PARKIN, D. M., FORMAN, D. & BRAY, F. 2015. Cancer
incidence and mortality worldwide: Sources, methods and major patterns in
GLOBOCAN 2012. International Journal of Cancer, 136, 9.
40. FIRE, A., XU, S., MONTGOMERY, M. K., KOSTAS, S. A., DRIVER, S. E. &
MELLO, C. C. 1998. Potent and specific genetic interference by double-stranded
RNA in Caenorhabditis elegans. Nature, 391, 806-11.
41. FOSTIRA, F., TSITLAIDOU, M., PAPADIMITRIOU, C., PERTESI, M.,
TIMOTHEADOU, E., STAVROPOULOU, A. V., GLENTIS, S., BOURNAKIS,
E., BOBOS, M., PECTASIDES, D., PAPAKOSTAS, P., PENTHEROUDAKIS,
G., GOGAS, H., SKARLOS, P., SAMANTAS, E., BAFALOUKOS, D.,
KOSMIDIS, P. A., KOUTRAS, A., YANNOUKAKOS, D.,
KONSTANTOPOULOU, I. & FOUNTZILAS, G. 2012. Prevalence of BRCA1
mutations among 403 women with triple-negative breast cancer: implications for
genetic screening selection criteria: a Hellenic Cooperative Oncology Group Study.
Breast Cancer Research and Treatment, 134, 353-62.
42. FRITSCHY, J.-M. & HÄRTIG, W. 2001. Immunofluorescence. eLS. John Wiley &
Sons, Ltd.
43. GALUKANDE, M., WABINGA, H., MIREMBE, F., KARAMAGI, C. & ASEA,
A. 2014. Molecular breast cancer subtypes prevalence in an indigenous Sub
Saharan African population. Pan African Medical Journal, 17.
44. GAO, J., SARKAR, F. H., MIELE, L. & WANG, Z. 2014. Chapter 4 - The Role of
Notch Signaling Pathway in the Progression of Pancreatic Cancer. In: AZMI, A. S.
(ed.) Molecular Diagnostics and Treatment of Pancreatic Cancer. Oxford:
Academic Press.
45. GLUZ, O., LIEDTKE, C., GOTTSCHALK, N., PUSZTAI, L., NITZ, U. &
HARBECK, N. 2009. Triple-negative breast cancer--current status and future
directions. Annals of Oncology, 20, 1913-27.
46. GOLDE, T. E., KOO, E. H., FELSENSTEIN, K. M., OSBORNE, B. A. & MIELE,
L. 2013. γ-Secretase inhibitors and modulators. Biochimica et Biophysica Acta
(BBA) - Biomembranes, 1828, 2898-2907.

98
47. GRAHAM, J. D., MOTE, P. A., SALAGAME, U., VAN DIJK, J. H., BALLEINE,
R. L., HUSCHTSCHA, L. I., REDDEL, R. R. & CLARKE, C. L. 2009. DNA
replication licensing and progenitor numbers are increased by progesterone in
normal human breast. Endocrinology, 150, 3318-26.
48. GREENUP, R., BUCHANAN, A., LORIZIO, W., RHOADS, K., CHAN, S.,
LEEDOM, T., KING, R., MCLENNAN, J., CRAWFORD, B., KELLY
MARCOM, P. & SHELLEY HWANG, E. 2013. Prevalence of BRCA mutations
among women with triple-negative breast cancer (TNBC) in a genetic counseling
cohort. Annals of Surgical Oncology, 20, 3254-8.
49. GUO, S., LIU, M. & GONZALEZ-PEREZ, R. R. 2011. Role of Notch and its
oncogenic signaling crosstalk in breast cancer. Biochim Biophys Acta-Review on
Cancer, 2, 197-213.
50. HAIMAN, C. A., CHEN, G. K., VACHON, C. M., CANZIAN, F., DUNNING, A.,
MILLIKAN, R. C., WANG, X., ADEMUYIWA, F., AHMED, S., AMBROSONE,
C. B., BAGLIETTO, L., BALLEINE, R., BANDERA, E. V., BECKMANN, M.
W., BERG, C. D., BERNSTEIN, L., BLOMQVIST, C., BLOT, W. J., BRAUCH,
H., BURING, J. E., CAREY, L. A., CARPENTER, J. E., CHANG-CLAUDE, J.,
CHANOCK, S. J., CHASMAN, D. I., CLARKE, C. L., COX, A., CROSS, S. S.,
DEMING, S. L., DIASIO, R. B., DIMOPOULOS, A. M., DRIVER, W. R.,
DUNNEBIER, T., DURCAN, L., ECCLES, D., EDLUND, C. K., EKICI, A. B.,
FASCHING, P. A., FEIGELSON, H. S., FLESCH-JANYS, D., FOSTIRA, F.,
FORSTI, A., FOUNTZILAS, G., GERTY, S. M., GILES, G. G., GODWIN, A. K.,
GOODFELLOW, P., GRAHAM, N., GRECO, D., HAMANN, U., HANKINSON,
S. E., HARTMANN, A., HEIN, R., HEINZ, J., HOLBROOK, A., HOOVER, R.
N., HU, J. J., HUNTER, D. J., INGLES, S. A., IRWANTO, A., IVANOVICH, J.,
JOHN, E. M., JOHNSON, N., JUKKOLA-VUORINEN, A., KAAKS, R., KO, Y.
D., KOLONEL, L. N., KONSTANTOPOULOU, I., KOSMA, V. M., KULKARNI,
S., LAMBRECHTS, D., LEE, A. M., MARCHAND, L. L., LESNICK, T., LIU, J.,
LINDSTROM, S., MANNERMAA, A., MARGOLIN, S., MARTIN, N. G.,
MIRON, P., MONTGOMERY, G. W., NEVANLINNA, H., NICKELS, S.,
NYANTE, S., OLSWOLD, C., PALMER, J., PATHAK, H., PECTASIDES, D.,

99
PEROU, C. M., PETO, J., PHAROAH, P. D., POOLER, L. C., PRESS, M. F.,
PYLKAS, K., REBBECK, T. R., RODRIGUEZ-GIL, J. L., ROSENBERG, L.,
ROSS, E., RUDIGER, T., SILVA IDOS, S., et al. 2011. A common variant at the
TERT-CLPTM1L locus is associated with estrogen receptor-negative breast cancer.
Nature Genetics, 43, 1210-4.
51. HAN, J., MA, I., HENDZEL, M. J. & ALLALUNIS-TURNER, J. 2009. The
cytotoxicity of gamma-secretase inhibitor I to breast cancer cells is mediated by
proteasome inhibition, not by gamma-secretase inhibition. Breast Cancer Research,
11, 6.
52. HAN, S., DZIEDZIC, N., GADUE, P., KELLER, G. M. & GOUON-EVANS, V.
2011. An endothelial cell niche induces hepatic specification through dual
repression of Wnt and Notch signaling. Stem Cells, 29, 217-28.
53. HANAHAN, D. & WEINBERG, ROBERT A. 2011. Hallmarks of Cancer: The
Next Generation. Cell, 144, 646-674.
54. HENG, Y.-W. & KOH, C.-G. 2010. Actin cytoskeleton dynamics and the cell
division cycle. The International Journal of Biochemistry & Cell Biology, 42,
1622-1633.
55. HOLLIDAY, D. L. & SPEIRS, V. 2011. Choosing the right cell line for breast
cancer research. Breast Cancer Research, 13.
56. HUGUET, E. L., MCMAHON, J. A., MCMAHON, A. P., BICKNELL, R. &
HARRIS, A. L. 1994. Differential expression of human Wnt genes 2, 3, 4, and 7B
in human breast cell lines and normal and disease states of human breast tissue.
Cancer Res, 54, 2615-21.
57. IGNATIADIS, M. & SOTIRIOU, C. 2013. Luminal breast cancer: from biology to
treatment. Nature Reviews Clinical Oncology, 10, 494-506.
58. KALLURI, R. & WEINBERG, R. A. 2009. The basics of epithelial-mesenchymal
transition. The Journal of Clinical Investigation 119, 1420-8.
59. KARAGIANNIS, T. C. & EL-OSTA, A. 2005. RNA interference and potential
therapeutic applications of short interfering RNAs. Cancer Gene Therapy, 12, 787-
95.

100
60. KAWAI, M., MALONE, K. E., TANG, M. T. & LI, C. I. 2014. Height, body mass
index (BMI), BMI change, and the risk of estrogen receptor-positive, HER2-
positive, and triple-negative breast cancer among women ages 20 to 44 years.
Cancer, 120, 1548-56.
61. KIDD, S., KELLEY, M. R. & YOUNG, M. W. 1986. Sequence of the notch locus
of Drosophila melanogaster: relationship of the encoded protein to mammalian
clotting and growth factors. Molecular and Cell Biology, 6, 3094-108.
62. KIKUCHI, A., YAMAMOTO, H., SATO, A. & MATSUMOTO, S. 2011. New
insights into the mechanism of Wnt signaling pathway activation. International
Review of Cell and Molecular Biology, 291, 21-71.
63. KIM, S. H., YIN, Y. I., LI, Y. M. & SISODIA, S. S. 2004. Evidence that assembly
of an active gamma-secretase complex occurs in the early compartments of the
secretory pathway. The Journal of Biological Chemistry, 279, 48615-9.
64. KOPAN, R. & ILAGAN, M. X. 2009. The canonical Notch signaling pathway:
unfolding the activation mechanism. Cell, 137, 216-33.
65. KORKAYA, H. & WICHA, M. S. 2009. HER-2, notch, and breast cancer stem
cells: targeting an axis of evil. Clinical Cancer Research, 15, 1845-7.
66. KOZIOL, M., PUSKULLUOGLU, M. & ZYGULSKA, A. 2012. PARP inhibitors
and their role in the therapy of triple-negative metastatic breast cancer. Przegl Lek,
69, 265-70.
67. KRAMER, N., WALZL, A., UNGER, C., ROSNER, M., KRUPITZA, G.,
HENGSTSCHLÄGER, M. & DOLZNIG, H. 2013. In vitro cell migration and
invasion assays. Mutation Research/Reviews in Mutation Research, 752, 10-24.
68. LEE, C. W., RASKETT, C. M., PRUDOVSKY, I. & ALTIERI, D. C. 2008a.
Molecular dependence of estrogen receptor-negative breast cancer on a notch-
survivin signaling axis. Cancer Research, 68, 5273-81.
69. LEE, C. W., SIMIN, K., LIU, Q., PLESCIA, J., GUHA, M., KHAN, A., HSIEH, C.
C. & ALTIERI, D. C. 2008b. A functional Notch-survivin gene signature in basal
breast cancer. Breast Cancer Research, 10, 24.
70. LEE, H. J., SONG, I. H., SEO, A. N., LIM, B., KIM, J. Y., LEE, J. J., PARK, I. A.,
SHIN, J., YU, J. H., AHN, J. H. & GONG, G. 2014. Correlations Between

101
Molecular Subtypes and Pathologic Response Patterns of Breast Cancers After
Neoadjuvant Chemotherapy. Annals of Surgical Oncology, 6, 6.
71. LEHMANN, B. D., BAUER, J. A., CHEN, X., SANDERS, M. E.,
CHAKRAVARTHY, A. B., SHYR, Y. & PIETENPOL, J. A. 2011. Identification
of human triple-negative breast cancer subtypes and preclinical models for
selection of targeted therapies. The Journal of Clinical Investigation, 121, 2750-
2767.
72. LEONG, K. G., NIESSEN, K., KULIC, I., RAOUF, A., EAVES, C., POLLET, I.
& KARSAN, A. 2007. Jagged1-mediated Notch activation induces epithelial-to-
mesenchymal transition through Slug-induced repression of E-cadherin. The
Journal of Experimental Medicine, 204, 2935-48.
73. LEWIS, H. D., PEREZ REVUELTA, B. I., NADIN, A., NEDUVELIL, J. G.,
HARRISON, T., POLLACK, S. J. & SHEARMAN, M. S. 2003. Catalytic site-
directed gamma-secretase complex inhibitors do not discriminate
pharmacologically between Notch S3 and beta-APP cleavages. Biochemistry, 42,
7580-6.
74. LI, C. I., BEABER, E. F., TANG, M. T., PORTER, P. L., DALING, J. R. &
MALONE, K. E. 2013. Reproductive factors and risk of estrogen receptor positive,
triple-negative, and HER2-neu overexpressing breast cancer among women 20-44
years of age. Breast Cancer Research and Treatment, 137, 579-87.
75. LIANG, C. C., PARK, A. Y. & GUAN, J. L. 2007. In vitro scratch assay: a
convenient and inexpensive method for analysis of cell migration in vitro. Nature
Protocol, 2, 329-33.
76. LIU, Z., ZHANG, X. S. & ZHANG, S. 2014. Breast tumor subgroups reveal
diverse clinical prognostic power. Scientific Reports, 4.
77. LOBRY, C., OH, P., MANSOUR, M. R., LOOK, A. T. & AIFANTIS, I. 2014.
Notch signaling: switching an oncogene to a tumor suppressor. Blood, 123, 2451-9.
78. LU, P., BAI, X. C., MA, D., XIE, T., YAN, C., SUN, L., YANG, G., ZHAO, Y.,
ZHOU, R., SCHERES, S. H. & SHI, Y. 2014. Three-dimensional structure of
human gamma-secretase. Nature, 512, 166-70.

102
79. MA, H., WANG, Y., SULLIVAN-HALLEY, J., WEISS, L., MARCHBANKS, P.
A., SPIRTAS, R., URSIN, G., BURKMAN, R. T., SIMON, M. S., MALONE, K.
E., STROM, B. L., MCDONALD, J. A., PRESS, M. F. & BERNSTEIN, L. 2010.
Use of four biomarkers to evaluate the risk of breast cancer subtypes in the
women's contraceptive and reproductive experiences study. Cancer Research, 70,
575-87.
80. MCCLEMENTS, L., YAKKUNDI, A., PAPASPYROPOULOS, A., HARRISON,
H., ABLETT, M. P., JITHESH, P. V., MCKEEN, H. D., BENNETT, R.,
DONLEY, C., KISSENPFENNIG, A., MCINTOSH, S., MCCARTHY, H. O.,
O'NEILL, E., CLARKE, R. B. & ROBSON, T. 2013. Targeting treatment-resistant
breast cancer stem cells with FKBPL and its peptide derivative, AD-01, via the
CD44 pathway. Clinical Cancer Research, 19, 3881-93.
81. MCCORMACK, V. A., JOFFE, M., VAN DEN BERG, E., BROEZE, N., DOS
SANTOS SILVA, I., ROMIEU, I., JACOBSON, J. S., NEUGUT, A. I., SCHUZ, J.
& CUBASCH, H. 2013. Breast cancer receptor status and stage at diagnosis in over
1,200 consecutive public hospital patients in Soweto, South Africa: a case series.
Breast Cancer Research, 15.
82. MIKI, M., MATSUO, Y., YOSHIDA, S., TANE, K., HIROKAGA, K.,
MAEKAWA, Y. & TAKAO, S. 2014. [A case of locally advanced and metastatic
breast cancer successfully treated with combination therapy of paclitaxel and
bevacizumab]. Gan To Kagaku Ryoho, 41, 1027-9.
83. MOWAD, R., CHU, Q. D., LI, B. D., BURTON, G. V., AMPIL, F. L. & KIM, R.
H. 2013. Does obesity have an effect on outcomes in triple-negative breast cancer?
Journal of Surgical Research, 184, 253-9.
84. NETWORK, C. G. A. 2012. Comprehensive molecular portraits of human breast
tumours. Nature, 490, 61-70.
85. NEWMAN, L. A., GRIFFITH, K. A., JATOI, I., SIMON, M. S., CROWE, J. P. &
COLDITZ, G. A. 2006. Meta-analysis of survival in African American and white
American patients with breast cancer: ethnicity compared with socioeconomic
status. Journal of Clinical Oncology, 24, 1342-9.

103
86. NIELSEN, T. O., HSU, F. D., JENSEN, K., CHEANG, M., KARACA, G., HU, Z.,
HERNANDEZ-BOUSSARD, T., LIVASY, C., COWAN, D., DRESSLER, L.,
AKSLEN, L. A., RAGAZ, J., GOWN, A. M., GILKS, C. B., VAN DE RIJN, M. &
PEROU, C. M. 2004. Immunohistochemical and clinical characterization of the
basal-like subtype of invasive breast carcinoma. Clinical Cancer Research, 10,
5367-74.
87. NTZIACHRISTOS, P., LIM, J. S., SAGE, J. & AIFANTIS, I. 2014. From fly
wings to targeted cancer therapies: a centennial for notch signaling. Cancer Cell,
25, 318-34.
88. O'NEILL, C. F., URS, S., CINELLI, C., LINCOLN, A., NADEAU, R. J., LEON,
R., TOHER, J., MOUTA-BELLUM, C., FRIESEL, R. E. & LIAW, L. 2007.
Notch2 signaling induces apoptosis and inhibits human MDA-MB-231 xenograft
growth. The American Journal of Pathology, 171, 1023-36.
89. OLSAUSKAS-KUPRYS, R., ZLOBIN, A. & OSIPO, C. 2013. Gamma secretase
inhibitors of Notch signaling. OncoTargets and Therapy, 6, 943-55.
90. OSIPO, C., PATEL, P., RIZZO, P., CLEMENTZ, A. G., HAO, L., GOLDE, T. E.
& MIELE, L. 2008. ErbB-2 inhibition activates Notch-1 and sensitizes breast
cancer cells to a gamma-secretase inhibitor. Oncogene, 27, 5019-32.
91. PALMER, J. R., RUIZ-NARVAEZ, E. A., ROTIMI, C. N., CUPPLES, L. A.,
COZIER, Y. C., ADAMS-CAMPBELL, L. L. & ROSENBERG, L. 2013. Genetic
susceptibility loci for subtypes of breast cancer in an African American population.
Cancer Epidemiology Biomarkers and Prevention, 22, 127-34.
92. PARISE, C. A. & CAGGIANO, V. 2013. Disparities in race/ethnicity and
socioeconomic status: risk of mortality of breast cancer patients in the California
Cancer Registry, 2000-2010. BMC Cancer, 13, 1471-2407.
93. PARR, C., WATKINS, G. & JIANG, W. G. 2004. The possible correlation of
Notch-1 and Notch-2 with clinical outcome and tumour clinicopathological
parameters in human breast cancer. International Journal of Molecular Medicine,
14, 779-86.
94. PEROU, C. M. 2011. Molecular stratification of triple-negative breast cancers.
Oncologist, 1, 61-70.

104
95. PEROU, C. M., SORLIE, T., EISEN, M. B., VAN DE RIJN, M., JEFFREY, S. S.,
REES, C. A., POLLACK, J. R., ROSS, D. T., JOHNSEN, H., AKSLEN, L. A.,
FLUGE, O., PERGAMENSCHIKOV, A., WILLIAMS, C., ZHU, S. X.,
LONNING, P. E., BORRESEN-DALE, A. L., BROWN, P. O. & BOTSTEIN, D.
2000. Molecular portraits of human breast tumours. Nature, 406, 747-52.
96. PIEROBON, M. & FRANKENFELD, C. L. 2013. Obesity as a risk factor for
triple-negative breast cancers: a systematic review and meta-analysis. Breast
Cancer Research and Treatment, 137, 307-14.
97. PODO, F., BUYDENS, L. M., DEGANI, H., HILHORST, R., KLIPP, E.,
GRIBBESTAD, I. S., VAN HUFFEL, S., VAN LAARHOVEN, H. W., LUTS, J.,
MONLEON, D., POSTMA, G. J., SCHNEIDERHAN-MARRA, N., SANTORO,
F., WOUTERS, H., RUSSNES, H. G., SORLIE, T., TAGLIABUE, E. &
BORRESEN-DALE, A. L. 2010. Triple-negative breast cancer: present challenges
and new perspectives. Molecular Oncology, 4, 209-29.
98. POGODA, K., NIWINSKA, A., MURAWSKA, M. & PIENKOWSKI, T. 2013.
Analysis of pattern, time and risk factors influencing recurrence in triple-negative
breast cancer patients. Medicaal Oncology, 30, 012-0388.
99. PRAT, A., ADAMO, B., CHEANG, M. C., ANDERS, C. K., CAREY, L. A. &
PEROU, C. M. 2013. Molecular characterization of basal-like and non-basal-like
triple-negative breast cancer. Oncologist, 18, 123-33.
100. PRAT, A., PARKER, J. S., KARGINOVA, O., FAN, C., LIVASY, C.,
HERSCHKOWITZ, J. I., HE, X. & PEROU, C. M. 2010. Phenotypic and
molecular characterization of the claudin-low intrinsic subtype of breast cancer.
Breast Cancer Research, 12, 2.
101. PRAT, A. & PEROU, C. M. 2011. Deconstructing the molecular portraits
of breast cancer. Molecular Oncology, 5, 5-23.
102. QIU, M., PENG, Q., JIANG, I., CARROLL, C., HAN, G., RYMER, I.,
LIPPINCOTT, J., ZACHWIEJA, J., GAJIWALA, K., KRAYNOV, E.,
THIBAULT, S., STONE, D., GAO, Y., SOFIA, S., GALLO, J., LI, G., YANG, J.,
LI, K. & WEI, P. 2013. Specific inhibition of Notch1 signaling enhances the

105
antitumor efficacy of chemotherapy in triple negative breast cancer through
reduction of cancer stem cells. Cancer Letters, 328, 261-70.
103. RAKHA, E., ELLIS, I. & REIS-FILHO, J. Are triple-negative and basal-
like breast cancer synonymous?, Clinical Cancer Research. 2008 Jan 15;14(2):618;
author reply 618-9. doi: 10.1158/1078-0432.CCR-07-1943.
104. RAKHA, E. A. & ELLIS, I. O. 2011. Modern classification of breast
cancer: should we stick with morphology or convert to molecular profile
characteristics. Advances in Anatomical Pathology, 18, 255-67.
105. RAKHA, E. A., ELSHEIKH, S. E., ALESKANDARANY, M. A.,
HABASHI, H. O., GREEN, A. R., POWE, D. G., EL-SAYED, M. E.,
BENHASOUNA, A., BRUNET, J. S., AKSLEN, L. A., EVANS, A. J., BLAMEY,
R., REIS-FILHO, J. S., FOULKES, W. D. & ELLIS, I. O. 2009. Triple-negative
breast cancer: distinguishing between basal and nonbasal subtypes. Clinical Cancer
Research, 15, 2302-10.
106. REEDIJK, M., ODORCIC, S., CHANG, L., ZHANG, H., MILLER, N.,
MCCREADY, D. R., LOCKWOOD, G. & EGAN, S. E. 2005. High-level
coexpression of JAG1 and NOTCH1 is observed in human breast cancer and is
associated with poor overall survival. Cancer Research, 65, 8530-7.
107. RIZZO, P., MIAO, H., D'SOUZA, G., OSIPO, C., SONG, L. L., YUN, J.,
ZHAO, H., MASCARENHAS, J., WYATT, D., ANTICO, G., HAO, L., YAO, K.,
RAJAN, P., HICKS, C., SIZIOPIKOU, K., SELVAGGI, S., BASHIR, A.,
BHANDARI, D., MARCHESE, A., LENDAHL, U., QIN, J. Z., TONETTI, D. A.,
ALBAIN, K., NICKOLOFF, B. J. & MIELE, L. 2008a. Cross-talk between notch
and the estrogen receptor in breast cancer suggests novel therapeutic approaches.
Cancer Research, 68, 5226-35.
108. RIZZO, P., OSIPO, C., FOREMAN, K., GOLDE, T., OSBORNE, B. &
MIELE, L. 2008b. Rational targeting of Notch signaling in cancer. Oncogene, 27,
5124-31.
109. RIZZO, P., OSIPO, C., PANNUTI, A., GOLDE, T., OSBORNE, B. &
MIELE, L. 2009. Targeting Notch signaling cross-talk with estrogen receptor and
ErbB-2 in breast cancer. Advances Enzyme Regulation, 49, 134-41.

106
110. ROSE, D. P. & VONA-DAVIS, L. 2009. Influence of obesity on breast
cancer receptor status and prognosis. Expert Review Anticancer Therapy, 9, 1091-
101.
111. ROSE, D. P. & VONA-DAVIS, L. 2010. Interaction between menopausal
status and obesity in affecting breast cancer risk. Maturitas, 66, 33-8.
112. ROSE, S. L., KUNNIMALAIYAAN, M., DRENZEK, J. & SEILER, N.
2010. Notch 1 signaling is active in ovarian cancer. Gynecologic Oncology, 117,
130-133.
113. ROSENBERG, L., BOGGS, D. A., WISE, L. A., ADAMS-CAMPBELL, L.
L. & PALMER, J. R. 2010. Oral contraceptive use and estrogen/progesterone
receptor-negative breast cancer among African American women. Cancer
Epidemiology Biomarkers and Prevention, 19, 2073-9.
114. ROY, M., PEAR, W. S. & ASTER, J. C. 2007. The multifaceted role of
Notch in cancer. Current Opinion in Genetics Development, 17, 52-9.
115. SAYED, S., MOLOO, Z., WASIKE, R., BIRD, P., OIGARA, R.,
GOVENDER, D., KIBERA, J., CARRARA, H. & SALEH, M. 2014. Is breast
cancer from Sub Saharan Africa truly receptor poor? Prevalence of ER/PR/HER2
in breast cancer from Kenya. Breast, 23, 591-6.
116. SCHOTT, A. F., LANDIS, M. D., DONTU, G., GRIFFITH, K. A.,
LAYMAN, R. M., KROP, I., PASKETT, L. A., WONG, H., DOBROLECKI, L.
E., LEWIS, M. T., FROEHLICH, A. M., PARANILAM, J., HAYES, D. F.,
WICHA, M. S. & CHANG, J. C. 2013. Preclinical and clinical studies of gamma
secretase inhibitors with docetaxel on human breast tumors. Clinical Cancer
Research, 19, 1512-24.
117. SENEVIRATNE, S., CAMPBELL, I., SCOTT, N., SHIRLEY, R. &
LAWRENSON, R. 2015. Impact of mammographic screening on ethnic and
socioeconomic inequities in breast cancer stage at diagnosis and survival in New
Zealand: a cohort study. BMC Public Health, 15, 46.
118. SHAO, H., HUANG, Q. & LIU, Z.-J. 2012. Chapter Seven - Targeting
Notch Signaling for Cancer Therapeutic Intervention. In: KEIRAN, S. M. S. (ed.)
Advances in Pharmacology. Academic Press.

107
119. SHARIFF-MARCO, S., YANG, J., JOHN, E. M., SANGARAMOORTHY,
M., HERTZ, A., KOO, J., NELSON, D. O., SCHUPP, C. W., SHEMA, S. J.,
COCKBURN, M., SATARIANO, W. A., YEN, I. H., PONCE, N. A.,
WINKLEBY, M., KEEGAN, T. H. & GOMEZ, S. L. 2014. Impact of
neighborhood and individual socioeconomic status on survival after breast cancer
varies by race/ethnicity: the Neighborhood and Breast Cancer Study. Cancer
Epidemiology Biomarkers and Prevention, 23, 793-811.
120. SHARMA, A., PARANJAPE, A. N., RANGARAJAN, A. & DIGHE, R. R.
2012. A monoclonal antibody against human Notch1 ligand-binding domain
depletes subpopulation of putative breast cancer stem-like cells. Molecular Cancer
Therapeutics, 11, 77-86.
121. SHUPTRINE, C. W., SURANA, R. & WEINER, L. M. 2012. Monoclonal
antibodies for the treatment of cancer. Seminars in Cancer Biology, 22, 3-13.
122. SIBILIA, M., KROISMAYR, R., LICHTENBERGER, B. M.,
NATARAJAN, A., HECKING, M. & HOLCMANN, M. 2007. The epidermal
growth factor receptor: from development to tumorigenesis. Differentiation, 75,
770-787.
123. SINESHAW, H. M., GAUDET, M., WARD, E. M., FLANDERS, W. D.,
DESANTIS, C., LIN, C. C. & JEMAL, A. 2014. Association of race/ethnicity,
socioeconomic status, and breast cancer subtypes in the National Cancer Data Base
(2010-2011). Breast Cancer Research and Treatment, 145, 753-63.
124. SINGHAI, R., PATIL, V. W., JAISWAL, S. R., PATIL, S. D., TAYADE,
M. B. & PATIL, A. V. 2011. E-Cadherin as a diagnostic biomarker in breast
cancer. North American Journal of Medical Sciences, 3, 227-33.
125. SOLIN, L. J., HWANG, W. T. & VAPIWALA, N. 2009. Outcome after
breast conservation treatment with radiation for women with triple-negative early-
stage invasive breast carcinoma. Clinical Breast Cancer, 9, 96-100.
126. SORLIE, T., PEROU, C. M., TIBSHIRANI, R., AAS, T., GEISLER, S.,
JOHNSEN, H., HASTIE, T., EISEN, M. B., VAN DE RIJN, M., JEFFREY, S. S.,
THORSEN, T., QUIST, H., MATESE, J. C., BROWN, P. O., BOTSTEIN, D.,
LONNING, P. E. & BORRESEN-DALE, A. L. 2001. Gene expression patterns of

108
breast carcinomas distinguish tumor subclasses with clinical implications.
Proceedings of the National Academy of Science U S A, 98, 10869-74.
127. SORLIE, T., TIBSHIRANI, R., PARKER, J., HASTIE, T., MARRON, J.
S., NOBEL, A., DENG, S., JOHNSEN, H., PESICH, R., GEISLER, S.,
DEMETER, J., PEROU, C. M., LONNING, P. E., BROWN, P. O., BORRESEN-
DALE, A. L. & BOTSTEIN, D. 2003. Repeated observation of breast tumor
subtypes in independent gene expression data sets. Proceedings of the National
Academy of Science U S A, 100, 8418-23.
128. SOTIRIOU, C. & PUSZTAI, L. 2009. Gene-expression signatures in breast
cancer. The New England Journal of Medicine, 360, 790-800.
129. SOULE, H. D., VAZGUEZ, J., LONG, A., ALBERT, S. & BRENNAN, M.
1973. A human cell line from a pleural effusion derived from a breast carcinoma.
Journal of the National Cancer Institute, 51, 1409-16.
130. SPEISER, J., FOREMAN, K., DRINKA, E., GODELLAS, C., PEREZ, C.,
SALHADAR, A., ERSAHIN, C. & RAJAN, P. 2012. Notch-1 and Notch-4
biomarker expression in triple-negative breast cancer. International Journal of
Surgical Pathology, 20, 139-45.
131. SPEISER, J. J., ERSAHIN, C. & OSIPO, C. 2013. The functional role of
Notch signaling in triple-negative breast cancer. Vitamins and Hormones, 93, 277-
306.
132. STANLEY, P. & OKAJIMA, T. 2010. Roles of glycosylation in Notch
signaling. Current Topics in Development Biology, 92, 131-64.
133. STEAD, L. A., LASH, T. L., SOBIERAJ, J. E., CHI, D. D., WESTRUP, J.
L., CHARLOT, M., BLANCHARD, R. A., LEE, J. C., KING, T. C. &
ROSENBERG, C. L. 2009. Triple-negative breast cancers are increased in black
women regardless of age or body mass index. Breast Cancer Research, 11, 25.
134. STURTZ, L. A., MELLEY, J., MAMULA, K., SHRIVER, C. D. &
ELLSWORTH, R. E. 2014. Outcome disparities in African American women with
triple negative breast cancer: a comparison of epidemiological and molecular
factors between African American and Caucasian women with triple negative
breast cancer. BMC Cancer, 14, 1471-2407.

109
135. SWEDE, H., GREGORIO, D. I., TANNENBAUM, S. H.,
BROCKMEYER, J. A., AMBROSONE, C., WILSON, L. L., PENSA, M. A.,
GONSALVES, L., STEVENS, R. G. & RUNOWICZ, C. D. 2011. Prevalence and
Prognostic Role of Triple-Negative Breast Cancer by Race: A Surveillance Study.
Clinical Breast Cancer, 11, 332-341.
136. TAIT, S., PACHECO, J. M., GAO, F., BUMB, C., ELLIS, M. J. & MA, C.
X. 2014. Body mass index, diabetes, and triple-negative breast cancer prognosis.
Breast Cancer Research and Treatment, 146, 189-97.
137. TAKEBE, N., NGUYEN, D. & YANG, S. X. 2014. Targeting Notch
signaling pathway in cancer: Clinical development advances and challenges.
Pharmacology & Therapeutics, 141, 140-149.
138. TARULLI, G. A., BUTLER, L. M., TILLEY, W. D. & HICKEY, T. E.
2014. Bringing androgens up a NOTCH in breast cancer. Endocrine Related
Cancer, 21, 14-0248.
139. THEYS, J., YAHYANEJAD, S., HABETS, R., SPAN, P., DUBOIS, L.,
PAESMANS, K., KATTENBELD, B., CLEUTJENS, J., GROOT, A. J.,
SCHUURBIERS, O. C. J., LAMBIN, P., BUSSINK, J. & VOOIJS, M. 2013. High
NOTCH activity induces radiation resistance in non small cell lung cancer.
Radiotherapy and Oncology, 108, 440-445.
140. TOLIA, A. & DE STROOPER, B. 2009. Structure and function of γ-
secretase. Seminars in Cell & Developmental Biology, 20, 211-218.
141. TURKOZ, F. P., SOLAK, M., PETEKKAYA, I., KESKIN, O.,
KERTMEN, N., SARICI, F., ARIK, Z., BABACAN, T., OZISIK, Y. &
ALTUNDAG, K. 2013. Association between common risk factors and molecular
subtypes in breast cancer patients. Breast, 22, 344-50.
142. VISVADER, J. E. 2009. Keeping abreast of the mammary epithelial
hierarchy and breast tumorigenesis. Genes and Development, 23, 2563-77.
143. VUONG, D., SIMPSON, P. T., GREEN, B., CUMMINGS, M. C. &
LAKHANI, S. R. 2014. Molecular classification of breast cancer. Virchows Arch,
465, 1-14.

110
144. WANG, M., WU, L., WANG, L. & XIN, X. 2010. Down-regulation of
Notch1 by gamma-secretase inhibition contributes to cell growth inhibition and
apoptosis in ovarian cancer cells A2780. Biochemical and Biophysical Research
Communications, 393, 144-149.
145. WEI, P., WALLS, M., QIU, M., DING, R., DENLINGER, R. H., WONG,
A., TSAPARIKOS, K., JANI, J. P., HOSEA, N., SANDS, M., RANDOLPH, S. &
SMEAL, T. 2010. Evaluation of selective gamma-secretase inhibitor PF-03084014
for its antitumor efficacy and gastrointestinal safety to guide optimal clinical trial
design. Molecular Cancer Therapetics, 9, 1618-28.
146. WEIGELT, B., MACKAY, A., A'HERN, R., NATRAJAN, R., TAN, D. S.
P., DOWSETT, M., ASHWORTH, A. & REIS-FILHO, J. S. 2010. Breast cancer
molecular profiling with single sample predictors: a retrospective analysis. The
Lancet Oncology, 11, 339-349.
147. WEINBERG, R. A. & LUNDBERG, A. S. 1999. Control of the cell cycle
and apoptosis. European Journal of Cancer, 35, 531-539.
148. WHARTON, K. A., JOHANSEN, K. M., XU, T. & ARTAVANIS-
TSAKONAS, S. 1985. Nucleotide sequence from the neurogenic locus notch
implies a gene product that shares homology with proteins containing EGF-like
repeats. Cell, 43, 567-81.
149. WOLFE, M. S. 2009. γ-Secretase in biology and medicine. Seminars in Cell
& Developmental Biology, 20, 219-224.
150. YAGATA, H., KAJIURA, Y. & YAMAUCHI, H. 2011. Current strategy
for triple-negative breast cancer: appropriate combination of surgery, radiation, and
chemotherapy. Breast Cancer, 18, 165-73.
151. YAMAGUCHI, H., CHANG, S. S., HSU, J. L. & HUNG, M. C. 2014.
Signaling cross-talk in the resistance to HER family receptor targeted therapy.
Oncogene, 33, 1073-81.
152. YAMAGUCHI, N., OYAMA, T., ITO, E., SATOH, H., AZUMA, S.,
HAYASHI, M., SHIMIZU, K., HONMA, R., YANAGISAWA, Y., NISHIKAWA,
A., KAWAMURA, M., IMAI, J., OHWADA, S., TATSUTA, K., INOUE, J.,
SEMBA, K. & WATANABE, S. 2008. NOTCH3 signaling pathway plays crucial

111
roles in the proliferation of ErbB2-negative human breast cancer cells. Cancer
Research, 68, 1881-8.
153. YARDEN, Y. 2001. The EGFR family and its ligands in human cancer:
signalling mechanisms and therapeutic opportunities. European Journal of Cancer,
37, Supplement 4, 3-8.
154. YERSAL, O. & BARUTCA, S. 2014. Biological subtypes of breast cancer:
Prognostic and therapeutic implications. World Journal Clinical Oncology, 5, 412-
24.
155. YILMAZ, M. & CHRISTOFORI, G. 2009. EMT, the cytoskeleton, and
cancer cell invasion. Cancer Metastasis Reviews, 28, 15-33.
156. YONG, T., SUN, A., HENRY, M. D., MEYERS, S. & DAVIS, J. N. 2011.
Down regulation of CSL activity inhibits cell proliferation in prostate and breast
cancer cells. Journal of Cell Biochemistry, 112, 2340-51.
157. ZANG, S., CHEN, F., DAI, J., GUO, D., TSE, W., QU, X., MA, D. & JI, C.
2010. RNAi-mediated knockdown of Notch-1 leads to cell growth inhibition and
enhanced chemosensitivity in human breast cancer. Oncology Reports, 23, 893-9.
158. ZHANG, C. C., YAN, Z., ZONG, Q., FANG, D. D., PAINTER, C.,
ZHANG, Q., CHEN, E., LIRA, M. E., JOHN-BAPTISTE, A. & CHRISTENSEN,
J. G. 2013. Synergistic effect of the gamma-secretase inhibitor PF-03084014 and
docetaxel in breast cancer models. Stem Cells Transational Medicine, 2, 233-42.
159. ZHANG, J., FACKENTHAL, J. D., ZHENG, Y., HUO, D., HOU, N., NIU,
Q., ZVOSEC, C., OGUNDIRAN, T. O., HENNIS, A. J., LESKE, M. C.,
NEMESURE, B., WU, S. Y. & OLOPADE, O. I. 2012. Recurrent BRCA1 and
BRCA2 mutations in breast cancer patients of African ancestry. Breast Cancer
Research and Treatment, 134, 889-94.
160. ZHANG, M. H., MAN, H. T., ZHAO, X. D., DONG, N. & MA, S. L. 2014.
Estrogen receptor-positive breast cancer molecular signatures and therapeutic
potentials (Review). Biomedical Reports, 2, 41-52.
161. ZHAO, C., QIAO, Y., JONSSON, P., WANG, J., XU, L., ROUHI, P.,
SINHA, I., CAO, Y., WILLIAMS, C. & DAHLMAN-WRIGHT, K. 2014.

112
Genome-wide profiling of AP-1 regulated transcription provides insights into the
invasiveness of triple-negative breast cancer. Cancer Research, 15.
6.2 E-references
1. www.Roche.com
2. www.sigmaaldrich.com
3. www.tocris.com
4. www.clinicaltrials.gov
5. www.cansa.org.za

113
Appendix A: Protocols
A.1 Preparation of solutions and reagents
A.1.1 1X Phosphate Buffered Solution (PBS)
1 PBS tablet (# P4417-100TAB; Sigma Life Sciences, USA) was dissolved in 200ml of
distilled water to make a 1X PBS solution and was sterilised by autoclaving it.
A.1.2 Blocking buffer
0.5% of bovine serum albumin (BSA) (# CAS9048-46-8, Santa Cruz Biotechnology,
USA) was mixed with PBS (PBS/BSA).
A.1.3 Fixing Solution/Buffer
3% of formaldehyde (#104003, Merk, SA) in 1X PBS solution
A.1.4 Permeabilisation solution/Buffer
0.25% (v/v) of t-Octylphenoxypoly ethoxyethanol (TritonX-100) (#T-9289; Sigma Life
Sciences, USA) was dissolved in PBS/BSA.
A.1.5 F-actin cytoskeleton staining solution
To prepare 1X Phalloidin conjugate working solution. Add 1µl of 1000X Cyto-painter
Phalloidin iFluor 488 Reagent (# ab176753; ABCAM ®, USA) conjugate DMSO solutions
into 1ml PBS/BSA.

114
A.1.6 Nuclear stain
4’,6-diamidino-2-phenylindole (DAPI) (#236276 ; Cell Biology Boehringer Mannheim ,
Germany) was received in a 10mg crystalized form and was dissolved in N,N-
Dimethylformamide (DMF) to make up a stock solution of 5mg/ml.
The working solution of DAPI was prepared by re-suspending 1µl of stock solution in
10ml PBS. It was aliqouted in 2ml Eppendorf tubes and kept frozen at -20 C until use.
A.1.7 Cell culture media
Table A1: Media preparation for MCF-7, MDA-MB-231 and MDA-MB-436 cell lines.
Cell
line
Growth medium
MCF-7 DMEM-F12 (#BE12-719F, Biowhittaker®
Lonza,USA) was supplemented with
5ml FBS (#SV30160.03, HYCLONE®,USA) and 100µl of 100µg/ml pen/strep
solution (#17-602E, Biowhittaker® Lonza,USA)
MDA-
MB-
231
DMEM-F12(#BE12-719F, Biowhittaker® Lonza,USA ) was supplemented
with 5ml FBS(#SV30160.03, HYCLONE® ,USA) and 100µl of 100µg/ml
pen/strep solution(#17-602E, Biowhittaker® Lonza,USA)
MDA-
MB-
436
Leibovitz (#BE12-700F, Biowhittaker® Lonza,USA) media was supplemented
with 50µl of human insulin (#1927,Sigma Life Sciences, USA), 5ml
FBS(#SV30160.03, HYCLONE®, USA) , 100µg/ml pen/strep solution (#17-
602E, Biowhittaker® Lonza,USA) and 40µl of L-glutamine (#G7513,
Sigma,USA)

115
A.1.8 Freezing media and thawing media
Freezing media contained 15% Dimethyl Sulfoxide (#D2650; Sigma Life sciences, USA)
(DMSO) and 20% FBS in media appropriate for each cell line. DMSO is used as a cryo-
preserving agent.
Thawing media contained 20% FBS in media appropriate for each cell line. The additional
FBS is added to aid cell recovery from DMSO as well as cell adherence.
A.2 Pharmacological inhibitor concentration calculations
A.2.1 DAPT stock solution
N-(N-3, 5-Diflurophenacetyl-L-alanyl))-S-phenyl glycine t-Butyl Ester (DAPT) (#D5942-
5mg; Sigma Life Sciences,USA) is in a lyophilized form and must be dissolved in DMSO
to make a 10mM stock solution. The concentration was calculated:
Mass = Concentration x Volume x Molecular Weight
5mg = (10mM) (x) (432.46)
X = 1.1562
Therefore the volume of DMSO required making a 10mM stock solution from 5mg DAPT
powder is 1.1562ml.

116
A.2.2 DBZ stock solution
N-[(1S)-2-[[(7S)-6,7-Dihydro-5-methyl-6-oxo-5H-dibenz[b,d]azepin-7-yl]amino]-1-
methyl-2-oxoethyl]-3,5-difluorobenzeneacetamide (DBZ) (#CAS209984-56-5,Tocris
Biosciences, Bristol UK) is a lyophilized and must be dissolved in DMSO to make a
10mM stock solution. The concentration was calculated as:
Mass = Concentration x Volume x Molecular Weight
10mg = (10mM) (x) (467.98)
X = 2.1368ml
Therefore the volume of DMSO required making a 10mM stock solution from 10mg DBZ
powder is 2.1368ml.
DAPT and DBZ working solution calculation was given by (stock solution calculation in
appendices 1.3.1 and 1.3.2):
C1V1=C2V2
(10mM)(x)= (10µM) (100µl)
x = 0.1µl
C1V1=C2V2
(10mM)(x)= (10µM) (1ml)
x = 1µl
Therefore 0.1µl of DAPT/DBZ in 99µl of cell culture media makes 10µM and 20µM
solution would mean adding 0.2µl of DAPT/DBZ in 98µl in cell culture media and 1µl of
DAPT/DBZ in 999µl of cell culture media makes 10µM and 2µl in 998µl of cell culture
media makes 20µM.

117
Appendix B: Cell culture maintenance and ethics
B.1 Cell sub-culture
Cells were passaged once they had reached 90% confluence. The cell culture medium was
poured out of the flasks and thereafter the cells rinsed thrice with 2ml of 1X PBS, then 1ml
of trypsin/EDTA (#BE17-161E, Biowhittaker ® Lonza, USA) was poured onto the cells
and was left to incubate for 3mins at 37 C in 5 CO2 ( ThermoForm series ll water
jacketed CO2 Incubator [HEPA FILTER]). After 3mins, 1ml of culture media that was
appropriate to the cell line being sub-cultured was poured onto the cells to deactivate
trypsin/EDTA. The cells were triturated gently and 2ml of the cell suspension was
transferred into a 15ml tube (SPL Lifesciences, Korea) and centrifuged at 1000 rpm for
3mins. The supernatant was discarded and cells were re-suspended in 1ml of media
(appropriate for the cell line being that was being sub-cultured). The cell suspension was
split in a 1:2 ratio and then added into 4ml of pre-warmed cell culture media in a culture
flask.
B.2 Cell Freezing
Sub-culturing procedures were followed until the centrifugation step. The supernatant was
discarded and cells were re-suspended in 1ml of cold freezing media. The cell suspension
was diluted in a 1:5 ratio to obtain an ideal freezing density , 1ml of the suspension was
aliquoted into cryo-vials (Greiner Bio-one , Germany) and transferred to a polystyrene
tube rack to freeze slowly overnight at -70 C the following day the cryo-vials were
transferred to a -80 C freezer.

118
B.3 Cell thawing
Prior to thawing, 1ml of thawing medium was aliquoted into a 15ml tube and another 4ml
was aliquoted into a cell culture flask (SPL-Lifesciences, Korea) and placed in the
incubator to warm up. The cryo-vials were removed from the -80οC freezer and sprayed
down with 70% ethanol. The cells were thawed by rubbing the vials in-between gloved
hands- this was done to avoid possible contamination from the water bath. Once cells had
thawed they were immediately transferred into the 1ml of pre-warmed medium. The
suspension of cells was centrifuged at 1000 rpm for 3mins to wash out the DMSO from the
cells. The supernatant was discarded and the cells were re-suspended in 1ml of warm
thawing media and suspension was transferred into 4ml of pre-warmed thawing media.
B.4 Cell counting
Once the cells had been re-suspended in media after centrifugation (from 1.2.2 or 1.2.3),
the cell suspension was mixed with Trypan Blue dye solution (#17-942E; Biowhitattaker®
Lonza,USA) in a 1:1 ratio and 10µl of that mixture was pipetted into a disposable cell
counting slide (#1450011; Bio-rad,USA ) which was then inserted into a TC10 automated
cell counter (Bio-rad,USA) or was counted manually with a disposable haemocytomer
fastread counting slide (#BVS100; Immune systems, UK). The heamocytomer was viewed
under an inverted phase contrast microscope (Carl Zeiss 426126 Axiovert 25) and 2 grids
were counted. Concentration (count/ml) was calculated by:
Counts/ml = (total counts/number of complete 4x4 grids counts) x104 x sample dilution
Cell seeding densities were adjusted to the optimal cell concentration by calculating:
C1V1=C2V2

119
B.5 Ethic waiver
Attached below is the ethics approval letter from the Human research committee (medical).

120

121
APPENDIX C: Cell growth, proliferation and viability raw Data
C.1 Normal growth profile cell number optimisation
Table C.1: Dilution series for cell seeding densities for growth signature optimization.
CELL LINES MCF-7 MDA-MB-231 MDA-MB-436
SERIES 1 10000 10000 20000
SERIES 2 5000 5000 10000
SERIES 3 2500 2500 5000
SERIES 4 1250 1250 2500
SERIES 5 1250
Figure C.1 Optimising cell seeding density of MCF-7 cell line. Effect of cell density on CI, Cell
growth signature for MCF-7 cell line over a period of 77 hours, cells were seeded at 10000 cell
(red) ; 5000 cells(green) and 2500cells (blue). The Error bars represent the CI at ± standard
deviation. Optimisation of seeding density was repeated in triplicate.

122
Figure C.2 Optimising cell seeding density of MDA-MB-231cell line. Effect of cell density on
CI, Cell growth signature for MDA-MB-231 cell line over a period of 150.0 hours, cells were
seeded at 10000 cell (red) ; 5000 cells(green) and 2500cells (blue). The Error bars represent the
CI at ± standard deviation. Optimisation of seeding density was repeated in triplicate
Figure C.3 Optimising cell seeding density of MDA-MB-436 cell line. Effect of cell
density on CI, Cell growth signature for MDA-MB-436 cell line over a period of 77 hours,
cells were seeded at 10000 cell (red) ; 5000 cells(green) and 2500cells (blue). The Error
bars represent the CI at ± standard deviation. Optimisation of seeding density was repeated in
triplicate.

123
C.2 Trypan blue assay and cell viability drug concentration optimisation
C.2.2 Trypan Blue viability assay
Table C.2: Average percentage values of MCF-7 cell viability.
Concentration 10µM 20µM 30µM 40µM 50µM
DBZ 89.6667 29 44.4433 73 87.6667
DAPT 95.8333 87.68 81 55.6667 100
DMSO 98.8333 100 77.7767 66.64 67.7733
MEDIA 99 100 95.3333 94.4433 100
Table C.3: Standard deviation values of MCF-7 cell viability.
Concentration 10µM 20µM 30µM 40µM 50µM
DBZ 3.2146 25.1197 41.942 12.1244 21.362
DAPT 3.7072 1.12089 5.2915 5.1316 0
DMSO 2.0207 0 4.80933 0.03464 1.92835
MEDIA 0 0 8.0829 9.62443 0
Table C.4: Average percentage values of MDA-MB-231 viability.
Concentration 10µM 20µM 30µM 40µM 50µM
DBZ 88.5 27.6666667 41.6667 46.6667 86.9867
DAPT 89 67.0533333 87 9.66667 88.8867
DMSO 94.6667 99.1666667 38 100
MEDIA 100 100 96 59.6667

124
Table C.5: Standard deviation values of MDA-MB-231 cell viability.
Concentration 10µM 20µM 30µM 40µM 50µM
DBZ 10.037 9.2376 14.4338 50.3322 4.95
DAPT 9.777 4.7622 11.2694 16.7432 19.2489
DMSO 9.2376 1.44338 33.6452 0
MEDIA 0 0 6.9282 52.7289
Table C.6: Average percentage values of MDA-MB-436 cell viability.
Concentration 10µM 20µM 30µM 40µM 50µM
DBZ 89.0833 22.22 87.7767 29 100
DAPT 92.4167 96.6666667 97.2 91.6667 100
DMSO 96.75 95.0666667 100 100 100
MEDIA 97 100 87.6667 33.3333 100
Table C.7: Standard deviation values of MDA-MB-436 cell viability.
Concentration 10µM 20µM 30µM 40µM 50µM
DBZ 3.3292 38.4862 10.7159 34.3948 0
DAPT 1.59478 3.05505 4.84974 14.4338 0
DMSO 2.20681 6.65307 0 0 0
MEDIA 0 0 2.88675 57.735 0

125
C.2.3 Cell proliferation raw data
Figure C.4 Real-time cell proliferation and viability of the MCF-7 cell line over 88 hours. Cells were serum starved for 22 hours prior to drug treatment.
Figure C.5 Real-time cell proliferation and viability of the MD-MB-231 cell line over
200 hours. Cells were serum starved for 22 hours prior to drug treatment.

126
Figure C.6 Real-time cell proliferation and viability of the MDA-MB-231 cell line over 119
hours. Cells were serum starved for 22 hours prior to drug treatment.

127
Appendix D: Indirect immunofluorescence
Negative controls of immunofluorescence
D.1 Negative controls for the Notch-1 intracellular component signalling
expression and localisation
Negative controls included cells incubated with the primary antibody but excluded the
secondary antibody and those incubated with secondary antibody but exclude the primary
antibody. Images to represent these may be viewed below (Figure. D.1-3):
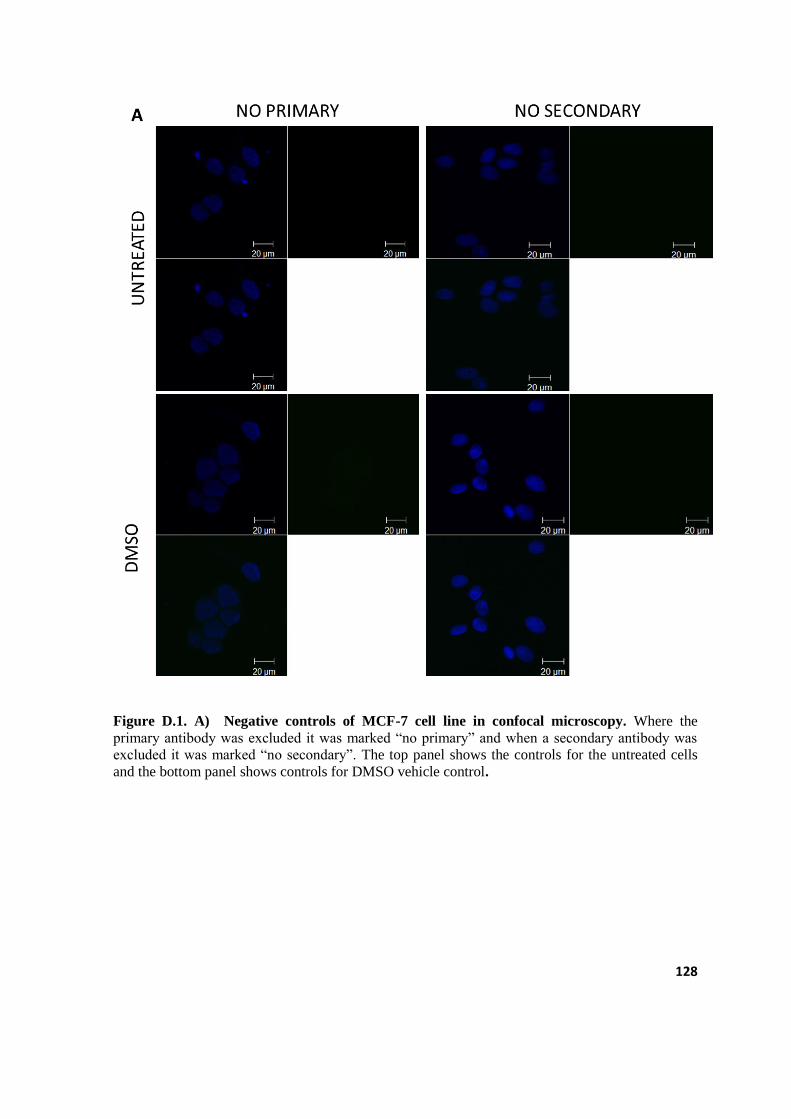
128
Figure D.1. A) Negative controls of MCF-7 cell line in confocal microscopy. Where the
primary antibody was excluded it was marked ―no primary‖ and when a secondary antibody was
excluded it was marked ―no secondary‖. The top panel shows the controls for the untreated cells
and the bottom panel shows controls for DMSO vehicle control.

129
Figure D.1.B) Negative controls of MCF-7 cell line in confocal microscopy. Where the primary
antibody was excluded it was marked ―no primary‖ and when a secondary antibody was excluded it
was marked ―no secondary‖. The top panel shows the controls for the DAPT treated cells and the
bottom panel shows controls for DBZ treated cells.

130
Figure D.2. A) Negative controls of MDA-MB-231cell line in confocal microscopy. Where the
primary antibody was excluded it was marked ―no primary‖ and when a secondary antibody was
excluded it was marked ―no secondary‖. The top panel shows the controls for the untreated cells
and the bottom panel shows controls for DMSO vehicle control.

131
Figure D.2 B) Negative controls of MDA-MB-231cell line in confocal microscopy. Where the
primary antibody was excluded it was marked ―no primary‖ and when a secondary antibody was
excluded it was marked ―no secondary‖. The top panel shows the controls for the DAPT treated
cells and the bottom panel shows controls for DBZ treated cells.

132
Figure D.3. A) Negative controls of MDA-MB-436 cell line in confocal microscopy. Where the
primary antibody was excluded it was marked ―no primary‖ and when a secondary antibody was
excluded it was marked ―no secondary‖. The top panel shows the controls for the untreated cells
and the bottom panel shows controls for DMSO vehicle control.

133
Figure D.3. B) Negative controls of MDA-MB-436 cell line in confocal microscopy. Where the
primary antibody was excluded it was marked ―no primary‖ and when a secondary antibody was
excluded it was marked ―no secondary‖. The top panel shows the controls for the DAPT treated
cells and the bottom panel shows controls for DBZ treated cells.

134
D.2 Negative controls for the expression and localisation of E-cadherin
Figure D.4. A) E-cadherin negative controls of MCF-7cell line in confocal microscopy. Where
the primary antibody was excluded it was marked ―no primary‖ and when a secondary antibody
was excluded it was marked ―no secondary‖. The top panel shows the controls for the untreated
cells and the bottom panel shows controls for DMSO vehicle control.

135
Figure D.4. B) E-cadherin negative controls of MCF-7cell line in confocal microscopy. Where
the primary antibody was excluded it was marked ―no primary‖ and when a secondary antibody
was excluded it was marked ―no secondary‖. The top panel shows the controls for the DAPT
treated cells and the bottom panel shows controls for DBZ treated cells.

136
Figure D.5. A) E-cadherin negative controls of MDA-MB-231cell line in confocal microscopy.
Where the primary antibody was excluded it was marked ―no primary‖ and when a secondary
antibody was excluded it was marked ―no secondary‖. The top panel shows the controls for the
untreated cells and the bottom panel shows controls for DMSO vehicle control.

137
Figure D.5.B) E-cadherin negative controls of MDA-MB-231cell line in confocal microscopy.
Where the primary antibody was excluded it was marked ―no primary‖ and when a secondary
antibody was excluded it was marked ―no secondary‖. The top panel shows the controls for the
DAPT treated cells and the bottom panel shows controls for DBZ treated cells.

138
Figure D.6.A) E-cadherin negative controls of MDA-MB-436 cell line in confocal microscopy.
Where the primary antibody was excluded it was marked ―no primary‖ and when a secondary
antibody was excluded it was marked ―no secondary‖. The top panel shows the controls for the
untreated cells and the bottom panel shows controls for DMSO vehicle control.
B)

139
Figure D.6 B) E-cadherin negative controls of MDA-MB-436 cell line in confocal microscopy.
Where the primary antibody was excluded it was marked ―no primary‖ and when a secondary
antibody was excluded it was marked ―no secondary‖. The top panel shows the controls for the
DAPT treated cells and the bottom panel shows controls for DBZ treated cells.

140
D.3 MCF-7 cell line E-cadherin expression
Figure D.7. The E-cadherin expression and localisation in MCF-7 cell line. E-cadherin (red)
appears to be expressed in the cytoplasm, the cell membrane as well as the nucleus (blue).

141
Appendix E: Scratch/Migration assay analysis
E.1 Calculations of cell migration
The distance between two borders of the cells created by the scratch, was measured at 3
points on the image (Figure E.1 orange arrows), using the Imagej software. The distance
was calculated in pixels. The distance in pixel/µm was given by the formula Distance in
pixels\known distance X 1.0 pixel aspect ratio which is performed by ImageJ
automatically. The averages of the 3 were calculated as the average distance for one
scratch. As each experiment included 3 biological repeats (Figure E.2-4) every gap on each
image was measured using this method. The average distance for each triplicate was
regarded as the average distance in pixels/µm.
Figure E.1.Scratch image analyses. An example of the three points (orange arrows) at which the
gap was measured using Imagej Software.

142
Figure E.2 Scratch image analyses. An example of DAPT treated cells in triplicates at 0 hours, 2
hours and 4 hours. The white arrows indicate gap closure
Figure E.3. Scratch image analyses. An example of DAPT treated cells in triplicates at 24 hours,
26 hours and 28 hours. The white arrows indicate gap closure

143
Figure E.4 Scratch image analyses. An example of DAPT treated cells in triplicates at 48 hours.
The white arrows indicate gap closure.
E.2 Raw data for gap closure plots
Table E.1: The average distances of MCF-7 cell line pixel/µm calculated on ImageJ.
average
Time
(hours)
UNTREATED DMSO DAPT DBZ
0
5.405 6.111333333 4.665667 6.683
2 4.557333333 4.604 6.32 4.918667
4 5.899 5.397 5.668 4.196667
24 3.301333333 4.269 4.112333 5.429667
26 3.193333333 3.918666667 3.385667 3.609
28 3.271 3.883 3.539667 2.476
48 1.886333333 2.302333333 2.483667 2.769333

144
Table E.2: The standard deviations of MCF-7 cell line pixel/µm calculated on ImageJ.
SDV
Time
(hours)
UNTREATED DMSO DAPT DBZ
0 0.54086875 0.175845 0.85770411 0.077788
2 0.13875278 0.366283 0.32261897 0.453244
4 0.56357165 0.534506 0.91279571 0.299067
24 0.58704032 0.543617 0.57189626 0.314607
26 0.74377707 0.605004 0.68207429 0.313651
28 1.14852993 1.423559 0.42602856 0.116052
48 0.52401559 0.432551 0.57452618 0.368138
Table E.3: The average distances of MDA-MB-231 cell line pixel/µm calculated on
ImageJ.
average
Time
(hours)
UNTREATED DMSO DAPT DBZ
4.252 3.555 6.020667 5.709667
2 4.24 4.36533333 4.330667 3.832667
4 4.62133333 4.727 4.397667 4.100667
24 4.09333333 3.80366667 2.513333 3.895333
26 3.287 3.096 3.723 3.241333
28 2.619 3.03833333 4.225667 3.224333
48 1.277 2.614 2.594667 0.930333

145
Table E.4: The standard deviation MDA-MB-231cell line pixel/µm calculated on ImageJ.
SDV
Time
(hours)
UNTREATED DMSO DAPT DBZ
0 0.245036732 0.495254 0.588145 0.15232
2 0.50610572 0.190264 0.350423 0.441799
4 0.595760299 0.527787 0.190327 0.83001
24 0.525178382 0.628673 0.707094 0.369197
26 0.424625718 0.659737 0.838485 0.443741
28 0.847488643 0.694784 0.473407 0.393983
48 0.459568276 0.522943 0.876286 0.366757
Table E.5: The averages distances of MDA-MB-436 cell line pixel/µm calculated on
ImageJ.
averages
Time
(hours)
UNTREATED DMSO DAPT DBZ
0 6.432 6.223 6.228667 6.089667
2 5.999333333 5.61366667 5.597333 4.828667
4 5.483333333 5.10233333 5.917 5.108333
24 4.118666667 3.927 4.115 4.960667
26 4.235666667 4.08466667 3.587667 4.909333
28 4.615 3.62166667 4.274333 5.071333
48 3.899333333 4.501 3.672 4.468667

146
Table E.6: The standard deviations of MDA-MB-436 cell line pixel/µm calculated on
ImageJ.
SDV
Time
(hours)
UNTREATED DMSO DAPT DBZ
0 0.488430138 0.138156 0.182506 0.45581
2 0.246579264 0.105406 0.40721 0.183664
4 0.334156151 0.205432 0.117478 0.368419
24 0.311872303 0.330002 0.792121 0.434403
26 0.148708888 0.105078 0.639207 0.426809
28 0.476087177 0.162312 0.492526 0.366571
48 0.173727756 0.681954 0.822658 0.577243

147
APPENDIX F: Statistical analyses and turn-it-in report
All statistical data was calculated with Graphpad Prism 5 Software version 5 below are all
the outputs from the analysis.
Table F.1: Results from the Kruskal-Wallis test of the effect of DBZ on MCF-7, MDA-
MB-231 and MDA-MB-436 cell lines.
Table Analysed Effect of DBZ on MCF-7,MDA-
MB-231 and MDA-MB-436
Kruskal-Wallis test
P value P<0.0001
Exact or approximate P value? Gaussian Approximation
P value summary ***
Do the medians vary signif. (P < 0.05) Yes
Number of groups 3
Kruskal-Wallis statistic 206.4

148
Table F.2: Results from the Kruskal-Wallis test of the effect of DAPT on MCF-7,MDA-
MB-231 and MDA-MB436 cell lines.
Table Analysed Effect of DAPT on MCF-
7,MDA-MB-231 and MDA-
MB-436
Kruskal-Wallis test
P value P<0.0001
Exact or approximate P value? Gaussian Approximation
P value summary ***
Do the medians vary signif. (P < 0.05) Yes
Number of groups 3
Kruskal-Wallis statistic 201.0
Table F.3: Results from the Kruskal-Wallis test of the normal growth curves of MCF-7,
MDA-MB-231, and MDA-MB-436 cell lines.
Table Analysed Growth curve
Kruskal-Wallis test
P value P<0.0001
Exact or approximate P value? Gaussian Approximation
P value summary ***
Do the medians vary signif. (P < 0.05) Yes
Number of groups 3
Kruskal-Wallis statistic 174.8

149
Table F.4: Results from the unpaired student’s t-test between the growth curves of MCF-7
and MDA-MB-231 cell lines.
Table Analysed Growth curve MCF-7 VS
MDA-231
Column A MCF-7
vs vs
Column B MDA-MB-231
Unpaired t test
P value P<0.0001
P value summary ***
Are means signif. different? (P < 0.05) Yes
One- or two-tailed P value? Two-tailed
t, df t=16.05 df=294
How big is the difference?
Mean ± SEM of column A 6.265 ± 0.1685 N=148
Mean ± SEM of column B 3.177 ± 0.09299 N=148
Difference between means 3.088 ± 0.1924
95% confidence interval 2.711 to 3.465
R squared 0.4669
F test to compare variances
F,DFn, Dfd 3.282, 147, 147
P value P<0.0001
P value summary ***
Are variances significantly different? Yes

150
Table F.5: Results from the unpaired student’s t-test between the growth curves of MCF-7
and MDA-MB-436.
Table Analysed Growth curve MCF-7 vs MDA-
MB-436
Column A MCF-7
vs vs
Column B MDA-MB-436
Unpaired t test
P value P<0.0001
P value summary ***
Are means signif. different? (P < 0.05) Yes
One- or two-tailed P value? Two-tailed
t, df t=17.70 df=294
How big is the difference?
Mean ± SEM of column A 6.265 ± 0.1685 N=148
Mean ± SEM of column B 3.165 ± 0.04780 N=148
Difference between means 3.099 ± 0.1751
95% confidence interval 2.756 to 3.442
R squared 0.5159
F test to compare variances
F,DFn, Dfd 12.42, 147, 147
P value P<0.0001
P value summary ***
Are variances significantly different? Yes
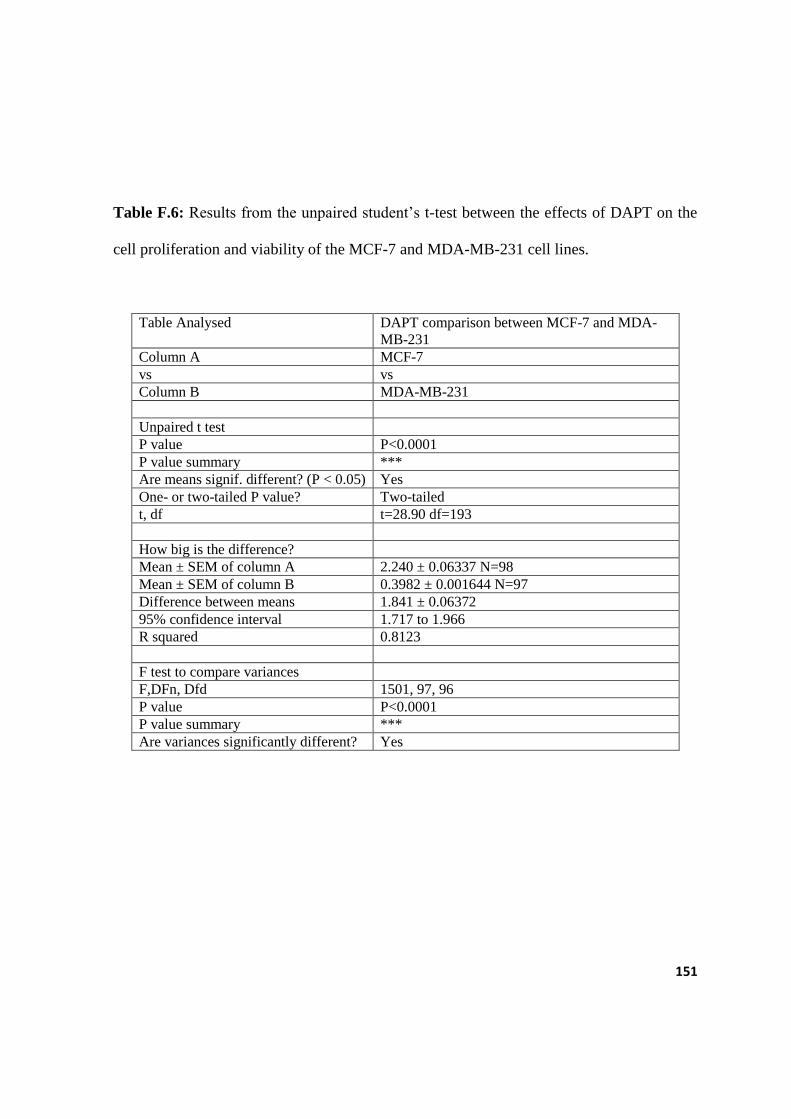
151
Table F.6: Results from the unpaired student’s t-test between the effects of DAPT on the
cell proliferation and viability of the MCF-7 and MDA-MB-231 cell lines.
Table Analysed DAPT comparison between MCF-7 and MDA-
MB-231
Column A MCF-7
vs vs
Column B MDA-MB-231
Unpaired t test
P value P<0.0001
P value summary ***
Are means signif. different? (P < 0.05) Yes
One- or two-tailed P value? Two-tailed
t, df t=28.90 df=193
How big is the difference?
Mean ± SEM of column A 2.240 ± 0.06337 N=98
Mean ± SEM of column B 0.3982 ± 0.001644 N=97
Difference between means 1.841 ± 0.06372
95% confidence interval 1.717 to 1.966
R squared 0.8123
F test to compare variances
F,DFn, Dfd 1501, 97, 96
P value P<0.0001
P value summary ***
Are variances significantly different? Yes

152
Table F.7: Results from the unpaired student’s t-test between the effects of DAPT on the
cell proliferation and viability of the MCF-7 and MDA-MB-436 cell lines.
Table Analysed DAPT comparison between MCF-7 and MDA-MB-
436
Column A MCF-7
vs vs
Column B MDA-MB-436
Unpaired t test
P value P<0.0001
P value summary ***
Are means signif. different? (P < 0.05) Yes
One- or two-tailed P value? Two-tailed
t, df t=28.74 df=192
How big is the difference?
Mean ± SEM of column A 2.240 ± 0.06337 N=98
Mean ± SEM of column B 0.3452 ± 0.01582 N=96
Difference between means 1.894 ± 0.06591
95% confidence interval 1.765 to 2.024
R squared 0.8114
F test to compare variances
F,DFn, Dfd 16.37, 97, 95
P value P<0.0001
P value summary ***
Are variances significantly different? Yes

153
Table F.8: Results from the unpaired student’s t-test between the effects of DBZ on the
cell proliferation and viability of the MCF-7 and MDA-MB-231 cell lines.
Table Analysed DBZ comparison between MCF-7 and MDA-MB-
231
Column A MCF-7
vs vs
Column B MDA-MB-231
Unpaired t test
P value P<0.0001
P value summary ***
Are means signif. different? (P < 0.05) Yes
One- or two-tailed P value? Two-tailed
t, df t=16.93 df=193
How big is the difference?
Mean ± SEM of column A 1.421 ± 0.06245 N=98
Mean ± SEM of column B 0.3579 ± 0.002118 N=97
Difference between means 1.064 ± 0.06281
95% confidence interval 0.9404 to 1.187
R squared 0.5977
F test to compare variances
F,DFn, Dfd 878.3, 97, 96
P value P<0.0001
P value summary ***
Are variances significantly different? Yes

154
Table F.9: Results from the unpaired student’s t-test between the effects of DBZ on the
cell proliferation and viability of the MCF-7 and MDA-MB-436 cell lines.
Table Analysed DBZ comparison between MCF-7 and MDA-MB-
436
Column A MCF-7
vs vs
Column B MDA-MB-436
Unpaired t test
P value P<0.0001
P value summary ***
Are means signif. different? (P < 0.05) Yes
One- or two-tailed P value? Two-tailed
t, df t=17.55 df=192
How big is the difference?
Mean ± SEM of column A 1.421 ± 0.06245 N=98
Mean ± SEM of column B 0.3024 ± 0.009160 N=96
Difference between means 1.119 ± 0.06375
95% confidence interval 0.9941 to 1.244
R squared 0.6161
F test to compare variances
F,DFn, Dfd 47.45, 97, 95
P value P<0.0001
P value summary ***
Are variances significantly different? Yes

155
Table F.10: Results from the paired student’s t-test between the effects of DAPT vs DBZ
on the cell proliferation and viability of the MCF-7 cell line.
Table Analysed MCF-7 DAPT VS
DBZ
Column A DAPT
vs vs
Column B DBZ
Paired t test
P value P<0.0001
P value summary ***
Are means signif. different? (P < 0.05) Yes
One- or two-tailed P value? Two-tailed
t, df t=94.01 df=97
Number of pairs 98
How big is the difference?
Mean of differences 0.8182
95% confidence interval 0.8009 to 0.8355
R squared 0.9891
How effective was the pairing?
Correlation coefficient (r) 0.9905
P Value (one tailed) P<0.0001
P value summary ***
Was the pairing significantly effective? Yes

156
Table F.11: Results from the paired student’s t-test between the effects of DAPT vs DBZ
on the cell proliferation and viability of the MDA-MB-231 cell line.
Table Analysed MDA-MB-231 DAPT vs DBZ
Column A DAPT
vs vs
Column B DBZ
Paired t test
P value P<0.0001
P value summary ***
Are means signif. different? (P < 0.05) Yes
One- or two-tailed P value? Two-tailed
t, df t=23.98 df=96
Number of pairs 97
How big is the difference?
Mean of differences 0.04034
95% confidence interval 0.03700 to 0.04369
R squared 0.8569
How effective was the pairing?
Correlation coefficient (r) 0.6257
P Value (one tailed) P<0.0001
P value summary ***
Was the pairing significantly effective? Yes

157
Table F.12: Results from the paired student’s t-test between the effects of DAPT vs DBZ
on the cell proliferation and viability of the MDA-MB-436 cell line.
Table Analysed MDA-MB-436 DAPT vs DBZ
Column A DAPT
vs vs
Column B DBZ
Paired t test
P value P<0.0001
P value summary ***
Are means signif. different? (P < 0.05) Yes
One- or two-tailed P value? Two-tailed
t, df t=6.363 df=95
Number of pairs 96
How big is the difference?
Mean of differences 0.04285
95% confidence interval 0.02946 to 0.05624
R squared 0.2989
How effective was the pairing?
Correlation coefficient (r) 0.9968
P Value (one tailed) P<0.0001
P value summary ***
Was the pairing significantly effective? Yes

158
Table F.13: Results from the Kruskal-Wallis test on the cell migration of MCF-7 cell
lines.
Table Analysed MCF-7 migration assay anova
Kruskal-Wallis test
P value 0.3916
Exact or approximate P value? Gaussian Approximation
P value summary ns
Do the medians vary signif. (P < 0.05) No
Number of groups 4
Kruskal-Wallis statistic 3.000
Table F.14: Results from the Kruskal-Wallis t-test on the cell proliferation and viability of
the MDA-MB-231 cell line.
Table Analysed MDA-MB-231 migration assay
ANOVA
Kruskal-Wallis test
P value 0.3916
Exact or approximate P value? Gaussian Approximation
P value summary ns
Do the medians vary signif. (P < 0.05) No
Number of groups 4
Kruskal-Wallis statistic 3.000

159
Table F.15: Results from the Kruskal-Wallis t-test on the cell migration of the MDA-MB-
436 cell line.
Table Analysed MDA-MB-436 MIGRATION
ASSAY ANOVA
Kruskal-Wallis test
P value 0.3916
Exact or approximate P value? Gaussian Approximation
P value summary ns
Do the medians vary signif. (P < 0.05) No
Number of groups 4
Kruskal-Wallis statistic 3.000

160
Table F.16: Results from the paired student’s t-test between the effects of DAPT vs DBZ
on the cell migration of the MCF-7 cell line.
Table Analysed Migration assay MCF-7 DAPT VS
DBZ
Column A DAPT
vs vs
Column B DBZ
Paired t test
P value 0.9804
P value summary ns
Are means signif. different? (P < 0.05) No
One- or two-tailed P value? Two-tailed
t, df t=0.02564 df=6
Number of pairs 7
How big is the difference?
Mean of differences 0.01324
95% confidence interval -1.250 to 1.277
R squared 0.0001096
How effective was the pairing?
Correlation coefficient (r) 0.5431
P Value (one tailed) 0.1039
P value summary ns
Was the pairing significantly effective? No

161
Table F.17: Results from the paired student’s t-test between the effects of DAPT vs DBZ
on the cell proliferation and viability of the MDA-MB-436 cell line.
Table Analysed MDA-MB-436
migration assay
Column A DAPT
vs vs
Column B DBZ
Paired t test
P value 0.4015
P value summary ns
Are means signif. different? (P < 0.05) No
One- or two-tailed P value? Two-tailed
t, df t=0.9026 df=6
Number of pairs 7
How big is the difference?
Mean of differences -0.2921
95% confidence interval -1.084 to 0.4998
R squared 0.1195
How effective was the pairing?
Correlation coefficient (r) 0.6763
P Value (one tailed) 0.0476
P value summary *
Was the pairing significantly effective? Yes

162
Table F.18: Results from the paired student’s t-test between the effects of DAPT vs DBZ
on the cell proliferation and viability of the MDA-MB-231 cell line.
Table Analysed MDA-MB-231 migration
assay
Column A DAPT
vs vs
Column B DBZ
Paired t test
P value 0.2867
P value summary ns
Are means signif. different? (P < 0.05) No
One- or two-tailed P value? Two-tailed
t, df t=1.169 df=6
Number of pairs 7
How big is the difference?
Mean of differences 0.4102
95% confidence interval -0.4483 to 1.269
R squared 0.1856
How effective was the pairing?
Correlation coefficient (r) 0.7637
P Value (one tailed) 0.0228
P value summary *
Was the pairing significantly effective? Yes


![[Credentials];[Notch JSC]](https://img.pdfslide.net/doc/110x75/5442a5f9b1af9f350a8b46f3/credentialsnotch-jsc.jpg)