Embed Size (px)
Citation preview
INVESTIGATING THE REGENERATIVE PROPERTIES OF RECLAIMED SITES IN
SINGAPORE BY COMPARATIVE ANALYSIS OF SOFT-BOTTOM MACROBENTHIC
COMMUNITIES
Abigail Lum Yan Yi Yiong Ziyi Olivia
NUS High School of Mathematics and Science
Little Green Dot Student Research Grant PROJECT REPORT
submitted to
Nature Society (Singapore)
Junior College Category
2011 3, 828 words
ABSTRACT Singapore has undergone extensive reclamation since the 1960s and the activity has since posed major threats to marine life. This study aims to investigate the regenerative properties of reclaimed sites using three main descriptors of benthic fauna – species richness, abundance and biomass. Sediment samples were collected from the coastal waters of four locations, East Coast of Singapore (~45 years), St. John’s Island (~35 years), Pulau Sudong (~40 years) and Pulau Semakau (~22 years), chosen due to their different recovery durations since the last reclamation. A total of 16 samples were taken from each location in July 2011 using a bottom dredge. Samples collected were analyzed using the Shannon-Weaver Index (H’) to determine their soft-bottom macrobenthic community structures; each sample was sieved, and macrobenthos retained were preserved and identified. The research yielded a mean H’ value of 1.00, 0.53, 0.37 and 0.61/grab for East Coast, St. John’s Island, Pulau Sudong and Pulau Semakau respectively. The Kruskal-Wallis test revealed significant differences in abundances of benthic fauna across locations, with the highest and lowest levels at East Coast and Pulau Semakau respectively. The Pearson two way chi-squared test revealed that there is no evidence for association between the sediment composition and location sampled. Further analyses via general linear modelling have confirmed that the age of recovery does have considerable impact on the macrobenthos. Keywords: Soft-bottom macrobenthic communities; Reclamation; Environmental impact; Species richness and diversity; Singapore 220 Words
INTRODUCTION Land reclamation refers to the conversion or modification of wetlands and water bodies to become usable land. Rapid industrial and commercial expansion, accompanied by a growing population, has called for the need for more land in Singapore. In order to accommodate the nation’s need for more land to sustain healthy economic growth, much of Singapore’s southern coast and offshore islands have undergone reclamation work. Small-scaled land reclamation in Singapore started as early as 1820s. It was only in the 1960s that land reclamation was carried out on a large scale. Since then, Singapore has reclaimed about 70 km2 of land (Chia et al., 1988). The most common methods of reclamation involve the construction of sand walls and filling of materials or dumping of earth spoils to stabilize the seabed (Chen et al., 2002). However, these activities may negatively influence marine diversity (Morton, 1996) by increasing sedimentation rates at areas near the reclaimed site, which in turn influences sunlight penetration or even smother benthic organisms to death (Chou et al., 2004). Many marine habitats have also been destroyed due to land reclamation. In this study, macrobenthos were chosen as indicators of marine biodiversity and marine life health. The survival of benthic fauna primarily depends on physical and chemical properties of the subsoil; moreover, benthic communities are known to be sensitive to changes in the quality of water and other aspects of the marine environment. Due to their relatively sedentary lifestyles resulting in a long-term residency period in a marine habitat, benthic communities are commonly used as bio-indicators of specific environment and habitat conditions (Alongi, 1990; Alongi et al., 1992). There has been much research on benthic infauna in the coastal waters of Singapore, and they have revealed that sediment heterogeneity of the seabed and various environmental variables could potentially alter benthic community structure (Chou et al., 2004; Lu et al., 2005). Previous studies also suggest human activities, which likely indicate a change in the marine environmental conditions due to pollution or sedimentation (Hatcher et al., 1994; Chou et al., 2004), may have an impacton benthic communities. Thus, this research aims to examine reclaimed sites to ascertain the negative influence reclamation may have on marine life. By assessing the marine ecology of selected sites using three descriptors of benthic fauna –diversity, abundance and biomass, our objective is to make a distinction between the marine biodiversity of sites reclaimed at different time periods. The result willcould help us determine if the impacts of land reclamation are reversible, and whether there is a chance for full recovery of reclaimed sites. These findings would be vital to urban planning in Singapore – ultimately striking a balance between economic land area development through reclamation and Singapore’s marine biodiversity.
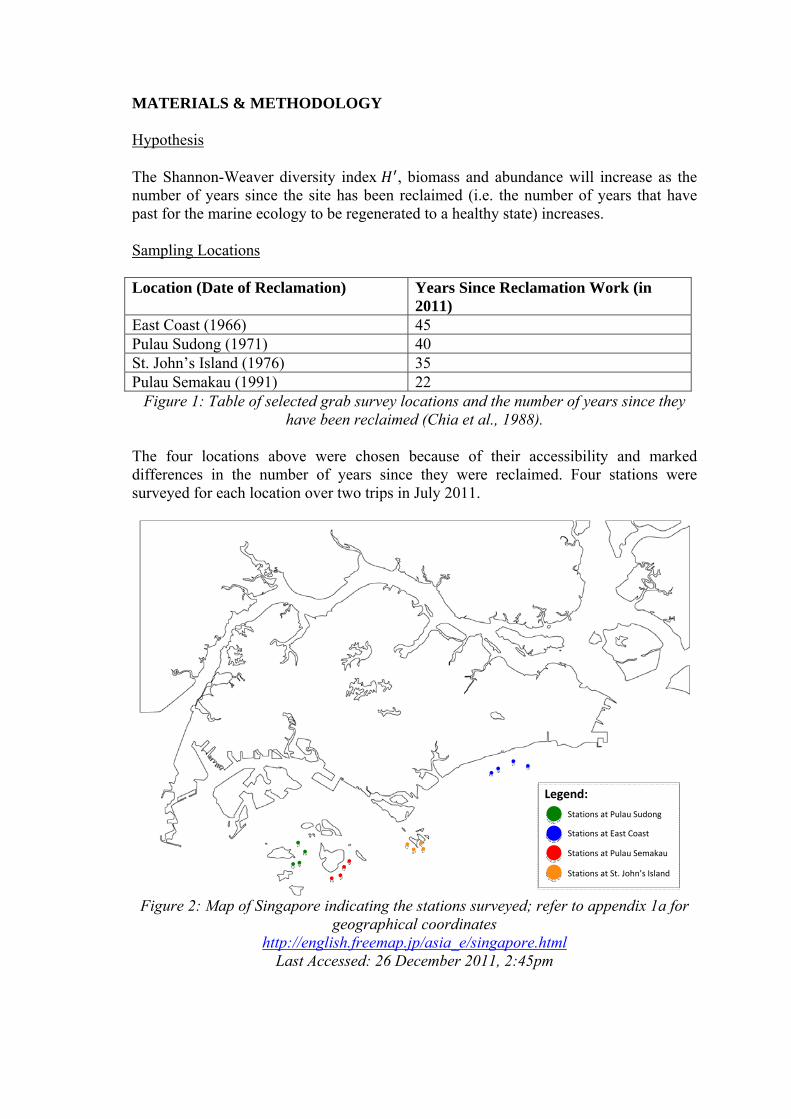
MATERIALS & METHODOLOGY Hypothesis The Shannon-Weaver diversity index , biomass and abundance will increase as the number of years since the site has been reclaimed (i.e. the number of years that have past for the marine ecology to be regenerated to a healthy state) increases. Sampling Locations Location (Date of Reclamation) Years Since Reclamation Work (in
2011) East Coast (1966) 45 Pulau Sudong (1971) 40 St. John’s Island (1976) 35 Pulau Semakau (1991) 22
Figure 1: Table of selected grab survey locations and the number of years since they have been reclaimed (Chia et al., 1988).
The four locations above were chosen because of their accessibility and marked differences in the number of years since they were reclaimed. Four stations were surveyed for each location over two trips in July 2011.
Figure 2: Map of Singapore indicating the stations surveyed; refer to appendix 1a for
geographical coordinates http://english.freemap.jp/asia_e/singapore.html
Last Accessed: 26 December 2011, 2:45pm
Legend: Stations at Pulau Sudong
Stations at East Coast
Stations at Pulau Semakau
Stations at St. John’s Island
Fitere M FowVmanw
Thcr
ive environemperature wespective pr
Macrofauna S
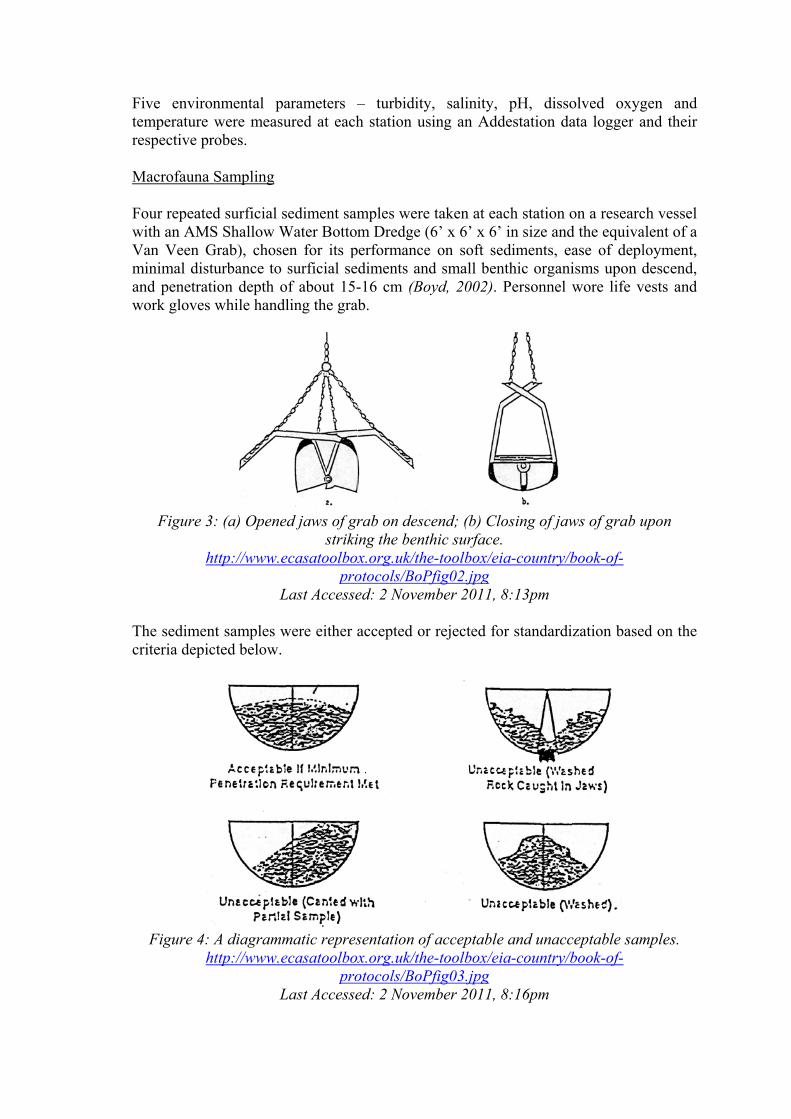
our repeatedwith an AMSVan Veen Gminimal distund penetrati
work gloves
Figure 3:
ht
he sedimenriteria depic
Figure 4: Aht
nmental pawere measuobes.
Sampling
d surficial sS Shallow W
Grab), choseurbance to ion depth owhile handl
: (a) Opene
ttp://www.e
L
nt samples wcted below.
A diagrammttp://www.e
L
arameters –ured at each
sediment samWater Bottomen for its psurficial se
of about 15-ling the gra
ed jaws of grstriki
ecasatoolboxpro
Last Accesse
were either a
matic represecasatoolbox
proLast Accesse
– turbidityh station us
mples werem Dredge (
performancediments and-16 cm (Bo
ab.
rab on descing the bentx.org.uk/theotocols/BoPed: 2 Novem
accepted or
sentation ofx.org.uk/theotocols/BoPed: 2 Novem
y, salinity, sing an Add
e taken at ea(6’ x 6’ x 6’e on soft sed small ben
oyd, 2002).
cend; (b) Clthic surface.e-toolbox/ei
Pfig02.jpg mber 2011,
r rejected fo
f acceptablee-toolbox/ei
Pfig03.jpg mber 2011,
pH, dissodestation da
ach station o’ in size andediments, eanthic organiPersonnel w
losing of jaw. ia-country/b
8:13pm
or standardi
e and unaccia-country/b
8:16pm
olved oxygata logger a
on a researcd the equivaase of deplisms upon dwore life v
ws of grab u
book-of-
zation base
ceptable sambook-of-
gen and and their
ch vessel alent of a loyment, descend,
vests and
upon
ed on the
mples.
Sieving and Storage Contents of the accepted samples were transferred into gallon-sized Ziploc bags and placed in a fridge for preliminary storage. The samples were then sorted for benthic fauna using a 0.5mm biological sieve. While sieving, water was gently sprayed from above and the sieve was agitated by hand in an up and down motion. The animals retained from the grab contents were then preserved in labeled falcon tubes, which included information on the sampled location, station number and sample number via fixation in a 10% buffered seawater formalin solution for two to four days, and were thereafter placed in 70% ethanol solution for long term storage. The chemicals were handled carefully with appropriate protective gear such as lab coats, gloves and facemasks. All animals were first sorted into 5 main categories (Annelida, Crustacea, Echinodermata, Mollusca and other invertebrate phyla), then classifiedto the lowest possible taxonomic levelusing a stereoscopic dissection microscope and biomass estimates were made for each sample, excluding fragments and empty mollusk shells. For each station, composite samples were pooled together and macrobenthic diversity was calculated using the Shannon-Weaver diversity index (Shannon and Weaver, 1963). The index is defined as ∑ , where refers to the proportion of the th phylum in the station.
Sediment Composition Analysis A small fraction of the sediment samples collected at each station was removed and transferred into labeled containers. Each sample was spread in the container and allowed to dry at 70ºC for at least 24 hours. After the sample hasfully dried, the dry weight was measured on a pre-weighed dish precisely to 3 decimal places. In order to separate the sand and silt fraction, clumps in the dried sample was broken up using a pestle and mortar, done in a fume hood, as this may generate dust which causes irritation to the skin and eyes. The sample was then dispersed in sodium hexametaphosphate solution (6.2 g/L) and steadily stirred for at least a half hour using a mechanical shaker. The sample was thereafter run through a 250 μm mesh sieve, thus retaining the sand fraction. The dry weight of the sand fraction was determined after drying at 70ºC overnight. The weight of the silt fraction was obtained by subtracting the dry weight of the sand fraction from the dry weight of the sample. The dried sand fraction was then transferred to a stacked series of mesh sieves, with the uppermost being the coarsest 4000 μm sieve and the bottommost being the finest 250 μm sieve. The column of sieves was shaken for approximately 10 minutes by hand to ensure thorough separation of grains. After sieving was completed, the grains retained at each sieve were weighed. The grain composition is subsequently represented by the respective percentage mass of grains at each size range. Statistical Analysis Due to our small sample size of 16 stations, the results will likely not follow a normal distribution. As such, the Kruskal-Wallis test was adopted to test for significant differences of the dependent variables, abundance, biomass and diversity, across
locations. The five independent environmental variables measured were put through the Kruskal-Wallis test as well. The Pearson’s chi-squared test was used to test for association between benthic surface sediment composition and the surveyed site. The general linear model (GLM) was used to determine the relationship between the explanatory and response variables. Prior to modelling, the Spearman’s rank correlation coefficient test was run to reveal correlated variables to be excluded from the general linear model. Akaike’s Corrected Information Criterion adjusted for small sample sizes (AICc), is an information-theoretic criterion used for our model selection. The calculation is represented as: AICc = nlog(RSS/n) + 2K(n /(n–K–1)); where n is the sample size, RSS is the residual sum-of-squares and k is the number of model parameters. Smaller AICc values indicate a better fit for the model (Burnham and Anderson, 2002). All statistical tests were run using MINITAB version 15 (Minitab 15 Statistical Software, 2007).
R B Aspabstwre Ab TALoEaPuStPu
Tofothabhaofwspyiinfiv(oac
RESULTS
enthic Faun
A total of 64pecimens bbundance, bations. Due
were pooled epresentatio
bundance
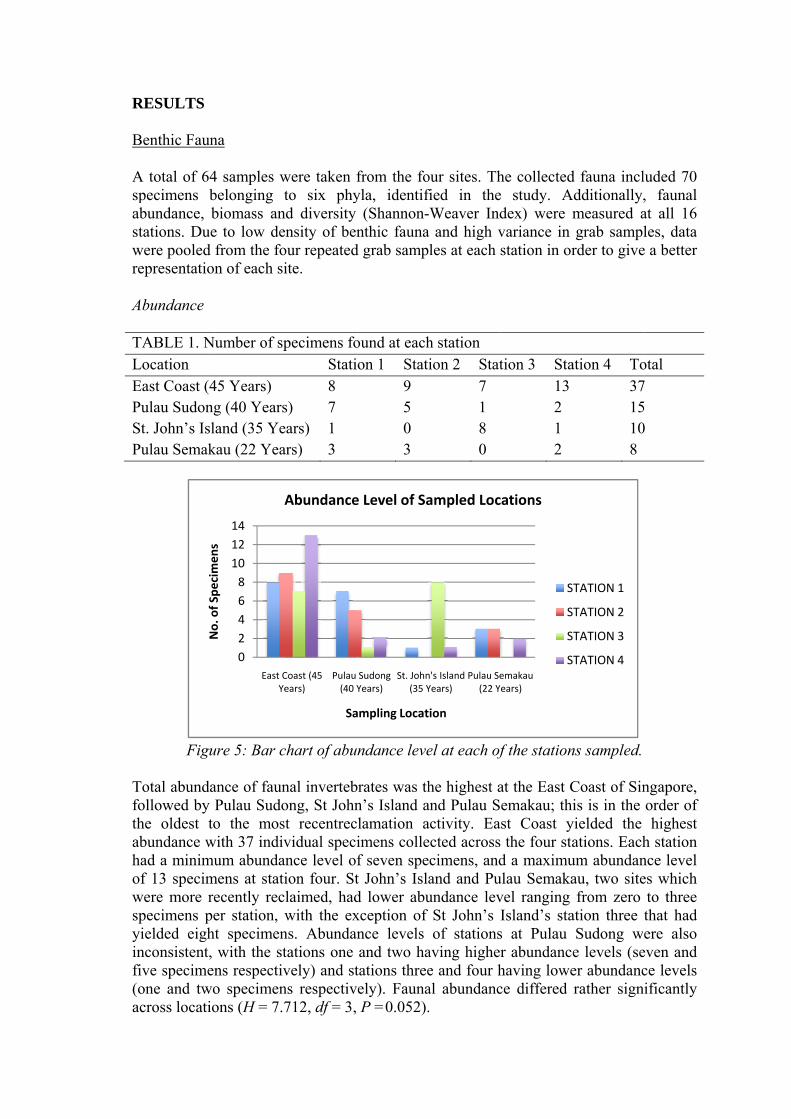
ABLE 1. Nocation ast Coast (4ulau Sudongt. John’s Islulau Semak
Figu
otal abundaollowed by he oldest tobundance wad a minimuf 13 specim
were more repecimens peielded eighnconsistent, ve specimen
one and twocross locatio
No
ofSpecim
ens
na
4 samples wbelonging tbiomass ande to low denfrom the fon of each si
Number of sp
45 Years) g (40 Yearsland (35 Yekau (22 Year
ure 5: Bar c
ance of faunPulau Sudoo the most
with 37 indivum abundan
mens at statiecently recler station, w
ht specimenwith the stns respectivo specimenons (H = 7.7
02468
101214
East CYe
No. of Spe
cimen
s
A
were taken fto six phyd diversity nsity of ben
our repeatedite.
pecimens foStati8
s) 7 ars) 1 rs) 3
hart of abun
nal invertebong, St Johnt recentrecvidual specince level ofion four. Stlaimed, hadwith the ex
ns. Abundantations one vely) and stns respectiv712, df = 3,
Coast (45 ears)
Pulau (40 Y
Sa
Abundance
from the foyla, identif
(Shannon-nthic fauna
d grab samp
ound at eachon 1 Stati
9 5 0 3
ndance leve
brates was thn’s Island alamation aimens collef seven spet John’s Islad lower abuxception of nce levels and two ha
tations threeely). FaunaP =0.052).
Sudong Years)
St. John(35 Y
ampling Locat
e Level of Sa
our sites. Thfied in theWeaver Ind
a and high vles at each
h station ion 2 Stat
7 1 8 0
el at each of
he highest aand Pulau Sactivity. Eaected acrosscimens, andand and Puundance levSt John’s Iof stations
aving highere and four hal abundanc.
n's Island Years)
Pulau Se(22 Y
ion
ampled Loc
he collectede study. Adex) were variance in station in or
tion 3 Sta13 2 1 2
f the station
at the East Cemakau; thst Coast y the four stad a maximu
ulau Semakavel ranging Island’s stas at Pulau r abundanchaving lowece differed
emakau ears)
cations
S
S
S
S
d fauna inclAdditionally,
measured agrab sampl
rder to give
ation 4 To3715108
ns sampled.
Coast of Sinhis is in the yielded the ations. Each
um abundanau, two sitefrom zero
ation three Sudong we levels (seer abundancrather sign
STATION 1
STATION 2
STATION 3
STATION 4
luded 70 , faunal at all 16 les, data
e a better
otal 7 5 0
ngapore, order of highest
h station nce level es which to three that had ere also
even and ce levels
nificantly
Bi TALoEaPuStPu
F
F
Th0.suThspa w
iomass
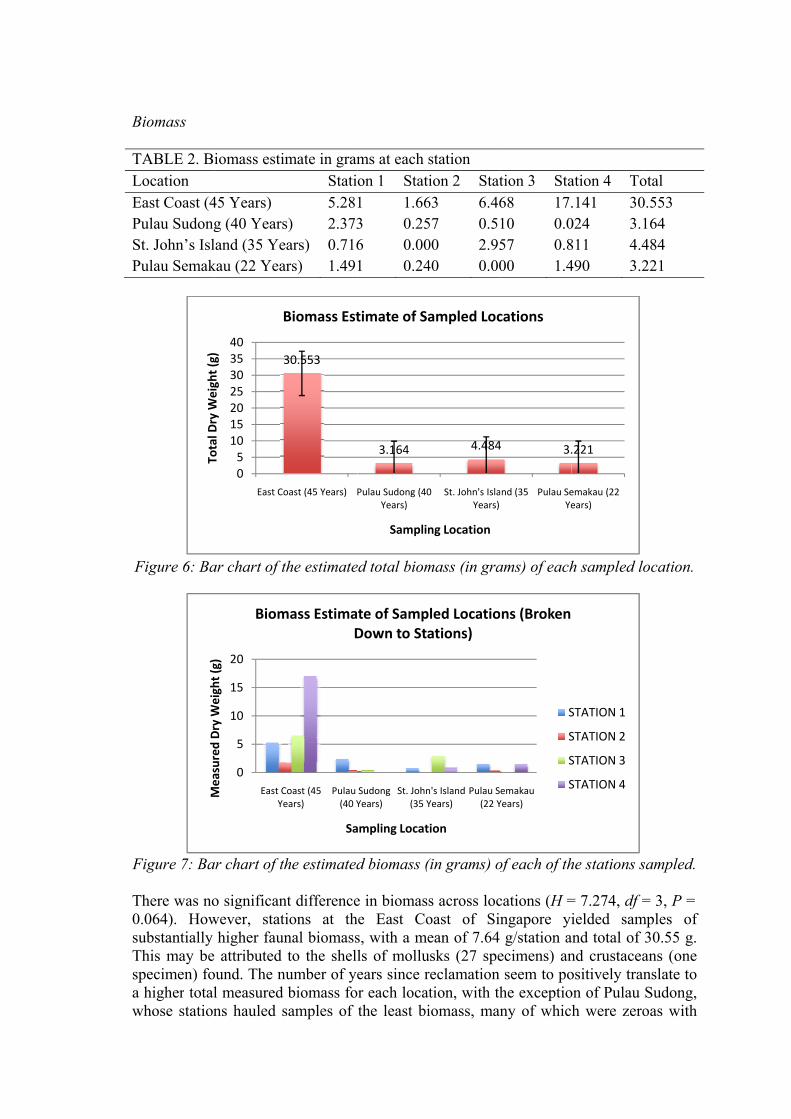
ABLE 2. Biocation ast Coast (4ulau Sudongt. John’s Islulau Semak
Figure 6: Ba
Figure 7: Ba
here was no064). How
ubstantially his may bepecimen) fohigher total
whose station
TotalD
ryWeight(g)
MeasuredDry
Weight(g)
iomass estim
45 Years) g (40 Yearsland (35 Yekau (22 Year
ar chart of t
ar chart of th
o significanwever, stati
higher faun attributed
ound. The nul measured ns hauled s
3
05
10152025303540
East Co
Total D
ry W
eight (g)
B
0
5
10
15
20
East CYe
Measured Dry W
eight (g)
Biom
mate in gramStati5.28
s) 2.373ars) 0.716rs) 1.49
the estimate
he estimated
nt differenceions at thnal biomassto the shellumber of yebiomass fo
samples of
30.553
oast (45 Years) P
Biomass Est
Coast (45 ears)
Pulau (40 Y
Sa
mass EstimaD
ms at each son 1 Stati1 1.663 0.256 0.001 0.24
ed total biom
d biomass (
e in biomasse East Cos, with a mels of molluears since rr each locatthe least bi
3.164
Pulau Sudong (40Years)
Samplin
timate of Sa
Sudong Years)
St. John(35 Y
ampling Locat
te of SampDown to Sta
station ion 2 Stat
63 6.4657 0.5100 2.9540 0.00
mass (in gra
(in grams) of
s across locoast of Sinean of 7.64
usks (27 spereclamationtion, with thiomass, man
4.484
0 St. John's IslaYears)
ng Location
ampled Loc
n's Island Years)
Pulau S(22 Y
ion
led Locatioations)
tion 3 Sta68 17.10 0.057 0.800 1.4
ams) of each
of each of th
cations (H =ngapore yig/station a
ecimens) anseem to po
he exceptiony of which
4 3.
nd (35 Pulau SeYe
cations
emakau Years)
ns (Broken
S
S
S
S
ation 4 To.141 30
024 3.1811 4.4490 3.2
h sampled lo
he stations s
= 7.274, df =ielded sam
and total of nd crustaceaositively tranon of Pulau h were zero
.221
emakau (22 ears)
STATION 1
STATION 2
STATION 3
STATION 4
otal 0.553 164 484 221
ocation.
sampled.
= 3, P = mples of
30.55 g. ans (one nslate to Sudong, oas with
abofre D TALoEaPuStPu
Dva/st
bundance. Hf Pulau Sudeclamation a
Diversity
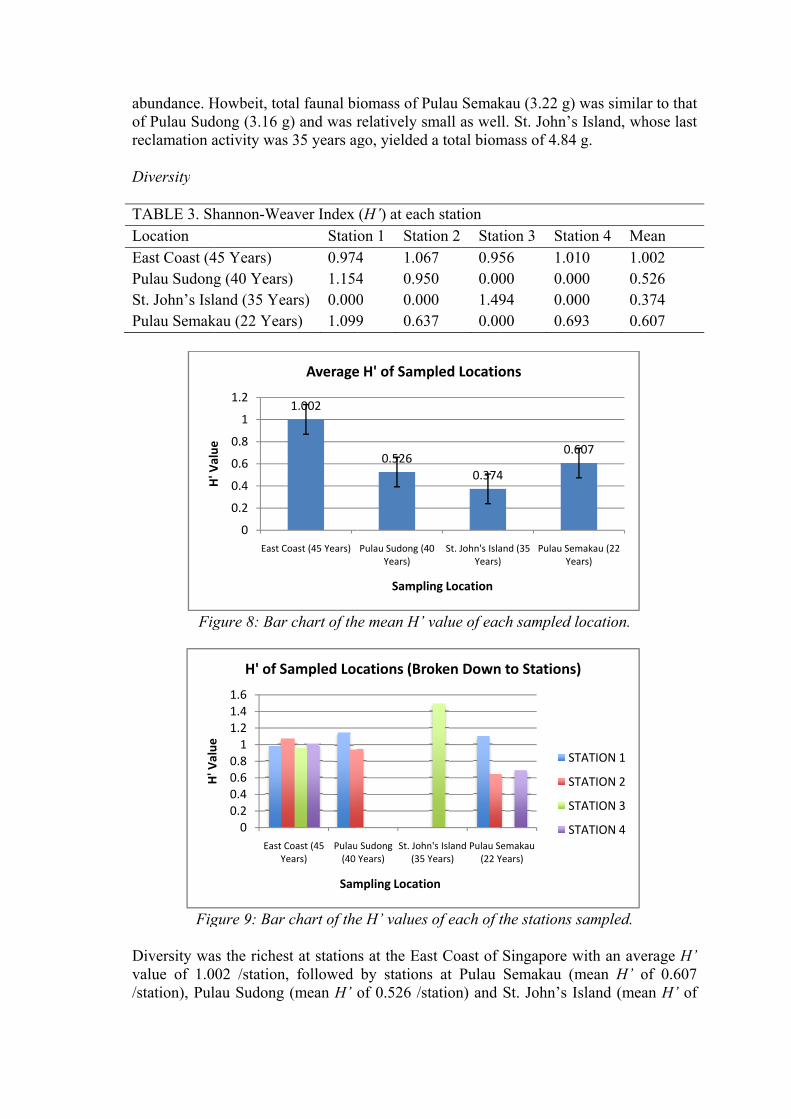
ABLE 3. Shocation ast Coast (4ulau Sudongt. John’s Islulau Semak
Fig
Fig
iversity waalue of 1.0tation), Pul
H'V
alue
H'V
alue
Howbeit, totdong (3.16 gactivity was
hannon-We
45 Years) g (40 Yearsland (35 Yekau (22 Year
gure 8: Bar
gure 9: Bar
as the riches02 /station,
lau Sudong
0
0.2
0.4
0.6
0.8
1
1.2
East C
H Value
00.20.40.60.81
1.21.41.6
East CY
H Value
H' of S
tal faunal big) and was rs 35 years ag
eaver Index Stati0.974
s) 1.154ars) 0.000rs) 1.099
r chart of th
chart of the
st at station, followed (mean H’ o
1.002
Coast (45 Years)
Average
Coast (45 ears)
Pulau(40
Sam
Sampled Loc
iomass of Prelatively smgo, yielded
(H’) at eachon 1 Stati4 1.064 0.950 0.009 0.63
e mean H’ v
e H’ values
ns at the Easby stationsof 0.526 /st
0.526
Pulau Sudong (4Years)
Sampli
e H' of Samp
Sudong Years)
St. John(35 Y
mpling Locatio
cations (Bro
Pulau Semakmall as wela total biom
h station ion 2 Stat
67 0.9550 0.0000 1.4937 0.00
value of eac
of each of t
st Coast of s at Pulau tation) and
0.374
0 St. John's IslaYears)
ng Location
pled Locatio
n's Island Years)
Pulau S(22 Y
on
oken Down
kau (3.22 g)ll. St. John’mass of 4.84
tion 3 Sta56 1.000 0.094 0.000 0.6
ch sampled
the stations
Singapore Semakau (St. John’s
4
0.
and (35 )
Pulau SeYe
ons
emakau Years)
n to Stations
S
S
S
S
) was similas Island, wh4 g.
ation 4 M010 1.0000 0.5000 0.3693 0.6
location.
sampled.
with an ave(mean H’ oIsland (mea
.607
emakau (22 ears)
s)
STATION 1
STATION 2
STATION 3
STATION 4
ar to that hose last
ean 002 526 374 607
erage H’ of 0.607 an H’ of
0.fo TALo
EaYPuYStYPuY
F
373 /stationour location
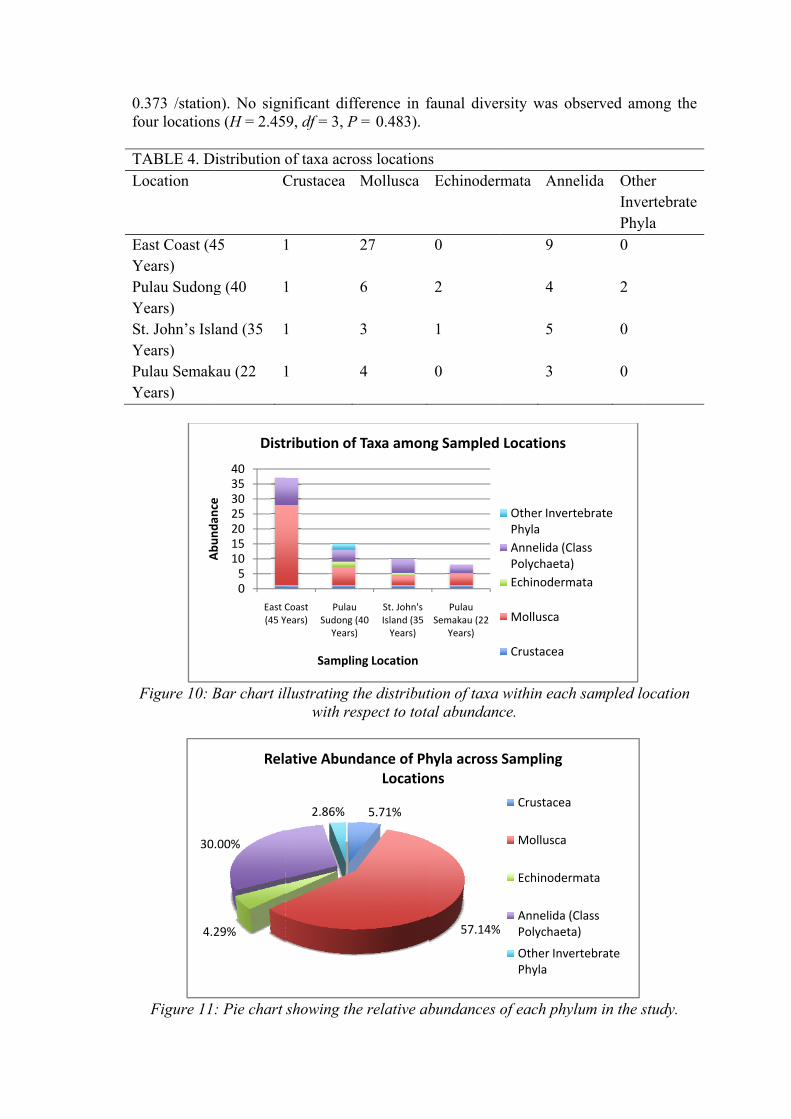
ABLE 4. Docation
ast Coast (4Years)
ulau SudongYears)
t. John’s IslYears)
ulau SemakYears)
Figure 10: B
Figure 11
Abu
ndan
ce
4.2
30
n). No signs (H = 2.45
istribution oC
45 1
g (40 1
land (35 1
kau (22 1
Bar chart il
: Pie chart
05
10152025303540
East C(45 Y
Abu
ndan
ce
Dist
29%
.00%
Rela
nificant diff9, df = 3, P
of taxa acroCrustacea
1
1
1
1
llustrating thwith res
showing the
Coast Years)
Pulau Sudong (
Years)
Samplin
ribution of
2.86%
ative Abund
ference in f= 0.483).
oss locationsMollusca
27
6
3
4
he distributspect to tota
e relative ab
(40 St. John's Island (35 Years)
ng Location
Taxa amon
5.71%
dance of PhLocatio
faunal diver
s Echinoderm
0
2
1
0
tion of taxa al abundanc
bundances o
Pulau Semakau (22
Years)
ng Sampled
57.14%
hyla across ns
rsity was o
mata Ann
9
4
5
3
within eachce.
of each phy
Locations
Other InverPhylaAnnelida (CPolychaeta)Echinoderm
Mollusca
Crustacea
Sampling
Crustacea
Mollusca
Echinoder
Annelida (Polychaeta
Other InvePhyla
bserved am
nelida OthInvePhy0
2
0
0
h sampled lo
ylum in the s
rtebrate
Class )mata
rmata
Class a)
ertebrate
mong the
her ertebrate
yla
ocation
study.
Phylum Mollusca made up the majority of the specimens collected from all four sites (57.14%) with 40 specimens. Polychaetes from the phylum Annelida were the next largest faunal group (30.00%) with 21 specimens. Only one crustacean was found at each of the sampling sites, while few echinoderms were found. Two roundworms from the phylum Nematoda were also retrieved from station four of Pulau Sudong. Environmental Parameters Appendix 1b summarizes the physical characteristics of the 16 stations sampled, including measurements of the depth, salinity, turbidity, pH, temperature and dissolved oxygen levels. Salinity levels ranged from 23.87 ppt to 25.65 ppt. There were significant differences in the salinity levels across the locations at the time of sampling (H = 10.670, df = 3, P =0.014). The turbidity levels did not differ significantly across locations at the time of sampling (H = 7.323, df = 3, P =0.062), although readings for turbidity within each sampling location were considerably inconsistent; station two at the East Coast of Singapore had a turbidity reading of 0.00 NTU.The sampled locations also yielded pH levels that were significantly different at the time of sampling (H = 12.035, df = 3, P =0.007). Waters at the East Coast of Singapore and Pulau Sudong leaned towards being more alkaline in nature while waters at St. John’s Island and Pulau Semakau were more acidic, with the lowest pH recorded in this study being 5.35.Water temperatures remained fairly constant across all locations with a mean of 30.67 ºC. However, statistical analyses revealed significant differences in the temperatures of the sampling locations (H = 11.078, df = 3, P =0.011), and this may be associated with the time of day at which the reading was taken.The amount of dissolved oxygen in each sampling location did not differ at the time of sampling (H = 4.264, df = 3, P =0.234). Sediment Composition Appendix 2a gives the distribution of grain sizes for each of the sampled locations. Referring to the pie charts at appendix 2b-e, the majority of the sampled locations – East Coast (56.49% silt), St. John’s Island (58.75% silt) and Pulau Semakau (60.30% silt) were made up primarily by the silt fraction, with the exception of Pulau Sudong (58.57% silt). The sediment at Pulau Sudong was found to comprise grains of generally greater sizes. The East Coast of Singapore also had an unusually high percentage of larger grains such as small stones or gravel, with 3.28% of the sediment being sand grains that were bigger than 4000 μmin size. Of all the locations sampled. Pulau Semakau had sediments that were extremely fine in nature and comprised a high silt fraction level and a large proportion of fine sand. The sediment compositions of Pulau Semakau and St. John’s Island followed a somewhat similar distribution, whereas the sediment compositions of the East Coast of Singapore and Pulau Sudong were distinctly dissimilar from the rest of the locations. No evidence exists for association between the location and sediment composition (χ² = 22.786, df =15, P = 0.089), thus the two variables deemed to be independent. General Linear Model Our correlation tests revealed that salinity, dissolved oxygen and pH were correlated with the number of years since reclamation (Appendix 3a) and were excluded from our

models; thus, only models that predict diversity, abundance and biomass as a function of the number of years since the last reclamation (YSR), temperature (TP), turbidity (TU), and percentage sand fraction (SF) were compared. The best models as selected via AICc calculations (Appendix 3b-d) are shown below:
SWI = 0.012 YSR + 0.203; where SWI is the Shannon-Weaver Diversity Index
ABD = 0.261 YSR – 4.894;
whereABD is the abundance of benthic fauna
BMS = 0.221 YSR – 5.249; whereBMS is the biomass of benthic fauna
DISCUSSION The dependent variables exhibited an overall increasing trend from the newest reclaimed site to the oldest reclaimed site. It is apparent that stations at East Coast, the oldest reclaimed site, yielded the highest diversity, abundance and biomass of benthic organisms; consequently it is likely that this site has managed to establish a stable and thriving community after the disturbances caused by the reclamation. The significantly high total biomass measured could be attributed to the shells of molluscs (27 specimens) found. However, it must be noted that all H’ values recorded in this study were generally low possibly due to the small sample and grab size. An exceptionally high H’ value was also observed at Pulau Semakau, although we expect it to have the lowest diversity as it was the most recently reclaimed site. Its marine life may not have been affected by the reclamation activity as much as the older reclaimed sites as efforts were made to protect the marine ecosystem during the time of construction of the rock bund via the use of silt screens, and careful management of the reclamation works. Additionally, the bund is made impermeable using a layer of membrane and marine clay, therefore preventing any landfill leachate from polluting the marine environment. The older reclaimed sites were subjected to greater impacts as a result of a lack of technology to prevent increasing instability of the environment, the leakage of landfill materials and sedimentation on the macrobenthos. A high proportion of organisms found in this research were from phylum Mollusca. Certain groups may be more prevalent due to their tolerance of different sedimentation rates and nutrient levels (Chou et. al., 2004); individuals more abundant in heavily sedimented stations had high tolerance for fine sediments and low nutrient levels and vice-versa. According to Chua and Lee (1984), construction materials are poor in nutrients and contain minimal organic matter, but molluscs may be more tolerant to these post-reclamation conditions. The next largest group was phylum Annelida and according to Olsgard and Hasle (1993), sites that were greatly affected by smothering of organisms all have small, opportunistic polychaetes as the predominant fauna. Polychaetes are also reported to be able to thrive in stressed environments of low dissolved oxygen and variable salinity levels (Aggrey-Fynn et al., 2011) via adaptive behaviour such as burrowing.After reclamation activities, the seabed is heavily disturbed and smothering will kill many benthic organisms. In this situation, opportunistic species will dominate, and if the effect of disturbance persists, these species will dominate continuously (Mirza and Gray, 1981). Model comparisons using AICc values have shown that the best models predict diversity, abundance and biomass as a function of the number of years since reclamation. Although salinity, pH and temperature, showed significant variability across locations, these parameters would have been easily influenced by other variables such as the time of sampling during the day, rather than the reclamation that took place years before. Thus, the differences in abundance, biomass and diversity of macrobenthos across sites are unlikely greatly altered by environmental parameters. Hence, the result of reclamation activities like habitat destruction and marine pollution through dredging and the dumping of earth spoils (Essink, 1999; OSPAR Commission, 2008) would likely be the dominant factors affecting the macrobenthic community. The latter is especially prevalent during the construction phase and sand extraction; changes
in sediment structure and nutrient input would have negative effects on macrobenthos and their habitat. The structure of the benthic community would also be affected due to deposition of fine-grained sediment on the coarser-grained sediment layer as a result of elevated silt concentration (Chou et. al., 2004). Limitations, Recommendations and Further Analysis Our experiment lacked a control because much of the southern coasts of Singapore has already been reclaimed; alternative locations in Malaysia that have not yet undergone any relcamation work could be considered for future studies. An assumption also made in this research was that the pre-existing marine biodiversity is identical across all sites. Ideally, a study on the regenerative properties of reclaimed sites should begin when the site was first reclaimed, and readings should be regularly taken back at the same site as the years pass. A larger grab size and more sampling should be considered to further substantiate our results. In addition, we plan to further identify the collected benthos down to family or species level with the help of a marine taxonomist, and ascertain if there are any indicator groups that were heavily affected by reclamation.
CONCLUSION There are negative impacts on marine life in the vicinity of reclamation activities as can be seen from low H’ values in this study when compared with findings in another research conducted by Lu et al. (2005). The dominant factor affecting benthos abundance, biomass and diversity was revealed to be the number of years since the last reclamation, suggesting that the number of years that have passed have indeed allowed a certain degree of regeneration to take place. These findings could help local environmental organizations identify reclaimed sites with high conservation values such as East Coast that was revealed to have achieved some form of regenerative success in this investigation. If well conserved and maintained in the years to come, this site may be able to recover to its original state. Pulau Semakau’shigh H’ despite its recent reclamation also makes it a site that is worth conserving. Agencies can thus consider using similar methods or technology employed during its reclamation for future reclamation work, in order to prevent excessive harm to the marine ecosystem. As Singapore is a country with limited land resources, it is almost impossible to rule out land reclamation if we want to maintain our competitiveness in the global economy. However, with careful management before, during and after the reclamation we can help speed up the regeneration process and our nation can then continue development yet reducing our impact on our marine biodiversity.
REFERENCES Aggrey-Fynn, J., Galyuon, I., Aheto, D.W. and Okyere, I. (2011) Assessment of the environmental conditions and benthic macroinvertebrate communities in two coastal lagoons in Ghana. Annals of Biological Research, 2011, 2(5): 413–424. Alongi, D.M. (1990) The ecology of tropical soft-bottom benthic ecosystems. Oceanography & Marine Biology: An Annual Review 28: 381-469. Alongi, D.M. and Chistoffersen, P. (1992) Benthic Infauna and Organism-sediment Relations in a Shallow, Tropical Coastal Area: Influence of outwelled mangrove detritus and physical disturbance. Marine Ecology Progress Series 81: 229–245. Boyd, S.E. (2002) Guidelines for the conduct of benthic studies at aggregate dredging sites. Lowestoft, Department for Transport, Local Government and the Regions, CEFAS: 1–117. Burnham, K.P. and Anderson, D.R. (2002). Model selection and multimodel inference: a practical information-theoretic approach. Springer. Chua, S.E. and Lee S.K. (1984) Creation of parks on reclaimed land in Singapore. Proceedings of the 3rd Symposium On Our Environment, Singapore: 43–50. Chen, C.S. and Tan, S.M. (2002) A Case History of Coastal Land Reclamation Project. GSM-IEM Forum on Engineering Geology & Geotechnics in Coastal Development, Institute of Engineering, Malaysia. Chia, L.S., Khan, H. and Chou, L.M. (1988) The Coastal Environmental Profile of Singapore. Technical Reports 21, International Center for Living Aquatic Resources Management, Manila, 92 pp. Chou, L.M., Yu, J.Y. and Loh, T.L. (2004) Impacts of sedimentation on soft-bottom benthic communities in the southern islands of Singapore. Hydrobiologia, 515(1−3): 91–106. Essink, K. (1999) Ecological effects of dumping of dredged sediments: options for management. Journal of Coastal Conservation, Volume 5, No.1, 69-80pp. Hatcher,A., Grant, J., and Schofield, B. (1994)Effects of suspended mussel culture (Mytilus spp.) on sedimentation, benthic respiration and sediment nutrient dynamics in a coastal bay. Marine Ecology Progress Series 91: 265–268. Lu, L. (2005) The relationship between soft-bottom macrobenthic communities and environmental variables in Singaporean waters. Marine Pollution Bulletin 51: 1034–1040. Minitab 15 Statistical Software. (2007) [Computer software]. State College, PA: Minitab, Inc. (www.minitab.com)
Mirza, F.B. and Gray, J.S. (1981) The fauna of benthic sediment from the organically enriched Olsofjord, Norway. Journal of Experimental Marine Biology & Ecology 54: 181–207. Morton, B. (1996) Protecting Hong Kong’s marine biodiversity: Present proposals, future challenges.Environmental Conservation23: 55–65. Olsgard, F. and Hasle, J. R. (1993)Impact of waste from titanium mining on benthic fauna. Journal of Experimental Marine Biology & Ecology 172: 185–213. OSPAR Commission (2008) Assessment of the environmental impact of land reclamation. Biodiversity Series. Shannon, C.E. and Weaver, W. (1963) The Mathematical Theory of Communication. University of Illinois Press, Urbana, IL, 125 pp.

ACKNOWLEDGEMENTS This study was supported by a grant awarded by IKEA Singapore, World Wide Fund for Nature (Singapore) and Nature Society (Singapore). We would like to thank NUS High School for the support and facilities they have provided us with. We would also like to thank our mentor, Mr. Chua Sek Chuan, and teacher-in-charge, Mr. Malcolm Soh for their guidance and expertise. Special thanks to the National Parks Board for agreeing to license and issue permits for this investigation.
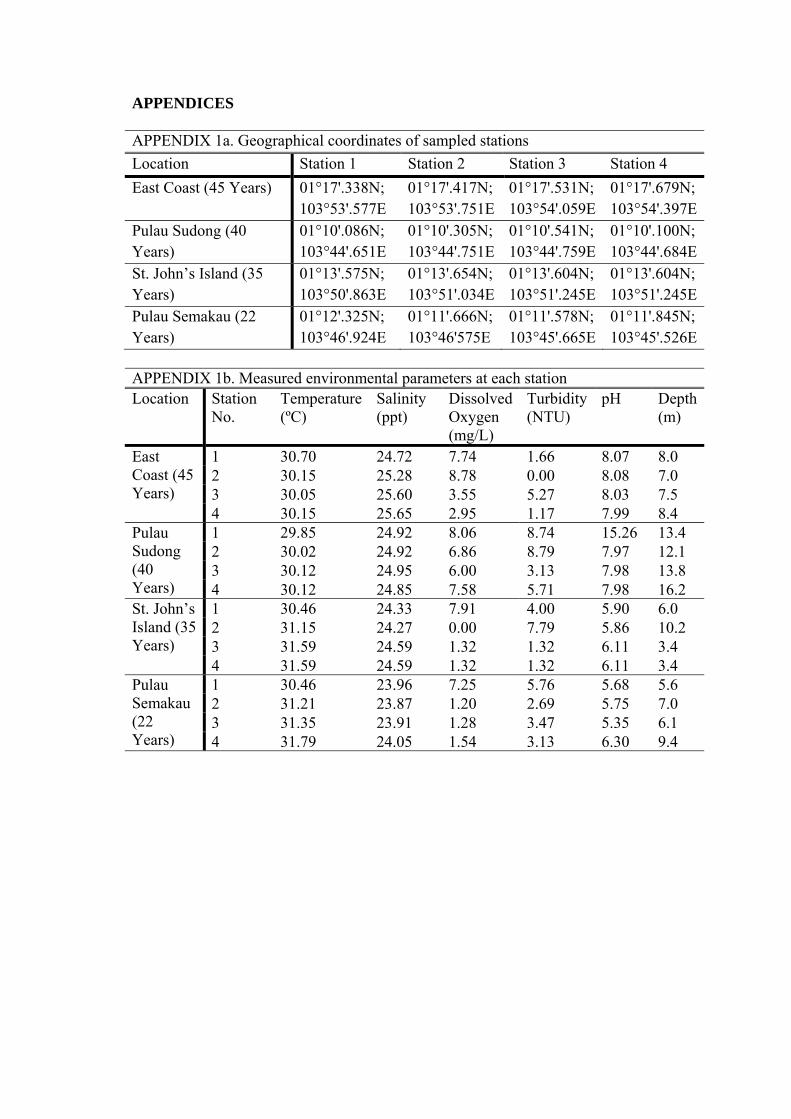
APPENDICES APPENDIX 1a. Geographical coordinates of sampled stations Location Station 1 Station 2 Station 3 Station 4 East Coast (45 Years) 01°17'.338N;
103°53'.577E 01°17'.417N; 103°53'.751E
01°17'.531N; 103°54'.059E
01°17'.679N; 103°54'.397E
Pulau Sudong (40 Years)
01°10'.086N; 103°44'.651E
01°10'.305N; 103°44'.751E
01°10'.541N; 103°44'.759E
01°10'.100N; 103°44'.684E
St. John’s Island (35 Years)
01°13'.575N; 103°50'.863E
01°13'.654N; 103°51'.034E
01°13'.604N; 103°51'.245E
01°13'.604N; 103°51'.245E
Pulau Semakau (22 Years)
01°12'.325N; 103°46'.924E
01°11'.666N; 103°46'575E
01°11'.578N; 103°45'.665E
01°11'.845N; 103°45'.526E
APPENDIX 1b. Measured environmental parameters at each station Location Station
No. Temperature (ºC)
Salinity (ppt)
Dissolved Oxygen (mg/L)
Turbidity (NTU)
pH Depth (m)
East Coast (45 Years)
1 30.70 24.72 7.74 1.66 8.07 8.0 2 30.15 25.28 8.78 0.00 8.08 7.0 3 30.05 25.60 3.55 5.27 8.03 7.5 4 30.15 25.65 2.95 1.17 7.99 8.4
Pulau Sudong (40 Years)
1 29.85 24.92 8.06 8.74 15.26 13.4 2 30.02 24.92 6.86 8.79 7.97 12.1 3 30.12 24.95 6.00 3.13 7.98 13.8 4 30.12 24.85 7.58 5.71 7.98 16.2
St. John’s Island (35 Years)
1 30.46 24.33 7.91 4.00 5.90 6.0 2 31.15 24.27 0.00 7.79 5.86 10.2 3 31.59 24.59 1.32 1.32 6.11 3.4 4 31.59 24.59 1.32 1.32 6.11 3.4
Pulau Semakau (22 Years)
1 30.46 23.96 7.25 5.76 5.68 5.6 2 31.21 23.87 1.20 2.69 5.75 7.0 3 31.35 23.91 1.28 3.47 5.35 6.1 4 31.79 24.05 1.54 3.13 6.30 9.4
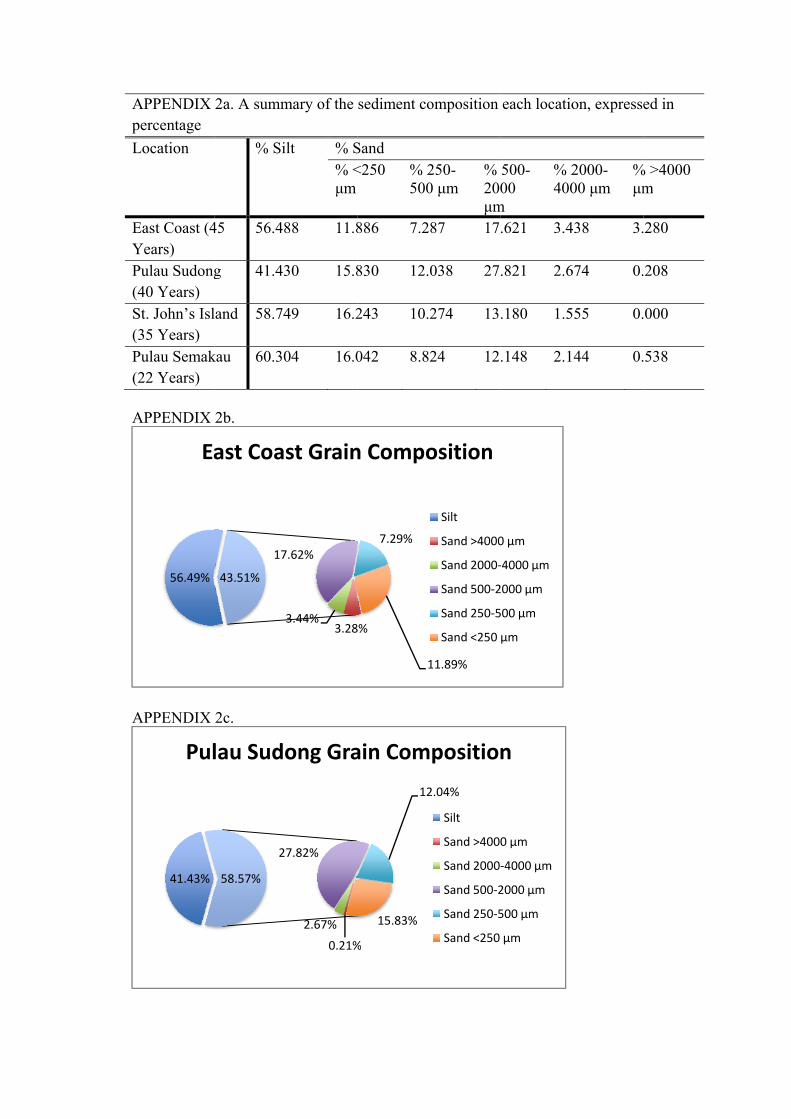
ApeLo
EaYPu(4St(3Pu(2 A
A
APPENDIX ercentage ocation
ast Coast (4Years)
ulau Sudong40 Years) t. John’s Isl35 Years) ulau Semak22 Years)
APPENDIX
APPENDIX
56.49%
Ea
41.43%
Pul
2a. A summ
% Si
45 56.48
g 41.43
land 58.74
kau 60.30
2b.
2c.
17
43.51%
ast Coas
2
58.57%
lau Sudo
mary of the
lt % S% <μm
88 11.8
30 15.8
49 16.2
04 16.0
3.283.44%
7.62%
st Grain
0.21%
2.67%
7.82%
ong Gra
sediment co
Sand <250 % 2
500
886 7.2
830 12.
243 10.
042 8.8
8%
7.29%
1
n Compo
%
12
15.83%
ain Com
omposition
250-0 μm
% 200μm
87 17
038 27
274 13
24 12
11.89%
osition
Silt
Sand >4000
Sand 2000‐
Sand 500‐2
Sand 250‐5
Sand <250
2.04%
mpositio
Silt
Sand >4000
Sand 2000
Sand 500‐2
Sand 250‐5
Sand <250
each locatio
500-00
m
% 2400
.621 3.4
.821 2.6
.180 1.5
.148 2.1
0 μm
‐4000 μm
2000 μm
500 μm
μm
n
0 μm
‐4000 μm
2000 μm
500 μm
μm
on, expresse
2000-00 μm
%μm
438 3.
674 0.
555 0.
44 0.
ed in
% >4000 m
280
208
000
538
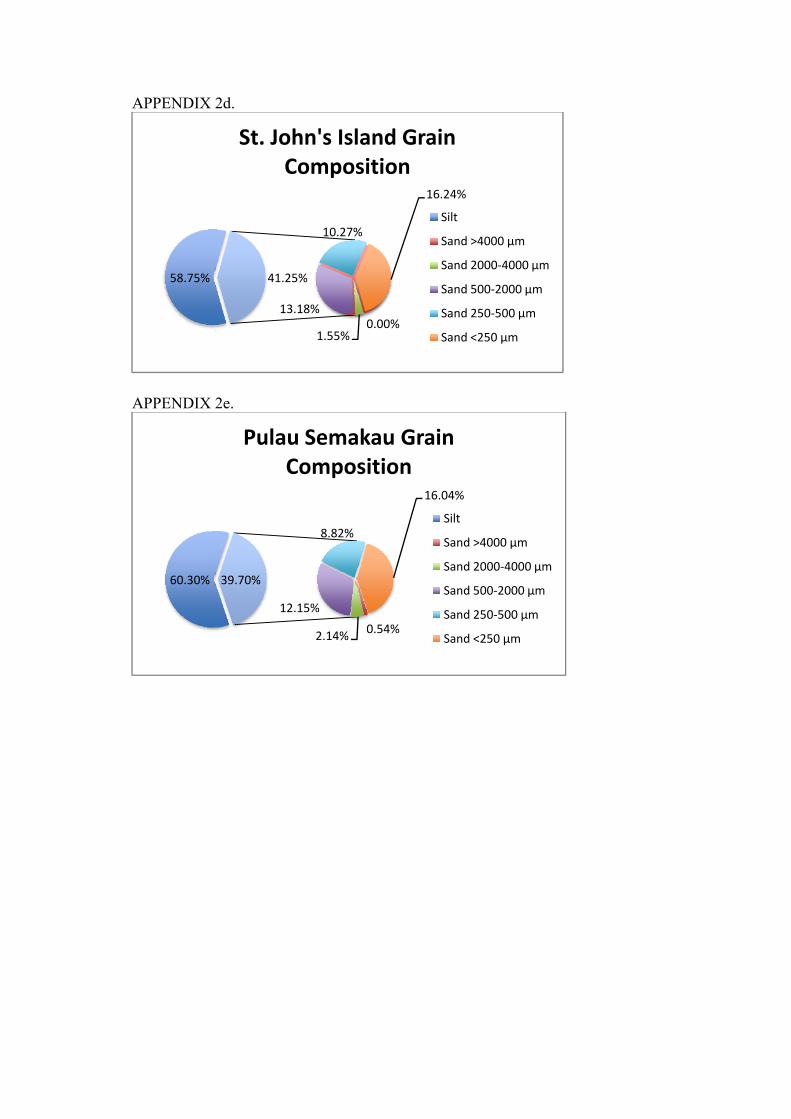
A
A
APPENDIX
APPENDIX
58.75%
60.30%
2d.
2e.
1
41.2
St. JoC
1
39.70%
Pula
1.55%
3.18%
10.27%
25%
ohn's IslCompos
2.14%
2.15%
8.82%
u SemaCompos
0.00%
%
1
land Grasition
0.54%
1
akau Grasition
16.24%
ain
Silt
Sand >4000
Sand 2000‐
Sand 500‐2
Sand 250‐5
Sand <250
16.04%
ain
Silt
Sand >4000
Sand 2000
Sand 500‐2
Sand 250‐5
Sand <250
0 μm
‐4000 μm
2000 μm
500 μm
μm
0 μm
‐4000 μm
2000 μm
500 μm
μm
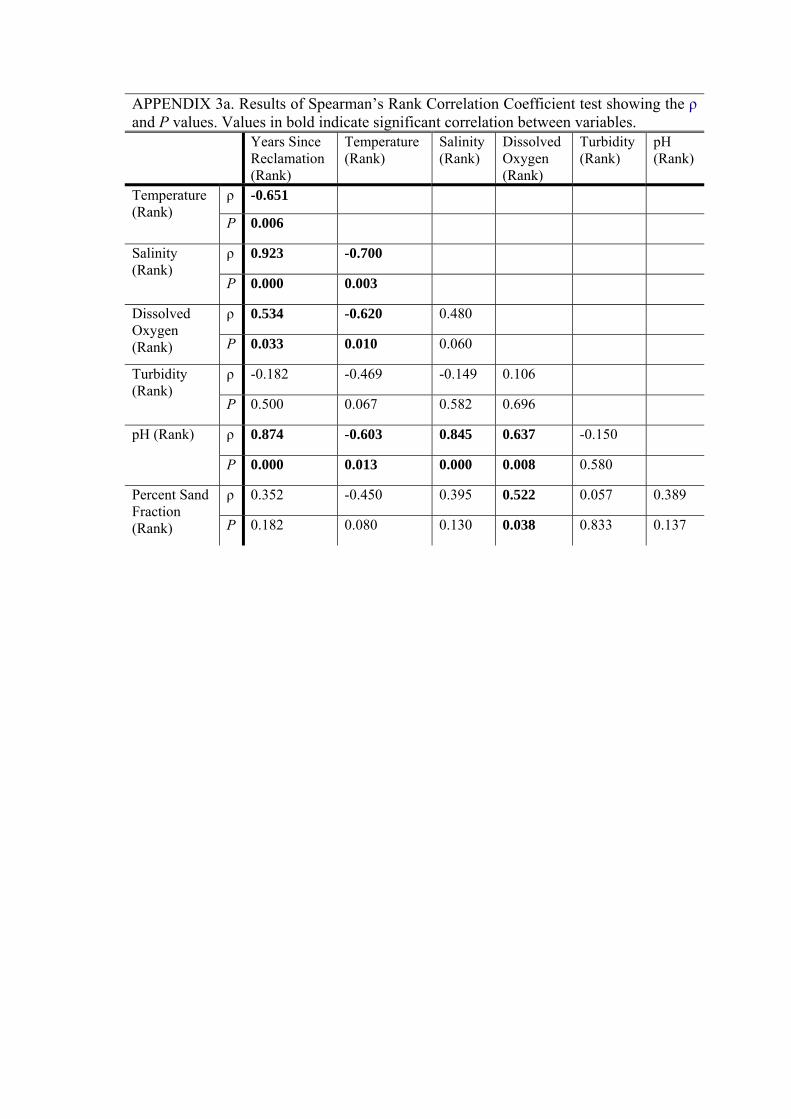
APPENDIX 3a. Results of Spearman’s Rank Correlation Coefficient test showing the ρ and P values. Values in bold indicate significant correlation between variables. Years Since
Reclamation (Rank)
Temperature (Rank)
Salinity (Rank)
Dissolved Oxygen (Rank)
Turbidity (Rank)
pH (Rank)
Temperature (Rank)
ρ -0.651
P 0.006
Salinity (Rank)
ρ 0.923 -0.700
P 0.000 0.003
Dissolved Oxygen (Rank)
ρ 0.534 -0.620 0.480
P 0.033 0.010 0.060
Turbidity (Rank)
ρ -0.182 -0.469 -0.149 0.106
P 0.500 0.067 0.582 0.696
pH (Rank) ρ 0.874 -0.603 0.845 0.637 -0.150
P 0.000 0.013 0.000 0.008 0.580
Percent Sand Fraction (Rank)
ρ 0.352 -0.450 0.395 0.522 0.057 0.389
P 0.182 0.080 0.130 0.038 0.833 0.137
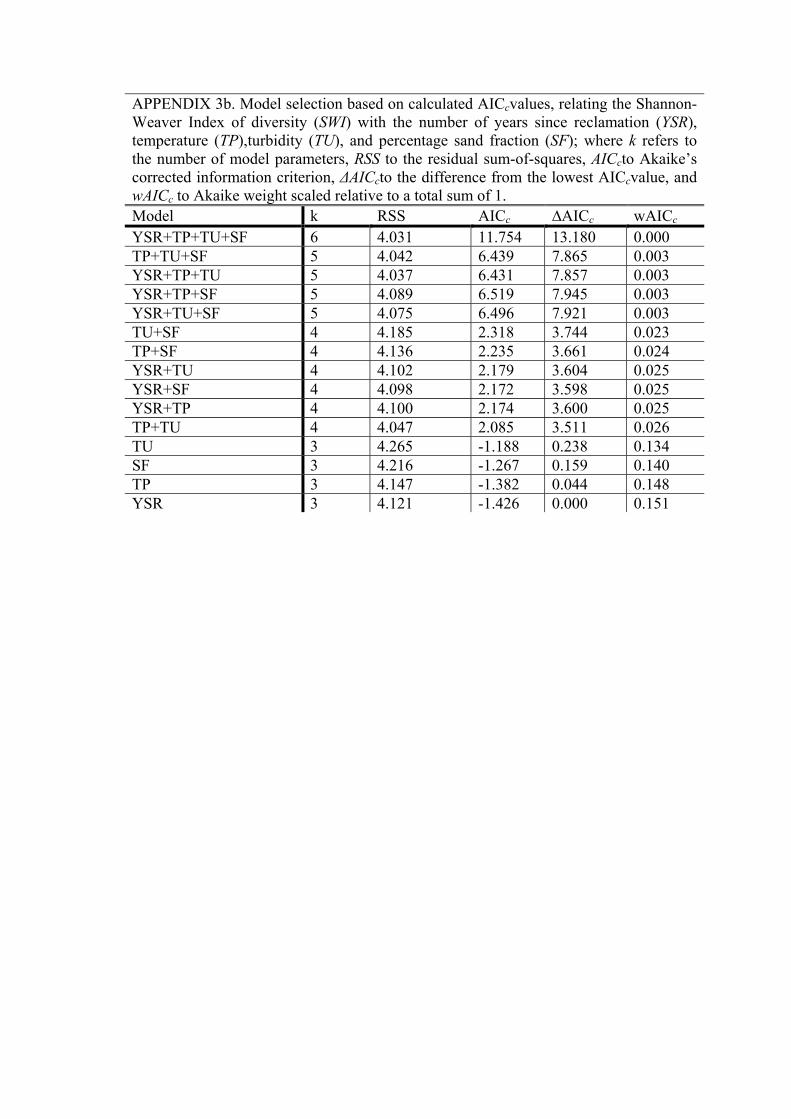
APPENDIX 3b. Model selection based on calculated AICcvalues, relating the Shannon-Weaver Index of diversity (SWI) with the number of years since reclamation (YSR), temperature (TP),turbidity (TU), and percentage sand fraction (SF); where k refers to the number of model parameters, RSS to the residual sum-of-squares, AICcto Akaike’s corrected information criterion, ΔAICcto the difference from the lowest AICcvalue, and wAICc to Akaike weight scaled relative to a total sum of 1. Model k RSS AICc ∆AICc wAICc
YSR+TP+TU+SF 6 4.031 11.754 13.180 0.000 TP+TU+SF 5 4.042 6.439 7.865 0.003 YSR+TP+TU 5 4.037 6.431 7.857 0.003 YSR+TP+SF 5 4.089 6.519 7.945 0.003 YSR+TU+SF 5 4.075 6.496 7.921 0.003 TU+SF 4 4.185 2.318 3.744 0.023 TP+SF 4 4.136 2.235 3.661 0.024 YSR+TU 4 4.102 2.179 3.604 0.025 YSR+SF 4 4.098 2.172 3.598 0.025 YSR+TP 4 4.100 2.174 3.600 0.025 TP+TU 4 4.047 2.085 3.511 0.026 TU 3 4.265 -1.188 0.238 0.134 SF 3 4.216 -1.267 0.159 0.140 TP 3 4.147 -1.382 0.044 0.148 YSR 3 4.121 -1.426 0.000 0.151
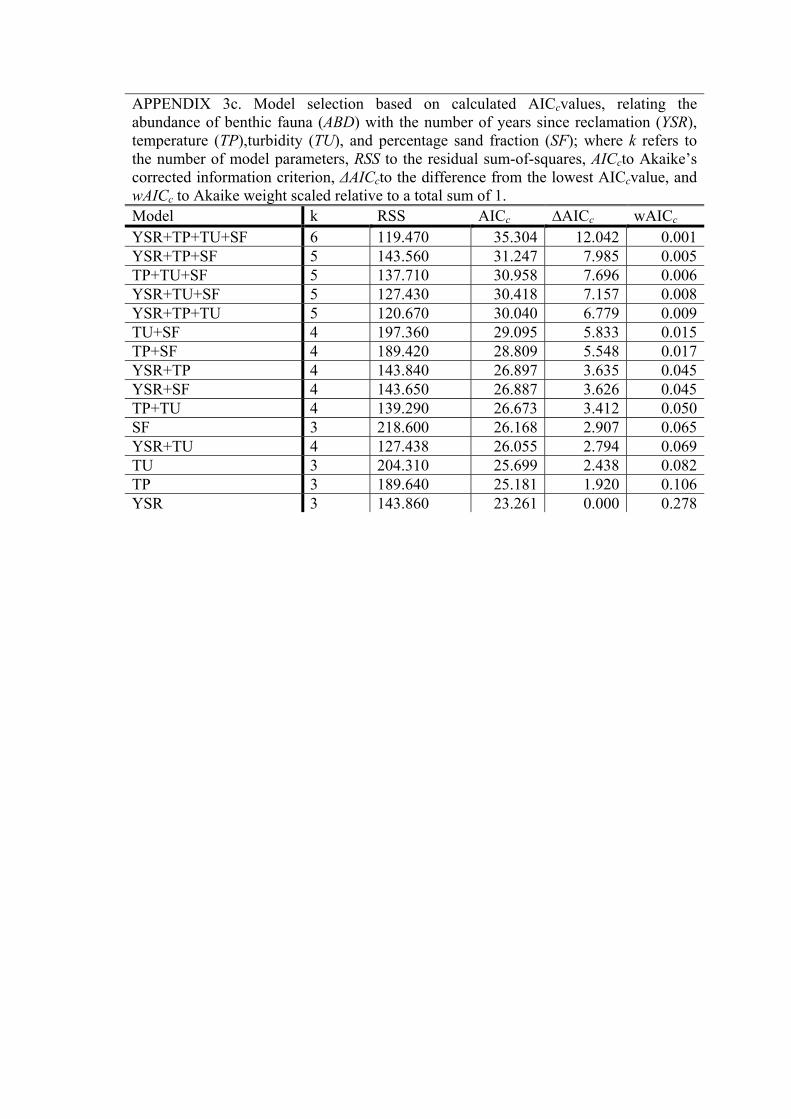
APPENDIX 3c. Model selection based on calculated AICcvalues, relating the abundance of benthic fauna (ABD) with the number of years since reclamation (YSR), temperature (TP),turbidity (TU), and percentage sand fraction (SF); where k refers to the number of model parameters, RSS to the residual sum-of-squares, AICcto Akaike’s corrected information criterion, ΔAICcto the difference from the lowest AICcvalue, and wAICc to Akaike weight scaled relative to a total sum of 1. Model k RSS AICc ∆AICc wAICc
YSR+TP+TU+SF 6 119.470 35.304 12.042 0.001YSR+TP+SF 5 143.560 31.247 7.985 0.005TP+TU+SF 5 137.710 30.958 7.696 0.006YSR+TU+SF 5 127.430 30.418 7.157 0.008YSR+TP+TU 5 120.670 30.040 6.779 0.009TU+SF 4 197.360 29.095 5.833 0.015TP+SF 4 189.420 28.809 5.548 0.017YSR+TP 4 143.840 26.897 3.635 0.045YSR+SF 4 143.650 26.887 3.626 0.045TP+TU 4 139.290 26.673 3.412 0.050SF 3 218.600 26.168 2.907 0.065YSR+TU 4 127.438 26.055 2.794 0.069TU 3 204.310 25.699 2.438 0.082TP 3 189.640 25.181 1.920 0.106YSR 3 143.860 23.261 0.000 0.278
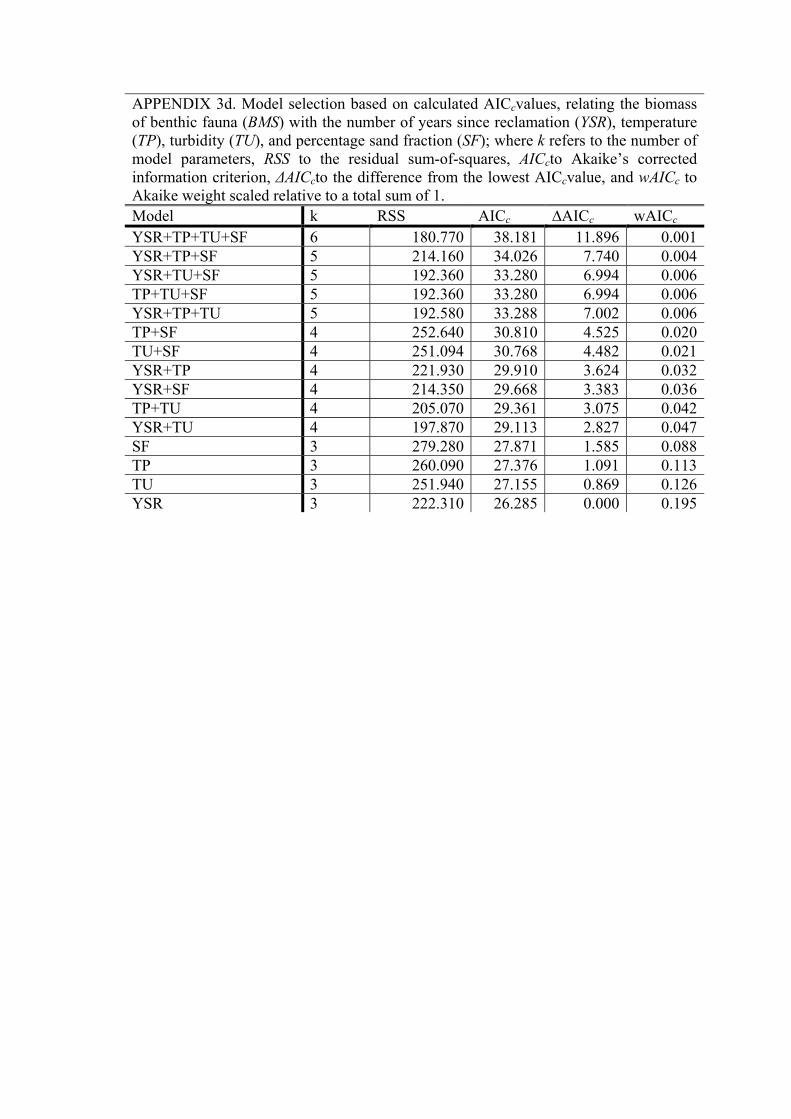
APPENDIX 3d. Model selection based on calculated AICcvalues, relating the biomass of benthic fauna (BMS) with the number of years since reclamation (YSR), temperature (TP), turbidity (TU), and percentage sand fraction (SF); where k refers to the number of model parameters, RSS to the residual sum-of-squares, AICcto Akaike’s corrected information criterion, ΔAICcto the difference from the lowest AICcvalue, and wAICc to Akaike weight scaled relative to a total sum of 1. Model k RSS AICc ∆AICc wAICc
YSR+TP+TU+SF 6 180.770 38.181 11.896 0.001YSR+TP+SF 5 214.160 34.026 7.740 0.004YSR+TU+SF 5 192.360 33.280 6.994 0.006TP+TU+SF 5 192.360 33.280 6.994 0.006YSR+TP+TU 5 192.580 33.288 7.002 0.006TP+SF 4 252.640 30.810 4.525 0.020TU+SF 4 251.094 30.768 4.482 0.021YSR+TP 4 221.930 29.910 3.624 0.032YSR+SF 4 214.350 29.668 3.383 0.036TP+TU 4 205.070 29.361 3.075 0.042YSR+TU 4 197.870 29.113 2.827 0.047SF 3 279.280 27.871 1.585 0.088TP 3 260.090 27.376 1.091 0.113TU 3 251.940 27.155 0.869 0.126YSR 3 222.310 26.285 0.000 0.195


![REGENERATIVE BRAKING SYSTEM IN ELECTRIC VEHICLES · REGENERATIVE BRAKING SYSTEM IN ELECTRIC VEHICLES ... REGENERATIVE BRAKING SYSTEM ... Regenerative action during braking[9]](https://img.pdfslide.net/doc/110x75/5adccef67f8b9a1a088c7cf0/regenerative-braking-system-in-electric-vehicles-braking-system-in-electric-vehicles.jpg)