Embed Size (px)
Citation preview

INVESTIGATING THE RELATIONSHIP BETWEEN
FLUENCY MEASURES AND SECOND LANGUAGE WRITING
PLACEMENT TEST DECISIONS
A SCHOLARLY PAPER SUBMITTED TO THE GRADUATE DIVISION OF
THE UNIVERSITY OF HAWAI`I AT MĀNOA IN PARTIAL FULFILLMENT OF
THE REQUIREMENTS FOR THE DEGREE OF
MASTER OF ARTS
IN SECOND LANGUAGE STUDIES SPECIALIZATION IN L.A.M.P.E.
(LANGUAGE ASSESSMENT, MEASUREMENT, AND PROGRAM EVALUATION)
NOVEMBER 2006
By Saerhim Oh
Scholarly Paper Readers:
Dr. John M. Norris Dr. Lourdes Ortega

2
ACKNOWLEDGEMENTS
I would like to show gratitude to my family who has been always there to support
me and pray for me. Without their encouragement and prayer, I would not have had such
a great experience studying here in the department of Second Language Studies (SLS).
Also, this study would not have been possible without the interest, support, and
encouragement of many people from the SLS department. Above all, I am especially
grateful to my Scholarly Paper readers for their feedback and encouragement towards the
completion of this paper as well as the M.A. degree. Dr. John Norris has trusted me and
guided me throughout the years of my study as my advisor, and has always provided me
with valuable advice. I learned much about Quantitative Research from his SLS 670
class and from his detailed feedback on several versions of this study. Dr. Lourdes
Ortega has always encouraged me and gave me confidence with my study along the way.
She provided valuable comments and supported me, when the earlier version of this study
was presented at the Symposium on Second Language Writing. I gained more interest in
Second Language Writing from listening to her talks and from her SLS 614 course.
I am indebted to the students who wrote the essays analyzed in this study and the
Graduate Assistants in the ELI who rated those writing samples, for providing me with
such valuable data. I am especially thankful to the Director of the ELI, Kenton Harsh, for
always willing to talk to me and help me, whenever I needed his advice and asked for his
assistance in data collection.
I would also like to thank a small grant from the ‘Oihana Maika’i Fund from the
SLS department.

3
I gratefully acknowledge Haejung Cho, Hye-eun Kim, and Yoonah Seong for
assisting me with coding the measures of the data for reliable analyses. Also, I would
like to thank Alexis Biedenfeld from the Manoa Writing Workshop for giving me great
feedback on this paper.
Finally, I am indebted to late Dr. Craig Chaudron, who was the first person for me
to contact and to meet in the department of SLS. He was always willing to give me
answers and advice on any questions and problems I encountered during the years in my
M.A. degree. I am sure he would have congratulated me with a warm smile.

4
ABSTRACT
Fluency has been investigated traditionally in L2 oral production, but the
construct has attracted increasing attention in L2 writing as well (Chenoweth & Hayes,
2001; Polio, 2001). This study investigated the relationship between measures of fluency
and placement decisions in 90 L2 writing samples written for a three-hour placement test.
The purpose of this study is threefold: (a) to find out what patterns, if any, can be
described in the difference between measures of fluency and the placements; (b) to
examine the relationship between six measures used in previous literature as a gauge of
fluency: number of words per essay, number of T-units, number of clauses, number of
words per minute, words per T-unit, and words per clause; and (c) to determine the extent
to which fluency can predict students’ placement into two curricular levels.
The results showed a statistically significant difference between the two
placement levels for most of the fluency measures. Also, based on factor analysis, it was
found that number of words, words per minute, number of T-units, and number of clauses
loaded on one factor, while words per T-unit and words per clause loaded on another
factor, thus contradicting claims by Wolfe-Quintero et al. (1998) that words per T-unit
and words per clause should be considered fluency rather than complexity measures.
Discriminant analyses showed that all six measures together showed the highest
predictability overall. However, for the intermediate level, raw fluency measures were the
best predictors, while the best prediction of placement into the advanced level was a
combination of raw fluency and complexity measure. The implications of these findings
are discussed in terms of the role that fluency may play in a comprehensive theory of L2

5
writing competence and also in terms of recommendations for L2 writing pedagogy and
assessment.

6
INTRODUCTION
Beginning in the late 1970s, “developmental index studies” (Larsen-Freeman,
1978) have attempted to gauge the second language development of learners at certain
proficiency levels using measures of language fluency, accuracy, and complexity. In the
review of these studies in Wolfe-Quintero, Inagaki, and Kim (1998), they were
categorized according to their intended uses for understanding the effects of: program,
feedback, grammar, instruction, planning, audience, topic, and time. However, one
category missing here is the intended use of these measures in placement test decisions.
Accordingly, this study investigated measures in students’ writing on a placement test for
EAP (English for Academic Purposes) contexts. The measures utilized in this study are
the following: number of words (NW), number of T-units (NT), number of clauses (NC),
words per minute (W/M), words per T-unit (W/T), and words per clause (W/C).
Placement tests: A focus on writing Placement tests are used in language programs in order to classify students into
different curricular levels. The nationwide survey results presented in Brown, Hudson,
and Clark (2004) showed that among various skills assessed in foreign language
placement tests across 169 foreign language departments, a large majority of placement
tests focused on traditional discrete skills such as reading, writing, and grammatical
knowledge. Among these skills, writing is especially important for ESL (English as a
Second Language) students in an EAP setting because many classes in U.S. universities
require students to show their work through writing. In the same vein, because it is likely

7
more relevant to EAP curriculum, Clapham (2000) supports the importance of including
essay writing in EAP tests.
Essays written for EAP placement tests are usually assessed via two widely used
types of rating scales: analytic scoring and holistic scoring. As Hamp-Lyons (1991b)
noted, with analytic scales, essays are rated based on several different aspects, while with
holistic scoring, they are assigned a single score based on overall impressions with an
assistance of a rating rubric. Thus, analytic scales provide specific information on the
different features of writing, whereas the single score assigned in holistic scoring does
not help raters or other test users to distinguish various aspects of students’ essays. Also,
although the same holistic score may be assigned to different essays, it may be due to
different reasons; some raters may have paid more attention to certain features of the
writing, while others may have looked for different features. In addition, Weigle (2002)
claimed that analytic scales are more reliable than holistic scales, and this is supported in
Ellis (2005), where Ellis suggested that analytic scales that are designed carefully to
assess second language writing proficiency will be more useful than assessing writings
holistically because linguistic development measures correlated higher with analytic
scales than with holistic scales.
Holistic assessment in placement tests
Although analytic scale ratings may have several advantages, as discussed above,
a primary consideration that should not be neglected is the purpose of the test and how
the ratings are to be used in a given situation (Norris, 2000). For example, Bachman and
Palmer (1996) compared the two rating scales according to six qualities of test usefulness

8
– reliability, construct validity, practicality, impact, authenticity, and interactiveness –
and stated that it is crucial to find the best possible combination of these qualities
considering the situation. Thus, when assessing essays written for a placement test, due
to the fact that a large number of students need to be placed into different levels in a
limited amount of time with limited resources, a holistic scale may be more effective than
an analytic scale (Carlson & Bridgeman, 1986; Cooper, 1977).
Among the six qualities mentioned in Bachman et al. (1996), reliability and
validity are two of the most basic and important concepts in classical test measurement
theory (Cherry & Meyer, 1993; Hamp-Lyons, 1991a; Henning, 1991), applying equally
to analytic or holistic assessment (Charney, 1984; Vaughan, 1991). Reliability in holistic
assessment refers to the consistency of raters’ judgments, while validity is traditionally
defined as “the degree to which a test measures what it claims, or purports, to measure”
(Brown, 1996, p.231). According to classical test theory, reliability is a necessary
condition but not a sufficient one for validity. Thus, in order for holistic assessments to
be valid, they must be both reliable and valid. To be specific, the ratings must be
consistent and they must measure a writer’s “true” ability. If we intend for a test to
measure students’ “true” ability, it should be providing information that leads to
trustworthy and accurate interpretations for the purposes to which they are being put.
However, Cronbach and Messik expanded this simplistic notion that validity is
about measuring true ability. Cronbach (1988) covered five perspectives of validity: the
functional, political, operationist, economic, and explanatory perspectives. The
functional perspective examines the worth of score interpretation rather than the
truthfulness of the interpretation. The political point of view has to do with who makes

9
decisions based on test scores and how. According to the operationist point of view, a
procedure has validity when it collects an adequate direct sample of behavior of a defined
type. The economic perspective deals with the cost of testing, for example, the costs of
extra tuition and time spent due to errors in placement decisions. The explanatory
perspective on test validity is the approach to doing research in order to support the
construct validity and inferences drawn from a set of test scores.
According to Messik (1988), validity is “an overall evaluative judgment, founded
on empirical evidence and theoretical rationales, of the adequacy and appropriateness of
inferences and actions based on test scores” (p. 33). Also, judging whether a test serves
its intended function or purpose requires evaluation of the intended and unintended social
consequences of test interpretation and use.
For writing placement tests in an EAP context, the interpretations made with the
results of the test are generally whether students are placed into the appropriate level and
are receiving the right level of instruction, in order to prepare them for academic writing.
Shifting the focus to reliability, White (1984, 1985) suggested six procedures and
practices that will help maintain high reliability for holistic scorings: (a) all the writings
should be read at the same time and placed with the same working hours and breaks; (b) a
scoring guideline is necessary and it should explicitly describe the criteria to use when
assessing the writings; (c) sample papers should be provided in order to give raters a taste
of the points of the rubrics; (d) a reading leader should be in charge of checking scores
and making sure that the readers continue scoring at the same level; (e) at least two raters
need to assess one essay independently, and if there is a serious difference, it should be

10
read by a third reader; and (f) all the records of the raters ought to be kept, in order to
keep track of the raters.
In Penny, Johnson, and Gordon (2000), rating with augmentation was examined
to see its effect on reliability. When raters felt that the writing represented the description
of the level in the rubric, they would assign that level. However, for instance, if raters
thought that a writing sample was a bit higher than the description of level 4 but not
adequately a 5, they would assign a 4+. Also, if it seemed like the writing was slightly
lower than a 5 but not as low as a 4 or a 4+, it would be assigned a 5-. The result of the
study indicated that the use of rating augmentation could improve the inter-rater
reliability of holistic assessments.
Although holistic scoring may be essential for writing placement tests, it also
presents a key problem. Thus, while the scoring guideline in holistic assessment
indicates what to focus on when assessing writings, and rater training should ensure that
focus, raters may nevertheless focus on different writing elements and have individual
approaches to reading essays because rating is a very subjective matter (Carlson et al.,
1986; Vaughan, 1991). One frequently addressed objection about holistic scoring is that
ratings tend to correlate with characteristics of essays that are irrelevant to “true” writing
ability, and that raters may focus on features of the writing that may not reflect the
interpretations of writing ability that are being made for placement purposes. These
characteristics include, handwriting (Charney, 1984; McColly, 1970), the length of the
writing (Ellis, 2005; Stewart & Grobe, 1979; Vaughan, 1991; Watanabe, 2001), and word
choice (Grobe, 1981; Neilson & Piche, 1981; Nold & Freedman, 1977).

11
One feature among those above, which may play a particularly salient role in
timed EAP writing placement exams, is the length of students’ essays. Although some
previous studies have described it as a superficial characteristic, the length of writing is
considered an indication of fluency in many cases (see next section). In addition, fluency
is one of the components included in many rubrics for holistic and analytic wrting
assessment (Tarone, Downing, Cohen, Gillette, Murie, Dailey, 1993; Wesche, 1987).
Fluency in second language writing
Fluency has been investigated traditionally in second language speaking. In
Lennon (1990), the term fluency in spoken language is distinguished in a broad sense and
a narrow sense. Fluency in the broad sense covers the term for overall oral proficiency.
Being fluent in this case indicates that someone has a high oral proficiency and is at the
highest point of the scales that measure oral proficiency. This is often the way fluency is
interpreted by the public to mean proficient (see also Filmore, 1979). In the narrow sense,
fluency is merely one of the components of oral proficiency among others, such as
“correctness, idiomaticness, relevance, appropriateness, pronunciation, and lexical range”
(Lennon, 1990, p.389). As for this specific term, fluency refers to “native-like rapidity”
(p. 390). A fluent speaker, according to the narrow definition, has the speed of a native
speaker, whereas a less fluent speaker’s speech is slow, stammering, and potentially
confusing.
As for fluency in second language writing, Polio (2001) stated that one way to
define it is to examine how native-like the writing “sounds”. The other way is to look at
the amount of production in a writing sample, following the Wolfe-Quintero et al. (1998)
12
definition of fluency as “a measure of the sheer number of words or structural units a
writer is able to include in their writing within a particular period of time” (p.14).
Fluency has also been defined in terms of rating scale criteria. Tarone et al. (1993) used
a holistic scale to compare Southeast Asian-American immigrant children’s English
writing skills according to their level, also with international students, and native
speaking undergraduate students. In their holistic scale, fluency is referred to as
“nativeness, standardness, length, ease of reading, and idomaticity” (p.170). This kind of
holistic scale is an example of the first way of defining fluency. In contrast, in the second
sense, in order to see the amount of production, we count the length of writing in terms of
total number of words, clauses1 or T-units2 produced by a writer (Polio, 2001).
A number of studies have applied such direct measurement of fluency in L2
writing. For example, Larsen-Freeman (1978) looked at the average number of words
per composition of EFL students. She found that there is an increase in the number of
words per composition as proficiency level goes up. She stated that this may be because
of students’ fluency, their expressiveness, or their increased self-confidence. However,
the length of the composition dropped for the group with the highest proficiency. Larsen-
Freeman explained that this was because the measures dependent on length are less
discriminatory at the upper levels of proficiency than the lower. This finding is
supported in Watanabe (2001), where the correlation between essay length and the
holistic rating was higher when the length was extremely short, fewer than 140 words.
1 A clause is a group of words which form a grammatical unit and which contain a subject and a finite verb, and it forms a sentence or part of a sentence often functioning as a noun, adjective, or adverb (Richards & Schmidt, 2002). 2 A T-unit is the shortest unit which a sentence can be reduced to, and consists of one independent clause together with whatever dependent clauses are attached to it (Richards & Schmidt, 2002).

13
However, the relationship between the two variables was moderate when the length was
longer than 200 words.
Wolfe-Quintero et al. (1998), however, claimed that frequency measures, such as
the number of words mentioned above, are not valid measures of fluency. Instead, they
suggested that fluency ratios, such as words per minute, words per clause, words per
sentence, and words per T-unit, are better measures. In their review, especially words per
clause, words per T-unit, and error-free T-unit length were found as the best three ratio
measures of fluency. These three measures had a strong relationship with “the
proficiency level across studies, regardless of task, target language, significance of the
results or how proficiency was defined” (p. 29).
In contrast to Wolfe-Quintero et al.’s view, Polio (2001) questioned the
relationship between how quickly writers can write (words per minute) and the quality of
writing. She stated that there might not be a relationship between them at all, or that it
could even be negative. In addition, the number of words per T-unit and the number of
words per clause have been interpreted to be measures of syntactic complexity (Henry,
1996; Ortega, 2003). In the 27 studies included in Ortega’s research synthesis, these
measures, along with the mean number of clauses per T-unit, were the three most
frequently used syntactic complexity measures. Ortega also offers critical magnitudes for
between-proficiency differences in syntactic complexity for these measures. For number
of words per T-unit, at least a difference of 1.8 words, for words per clause, a difference
of 1.1 words were found to make the difference between levels statistically significant.
Based on competing notions of fluency in the L2 writing literature, the six
measures of fluency in this study were selected in order to capture as broad a perspective
14
as possible. To restate, they are number of words (NW), number of T-units (NT),
number of clauses (NC), words per minute (W/M), words per T-unit (W/T), and words
per clause (W/C). These six can be categorized as raw frequency measures (NW, NT,
and NC) and ratio measures (W/M, W/T, W/C), as in Wolfe-Quintero et al. According to
their report, ratio measures are better measures of fluency, and it will be interesting to see
how these two categories differ in relation to students’ essays on placement tests in this
current study.
In this study, then, fluency was examined in writing samples assigned to two
different placement levels, specifically aiming to shed further light on the relationship
between measures of fluency and levels of proficiency, as revealed in an EAP writing
assessment. This relationship is especially important in this placement setting where the
distinction of fluency between the two levels noted in the scoring rubric is very vague
(see Method section for more detail). Hence, this study will assist to better understand
the actual fluency differences and to broaden our conceptualization of this important
feature in L2 writing.
Research Questions
The research questions addressed in this study are the following:
1) What, if any, differences are there between placement levels on each of the six L2
fluency measures?
2) What is the relationship among the six measures, if any?
3) How much of the placement decision can be predicted by the six measures?

15
METHOD
Placement Test
The placement test that is investigated in this study is the Mānoa Writing
Placement Test, as administered in the beginning of the Fall semester in 2005 and Spring
semester in 2006. It is a three-hour test and there are two prompts from which students
can select. The two prompts given to students in the Fall administration are labeled as
Prompt 1 and 2, and the two given to test takers in the Spring are labeled as Prompt 3 and
4 throughout this study.
The directions in the writing prompts ask the test takers to agree or disagree with
the passage and write an essay describing and defending their positions with support.
The three-hour testing period includes time to read the passage and write their essays.
Students are given separate sheets of paper to write drafts and their final work, and they
may leave the room when they are finished writing. When test takers leave the room, all
the papers on which they write are collected and stapled with the first page, which has the
information of the student, the directions, and the passage. The administrators check the
time when students leave the testing room and make a note on the first page.
Writing Samples and Placement Decisions
All undergraduate students entering University of Hawai`i at Mānoa take this
Mānoa Writing Placement Test administered by the Mānoa Writing Program. Among
them, a good portion are international and immigrant students whose mother tongue is
not English. The essays written by these international students are rated by the English

16
Language Institute (ELI), whereas those written by students who speak English as their
first language are rated by the English department.
In the ELI, there are three levels of decisions when assessing these essays;
students can be placed into one of two courses (ELI 73 and ELI 100) taught in the ELI, or
they can get exempted from the ELI and placed into ENG 100, offered by the English
department. This study focuses on the essays of students placed into ELI 73, the
intermediate proficiency writing class, and ELI 100, the advanced proficiency writing
class.
The data for this study are 90 writing samples written for the placement test in
order to get placed into these two undergraduate writing courses in the ELI. These
samples were obtained with the approval of the ELI. The number of samples for each
prompt and placement decision level is displayed in Table 1.
Table 1.
Number of writing samples for each prompt and level
Prompt 1 Prompt 2 Prompt 3 Prompt 4 Total
ELI 73 11 12 4 15 42
ELI 100 20 12 8 8 48
Total 31 24 12 23 90

17
In the ELI, essays are rated holistically according to the Hallmark (see Appendix
A) developed by graduate teaching assistants in Fall 2002. The Hallmarks are used as a
guideline to help the raters’ judgments. They are divided into the categories of Content,
Organization, Vocabulary, Grammar, and Fluency. Though the Hallmark describes these
different categories, raters are encouraged to make the decision about course placement
with the overall quality of the paper in mind.
According to the Hallmark, writing samples are assigned to the ELI 73 level when
the writers “need to develop L2 proficiency; [have] notable unfamiliarity with and
general lack of control of academic writing; would benefit from at least two semesters of
ELI writing instruction” (Writing Hallmark, 2002, see Appendix A). However, students
that are placed into ELI 100 are those that “show some knowledge and control of
academic writing; need to develop L2 proficiency, writing ability, awareness of
genres/conventions common in U.S. universities; will benefit from ELI rather than
English department instructions”.
Compared to these overall descriptions of the two levels, the description of
fluency in the two levels in the Hallmark is rather vague and not very distinguishable.
Fluency is described as the “Amount of writing is suitable for level of analysis and/or
amount of time provided to write the paper” for essays rated at the level of ELI 100,
whereas “Amount of writing is unsuitable for level of analysis and/or amount of time
provided to write paper” for essays rated to be in ELI 73.
Raters who assess the writing samples are graduate students who are instructors in
the ELI. They teach Reading, Listening and Speaking, and/or Writing and have different
amounts of experience in teaching and in rating assessment papers. They use the

18
Hallmark as a guide, and at the beginning of the training session, they are shown sample
essays that were rated in the previous semesters. Each writing sample is read by three
different raters, not necessarily by the same three raters. These different raters read each
writing samples and decide the placement of the student. When there is a disagreement
on the placement, raters discuss the reasons why they think the students should be placed
in that certain level. If the three cannot agree on a level, a fourth reader reads the sample
and gives another opinion on it. In addition, there is a leader responsible for checking the
agreement of all the readers and he or she keeps a record of the decisions made by the
three raters.
Though it is not required, raters often put a plus (+) or a minus (-) sign after the
level when they think that the writing seems to be a little more advanced or less advanced
than the given description of the levels. Given these careful procedures, and based on the
views of reliability of Homburg (1984), Penny et al. (2000) and White (1984), the holistic
assessment of the placement test has the potential to maintain sufficient scoring reliability.
In fact, overall there was an agreement of .77 among the three raters who rated each
writing sample. The agreement ratio was calculated instead of inter-rater reliability
because each writing sample was rated by three raters randomly selected from a total of
16 raters.

19
Participants
The students who wrote the 90 writing samples were new incoming international
or immigrant undergraduate students who were admitted to university programs of study
and who did not speak English as their native language. The TOEFL (Test of English as
a Foreign Language) scores for these students fell in the range of 500 (173 on the CBT)
to 600 (250 on the CBT). This proficiency range is relatively narrow and thus, has a
potential for lack of difference between levels.
Procedures
The researcher measured six features in the 90 writing samples that were rated
according to the process described above: number of words, number of T-units, number
of clauses, words per minute, words per T-unit, and words per clause. Since the Mānoa
Writing Placement Test is a paper based test, all 90 writing samples were first typed into
a word document for further analyses.
Number of words per essay was easily calculated using the word counting tool in
Microsoft Word. With the starting and ending time written in the students’ record, the
words-per-minute measure was calculated for each writing sample. However, there were
three essays that did not have the time record, thus the N size for this measure was 87
instead of 90. To ensure reliability, additional coders assisted in analyzing the four
measures related to T-unit and clause. After the researcher coded the 90 writing samples,
these three coders, each analyzed 30 samples (for examples of the coding of T-units and
clauses, see Appendix B).

20
The agreements between the researcher and the coders on the T-unit and the
clause analyses were .97 and .99, .96 and .99, and .97 and .98, respectively for each coder.
The disagreements between the researcher and the coders were discussed with the three
coders and reached 100% agreement.
Analyses
Before any descriptive or inferential analyses were conducted, there was an
attempt to figure out whether outliers existed for each measure. Thus a Stem-and-Leaf
plot using Statistical Package for the Social Science (SPSS, v. 11.5) was analyzed for
each measure in both placement levels. The descriptive statistics were then calculated
with the original data and without the outliers. Once the outliers were detected and
eliminated, all the inferential statistics were based on cases with no missing values for
any variable used, and the overall alpha decision level for all the statistical analyses was
set at p < 0.05.
Research Question 1. What, if any, differences are there between placement
levels on each of the six L2 fluency measures? In response to Research Question 1,
descriptive statistics were compared and a one-way two-group multivariate analysis of
variance (MANOVA) was conducted using SPSS. The independent variable was the
level (ELI 73 and ELI 100) and the dependent variables were the six measures (NW, NT,
NC, W/M, W/T, W/C) for this analysis. In addition, the 95% confidence interval
boundaries were displayed in bar graphs using Microsoft Excel.

21
Research Question 2. What is the relationship among the six measures, if any?
Pearson-coefficient correlation and Factor analysis were conducted via SPSS for the six
measures, in order to understand the relationship among these six measures, which is
addressed in Research Question 2.
Research Question 3. How much of the placement decision can be predicted by
the six measures? In order to answer the last Research Question and interpret how much
different measures were able to predict membership in the two levels, discriminant
analyses were conducted, also using SPSS. Discriminant analysis is mathematically
equivalent to one-way MANOVA, but shifts the perspective to present an estimate of the
degree to which variables function as predictors with respect to group membership. Here,
the predictor variables were the six measures, and the grouping variable was placement
level.
RESULTS
This section presents the results, in the following order: (a) descriptive statistics
and outliers for the six measures: NW, NT, NC, W/M, W/T, W/C; (b) MANOVA results
and 95% CI (Confidence Interval) boundaries; (c) Pearson-coefficient correlation and
factor analyses results; and (d) results of discriminant analyses.
Descriptive statistics and outliers for the six measures

22
Number of Words (NW). The frequency distributions of number of words (NW)
in essays placed into Level 73 and 100 are plotted in Figures 1 and 2, respectively.3 The
frequency distributions range from 2 SD (standard deviation) below the mean to 4 SD
above the mean for Level 73, and 2 SD below the mean to 5 SD above the mean for
Level 100. The large ranges of the SD units are due to the outliers in each distribution, as
can be recognized in both figures. The skewness values are 1.40 for Level 73 and 2.04
for Level 100, and the kurtosis values are 2.73 and 7.18, respectively; both distributions
are positively skewed and not normally distributed.
0
1
2
3
4
5
6
7
8
9
10
11
12
13
14
15
0 100 200 300 400 500 600 700 800 900 1000 1100 1200 1300 1400 1500 1600
Number of Words for 73
Fre
qu
ency
Figure 1. Frequency distribution of number of words (NW) in essays in Level 73
3 The frequency distributions in this study are shown in units of 1, 10 or 100 according to the range of the measures: 1 for W/M, W/T, and W/C, 10 for NT and NC, and 100 for NW.
Number of Words
Num
ber
of S
tude
nts

23
0
1
2
3
4
5
6
7
8
9
10
11
12
13
14
15
0 100 200 300 400 500 600 700 800 900 1000 1100 1200 1300 1400 1500 1600
Number of words for 100
Fre
qu
ency
Figure 2. Frequency distribution of number of words (NW) in essays in Level 100
The Stem-and-Leaf plots in Figures 3 and 4 point out two extreme values in each
level, which can be interpreted as outliers. The two extremes are the two highest values
in each level. As noted earlier, for more accurate analysis of the findings, these outliers
are eliminated from inferential comparisons (Tabachnick & Fidell, 2000). With these
four extreme values deleted, the skewness values of the distribution for ELI 73 and ELI
100 are .31 and .50, and the kurtosis values are -.50 and .30, making the distribution quite
normal.
Frequency Stem & Leaf
1.00 2 . 3 1.00 2 . 5 9.00 3 . 001113334 8.00 3 . 56666777 6.00 4 . 011223 6.00 4 . 566789 5.00 5 . 01112 2.00 5 . 88 2.00 6 . 00 2.00 Extremes (>=829) Stem width: 100 Each leaf: 1 case(s)
Figure 3. Stem-and-Leaf plot for number of words (NW) in essays placed in Level 73
Num
ber
of S
tude
nts
Number of Words

24
Frequency Stem & Leaf 1.00 3 . 3
6.00 3 . 556779 6.00 4 . 001134 6.00 4 . 567899 15.00 5 . 000012233334444 2.00 5 . 56 5.00 6 . 00124 2.00 6 . 67 2.00 7 . 00 1.00 7 . 9 2.00 Extremes (>=838) Stem width: 100 Each leaf: 1 case(s)
Figure 4. Stem-and-Leaf plot for number of words (NW) in essays placed in Level 100
Tables 2 and 3 show the descriptive statistics with and without outliers for the
NW measure in each level, specified according to the prompts. These two tables show
that the outliers deleted one from Prompt 3 and from Prompt 4 for both levels. Also, as
could be predicted, with the two highest extremes deleted from each level, the descriptive
statistics in Table 3 show a lower mean with a smaller variation. The writing samples
rated at the ELI 100 level are consistently longer than those at the ELI 73 level, with and
without the outliers: the difference of the mean number of words in essays written by
students placed in ELI 73 and ELI 100 is 97.52 (533.88 - 436.36) with the outliers, and
96.00 (513.02 – 416.03) without the outliers. The N size for prompt one and two are
similar and relatively larger than that for prompts three and four. This is because the first
two prompts were administered in the Fall semester, whereas the latter two were
administered in the Spring semester, and more students take the placement test in the Fall

25
semester. Due to the small N size, prompt three especially shows a large standard
deviation.
Table 2.
Descriptive statistics for number of words (NW) in writing samples with outliers
ELI 73 ELI 100 Statistic Prompt
1 Prompt
2 Prompt
3 Prompt
4 Total Prompt
1 Prompt
2 Prompt
3 Prompt
4 Total
N 11 12 4 15 42 20 12 8 8 48 Mean 435.91 412.58 489.50 441.53 436.36 512.45 526.75 598.38 533.63 533.88 Median 420 394 437.50 412 412 517 542 500.50 412 517 Mode N/A N/A N/A N/A 516 N/A 703 N/A N/A 549 SD 87.88 90.99 250.63 153.51 131.15 81.89 140.01 274.62 130.54 148.28 Max 606 583 829 857 857 664 703 1189 857 1189 Min 313 307 254 235 235
332 353 372 411 332
Table 3.
Descriptive statistics for number of words (NW) in writing samples without outliers
ELI 73 ELI 100 Statistic Prompt
1 Prompt
2 Prompt
3 Prompt
4 Total Prompt
1 Prompt
2 Prompt
3 Prompt
4 Total
N 11 12 3 14 40 20 12 7 7 46 Mean 435.91 412.58 376.33 411.86 416.03 512.45 526.75 514 490.14 513.02 Median 420 394 359 393.50 410.50 517 542 494 484 510 Mode N/A N/A N/A N/A 516 521 N/A N/A N/A 549 SD 87.88 90.99 131.86 105.61 95.75 81.89 140.01 146.77 47.26 104.53 Max 606 583 516 605 606 664 703 797 541 797 Min 313 307 254 235 235
332 353 372 411 332
In a nutshell, there were two outliers for each level for the measure of number of
words. Once these were removed, the distributions looked quite normal, and there are
clear differences between Levels 73 and 100 in terms of number of words.

26
Number of T-units (NT). Figures 5 and 6 show the frequency distribution for
number of T-units (NT) at each level. Interestingly, the two graphs look very similar in
shape; the skewness value for both levels is 1.09, with the kurtosis values of 2.54 and
1.18 for level 73 and 100, in that order.
0
12
3
4
56
7
8
910
11
12
1314
15
16
0 10 20 30 40 50 60 70 80 90 100
Number of T-units for 73
Fre
qu
ency
Figure 5. Frequency distribution of number of T-units (NT) in essays placed in Level 73
0
1
2
3
4
5
6
7
8
9
10
11
12
13
14
15
16
0 10 20 30 40 50 60 70 80 90 100
Number of T-units for 100
Fre
qu
ency
Figure 6. Frequency distribution of number of T-units (NT) in essays placed in Level
100
Number of T-units
Number of T-units
Num
ber
of S
tude
nts
Num
ber
of S
tude
nts

27
Both levels had one extreme value each as Figures 7 and 8 show, and both of
them were detected in Prompt 3 as the two descriptive statistics in Tables 4 and 5 present.
With these two extreme values deleted, the skewness values for Levels 73 and 100
are .27 and .72, and the kurtosis values are -.44 and .27, which makes the distributions
more normal compared to those with the outliers included.
Frequency Stem & Leaf 1.00 1 . 4 1.00 1 . 9 6.00 2 . 012334 10.00 2 . 6666679999 11.00 3 . 00111223344 4.00 3 . 5588 5.00 4 . 01144 3.00 4 . 677 1.00 Extremes (>=66) Stem width: 10 Each leaf: 1 case(s)
Figure 7. Stem-and Leaf plot for number T-units (NT) in essays placed in Level 73
Frequency Stem & Leaf
1.00 1 . 9 5.00 2 . 11244 12.00 2 . 556667777888 7.00 3 . 0112234 6.00 3 . 778999 8.00 4 . 00112334 3.00 4 . 567 1.00 5 . 3 2.00 5 . 99 2.00 6 . 01 1.00 Extremes (>=76) Stem width: 10 Each leaf: 1 case(s)
Figure 8. Stem-and Leaf plot for number T-units (NT) in essays placed in Level 100

28
Table 4.
Descriptive statistics for number of T-units (NT) in writing samples with outliers
ELI 73 ELI 100 Statistic Prompt
1 Prompt
2 Prompt
3 Prompt
4 Total Prompt
1 Prompt
2 Prompt
3 Prompt
4 Total
N 11 12 4 15 42 20 12 8 8 48 Mean 30.09 32.67 36 32.33 32.19 34.20 39.08 37.63 36.13 36.31 Median 30 31 32 33 31 33.50 37.50 27 34.50 33.50 Mode 26 31 N/A 26 26 21 25 N/A N/A 27 SD 6.52 9.35 21.86 7.65 9.56 7.28 13.43 20.78 11.72 12.35 Max 41 47 66 46 66 44 61 76 59 76 Min 19 21 14 20 14
21 25 19 24 19
Table 5.
Descriptive statistics for number of T-units (NT) in writing samples without outliers
ELI 73 ELI 100 Statistic Prompt
1 Prompt
2 Prompt
3 Prompt
4 Total Prompt
1 Prompt
2 Prompt
3 Prompt
4 Total
N 11 12 3 15 41 20 12 7 8 47 Mean 30.09 32.67 26 32.33 31.37 34.20 39.08 32.14 36.13 35.47 Median 30 31 29 33 31 33.50 37.50 26 34.50 33 Mode 26 31 N/A 26 26 21.00 25.00 N/A N/A 27 SD 6.52 9.35 10.82 7.65 8.03 7.28 13.43 14.94 11.72 11 Max 41 47 35 46 47 44 61 59 59 61 Min 19 21 14 20 14
21 25 19 24 19
Table 5 shows a difference of 4.10 in numbers of T-units (35.47 – 31.37) between
the two levels. Also, interestingly, the difference of the minimum (Min) number of T-
units among each prompt in both levels is smaller than the difference of the maximum
(Max) number of T-units among each prompt in both levels, and the difference of Min for
Level 73 and Level 100 in total (14 and 19) is also smaller than that of Max (47 and 61)
for the two levels.

29
Number of clauses (NC). The frequency distributions of the NC measure for
both levels are presented in Figures 9 and 10. Also two outliers from Level 73 and one
from Level 100 were detected and eliminated as shown in Figures 11 and 12. The
skewness values for the two distributions in Figure 9 and 10 are 1.36 and 1.91, and the
kurtosis values are 2.67 and 6.53. With the extreme values deleted based on the Stem-
and-Leaf plot, the skewness values decrease to .38 and .72, and the kurtosis values
change to .22 and -.39, for Level 73 and Level 100, respectively, making the distributions
more normal.
0
1
2
3
4
5
6
7
8
9
10
11
12
0 10 20 30 40 50 60 70 80 90 100 110 120 130 140 150 160 170 180 190 200
Number of clasues for 73
Fre
qu
ency
Figure 9. Frequency distribution of number clauses (NC) in essays placed in Level 73
0
1
2
3
4
5
6
7
8
9
10
11
0 10 20 30 40 50 60 70 80 90 100 110 120 130 140 150 160 170 180 190 200
Number of clause for 100
Frequency
Figure 10. Frequency distribution of number clauses (NC) in essays placed in Level 100
Num
ber
of S
tude
nts
Num
ber
of S
tude
nts
Number of clauses
Number of clauses

30
Frequency Stem & Leaf 1.00 2 . 6 8.00 3 . 15666899 15.00 4 . 001455566668899 8.00 5 . 00113458 6.00 6 . 001267 2.00 7 . 02 2.00 Extremes (>=92) Stem width: 10 Each leaf: 1 case(s)
Figure 11. Stem-and-Leaf plot for number of clauses (NC) in essays placed in Level 73
Frequency Stem & Leaf
1.00 2 . 9 4.00 3 . 5788 11.00 4 . 01113468999 11.00 5 . 00123445678 11.00 6 . 02334456889 4.00 7 . 1377 4.00 8 . 3489 1.00 9 . 7 1.00 Extremes (>=148) Stem width: 10 Each leaf: 1 case(s)
Figure 12. Stem-and-Leaf plot for number of clauses (NC) in essays placed in Level 100
As the descriptive statistics show in Tables 6 and 7, the difference in the number
of clauses between the levels is around 9 words: 8.95 (59.52 – 50.57) with the outliers
and 9.29 (57.64 – 48.35) without the outliers. In Table 7, the range of the mean number
of clauses is larger for the 100 level (54.14 to 63.92) compared to the 73 level (46.33 to
50.83).

31
Table 6.
Descriptive statistics for number of clauses (NC) in writing samples with outliers
ELI 73 ELI 100 Statistic Prompt
1 Prompt
2 Prompt
3 Prompt
4 Total Prompt
1 Prompt
2 Prompt
3 Prompt
4 Total
N 11 12 4 15 42 20 12 8 8 48 Mean 46.09 50.83 57.75 51.73 50.57 55.65 63.92 65.88 56.25 59.52 Median 45 48.50 54 50 48 59 58 52.50 53 55.50 Mode 45 N/A N/A N/A 46 N/A N/A N/A N/A 49 SD 8.04 9.20 29.24 17.06 14.54 12.23 20.78 37.05 13.19 20.29 Max 62 67 92 98 98 71 97 148 84 148 Min 35 36 31 26 26
29 38 37 41 29
Table 7.
Descriptive statistics for number of clauses (NC) in writing samples without outliers
ELI 73 ELI 100 Statistic Prompt
1 Prompt
2 Prompt
3 Prompt
4 Total Prompt
1 Prompt
2 Prompt
3 Prompt
4 Total
N 11 12 3 14 40 20 12 7 8 47 Mean 46.09 50.83 46.33 48.43 48.35 55.65 63.92 54.14 56.25 57.64 Median 45 48.50 36 48 47 59 58 48 53 55 Mode 45 N/A N/A N/A 46 N/A N/A N/A N/A 49 SD 8.04 9.20 22.37 11.71 10.75 12.23 20.78 17.80 13.19 15.72 Max 62 67 72 70 72 71 97 83 84 97 Min 35 36 31 26 26
29 38 37 41 29
Words per minute (W/M). This measure was calculated by dividing the number
of words by the amount of time students spent on the placement test. Wolfe-Quintero et
al. (1998) advocate using ratio measures because they are more precise than merely using
the frequency measures when you do not know how much the given time was. However,
for this study, it is inaccurate to say that the given time is the solely spent to write the
essay, because this time includes the amount of time spent to read the prompt, write
drafts and the essay and also revise. Also, for this research, it turned out that the time
spent with the essay does not correlate with the amount they wrote (r NW, Time = 0.17, p
= .118).

32
0
12
3
4
56
7
8
910
11
12
1314
15
16
0 1 2 3 4 5 6 7 8 9 10 11 12 13 14
W/T for 73
Fre
qu
ency
Figure 13. Frequency distribution of number of words per minute (W/M) in essays placed
in Level 73
0
1
2
3
4
5
6
7
8
9
10
11
12
13
14
15
0 1 2 3 4 5 6 7 8 9 10 11 12 13 14
W/T for 100
Fre
qu
ency
Figure 14. Frequency distribution of number of words per minute (W/M) in essays placed
in Level 100
The frequency distributions for number of words produced per minute is shown in
Figures 13 and 14. The distributions range from 2 SD below the mean, and 4SD and 5SD
above the mean, with one outlier detected in Level 73 and two outliers detected in Level
100, as shown in Figures 15 and 16. The skewness values changed from 1.03 to -.76 for
Level 73 and 2.69 to .53 for Level 100, and the kurtosis values decreased from 1.54 to .94
Words per minute
Words per minute
Num
ber
of S
tude
nts
Num
ber
of S
tude
nts

33
for Level 73 and 10.88 to -.22 for Level 100. As in the other measures discussed above,
the distribution is relatively normal once outliers were removed.
Frequency Stem & Leaf 4.00 1 . 5778 8.00 2 . 00112234 10.00 2 . 5556678889 10.00 3 . 0001223344 1.00 3 . 9 4.00 4 . 0234 1.00 4 . 5 1.00 Extremes (>=5.9) Stem width: 1.000000
Each leaf: 1 case(s)
Figure 15. Stem-and-Leaf plot for number of words per minute (W/M) in essays placed
in Level 73
Frequency Stem & Leaf
1.00 1 . 9 6.00 2 . 111223 6.00 2 . 677778 15.00 3 . 011111122344444 5.00 3 . 56889 5.00 4 . 23334 2.00 4 . 67 3.00 5 . 014 2.00 5 . 77 1.00 6 . 4 2.00 Extremes (>=7.1) Stem width: 1.000000 Each leaf: 1 case(s)
Figure 16. Stem-and-Leaf plot for number of words per minute (W/M) in essays placed
in Level 100

34
Tables 8 and 9 display the descriptive statistics for the W/M measure. There were
three essays from level 73, one each from Prompt 1, 2, and 3, that did not have the time
indicated, thus, the N size for this measure is different from the other five measures. As
with NW, all three outliers were detected from Prompt 3 and 4. As the means for each
prompt and the means in the Total column show in Table 9, the difference between the
two levels on this measure is not so obvious.
Table 8. Descriptive statistics for number of words per minute (W/M) in writing samples with
outliers
ELI 73 ELI 100 Statistic Prompt
1 Prompt
2 Prompt
3 Prompt
4 Total Prompt 1
Prompt 2
Prompt 3
Prompt 4 Total
N 10 11 3 15 39 20 12 8 8 48 Mean 3.03 2.78 2.31 3.20 2.97 3.84 3.55 4.09 3.90 3.82 Median 2.90 2.83 2.03 3 2.85 3.18 3.38 3.49 3.70 3.42 Mode N/A N/A N/A N/A N/A N/A N/A N/A N/A N/A SD 0.75 0.69 0.50 1.15 0.91 2.07 1.14 1.85 1.12 1.66 Max 4.54 4.03 2.88 5.90 5.90 11.86 5.49 7.06 5.70 11.86 Min 2.16 1.80 2.02 1.58 1.58
1.95 2.12 2.14 2.31 1.95
Table 9. Descriptive statistics for number of words per minute (W/M) in writing samples without
outliers
ELI 73 ELI 100 Statistic Prompt
1 Prompt
2 Prompt
3 Prompt
4 Total Prompt
1 Prompt
2 Prompt
3 Prompt
4 Total
N 10 11 3 14 38 19 12 7 8 46 Mean 3.03 2.78 2.31 3 2.89 3.42 3.55 3.66 3.90 3.57 Median 2.90 2.83 2.03 2.89 2.84 3.18 3.38 3.48 3.70 3.37 Mode N/A N/A N/A N/A N/A N/A N/A N/A N/A N/A SD 0.75 0.69 0.50 0.91 0.78 0.88 1.14 1.51 1.12 1.07 Max 4.54 4.03 2.88 4.42 4.54 5.77 5.49 6.46 5.70 6.46 Min 2.16 1.80 2.02 1.58 1.58
1.95 2.12 2.14 2.31 1.95

35
Number of words per T-unit (W/T). The frequency distributions for number of
words per T-unit (W/T) at each placement level are shown in Figures 17 and 18. The
skewness values for Levels 73 and 100 are .59 and .73, respectively. Thus, the
distributions of W/T are moderately positively skewed. Also, the distribution at Level
100 is flatter than that at 73 (kurtosis value = - .62 for 73 and .39 for 100). In addition,
W/T measure has the smallest range of SD among the six measures, ranging from 2SD
below the mean to 3SD above the mean for both levels.
0
1
2
3
4
5
6
7
8
9
10
11
12
0 1 2 3 4 5 6 7 8 9 10 11 12 13 14 15 16 17 18 19 20 21 22 23 24 25 26 27 28 29 30
Number of words per T-unit for 73
Fre
qu
ency
Figure 17. Frequency distribution of number of words per T-unit (W/T) in Level 73
Words per T-unit
Num
ber
of S
tude
nts

36
0
1
2
3
4
5
6
7
8
9
10
11
12
0 1 2 3 4 5 6 7 8 9 10 11 12 13 14 15 16 17 18 19 20 21 22 23 24 25 26 27 28 29 30
Number of words per T-unit for 100
Fre
qu
ency
Figure 18. Frequency distribution of number of words per T-unit (W/T) in essays placed
in Level 100
According to the Stem-and-Leaf plots in Figures 19 and 20, there were no
extreme values spotted in Level 73, whereas there was one in Level 100. This outlier was
deleted from the original data, and the descriptive statistics of the original data and the
data without the outliers are shown in Tables 10 and 11.
Frequency Stem & Leaf
3.00 0 . 999 13.00 1 . 0111111111111 9.00 1 . 222222333 7.00 1 . 4444455 6.00 1 . 667777
4.00 1 . 8899 Stem width: 10.00 Each leaf: 1 case(s)
Figure 19. Stem-and Leaf plot for number of words per T-unit (W/T) in essays placed in
Level 73
Words per T-unit
Num
ber
of S
tude
nts

37
Frequency Stem & Leaf 6.00 1 . 001111 10.00 1 . 2222233333 14.00 1 . 44444444455555
10.00 1 . 6666666777 4.00 1 . 8899 2.00 2 . 00 1.00 2 . 2 1.00 Extremes (>=24) Stem width: 10.00000 Each leaf: 1 case(s)
Figure 20. Stem-and Leaf plot for number of words per T-unit (W/T) in essays placed in
Level 100
Table 10.
Descriptive statistics for number of words per T-unit (W/T) in writing samples with
outliers
ELI 73 ELI 100 Statistic Prompt
1 Prompt
2 Prompt
3 Prompt
4 Total Prompt
1 Prompt
2 Prompt
3 Prompt
4 Total
N 11 12 4 15 42 20 12 8 8 48 Mean 14.21 13.11 14.46 13.56 13.68 15.40 13.98 17.04 15.19 15.28 Median 14.25 11.53 13.65 12.34 12.65 14.49 13.81 16.30 15.34 14.64 Mode 11.81 N/A N/A N/A 11.81 N/A N/A N/A N/A N/A SD 2.95 3.09 2.68 2.61 2.79 2.84 2.67 3.80 2.58 3.01 Max 19.84 18.22 18.14 19.48 19.84 23.71 20.33 22.45 18.62 23.71 Min 9.15 9.68 12.38 10.79 9.15
11.74 10.95 10.17 11.87 10.17

38
Table 11.
Descriptive statistics for number of words per T-unit (W/T) in writing samples without
outliers
ELI 73 ELI 100 Statistic Prompt
1 Prompt
2 Prompt
3 Prompt
4 Total Prompt
1 Prompt
2 Prompt
3 Prompt
4 Total
N 11 12 4 15 42 19 12 8 8 47 Mean 14.21 13.11 14.46 13.56 13.68 14.96 13.98 17.04 15.19 15.10 Median 14.25 11.53 13.65 12.34 12.65 14.47 13.81 16.30 15.34 14.51 Mode 11.81 N/A N/A N/A 11.81 N/A N/A N/A N/A N/A SD 2.95 3.09 2.68 2.61 2.79 2.12 2.67 3.80 2.58 2.77 Max 19.84 18.22 18.14 19.48 19.84 19.19 20.33 22.45 18.62 22.45 Min 9.15 9.68 12.38 10.79 9.15
11.74 10.95 10.17 11.87 10.17
Overall, in Table 11, the differences of the descriptive statistics between the two
levels are consistent, but when looking closely among the four prompts, the distinction is
not so clear: the Mean ranges from 13.11 to 14.46 for level 73 and 13.98 to 17.04 for
Level 100, the Max from 18.14 to 19.84 for Level 73 and 18.62 to 22.45 for Level 100,
and the Min from 9.15 to 12.38 for Level 73 and 10.17 to 11.87 for Level 100.

39
Number of words per clause (W/C). The last measure analyzed was W/C.
Figures 21 and 22 show the frequency distributions for number of words per clauses in
essays of students placed into 73 and 100. The skewness values are .26 and .73 for the
two levels and 1.44 and 1.27 for the kurtosis values.
0
12
3
4
56
7
8
910
11
12
1314
15
16
0 1 2 3 4 5 6 7 8 9 10 11 12 13 14 15 16 17 18 19 20
Number of words per clause for 73
Fre
qu
ency
Figure 21. Frequency distribution of number of words per clause (W/C) in essays placed
in Level 73
0
1
2
3
4
5
6
7
8
9
10
11
12
13
14
15
16
0 1 2 3 4 5 6 7 8 9 10 11 12 13 14 15 16 17 18 19 20
Number of words per clause for 100
Fre
qu
ency
Figure 22. Frequency distribution of number of words per clause (W/C) in essays placed
in Level 73
Num
ber
of S
tude
nts
Num
ber
of S
tude
nts
Words per clause
Words per clause

40
Though not so noticeable in the frequency distribution, the Stem-and-Leaf plots in
Figures 23 and 24 point out three outliers for this measure in the two levels. Interestingly,
W/C is the only measure that shows a lower extreme value as an outlier, as can be seen in
Figure 23. In addition to this lower outlier, Level 73 also had a higher extreme value.
Figure 24 points out an outlier in Level 100 as well.
Frequency Stem & Leaf 1.00 Extremes (=<5.7) 2.00 6 . 33 2.00 6 . 67 2.00 7 . 01 3.00 7 . 789
9.00 8 . 000123334 8.00 8 . 55677899 7.00 9 . 0111334 2.00 9 . 69 4.00 10 . 0112 1.00 10 . 5
1.00 Extremes (>=12.7)
Stem width: 1.000000 Each leaf: 1 case(s)
Figure 23. Stem-and Leaf plot for words per clause (W/C) in essays placed in Level 73
Frequency Stem & Leaf 3.00 6 . 689 6.00 7 . 235688 14.00 8 . 01233444555789 11.00 9 . 01346677789 11.00 10 . 00011255679 1.00 11 . 8 1.00 12 . 3 1.00 Extremes (>=13.9)
Stem width: 1.000000 Each leaf: 1 case(s)
Figure 24. Stem-and Leaf plot for words per clause (W/C) in essays placed in Level 100
41
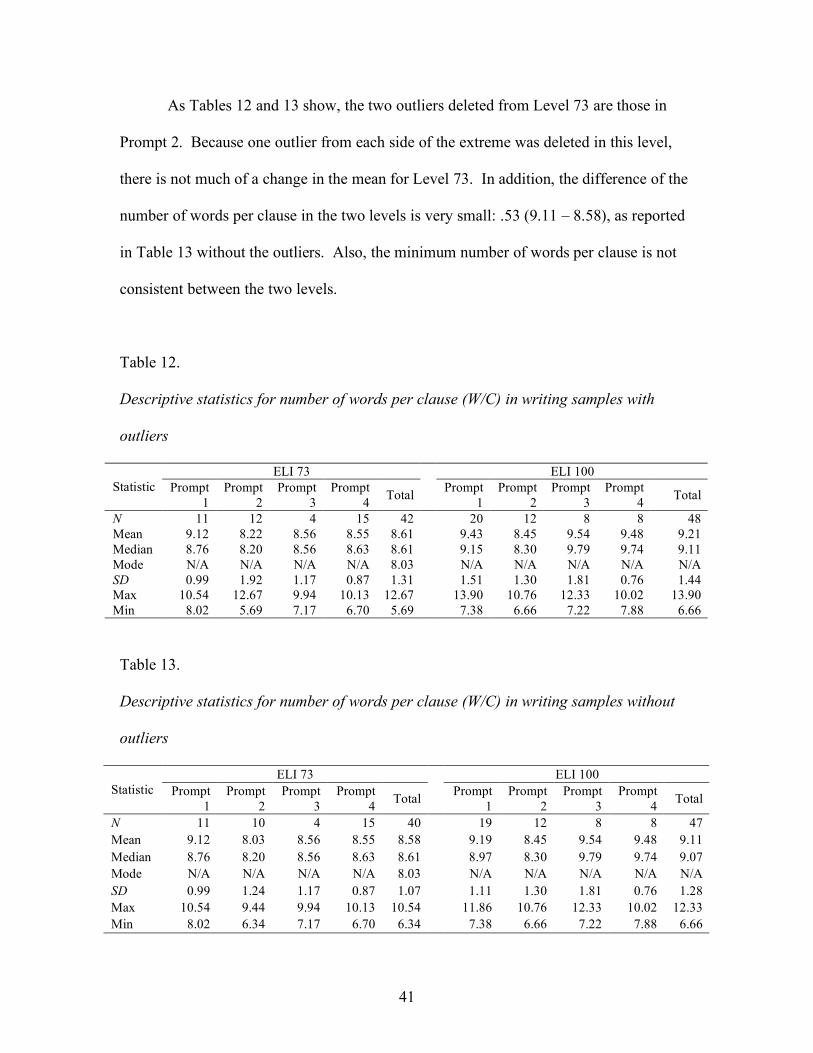
As Tables 12 and 13 show, the two outliers deleted from Level 73 are those in
Prompt 2. Because one outlier from each side of the extreme was deleted in this level,
there is not much of a change in the mean for Level 73. In addition, the difference of the
number of words per clause in the two levels is very small: .53 (9.11 – 8.58), as reported
in Table 13 without the outliers. Also, the minimum number of words per clause is not
consistent between the two levels.
Table 12.
Descriptive statistics for number of words per clause (W/C) in writing samples with
outliers
ELI 73 ELI 100 Statistic Prompt
1 Prompt
2 Prompt
3 Prompt
4 Total Prompt 1
Prompt 2
Prompt 3
Prompt 4 Total
N 11 12 4 15 42 20 12 8 8 48 Mean 9.12 8.22 8.56 8.55 8.61 9.43 8.45 9.54 9.48 9.21 Median 8.76 8.20 8.56 8.63 8.61 9.15 8.30 9.79 9.74 9.11 Mode N/A N/A N/A N/A 8.03 N/A N/A N/A N/A N/A SD 0.99 1.92 1.17 0.87 1.31 1.51 1.30 1.81 0.76 1.44 Max 10.54 12.67 9.94 10.13 12.67 13.90 10.76 12.33 10.02 13.90 Min 8.02 5.69 7.17 6.70 5.69
7.38 6.66 7.22 7.88 6.66
Table 13.
Descriptive statistics for number of words per clause (W/C) in writing samples without
outliers
ELI 73 ELI 100 Statistic Prompt
1 Prompt
2 Prompt
3 Prompt
4 Total Prompt
1 Prompt
2 Prompt
3 Prompt
4 Total
N 11 10 4 15 40 19 12 8 8 47 Mean 9.12 8.03 8.56 8.55 8.58 9.19 8.45 9.54 9.48 9.11 Median 8.76 8.20 8.56 8.63 8.61 8.97 8.30 9.79 9.74 9.07 Mode N/A N/A N/A N/A 8.03 N/A N/A N/A N/A N/A SD 0.99 1.24 1.17 0.87 1.07 1.11 1.30 1.81 0.76 1.28 Max 10.54 9.44 9.94 10.13 10.54 11.86 10.76 12.33 10.02 12.33 Min 8.02 6.34 7.17 6.70 6.34
7.38 6.66 7.22 7.88 6.66

42
Pruning of outliers for further analyses
Based on the preceding descriptive analyses, data for all outliers were removed
prior to further comparison. The new skewness values, along with the new SD range for
each measure in both levels, are presented in Table 14. The skewness values range from
-.35 to .75, and the ranges of the distribution are from 2 or 3 SDs below the mean to 2 or
3 SDs above the mean. Except for Level 100 for the W/T measure, all data sets show a
relatively normal distribution after pruning.
The results from this point on are based on the data sets without the outliers.
There were 16 extreme values in total, and ten data sets had at least one of these outliers.
Also, two additional data were missing for W/M (one overlaps with the outlier). Thus the
pruned N size used for the inferential statistics is 78 rather than 90.
Table 14.
Skewness and SD range without outliers
Measures
NW
NT
NC
W/M
W/T
W/C
Level 73 100 73 100 73 100 73 100 73 100 73 100 Skewness .32 .43 .25 .75 .34 .53 .47 .57 .59 .53 -.35 .20 SD below -2SD -2SD -2SD -2SD -3SD -2SD -2SD -2SD -3SD -2SD -2SD -2SD SD above +2SD +3SD +2SD +3SD +3SD +3SD +3SD +3SD +2SD +3SD +2SD +2SD
Differences between the two levels on each measure
MANOVA result. The MANOVA procedures compared differences between the
two levels (the independent variable) for each of six dependent variables: NW, NT, NC,
W/M, W/T, and W/C. The result of the multivariate test yielded a significant effect of
the dependent variables for the two levels (Wilks’s Lambda = .70, F (6, 5.04), p = .00),

43
and also explains 30% of the variance. In addition, Table 15 shows the tests of between-
subjects effects, and the one-way analysis for each of the six measures.
Table 15.
Tests of between-subjects effects.
Source Dependent Variable
Type III Sum of Squares
df Mean Square F Sig.
Partial Eta
Squared Level NW 173155.94 1.00 173155.94 17.33 .00 .19 NT 241.91 1.00 241.91 2.84 .10 .04 NC 1493.07 1.00 1493.07 8.37 .01 .10 W/M 7.32 1.00 7.32 9.69 .00 .11 W/T 54.93 1.00 54.93 7.65 .01 .09 W/C 5.30 1.00 5.30 3.79 .06 .05 Intercept NW 16522056.04 1.00 16522056.04 1653.98 .00 .96 NT 84626.53 1.00 84626.53 992.79 .00 .93 NC 214685.07 1.00 214685.07 1203.87 .00 .94 W/M 774.33 1.00 774.33 1024.28 .00 .93 W/T 15751.50 1.00 15751.50 2193.74 .00 .97 W/C 6023.38 1.00 6023.38 4303.08 .00 .98 Error NW 759185.45 76.00 9989.28 NT 6478.30 76.00 85.24 NC 13553.05 76.00 178.33 W/M 57.45 76.00 0.76 W/T 545.70 76.00 7.18 W/C 106.38 76.00 1.40
Main differences for the two dependent variables, NT (number of T-units) and
W/C (words per clause), (F = 2.84 and 3.79, respectively) were not statistically
significant (p = .10 and .06, respectively). On the other hand, the other four dependent
variables NW, NC, W/M, and W/T, (F = 17.33, 8.37, 9.69, and 7.65, respectively) were
statistically significant (p = .00, .01, .00 and .01, respectively). In other words, there are
differences in the two level means and this is not due to chance of sampling.

44
95% confidence interval
95% confidence intervals for each measure were calculated and displayed in a bar
graph in order to illustrate the mean difference of the two levels and to see how much
they overlap.
Number of words (NW). Figure 21 displays the upper and lower 95% confidence
boundaries of the number of words in writing samples for the two levels overall, and for
those levels with each of the four different writing prompts. Means are plotted by dashes
(-) and the vertical boxes show associated confidence intervals. The difference between
the means is not considered statistically significant, where the vertical boxes overlap,
(Henry, 1995).
The average difference in terms of number of words, between the two levels is
96.99. There is no overlap in CIs between the two levels for the overall comparison (CI
upper for 73: 445:70 and CI lower for 100: 482.82). In other words, the difference
between the writing samples in ELI 73 and ELI 100, according to the average overall
length of writing, is statistically significant, as shown in the result of MANOVA
(F (1, 76) = 17.33, p = .00).
Looking at Figure 21 at the boxes with the same color, NW measures for the four
prompts overlap consistently with each other at the 95% confidence interval for both 73
and 100. Thus, viewing prompt as a potential major source of variance, there was no
statistically significant difference among the four prompts within each level. This could
be the case because the students had a choice of prompts. The result could have been

45
different if they were assigned to write about different topics. In addition, the confidence
interval boxes for Prompt 3 are much larger than others due to the low N size.
Figure 21. 95% confidence intervals for number of words (NW) in essays in different
levels and those with different prompts

46
Number of T-unit (NT). NT was the measure for which the p value from the
MANOVA result was the biggest (p = .10) and the F value closest to 1 (F =2.84), and as
such, this measure was not to be statistically significant (F (1, 76) = 2.84, p = .10). This
finding is also illustrated in Figure 22, where the the first two boxes slightly overlap with
a difference of 4.10.
Figure 22. 95% confidence intervals for number of T-units (NT) in essays in different
levels and those with different prompts

47
Number of clauses (NC). The result from MANOVA (F (1, 76) = 8.38, p = .01)
and the 95% CI boundaries in Figure 23 both showed a statistically significant difference
between the levels (difference of 9.29 number of clauses).
Figure 23. 95% confidence intervals for number of clauses in different levels and those
with different prompts
48
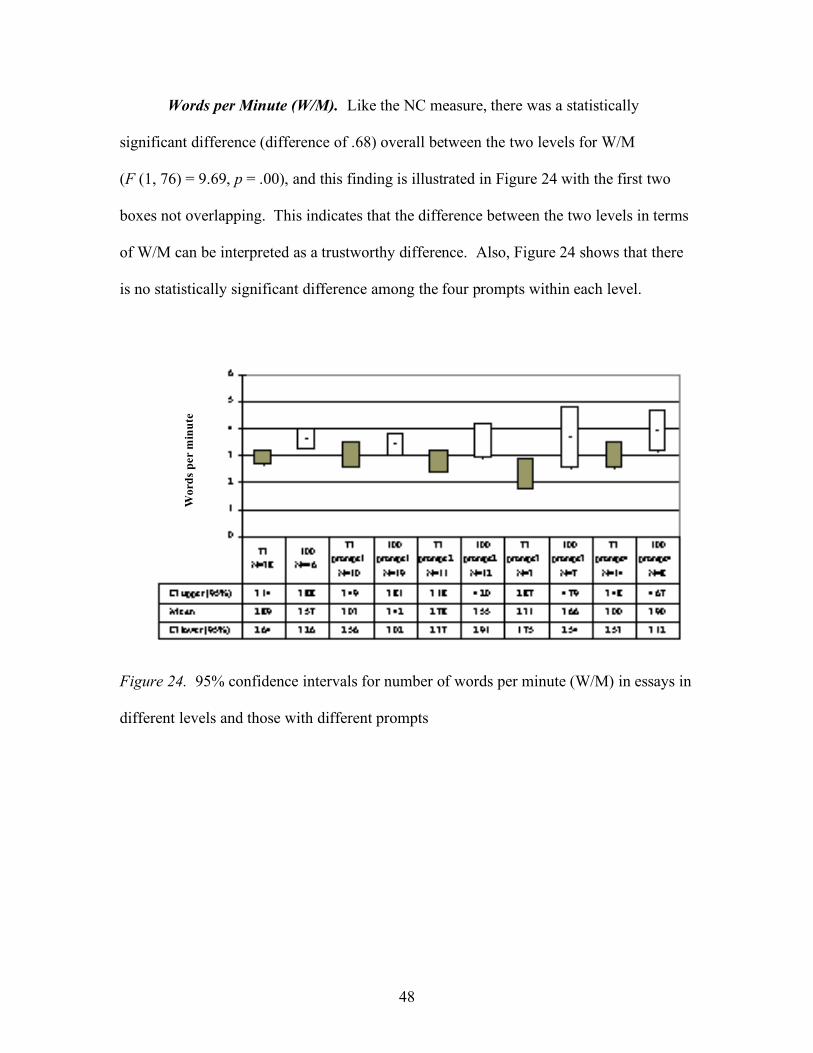
Words per Minute (W/M). Like the NC measure, there was a statistically
significant difference (difference of .68) overall between the two levels for W/M
(F (1, 76) = 9.69, p = .00), and this finding is illustrated in Figure 24 with the first two
boxes not overlapping. This indicates that the difference between the two levels in terms
of W/M can be interpreted as a trustworthy difference. Also, Figure 24 shows that there
is no statistically significant difference among the four prompts within each level.
Figure 24. 95% confidence intervals for number of words per minute (W/M) in essays in
different levels and those with different prompts
Wor
ds p
er m
inut
e

49
Number of Words per T-unit (W/T). The result of MANOVA indicated that
there is a statistically significant difference between the two levels (F (1, 76) = 7.65, p
= .01). However, in Figure 25, the two boxes slightly overlap. This could mean that this
difference might not be entirely trustworthy, given the current sample of participants and
the current observed means and score distributions. Nevertheless, it should not be
ignored that there was a mean difference of 1.42 words per T-unit.
Figure 25. 95% confidence intervals for number of words per T-unit in different levels
and those with different prompts

50
Number of words per clause (W/C). For the last measure, W/C, there was no
statistically significant difference between the two levels from the result of MANOVA
(F (1, 76) = 3. 79, p = .06). This is also shown in Figure 26, where although there is a
mean difference of .50, the two boxes overlap. However, since the p value was slightly
bigger than .05, this should be interpreted cautiously.
Figure 26. 95% confidence intervals for number of words per clause (W/C) in essays in
different levels and those with different prompts
Table 15 summarizes the findings from this section. NT and W/C were the two
measures which did not show a statistically significant difference between the means in
the two levels, yet showed a difference of 4.10 and .53 respectively. NW, NC, W/M, and
W/T measures showed a difference of 96.99, 9.29, .68, and 1.42 in this order and were
statistically significant. However, though there was a statistically significant difference
for W/T, the 95% confidence intervals of the two levels slightly overlapped indicating
that the difference may not be entirely trustworthy.

51
Table 15.
Mean Differences
Measure Mean difference F test Significance 95 % Confidence
intervals of two levels NW 96.99 (F (1, 76) = 17.33, p = .00) sg Do not overlap NT 4.10 (F (1, 76) = 2.84, p = .10) ns Overlap NC 9.29 (F (1, 76) = 8.37, p = .01) sg Do not overlap W/M .68 (F (1, 76) = 9.69, p = .00) sg Do not overlap W/T 1.42 (F (1, 76) = 7.65, p = .01) sg Overlap W/C .53 (F (1, 76) = 3.79, p = .06) ns Overlap
Relationship of the six measures
Pearson correlation coefficient was conducted among all pairs of the six measures
in order to understand the relationship among the six. Table 16 shows that the highest
three correlation pairs are those among the frequency measures (NW, NT, and NC).
However, among the ratio measures (W/M, W/T, and W/C), only the W/T and W/C pair
correlated statistically significantly. W/M showed a high correlation rather with the
frequency measures. Especially, W/M and NW correlated positively highly. In addition,
there were negative correlations between the frequency measures and the corresponding
ratio measures: NT and W/T, and NC and W/C. Clearly, this shows that these two ways
of measures are tapping very different constructs.
Table 16.
Pearson Correlation Coefficients for the Six Measures
NW NT NC W/M W/T W/C NW 1.00 *.76 *.82 *.70 .14 .13 NT 1.00 *.88 *.57 *-.51 *-.33 NC 1.00 *.64 *-.23 *-.42 W/M 1.00 .07 .03 W/T 1.00 *.65 W/C 1.00 Note. * p <.05
52
Factor Analyses Results
Note that Tabachnik and Fidell (2000) recommended several concerns with data
for more reliable factor analysis results. The first is to have at least 300 cases for factor
analysis to obtain more trustworthy results. Also, none of the variables in the analyses
should have missing data. However, with the outliers omitted, and three samples without
the time, 10 samples in total were eliminated. Thus the result of the factor analyses
should be interpreted with caution. In addition, distributions should be normal and linear.
Based on the descriptive statistics with the outliers deleted, the distributions were
relatively normal and linear.
The KMO (Kaiser-Meyer-Olkin) and Bartlett’s test result was .55 at p = .00,
which tells that the result is not highly adequate but still relatively significant (Morgan
and Griego, 1998). With a minimum eigenvalue (a measure of explained variance) for
extraction of factors set at 1.00, the factor analysis extracted two factors. The
eigenvalues for these two factors were 3.30 and 1.83, and they accounted for 55.80% and
30.43%, respectively, of the variance within the subset of variables. Table 17 displays
the rotated factor matrix, which shows the loadings of the six measures on the two factors.
Factor analyses results show that NW, W/M, NT, and NC loaded on Factor 1 and W/T
and W/C loaded on Factor 2.

53
Table 17.
Rotated Factor Matrix
Factor
1 2
Number of Words (NW) .96 .17
Number of Clauses (NC) .90 -.33
Number of T-units (NT) .84 -.46
Words per Minute (W/M) .83 .13
Number of Words per T-unit (W/T) -.02 .92
Number of Words per clause (W/C) -.04 .89
Eigenvalue 3.30 1.83
% of Variance 55.08 30.43
Cumulative % 55.08
85.51
Discriminant Analyses Results
The following tables (Tables 18 to 23) show the results of discriminant analyses
of each measure, indicating how well the six measures predict a students’ placement into
the two ELI levels. Table 18 shows that the number of words (NW) in an essay was able
to correctly classify 65.7% of students into Level 73, and 69.8% into Level 100. As for
number of T-units (NT) in a writing sample (Table 19), it was able to classify the same
percentage of students as for NW, which was 65.7%, into Level 73, whereas 48.8% into
Level 100. The number of clauses (NC) measure correctly predicted 71.4% of students
into Level 73, and 55.8% into Level 100 as could be seen in Table 20. Interestingly, the

54
result of the discriminant analysis for W/M in Table 21 was the same as that for NW:
correctly classifying 65.7% of students into Level 73 and 69.8% into Level 100. Table
22 shows that W/T (words per T-unit) predicted 65.7% of students into Level 73 and
60.5% into Level 100. The last measure, W/C in Table 22 was able to predict 57.1% of
students into Level 73 and 53.5% into Level 100.
All in all, NW and W/M were the two measures that predicted higher for Level
100 compared to Level 73, whereas the other four predicted more students’ membership
to Level 73. Also, from the result of the discriminant analysis for each measure, NC was
the best predictor for Level 73, NW and W/M were the best predictor for Level 100, and
overall NW and W/M were the best predictor for both levels.
Table 18.
Prediction of group membership for NW
Level Predicted Group Membership Total 73 100 Count 73 23 12 35 100 13 30 43 % 73 65.7 34.3 100.0 100 30.2 69.8 100.0
Note. 67.9% of original grouped cases correctly classified. Table 19.
Prediction of group membership for NT
Level Predicted Group Membership Total 73 100 Count 73 23 12 35 100 22 21 43 % 73 65.7 34.3 100.0 100 51.2 48.8 100.0
Note. 56.4% of original grouped cases correctly classified.

55
Table 20.
Prediction of group membership for NC
Level Predicted Group Membership Total 73 100 Count 73 25 10 35 100 19 24 43 % 73 71.4 28.6 100.0 100 44.2 55.8 100.0
Note. 62.8% of original grouped cases correctly classified.
Table 21.
Prediction of group membership for W/M
Level Predicted Group Membership Total 73 100 Count 73 23 12 35 100 13 30 43 % 73 65.7 34.3 100.0 100 30.2 69.8 100.0
Note. 67.9% of original grouped cases correctly classified.
Table 22.
Prediction of group membership for W/T
Level Predicted Group Membership Total 73 100 Count 73 23 12 35 100 17 26 43 % 73 65.7 34.3 100.0 100 39.5 60.5 100.0
Note. 62.8% of original grouped cases correctly classified.

56
Table 23.
Prediction of group membership for W/C
Level Predicted Group Membership Total 73 100 Count 73 20 15 35 100 20 23 43 % 73 57.1 42.9 100.0 100 46.5 53.5 100.0
Note. 55.1% of original grouped cases correctly classified.
Discriminant analyses for the three frequency measures (NW, NT, and NC)
together and for the three ratio measures (W/M, W/T, and W/C) together were conducted
in order to see whether there was a difference between these two types of measures. The
result is shown in Tables 24 and 25. The frequency measures together correctly classified
62.9% of students into Level 73 and 72.1% into Level 100. The three ratio measures
predicted 65.7% of students’ membership into Level 73 and 67.4% into Level 100.
These two results show that both measures properly classified students more into Level
100 rather than into Level 73. Also, among the two types of measures, the frequency
measures had a higher predictability compared to the ratio measure.
Table 24.
Prediction of group membership for Frequency Measures
Level Predicted Group Membership Total 73 100 Count 22 13 35 100 12 31 43 % 73 62.9 37.1 100.0 100 27.9 72.1 100.0
Note. 67.9% of original grouped cases correctly classified.

57
Table 25.
Prediction of group membership for Ratio Measures
Level Predicted Group Membership Total 73 100 Count 73 23 12 35 100 14 29 43 % 73 65.7 34.3 100.0 100 32.6 67.4 100.0
Note. 66.7% of original grouped cases correctly classified.
Recall that the measures, that loaded on Factor 1 based on the result of the factor
analyses were NW, NT, NC, and W/M, and those loaded on Factor 2 were W/T and W/C.
These two groups of measurements were grouped together and the discriminant analyses
for these two groups were conducted. The results are displayed in Table 26 and 27. The
measures loaded on Factor 1 – NW, NT, NC, and W/M – correctly classified 65.7% of
students into Level 73, and 69.8% into Level 100. The two measures, W/T and W/C
together, predicted 68.6% and 55.8% of students’ membership into Level 73 and 100,
respectively. Thus, the measures loaded on Factor 1 were a better predictor for Level 100,
while those loaded on Factor 2 were better for Level 73.
Table 26.
Prediction of group membership for Measures loaded on Factor 1
Level Predicted Group Membership Total 73 100 Count 73 23 12 35 100 13 30 43 % 73 65.7 34.3 100.0 100 30.2 69.8 100.0
Note. 67.9% of original grouped cases correctly classified.

58
Table 27.
Prediction of group membership for Measures loaded on Factor 2
Level Predicted Group Membership Total 73 100 Count 73 24 11 35 100 19 24 43 % 73 68.6 31.4 100.0 100 44.2 55.8 100.0
Note. 61.5% of original grouped cases correctly classified.
The last discriminant analysis result in Table 28 is done with all six measures. .
The six measures together correctly classified 62.9% of students into Level 73 and 81.4%
into Level 100. Also, there was an increase in prediction overall with all the six measures
together.
Table 28.
Prediction of group membership for all six measures
Level Predicted Group Membership Total 73 100 Count 73 22 13 35 100 8 35 43 % 73 62.9 37.1 100.0 100 18.6 81.4 100.0
Note. 73.1% of original grouped cases correctly classified.
To summarize the findings from this section, the best prediction was shown when
all six measures were grouped together (73.1%). Yet, they were quite different by level.
Comparing the result from the discriminate analyses of the six measures individually and
as a subset, it is clear that predicting placement into Level 73 was best done on a basis of

59
raw fluency measures. However, the best prediction of placement into the higher level
(Level 100) was a combination of raw fluency and complexity measures.
DISCUSSION
Research Question 1: What, if any, difference are there between placement levels on
each of the six L2 fluency measures?
Overall, the strongest differences between the two levels were made with the NW
measure (F (1, 76) = 17.33, p = .00, with a difference of 96.99 words). A weaker
difference was made with the NT and W/C measure ((F (1, 76) = 2.84, ns, p = .10, with a
difference of 4.10 T-units) and (F (1, 76) = 3.79, ns, p = .06, with a difference of .53
words per clause)).
As mentioned above, the difference of NW measures in the two levels was found
to be statistically significant. This supports the findings in Wolfe-Quintero et al. (1998),
that the studies that found a significant effect of number of words in an essay were those
that compared writers at different proficiency levels using a composition with a time limit.
The mean difference of NT between the two levels was 4.10 but it did not show a
statistically significant difference between the two levels. This was also the case in the
studies mentioned in Wolfe-Quintero et al. However, unlike the finding that the NT may
decrease with increased proficiency, the result of this study still showed an increase.
The NC was found to be a measure that has a statistically significant difference
between the two levels with a difference of 9.29 clauses. However, NC in the studies that
were investigated in Wolfe-Quintero et al (1998) was found not to be statistically

60
significant. These studies were those that compared beginning level students’ writings.
However, number of clauses is a better measure in the higher level proficiency (L. Ortega,
personal communication), which is the case for the students who wrote these writing
samples, whose TOEFL score ranges from 500 to 600.
W/M is a measure that corresponds to the rate of speech measure commonly used
in studies of oral fluency. The difference of words per minute in the two levels was .68
in this study. This measure also showed a statistically significant difference between the
two levels, with is correspondent to Arthur (1979) cited in Wolfe-Quintero et al.
Though the result of MANOVA for W/T indicated a statistically significant
difference between the two levels, it was not entirely trustworthy because the 95%
confidence intervals of the two levels slightly overlapped. However, the means did show
a difference of around 2 words, which supports the finding in Ortega (2003). In this
research synthesis, she finds that 1.8 words of difference may be enough for statistically
significant results. Also, the studies mentioned in Wolfe-Quintero et al. (1998) showed a
range from 6 W/T for the lowest level learners to 23 W/T for the most advanced level. If
this is the case for ESL learners, the W/T of the writings (13.68 and 15.1) indicates that
these learners are intermediate-advanced students according to the range.
As with W/T, the 95% confidence interval boundaries overlapped. In addition,
though the difference was .53, the result of MANOVA for W/C indicates that there is no
statistically significant difference between the two levels. This supports the finding in
Ortega (2003), where the studies that have a statistically significant difference were those
with difference of more than 1.1 words per clauses. However, it is not the case in this
study (.53) and thus is not statistically significant. In addition, the studies in Wolfe-

61
Quintero et al (1998) show a range of 5.20 of W/C for lowest level learners to 10.83 of
W/C for advanced level learners, and the students in this study wrote a mean of 8.58 and
9.11 W/C, indicating that they are intermediate-advanced learners. This corresponds to
the result from the W/T measure.
Research Question 2: What is the relationship among the six measures, if any?
Based on the Pearson Coefficient Correlation result, those that had the highest
three correlations were among the frequency measures: r NC NT = .88, r NW NC = .82, r NW NT
= .76. In addition to these three, two ratio measures – W/T and W/C – showed a
relatively high correlation (r W/T W/C = .65). Also, instead of correlating highly with the
two ratio measures, W/M showed a high correlation with NW, NT, NC and (r W/M, NW = .70,
r W/M NT = .57, and r W/M NC = .64). Another interesting finding was that the frequency
measures and the corresponding ratio measures (NT and W/T, and NC and W/C) showed
a negative correlation. All these findings of the correlation indicate that, W/M is another
way of looking at frequency of words by reducing the unit to a standardized amount of
time. Thus, it is fundamentally different from the other two ratio measures, which
correlates negatively with its matching frequency measure and may be measuring
something else. These relationships could be better understood with the result of the
factor analyses.
Based on the factor analyses, it could be carefully interpreted that NW, NT, NC,
and W/M load on the same factor, while W/T and W/C load on a separate factor. If true,
this finding runs counter to the assumption in Wolfe-Quintero et al. (1998) that ratio
measures (W/T or W/C) are not measures of complexity as thought traditionally, but

62
rather measures of fluency. In the current study, they seem to be measuring a different
phenomenon from the other variables. In addition, in Ortega (2003)’s research synthesis,
she viewed these two measures in Factor 2 as measures of syntactic complexity rather
than fluency. Thus, this finding supports claims made in previous research that the
production units are good measures of fluency (e.g. Polio, 2001), while ratio units may
measure something else.
Research Question 3: How much of the placement decision can be predicted by the six
measures?
The findings from the Pearson-coefficient correlation and the factor analysis are
consistent for the result of the discriminant analyses. Although the result with all six
measures together showed the highest predictability overall, for the 73 level, raw fluency
measures were the best predictors, while the best prediction of placement into the 100
level was a combination of raw fluency and complexity measure.
CONCLUSION
In concluding this current study, measures that are assumed to gauge fluency were
examined in order to understand the effect of second language learners’ fluency
development in placement decision. Although some may think that the length of an essay
is irrelevant to “true” writing ability and that it may not reflect the interpretations of
writing ability, the findings in this current study show that among the measures that are
thought to measure fluency, the sheer number of words in a writing sample (NW) and the

63
number of words written in a limited time (W/M) was the measures that best showed
difference between the placement decision and also were measures that best correctly
categorized essays into the two levels. Thus, as shown in Larsen-Freeman (1978), there
was an increase in the number of words per composition as proficiency level went up and
the notion of “suitable” length in the Hallmark can be better understood. It would be
interesting to see whether the length of essays dropped for the students in the highest
proficiency as in Larsen-Freeman (1978), by adding the writing samples of students who
were placed into ENG 100, which is the highest level.
In addition, among the six measures examined in this study, two measures that
were concluded to be best measures of fluency in Wolfe-Quintero et al. (1998) – W/T and
W/C – negatively correlate with fluency variables, thus were found to be measuring a
different phenomenon, perhaps measures of syntactic complexity as in Ortega (2003).
For predictability, fluency measures were found to be good predictors of the
lower level placement, but fluency plus complexity measures were a much better
predictor of the upper level placement.
One of the limitations of this study was the small N size, which caused some
results of the statistical analyses not to be entirely trustworthy. It could have been more
reliable and accurate with more data analyzed. Also, as mentioned, additional analyses
with the writing samples of students who were placed into the highest level, ENG 100
could have shown an interesting finding. In addition to fluency measures, analyses of
accuracy and complexity measures would help understand the relationship between
students’ writing development and their placement decisions more fully.

64
Several implications could be drawn from the current study. As for assessment in
second language writing, especially for a timed placement test, it could be cautiously
concluded that the amount of writing does have an effect on the placement decisions,
especially for the lower level placement, thus should not be thought of an entirely
irrelevant characteristic of students’ writing proficiency. For teachers, they can think
about what to focus on when designing curricular levels; for example, whether the course
level should focus on helping students build fluency in writing.

65
REFERENCES
Arthur, B (1979). Short-term changes in EFL composition skills. In C. Yorio, K, Perkins,
& H. Bejoint (Eds.), Vocabulary and applied linguistics (pp. 133-145). London:
Macmillan.
Bachman, L. F., Palmer, A. S. (1996). Language testing in practice. Oxford: Oxford
University.
Brown, J. D. (1996). Testing in language programs. Upper Saddle River, NJ: Prentice
Hall Regents.
Brown, J.D., Hudson, T., & Clark, M. (2004). Issues in placement survey (BetWork#40t)
[PDF document]. Honolulu; University of Hawai`i, National Foreign Language
Resource Center. http://nflrc.hawaii.edu/NetWorks/NW41.pdf
Carlson, S., & Bridgeman, B. (1986). Testing ESL student writers. In K. L. Greenberg, H.
S. Wiener, & R.A. Donovan (Eds.). Writing assessment. (pp.126-152). White
Plains, NY: Longman
Charney, D. (1984). The validity of using holistic scoring to evaluate writing: a critical
overview. Research in the Teaching of English, 18, 65-81.
Chenoweth, N. A., & Hayes, J. R. (2001). Fluency in writing: Generating text in L1 and
L2. Written Communication, 18, 80-98.
Cherry, R. D., Meyer, P. R. (1993). Reliability issues in holistic assessment. In M. M.
Williamson and B. A. Huot (Eds.), Validating holistic scoring for writing
assessment (pp. 109-141). Cresskill, NJ: Hamton Press, Inc.
Clapham, C. (2000). Assessment for academic purposes: where next? System 28, 511-521.

66
Cooper, C. R. (1977). Holistic evaluation of writing. In C. R. Copper & L. Odell (Eds.).
Evaluating writing: Describing, measuring, judging (pp.3-32). Urbana, IL: NCTE.
Cronbach, L. J. (1988). Five perspectives on validity argument. In H. Wainer & H. I.
Braun (Eds.). Test validity (pp. 3 – 17). Hillsdale, NJ: Lawrence Erlbaum
Associates.
Ellis, D. (2005). Holistic, analytic, and linguistic measures of second language writing
placement test decisions. Unpublished master’s thesis, University of Hawai`i at
Mānoa, Honolulu, Hawai`i.
Fillmore, C. J. (1979). On fluency. In C. Fillmore, D. Kempler, & W. S.Y. Wang (Eds.),
Individual differences in language ability and language behavior (pp. 85-101).
New York: Academic Press.
Grobe, C. (1981). Syntactic maturity, mechanics and vocabulary as predictors of quality
ratings. Research in the Teaching of English, 15, 75-86.
Hamp-Lyons, L. (1991a). Basic concepts. In L. Hamp-Lyons (Ed.). Assessing second
language writing in academic contexts. (pp. 5-15). Norwood, NJ: Ablex,
Publishing Corporation.
Hamp-Lyons, L., (1991b). Scoring procedures for ESL contexts. In L. Hamp-Lyons (Ed.).
Assessing second language writing in academic contexts. (pp. 87-107). Norwood,
NJ: Ablex, Publishing Corporation.
Henning, G. (1991). Issues in evaluating and maintaining an ESL writing assessment
program. In L. Hamp-Lyons (Ed.), Assessing second language writing in
academic contexts (pp-279-292). Norwood, NJ: Ablex Publishing Corporation.

67
Henry, G. (1995). Graphing data: Techniques for display and analysis. Thousand Oaks,
CA: Sage
Henry, K. (1996). Early L2 writing development: A study of autobiographical essays by
university-level students of Russian. Modern Language Journal, 80, 309-326.
Larsen-Freeman, D. (1978). An ESL index of development. TESOL Quarterly, 12,
439-448.
Lennon, P. (1990). Investigating fluency in EFL: A quantitative approach. Language
Learning, 40, 387-417
Messik, S. (1988). The once and future issues of validity: Assessing the meaning and
consequences of measurement. In H. Wainer & H. I. Braun (Eds.). Test validity
(pp. 33 – 45). Hillsdale, NJ: Lawrence Erlbaum Associates.
Morgan, G. A., & Griego, O.V. (1998). Easy use and interpretation of SPSS for
Windows : answering research questions with statistics Mahwah, N.J.: Lawrence
Erlllllbaum.
McColly, W. (1970). What does educational research say about the judging of writing
ability? Journal of Educational Research, 64, 147-156.
Neilson, L., & Piche, G. (1981). The influence of headed nominal complexity and lexical
choice on teachers’ evaluation of writing. Research in the Teaching of English, 15,
65-74.
Nold, E., & Freedman, S. (1977). An analysis of readers’ responses to essays. Research
in the Teaching of English, 11, 164-174.
Norris, J. M. (2000). Purposeful language assessment. English Teaching Forum, 38, 18-
23.

68
Ortega, L. (2003). Syntactic complexity measure and their relationship to L2 Proficiency:
A research synthesis of college-level L2 writing. Applied Linguistics, 24, 492-518.
Penny, J., Johnson, R. L., & Gordon, B. (2000). The effect of rating augmentation on
inter-rater reliability: An empirical study of a holistic rubric. Assessing Writing, 7,
143-164.
Polio, C. (2001). Research methodology in second language writing research: The case of
text-based studies. In T. Silva & P. K. Matsuda (Eds.). On second language
writing (pp. 91-115). Mahwah, NJ: Lawrence Erlllllbaum.
Richards, J.C., & Schmidt, R. (2002). Dictionary of language teaching and applied
linguistics (3rd ed.). NY: Longman.
Stewart, M., & Grobe, C. (1979). Syntactic maturity, mechanics of writing and teachers’
quality ratings. Research in the Teaching of English, 13, 207-215.
Tabachnick, B., & Fidell, L. (2000). Using multivariate statistics (4th ed.). New York:
Allyn & Bacon.
Tarone, E., Downing, B., Cohen, A., Gillette, S., Murie, R., & Dailey, B. (1993). The
writing of Southeast Asian-American students in secondary school and university.
Journal of Second Language Writing, 2, 149-172.
Vaughan, C. (1991). Holistic assessment: What goes on in the raters’ minds? In L. Hamp-
Lyons (Ed.), Assessing second language writing in academic contexts. (pp. 111-
126). Norwood, NJ: Ablex Publishing Corporation.

69
Watanabe, Y. (2001). Read-to-write tasks for the assessment of second language
academic writing skills: Investigating text features and rater reactions.
Unpublished doctoral dissertation, University of Hawai`i at Mānoa, Honolulu,
Hawai`i.
Weigle, S. C. (2002). Assessing writing. Cambridge: Cambridge University Press.
Wesche, M. B. (1987). Second language performance testing: the Ontario Test of ESL as
an example. Language Testing, 37, 28-47.
White, E. M. (1984). Holisticism. College Compsition and Communication, 35, 400-409.
White, E. M. (1985). Teaching and assessing writing. San Francisco, CA: Joosey Bass.
Wolfe-Quintero, K., Inagaki, S., & Kim, H. Y. (1998). Second language development in
writing: Measures of fluency, accuracy & complexity (Technical Report #17).
Honolulu: University of Hawaii, Second Language Teaching and Curriculum
Center.

APPENDIX A
Hallmark for Writing Placement Test (ELI, 2002)
Content Organization Vocabulary Grammar Fluency English Shows high proficiency in L2, but need for instruction in rhetoric, organization, support, argumentation. Will benefit from
Paper shows evidence of: • Clear, developed argument, but may be simplistic • Some insight on the topic, but may lack depth • Effective support, but evidence and examples may be general or vague
Paper is: • Cohesive • Somewhat formulaic (e.g. 5-para essay format) • Marked by appropriate transitions
Paper is: • Varied vocabulary • Few problems with collocations • Few problems with word choice
Paper has: • Few errors • Complex sentence structure (e.g. complex coordination, subordination, embedded questions, etc.)
Amount of writing is: • Suitable for level of analysis and/or amount of time provided to write the paper
ELI 100 Shows some knowledge and control of academic writing; needs to develop L2 proficiency, writing ability, awareness of genres/conventions common in US universities. Will benefit from ELI rather than English Dept instruction.
Paper shows evidence of: • Clear, developed argument, but may e simplistic • Some insight on the topic, but may lack depth • Effective support, but evidence and examples may be general or vague
Paper is: • Cohesive • Somewhat formulaic (e.g. 5-para essay format) • Marked by appropriate transitions, with some misuse/overuse of transitional phrases
Paper is: • Varied vocabulary • Some problems with collocations • Some problems with word choice
Paper has: • Several errors (e.g. verb tense/aspect, word form, articles, pre-positions), but typically do not interfere with comprehension Paper has: • Some correct complex sentence structure; evidence of other (incorrect) attempts
Amount of writing is: • Suitable for level of analysis and/or amount of time provided to write the paper
ELI 73 Needs to develop L2 proficiency; notable unfamiliarity with and general lack of control of academic writing; would benefit from at least two semesters of ELI writing instruction.
Paper shows evidence of: • Underdeveloped or unclear argument • Simple topic description/restatement, but with little insight • A general lack of supporting evidence, detail, examples • Redundancy of ideas, argumentation
Paper is: • Not cohesive • Formulaic (e.g. 5-para essay format), or lacking organization • Marked by absence of clear transitions between ideas, or simple sentence-level transitions used at paragraph level (e.g. first, next, then)
Paper is: • Notably limited vocabulary • Repetition/overuse of certain lexical items • Numerous problems with word choice • Incorrect collocations
Paper has: • Numerous errors that typically interfere with comprehension • General lack of sentence complexity
Amount of writing is: • Unsuitable for level of analysis and/or amount of time provided to write paper

APPENDIX B
Example of T-unit and Clause
T-unit Clause Some people hold the opinion that doing team sports are vital things for in our life.
Some people hold the opinion
Others however contradict them. that doing team sports are vital things for in our life.
Personally, I would prefer the writer’s opinion which sports are not for everyone because I believe the opinion has more advantages in many ways.
Others however contradict them.
There are numerous reasons why I agree with the opinion
Personally, I would prefer the writer’s opinion
and I would in here explain the most important ones.
which sports are not for everyone
The main reason is that it depends on the person’s mind.
because I believe the opinion has more advantages in many ways.
If the person does not like sports (any kind of sports), we cannot force to play sports.
There are numerous reasons
why I agree with the opinion
and I would in here explain the most important ones.
The main reason is
that it depends on the person’s mind.