Embed Size (px)
Citation preview

The University of MaineDigitalCommons@UMaine
Electronic Theses and Dissertations Fogler Library
Spring 5-11-2019
Investigating the Time-dependent and theMechanical Behavior of Wood Plastic CompositeLumber Made from Thermally Modified Wood inthe Use of Marine Aquacultural StructuresMurtada A. AlrubaieUniversity of Maine, [email protected]
Follow this and additional works at: https://digitalcommons.library.umaine.edu/etd
Part of the Civil Engineering Commons
This Open-Access Thesis is brought to you for free and open access by DigitalCommons@UMaine. It has been accepted for inclusion in ElectronicTheses and Dissertations by an authorized administrator of DigitalCommons@UMaine. For more information, please [email protected].
Recommended CitationAlrubaie, Murtada A., "Investigating the Time-dependent and the Mechanical Behavior of Wood Plastic Composite Lumber Madefrom Thermally Modified Wood in the Use of Marine Aquacultural Structures" (2019). Electronic Theses and Dissertations. 3026.https://digitalcommons.library.umaine.edu/etd/3026
INVESTIGATING THE TIME-DEPENDENT AND THE MECHANICAL BEHAVIOR
OF WOOD PLASTIC COMPOSITE LUMBER MADE FROM THERMALLY
MODIFIED WOOD IN THE USE OF MARINE
AQUACULTURAL STRUCTURES
By
Murtada Abass A. Alrubaie
B.Sc. University of Basra, 2005
M.Sc. Universiti Putra Malaysia, 2010
A DISSERTATION
Submitted in Partial Fulfillment of the
Requirements for the Degree of
Doctor of Philosophy
(in Civil Engineering)
The Graduate School
The University of Maine
May 2019
Advisory Committee:
Roberto A Lopez-Anido, Professor of Civil Engineering, Co-Advisor
Douglas J. Gardner, Professor of Forest Operations, Bioproducts and Bioenergy, Co-Advisor
William G. Davids, Professor of Civil Engineering
Yousoo Han, Associate Research Professor of Forest Operations, Bioproducts and Bioenergy
Mehdi Tajvidi, Assistant Professor of Renewable Nanomaterials

© 2019 Murtada Abass A Alrubaie
All Rights Reserved

INVESTIGATING THE TIME-DEPENDENT AND THE MECHANICAL BEHAVIOR
OF WOOD PLASTIC COMPOSITE LUMBER MADE FROM THERMALLY
MODIFIED WOOD IN THE USE OF MARINE
AQUACULTURAL STRUCTURES
By Murtada Abass A Alrubaie
Dissertation Co-Advisors: Dr. Roberto Lopez-Anido, P.E.
Dr.Douglas J. Gardner
An Abstract of the Dissertation Presented
in Partial Fulfillment of the Requirements for the
Degree of Doctor of Philosophy
(in Civil Engineering)
May 2019
Wood Plastic Composite (WPC) lumber based on a patent-pending formulation is being
explored for use in the manufacture of an aquaculture fish cage structure (Aquapod net pen
cage), as an alternative to the current high density polyethylene (HDPE) lumber. The use of
WPC lumber in structural applications in marine environments requires a comprehensive effort
to understand the material viscoelastic behavior and the structural performance of the WPC
lumber in marine environments where the WPC lumber is exposed to the combined effect of
saltwater immersion and temperature (hygrothermal). The evaluation of the viscoelastic behavior
of WPC lumber in marine environments was conducted through series of short-term of dynamic
mechanical and thermal analysis (DMTA) creep and creep-recovery experiments, where the
WPC specimens were preconditioned and tested under the combined effect of temperature and
water immersion at different target levels of stress. Long-term creep experiments of WPC and
HDPE lumber under the same controlled conditions and stress levels are necessary to evaluate

and compare the viscoelastic behavior of WPC and HDPE lumber. An understanding of the
structural behavior of WPC lumber in an aquaculture structure was advanced through testing
components (triangular panels) from a spherical shape geodesic frame (Aquapod) structure made
from WPC and HDPE lumber, respectively. The hygrothermal viscoelastic response of WPC
lumber was characterized and modeled. The experiments included measuring 30 minutes of
creep and 30 minutes of creep-recovery on the specimens immersed in saltwater and distilled
water at two different levels of flexural stresses (9% and 14% of the ultimate flexural strength,
Fb) and three temperature values (25, 35, and 45℃). The creep strain fractional increment (CSFI)
of the WPC in this study under all conditions was 86% lower than the CSFI of the WPCs
reported in previous studies. The WPC material in this study exhibited linear viscoelastic and
nonlinear viscoelastic behavior based on the effect of temperature only, and the combined
temperature and water immerstion effect, respectively. The 180-day creep behavior of the WPC
and HDPE lumber in flexure was characterized and compared for WPC and HDPE lumber (with
853 mm support span) subjected to three levels of creep stress: 7.5, 15, and 30% of the ultimate
flexural strength (Fb). The 180-day creep deformation of HDPE specimens was six times higher
than the creep deformation of WPC specimens at the 30% creep stress level. A power law model
was used to describe 180-day creep deflection of WPC lumber beams. Modeling results
predicted that the strain to failure in the HDPE and WPC lumber would occur in 1.5 years and
150 years at a flexural stress of 30% Fb, respectively. A pair of connected triangular panels of
the Aquapod structure with and without wire mesh made from WPC and HDPE lumber were
tested in compression to evaluate and compare the buckling capacity of the panels, respectively.

iii
ACKNOWLEDGEMENTS
There are a numerous number of people that I am genuinely very grateful for their;
support, efforts, guidance, and knowledge. I would like to first and foremost thank my co-advisor
Dr. Douglas J. Gardner for offering me the honor to work on part of his projects, be one of his
research team, and for the extraordinary efforts and support throughout the journey of this
research. Without him it would have never happened. I also thank my co-advisor Dr.Roberto A.
Lopez-Anido for his efforts, advice, knowledge, and guidance. Furthermore, I sincerely thank
Dr. Mehdi Tajvidi, Dr. Yousoo Han, and Dr. Bill Davids for their efforts and the time dedicated
for this research. I also thank Chris West, Justin Crouse, Rich Fredericks, Ben Herzog, Russell
Edgar Steve Ruell, from InnovaSea during his employment, Ray Lawrence, and Duncan Mayes
from Stora Enso. I thank every; employee and graduate student at the Advanced Structures and
Composites Center at the University of Maine, Orono, Maine, USA, who always show their help
during my experimental work. I acknowledge the Higher Committee for Education Development
in Iraq (HCED-Iraq) for their financial support throughout my Ph.D. study.
I would like to thank and acknowledge my family in Iraq who some of them passed away
(my father and my brother) during the years of this research and my family in Maine for their
constant support and encouragement throughout my educational career. My mother, my brothers,
my sister, and my wife, Sally. My little ones (starting from the oldest), Masara, Fatima, and
Hasan, without your happy faces and the joy you bring to me every day, I wouldn’t overcome the
study plights, you all made it worthwhile.
The experimental work in this research was conducted at the Advanced Structures and
Composites Center at the University of Maine, Orono, Maine (USA). The University of Maine
research reinvestment funds (RRF) Seed Grant entitled (Development of structural wood plastic

iv
composite timber for innovative marine application) and the United Stated Department of
Agriculture (USDA)-the agricultural research service (ARS) Funding Grant Number (58-0204-6-
003) have provided the financial support for this project. The wood plastic composite is based on
a patent-pending formulation that has the publication number (WO2018/142314). The thermally
modified wood fiber used in this research is supplied by Stora Enso (Finland).

v
TABLE OF CONTENTS
ACKNOWLEDGEMENTS ........................................................................................................... iii
LIST OF TABLES .......................................................................................................................... x
LIST OF FIGURES ...................................................................................................................... xii
CHAPTER 1 INTRODUCTION .................................................................................................. 18
1.1 Motivation of Using WPC Lumber in Aquaculture Cages ................................................. 19
1.2 Time-Dependent Behavior of WPCs ..................................................................................... 20
1.3 Aquaculture Cage Structures .................................................................................................. 23
1.4 Research Objectives ................................................................................................................. 31
1.5 Organization of the Dissertation Chapters ............................................................................ 31
CHAPTER 2 EXPERIMENTAL INVESTIGATION OF THE HYGROTHERMAL
CREEP STRAIN OF WOOD PLASTIC COMPOSITE LUMBER MADE FROM
THERMALLY MODIFIED WOOD ............................................................................................ 34
2.1 Abstract ...................................................................................................................................... 34
2.2 Introduction ............................................................................................................................... 35
2.3 Experimental Program ............................................................................................................. 37
2.4 Material Preparation ................................................................................................................. 37
2.4.1 Extruded WPC Material .......................................................................................... 37
2.5 Elastic Modulus and Material Density .................................................................................. 39

vi
2.6 The Relationship Between the Modulus of Elasticity
(Apparent) and the Length of The WPC Specimen ................................................................ 40
2.7 Specimen Conditioning ........................................................................................................... 40
2.8 Calculations of the Maximum Flexural Stress Levels ......................................................... 42
2.9 Dynamic Mechanical Thermal Analysis (DMTA) .............................................................. 42
2.10 Strain and Strain Recovery...................................................................................................... 43
2.11 Discussion of Results ............................................................................................................... 43
2.11.1 Hygrothermal Effect on Glass Transition Temperature and Modulus
Of Elasticity of WPC. ............................................................................................................ 43
2.12 Average Creep Strain and Creep Strain-Recovery of WPC ............................................... 55
2.13 Comparison of the WPC Time-Dependent Behavior (Creep Strain)
with Previous Studies ................................................................................................................. 61
2.14 Conclusions ............................................................................................................................... 63
CHAPTER 3 MODELING THE HYGROTHERMAL CREEP BEHAVIOR OF WOOD
PLASTIC COMPOSITE (WPC) LUMBER MADE FROM THERMALLY
MODIFIED WOOD...................................................................................................................... 64
3.1 Abstract ...................................................................................................................................... 64
3.2 Introduction ............................................................................................................................... 64

vii
3.3 Experimental ............................................................................................................................. 67
3.3.1 Materials and Equipment ........................................................................................ 67
3.3.1.1 30-Minute and 250-Minute Creep Experiments.................................................. 67
3.3.1.2 180-day Creep Experiments ................................................................................ 68
3.3.2 Mechanical Testing ................................................................................................. 68
3.3.2.1 DMTA Creep Experiments ................................................................................. 68
3.3.2.2 180-day Creep Experiments ................................................................................ 70
3.4 Results and Discussion ............................................................................................................ 70
3.4.1 Power Law Model ................................................................................................... 70
3.4.2 The 30-Minute Creep of WPC ................................................................................ 72
3.5 Application of the Power Law Model: 250-Minutes Creep of WPC Specimen .............. 77
3.6 Application of the Power Law Model: 180-Day Creep Of WPC Lumber ....................... 78
3.7 Comparison of WPC Creep Response and the Predicted Creep Lifetime of Previous
Studies ........................................................................................................................................... 80
3.8 Conclusions ............................................................................................................................... 85
CHAPTER 4 FLEXURAL CREEP BEHAVIOR OF HDPE LUMBER AND
WPC LUMBER MADE FROM THERMALLY MODIFIED WOOD ....................................... 87
4.1 Abstract ...................................................................................................................................... 87
4.2 Introduction ............................................................................................................................... 87

viii
4.3 Experimental ............................................................................................................................. 92
4.3.1 Material ................................................................................................................... 92
4.3.2 WPC And HDPE Sample Preparation .................................................................... 92
4.3.3 180-Day Creep Experimental Setup ....................................................................... 93
4.4 Quasi-Static Tests ..................................................................................................................... 94
4.5 Discussion of Results ............................................................................................................... 99
4.5.1 Determination of the Creep Stress Levels .............................................................. 99
4.5.2 Experimental Comparison Between the Long-Term Creep of WPC
and HDPE Lumber ................................................................................................................ 99
4.5.3 Time-Dependent Creep Modeling ........................................................................ 105
4.6 Conclusions ............................................................................................................................. 110
CHAPTER 5 EXPERIMENTAL STRUCTURAL PERFORMANCE OF HDPE AND
WPC LUMBER OF AQUACULTURAL GEODESIC SPHERICAL
CAGE COMPONENTS.............................................................................................................. 112
5.1 Abstract .................................................................................................................................... 112
5.2 Introduction ............................................................................................................................. 112
5.3 Experimental ........................................................................................................................... 116
5.3.1 Materials ............................................................................................................... 116
5.3.2 Equipment and Test Setup .................................................................................... 118
5.3.3 Degrees of Freedom of the Supports System of the Triangular Panels ................ 119

ix
5.4 Discussion of Results ............................................................................................................. 120
5.4.1 Structural Analysis of the Tested Structural Components (Panels) of the
Aquacultural Geodesic Spherical Cage Structure ............................................................... 128
5.4.2 Southwell’s Method to Determine the Critical Load ............................................ 133
5.5 Conclusions ............................................................................................................................. 139
CHAPTER 6 CONCLUSIONS AND FUTURE WORK ........................................................... 140
6.1 Conclusions ............................................................................................................................. 141
6.2 Future Work ............................................................................................................................ 142
BIBLIOGRAPHY ....................................................................................................................... 143
BIOGRAPHY OF THE AUTHOR ............................................................................................. 150

x
LIST OF TABLES
Table 2.1. Mean true modulus of elasticity of WPC specimens obtained from
3-point bending tests and the mean of the density of the WPC lumber. ........................... 40
Table 2.2. Glass transition temperature and heat deflection temperature of WPC
under three different testing conditions: dry, saltwater and distilled water. ..................... 46
Table 2.3. Maximum avg. flexural creep strain and strain recovery of WPC
in the three different; conditions, values of temperature, and two levels
of maximum flexural stress. .............................................................................................. 58
Table 2.4. Comparison of WPC creep behavior with previous studies. ....................................... 62
Table 3.1. Power law model parameters of the creep compliance curves of
WPC specimens tested in the dry (D) condition. .............................................................. 74
Table 3.2. Power law model parameters of the creep compliance curves of WPC
specimens conditioned and tested in saltwater (SW) condition. ....................................... 75
Table 3.3. Power law model parameters of the creep compliance curves of WPC
specimens conditioned and tested in distilled water (DW) condition. .............................. 75
Table 3.4. Comparison of the experimental and predictied creep lifetime of WPCs . ................. 85
Table 4.1. Values of elastic modulus (E), flexural strength, and the applied creep
stress level of WPC and HDPE lumber obtained from 4-point quasi-static testing. ....... 98
Table 4.2. Initial midspan deflection (D0) of WPC and HDPE lumber at three
different stress levels....................................................................................................... 101

xi
Table 0.3. Values of creep rate deflection (D) (mm) of all the groups of WPC and
HDPE specimens at 30th, 60th, 90th, 120th, 150 and 180th day respectively
and the fractional deflection (FD) at the 180th day with respect to
initial deflection D0……………………………………………………………………………………………103
Table 4.4. 10 year prediction of the creep displacement of the WPC and HDPE
lumber (in accordance with ASTM D6109). …………………………………………………………107
Table 0.5. Power law model parameters. ……………………………………………..………..…………………109
Table 5.1. Mechanical properties of WPC and HDPE lumber used as struts
of the aquacultural geodesic components of Aquapod net pen geodesic
spherical cage structure. .................................................................................................. 117
Table 5.2.Two dimensional degrees of freedom of the triangular panels during
the buckling experiment. ................................................................................................. 119
Table 5.3. Reactions and member forces computed from the 2D FE linear
analyses obtained from applying unit load on panel 1 (Figure 5.4 at point a)
of the aquacultural geodesic spherical cage structure for four sample types:
WPC-M-panel, WPC-panel, HDPE-M-panel, and HDPE-panel. ................................... 130
Table 5.4. The experimental maximum buckling load and the failure type and
occurrence sequence in the structural components of the aquacultural geodesic
spherical cage structure ................................................................................................... 137
Table 5.5. The buckling load of the member ac based on multiplying the multiplier
value α obtained from the 2D FE linear analyses by the value of critical load
obtained from Southwell’s method. ................................................................................ 138

xii
LIST OF FIGURES
Figure 1.1. (left) the flexural modulus of elasticity of the materials in psi,
(right) the time-dependent deformation in the cage attributable to the sustained
seals’ load on the cage in the presence of high temperature
(InnovaSea Systems, Inc.)................................................................................................. 19
Figure 1.2. Types of aquaculture cages. Clockwise from top left: prototype
gravity system, AquaPod net pen, Ocean Cage Aquaculture Technology (OCAT)
cage, gravity-type flexible cage, tension-leg system, and rigid-frame fish cage
(Vandenbroucke, K. and M. Metzlaff, 2013).................................................................... 24
Figure 1.3. Details of the structural component-the triangular net panel
(building unit) of AquaPod net pen cage
(Vandenbroucke, K. and M. Metzlaff, 2013).................................................................... 26
Figure 1.4. Details of; connected struts in the panels and the connected panels to
form the cage faces, types of hubs, and the types of the panels
(InnovaSea Systems, INC.,2017). ..................................................................................... 27
Figure 1.5. (a) fully submerged cage, (b) a configuration of grid mooring system of
4 AquaPod net pen cages, (c) bridle system in grid mooring cell
(Vandenbroucke, K. and M. Metzlaff, 2013).................................................................... 30
Figure 2.1. WPC cross-section with the highlighted regions where DMTA samples
were cut and machined in the longitudinal direction. ....................................................... 38
Figure 2.2. Schematic of the DMTA submersible 3-point bending clamp used in the
DMTA experiments of WPC specimens with a total specimen span between the
supports (L) of 15mm and a thickness (h) of 2.7mm. ....................................................... 39

xiii
Figure 2.3. Typical flexural load versus midspan deflection for WPC specimens at
three different span lengths (15, 50, and 61.9 mm) and the ANOVA analysis
of the obtained modulus of elasticity E using Equation 2.1. ............................................ 50
Figure 2.4. Mean of the water uptake of WPC in distilled water and saltwater. .......................... 51
Figure 2.5. a) Storage modulus and tan δ versus temperature of WPC under three
different testing conditions; dry (D), saltwater (SW), and distilled water (DW), b)
Mid-span deflection versus temperature of WPC under three different testing
conditions; dry (D), saltwater (SW), and distilled water (DW). ....................................... 52
Figure 2.6. Density profile of the WPC lumber. ........................................................................... 53
Figure 2.7. Normalized (E) versus temperature at three different testing
conditions; dry (D), saltwater (SW), and distilled water (DW). ....................................... 55
Figure 2.8. Avg. creep strain and strain-recovery of the WPC specimens subjected
to a maximum flexural stress of 3.75 MPa at three different temperatures
25, 35, and 45℃ and under three testing conditions (D, SW, and DW). .......................... 57
Figure 2.9.Isochronous stress-strain curves: a) WPC specimens in the dry condition,
b) WPC specimens conditioned and tested in saltwater. .................................................. 60
Figure 3.1.a) 3-point bending DMTA submersible clamp, b) a schematic of the
180-day creep experiment in 4-point bending. ................................................................. 69
Figure 3.2. Isochronous curves of the WPC specimens at the creep time; 5, 15, and
30 minutes at the three different conditions; D, SW, and DW at 25°C. ........................... 73
Figure 3.3. 30-minute creep compliance of WPC specimens (with 15 mm length)
subjected to a maximum flexural stress of 2.5 MPa at 45°C in three different
testing conditions; dry (D), saltwater (SW), and distilled water (DW) conditions........... 76

xiv
Figure 3.4. 30-minute creep compliance of WPC specimens (with 15mm length)
subjected to a maximum flexural stress of 3.75 MPa at 45°C at three different
testing conditions; D, DW, and SW conditions. ............................................................... 77
Figure 3.5. 250-minute creep compliance values and models' data fitting of WPC
specimens under σ = 2.5MPa tested at 45℃ in D, DW, and SW conditions. ................... 78
Figure 3.6. 180-day creep displacement of WPC specimens under 2243 N± 15.20 N
of applied flexural load in a four-point bending test configuration. ................................. 79
Figure 3.7. Implementation of the power law model that was used in the description
of creep behavior of 30-minute creep, 250 minutes, and 180-day creep to predict
the time-dependent displacement of WPC lumber in flexure. .......................................... 80
Figure 4.1. Buckled Aquapod cage made from HDPE lumber and netting
(covered with biofouling) with two lounging sea lions on the exposed struts
(InnovaSea Systems, INC.,2015). ..................................................................................... 89
Figure 4.2. A) Four-point bending test configuration used for both quasi-static
tests and creep tests, B) Creep frames experimental setup. .............................................. 94
Figure 4.3. Stress-strain relationship curves of the a) WPC and b) HDPE lumber,
respectively, in 4-point flexural test.................................................................................. 97
Figure 4.4. Time-dependent mid-span creep displacement for WPC and HDPE
specimens at different stress levels. ................................................................................ 102
Figure 4.5. a) Statistical analysis of variance (ANOVA) that investigates the reduction
in creep rate of the WPC specimens subjected to three applied flexural creep
stress levels. b) ANOVA that investigates the reduction in creep rate of the
HDPE specimens subjected to three applied flexural creep stress levels. ...................... 104

xv
Figure 4.6. Predicted failure occurrence in the outer fiber strain of WPC and HDPE
lumber for the specimens subjected to 30% Fb flexural stress using the power
law model. ....................................................................................................................... 108
Figure 4.7. Comparison of power law model and experimental creep result for
WPC lumber.................................................................................................................... 109
Figure 4.8. Comparison of power law model and experimental creep results
for HDPE lumber ............................................................................................................ 110
Figure 5.1. Details of; connected struts in the panels and the connected panels to form
the cage faces, types of hubs, and the types of the panels of the aquacultural
geodesic spherical cage structure with an approximate diameter of 21 m
(Page, 2013; Vandenbroucke & Metzlaff, 2013). ........................................................... 113
Figure 5.2. Typical stress versus strain relationship to obtain the elastic modulus
and the flexural strength of WPC and HDPE lumber in accordance
with ASTM D6109. ........................................................................................................ 117
Figure 5.3. (Left) the test frame and the buckling test setup, (right) the WPC and
HDPE connected triangular panels with and without metallic mesh. ............................. 118
Figure 5.4. Schematic of the 2D free body diagram of the tested connected
(bolted) of WPC and HDPE triangular panels with and without mesh. ......................... 120
Figure 5.5. The relationship between the applied buckling load and lateral
mid-span deflection (point f in Figure 5.4) of the vertical strut ac in the
panels made from WPC struts and without metallic mesh. ............................................ 122

xvi
Figure 5.6. The relationship between the applied buckling load and lateral
mid-span deflection of the vertical strut ac in the panels made from HDPE
struts and without metallic mesh. .................................................................................... 123
Figure 5.7. Failure modes of the panels made from HDPE and WPC lumber for the
four different cases; A) net section failure at the middle strut ac at the location of the
bolt connection of the panels made from WPC without metallic mesh, B) buckling
mode failure of the strut ac of the panels made from HDPE without metallic
mesh, C) net section failure mode of panels made from WPC struts with
metallic mesh, and D) buckling failure mode of the panels made from HDPE
struts with metallic mesh. ............................................................................................... 125
Figure 5.8. The relationship between the applied buckling load and lateral mid-span
deflection of the vertical strut ac in the panels made from WPC struts and
with metallic mesh. ......................................................................................................... 126
Figure 5.9. The relationship between the applied buckling load and lateral mid-span
deflection of the vertical strut ac in the panels made from HDPE struts and with
metallic mesh. ................................................................................................................. 127
Figure 5.10. Reactions and member forces in N units of panel 1 of the aquacultural
geodesic spherical cage structure obtained from 2D FE linear analyses;
A)WPC-Panel, B)HDPE-panel, C)WPC-M-panel, and C) HDPE-M-panel. ................. 132
Figure 5.11. Application of Southwell’s method to obtain the critical buckling
load of the structural panels of the cage structure made from WPC struts
without metallic mesh. .................................................................................................... 134

xvii
Figure 5.12. Application of Southwell’s method to obtain the critical buckling
load of the structural panels of the cage structure made from WPC struts with
metallic mesh with the shaded region of the linear relationship
between Δ/P versus Δ. .................................................................................................... 135
Figure 5.13. Application of Southwell’s method to obtain the critical buckling
load of the structural panels of the cage structure made from HDPE struts
without metallic mesh. .................................................................................................... 136
Figure 5.14. Application of Southwell’s method to obtain the critical buckling
load of the structural panels of the cage structure made from HDPE struts
with metallic mesh. ......................................................................................................... 137

xviii
CHAPTER 1
1 INTRODUCTION
The mechanical properties of a patent-pending formulation wood plastic composites
(WPCs) made from this WPCs to have a potential capability to be used in marine structural
application (Gardner & Han 2010). Several researchers (Alvarez-Valencia et al. 2010, Bright &
Smith 2007, Haiar 2000, Slaughter 2006, Tamrakar & Lopez-Anido 2011) studied the use of
WPCs in structural application, for instance, WPCs in waterfront structures, and in sheet piles.
University of Maine researchers have successfully developed a WPC that has approximately 4.3
GPa apparent Modulus of Elasticity (MOE) and “less prone to creep than the current WPCs.”
InnovaSea Systems, Inc., Morrill, Maine showed a keen interest to use WPCs, instead of the
High-Density Polyethylene (HDPE) lumber that is used in the current construction of the
AquaPod net pen cages. The latter showed lower apparent MOE, approximately 0.9 GPa and
experienced a severe time-dependent deformation (Gardner 2015). Figure 1.1 illustrates the
motivation to use WPC lumber in AquaPod net pen cages rather than HDPE lumber based on the
high (five times higher) MOE of WPCs, and based on the recorded damage occurred to the
Aquapod cage structure (right) made from HDPE lumber.

19
1.1 Motivation of Using WPC Lumber in Aquaculture Cages
InnovaSea Systems, Inc., (InnovaSea Systems 2015), reported damage occurring to an
A4800 AquaPod net pen cage that is made of HDPE struts, attributable to the combination of
long-term exposure to the tropical heat, the generated waves from a storm that hit the location of
the cage in the Gulf of Mexico, and the unexpected live load of the Sea lions that acted on the
top of the cage during the cage sun exposure (as a process of cleaning the cage from the
biofouling). A pronounced deformation attributable to a sustained point live load of the Sea lions
under the effect of temperature is shown in Figure 1.1 (right). Approximate weight of each Sea
lion was reported as 500 kg, and two Sea lions were observed (InnovaSea Systems 2015). The
following storm created waves that hit the cage repeatedly for more than eight hours and
worsened the damage to the cage. Of the 216 triangular panels (648 struts with 2 x 6 cross-
Figure 1.1. (left) the flexural modulus of elasticity of the materials in psi, (right) the time-
dependent deformation in the cage attributable to the sustained seals’ load on the cage in the
presence of high temperature (InnovaSea Systems 2015).

20
section) required to construct the A4700 AquaPod cage, 78 panels were damaged because of the
synergetic forces that were mentioned earlier (InnovaSea Systems 2015).
To investigate the long-term deformation that might occur on the HDPE struts because of
the effect of elevated temperature, a series of experimental tests were conducted at the University
of Maine, Orono, Maine following the ASTM D6108 (Snape 2015). The compression tests were
performed at four different temperatures; 1.2; 21.11 , 37.78 , 48.89 , and 60 , respectively.
However, the tested specimens from the used struts did not show a decrease in their mechanical
properties attributable to the temperature and moisture, compared with unused tested specimens
(InnovaSea Systems 2015). The reason for not having a pronounced difference between the used
and the unused HDPE specimens is believed to be attributed to the chosen test (i.e., the
compression test vertical to the extrusion direction), different results would have been obtained if
different tests were used, for instance, tension or flexure test in the direction of the extrusion.
InnovaSea systems, Inc., conducts their structural analysis and design, using a finite element
analysis software, CADRE PRO 6. The model was run by considering the weight of the two Sea
lions, acting on the top face of the cage. The model showed a similar deformation to the actual
damage (InnovaSea Systems 2015).
1.2 Time-Dependent Behavior of WPCs
Although WPCs have been explored for use in the different structural applications, the
material’s long-term behavior is still a subject of concern among the researchers. WPCs, unlike
the conventional elastic materials, exhibit viscoelastic behavior. Creep is one of the physical
manifestations of the behavior of the viscoelastic materials, when a constant stress is applied to
the viscoelastic material, the summation of the elastic strain and the time-dependent strain will
represent the total strain (creep strain) of the viscoelastic composite material (Gibson 2016).

21
Some researchers (Gibson 2016, Haghighi-Yazdi & Lee-Sullivan 2013, Sullivan 1990) consider
WPCs to have a linear viscoelastic behavior, whereas other researchers, (Hamel 2011), in their
work consider WPCs to have a nonlinear viscoelastic behavior. Linear viscoelastic behavior
enables the principle of superposition when long-time deformation can be measured in a shorter
duration via accelerated conditions and superimpose the data to construct, so called, the master
curve of the creep strain, whereas the nonlinear viscoelastic behavior requires a “mechanics-
based” model to predict the long-term behavior (Hamel 2011). The time-dependent strain
increases during the period of loading, attributable to the effect of the constant stress, as shown
in Equation 1.1.
(1.1)
The time-dependent behavior of WPCs, particularly in this study, the creep, depends on
the following; (1) the applied stress, (2) the formulation of the WPCs, (3) both temperature and
moisture, (4) physical ageing, and (5) the stress dependency of the parameters of the physical
models (Barbero 2013). If the WPC experiences a combination of all these factors acting at the
same time, thus the complexity of the time-dependent behavior needs to be addressed and
investigated, to have a satisfactory prediction of the service life of the WPC material. Tamrakar
and Lopez-Anido reported a significant decrease in the mechanical properties of “water-
saturated” specimens compared with dry specimens that are exposed to a range of temperatures
(Tamrakar & Lopez-Anido 2011). Cheng reported the effect of immersing a WPC sample in
osmotic and sea water for 13 months. Cheng found significant differences in the mechanical
properties of the WPC samples (Cheng 2005). The temperature (high or low) and the moisture
(water can be humidity, water immersion, or rain) also degrade the constituent of the WPCs and
the composite itself. Wood as a WPC constituent exhibits swelling because of water absorption

22
by the hydrophilic nature of the wood cell wall material. Wood also expands attributable to the
change in temperature. The polymer constituent exhibits a viscoelastic behavior and time-
dependent change in the mechanical properties because of the thermal effect. Combining both
constituents under the hygrothermal effect will worsen the properties of the WPCs further.
Microcracks in the interfacial zone between the polymer and the wood flour particles will be
created, and adhesion will be degraded. Freeze-thaw degradation can be considered as a type of
degradation that is related to the effect of the combination of temperature and moisture (Stark
2008).
To have a better judgment on the most severe environmental impact on the mechanical
behavior of WPCs, an understanding of the environmental degradation of WPC constituents,
wood flour, and polymer, is necessary. UV has an impact on wood. A combination of (UV) with
moisture and air will increase the degradation impact on wood attributable to the hydroxyl
groups and the formation of the free radicals (Stark 2008). The second constituent of the WPCs
is a polymer, generally including the matrix, the coupling agent, the lubricants, or any other
polymer additives also degrades with the exposure to (UV). However, a combination of (UV)
and oxygen (air) will have a pronounced impact on the durability of the polymer, so-called,
photodegradation. The degradation of the polymer will also result in; forming a free radical,
possible chain scission, and crosslinking. As a wood plastic composites (WPCs), the
combination of (UV) with other environmental factors will degrade the surface of the WPCs and
decrease the mechanical properties of WPCs (Matuana et al. 2011). However, this study will not
consider the effect of UV and air on the mechanical properties of WPCs, because the cages will
be submerged in its application.

23
1.3 Aquaculture Cage Structures
To understand the structural behavior of WPC members (struts) in aquaculture cages
(AquaPod net pen cages) that are operated in marine environment and exposed to wave and
current forces, and to qualify that WPC members can show an acceptable structural behavior in
such environment during the service life of the structure, a review of the structural analysis and
design that were conducted by other researchers on aquaculture structures is required. There are
different types of aquaculture cages that are used for fish- stocks farms in open ocean
environment, as shown in Figure 1.2. However, the objective of this study will focus on
reviewing the work was conducted on the AquaPod net pen cages. Ocean Farm Technology
(OFT)-InnovaSea systems, Inc. manufacture AquaPod cages worldwide and in different
capacities. The largest manufactured Aquapod cage has a capacity of 4700 , geodesic
spherical shape approximately 20 m diameter (Vandenbroucke & Metzlaff 2013).

24
The AquaPod net pen cage, among other types of cages, is considered a
distinctive containment system for marine aquaculture, not only its rigid spherical shape,
but for other remarkable features; utilizing the coded triangular panels that are
interchangeable and can be tracked to form cages (six faces assemblies method) in
different desired sizes and to track each panel to do the required maintenance to it,
respectively, reducing maintenance cost by replacing the damaged panels only, any joint
(hub) in the structure can be operated as a mooring point, and it can be rotated
Figure 1.2. Types of aquaculture cages. Clockwise from top left: prototype gravity
system, AquaPod net pen, Ocean Cage Aquaculture Technology (OCAT) cage, gravity-
type flexible cage, tension-leg system, and rigid-frame fish cage (Vandenbroucke &
Metzlaff 2013).

25
attributable to its rigid spherical geometry. Its spherical shape is constructed from
individual triangular net panels that are fastened together using so-called, Gusset blocks.
These net panels are simply structural members (struts) and netting, as shown in Figure
1.3. These struts are made of recycled HDPE material (lumber), and plastic-coated
welded wire mesh, for the net fabric. A hub connects six panels. Figure 1.4 shows the
details of connecting struts to each other in the panel, and panels to the hub. In addition to
the function of the triangular net panels to construct the spherical shape of the cage, other
panels are utilized as access, feeding window, supporting the floating devices that
provide orientation to the cage, and mooring (Vandenbroucke & Metzlaff 2013).

26
Figure 1.3. Details of the structural component-the triangular net panel (building unit) of
AquaPod net pen cage (Vandenbroucke, K. and M. Metzlaff, 2013).

27
Figure 1.4. Details of; connected struts in the panels and the connected panels to form the cage
faces, types of hubs, and the types of the panels (InnovaSea Systems 2017).
An advantageous use of the AquaPod net pen cages in addition to their rigid geometry is
the ability to be operated in the marine environment in a depth of water, below the region of
destructive energy of the surface waves and currents (Vandenbroucke & Metzlaff 2013), as
shown in Figure 1.5 (a).

28
Different configurations of the grid mooring system are used for either individual or
grouped AquaPod net pen cages. However, this study reviews the most common grid mooring
configuration that InnovaSea Systems Inc. use, i.e., the fully submerged four-points grid mooring
system of a single cage as shown in Figure 1.5 (c).
The geometry of the Aquapod net pen structure is supposed to enable it to maintain its
shape and volume under the effect of strong current or towing. However, the struts of the
AquaPod cage (A4700) and the plastic-coated welded wire mesh net of the panels, didn’t
withstand the synergetic forces, for instance, the damage that took place on A4700, when sea
lions resting on the cage and the following weather severe storm, as shown in Figure 1.1 (right).
The objectives of this research are: (1) to provide a time-dependent evaluation (short- and
long-term) that qualifies the structural use of WPC lumber for struts in the AquaPod structures
during their service life in the marine environment, (2) and to describe the effect of temperature
and immersion on the structural behavior of WPC struts.
The scope of this study encompasses; short-term creep and creep recovery experiments
on WPC specimmens (30-minute creep and 30-minute creep recovery)creep testing, long-term
creep (180-day creep experiments) on WPC and HDPE lumber, and mechanical buckling
evaluation of two connected (fastened) strucutral componentes of the Aquapod cage structure
(triangular panels) . These panels are taken from the 1:4 prototype structure of the AquaPod
A4700 cage.

29

30
Figure 1.5. (a) fully submerged cage, (b) a configuration of grid mooring system of 4 AquaPod
net pen cages, (c) bridle system in grid mooring cell (Vandenbroucke, K. and M. Metzlaff,
2013).

31
1.4 Research Objectives
The objectives of the current research are to:
Provide an understanding of the viscoelastic and structural behavior of WPC lumber
in marine structural applications
Investigate the short-term viscoelastic creep and creep-recovery behavior of WPC
lumber under the combined effect of water immersion and temperature.
Describe the creep viscoelastic behavior by modeling it, and implement the model to
predict the WPC lumber viscoelastic behavior for durations longer than the
experimental test duration.
Compare the long-term viscoelastic creep behavior of WPC lumber with viscoelastic
behavior of HDPE lumber.
Compare the structural performance of the structural components of Aquapod net pen
cage made from WPC lumber with the structural performance of the structural
components made from HDPE lumber.
1.5 Organization of the Dissertation Chapters
This dissertation is arranged as a series of six chapters. The focus of chapter two is to
investigate the hygrothermal effect on the short-term creep behavior of extruded thermally
modified wood fiber high strength styrenic copolymer plastic composites (WPCs) on specimens
preconditioned for one month under water immersion (distilled and saltwater). These specimens
were then tested in the same conditions for short-term creep and creep-recovery response using a
submersible clamp. The short-term creep tests of WPC specimens (that are immersed in water as
a function of different temperatures) has not yet been reported in previous studies. The
experiments included measuring 30 minutes of creep and 30 minutes of creep-recovery on the

32
specimens immersed in saltwater and distilled water at two different levels of flexural stresses
(9% and 14% of the flexural strength) and three temperature values (25, 35, and 45℃). Chapter
two has been published as a journal article in a peer-reviewed journal.
Chapter three presents the modeling to the hygrothermal short-term creep behavior of the
WPC specimens. Multiple 3-point bending creep/recovery tests were carried out using a dynamic
mechanical thermal analyzer (DMTA) equipped with a submersible clamp. WPC specimens with
15 mm span were subjected to two initial applied stresses; 9 and 14% of the flexural strength in
30 minutes of creep and 30 minutes of creep recovery under the combined effects of temperature
(25, 35, 45 ) and water immersion (saltwater and distilled water). A dry condition WPC control
was used to compare the hygrothermal effects with respect to the control conditions. A power
law model is considered a useful model to describe the creep behavior of WPC specimens with a
15mm span in the control and the saltwater conditions and at 45℃. Chapter three has been
published as a journal article in a peer-reviewed journal.
Chapter four presents a characterization and comparison study to the creep behavior of the WPC
and high density polyethylene (HDPE) lumber in flexure. Three sample groupings of WPC and
HDPE lumber were subjected to three levels of creep stress; 7.5, 15, and 30% of the ultimate
flexural strength for a duration of 180 days. Because of the relatively low initial creep
compliance of the WPC specimens (five times less) compared with the initial creep compliance
of HDPE specimens, the creep deformation of HDPE specimens was six times higher than the
creep deformation of WPC specimens at the 30% creep stress level. Modeling results predicted
that the strain to failure in the HDPE lumber would occur in 1.5 years at 30% Fb flexural stress
while the predicted failure for the WPC would occur in 150 years. Chapter four has been
submitted to a peer-reviewed journal and is still under review.

33
The focus of chapter five is on an experimental study to the structural performance of the
connected structural components of the Aquapod cage structure (triangular panels) in buckling.
These panels were made from WPC lumber and HDPE lumber and their buckling evaluation was
discussed and compared, accordingly.
Finally, chapter six provides conclusions of the research that was conducted for this
dissertation. Potential areas of future research are also addressed.

34
CHAPTER 2
2 EXPERIMENTAL INVESTIGATION OF THE HYGROTHERMAL CREEP
STRAIN OF WOOD PLASTIC COMPOSITE LUMBER MADE FROM
THERMALLY MODIFIED WOOD
2.1 Abstract
The hygrothermal effect on the short-term creep behavior of extruded thermally modified
wood fiber high strength styrenic copolymer plastic composites (WPCs) was investigated on
specimens preconditioned for one month under water immersion (distilled and saltwater). These
specimens were then tested in the same conditions for short-term creep and creep-recovery
response using a submersible clamp. The short-term creep tests of WPC specimens (that are
immersed in water as a function of different temperatures) has not yet been reported in previous
studies. The objective of this study was to determine if the hygrothermal creep response of WPC
material evaluated through water immersion differs from the creep response published in the
literature for other environmental exposure conditions. The experiments included measuring 30
minutes of creep and 30 minutes of creep-recovery on the specimens immersed in saltwater and
distilled water at two different levels of flexural stresses (9% and 14% of the flexural strength)
and three temperature values (25, 35, and 45℃). The average creep strain recovery (%) of the
specimens was higher for the specimens immersed in saltwater during testing than the control
specimens. The WPC material is considered to have a potential use in structural applications in
environments where the temperature is below 45℃ because of the following factors: the low
deformation under the short-term sustained loading; the decrease in the deformation rate with
respect to the increase in load duration; maintaining the modulus of elasticity over a range of

35
temperatures from 25℃ to 45℃ under sustained load; and the ability to recover more than 69%
of the average creep strain under water immersion when the loading source is removed. The
creep strain fractional increment (CSFI) of the WPC in this study under all conditions was 13%
which is 86% lower than the CSFI of the WPCs reported in previous studies.
2.2 Introduction
The time-dependent behavior of WPCs, particularly creep, has been studied by many
researchers under the effect of temperature (Chang et al. 2014, Pooler & Smith 2004, Tamrakar
et al. 2011). To widen the structural application of WPCs to include, water immersion
applications (Alvarez-Valencia et al. 2010), the time-dependent behavior of WPCs under
hygrothermal exposure conditions should be investigated. Temperature (low or high) and
moisture (humidity or water immersion) can degrade or reduce the mechanical properties of the
constituents of the WPC composite, leading to changes in the composite itself. Wood swells
because of water uptake caused by the hydrophilic nature of the wood cell wall material. The
plastic constituent exhibits viscoelastic behavior and time-dependent changes in mechanical
properties produced by thermal effects. Both wood and plastic constituents under hygrothermal
effects will impact the mechanical properties of the WPCs. Microcracks in the interfacial zone
between the polymer and the wood flour particles can be created, and the adhesion between the
wood flour and the plastic will be negatively impacted (Klyosov 2007, Stark 2008).
Tamrakar and Lopez-Anido reported a significant decrease in the mechanical properties
of “water-saturated” specimens compared with dry specimens that were exposed to a range of
temperatures (Tamrakar & Lopez-Anido 2011). Cheng (Cheng 2005) reported the effect of
immersing a WPC sample in osmotic and sea water for 13 months, and found significant
decreases in the mechanical properties of the immersed WPC samples (Cheng 2005). Most

36
researchers have studied the time-dependent behavior of WPCs under the effect of temperature.
Kazemi et al. ( Kazemi et al. 2008) studied the effect of water content on creep behavior of
WPCs. Specimens were conditioned in water for 7 and 30 days, respectively, and then tested for
creep and creep-recovery ( Kazemi et al. 2008). Their study showed when the specimens were
conditioned under immersion for a longer duration, the resulting creep strain increased.
However, the moisture content of the specimens was not controlled during the tests, especially
when the creep and creep-recovery experiments were conducted at elevated temperatures. Recent
studies have investigated the combined effect of temperature and the moisture uptake on the
mechanical properties of wood flour-high density polyethylene (HDPE) composites (Fortini &
Mazzanti 2018). In an attempt to widen the structural applications of WPC to include structures
where temperature and moisture are both acting on the WPC, Fortini and Mazzanti (Fortini &
Mazzanti 2018) investigated the combined effect of temperature and the moisture uptake on
reducing the mechanical properties of the WPC. Their study included investigating the reduction
in the mechanical properties related to the combined effect of temperature and moisture via a
Charpy impact test with a load duration less than five seconds. Fortini and Mazzanti did not
investigate the combined effect of temperature and moisture on longer duration tests under
sustained loads.
Dynamic mechanical thermal analysis (DMTA) instruments and techniques have helped
researchers conduct a variety of short-term experiments to predict or evaluate the time-dependent
behavior of WPC specimens in a short period of time. This is done to provide a better
understanding of the time-dependent behavior of the material over a longer period.
Bases on researcher interests towards the enhancement of the mechanical properties of
wood particles for WPC manufacture (Chang et al. 2009, Esteves & Pereira 2008), different

37
modification methods have been studied. Wood heat-thermal treatment was determined to be one
of the treating processes that improves the mechanical properties of the wood particles related to
the elimination of the hemicellulose, which is the main component for reducing the mechanical
properties of wood particles (Esteves & Pereira 2008). Thermal modification also enhances the
compatibility between the wood particles and the polymer matrix and increases interfacial
bonding (Hosseinaei et al. 2012). The objective of the research presented here was to
experimentally investigate the hygrothermal average (avg.) creep strain and recovery of an
extruded WPC material made from thermally modified wood evaluated under water immersion
and compare it with the creep response published in the literature for other exposure conditions.
2.3 Experimental Program
In this study, a DMTA instrument with a 3-point bending submersible clamp was used to
conduct short-term creep and creep-recovery experiments under the synergistic effects of water
immersion and temperature. These results were compared with those of the dry reference state
of the specimens. WPC materials exhibit distinctive time-dependent behavior related to their
different formulations (i.e., different type of plastic and different types and quantity of the wood
flour). The WPC material used in this study is being considered for application in aquaculture
cages that are submerged marine structures (Gardner 2015), and hence, an understanding and
investigation of the time-dependent avg. creep strain of this material under the effect of water
immersion and temperature is essential.
2.4 Material Preparation
2.4.1 Extruded WPC Material
The WPC specimens with dimensions (L, w, h), 15.0 mm, 7.2 mm ± 0.2mm, 2.7 mm ±
0.2mm (uncertainty in the measurement of the dimensions was reported by computing the

38
standard deviation of 190 specimens) were cut and machined from extruded wood plastic
composite lumber with a cross section shown in Figure 2.1, to conduct the DMTA analysis
(creep and creep-recovery experimentation). A 3-point bending submersible clamp was used in
these experiments (Figure 2.2). This clamp has the ability to conduct bending tests on a specimen
submerged in a fluid environment for temperatures between 20 and 80 . The WPC lumber
cross section (Figure 2.1) was produced using a twin-screw Davis-Standard WoodtruderTM in the
Advanced Structures and Composites Center at the University of Maine’s Orono campus (Davis-
Standard Woodtruder 2018). The WPC examined here is based on a patent-pending formulation
that combines a thermally modified wood flour that was produced at a sawmill in Uimaharju,
Finland and a high strength styrenic copolymer system in an equivalent weight ratio to each of
the two constituents.
Figure 2.1. WPC cross-section with the highlighted regions where DMTA samples were cut
and machined in the longitudinal direction.

39
Figure 2.2. Schematic of the DMTA submersible 3-point bending clamp used in the
DMTA experiments of WPC specimens with a total specimen span between the
supports (L) of 15mm and a thickness (h) of 2.7mm.
2.5 Elastic Modulus and Material Density
The mean modulus of elasticity (three specimens) of the cut and machined WPC
specimens was computed for the specimens tested in 3-point bending using two different
instruments (non-destructive and destructive): the initial compliance of the creep test that was
conducted on the WPC specimens using the DMTA instrument; the other WPC specimens were
tested using an Instron dual column tabletop electromechanical (10 kN load cell and in strain
control testing). This was done in accordance with ASTM D790 (ASTM) by a linear regression
to the linear region (from 10% to 40%) of the flexural load versus the midspan deflection. A
density evaluation along the thickness was performed using a QMS density profiler model QDP-
01X for ten WPC specimens with the dimensions (length, width, thickness) 51.6 mm, 50.4 mm,

40
and 33.5 mm to determine the density variation between the surface layer of the WPC lumber
and the region in Figure 2.1 where the WPC specimens were cut and machined to be used in
DMTA experiments. The mean of the modulus of elasticity (E) from the 3-point bending tests in
accordance with ASTM D790, and the WPC density are reported in Table 2.1.
Table 2.1. Mean true modulus of elasticity of WPC specimens obtained from 3-point bending
tests and the mean of the density of the WPC lumber.
E (GPa) 4±0.45
Density of the WPC lumber (kg/m3) 719±9
2.6 The Relationship Between the Modulus of Elasticity (Apparent) and the Length of
The WPC Specimen
To investigate the effect of span length on the variation in the modulus of elasticity, a
typical flexural load-midspan deflection relationship was obtained for three WPC specimens
with different span lengths, and an analysis of variance was performed for the computed
modulus of elasticity and the span length, as shown in Figure 2.3. The flexural load-midspan
deflection tests were performed to failure for the specimens with a span of 61.9 mm. For the
specimens with spans of 50.0 mm and 15.0 mm, the maximum flexural load of the DMTA
instrument did not exceed the linear region of the tested WPC specimens.
2.7 Specimen Conditioning
One goal of the study was to compare the hygrothermal avg. creep strain of the WPC
material in saltwater and distilled water. Instant Ocean® (Ocean®) mix was added to distilled
water to make the saltwater for the conditioning and the testing of WPC specimens. 0.14 kg of
41
the Instant Ocean® powder was added and mixed with a 3.79 L of distilled water to make the
saltwater.
According to the procedure recommended by ASTM D570 (ASTM), the mean of the
water uptake (with standard deviation for five specimens at each time the water uptake was
measured) was computed and reported as shown in Figure 2.4. Prior to the water absorption
process to be conducted, the WPC specimens were dried in an oven at 50℃ for 24 hours.
Thereafter, the specimens were immersed in both distilled water and saltwater for one month and
the measurement was conducted at each condition (distilled water and saltwater) at one day, one
week, two weeks, three weeks, and four weeks, respectively. The specimens were then removed
from the water vertically to drain the water from the specimen wiped off using a piece of cotton
fabric, and each were weighed. During the preconditioning time (30 days), the WPC did not
appear to produce any leachate in the absorption container.
The surface layer of the extruded WPC lumber encapsulates the wood particles with
polymer that hinders water uptake by creating a skin layer of polymer at the contact perimeter of
the WPC lumber during the extrusion process (6). In this study, however, WPC specimens were
produced without a skin layer by machining (using a milling machine with a special blade for
cutting plastic-based materials affixed to the head of the milling machine with 150 rpm a rotating
speed of the blade) samples far from the surface of the boards. This exposed more wood particles
to water during the DMTA tests. In addition, the development of the microcracks on the
machined surface of the WPC specimen could also contribute to an increase in water uptake.

42
2.8 Calculations of the Maximum Flexural Stress Levels
The 3-point bending tests were performed according to ASTM D790 using the Instron
electromechanical testing machine. The displacement control method of testing was used with an
average strain rate (1.6 mm/min 0.2 mm/min) (ASTM) was applied during the flexural test of
the five tested WPC specimens. Prior to the testing, the five specimens with dimensions (L =
59.7 mm 0.4 mm, w = 7.3 mm 0.3 mm, h = 3.7 mm 0.4 mm) were oven-dried at 50
for 24 hours (ASTM).
2.9 Dynamic Mechanical Thermal Analysis (DMTA)
Two methods, storage modulus and heat deflection temperature, were used to determine
the glassy region of the material behavior by locating the onset of the glassy region by locating
the glass transition temperature (Tg) at the onset of the change in the storage modulus curve (E’),
as shown in Figure 2.5 (a). A similar approach was used to determine the heat deflection
temperature (HDT) by locating the onset of the change in the load-midspan deflection
relationship of the specimen in the flexural test, as shown in Figure 2.5 (b). DMTA was carried
out using a TA Instruments DMTA Q800 and the 3-point bending submersible clamp to
determine the storage modulus (E’) and tan δ of the WPC at three conditions: dry; submerged in
distilled water; and submerged in saltwater (ASTM, Herzog et al. 2005). Two lines (TA, TB)
were constructed by performing a linear regression of the curve at the regions, before and after
the change in the curve of storage modulus and the midspan deflection, respectively. The
calculation of Tg and HDT was based on the intersection of TA and TB. Specimens with
dimensions 15.0 mm ± 0.0 mm, 7.2 mm ± 0.2 mm, 2.7 mm ± 0.2 mm (the uncertainty in
measurement of the WPC specimen dimensions was reported based on the computation of
standard deviation of 190 WPC specimens) were tested in 3-point bending at 1 Hz frequency and

43
with 0.01% constant strain amplitude. Tests were conducted over a range of temperature from
25 to 80 , and at a scanning rate of 3 /min.
The specimens were tested in a fluid environment with a 6:1 span to depth ratio (L/h) (
TA instruments) and the maximum flexural creep stress and the maximum avg. flexural creep
strain were computed and reported accordingly.
2.10 Strain and Strain Recovery
Creep and creep-recovery experiments were performed using the DMTA instrument
model Q800 and using the 3-point bending submersible clamp. A thermocouple extension on the
clamp measured the water temperature at 1mm distance from the WPC specimen (Figure 2.2).
Two different stress levels and three temperatures were used during the experiments and five
replicates for each test were considered. To avoid exceeding 50% of the maximum capacity of
the applied load (18 N) of the DMTA instrument and to keep the maximum applied flexural
stress in the linear region, the stress levels were 9.2 %, and 13.8% of the maximum flexural
strength. Ten minutes of soaking time, prior to the creep and creep-recovery experiment, were
followed by 30-minutes creep and 30-minutes recovery.
2.11 Discussion of Results
2.11.1 Hygrothermal Effect on Glass Transition Temperature and Modulus Of Elasticity
of WPC.
The moisture content of each specimen was determined with respect to the oven dry
weight of the specimens (dry weight). Figure 2.4 shows the water uptake of the WPC specimens
during the month of conditioning. Tg and HDT of the three conditions (dry, saltwater, and
distilled water) were determined as shown and reported in Figures 2.6 (a and b) and Table 2, and

44
their values are (44, 38, 41 ) and (44, 45, and 40 ), respectively. The determination of Tg and
HDT for the dry and the distilled water immersed samples showed similar values for all the three
conditions (ca. 40 and 44 , respectively), except for the saltwater condition where HDT was
17% higher than Tg. This difference can be related to the effect of the cross-linking (Chakraverty
et al. 2015) of the polymer and its effect on the segmental relaxation, which reduces the free
volume and increases the HDT, and is believed to occur during the extrusion process of the WPC
(11, 24). Since two regions (Figure 2.1) in the cross section of WPC lumber were selected to
produce specimens for DMTA, this difference in regions for the specimens can lead into a
difference in their storage modulus (modulus of elasticity) produced by the change in the density
across the thickness of WPC lumber (Figure 2.6) (23). This is the reason of having the initial
values of storage modulus of the specimens tested in water immersion (distilled and saltwater) to
be relatively higher than the value of storage modulus in dry conditions (varied from 1.59 to 0.81
GPa). In conclusion, the determination of both Tg and HDT has enabled locating a region for the
range of temperatures between 25 and 45 where the WPC material has the ability to carry
loads.
The Tg and E’ of the WPC material decreased because of hygrothermal effects. The
glassy region for temperatures below Tg represents the region where the WPC material has
rigidity and can be effectively used in structural applications (Mark 2007). The hygrothermal
effect tends to decrease the glassy region extent by decreasing the value of the Tg. Furthermore,
E’ experiences a decrease in its value in this region. This reduction is explained by the motion in
the molecules of plastics accompanied with the onset of transition from a glassy to the rubbery
region. Furthermore, this reduction in Tg and E’ can be related to weakening the interfacial bond
between the wood particles and the plastics of the WPC, when that molecular transition takes

45
place . This study showed that the water uptake of the WPC immersed in saltwater is faster than
the water uptake of the WPC immersed in distilled water, and according to Chakraverty
(Chakraverty et al. 2015), this fast rate can be related to the ionic interaction that might occur
between the dissolved salt and the available hydroxyl groups on the thermally modified wood.
However, this rate of water uptake decreased during the immersion time from (56% to 6% to
2%) for the periods 1, 7, and 14 days, respectively, until reaching a constant rate at 21 days, as
shown in Figure 2.4. It is known that wood particles are the source of the water uptake in WPC
(Lenth & Kamke 2007), but in this study, the thermally modified wood of the WPC is less water
absorbent because of the reduction in hydroxyl groups resulting from heat treatment . The
finding in this study conflicts with what other researchers have reported that more tap water is
absorbed in WPC than saltwater, Nonetheless, Kazemi-Najafi (Kazemi & Kordkheili 2011) in
his study, showed that the type of water has a significant effect on the degree of uptake of WPC
(i.e. WPCs absorb more moisture in saltwater than in distilled water). Kazemi-Najafi correlated
the increase in the water uptake produced by the increase in the density of the saltwater
compared with the distilled water, and to the existence of the metallic ions in the saltwater (sea
water) and their ability to sediment on the wood flour and hence, increase the water uptake of the
WPC. Thus, the glassy region of the WPC material immersed in saltwater is narrower than the
glassy region of the dry WPC material and WPC material immersed in distilled water, as shown
in Figure 2.5, respectively. However, the amorphous polymer used in the WPC of this study,
showed a significant plateau that indicates the material maintains the storage modulus (E’) as
shown in the region A of Figure 2.5 (a and b). This response is dependent on the cross-link
density, or on the well-developed interfacial bonding between the modified wood particles and
the polymer matrix in the region below the Tg . However, this feature contradicts with the

46
behavior of the conventional WPCs in the previous studies using semi-crystalline polymers.
Therefore, this study suggests that the WPC can be used in structural applications over a range of
temperatures below the Tg.
Table 2.2. Glass transition temperature and heat deflection temperature of WPC under three
different testing conditions: dry, saltwater and distilled water.
Condition of tested
specimens
Tg from storage modulus-
temperature relationship
(℃)
HDT from mid-span
deflection- temperature
relationship(℃)
Dry (D) 44 ± 1 44 ± 2
Saltwater (SW) 38± 2 45 ± 2
Distilled water (DW) 41± 1 40 ± 1
The mean modulus of elasticity (E) was normalized with respect to the modulus of
elasticity of the WPC specimens (with span of 15 mm) at 25°C. This modulus of elasticity was
computed from the initial compliance (reciprocal of the initial compliance) of the creep
experiments in dry (D) condition at 25°C temperature to be 1.4 GPa which is 35% of the true
modulus of elasticity (4 GPa) obtained from the WPC specimens with a span of 59.7 mm in
accordance with ASTM D790. This reduction in the modulus of elasticity can be related to either
the variation in density between the cut and machined specimens and their location from the top
surface of the WPC lumber (i.e. the closer the WPC specimen to the surface layer, the higher the
E value), or to the effect of the span to depth ratio (L/h) and the development of shear
deformation. A density evaluation across the thickness of the WPC lumber was performed using
47
a QMS density profiler model QDP-01X, to indicate the reduction in the modulus of elasticity as
a function in the reduction in the density, along the thickness of the WPC lumber. Pavel, et.al
(Pavel et al. 2015) correlated the relationship between the modulus of elasticity and the density
of the material via the specific modulus. The higher the specific density, the higher modulus of
elasticity is indicated. Nonetheless, a 2.6% reduction in the density of the WPC lumber between
the density of the surface layer and the core layer of the WPC lumber as shown in Figure 2.6 was
not considered the primary cause for the reduction in the modulus of elasticity in this study.
Mehndiratta et al. (Mehndiratta et al. 2018) reported an approximately 42% reduction in the
flexural modulus of bi-directional glass fiber reinforced polymer laminate when the span
increased from 32 mm to 65 mm for specimens tested in 3-point bending. Garoushi et al.
(Garoushi et al. 2012) conducted 3-point bending tests on short fiber reinforced composite resin
specimens at six different span lengths: 20 mm; 15 mm; 10 mm; 7 mm; 6 mm; and 5 mm.
Danawade et al. (Danawade et al. 2014) conducted a study to investigate the effect of span to
depth ratio on the obtained value of modulus of elasticity of wood-filled steel tubes. Four
different values of L/h were investigated; 7.09, 14.17, 13.98, and 27.95. The modulus of
elasticity was computed in these four different values of L/h for the; wood beams, the hollow
section rectangular steel tube beams, and the wood filled steel tube beams. Danawade et al.
(Danawade et al., 2014) found that the value of the modulus of elasticity was high when the L/h
values were 27.95 and 13.98 for all the three tested beams. Danawade et al. (Danawade et al.,
2014) findings agreed with the recommended L/h by ASTM. Thus, the modulus of elasticity can
be obtained from the specimens that meet the recommended L/h by ASTM even if the shear
deformation is ignored.

48
The true modulus of elasticity ( (shear free modulus of elasticity) is a material
independent property and it should not be considered as a function of the total beam span
between the supports (L), or the L/h ratio (Berube, Lopez-Anido, & Goupee, 2016, Davids et al.,
2017). However, in accordance with ASTM D790, ASTM D2915, ASTM D6109 the shear
deformation can be ignored in the computation of the modulus of elasticity and the resulting
modulus of elasticity can represent the material independent property for the specimens with
large span to depth ratio (L/h ≥ 16)(Danawade et al. 2014, Gibson 2016). Equation 2.1 can be
used to compute the apparent modulus of elasticity when the shear deformation is ignored and
can be used for specimens with L/h greater than or equal to 16. Nevertheless, Equation 2.1 does
not consider the shear deformation in the computation of the modulus of elasticity. To include
the shear deformation ( s) and the flexural deformation ( f) in the computation of the modulus
of elasticity, Equation 2.2 (ASTM), Instruments 2018, Timoshenko & Goodier 1951) can be
used, but the values of (E/G) are difficult to obtain (Ferdous et al. 2016). According to Carlsson
and Pipes (Carlsson et al. 2002), the true modulus (E) of elasticity in the value of E/G is not
known, hence, it can be replaced by the tensile modulus and used in the value of E/G. Carlsson
and Pipes (Carlsson et al., 2002) reported in their study the computed modulus of elasticity
(computed using Equation 2.2) had different values with respect to the values of L/h (from
L/h=20 to L/h=120). In DMTA experiments, it is recommended to account for the shear
deformation when the L/h is smaller than 10 (Instruments, 2018). However, with the assumption
of the WPC as an isotropic and linearly elastic material, the E/G value can be replaced by an
expression that contains Poisson’s ratio (ν) (Dura 2005, Hamel et al. 2014, TA Instruments,
Storage et al. 2013).

49
Since this study did not conduct experiments to compute the true modulus (shear free
modulus) or the shear modulus (G), the “standardized value”(ASTM) [the value of the modulus
of elasticity obtained using Eq.1 for the long span in this study (59.7mm)] of the modulus of
elasticity was computed using Equation 2.1, to be 4 GPa.
(2.1)
Where m is the slope of the tangent to the initial straight-line portion of the load-
deflection (P- ) curve, L, w, h are the dimensions of the specimen.
(2.2)
The authors recognize that three replicates is not sufficient to characterize the WPC
material (i.e., ASTM D790 suggests more than five specimens). In some studies (Balma 1999,
Chang 2011, Decew 2011, Fredriksson et al. 2007), three replicates have been used. For
instance, Decew (Decew 2011) conducted a test in accordance with ASTM D638 using three
replicates. For the purpose of illustrating that the reduction in modulus of elasticity in this study
is a function of the span length, three replicates of the relationship between the modulus of
elasticity and the span length were reported, as shown in Figure 2.3.

50
Figure 2.3. Typical flexural load versus midspan deflection for WPC specimens at
three different span lengths (15, 50, and 61.9 mm) and the ANOVA analysis of the
obtained modulus of elasticity E using Equation 2.1.

51
Figure 2.4. Mean of the water uptake of WPC in distilled water and saltwater.
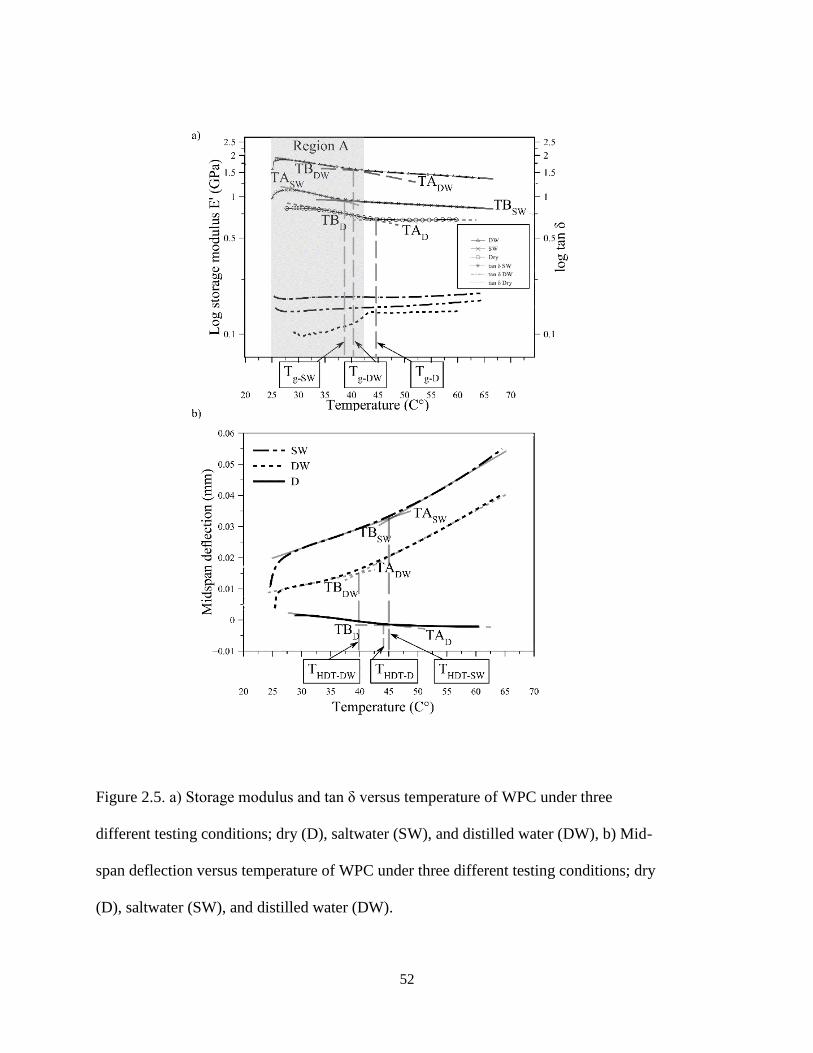
52
Figure 2.5. a) Storage modulus and tan δ versus temperature of WPC under three
different testing conditions; dry (D), saltwater (SW), and distilled water (DW), b) Mid-
span deflection versus temperature of WPC under three different testing conditions; dry
(D), saltwater (SW), and distilled water (DW).

53
Figure 2.6. Density profile of the WPC lumber.
Unlike polyolefin-based WPCs that have been reported in previous studies, the WPC
material in dry condition maintained the normalized value of the modulus of elasticity over the
range of temperatures examined (25, 35, and 45 °C) as shown in Figure 2.7. The rate of decrease
in normalized (E) for the specimens conditioned and tested in saltwater and distilled did not
exhibit a linear relationship and the rate of decrease for temperatures higher than 35°C was
smaller than the rate of decrease for the temperature below 35 °C as shown in Figure 2.7. This
low rate of decrease is related to the properties of the styrenic polymer comprising the WPC and

54
its ability to maintain modulus of elasticity (E) at elevated temperatures below the Tg. The
hygrothermal effect is attributed to the higher water uptake of the specimens tested in saltwater
compared with the specimens tested in distilled water, and the degradation-decrease in the
normalized (E) of the specimens in saltwater was higher than the degradation in the specimens
tested in distilled water. However, this degradation-reduction produced by saltwater immersion
was higher for the range of temperatures below 35℃, and the reduction was smaller than the
specimens tested in distilled water. This finding can be beneficial for the use of WPC in
aquaculture cages (totally submerged structures) in warmer ocean water (temperature below 45
°C).

55
Figure 2.7. Normalized (E) versus temperature at three different testing conditions; dry
(D), saltwater (SW), and distilled water (DW).
2.12 Average Creep Strain and Creep Strain-Recovery of WPC
Strain recovery is governed by the elastic behavior of the viscoelastic material, where the
unrecoverable strain is governed by the viscous behavior. For all the strain recovery data shown
in Table 2.3 and Figure 2.8, the tested WPC specimens under immersion conditions (distilled
water and saltwater) have shown higher strain recovery percentages when compared with the
WPC specimens tested in the dry condition. The immersion in distilled and saltwater increases
the recoverability of the viscous response to be greater than 2% for all the creep experiments
under the different hygrothermal environmental conditions and this is attributed to the water
uptake (i.e. the higher the water uptake, the higher the strain recovery), and this finding agreed
with the findings of Najafi when WPC with 70% wood flour was immersed in water for 30 days
56
showed higher creep displacement recovery than the WPC immersed in water for seven days.
Figure 2.9 illustrates the WPC 30 minutes creep and 30 minutes recovery under 3.75MPa of the
maximum applied flexural stress at three different values of temperature 25-45°C at three
different exposure conditions: dry (D); saltwater (SW); and distilled water (DW).
Since the WPC material maintains stiffness over the evaluated temperature range and
unlike the behavior of polyolefin-based WPCs that show a reduction in the modulus of elasticity
as the temperature increases. Further illustration of the maintained behavior of the creep
compliance of the WPC, instead of experiencing high deflection, the specimens exhibit less
deformation when the duration of the sustained load increases under an increase in the
temperature, as shown in the constructed “isochronous curves” in Figure 2.9. Isochronous curves
were constructed using the applied maximum flexural stress-strain relationship for the strains
(average creep strain) at times 5, 15, and 30 minutes and for two cases of conditioning and
testing (dry and saltwater) as shown in Figure 2.9 (a and b) (Gibson, 2016). However, for the
case of saltwater conditioning and testing, the stress strain relationship tends to be nonlinear
(unlike the linear relationship for the dry condition) at 35 and 45 °C. The WPC was studied using
30 minutes creep and 30 minutes creep recovery under two different levels of stresses and under
different hygrothermal conditions (three levels of temperatures and two types of water
immersion). For the 2.5 MPa level of stress (at 25, 35, and 45℃), the values of the 30-minute
creep strain for the WPC specimens conditioned and tested in saltwater were 12, 25, and 7%
higher than the avg. creep strain values of the WPC specimens conditioned and tested in distilled
water, whereas at the 3.75 MPa level of stress, the 30-minute creep strain value of the WPC
tested in saltwater was 8% higher than the avg. creep strain of the avg. creep strain of the
specimens in distilled water at 25 °C, and the avg. creep strain values of the specimens tested in

57
saltwater were 21 and 17% lower than the creep strain of the specimens tested in distilled water
at 35 and 45℃, respectively. The reason of having lower avg. creep strain for the WPC
specimens tested in saltwater at 3.75 MPa level of stress and at 35 and 45℃ than the specimens
tested in distilled water can be attributed to maintaining the modulus of elasticity of the WPC at
elevated temperatures under this level of stress.
Figure 2.8. Avg. creep strain and strain-recovery of the WPC specimens subjected to a
maximum flexural stress of 3.75 MPa at three different temperatures 25, 35, and 45℃
and under three testing conditions (D, SW, and DW).

58
Table 2.3. Maximum avg. flexural creep strain and strain recovery of WPC in the three different;
conditions, values of temperature, and two levels of maximum flexural stress.
Condition
D=Dry
SW=Saltwater
DW=Distilled
Water
Applied
Maximum
Flexural
Stress (MPa)
Temperature
(°C)
Maximum
avg. Creep
Strain (%)
Strain
Recovery±
standard
deviation (%)
D
SW
DW 2.5 25
0.20 72±4
0.48 84±5
0.43 78±3
D
SW
DW
2.5 35
0.27 67±3
0.66 72±6
0.53 76±5
D
SW
DW
2.5 45
0.24 65±5
0.75 70±5
0.70 77±3
D
SW
DW
3.75 25
0.32 66±8
0.53 80±7
0.49 83±6
D
SW
DW
3.75 35
0.41 74±3
0.62 75±5
0.75 75±6
D
SW 3.75 45
0.39 70±5
0.69 76±2

59
DW 0.81 73±5

60
Figure 2.9.Isochronous stress-strain curves: a) WPC specimens in the dry condition, b)
WPC specimens conditioned and tested in saltwater.

61
2.13 Comparison of the WPC Time-Dependent Behavior (Creep Strain) with Previous
Studies
The WPC materials in the literature were made with different formulations, for instance,
untreated pine wood flour particles, and polypropylene as a plastic, or pine wood flour with HDPE
plastic. To quantify the performance of the thermally modified WPC in avg. creep strain with other
formulations in terms of creep behavior, creep strain fractional increment (CSFI) values were
computed for the purpose of comparison as shown in Equation 2.3. For further illustration and
comparison purposes, a 250-minute creep experiment was conducted at the three conditions under
2.5 MPa of the maximum flexural stress and at 45℃ temperature.
(2.3)
It can be concluded from the comparison results reported in Table 4 that the WPC in
this study has a lower increase in avg. creep strain for all the conditions; dry, saltwater,
distilled water. Even though previous studies did not test the WPC in an immersed
environment over a range of temperatures, this study showed lower CSFI for specimens
conditioned and tested in distilled water compared with the finding by. Dry specimens
showed very low time-dependent deformation for specimens tested for 250 minutes. The
reason of this enhancement in the low time-dependent deformation of the WPC can be
related to the thermal treatment of the wood flour and its contribution to increasing the
modulus of elasticity of the wood wall cells, and to the enhanced interfacial bonding between
the wood particles and the polymer. This enhanced time-dependent behavior enables the
material to be used in structural applications especially when low levels of stress are applied.

62
Furthermore, the material has potential to be used in marine applications where the material
is immersed in warm tropical waters for instance; the Gulf of California, Mexico, the Pacific
Islands, South Padre Island TX (Buoy 42003), San Juan P.R. (Atlantic Site), Virginia Key,
FL, Key West FL, and Hawaiian Island Coast (Commerce 2018).
Table 2.4. Comparison of WPC creep behavior with previous studies.
Source Loading
stress
Duratio
n (s)
Applied
stress (MPa)
Condition of testing
or specimen
conditioning
CSFI
This paper Flexural
1800 3.75
D@ 25℃
DW@ 25℃
SW@ 25℃
D@ 45℃
DW@ 45℃
SW@ 45℃
29%
34%
27%
40%
51%
48%
15000 2.5 MPa
Dry@ 45℃
DW@ 45℃
SW@ 45℃
37%
10%
80%
Kazemi et
al. Flexural 1800 ca 4.2
7 days immersion 58%
30 days immersion 58%
Chang Flexural 600 5 D @ 45℃ 95%
63
2.14 Conclusions
1. The creep strain fractional increment (CSFI) of the WPC specimens conditioned at the
highest level of temperature and under water immersion was 13% which is 86% lower than the
CSFI of the preconditioned and dry specimens reported in previous studies. The WPC material in
this study maintained (E) at elevated temperatures and exhibited relatively low time-dependent
deformation compared with polyolefinic WPC materials from the literature, most-likely
attributed to its strong interfacial bond between the wood and polymer.
2. Since water immersion has an ability to mitigate the effect of temperature on the viscous
behavior of the viscoelastic WPC, the ability to recover the deformation after the loading source
was removed was high for the specimens under the synergistic effect of temperature and
immersion, compared with the deformation recovery of the same material under just the
temperature effect. That indicates in addition to the deformation recovery attributed to the elastic
behavior, a recovery to the viscous part of the viscoelastic WPC occurred.
3. According to the low variation in density along the thickness of the WPC lumber, it is
believed that this material has a unique formulation, hence it has enhanced modulus of elasticity
by maintaining E at higher temperatures over the range of temperatures below Tg, related to the
developed interfacial bonding between the wood particles and the polymer matrix. Furthermore,
the low variation in density suggests good dispersion of the wood flour throughout the thickness
of the WPC lumber and uniform structure of the composite.

64
CHAPTER 3
3 MODELING THE HYGROTHERMAL CREEP BEHAVIOR OF WOOD PLASTIC
COMPOSITE (WPC) LUMBER MADE FROM THERMALLY MODIFIED WOOD
3.1 Abstract
The viscoelastic behavior of an extruded wood plastic composite (WPC) made from
thermally modified wood under hygrothermal treatment was studied and modeled. Multiple 3-
point bending creep/recovery tests were carried out using a dynamic mechanical thermal
analyzer (DMTA) equipped with a submersible clamp. WPC specimens with 15 mm span were
subjected to two initial applied stresses; 9 and 14% of the flexural strength in 30 minutes of
creep and 30 minutes of creep recovery under the combined effects of temperature (25, 35, 45 )
and water immersion (saltwater and distilled water). A dry condition WPC control was used to
compare the hygrothermal effects with respect to the control conditions. The WPC material in
this paper exhibited a linear viscoelastic behavior under the effect of temperature, whereas, a
nonlinear viscoelastic behavior was observed under immersion conditions. A power law model is
considered a useful model to describe the creep behavior of WPC specimens with a 15mm span
in the control and the saltwater conditions and at 45℃. A power law model was used to describe
180-day creep deflection of WPC lumber beams with a 853 mm span subjected to 12 MPa of the
flexural strength in 4-point bending at 50% RH and at 21 . The power law model predicts that
the WPC lumber will reach a flexural strain in outer fiber of 1% in approximately 150 years.
3.2 Introduction
Wood plastic composites, unlike elastic materials, exhibit viscoelastic behavior. Gibson
(Gibson, 2016) reported that thermoplastic composites in general, exhibit a linear viscoelastic

65
behavior, and that can be represented as a physical model; for instance, spring-dashpot in a series
arrangement. The spring represents the elastic behavior (i.e., following Hooke’s law) of
thermoplastic composites, whereas the dashpot represents the “Newtonian fluid” viscosity.
However, other researchers (Pooler & Smith 2016) reported that WPC materials exhibit
nonlinear viscoelastic behavior that can be related to the effect of the filler (i.e., the wood flour).
Barbero (Barbero 2013) distinguished between the linear and the nonlinear viscoelasticity
behavior of viscoelastic materials via the stress dependency of the models’ parameters.
To better understand the viscoelastic behavior of WPCs, different models have been
proposed in the literature; Maxwell, power law, generalized Burger’s, standard linear solid,
standard nonlinear solid, Maxwell-Kelvin, linear solid Zener, and improved Zener (a.k.a. Prony
Series) models. The time-dependent viscoelastic behavior of the material based on these models
is governed either by an empirical (mathematical) equation similar to the power law model, or by
the number of the spring and dashpot elements in the model (physical model), and on the
arrangement of these elements (parallel or in series) (Barbero 2013; Gibson 2016; Nuñez et al.
2004; Tajvidi & Simon 2015). Certain models can describe the short-term time-dependent
behavior of the viscoelastic material, whereas, other models can describe the long-term time
dependent behavior of viscoelastic materials.
Dynamic mechanical thermal analysis (DMTA) instruments and techniques have helped
researchers to conduct a variety of short-term experiments, to predict or evaluate the time-
dependent behavior of wood plastic composite (WPC) specimens in a short period of time, and
hence, to provide a better understanding of the time-dependent behavior of the material over a
longer period of time. Tamrakar et al.(Tamrakar et al. 2011) applied a generalized Burger’s
model to describe the strain of WPC and polyvinyl chloride (PVC) specimens under a short-term

66
(100 min.) tensile creep test. Pooler (Pooler 2001) used a power law and Prony Series models to
describe the 10 min. and 600 min. creep behavior of WPCs. Xu et al (Xu et al. 2001)
implemented a three parameter power law model to investigate the creep behavior of wood filled
polystyrene/high-density polyethylene. Slaughter used a three parameter power law model to
describe the creep behavior of wood polypropylene plastic composites(Slaughter 2006). Hamel
(Hamel et al. 2011) implemented a two parameter power law model on WPC for seven different
formulations in axial creep experiments.
WPC flexural creep experiments have not been implemented solely for short-term (below
24 hours) behavior using small specimens (DMTA specimens that has the span ≤ 50 mm), but
also long-term (> 24 hrs.) creep implemented on large-scale specimens (WPC specimens have
spans >100 times the size of DMTA specimens) (Alvarez-Valencia et al. 2010). For instance,
Brandt and Fridley (Brandt & Fridley 2003) conducted 90-day creep experiments on specimens
with span length of 1830 mm in flexure. Likewise, Hamel (Hamel et al. 2011) conducted creep
experiments for three years in compression, tension on specimens with gage lengths of 12.7 and
57.1 mm, respectively. Hamel (Hamel et al. 2011), further predicted the creep behavior of WPC
in flexure for 90 days for WPC specimens with a span of 2130 mm.
The objective of the research presented here was to characterize the hygrothermal creep
response of a WPC material evaluated under water immersion and compare it with the creep
responses (displacements) published in the literature for other exposure conditions.
In this study, a DMTA instrument with a 3-point bending submersible clamp was used to
conduct short-term creep and creep-recovery experiments under the combined effects of water
immersion and temperature on preconditioned WPC specimens with a 15 mm span, and to

67
compare that with the control (reference) dry state of the specimens. The WPC materials exhibit
different time-dependent behavior, attributable to their different formulations (i.e. different type
of plastics and different types and quantity of wood flour). A further description on the creep
behavior of the WPCs was conducted by using 250-minute and 180-day creep experiments using
power law models. The WPC material used in this study has potential for application in
submerged marine structures (Gardner & Han 2010), and hence, an understanding and
investigation of the time-dependent behavior of this material under the effect of water immersion
and temperature is necessary.
3.3 Experimental
3.3.1 Materials and Equipment
3.3.1.1 30-Minute and 250-Minute Creep Experiments
WPC specimens with dimensions (L, w, h), 15.00 mm, 7.24 mm ± 0.18 mm, 2.69 mm ±
0.24 mm were cut and machined from extruded wood plastic composite lumber with width and
thickness equal to 139 and 34 mm, respectively. A dynamic mechanical thermal analyzer
(DMTA) (TA Q800) instrument was used to conduct the creep and creep recovery experiments.
A 3-point bending submersible clamp was used in these experiments as shown in Figure 3.1 a.
This clamp has the ability to conduct a 3-point bending test on a specimen submerged in a fluid
environment over a range of temperatures from room temperature (ca.20℃) to 80 . To ensure
the temperature measurement in the liquid environment is the specimen’s temperature, an
extended thermocouple in the liquid environment of the clamp was located at 1mm distance from
the tested specimen The WPC lumber was produced using a counter rotating twin screw Davis-
Standard WoodtruderTM in the Advanced Structures and Composites Center at the University of
Maine, Orono, Maine (USA) ("Davis-Standard Woodtruder" 2018).

68
3.3.1.2 180-day Creep Experiments
Five WPC lumber specimens with a span length of 853 mm, were loaded in a 180-day
creep experiment in 4-point bending, as shown in the schematic of Figure 3.1 b. The 180-day
experiment was conducted in the creep room at the Advanced Structures and Composites Center
at the University of Maine, Orono, Maine. The relative humidity (RH) and temperature were
controlled during the 180 days to be 50% ± 5%, and 21 ± 2 . The WPC examined here is
based on a patent-pending formulation that combines thermally modified wood flour that was
produced at Uimaharju sawmill in Finland with a high strength styrenic copolymer system in an
equivalent weight ratio to each of the two constituents. WPC specimens were preconditioned for
one month in both saltwater and distilled water.
3.3.2 Mechanical Testing
3.3.2.1 DMTA Creep Experiments
To obtain the flexural strength WPC used in the DMTA creep experiments (the cut and
machined specimens), 3-point bending tests were performed according to ASTM D790 using an
Instron dual column tabletop electromechanical testing machine. A 10 kN load cell was used in
displacement control method of testing with an average crosshead speed motion of 1.59 mm/min
0.17 mm/min (ASTM) was applied during the flexural tests of the five WPC specimens,
(ASTM). Prior to the testing, the five WPC specimens with dimensions (L, w, h) (59.68 mm
0.39 mm, 7.25 mm 0.25 mm, 3.73 mm 0.39 mm), were oven-dried at 50 for 24 hrs.
(ASTM).

69
Figure 3.1.a) 3-point bending DMTA submersible clamp, b) a schematic of the 180-
day creep experiment in 4-point bending.
The applied initial flexural stress levels of the WPC specimens in the DMTA experiments were
selected to be 9.20 %, and 13.8% of the ultimate flexural strength. This selection of the stress
levels was made based on the recommendation from previous studies; for instance, Hamel
(Hamel et al. 2011) recommended studying stress levels that are below 20% of the ultimate
stress. Thus, the stress levels in this study were selected to be below 15%. The average ultimate
flexural strength was 27.22 MPa ± 3.88 MPa with a coefficient of variation (COV) of 13% and
hence, the applied initial flexural stresses in the DMTA experiments were 2.5, and 3.75 MPa,
respectively. Three different temperatures (25, 35, and 45 ) were evaluated and five replicates
to each stress level were studied on the reference (dry) condition and the preconditioned WPC
specimens (one month immersion) in both distilled water and saltwater immersion, respectively.
Ten minutes of soaking time was applied prior to the DMTA flexural creep and creep-recovery
experiments.

70
3.3.2.2 180-day Creep Experiments
The 180-day creep experiments of the WPC lumber (with 853mm length) was conducted
in accordance with ASTM D6112, (ASTM). The applied initial flexural load [(P) as shown in
Figure 3.1 b] in the 180-day creep experiment was 2243.2 N± 15.2 N (12 MPa flexural stress). In
accordance with the loading rate mentioned in ASTM D6109, the maximum applied flexural
load was applied to the WPC specimen during the instantaneous loading phase (four minutes)
with a crosshead rate motion of 39.4 mm/min. This crosshead rate motion was computed using
the equation stated in the ASTM D6109 by considering a strain of 1% at the outer fiber. This
loading rate was similar to the quasi-static rate so that the instantaneous duration is maintained
within the short-time stated in the ASTM D6109 (not less than 10 sec. and not more than 10
min.).
3.4 Results and Discussion
3.4.1 Power Law Model
The relationship between the creep compliance of a material and the stress is shown in Equation
1. Furthermore; in accordance with the ASTM D6109, the creep displacement of the WPC
lumber in 4-point bending test was computed using Equation 2.
(3.2)
(3.3)
where S(t) is the creep compliance, is the creep strain, is the applied stress, d(t) is the
midspan creep deflection (vertical displacement), is the creep strain (mm/mm), l is the span
length, D is the depth (thickness) of the WPC lumber.

71
An empirical power law model was used to describe the creep compliance of the WPC in
dry, distilled water, and saltwater conditions. Prior to and during the creep test, both the distilled
water and saltwater immersion WPC specimens were subjected to flexural stresses and range of
temperatures in the immersed environment. The power law, as shown in Equation 3 ( Barbero
2013), is suggested for these experiments based on the assumption of the linear viscoelastic
behavior of the WPC specimens in this study (Gibson 2016). The initial value of the compliance
represents the reciprocal of the modulus of elasticity (E). The power law model was
implemented on the creep compliance vectors obtained from the 30-minute and 250-minute
creep experiments on WPC specimens tested in the DMTA submersible clamp. Parameters of the
model and the initial experimental compliance values are reported in Table 3.1-3.3.
(4.3)
where S(t) is the total creep compliance of the model, S0, S1, n represent the model’s parameters
that can be found from the experimental data fitting using a written code in Matlab ("MATLAB"
1994-2018), and t is the time of the creep experiment. Parameters of the model for each
condition (stress, temperature, and environmental condition) are reported in Table 3.1-3.3. In
addition to reporting the coefficient of determination (R2) that shows the degree of agreement
between the model and the experimental data, and to quantify the degree of the agreement
between the model and the experimental data to each condition, the summation of the square
error (SSE) vector was also reported in Table 3.1-3.3. Figure 3.2 illustrates the viscoelastic
linearity and nonlinearity of the WPC specimens used in this study, whereas, Figure 3.3 and 3.4
illustrate the combined effect of the high value of temperature in this study (45 ) and the water
immersion (saltwater and distilled water) on the creep compliance values of the 30-minute of

72
WPC specimens under the 2.5 and 3.75 MPa of the applied initial flexural stresses in logarithmic
scale. Table 3.1-3.3 show that the WPC specimens for the both selected initial flexural stress
levels exhibit a reduction in creep compliance at a temperature of 35 , compared with creep
compliance of the WPC specimens at 25 and 45 . This reduction in the creep compliance at
temperatures below the glass transition temperature (Tg) can be related to the developed
interfacial bonding between the amorphous polymer and the thermally modified wood particles
of the WPC of this study. A similar trend was noticed on the neat and sisal fibers reinforced
polystyrene composites that was studied by Manikandan et al. (Nair et al. 2001), when they
investigated the variation in the storage modulus with respect to temperature to polystyrene
reinforced with different percentages of sisal fibers. According to a study reported elsewhere
(Alrubaie et al. 2019) and according to the constituents of the WPCs used in this study, this
reduction in the creep compliance at 35° is related to the properties of the amorphous polymer of
the WPC and its ability to maintain modulus of elasticity (E) at elevated temperatures below the
Tg and that was observed in storage modulus versus temperature relationship.
3.4.2 The 30-Minute Creep of WPC
To investigate the viscoelastic behavior of the WPC, isochronous curves were
constructed at 5, 15, and 30 minutes to the two applied creep flexural stresses for the purpose of
evaluating whether the WPC exhibits a linear or nonlinear viscoelastic behavior and these
constructed isochronous curves were reported elsewhere ( Alrubaie et al.2019) and as shown in
Figure 3.2. Three conditions were selected for the purpose of illustration and comparison, the dry
(control) and the saltwater (SW) and the distilled water (DW) immersion conditions at 25°C. The
WPC specimens show a linear viscoelastic behavior under the dry condition and nonlinear
viscoelastic at the other immersion conditions. Isochronous curves at different immersion

73
conditions and at different values of temperature were reported elsewhere (Murtada Abass A.
Alrubaie et al., 2019).
Figure 3.2. Isochronous curves of the WPC specimens at the creep time; 5, 15, and 30 minutes
at the three different conditions; D, SW, and DW at 25°C.
A preliminary study was conducted to apply different models to describe the behavior of
WPC, and the power law model exhibited the lowest SSE among the other models examined. For
all the cases of the applied flexural stress and hygrothermal conditioning, two distinctive regions
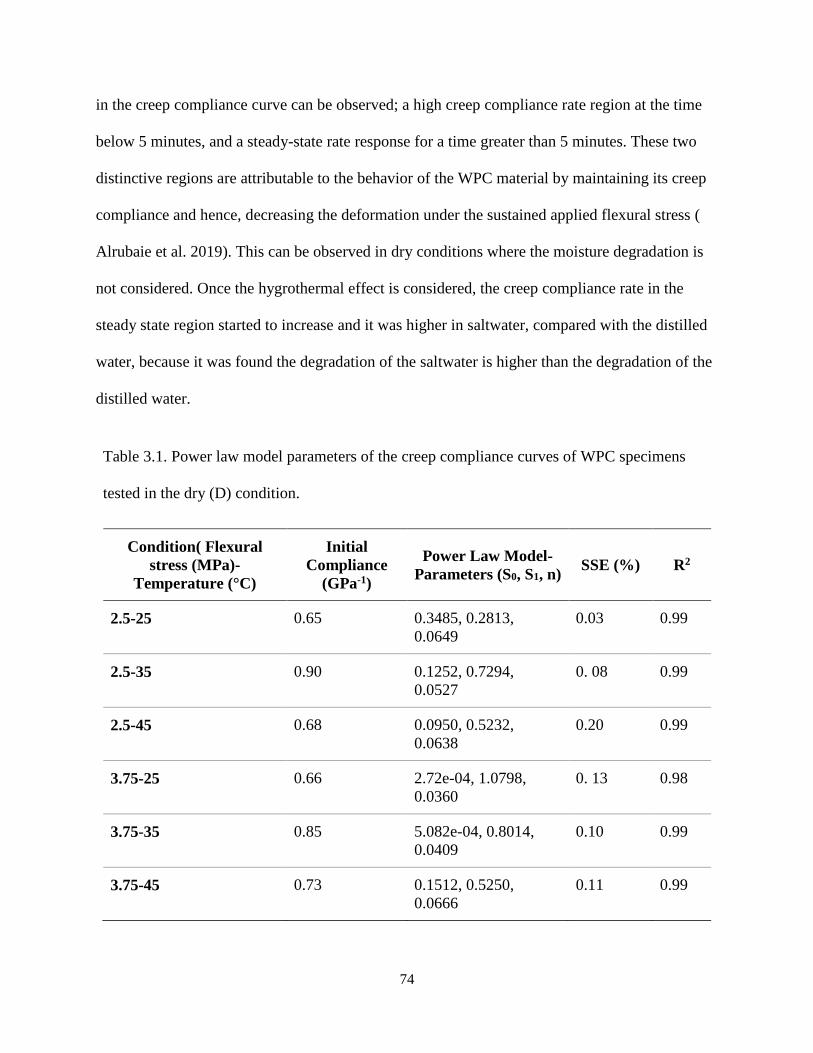
74
in the creep compliance curve can be observed; a high creep compliance rate region at the time
below 5 minutes, and a steady-state rate response for a time greater than 5 minutes. These two
distinctive regions are attributable to the behavior of the WPC material by maintaining its creep
compliance and hence, decreasing the deformation under the sustained applied flexural stress (
Alrubaie et al. 2019). This can be observed in dry conditions where the moisture degradation is
not considered. Once the hygrothermal effect is considered, the creep compliance rate in the
steady state region started to increase and it was higher in saltwater, compared with the distilled
water, because it was found the degradation of the saltwater is higher than the degradation of the
distilled water.
Table 3.1. Power law model parameters of the creep compliance curves of WPC specimens
tested in the dry (D) condition.
Condition( Flexural
stress (MPa)-
Temperature (°C)
Initial
Compliance
(GPa-1)
Power Law Model-
Parameters (S0, S1, n) SSE (%) R2
2.5-25 0.65 0.3485, 0.2813,
0.0649
0.03 0.99
2.5-35 0.90 0.1252, 0.7294,
0.0527
0. 08 0.99
2.5-45 0.68 0.0950, 0.5232,
0.0638
0.20 0.99
3.75-25 0.66 2.72e-04, 1.0798,
0.0360
0. 13 0.98
3.75-35 0.85 5.082e-04, 0.8014,
0.0409
0.10 0.99
3.75-45 0.73 0.1512, 0.5250,
0.0666
0.11 0.99

75
Table 3.2. Power law model parameters of the creep compliance curves of WPC specimens
conditioned and tested in saltwater (SW) condition.
Condition
(Flexural stress
(MPa)-
Temperature (°C))
Initial
Compliance
(GPa-1)
Power Law Model-
Parameters (S0, S1, n)
SSE (%)
R2
2.5-25 1.58 0.1111, 1.4370, 0.0316 0.29 0.98
2.5-35 1.89 0.0947, 1.6918, 0.0529 0.43 0.99
2.5-45 2.10 1.3114, 0.6977, 0.1162 0.63 0.99
3.75-25 1.11 0.0280, 0.5871, 0.0432 0. 16 0.98
3.75-35 1.33 7.239e-04, 1.2307, 0.0550 0. 17 0.99
3.75-45 1.24 0.8332, 0.3509, 0.1398 0. 28 0.99
Table 3.3. Power law model parameters of the creep compliance curves of WPC specimens
conditioned and tested in distilled water (DW) condition.
Condition
(Flexural stress
(MPa)-
Temperature (°C))
Initial
Compliance
(GPa-1)
Power Law Model-
Parameters (S0, S1, n) SSE (%) R2
2.5-25 1.42 0.1308, 1.2577, 0.0297 0.14 0.98
2.5-35 1.58 0.1178, 1.3859, 0.0481 0.24 0.99
2.5-45 1.90 0.0193, 1.7394, 0.0605 0.82 0.99
3.75-25 0.97 9.192e-04, 0.9389, 0.0446 0. 17 0.98
3.75-35 1.52 1.102e-04, 1.4215, 0.0597 0. 39 0.99
3.75-45 1.42 0.6509, 0.69, 0.1027 0.42 0.99

76
Figure 3.3. 30-minute creep compliance of WPC specimens (with 15 mm length) subjected to
a maximum flexural stress of 2.5 MPa at 45°C in three different testing conditions; dry (D),
saltwater (SW), and distilled water (DW) conditions.

77
Figure 3.4. 30-minute creep compliance of WPC specimens (with 15mm length) subjected to a
maximum flexural stress of 3.75 MPa at 45°C at three different testing conditions; D, DW, and
SW conditions.
3.5 Application of the Power Law Model: 250-Minutes Creep of WPC Specimen
To verify the power law model used in this study to describe the 30-minute creep
compliance of WPC specimens, a 250-minute creep experiment (stress = 2.5 MPa, and
temperature = 45℃) was conducted in dry and immersion environments (distilled water and
saltwater) using the DMTA submersible clamp. The power law model shows good agreement
with the experimental data at all three testing conditions; dry, distilled water, and saltwater, as
shown in Figure 3.5.

78
3.6 Application of the Power Law Model: 180-Day Creep Of WPC Lumber
For the purpose of evaluating the extension of the application of the power law model
from the short-term to include the long-term creep experiments, the power law model was used
to describe the 180-day creep behavior of WPC lumber with a span length 853mm, tested in
creep under a flexural load. The power law model showed good agreement with experimental
creep displacement data, as shown in Figure 3.6. According to ASTM D6109 (ASTM) and to the
Equation 2, the flexural yield strength is computed for the stress corresponding to 1% of the
Figure 3.5. 250-minute creep compliance values and models' data fitting of WPC
specimens under σ = 2.5MPa tested at 45℃ in D, DW, and SW conditions.

79
flexural strain. Thus, in this study, a prediction of the creep displacement of the WPC lumber is
presented using the power law model. Based on the assumption that the WPC should fail at a
flexural strain in outer fiber of 1%, (similar to the failure strain value mentioned in ASTM
D6109), the computed midspan creep deflection will be 44.9 mm. The WPC lumber in this study
will reach this creep mid-span deflection under a sustained flexural stress (11.8 MPa ± 0.08
MPa) after approximately 150 years, as shown in Figure 3.7.
Figure 3.6. 180-day creep displacement of WPC specimens under 2243 N± 15.20 N of applied
flexural load in a four-point bending test configuration.
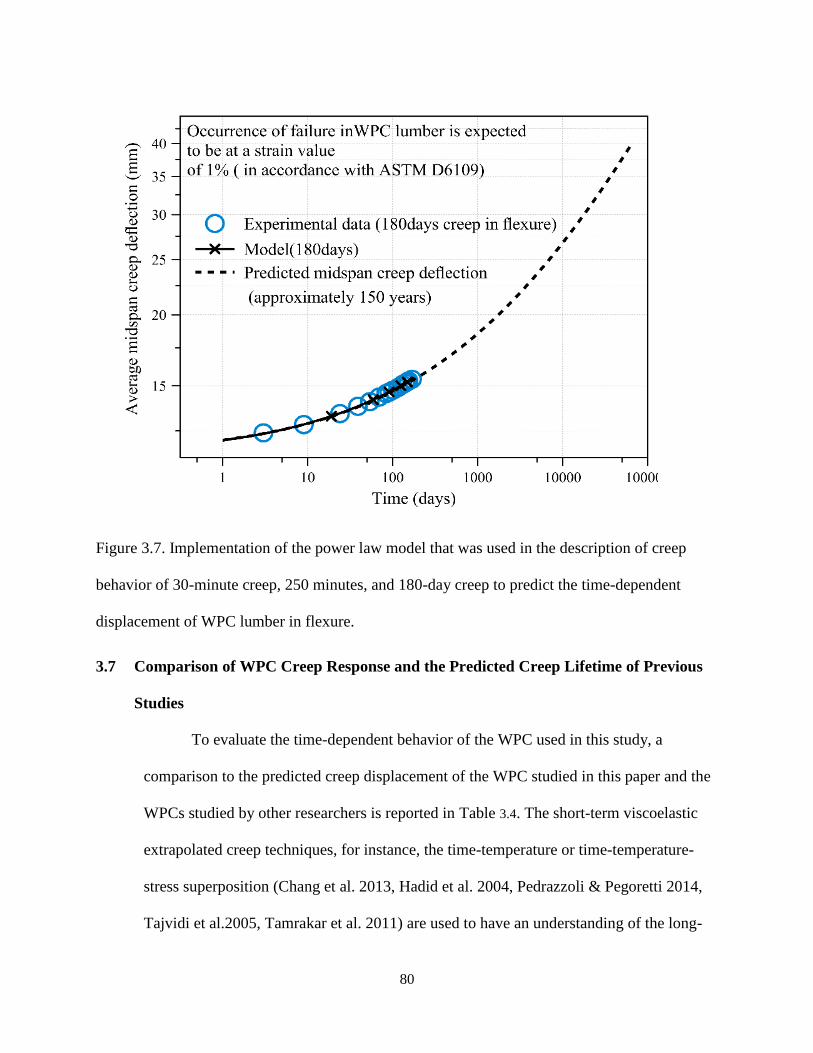
80
Figure 3.7. Implementation of the power law model that was used in the description of creep
behavior of 30-minute creep, 250 minutes, and 180-day creep to predict the time-dependent
displacement of WPC lumber in flexure.
3.7 Comparison of WPC Creep Response and the Predicted Creep Lifetime of Previous
Studies
To evaluate the time-dependent behavior of the WPC used in this study, a
comparison to the predicted creep displacement of the WPC studied in this paper and the
WPCs studied by other researchers is reported in Table 3.4. The short-term viscoelastic
extrapolated creep techniques, for instance, the time-temperature or time-temperature-
stress superposition (Chang et al. 2013, Hadid et al. 2004, Pedrazzoli & Pegoretti 2014,
Tajvidi et al.2005, Tamrakar et al. 2011) are used to have an understanding of the long-

81
term behavior of the viscoelastic material (WPC) by applying the principle of
superposition and superimpose the short-term relationships to construct the master curve
that describes the viscoelastic behavior of the WPC at longer duration of testing.
However, these extrapolated experiments encompassed exposing the WPC specimens to
high temperature (above the glassy region of the material) and the WPC specimens used
in the experiments are small (below 50mm) compared with the size of the WPC members
in service. Thus, the prediction of the long-term viscoelastic behavior of these specimens
are not representative of the viscoelastic behavior of the WPC members in service,
especially when the exposure temperature of the member in service is usually below the
glass transition temperature of the material. Besides, the difference in size of the
specimens used in the extrapolated experiments and the size of the member in service and
the accompanied change in the mechanical properties resulting from these differences
(Chang et al. 2013; Garoushi et al. 2012; Mehndiratta et al. 2018; Nuñez et al. 2004;
Pedrazzoli & Pegoretti 2014, Pooler & Smith 2016, Stark 2008, Struik 1989, Tajvidi et
al. 2005, Tamrakar et al. 2011). Furthermore, these techniques are implemented on the
assumption of the linear viscoelasticity and hence the principle of superposition on the
short creep curves can be applied, whereas, the WPCs in this study showed a nonlinear
viscoelastic behavior under the combined effect of temperature and water immersion.
Thus, the extrapolated techniques cannot be used to predict the hygrothermal behavior of
the WPC specimens in this study.
The viscoelastic models are another tool (approach) in addition to the
extrapolated techniques are utilized to describe the viscoelastic behavior of the WPC for
longer durations than the experiments’ durations. However, both the extrapolated

82
techniques and the viscoelastic models do not describe the viscoelastic behavior in the
tertiary region. Likewise, the model of this study has not considered the prediction of the
creep behavior in the tertiary region, even though it predicted the creep behavior for 150
years. The creep lifetime prediction can be used to evaluate the WPC in the primary and
the secondary regions. Barbero (Barbero 2013) emphasizes the importance of studying
the time dependence of the viscoelastic behavior of the material in structural applications
in the primary and the secondary regions. The power law model in this study and unlike
the previous studies, was applied for different; time-durations, specimens lengths, and
testing conditions (temperature only or hygrothermal). The model showed good
agreement with the different hygrothermal conditions in addition to the different test
durations and at different specimen lengths, compared with previous studies, as shown in
Table 3.4. In accordance with ASTM D6815 (ASTM), the WPC in this study can attain
the acceptable fractional creep limit in approximately 10 years whereas the deflection
limit L/20 (Shao et al. 2006, Slaughter 2006) of the WPC of this study can be reached in
approximately more than 150 years. Furthermore, and according to Shao (Shao et al.
2006) when a 70% increase to the initial creep deflection is expected to occur during the
service life of the pultruded FRP sheet pile, the expected 70% increase to the initial
deflection of the WPC in this study is predicted to be in four years.
For most of the experimental conditions, the parameter (n) in the power law
model of this study was dependent on hygrothermal effects (i.e. the value of n increases
with the increase of temperature). However, power law models used in previous studies
had an independent parameter (n), as was found in the models used by Hamel et

83
al.(Hamel et al. 2011; King & Hamel 2013). However, a similar temperature dependency
to the power law model parameter (n) was observed in Pooler’s study (Pooler 2001).
The WPC material in this study shows a potential to be used in applications in
dry environments where the values of the temperature are below the maximum
temperature used in this experiment (45 ) and subjected to low levels of applied
stresses. Whereas, the time-dependent performance of the WPC materials used in the
studies reported by Tamrakar (Tamrakar et al. 2011) and Alvarez-Valencia (Alvarez-
Valencia et al. 2010) have shown a potential of the WPC used in their study to be used in
structural applications, but with the belief of having shorter lifetime of the WPC material
used in this study as shown in Table 3.4, attributable to the predicted creep tensile
displacement and the experimental creep mid-span deflection, respectively.
In accordance with; ASTM D790, ASTM D2915 (ASTM), and ASTM D6109
(ASTM), the shear deformation can be ignored in the computation of the total midspan
deflection when the used span to depth ratio (L/h) is greater than or equal to 16.
However; the L/h ratio used in this study for the DMTA experiments was six. Thus, an
investigation was required for the accountability or the ignorance of the shear
deformation of the short span (L/h <16. The inclusion of the shear deformation is
considered in the computation of the modulus of elasticity (E). In the DMTA
experiments, the modulus of elasticity is computed by the multiplication of the stiffness
(applied flexural force divided by the measured vertical displacement) of the tested WPC
specimen by the geometry factor (GF), as shown in Equation 4. To account for the shear
deformation, the GF has been modified to make the measured vertical midspan
displacement to include the shear deformation component in addition to the bending

84
deformation component, as shown in Equation 5 ( TA Instruments 2018, Storage et al.
2013). Thus, by substituting the GF obtained from Equation 5 in Equation 4, the
computed modulus of elasticity is computed by accounting the shear deformation, and
this Equation is analogous to Timoshenko’s theory of beam deflection (Timoshenko &
Goodier 1951) where the shear deformation component is included in the computation of
the total midspan deflection.
(3.5)
Where the value GF in case of ignoring the shear deformation equals to L3/4wh3.
(3.6)
Where ν is Poisson’s ratio. However, Poisson’s ratio was not computed in this study.
Thus, a value of ν was adopted from the previous studies conducted by Hamel et
al.(Hamel et al. 2014) and Dura (Dura et al. 2005) to be 0.33. These computations were
conducted with the assumption that the WPC behaved as linearly elastic and an isotropic.
The computed values of the elastic moduli for the WPC specimens with L/h=16 and
L/h=6 with the inclusion of the shear deformation were 3% and 12.5% higher than the
computed moduli with the ignorance of the shear deformation.

85
Table 3.4. Comparison of the experimental and predictied creep lifetime of WPCs .
Source This Paper Alvarez
(Alvarez-
Valencia
2010)
Tamrakar
(Tamrakar et
al. 2011)
Loading configuration 4-point bending 4-point
bending
Tensile
Value of the applied stress (MPa) or
load (N)
12(MPa), 2243(N) 11,700(N) 5.45(MPa)
Length of the WPC specimen (mm) 853 4700 246
Condition of testing and/or the
specimen conditioning 21 @50%RH ∼20 @∼3-
50%
Dry@ 21℃
Predicted failure occurrence (years) 154 - ∼1.5
Maximum experimental, and
predicted creep displacement value
(mm), respectively.
14.60, 44.9 Ca 86, - 4.77, -
Conclusions
1. The WPCs in this study have the potential to be used in marine applications (warm water
regions) because of the high level of creep recovery after the low sustained load is removed
resulting from maintaining the creep compliance at temperatures between 25-45℃, and the
reduced water uptake attributed to the thermally treated wood fibers used in the WPCs.
2. The WPC in this study has a potential to be used in long-term application where low
sustained flexural stresses (below 15% of the flexural strength) are applied.

86
3. The viscoelastic behavior of the studied WPC material (whether linear viscoelastic or
nonlinear viscoelastic) was characterized in this study as a function of hygrothermal effects.
4. Limiting the increase in creep compliance in the range of temperatures between 25 and
45 (at 35 )in dry condition to be lower than 39% at the both flexural stress levels (related to
formulation of the WPC in this study) is useful for the considering this material in environments
over a range temperatures below 45 .
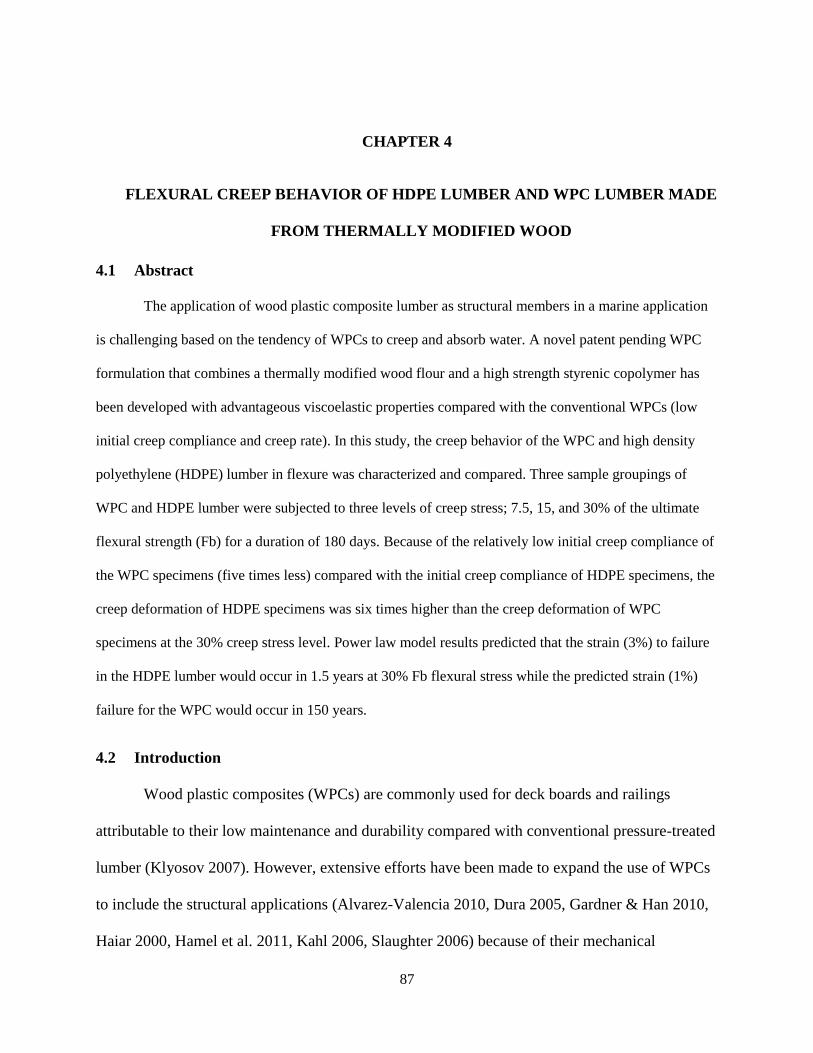
87
CHAPTER 4
4 FLEXURAL CREEP BEHAVIOR OF HDPE LUMBER AND WPC LUMBER MADE
FROM THERMALLY MODIFIED WOOD
4.1 Abstract
The application of wood plastic composite lumber as structural members in a marine application
is challenging based on the tendency of WPCs to creep and absorb water. A novel patent pending WPC
formulation that combines a thermally modified wood flour and a high strength styrenic copolymer has
been developed with advantageous viscoelastic properties compared with the conventional WPCs (low
initial creep compliance and creep rate). In this study, the creep behavior of the WPC and high density
polyethylene (HDPE) lumber in flexure was characterized and compared. Three sample groupings of
WPC and HDPE lumber were subjected to three levels of creep stress; 7.5, 15, and 30% of the ultimate
flexural strength (Fb) for a duration of 180 days. Because of the relatively low initial creep compliance of
the WPC specimens (five times less) compared with the initial creep compliance of HDPE specimens, the
creep deformation of HDPE specimens was six times higher than the creep deformation of WPC
specimens at the 30% creep stress level. Power law model results predicted that the strain (3%) to failure
in the HDPE lumber would occur in 1.5 years at 30% Fb flexural stress while the predicted strain (1%)
failure for the WPC would occur in 150 years.
4.2 Introduction
Wood plastic composites (WPCs) are commonly used for deck boards and railings
attributable to their low maintenance and durability compared with conventional pressure-treated
lumber (Klyosov 2007). However, extensive efforts have been made to expand the use of WPCs
to include the structural applications (Alvarez-Valencia 2010, Dura 2005, Gardner & Han 2010,
Haiar 2000, Hamel et al. 2011, Kahl 2006, Slaughter 2006) because of their mechanical

88
properties, longer lifetime, and their competing commercial prices with the conventional types of
lumber (Alvarez-Valencia 2010, Bright & Smith 2007, Haiar 2000, Slaughter 2006, Tamrakar &
Lopez-Anido 2011). Furthermore, WPCs made from thermally modified wood have shown
potential to be used in structural applications, since they have been shown to exhibit relatively
low time-dependent deformation under sustained flexural loads (Alrubaie et al. 2019, Alrubaie et
al. 2019). Likewise, plastic lumber is also used in low-cost structural applications. One type of
plastic lumber, high density polyethylene (HDPE) lumber, is used in the construction of
aquaculture-offshore fish cages (a.k.a. Aquapod Net Pen cages) (InnovaSea Systems,
Vandenbroucke & Metzlaff 2013). However, HDPE lumber has experienced damage during its
service life attributable to exposure to severe ocean conditions (wave action and high
temperatures during the summer, ca. 48 in the Gulf of Mexico(Vandenbroucke & Metzlaff
2013)) and when these cages are partially surfaced and not submerged (Vandenbroucke &
Metzlaff 2013), predators; for instance, the lounging sea lions caused damage to the exposed
struts of the structure of the cage (in the partially surfaced cages) (Commerce, Gardner 2015,
InnovaSea Systems), as shown in Figure 4.1.
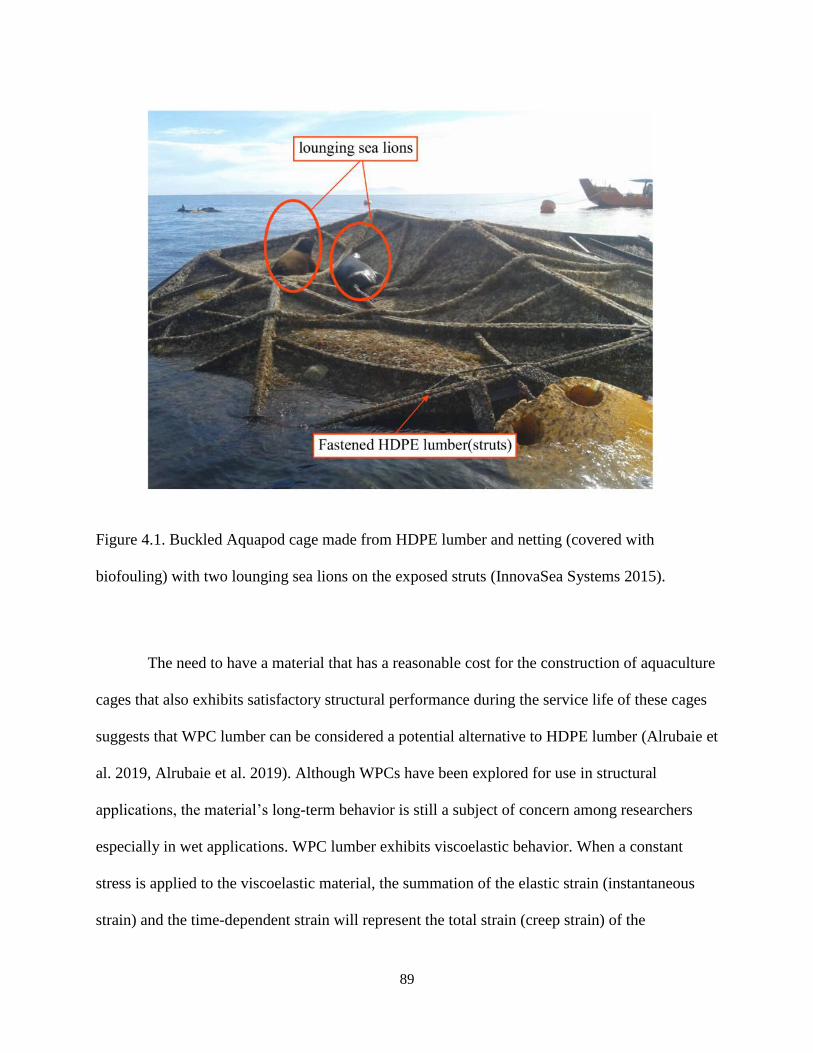
89
Figure 4.1. Buckled Aquapod cage made from HDPE lumber and netting (covered with
biofouling) with two lounging sea lions on the exposed struts (InnovaSea Systems 2015).
The need to have a material that has a reasonable cost for the construction of aquaculture
cages that also exhibits satisfactory structural performance during the service life of these cages
suggests that WPC lumber can be considered a potential alternative to HDPE lumber (Alrubaie et
al. 2019, Alrubaie et al. 2019). Although WPCs have been explored for use in structural
applications, the material’s long-term behavior is still a subject of concern among researchers
especially in wet applications. WPC lumber exhibits viscoelastic behavior. When a constant
stress is applied to the viscoelastic material, the summation of the elastic strain (instantaneous
strain) and the time-dependent strain will represent the total strain (creep strain) of the

90
viscoelastic composite material (Barbero 2013, Gibson 2016). One dimensional (1D) viscoelastic
models (power law, Maxwell, Kelvin, Prony series, and four element viscoelastic model) have
been used in previous studies to describe both the short, and long-term creep-behavior of
viscoelastic materials (Alvarez-Valencia et al. 2010, Pooler 2001, Slaughter 2006, Tamrakar et
al. 2011) . Alrubaie (Alrubaie et al. 2019) implemented a 1D power law viscoelastic model to
describe the 180-day creep behavior of WPC lumber made from thermally modified wood with a
span of 853 mm in 4-point bending (flatwise). Alvarez-Valencia (Alvarez-Valencia et al. 2010)
conducted a full-scale 90-day creep rupture in 4-point bending of a Z-shape WPC sheet piling
with 4.70m in length, to evaluate the time-dependent structural behavior of the WPC sheet
piling, and the 1D Findlay’s power law model was used to predict the creep behavior of the WPC
sheet piling that has shown good agreement with the experimental data. Dura (Dura 2005)
conducted one, seven, and 15-day creep experiments on WPC dumbbell shaped tensile
specimens in at 15, 30, and 45% of the average tensile strength, to evaluate the time-dependent
behavior of the WPCs. In addition to the creep in tension, Dura ( Dura 2005) also conducted
creep tests in compression at the same stress levels used for tensile creep experiments, but with
respect to the average maximum compression stress and to the same creep duration. Many
researchers (Alvarez-Valencia et al. 2010, Dura 2005, Hamel 2011) have studied the large-scale
flexural creep behavior (i.e. the WPC specimens had length to span ratios (L/h) exceeding the
value recommended by ASTM International, (2013) for WPC specimens. Dura (2005) conducted
a 90-day flexural creep experiments (edgewise) on WPC specimens with a span length of 2515
mm with and without a layer of fiber reinforced polymer layer (FRP) and their creep behaviors
were reported. (Dura 2005). Dura (Dura 2005) used the experimental response to verify a
nonlinear 1D long-term viscoelastic model. Alvarez-Valencia ( Alvarez-Valencia 2010)

91
conducted a flexural creep rupture experiment on Z-shape WPC sheet pile with a span length of
4700 mm subjected to 55% of the flexural load at failure (11.7 kN). Hamel (Hamel et al. 2014)
performed a three-year tensile creep test experiment on WPC dumbbell shaped specimens
subjected to two different level of stresses, 20% and 50% of the average maximum stress at
failure, to predict the creep behavior of 2.13m WPC boards in flexure. Hamel (Hamel et al.
2014) developed a 2D finite element (FE) model that predicted the flexural creep behavior
(edgewise) based on the uniaxial quasi-static testing using Abaqus ("Abaqus/CAE "2017)
software. However, Hamel (Hamel et al. 2014) and other researchers (Alvarez-Valencia et al.
2010, Dura 2005, Slaughter 2006) have not implemented a finite element analysis to model the
long-term creep behavior of WPC (Hamel et al. 2014).
The two objectives of the research presented here were: (1) to experimentally
characterize the long-term (180 days) flexural creep behavior (flatwise) of WPC lumber made
from thermally modified wood and compare it with the flexural creep behavior of HDPE lumber
currently used in the construction of aquaculture fish cages (Aquapod Net Pen cages), and (2) to
implement a power law model to describe the long-term viscoelastic creep behavior of WPC and
HDPE lumber in flexure (flatwise) for a duration of 180 days, respectively. Furthermore, the
model was implemented to predict the occurrence failure at the outer layer of the WPC and
HDPE lumber for a duration longer than the 180 days.
In this study, thirty 4-point bending creep frames (flat wise) located in a climate
controlled creep room in the Advanced Structures and Composite Center (ASCC) at the
University of Maine, Orono, Maine, USA were utilized to conduct 180-day creep experiments in
4-point bending (flatwise) of the WPC and HDPE lumber subjected to three different levels of

92
stresses and each level of stress was applied to five specimens (i.e., the total number of WPC and
HDPE specimens is 30).
4.3 Experimental
4.3.1 Material
The WPC lumber with cross section dimensions [width (w), thickness (h)], (139 mm,
33.5 mm) was produced using a twin-screw Davis-Standard WoodtruderTM in the ASCC at the
University of Maine, Orono, Maine [20]. The WPC lumber cross section has two grooves along
the longitudinal direction (extrusion direction) of the lumber at the top layer with 3 mm width
and 1.8 mm depth, and these grooves are located at 21.9 mm from the short edges of the WPC
lumber, as shown in the cross section A-A in Figure 4.2(A). The WPC examined here is based on
a patent-pending formulation combining thermally modified wood flour that has been produced
at Uimaharju sawmill in Finland and a high strength styrenic copolymer system in an equivalent
weight ratio to each of the two constituents. Section A-A in Figure 4.2 (A) shows the cross
section of WPC and HDPE lumber. However, a simplifying assumption was made to consider
the WPC cross-section is a rectangular cross-section and eliminate the grooved areas at the top
layer in the computations. The commercially available HDPE lumber has a rectangular cross
section with the width of 140 mm and the thickness of 38 mm is used in the construction of the
Aquapod Net Pen cages and was provided by InnovaSea [11], to conduct this study.
4.3.2 WPC And HDPE Sample Preparation
WPC and HDPE lumber specimens with cross section dimensions (width, thickness),
(139 mm, 33.5 mm) and (140 mm, 38 mm), respectively, were cut in an adequate length to fit the
span of the creep test rig, 853 mm with an adequate length for the overhang at each support of
the test rig [51 mm at each overhang (a) in Figure 4.2 (A)], as shown in Figure 4.2 (B). To

93
achieve the magnetic mounting of the string potentiometer that measures the creep deflection to
the mid-span of the specimens, 3- minute flame treatment to each specimen and followed by a 5-
minute epoxy to adhere a square metal piece (19 × 19 mm) to the mid-span of each specimen
(flatwise) at the compression outer fibers. Thereafter, a magnetic hook was mounted on the
square metal and the string potentiometer was attached to the hook during the creep loading, and
hence, the creep mid-span deflection was acquired, accordingly.
4.3.3 180-Day Creep Experimental Setup
Prior to the creep loading and in accordance with ASTM D618, WPC and HDPE
specimens were preconditioned in the climate control creep room at the ASCC for one week.
Thereafter, and according to ASTM D6109 and ASTM D6815 (ASTM), the long-term WPC and
HDPE specimens were loaded in 4-point bending (flat wise) with values of L/h of 25 and 22,
respectively. The relative humidity (RH) and temperature were controlled during the 180 days of the
creep experiment to be 50 5% and 21 2 The crosshead speed used to load the WPC and HDPE
specimens for creep was the same crosshead speed used in the quasi-static testing to obtain the
mean ultimate flexural stress (i.e. to ensure the initial applied loading will be applied to the
specimens not less than one minute and not greater than 10 minutes). The measurements and the
recording of the; applied flexural level, creep displacements, and the relative humidity and the
temperature of the climate control creep room, were managed by a data acquisition system
(DAQ) located at the climate control room at the ASCC at the University of Maine, Orono, ME,
USA. Based on the applied flexural stress level relative to the flexural strength (Fb), the WPC and HDPE
specimens have been divided into three groups: 7.5% of Fb, 15% of Fb, and 30% of Fb, respectively.

94
4.4 Quasi-Static Tests
Figure 4.2. A) Four-point bending test configuration used for both quasi-static tests and creep
tests, B) Creep frames experimental setup.

95
To obtain the apparent elastic modulus (E) and the mean of the flexural strength, five
specimens of each of the WPC and HDPE lumber were cut with a span to depth ratio 16:1 with
an adequate overhang length over the supports of the fixture, and were tested in 4-point bending
in accordance with ASTM D6109, as shown in Figure 4.2 (A). The support spans of the WPC
and HDPE specimens were L=545 mm and L=620 mm, respectively. The crosshead rate used on
the WPC and the HDPE specimens during the 4-point bending test were selected in accordance
with ASTM D6109 (ASTM), to be 15.9 and 18 mm/min, respectively. For the 180-day creep
experiments, three levels of flexural creep stress were applied to the WPC and HDPE specimens
(five specimens in each level). These three levels were: 7.5%, 15%, and 30% of the mean of the
flexural strength obtained from the quasi-static tests. These three levels were; 7.5%, 15%, and
30% of the mean of the flexural strength obtained from the quasi-static testing, as shown in
Figure 4.3. The selection of the stress levels was made based on; (1) the use of the WPC and
HDPE lumber in submerged Aquapod net pen cage is expected to be under low stresses (the
structural members of the cage does not carry the weight of the cage, except to withstand the
mooring and the buoyancy system (InnovaSea Systems 2015, Page 2013, Vandenbroucke &
Metzlaff 2013), (2) researchers in previous studies (Chassagne et al. 2005, Dura 2005, Hamel
2011, Hamel et al. 2013, King & Hamel 2013, Tamrakar et al. 2011) have studied the creep
behavior of WPCs under stress levels that were greater than or equal to 30% and recommended
further studies using low stress levels (Chang et al. 2011, Hamel et al.2011), thus, it is important
to investigate the creep behavior of WPCs under low stress levels. Table 4.1 shows the values of
the apparent elastic modulus of the WPC specimens and the HDPE with their coefficient of
variation (COV) and the selected levels of the creep flexural stress. The determination of the
apparent elastic modulus of WPC and HDPE specimens was performed in accordance with

96
ASTM D6109 (ASTM), by computing the slope of the line obtained from the linear regression to
the linear portion in the load-midspan deflection curve. Since the span to depth ratio (L/h) of the
tested WPC and HDPE specimens was 16 which met the recommended L/h in the ASTM
standards, the shear deformation was ignored in the computation of the apparent elastic modulus
(further discussion on shear deformation in the computation of the elastic modulus of the WPCs
with similar formulation was described elsewhere (Alrubaie et al. 2019, Alrubaie et al. 2019)).
Then, the flexural strength (Fb) was determined: (1) for WPC, as the ultimate flexural stress at
midspan at failure, (2) for HDPE, as the flexural stress at midspan corresponding to 3% of outer
fiber strain. The results are reported in Table 1. The mechanical properties of the HDPE lumber
tested in this study agreed with the mechanical properties reported in the data sheet of the
manufacturer (Tangent Technologies, 2015). In accordance with ASTM D6109, the flexural
strength is determined as the maximum stress in the outer fibers at failure or when the strain in
the outer fibers equals 3%, whichever occurs first.

97
Figure 4.3. Stress-strain relationship curves of the a) WPC and b) HDPE lumber, respectively,
in 4-point flexural test.

98
Table 4.1. Values of elastic modulus (E), flexural strength, and the applied creep stress level of
WPC and HDPE lumber obtained from 4-point quasi-static testing.
Material
Applied stress
level
E (GPa) Mean Fb (MPa)
Applied Flexural
Creep Stress
Level (MPa)
WPC
7.5% Fb
4.34 0.26 41.2 4.53
2.98 0.08
15% Fb 5.88 0.04
30% Fb 11.84 0.09
HDPE
7.5% Fb
0.93 0.03 14.1 0.70
1.14 0.05
15% Fb 2.22 0.04
30% Fb 4.4 0.09

99
4.5 Discussion of Results
4.5.1 Determination of the Creep Stress Levels
The applied flexural stress levels for WPC and HDPE lumber were selected to be as
percentages of the mean of the flexural strength obtained from the quasi-static tests, Fb=41.2
MPa, and Fb=14.1 MPa, respectively. Thus, the flexural creep stress levels applied on the three
groups of each of WPC and HDPE lumber were approximately 7.5%, 15%, and 30% of the
ultimate flexural strength, as shown in Table 4.1.
4.5.2 Experimental Comparison Between the Long-Term Creep of WPC and HDPE
Lumber
Three levels of stress were applied on each group of five specimens of WPC and HDPE
lumber. The mean of the mid-span creep deflection of each group of WPC and HDPE lumber
was reported, as shown in the log-log space axes Figure 4.4.
In accordance with ASTM D6815 (ASTM), the acceptance criteria of the creep behavior
of the specimen is evaluated via: (1) the decrement in the creep rate (all the subsequent creep rate
data should be decreasing during the duration of the creep test), (2) the fractional deflection (FD)
should not exceed 2, which is obtained from dividing the mid-span creep deflection at the end of
the creep experiment by the initial mid-span deflection (D0)(ASTM). The values of initial
midspan displacement measured during the first four minutes of the creep test and were reported
in Table 4.2. The creep rate in this study was measured at each 30 days as reported in Table 3.
Table 4.3 shows the 30-day creep rate of the three groups of each of WPC and HDPE specimens
during the 180-day creep experiment. It can be seen that the values of the WPC fractional

100
deflection under the three different flexural stress levels were within the acceptable limit
recommended by ASTM D6815, whereas, the values of the HDPE fractional deflection failed to
meet the recommended fractional deflection limit. However, all the WPC and HDPE groups
exhibited a decreasing creep rate during the 180-day creep experiment as reported in Table 4.3,
except a noticeable increase in the creep rate of the HDPE group-15% Fb for the time between
the 150 and 180 days. This increase can be attributable to the assumption that the creep of HDPE
specimens entered the steady-state of creep in the secondary region (ASTM).
For further comparison between the creep behavior of WPC and HDPE specimens, a
statistical analysis of variance study (ANOVA) of the mid-span creep deflection of each
specimen at each group of the WPC and HDPE was conducted and the results shown in Figure
4.5. At the applied flexural stress level of 7.5% of the flexural strength, HDPE specimens
showed a mid-span creep deflection exceeding two times the mid-span creep deflection of the
WPC specimens. As the levels of applied flexural stress increased from 7.5% to 15% and 30%,
the HDPE specimens showed mid-span creep deflections exceeding five times and seven times
the mid-span creep deflection of the WPC at the same applied flexural levels of stress,
respectively. The rate of increase in the mid-span creep deflection between the HDPE specimens
subjected to 7.5 and 15% (i.e., HDPE specimens for-7.5% Fb, and15% Fb) of the flexural
strength was below 150%, whereas it was below 35% for the WPC specimens (WPC specimens
in group-7.5% and 15% of Fb). When the applied flexural stress levels increased from 15% to
30% of the flexural strength, the creep rate between groups-15% and 30% of Fb was below
215% for the HDPE specimens, and below 110% for WPC specimens. This low time-dependent
mid-span deflection creep behavior of the WPC specimens compared with the behavior of HDPE
specimens can be anticipated based on their initial compliances (the reciprocal of the elastic

101
modulus); 0.232 GPa-1 and 1.11 GPa-1, respectively. In regards to the comparison of the time-
dependent viscoelastic behavior of the WPC with the WPC in previous studies; a short-term
time-dependent behavior comparison of the WPC with the same formulation of WPC in this
study was presented elsewhere (Alrubaie et al. 2019), and Alrubaie et al. (Alrubaie et al., 2019)
have presented a comparison between the creep behavior of the group-30% of Fb of WPC
presented in this study and the creep behavior of WPC from previous studies. Thus, a
comparison to the creep behavior of the WPC used in this study with WPC material from
previous studies is not discussed here.
Table 4.2. Initial midspan deflection (D0) of WPC and HDPE lumber at three different stress
levels.
Material % of Fb D0 (mm)
WPC-7.5% 2.96
WPC-15% 5.8
WPC-30% 11.3
HDPE-7.5% 5.5
HDPE-15% 8.74
HDPE-30% 18.71

102
Figure 4.4. Time-dependent mid-span creep displacement for WPC and HDPE specimens at
different stress levels.

103
Table 4.3. Values of creep rate deflection (D) (mm) of all the groups of WPC and HDPE
specimens at 30th, 60th, 90th, 120th, 150 and 180th day respectively and the fractional deflection
(FD) at the 180th day with respect to initial deflection D0.
Creep rate
and FD
Material -% of Fb
WPC-
7.5%
WPC-
15%
WPC-
30%
HDPE-
7.5%
HDPE-
15%
HDPE-
30%
D30-D0 0.54 0.99 2.35 7.31 15.57 72.54
D60-D30 0.13 0.21 0.57 0.77 1.72 7.80
D90-D60 0.12 0.28 0.45 0.51 1.04 4.62
D120-D90 0.05 0.12 0.35 0.36 0.65 3.45
D150-D120 0.08 0.12 0.29 0.25 0.5 2.87
D180-D150 0.06 0.09 0.23 0.22 0.62 2.47
FD180 1.22 1.33 1.28 2.71 3.88 5.11

104
Figure 4.5. a) Statistical analysis of variance (ANOVA) that investigates the reduction in creep
rate of the WPC specimens subjected to three applied flexural creep stress levels. b) ANOVA
that investigates the reduction in creep rate of the HDPE specimens subjected to three applied
flexural creep stress levels.

105
4.5.3 Time-Dependent Creep Modeling
An empirical power law model was used to describe the 180-day mid-span flexural creep
displacement. The model showed a good degree of agreement with the experimental data of the
WPC and HDPE lumber in 4-point bending creep test (flatwise). Based on the assumption that
the WPC should fail at a flexural strain in outer fiber of 1%, and the HDPE lumber should fail at
a flexural strain in outer fiber of 3% (similar to the failure strain value mentioned in ASTM
D6109), the computed mid-span creep the predicted failure occurrence for WPC and HDPE in
flexure and under a flexural stress of 30% of Fb will occur after 150 years and 1.5 years,
respectively, as shown in Figure 6. To investigate the stress-independency behavior (viscoelastic
behavior) of the WPC and HDPE lumber with regards the three applied stress levels (7.5%, 15%,
and 30% of Fb), a power law model was implemented to describe the normalized mid-span creep
displacement behavior (d(t)). Equation (4.1) describes the normalized midspan creep
displacement behavior.
(4.1)
Where d(t) is the time dependent midspan deflection. For a 4-point bending test configuration,
the initial mid-span creep displacement (D0) is related to the applied flexural stress, as shown in
Equation 4.2.
(4.2)

106
Where and E are the flexural stress and elastic modulus, respectively, L is the support span,
and h is the depth of the WPC and HDPE specimen. The normalized mid-span creep
displacement is predicted, as shown in Equation 4.3.
(4.3)
where d1 and m are the stress-independent power law parameters. These parameters (d1 and m)
were computed from the experimental least square error data fitting using a Matlab code. The
creep behavior of HDPE lumber and WPC lumber has been predicted for ten years using the
power law model, as was reported in Table 4.4. According to InnovaSea systems Inc., the
estimated service life of aquaculture cages is ten years. The prediction showed the failure
occurrence (maximum strain at outer fiber layer) will not occur for both WPC and HDPE
specimens for the stress levels 7.5% and 15% of Fb. Whereas, the failure occurrence was
predicted in 1.5 years for the HDPE lumbers subjected to 30% of Fb. For this reason WPCs are
considered in the construction of aquaculture cage structures subjected to stress levels 30%
below Fb.

107
Table 4.4. 10 year prediction of the creep displacement of the WPC and HDPE lumber (in
accordance with ASTM D6109).
Material name -%
of Fb
Outer fiber strain at
failure %
Mid-span
displacement at
failure (mm)
Predicted mid-span
creep displacement
in 10 years (mm)
WPC-7.5%
1.040
46
6
WPC-15% 11
WPC-30% 22
HDPE-7.5%
3.004
120
21
HDPE-15% 50
HDPE-30% 165

108
Figure 4.6. Predicted failure occurrence in the outer fiber strain of WPC and HDPE lumber for
the specimens subjected to 30% Fb flexural stress using the power law model.
Values of the normalized mid-span creep displacement were reported in Table 4.5. The
normalized power law model showed the stress-independency [18] of the WPC and HDPE
lumber by having similar values of the normalized power law model (d1 and m) at different
flexural stress levels, respectively. Figures 4.7 and 4.88 illustrate the stress-independency
behavior of each group of the WPC and HDPE lumber via describing the normalized mid-span
creep displacement by the normalized creep behavior.

109
Table 4.5. Power law model parameters.
Material type
model parameters
d1 m
WPC 0.011 0.596
HDPE 0.018 0.494
Figure 4.7. Comparison of power law model and experimental creep result for WPC lumber.

110
Figure 4.8. Comparison of power law model and experimental creep results for HDPE lumber.
Conclusions
1. The WPC in this study showed an enhanced time-dependent creep behavior compared to
HDPE. WPCs show potential to replace HDPE lumber in the construction of aquaculture cage
structure.
2. While previous studies have studied the creep behavior of WPC at relatively high level of
stresses, this study conducted the creep experiments using levels of stresses that were below 30%
of the ultimate flexural strength, which are typical for the intended design application. During the
comparison between the creep behavior of WPC and HDPE specimens at the low stress levels
(7.5% and 15% of Fb), the fractional deflections (FD) of HDPE were 122% and 192% higher
than the FD of the WPC specimens, respectively. Whereas, the FD of HDPE specimens at 30%

111
stress level was 300% higher than the FD of the WPC specimens. This can be advantageous for
using WPC lumber as a replacement of the HDPE lumber in the construction of aquaculture
cages.
3. The power law model was a useful tool to describe and predict the creep behavior of
both WPC and HDPE lumber for all the stress levels (7.5%, 15%, and 30% of Fb). This model
predicted that both HDPE lumber and WPC lumber show low creep rate during ten years at
stress levels below 15% of Fb. Whereas, at stress level 30% of Fb, failure occurrence at outer
fiber is predicted to happen at 1.5 years for HDPE lumber and at 150 years for WPC lumber.

112
CHAPTER 5
5 EXPERIMENTAL STRUCTURAL PERFORMANCE OF HDPE AND WPC
LUMBER OF AQUACULTURAL GEODESIC SPHERICAL CAGE COMPONENTS
5.1 Abstract
The buckling load of Aquapod connected triangular panel components of an aquacultural
geodesic cage structure 1:4 size of the full-scale spherical cage (volume =4700 m3 with an
approximate diameter of 21 m) made from HDPE and WPC struts with and without the steel
plastic coated mesh was experimentally measured and characterized. The metallic mesh of the
panels contributed to increasing the buckling capacity of the connected triangular panels by
approximately two times the buckling capacity of the connected panels without steel mesh made
from WPC and HDPE struts, respectively. The typical failure mode of the HDPE panels made
from HDPE struts with and without metallic mesh was buckling failure in the struts and the
metallic mesh, whereas the failure of the WPC panels with and without metallic mesh was
buckling failure (bending) at the weak section of the bolted struts.
5.2 Introduction
Aquaculture cages for fish farming are made in different ways. Unlike other types of
aquaculture fish cage structures, the Aquapod Net Pen cage is a rigid-frame geodesic spherical
cage structure. The cage structure is comprised of individual triangular panels made from high
density polyethylene (HDPE) lumber (strut) and these panels are fastened to each other to form
the geodesic spherical shape of the cage (Vandenbroucke & Metzlaff 2013). These triangular
panels contain wire mesh netting, and is affixed to the struts of the panels by mechanical
fastening (stapling). Five panels (P1, P2, P3, P4, and P5) are the main structural components to
construct the spherical shape of the Aquapod cage, as shown in Figure 5.1. These triangular

113
panel components are designed to contribute to facile construction by reducing the time and
manpower required to construct the cage structure (Page 2013). The cage structure is utilized in a
fully submerged situation; except for cleaning, where it will be partially (30%) exposed to the air
(Vandenbroucke & Metzlaff 2013).
Figure 5.1. Details of; connected struts in the panels and the connected panels to form the cage
faces, types of hubs, and the types of the panels of the aquacultural geodesic spherical cage
structure with an approximate diameter of 21 m (Page 2013, Vandenbroucke & Metzlaff
2013).
114
Because of the increased demand for aquaculture structures that have useful features (high
volume capacity, rigid frame, and durable structure for up to 10 years) compared with other
aquaculture cage structures, the aquacultural geodesic spherical cage structure has been
constructed in different volume capacities and diameters since 2006 (InnovaSea Systems 2016)
to its most recent product, Aquapod 4700, with a volume capacity of 4700 m3 (dia. of
approximately 21 m)(InnovaSea Systems 2016). The cages function under submersion without
any apparent problems from the marine exposure. However, damage to cage structures was
reported in the Gulf of Mexico in 2015(InnovaSea Systems 2015) , when the structures were
exposed during cleaning to destructive surface waves during a hurricane. InnovaSea systems,
Inc. decided to explore a better material option to replace the HDPE lumber (struts). An extruded
wood plastic composite (WPC) lumber made from high strength styrenic copolymer and
thermally modified wood flour appears to be a promising alternative to replace HDPE,
attributable to its features compared with HDPE lumber. For instance, the elastic modulus of
WPC lumber is approximately five time the elastic modulus of the HDPE lumber. Although
WPCs have been investigated for structural applications (Alvarez-Valencia 2010, Balma 1999,
Brandt & Fridley 2003, Brandt & Fridley 2007, Dura 2005, Haiar 2000, Slaughter 2006,
Tamrakar 2011) , the performance of WPCs requires evaluation to be utilized for marine
applications, where the material will be exposed to the combined effect of temperature and
saltwater immersion. Nevertheless, it is very difficult to evaluate the structural performance of
the full-scale structure of the cage structure that is made from HDPE or WPC lumber in such
combined conditions (temperature and water immersion). WPCs are similar to other
thermoplastic materials that exhibit viscoelastic behavior, hence, their time-dependent behavior
was investigated. Previous studies have focused on the time-dependent behavior of WPCs

115
(Alvarez-Valencia et al. 2010, Chang 2011, Hamel et al. 2011, Pooler & Smith 2004, Tamrakar
et al. 2011). For the WPC lumber that is considered as alternative to HDPE lumber in the
construction of the cage structure, Alrubaie et al. conducted a 180-day creep experiment to
compare the time-dependent behavior of HDPE and WPC lumber under similar conditions
(temperature 23℃± 2℃ and relative humidity 50%±5%). Furthermore, the short-term time-
dependent behavior of the WPCs (that is considered an alternative for the HDPE in the
construction of the aquacultural geodesic spherical cage structure) was investigated and modeled
under the synergistic effect of elevated temperature and water immersion (Alrubaie et al. 2019,
Alrubaie et al. 2019). InnovaSea systems, Inc. conducted mechanical testing at the Advanced
Manufacturing Center, University of Maine, Orono in 2006 to evaluate the buckling capacity of
full-scale fastened panels (with and without netting) of Aquapod A4700 made from glass bar-
reinforced HDPE lumber.
The objective of the research presented here was to experimentally investigate and
characterize the buckling capacity of two connected panels made from WPC and HDPE struts
with and without metallic mesh, to compare the structural performance of WPC lumber in
aquacultural structures.
In this study, 24 triangular panels with struts length; 965 mm, 1003 mm, and 1321 mm
were tested in compression along the longest strut. Twelve panels were made from WPC struts
and twelve panels were made from HDPE struts. Six of each of these panels were constructed
with plastic coated steel wire mesh with 38.1 mm openings and 2.8 mm thickness of the steel
wire (Caccese 2006). A set of two panels were connected using three steel galvanized bolts with
a diameter of 12.7 mm and two steel galvanized square washers with dimension of 51 mm to
each bolt. Four types of panels were experimentally investigated in the buckling experiment:

116
WPC panels without steel mesh condition (WPC-panel), WPC panels with steel mesh condition
(WPC-M-panel), HDPE panels without steel mesh (HDPE-panel), and HDPE panels with steel
mesh (HDPE-M-panel). Three sets were tested for each panel type (Tangent Technologies 2015).
5.3 Experimental
5.3.1 Materials
The commercially available HDPE lumber with cross section dimensions (b=140 mm
and h= 38.1 mm) was provided by InnovaSea system, Inc. to be used in the manufacture of the
HDPE triangular panels with and without steel wire mesh. The struts (made from WPC and
HDPE lumber) of the triangular panels were connected to each other to form the panel via a
triangular blocks (gussets) made from the same HDPE of the struts. The WPC lumber with cross
section dimensions (b= 139 mm and h=33.5 mm was produced using a twin-screw Davis-
Standard WoodtruderTM in the Advanced Structures and Composites Center at the University of
Maine’s Orono campus (Davis-Standard Woodtruder) were used in the manufacture of the WPC
triangular panels with and without steel wire mesh . The WPC lumber examined is based on a
patent-pending formulation that combines a thermally modified wood flour that was produced at
a sawmill in Uimaharju, Finland and a high strength styrenic copolymer system in an equivalent
weight ratio to each of the two constituents. The elastic modulus and the flexural strength of the
WPC and HDPE lumber were reported elsewhere (Alrubaie et al. 2019). Figure 5.2 shows
representative specimens of WPC and HDPE lumber tested in accordance with ASTM D6109 to
obtain the elastic modulus and the flexural strength (Fb). Table 5.1 shows the mechanical
properties of The WPC and HDPE lumber used in this study.

117
Table 5.1. Mechanical properties of WPC and HDPE lumber used as struts of the aquacultural
geodesic components of Aquapod net pen geodesic spherical cage structure.
Material Flexural modulus
(E) GPa (COV%)
Flexural strength
(Fb) MPa (COV%)
WPC 4.34 (6) 41.2 (11)
HDPE 0.93 (3) 14.1 (5)
Figure 5.2. Typical stress versus strain relationship to obtain the elastic modulus and the
flexural strength of WPC and HDPE lumber in accordance with ASTM D6109.

118
5.3.2 Equipment and Test Setup
The panel manufacture was conducted by InnovaSea system, Inc. The fixture to test the
connected panels in compression was manufactured at the Advanced Structures and Composite
Center, University of Maine, Orono, Maine. Figure 5.3 shows the connected triangular panels
and the test fixture. An Instron test frame with a load cell capacity of 1334 kN was used. The
data acquisition system (DAQ) with a written labview software was used to collect: the applied
axial load (negative Y-direction in Figure 5.4), the axial displacement (of the actuator, the in-
plane displacement of the struts), the in-plane displacement (negative and positive direction of
X-axis as shown in Figure 5.4), and the out of plane displacement (negative and positive
direction of Z-axis as shown in Figure 5.4). The tests were conducted in displacement control
with a crosshead speed of 1 mm/min.
Figure 5.3. (Left) the test frame and the buckling test setup, (right) the WPC and HDPE
connected triangular panels with and without metallic mesh.

119
5.3.3 Degrees of Freedom of the Supports System of the Triangular Panels
Table 5.2 and Figure 5.4 summarize the degree of freedom of each support of the
triangular panels during the buckling test.
Table 5.2.Two dimensional degrees of freedom of the triangular panels during the buckling
experiment.
Supports boundary conditions
(free=0, fixed=1)
Supports
a b c d
Ux 1 1 1 1
Uy 0 1 1 1
z 0 0 0 0

120
Figure 5.4. Schematic of the 2D free body diagram of the tested connected (bolted) of WPC and
HDPE triangular panels with and without mesh.
5.4 Discussion of Results
The relationship between the applied buckling load and lateral deflection of the middle
vertical strut ac at point f (Figure 5.4) for the connected components (panels) made from WPC and
HDPE struts are reported in Figures 5.5, 5.6, 5.8, and 5.9. The buckling capacity of the panels
made from WPC struts was three times the buckling capacity of the panels made from HDPE
struts. The steel wire mesh contributed to the increased buckling capacity of the panels. A 2D FE
analysis model provided a useful assessment of the multiplier factor (α) that can be used in the

121
computation of the reactions and the member of forces under different values of applied loads.
Table 5.3 reports the values of α.Table 5.4 reports the average maximum buckling load of the
HDPE and WPC struts connected panels at each condition (with and without metallic mesh) and
their corresponding type of failure.
The buckling failure of the cage components (panels) made from WPC struts was the
dominant type of failure at one of the regions of the galvanized bolts that connect the two panels
causing a net section failure at the region where the bolts were located, whereas, no such net
section failure was noticed at the buckling failure occurred for the panels made from HDPE
lumber. This is attributable to the brittle behavior of the high wood flour content WPC lumber
compared with the HDPE plastic lumber. Table 5.4 summarizes the type of failure of the structural
components of the cage structure with and without metallic mesh. Table 5.5 summarizes the
implementation of the multiplier load factor (α) to compute the allowable member force of strut ac
based on the buckling load values obtained from Southwell’s method (Barbero & Tomblin 1993).
Regarding the connected components (panels) made from WPC lumber (strut) without
metallic mesh, the buckling failure tended to be abrupt after reaching the maximum applied load, as
shown in Figure 5.5. A similar pattern of the failure propagation was observed in the panels made
from HDPE lumber without metallic mesh, the panels showed propagated deformation after
reaching the maximum applied load without an abrupt failure, as shown in Figure 5.6. However,
panel number three (HDPE-panel-3), as shown in Figure 5.6, exhibited a different load-lateral
deflection curve. The panels (the middle strut ac) started deforming with the propagation of the
applied load. This can be attributed to the geometry of the panels or to an eccentricity has been
developed while the load was imposed to the panel.

122
Figure 5.5. The relationship between the applied buckling load and lateral mid-span
deflection (point f in Figure 5.4) of the vertical strut ac in the panels made from WPC struts
and without metallic mesh.

123
Figure 5.6. The relationship between the applied buckling load and lateral mid-span deflection of
the vertical strut ac in the panels made from HDPE struts and without metallic mesh.
Regarding the failure behavior of the panels made from WPC with metallic mesh, the
metallic mesh contributed into an increase in the buckling capacity (maximum applied load)
approximately three times of the buckling capacity (maximum applied load) of the panels made
without the metallic mesh. However, as regards to improving the ductility of the panels, the
metallic mesh did not contribute into improved ductility of the panels made from WPC struts. The
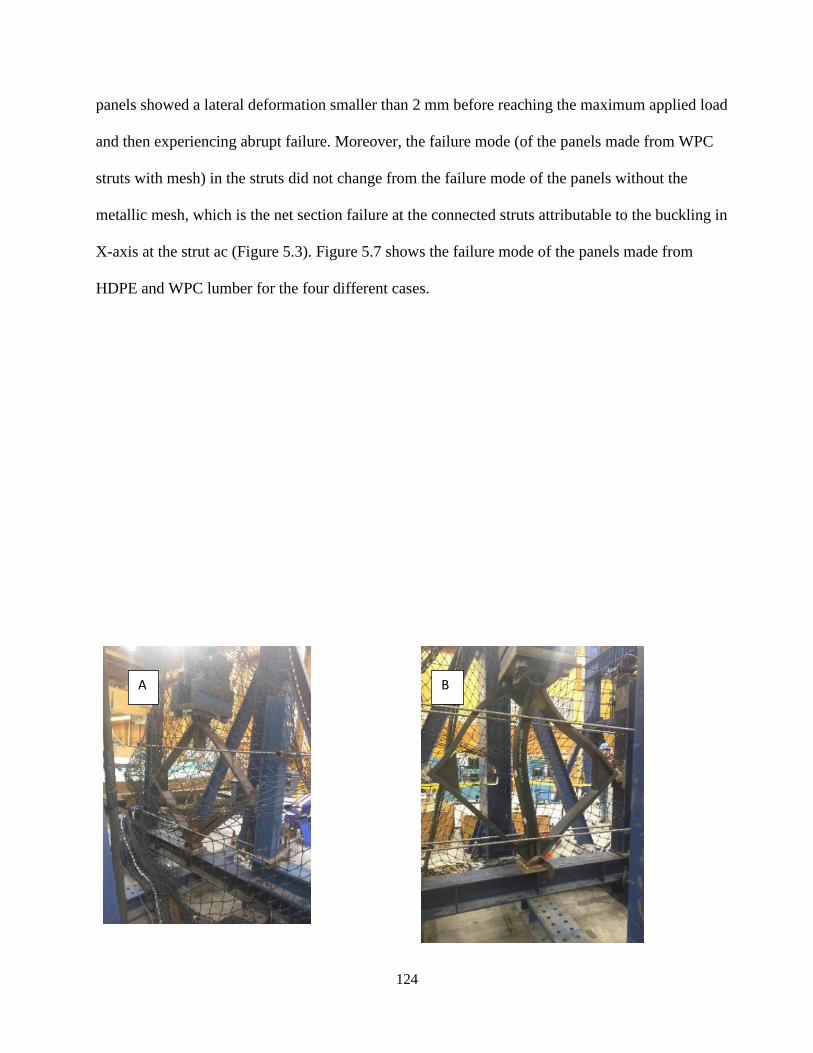
124
panels showed a lateral deformation smaller than 2 mm before reaching the maximum applied load
and then experiencing abrupt failure. Moreover, the failure mode (of the panels made from WPC
struts with mesh) in the struts did not change from the failure mode of the panels without the
metallic mesh, which is the net section failure at the connected struts attributable to the buckling in
X-axis at the strut ac (Figure 5.3). Figure 5.7 shows the failure mode of the panels made from
HDPE and WPC lumber for the four different cases.
A B

125
Figure 5.7. Failure modes of the panels made from HDPE and WPC lumber for the four different
cases; A) net section failure at the middle strut ac at the location of the bolt connection of the
panels made from WPC without metallic mesh, B) buckling mode failure of the strut ac of the
panels made from HDPE without metallic mesh, C) net section failure mode of panels made
from WPC struts with metallic mesh, and D) buckling failure mode of the panels made from
HDPE struts with metallic mesh.
C D

126
Figure 5.8. The relationship between the applied buckling load and lateral mid-span deflection of
the vertical strut ac in the panels made from WPC struts and with metallic mesh.
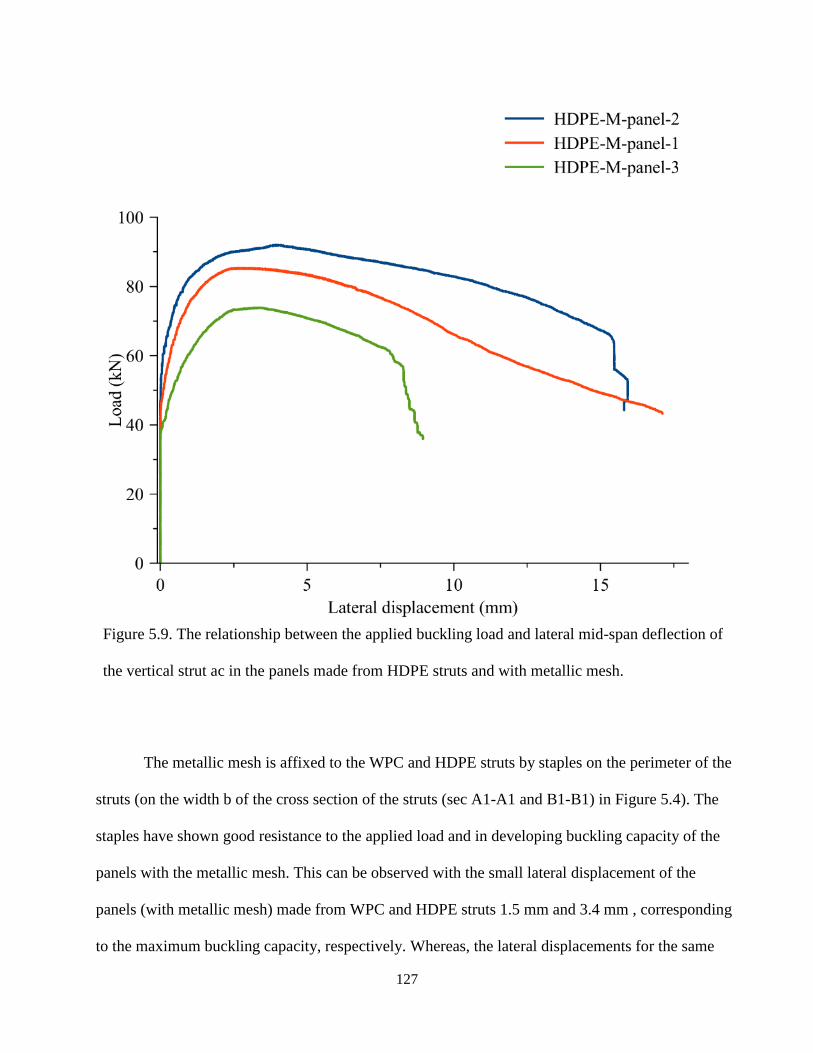
127
Figure 5.9. The relationship between the applied buckling load and lateral mid-span deflection of
the vertical strut ac in the panels made from HDPE struts and with metallic mesh.
The metallic mesh is affixed to the WPC and HDPE struts by staples on the perimeter of the
struts (on the width b of the cross section of the struts (sec A1-A1 and B1-B1) in Figure 5.4). The
staples have shown good resistance to the applied load and in developing buckling capacity of the
panels with the metallic mesh. This can be observed with the small lateral displacement of the
panels (with metallic mesh) made from WPC and HDPE struts 1.5 mm and 3.4 mm , corresponding
to the maximum buckling capacity, respectively. Whereas, the lateral displacements for the same

128
type of panels without metallic mesh were; 20.1 mm and 12.5 mm, respectively.
5.4.1 Structural Analysis of the Tested Structural Components (Panels) of the Aquacultural
Geodesic Spherical Cage Structure
To compute the reaction and the section forces at the supports and the struts of the
connected, respectively, 2D (two dimensional) finite element (FE) linear elastic analyses models
were conducted to the four types of the test panels (WPC-M-panel, WPC-panel, HDPE-M-panel,
and HDPE-panel) using commercially available software Abaqus/CAE("Abaqus/CAE 2017,"
2017) with the following assumptions:
1. Based on the symmetry of the connected panels, panel 1 in Figure 5.4 was used on
the 2D FE model to compute the member forces and the support reactions.
2. The supports at points b,c, and d were assumed to be as pin supports (vertical (Y-
axis) and horizontal (X-axis) movement restriction), whereas, point a was assumed to
be as s roller support (horizontal (X-axis) movement restriction). This assumption
was made based on the design of the fixture used in the experiment and the ability of
the structure to have rotation at the points a,b,c, and d.
3. A slender beam element B23 (cubic beam in plane) was chosen from the available
types of beam elements available in the used commercial software Abaqus and was
used in the 2D linear finite element (FE) analysis of the structural components of the
aquacultural geodesic spherical cage structure. The selection was made based on the
assumption that both the struts of the components and the metallic mesh are slender
even some of the beams have a slender ratio (span (l)/ radius of gyration (r)) less than
200. This assumption eliminated the need to have the values of Poisson’s ratio of the
materials of the components (steel of the metallic mesh, WPC struts, and HDPE

129
struts), i.e. the elastic moduli were the required input for the mechanical properties of
the materials in the 2D FE linear analysis model.
4. Regarding the connected panels with metallic mesh, the metallic mesh was modeled
as vertical and horizontal beam elements [type B23(Abaqus Analysis User's Guide)]
(each wire mesh modeled as a beam) spaced 38.1 mm from each other and has a
circular cross-section with a diameter of 3 mm to each beam. The geometry and the
space of the wire mesh was implemented based on the specification of the metallic
wire mesh, Aquamesh®(RIVERDALE, 2019) used in the manufacture of the
structural panels of the aquacultural geodesic spherical cage structure.
5. The elastic moduli of the WPC and HDPE lumber used in the structural analysis
were obtained from the 4-point bending test conducted on specimens with a span to
depth ratio of 16 to be 4430 MPa and 930 MPa as reported in Table 5.1,
respectively. The elastic modulus of the wire mesh was assumed to be the elastic
modulus of steel, Esteel=200000MPa.
6. The 2D FE model was conducted to investigate the response of the structure in the
linear region. Thus, the values of the applied load were assumed to be a unit load (1
N) to be applied to the structure. The computed member forces and reactions at the
supports represented a multiplier coefficient that can be used to compute the
reactions and member forces at any value of the applied load.
The reaction values at the supports were computed from the 2D FE model. Furthermore, the
member forces were computed for the tested panels in the four cases, to provide an understanding
to the distribution of the applied load through the struts of the panels. However, the strut cd for the

130
panels made from HDPE or WPC lumber without metallic mesh had no member force. Whereas,
the metallic mesh contributed into distributing the applied load among the struts; ac, cd, and ad.
Furthermore, the value of the member force varied along the length of the strut attributable to the
presence of the metallic mesh. The maximum values of member forces of the struts of the panels
made from HDPE and WPC struts with metallic mesh are shown and reported in Table 5.3 and
Figure 5.10, respectively.
Table 5.3. Reactions and member forces computed from the 2D FE linear analyses obtained from
applying unit load on panel 1 (Figure 5.4 at point a) of the aquacultural geodesic spherical cage
structure for four sample types: WPC-M-panel, WPC-panel, HDPE-M-panel, and HDPE-panel.
Reactions
and member
Condition of the panels made
from WPC struts
Condition of the panels made
from HDPE struts

131
forces (N) M-panel panel M-panel panel
Ax -0.4 -0.414 -0.37 -0.414
Cx -0.004 0.001 0.01 0.001
Cy 0.66 0.64 0.7 0.64
Dx 0.404 0.413 0.38 0.413
Dy 0.34 0.36 0.32 0.36
Fad -0.54 -0.55 -0.54 -0.55
Fac -0.60 -0.64 -0.54 -0.64
Fcd -0.04 0 -0.1 0

132
Figure 5.10. Reactions and member forces in N units of panel 1 of the aquacultural geodesic
spherical cage structure obtained from 2D FE linear analyses; A)WPC-Panel, B)HDPE-panel,
C)WPC-M-panel, and C) HDPE-M-panel.
133
5.4.2 Southwell’s Method to Determine the Critical Load
To investigate the critical load mode for the four cases of the panels made from WPC and
HDPE struts in the cases of metallic wire mesh and without wire mesh, Southwell’s method(E.
Barbero & Tomblin, 1993) was implemented. The method can be summarized by creating a plot
based on the relationship between; the ratio of the lateral displacement (deflection) (Δ) over the
applied buckling load (P), and the lateral displacement (Δ). If this relationship can be described by
a linear relationship, then, the inverse of the slope of this line represents the critical buckling load
(Pcr) and the buckling mode is global. This critical load does not account for imperfections or mode
of interactions. Southwell’s method was implemented on the relationships reported in Figures 5.11-
5.14 after modifying the relationship to include the load vs later deflection only at the limit of the
maximum applied load (i.e., the data points after the maximum applied load has not been
considered in the application of Southwell’s method). By using linear regression to obtain the slope
of the equation of the line, hence, the inverse of the slope of the line represents the value of Pcr.
Figures 5.11=5.14 show the implication of Southwell’s method on the four sample panels (WPC-
panel, WPC-M-panel, HDPE-panel, and HDPE-M-panel) and the obtained slope of each tested set
of panels. Based on the linear relationship between Δ/P versus Δ, the critical load can be
determined.

134
Figure 5.11. Application of Southwell’s method to obtain the critical buckling load of the
structural panels of the cage structure made from WPC struts without metallic mesh.

135
Figure 5.12. Application of Southwell’s method to obtain the critical buckling load of the
structural panels of the cage structure made from WPC struts with metallic mesh with the shaded
region of the linear relationship between Δ/P versus Δ.

136
Figure 5.13. Application of Southwell’s method to obtain the critical buckling load of the
structural panels of the cage structure made from HDPE struts without metallic mesh.

137
Figure 5.14. Application of Southwell’s method to obtain the critical buckling load of the
structural panels of the cage structure made from HDPE struts with metallic mesh.
Table 5.4. The experimental maximum buckling load and the failure type and occurrence sequence

138
in the structural components of the aquacultural geodesic spherical cage structure.
Connected triangular
panels
Experimental
buckling load
for each panel
(kN)
Failure type and location of
occurrence in the component
Struts
Material
Mesh condition
M-panel=with
mesh
panel=without
mesh
P1 P2 P3 M-panel panel
WPC M-panel 294 207 270 Struts Buckling
failure (X-axis)
and metallic
mesh buckling
(Z-axis)
Buckling failure
(X-axis) WPC Panel 120 111 131
HDPE M-panel 85 92 74 Metallic mesh
buckling (Z-
axis) followed
by struts
buckling (X-
axis)
Buckling failure
(X-axis) in the
struts
HDPE panel 54 55 35
Table 5.5. The buckling load of the member ac based on multiplying the multiplier value α
obtained from the 2D FE linear analyses by the value of critical load obtained from Southwell’s

139
method.
Connected
panels
Experimental Southwell’s
method
Euler’s method Allowable
buckling load
Max. average
load (kN)
Material and
mesh condition
Fac
Fac-Southwell
critical (kN)
Fac-Euler-critical (kN) Fac (kN)
WPC-M-panel 129 116 NA 70
WPC-panel 60 61 43 39
HDPE-M-panel 42 44 NA 24
HDPE-panel 24 27 14 17
5.5 Conclusions
1. The buckling behavior of the structural components of the aquacultural geodesic spherical
cage structure made from HDPE and WPC lumber was experimentally investigated and
characterized. The buckling capacity (load) of the triangular panels made from WPC struts and
with mesh was 256.81 kN, whereas, the buckling capacity of the same type of panels made from
HDPE struts was 83.80 kN. Furthermore, the buckling capacity of the panels made from WPC
struts and without steel mesh was 120.42 kN which was 2.5 times the buckling capacity of the
same condition of panels but made from HDPE struts.
2. The metallic mesh contributed into distributing the member forces through the struts: ac, ca

140
CHAPTER 6
6 CONCLUSIONS AND FUTURE WORK
and da of the component (panel). Whereas, the panels without metallic mesh experienced strut (cd)
without member force.
3. Attributable to the brittleness behavior of WPC lumber (50 wt.% wood flour) compared
with the ductile behavior of HDPE lumber (100 wt.% plastic), an abrupt failure to panels made
from WPC was observed in the experiments.
4. According to the linear structural analysis, the short struts in the connected panels (struts bc
and strut cd) did not carry load values and this contributed to the buckling occurrence to be
initiated in the longest strut (ac) and then at the shorter struts (ab and ad) for the panels made from
WPC and HDPE lumber and without metallic mesh.
5. As a containment aquaculture structure system in open ocean environments, it is preferable
to have a structural material (strut) that shows an indication prior to failure or to defect without
breakage, than an abrupt failure, so that the member can be replaced properly.
6. Attributable to the viscoelastic behavior and the brittleness behavior of the WPC in this
study, it is preferable to consider using the WPC lumber in structural application where the applied
load should be at a low level compared with strength of the WPC, to avoid the abrupt failure of the
structural member during the service life of the structure.

141
6.1 Conclusions
Marine structures require an investigation of the viscoelastic behavior under the
combined effect of temperature and water immersion. The short-term (30-minute) creep and
creep-recovery in this study provided an understanding to the viscoelastic behavior of WPC
lumber under the combined effect of temperature and water immersion. Evaluating the short-
term time-dependent behavior of the WPC lumber in this study and comparing it with the time-
dependent behavior of the WPCs from previous studies under different conditions have
emphasized on the potential capabilities of the WPCs in this study to be used in structural
application attributable to the lower creep strain rate. Moreover, the WPCs in this study and
attributable to its property of maintaining the modulus of elasticity at values of temperature
below the glass transition temperature has the ability to be used in application that are exposed
merely to the effect of elevated temperature.
Attributable to the viscoelastic and the brittle behavior (attributed to high content of
wood flour in the formulation of the WPCs of this study), the use of WPC members in structural
application under different environmental conditions can be accomplished by taking in
consideration: (1) the applied levels of stress have to be low below 30% of the maximum
strength of the WPCs, and (2) avoid the environments where the temperature level is higher than
the glass transition zone of the WPCs of this study.
In addition to the elastic modulus of the WPC lumber in this study is approximately five
times the elastic modulus of HDPE lumber and attributable to the short-term and long-term time
dependent behavior of the WPCs of this study compared with the long-term time-dependent
behavior of the HDPE material, the WPC lumber in this study is considered a competing
alternative to replace the HDPE lumber in the manufacturing of the Aquapod structures.

142
However, limitations have to be taken into consideration as regards the size of the aquaculture
structure manufactured using the WPCs, attributable to the developed weight of the structure (the
density of the WPC lumber is higher than the density of the HDPE lumber) and the accompanied
developed stresses (should not exceed the level of 30% of the maximum strength) on the
structural members made from WPCs.
6.2 Future Work
1- Further studies to evaluate the structural performance of the WPC lumber as structural
members are required to provide a sufficient understanding to the use of WPC lumber in
the construction of Aquapod cage structures. For instance, the evaluating of the bolt
connections where each strut is connected to the adjacent strut by bolts. Furthermore, the
evaluating of bolt connections of each strut in the triangular panel to the hub system that
holds six panels.
2- Long-term (more than three years) creep experiments are essential to study the creep
behavior of the WPC used in this study in high temperature environments and under the
field temperature (ambient temperature). For instance, Southern Iraq region where the
temperature during summer season (from April till October) can reach 50℃.
3- Field Conditioning (ambient temperature and moisture) to the WPC in marine
environments and evaluate the reduction in the mechanical properties by series of
mechanical testing on a regular basis duration. For instance, having WPC lumber
immersed at the Gulf of Maine, Maine, USA and have the lumber conditioned at the
ambient temperature and saltwater immersion. Followed by series of mechanical testing
and water uptake to evaluate the reduction in the mechanical properties and to evaluate
the water uptake wt%.

143
7 BIBLIOGRAPHY
Abaqus/CAE (2017). Rohde Island: SIMULIA Inc.
AbaqusAnalysisUser'sGuide. Euler-Bernoulli (slender) beams. Abaqus 6.14. Retrieved from
https://www.sharcnet.ca/Software/Abaqus/6.14.2/v6.14/books/usb/default.htm?startat=pt
06ch29s03alm08.html.
Alrubaie, M. A. A., Lopez‐Anido, R., Gardner, D., Tajvidi, M., & Han, Y. (2019). Experimental
Investigation of the Hygrothermal Creep Strain of Wood Plastic Composite (WPC)
Lumber Made from Thermally Modified Wood. Journal of Thermoplastic Composite
Materials, 21. doi:https://doi.org/10.1177/0892705718820398
Alrubaie, M. A. A., Lopez‐Anido, R., Gardner, D., Tajvidi, M., & Han, Y. (2019). Modeling the
Hygrothermal Creep behavior of Wood Plastic Composite (WPC) Lumber Made from
Thermally Modified Wood. Journal of Thermoplastic Composite Materials, 16.
doi:https://doi.org/10.1177/0892705718820404
Alrubaie, M. A. A., Lopez‐Anido, R., Gardner, D.. (2019). Flexural Creep Behavior of HDPE
Lumber and WPC Lumber made from Thermally Modified Wood. Journal of
Construction and Building Materials. Under review.
Alvarez-Valencia, D., Dagher, H. J., Davids, W. G., Lopez-Anido, R. A., & Gardner, D. J.
(2010). Structural performance of wood plastic composite sheet piling. Journal of
Materials in Civil Engineering, 22(12), 1235-1243.
ASTM International, (2010). Standard Practice for Sampling and Data-Analysis for Structural
Wood and Wood-Based Products D2915-10. West Conshohocken, PA.
ASTM International, (2010). Standard Test Method for Water Absorption of Plastics D570-
98(Reapproved 2010). West Conshohocken, PA.
ASTM International,(2011). Standard Guide for Evaluating Mechanical and Physical Properties
of Wood- Plastic Composite Products D7031-11. West Conshohocken, PA.
ASTM International, (2013). Standard Test Methods for Compressive and Flexural Creep and
Creep-Rupture of Plastic Lumber and Shapes D6112-13. West Conshohocken, PA.
ASTM International, (2013). Standard Test Methods for Flexural Properties of Unreinforced and
Reinforced Plastic Lumber and Related Products D6109-13. West Conshohocken, PA.
ASTM International, & (2015). Standard Specification for Evaluation of Duration of Load and
Creep Effects of Wood and Wood-Based Products D6815-09 (Reapproved 2015). West
Conshohocken, PA.

144
ASTM International, (2015). Standard Test Method for Glass Transition Temperature (DMA Tg)
of Polymer Matrix Composites by Dynamic Mechanical Analysis (DMA) D7028-07
(Reapproved 2015). West Conshohocken, PA.
ASTM International,(2017). standard Test Methods for Flexural Properties of Unreinforced and
Reinforced Plastics and Electrical Insulating Materials D790-17. West Conshohocken,
PA.
Balma, D. A. (1999). Evaluation of bolted connections in wood plastic composites. Washington
State University.
Barbero, E., & Tomblin, J. (1993). Euler buckling of thin-walled composite columns. Thin-
walled structures, 17(4), 237-258.
Barbero, E. J. (2013). Finite element analysis of composite materials using AbaqusTM: CRC
press.
Berube, K., Lopez-Anido, R., & Goupee, A. (2016). Determining the flexural and shear moduli
of fiber-reinforced polymer composites using three-dimensional digital image correlation.
Experimental Techniques, 40(4), 1263-1273.
Brandt, C. W., & Fridley, K. J. (2003). Load-duration behavior of wood-plastic composites.
Journal of Materials in Civil Engineering, 15(6), 524-536.
Brandt, C. W., & Fridley, K. J. (2007). Effect of load rate on flexural properties of wood-plastic
composites. Wood and fiber science, 35(1), 135-147.
Bright, K. D., & Smith, P. M. (2007). Perceptions of new and established waterfront materials by
US marine decision makers. Wood and fiber science, 34(2), 186-204.
Carlsson, L. A., Adams, D. F., & Pipes, R. B. (2002). Experimental characterization of advanced
composite materials: CRC press.
Chakraverty, A., Mohanty, U., Mishra, S., & Satapathy, A. (2015). Sea water ageing of GFRP
composites and the dissolved salts. Paper presented at the IOP conference series:
materials science and engineering.
Chang, F.-C. (2011). Creep behaviour of wood-plastic composites. University of British
Columbia.
Chang, F.-C., Lam, F., & Kadla, J. F. (2013). Application of time–temperature–stress
superposition on creep of wood–plastic composites. Mechanics of Time-Dependent
Materials, 17(3), 427-437.

145
Chang, F.-C., Lam, F., & Kadla, J. F. (2014). The effect of temperature on creep behavior of
wood-plastic composites. Journal of Reinforced Plastics and Composites, 33(9), 883-
892. doi:10.1177/0731684414523691.
Chang, W.-P., Kim, K.-J., & Gupta, R. K. (2009). Moisture absorption behavior of wood/plastic
composites made with ultrasound-assisted alkali-treated wood particulates. Composite
Interfaces, 16(7-9), 937-951.
Chassagne, P., Saïd, E. B., Jullien, J.-F., & Galimard, P. (2005). Three dimensional creep model
for wood under variable humidity-numerical analyses at different material scales.
Mechanics of Time-Dependent Materials, 9(4), 1-21.
Cheng, Q. (2005). Microstuctural Changes in Wood-Plastic Composites (WPC) Due to Extended
Moisture Cycling and its Relationship to Mechanical Performance Changes.
Commerce, D. o. (2018, 11-Jun-2018). Water Temperature Table of All Coastal Regions.
Retrieved from https://www.nodc.noaa.gov/dsdt/cwtg/all.html
Danawade, B., Malagi, R., Kalamkar, R., & Sarode, A. (2014). Effect of span-to-depth ratio on
flexural properties of wood filled steel tubes. Procedia Materials Science, 5, 96-105.
Davids, W. G., Willey, N., Lopez-Anido, R., Shaler, S., Gardner, D., Edgar, R., & Tajvidi, M.
(2017). Structural performance of hybrid SPFs-LSL cross-laminated timber panels.
Construction and Building Materials, 149, 156-163.
Davis-Standard Woodtruder. (2018). Retrieved from https://composites.umaine.edu/equipment-
and-facilities/thermoplastic-composite-extrusion-lab/.
Decew, J. (2011). Development of engineering tools to analyze and design flexible structures in
open ocean environments: University of New Hampshire.
Dura, Matthew Jonathan, "Behavior of Hybrid Wood Plastic Composite-Fiber Reinforced
Polymer Structural Members for Use in Sustained Loading Applications"
(2005). Electronic Theses and Dissertations. 853.
https://digitalcommons.library.umaine.edu/etd/853
Esteves, B., & Pereira, H. (2008). Wood modification by heat treatment: A review.
BioResources, 4(1), 370-404.
Ferdous, W., Manalo, A., & Aravinthan, T. (2016). Behaviour of composite sandwich beams
with different shear span-to-depth ratios. Paper presented at the Mechanics of Structures
and Materials XXIV: Proceedings of the 24th Australian Conference on the Mechanics of
Structures and Materials (ACMSM24, Perth, Australia, 6-9 December 2016).
Fortini, A., & Mazzanti, V. (2018). Combined effect of water uptake and temperature on wood
polymer composites. Journal of applied polymer science, 46674.

146
Fredriksson, D. W., DeCew, J. C., & Tsukrov, I. (2007). Development of structural modeling
techniques for evaluating HDPE plastic net pens used in marine aquaculture. Ocean
Engineering, 34(16), 2124-2137.
Gardner, D., & Han, Y. (2010). Towards structural wood-plastic composites: technical
innovations. Paper presented at the Proceedings of the 6th Meeting of the Nordic-Baltic
Network in Wood Material Science and Engineering (WSE), Tallinn, Estonia.
Gardner, D. J. (2015). Development of structural wood plastic composite timber for innovative
marine application. Retrieved from The University of Maine, Orono, Maine, ME 04469.
Garoushi, S., Lassila, L. V., & Vallittu, P. K. (2012). The effect of span length of flexural testing
on properties of short fiber reinforced composite. Journal of Materials Science: Materials
in Medicine, 23(2), 325-328.
Gibson, R. F. (2016). Principles of composite material mechanics: CRC press.
Hadid, M., Rechak, S., & Tati, A. (2004). Long-term bending creep behavior prediction of
injection molded composite using stress–time correspondence principle. Materials
Science and Engineering: A, 385(1), 54-58.
Haghighi-Yazdi, M., & Lee-Sullivan, P. (2013). Stress relaxation of a polycarbonate blend after
hygrothermal aging. Mechanics of Time-Dependent Materials, 17(2), 171-193.
Haiar, K. J. (2000). Performance and design of prototype wood-plastic composite sections.
Washington State University.
Hamel, S. E. (2011). Modeling the time-dependent flexural response of wood-plastic composite
materials.
Hamel, S. E., Hermanson, J. C., & Cramer, S. M. (2013). Mechanical and time-dependent
behavior of wood–plastic composites subjected to tension and compression. Journal of
Thermoplastic Composite Materials, 26(7), 968-987.
Hamel, S. E., Hermanson, J. C., & Cramer, S. M. (2014). Predicting the flexure response of
wood-plastic composites from uni-axial and shear data using a finite-element model.
Journal of Materials in Civil Engineering, 26(12), 04014098.
Herzog, B., Gardner, D. J., Lopez‐Anido, R., & Goodell, B. (2005). Glass‐transition temperature
based on dynamic mechanical thermal analysis techniques as an indicator of the adhesive
performance of vinyl ester resin. Journal of applied polymer science, 97(6), 2221-2229.
Hosseinaei, O., Wang, S., Enayati, A. A., & Rials, T. G. (2012). Effects of hemicellulose
extraction on properties of wood flour and wood–plastic composites. Composites Part A:
Applied Science and Manufacturing, 43(4), 686-694.

147
InnovaSea Systems, I. (2015). Report on Structural Damage to A4800 AquaPod. Retrieved from
52 South Main Streeet Morrill, Maine 04952, USA:
InnovaSea Systems, I. (2016). A4700 BRIDLE SYSTEM IN GRID MOORING CELL.
Retrieved from www.innovasea.com
Instruments, T. (2018). Dynamic Mechanical Analysis: Basic Theory & applications Training.
Retrieved from
http://people.clarkson.edu/~skrishna/DMA_Basic_Theory_Applications.pdf
Kahl, Melissa, "Structural Design of Hollow Extruded WPC Sheet Piling" (2006). Electronic
Theses and Dissertations. 117.
https://digitalcommons.library.umaine.edu/etd/117.
King, D., & Hamel, S. (2013). The Tensile Creep Response of a Wood-Plastic Composite in
Cold Regions ISCORD 2013: Planning for Sustainable Cold Regions (pp. 771-778).
Klyosov, A. A. (2007). Wood-plastic composites: John Wiley & Sons.
Král, P., Klímek, P., Mishra, P. K., Wimmer, R., & Děcký, D. (2015). Specific modulus and
density profile as characterization criteria of prefabricated wood composite materials.
Acta Universitatis Agriculturae et Silviculturae Mendelianae Brunensis, 63(2), 433-438.
Lenth, C. A., & Kamke, F. A. (2007). Moisture dependent softening behavior of wood. Wood
and fiber science, 33(3), 492-507.
Mark, J. E. (2007). Physical properties of polymers handbook (Vol. 1076): Springer.
. MATLAB. ( 1994-2018). The MathWorks, Inc: MathWorks®. Retrieved from
https://www.mathworks.com/products.html?s_tid=gn_ps
Matuana, L. M., Jin, S., & Stark, N. M. (2011). Ultraviolet weathering of HDPE/wood-flour
composites coextruded with a clear HDPE cap layer. Polymer degradation and stability,
96(1), 97-106.
Mehndiratta, A., Bandyopadhyaya, S., Kumar, V., & Kumar, D. (2018). Experimental
investigation of span length for flexural test of fiber reinforced polymer composite
laminates. Journal of materials research and technology, 7(1), 89-95.
Nair, K. M., Thomas, S., & Groeninckx, G. (2001). Thermal and dynamic mechanical analysis of
polystyrene composites reinforced with short sisal fibres. Composites Science and
Technology, 61(16), 2519-2529.

148
Najafi, S. K., & Kordkheili, H. Y. (2011). Effect of sea water on water absorption and flexural
properties of wood-polypropylene composites. European Journal of Wood and Wood
Products, 69(4), 553-556.
Kazemi, S., Sharifnia, H., & Tajvidi, M. (2008). Effects of Water Absorption on Creep Behavior
of Wood—Plastic Composites. Journal of Composite Materials, 42(10), 993–
1002. https://doi.org/10.1177/0021998307088608
Nuñez, A. J., Marcovich, N. E., & Aranguren, M. I. (2004). Analysis of the creep behavior of
polypropylene‐woodflour composites. Polymer Engineering & Science, 44(8), 1594-
1603.
Ocean®, I. (2018). Instant Ocean® Sea Salt. Retrieved from
http://www.instantocean.com/Products/Sea-Salt-Mixes/sea-salt-mixture.aspx
Page, S. H. (2013). Aquapod Systems aquaculture Aquapod systems for Sustainable Ocean
Aquaculture Aquaculture Sustainable Food Production (pp. 223-235): Springer.
Pedrazzoli, D., & Pegoretti, A. (2014). Long-term creep behavior of polypropylene/fumed silica
nanocomposites estimated by time–temperature and time–strain superposition
approaches. Polymer bulletin, 71(9), 2247-2268.
Pooler, D. J. (2001). The temperature dependent non-linear response of a wood plastic
composite. Washington State University.
Pooler, D. J., & Smith, L. V. (2016). Nonlinear Viscoelastic Response of a Wood–Plastic
Composite Including Temperature Effects. Journal of Thermoplastic Composite
Materials, 17(5), 427-445. doi:10.1177/0892705704038220
RIVERDALE. (2019). Aquamesh Specifications. Retrieved from https://riverdale.com/wp-
content/sellsheets/Aquamesh.pdf
Shao, Y. (2006). Characterization of a pultruded FRP sheet pile for waterfront retaining
structures. Journal of Materials in Civil Engineering, 18(5), 626-633.
Slaughter, A. E. (2006). Design and fatigue of a structural wood-plastic composite.
Stark, N. (2008). Outdoor durability of wood-polymer composites: Woodhead Publishing,
Philadelphia.
Storage, T. M., Brockman, R. A., & Tienda, K. M. (2013). Analysis of Data Reduction Strategy
used in TA Instruments Q800 DMA Test System.
Struik, L. (1989). Mechanical behaviour and physical ageing of semi-crystalline polymers: 3.
Prediction of long term creep from short time tests. Polymer, 30(5), 799-814.

149
Sullivan, J. (1990). Creep and physical aging of composites. Composites Science and
Technology, 39(3), 207-232.
TAinstruments.com. (2010). TAinstruments Thermal Analysis. Retrieved from
http://www.tainstruments.com/pdf/brochure/dma.pdf
Tajvidi, M., Falk, R. H., & Hermanson, J. C. (2005). Time–temperature superposition principle
applied to a kenaf‐fiber/high‐density polyethylene composite. Journal of applied polymer
science, 97(5), 1995-2004.
Tajvidi, M., & Simon, L. C. (2015). High-temperature creep behavior of wheat straw
isotactic/impact-modified polypropylene composites. Journal of Thermoplastic
Composite Materials, 28(10), 1406-1422.
Tamrakar, Sandeep, "Effect of Strain Rate and Hygrothermal Environment in Wood Plastic
Composite Sheet Piles" (2011). Electronic Theses and Dissertations. 1576.
https://digitalcommons.library.umaine.edu/etd/1576
Tamrakar, S., & Lopez-Anido, R. A. (2011). Water absorption of wood polypropylene composite
sheet piles and its influence on mechanical properties. Construction and Building
Materials, 25(10), 3977-3988.
Tamrakar Sandeep, R. A. L.-A., Alper Kiziltas, Douglas J Gardner (2011). Time and temperature
dependent response of a wood–polypropylene composite. Composites Part A: Applied
Science and Manufacturing, 42(7), 834-842.
Tangent Technologies, L. (2015). Polyforce sturctural recycled plastic lumber. Retrieved from
http://tangentusa.com/wp-content/uploads/2016/01/PolyForce_DataSheet_01_20_16.pdf
Thomas Snape, S. E. (2015). Fish Cage Plastic Lumber Testing: Compression Properties (15-39-
1263). Retrieved from UMaine Advanced Structures and Composite Center, 35 Flagstaff
Rd, University of Maine, Orono, ME 04469:
Timoshenko, S., & Goodier, J. Theory of elasticity. 1951. New York, 412, 108.
Vandenbroucke, K., & Metzlaff, M. (2013). Abiotic stress tolerant crops: genes, pathways and
bottlenecks Sustainable Food Production (pp. 1-17): Springer.
Vincent Caccese, P. D., P.E. (2006). Structural Testing of Various Configurations for the
AquaPod Net Pen (C2004-018-01).
Xu, B., Simonsen, J., & Rochefort, W. s. (2001). Creep resistance of wood‐filled
polystyrene/high‐density polyethylene blends. Journal of applied polymer science, 79(3),
418-425.

150
BIOGRAPHY OF THE AUTHOR
Murtada Abass A Alrubaie was born in Amara City, Maysan Province, Iraq, on February
12, 1983. He was raised in Amara, Maysan and graduated from Althawra High School in 2001.
He attended the University of Basra, Iraq, and graduated in 2005 with a Bachelor’s of Science
degree (B.Sc.) in Civil Engineering. He spent two years working international company (Mott
MacDonald) as a site and supervisor engineer. He then travelled to New Delhi, India, to attend a
six-month course for academic writing in Inlingua from Dec 2007 to June 2008. Murtada
attended the Universiti Putra Malaysia, Serdang, Selangor Darul Ehsan, Malaysia, and graduated
in 2010 with a Master of Science degree (M.Sc.) Structural Engineering and Constructions.
Before Murtada Joins the University of Maysan, Amara, Mayan, Iraq, as associate lecturer in
2014, he worked as a site construction manager with two International petroleum companies
(Weatherford Oil Tool Middle East Limited, PetroChina International Iraq FZE Iraq Branch)
from 2010 to 2013. Murtada joined the University of Maine in Fall 2014 as a Doctor of
Philosophy student in the department of Civil and Environmental Engineering as a sponsored
student from the High Committee for Education Development in Iraq (HCED-Iraq). Murtada is a
candidate for the Doctor of Philosophy degree in Civil Engineering from the University of Maine
in May of 2019.