Embed Size (px)
Citation preview

Louisiana State UniversityLSU Digital Commons
LSU Master's Theses Graduate School
2011
Investigating the use of graphic organizers forwritingLaura Nicole DelroseLouisiana State University and Agricultural and Mechanical College, [email protected]
Follow this and additional works at: https://digitalcommons.lsu.edu/gradschool_theses
Part of the Communication Sciences and Disorders Commons
This Thesis is brought to you for free and open access by the Graduate School at LSU Digital Commons. It has been accepted for inclusion in LSUMaster's Theses by an authorized graduate school editor of LSU Digital Commons. For more information, please contact [email protected].
Recommended CitationDelrose, Laura Nicole, "Investigating the use of graphic organizers for writing" (2011). LSU Master's Theses. 2537.https://digitalcommons.lsu.edu/gradschool_theses/2537

INVESTIGATING THE USE OF GRAPHIC ORGANIZERS FOR WRITING
A Thesis
Submitted to the Graduate Faculty of the Louisiana State University and
Agricultural and Mechanical College in partial fulfillment of the
requirements for the degree of Master of Arts
in
The Department of Communication Sciences and Disorders
by Laura Nicole Delrose
B.A., University of California Santa Barbara, 2009 May 2011

ii
TABLE OF CONTENTS
LIST OF TABLES……………………………………………………………………….iii
LIST OF FIGURES………………………………………………………………………iv
ABSTRACT……………………………………………………………………………….v
REVIEW OF LITERATURE………………………………………..................................1 Writing Instruction…………………………………………………………….......1 Syntactic Complexity……………………………………………………………...2 Sentence Combining ……………………………………………………………...3 Discourse………………………………………………………….........................4 Graphic Organizers……………………………………………………………….5 Types of Graphic Organizers……………………………………………..6 Suggestions for an Effective Graphic Organizer…………………………7 GO Charts and Writing…………………………………………………………...8 Graphic Organizers and Syntax………………………………………………….11
METHODS………………………………………………………………………………14 Participants………………………………………………………………...……..14 Test Battery……………………………………………………………………....16 Materials………………………………………………………………………….17 GO Charts………………………………………………………………...17 Probes…………………………………………………………………….17 Procedure…………………………………………………………………………18 Data Analysis……………………………………………………………………..19
RESULTS………………………………………………………………………………...20 Oral Sentence Combining………………………………………………………...20 Written Sentence Combining……………………………………………………..21 Contextual Language……………………………………………………………..22 Story Construction………………………………………………………………..25 Summary………………………………………………………………………….26
DISCUSSION…………………………………………………………………………….27 Effectiveness of GO Charts……………………………………………………….27 Syntax……………………………………………………………………………..27 Discourse………………………………………………………………………….29 Limitations………………………………………………………………………...30 Future Studies……………………………………………………………………..31
REFERENCES……………………………………………………………………………33
VITA……………………………………………………………………………………...36

iii
LIST OF TABLES
1. Profile of Participants by Age, Grade, Standard Writing Score, Oral Language Scores, and Nonverbal Quotient……………………………………………………..15
2. Profile of Syntactic Structures, Contextual Language, and Story Construction Scores for Final Stories Generated Using GO Charts and Adult Prompts and Feedback by Age……………………………………………………………………..23
3. Profile of Conjunctions (C) and Adverbial Clauses (A) Produced by Younger and Older Subjects in the Weekly Written Sentence Combining Probes…………………………………………………………………………….......24

iv
LIST OF FIGURES
1. Hierarchical GO Chart Profiling Superordinate and Subordinate Nodes…………….12
2. Example of GO Chart Used to Organize Information for Writing…………………...17
3. Mean Oral Sentence Combining Scores by Age and Time…………………………..20
4. Mean Written Sentence Combining Scores by Age and Time……………………….21
5. Mean Written Contextual Language Scores by Age and Time………………………25
6. Mean Written Story Construction Scores by Age and Time………………………...26

v
ABSTRACT
Students are placed under increasing demands for more complex syntax and
discourse structure in oral and written language as they age. Children with language and
learning disabilities struggle to grasp the organization and relationships between the facts
of the topic, making writing an increasingly daunting task. In addition, these students
must also master conventions such as vocabulary, spelling, punctuation, and syntax to
produce a written essay (Schumaker & Deshler, 2003). This study explored the efficacy
of graphic organizers as a strategy to facilitate higher complexity of syntactic and
discourse structures in sentence and story formation. After seven weeks of intervention,
the impact of graphic organizers was assessed by comparing spontaneously written stories
to scaffolded stories as well as comparing sentence combining skills from pre- to post-test.
The results suggest that graphic organizers can be an effective tool used in the writing
process to generate sentences and narratives containing more complex structure of syntax
and discourse.

1
REVIEW OF LITERATURE
Learning to write is difficult for all children, but in particular for those with
language based learning difficulties. These students struggle with the language skills of
spelling, sentence formation, word choice, and punctuation, but also have difficulty with
the cognitive processes of planning and organizing the topic for writing (Schumaker &
Deshler, 2003). Despite their difficulties with all of these aspects of language (Catts,
1993; Catts, Adlof, & Weismer, 2006), students with language and learning disabilities
are expected to write essays with sufficient complexity and coherence to pass high-stakes
assessments. These tests are used to make decisions such as whether the child will
progress to the next grade level (Gregg, Coleman, Davis, & Chalk, 2007). Therefore, it is
critical to develop interventions that are effective in improving writing abilities for this
population.
Writing Instruction
Writing instruction for first and second grades focuses on learning to spell,
punctuate, print, and generate simple sentences that tell a single, simple fact. Third grade
is when many students actually become writers. They have sufficient skills to write with
some fluency and independently write simple sentences with a few basic adjectives (size,
color) and verbs which they tend to use over and over again. In school, explicit
instruction is presented to third graders on the use of conjunctions to combine sentences
as an initial step toward becoming better writers. Students also are taught to write longer
essays and stories that have greater structure, but in general still view writing as putting
words down on paper (Calkins, 1994). However, writing becomes more refined as the
school year progresses and new structures in syntax and discourse emerge.

2
Fourth graders and above are expected to use writing in nearly every subject area
and to master the appropriate discourse structures for narrative writing, expository
nonfiction writing, and persuasive writing. In school, explicit teaching focuses on the
writing process, including prewriting organization, drafting, revising, editing and
publishing. Longer, more complex, and more varied sentences are generated during this
process, including adverbial and relative clauses. As children age, the syntactic
complexity, including the number of sentences with dependent clauses, increases (Loban,
1976; Snow & Kim, 2010) and discourse structure becomes more embedded and refined
(Calkins, 1994; Snow & Kim, 2010).
Syntactic Complexity
One of the primary measures of writing achievement is syntactic complexity.
Measures such as average sentence length (Hunt, 1970; Loban, 1976) have been used to
compare the writing of low-achieving and high-achieving children and adolescents. In
his longitudinal study, Loban (1976) showed that high-achieving students had longer
sentences and more clauses in their writing, including adverbial, adjectival, infinitive,
conjoined, and embedded, at each grade level from 4th through 12th grades. According to
Loban, 4th grade is the level where a variety of dependent clauses first appear in writing
although they are present in oral language by first grade. In addition, high achieving
students made greater gains in these measures for both oral and written language each
year in school than low-achieving students, so the gap between them widened. In
addition to shorter and less complex sentences (Anderson, 1982; Hunt, 1970; Loban,
1976), low-achieving students also make more grammatical errors when writing
(Windsor, Scott, & Street, 2000). Currently in schools there is no tolerance for

3
grammatical errors in final draft writing, and increasing mastery over complex syntactic
structures is expected (Gregg et al., 2007; Ravid & Tolchinksy, 2002). These findings
suggest that improving syntactic skills in both speaking and writing is necessary for
language and learning disabled students to achieve in academics.
Sentence Combining
Sentence combining has been found to be one of the most effective instructional
methods for improving syntactic complexity in writing. In several reviews of the extant
literature, sentence combining has been shown to be consistently more effective in
improving writing scores than other grammatical approaches, including teaching parts of
speech, sentence diagramming, or instruction in transformational grammar rules
(Abrahamson, 1977; Amiran & Mann, 1982; Andrews et al., 2005; Hillocks, 1984).
Mellon (1969) taught grammatical terms using transformational grammar rules along
with a sentence combining component and found small significant gains. O’Hare (1973)
replicated the study using sentence combining alone with no reference to the grammatical
terminology or rules and showed significant gains. Hillock (1984) reviewed the extent
research and concluded that syntactic complexity increased for subjects across studies
comparing sentence combining to a control condition. In those studies, sentence
combining instruction was more than twice as effective as other conditions for improving
writing abilities. These findings held across age levels from third grade through
secondary grades and for both typically developing and learning disabled students.
Students with identified disabilities and disadvantaged students both showed greater
change than higher performing peers following sentence combining practice, indicating

4
explicit instruction can help close the gap (Hunt & O’Donnell, 1970; Perron, 1975; Ross,
1972; Schuster, 1977; Waterfall, 1978).
Hudson (2000) conducted an analysis of 13 previous reviews and 28 additional
studies and concluded that the evidence for the efficacy of using sentence combining to
improve writing skills was much stronger than commonly supposed. Her analysis was
consistent with others showing that traditional grammar teaching is ineffective but
sentence combining does result in gains. Wyse (2001) came to a similar conclusion
following a review of 15 studies, stating that sentence combining is the one method that
was beneficial for fostering syntactic maturity in writing.
Discourse
While syntactic complexity is important to writing, so is the discourse. Discourse,
or the structure of the text used to establish links between sentences, groups of sentences,
and elements within sentences, is important for communicating meaning and intent. The
style and structure of the discourse varies depending upon the type of writing (Britton,
1976). For example, a story would follow patterns of narrative discourse, while a report
would conform to one or more expository text structures. In writing, discourse is parsed
into paragraphs, with each paragraph focusing on a topic or theme. The opening sentence
generally states the topic, with subsequent sentences developing and supporting the
theme. The extent to which a text makes sense and maintains a focus is related to both
cohesion and coherence (Halliday & Hasan, 1976).
Cohesion is the sense of a logical flow of information from previous ideas or
statements to new information as the text is produced. This sense of flow is created by
choices in words or word order that serve as ties, connecting each new sentence to those

5
that have gone before. Coherence is the sense that the writer of the text establishes a topic,
and each succeeding sentence bears a logical relationship to that topic, highlighted by
transitional phrases and words that enable the receiver to understand how the ideas are
related to each other. Obviously, the grammar and word choices of individual sentences
contribute to both the cohesion and coherence of the writing. But for a text to make sense,
the writer must create a unified whole, with attention to the words and relationships of
meaning expressed in the surrounding sentences and paragraphs (Halliday & Hasan,
1976).
To compose a coherent text, the writer must have the ability to structure a
meaningful text using the conventions of written language. To accomplish this, the
writer must simultaneously coordinate spelling, sentence formation, word choice,
punctuation, and handwriting while developing a topic or theme within discourse. This
can be a daunting task for typically developing writers who have relative proficiency with
each of these components. For children with language learning disorders who have
deficits across these abilities, writing can be overwhelming.
Graphic Organizers
One tool that has been shown to be effective for structuring written discourse is
graphic organizers (Ellis & Howard, 2005). Graphic organizers (GO charts) are visual
and spatial displays of information that graph the logical relationships between the key
concepts, facts, terms, or ideas from the learning task (DiCecco & Gleason, 2002). Key
concepts, usually single words or phrases, are arranged logically on the GO chart with
lines, arrows, and spatial representations clearly highlighting interrelationships and
providing a structured way to see a picture of the information. GO charts are designed to

6
extract salient information and eliminate extraneous information (i.e., the information
that frequently distracts learning disabled students). They provide a foundation for an
explicit, organized way of visually expressing the relationship between new and existing
knowledge and profiling the connections between them (Ellis & Howard, 2005; Kim,
Vaughn, Wanzek, & Wei, 2004).
Types of Graphic Organizers. Also referred to as semantic maps, cognitive
maps, advance organizers, or concept diagrams, GO charts can be completed in many
different formats such as cause-and-effect diagrams, compare-and-contrast diagrams,
sequence charts, and main-idea-and-detail charts (Baxendell, 2003). Well structured GO
charts can be used flexibly to represent multiple goals. For example, the cause-and-effect
diagram aids students in visualizing the relationship between a single cause and a single
effect, or the focus can be on a single main event and its primary causes and effects. This
format allows students to organize thoughts before writing by displaying abstract
relationships in a graphic representation where the relationships are clearly displayed
(Kim et al., 2004). A different presentation of complex relationships is displayed in
compare-and-contrast diagrams which visually depict the similarities and differences
across main ideas. This format can be used to present one main idea with its supporting
details along one strand in the diagram which is then contrasted with the opposing main
idea, or the ideas can be compared and contrasted point by point across main ideas
(Baxendell, 2003).
Sequence charts are used to illustrate a series of events. They flow in one
direction, either right to left or top to bottom, and are often connected by arrows and
numbered boxes to ensure clear understanding of the relationships of the sequence of
7
events. This format is beneficial to learning disabled students in the writing process since
it visually organizes important events sequentially (Ellis & Howard, 2005). Another
challenge faced by learning disabled students is difficulty conceptualizing and
differentiating main ideas from details. The main-idea-and-detail chart helps to extract
main ideas and supporting details from extraneous information, allowing the focus to
remain on relevant information (Ellis & Howard, 2005). Students can use this format in
the writing process to create paragraphs that focus on one main idea and details
highlighting the importance of the main idea.
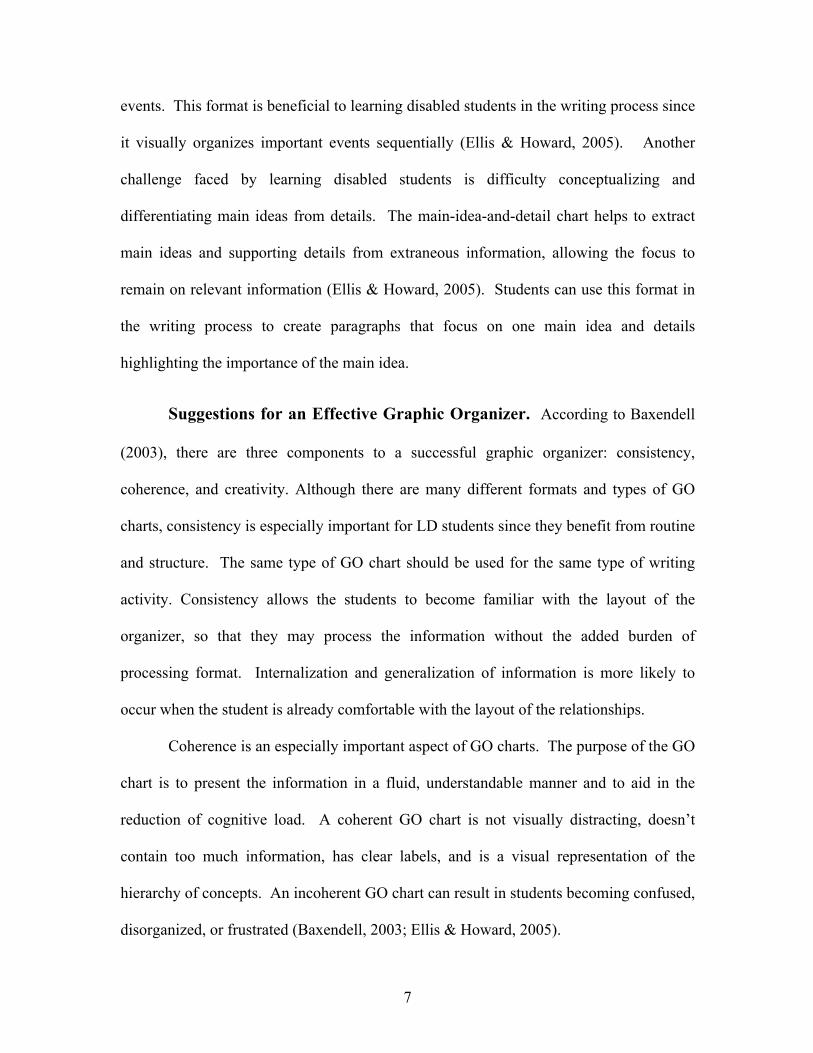
Suggestions for an Effective Graphic Organizer. According to Baxendell
(2003), there are three components to a successful graphic organizer: consistency,
coherence, and creativity. Although there are many different formats and types of GO
charts, consistency is especially important for LD students since they benefit from routine
and structure. The same type of GO chart should be used for the same type of writing
activity. Consistency allows the students to become familiar with the layout of the
organizer, so that they may process the information without the added burden of
processing format. Internalization and generalization of information is more likely to
occur when the student is already comfortable with the layout of the relationships.
Coherence is an especially important aspect of GO charts. The purpose of the GO
chart is to present the information in a fluid, understandable manner and to aid in the
reduction of cognitive load. A coherent GO chart is not visually distracting, doesn’t
contain too much information, has clear labels, and is a visual representation of the
hierarchy of concepts. An incoherent GO chart can result in students becoming confused,
disorganized, or frustrated (Baxendell, 2003; Ellis & Howard, 2005).

8
Creativity in the use of GO charts is also important for engaging the learning of
LD students. In this context, creativity does not refer to the stylistic choice of making the
GO charts themselves, rather it refers to how the GO charts are implemented by the
teacher (Baxendell, 2003). Students need to be actively included in creating the GO
chart, bringing prior knowledge and discussion to develop the main ideas and details
(Ellis, Farmer, & Newman, 2005).
GO Charts and Writing
The efficacy of graphic organizers as a tool to guide students through the writing
process was examined by Meyer (1995). This study was designed to evaluate the writing
of third grade students along four dimensions: content and organization, usage, sentence
construction, and mechanics. A pre- and post-writing sample was gathered and evaluated
for each participant. Both groups were given the same writing topic and used the
computer program Storybook Weaver by MECC to write their stories. The experimental
group incorporated the use of a GO chart to complete writing assignments, while the
control group completed writing assignments without a graphic organizer. Throughout
the 12 weeks, the experimental group discussed advantages and other uses of a GO chart,
completed organizers as a group and individually, and completed creative writing
assignments using the graphic organizer.
At the beginning of the study, the control group demonstrated significantly higher
scores on the writing sample. At the end of the study, the mean gain was 0.38 for the
control group and 1.33 for the experimental group. Thus, the experimental group
improved more than the control group, improving to almost the same level as the control

9
group at the beginning of the study. This improvement, while small, indicated the value
of using graphic organizers in the writing process.
Myrick and Siders (2007) examined the effects of using graphic organizers in a
classroom setting on vocabulary development and writing abilities of sixth graders.
Students were enrolled in the same curriculum and taught the same material; however,
the control group was instructed using only traditional text-based strategies. The
experimental group was instructed using the Makes Sense Strategies (MSS) model (Ellis,
2004) using graphic organizers in conjunction with traditional text-based methods. The
MSS model is based on three principles: active engagement in processing new
information in meaningful ways promotes better student learning, increasing the ease in
synthesizing information is more effective than reducing the cognitive complexity of the
information, and learning should not become a rote process. This model focuses on
implementing techniques that enhance students’ ability to process new information,
connect it to prior knowledge, and synthesize the relationship between new and existing
knowledge.
Improvements were determined by evaluating students’ writing samples for
degree of content knowledge, coherence, spelling and grammar, and neatness. For both
groups, each element was rated on a scale of one to four points, representing the degree
of performance in each area. In addition, the number of total words in each writing
sample was counted. A pre-test, mid-test, and post-test were intended to be collected for
both groups; however, due to a lack of funding, a post-test was only collected from the
experimental group. Comparison between groups and within the control group was based

10
on pre- and mid-test scores. Comparison within with experimental group was based on
pre- and post-test scores.
The experimental group demonstrated a 26% increase in average number of
words contained in the writing sample from pre-test to post-test; while the control group
demonstrated a significant decrease in average number of words used from pre-test to
mid-test, decreasing by 48%. In the dimensions of coherence and depth of knowledge,
the experimental group displayed improvements, and the control group displayed
declines in overall scores. The authors attribute the control group’s decrease in scores to
disengagement from processing new information and due to a lack of interest in the topic.
This study suggests that graphic organizers in conjunction with traditional text-based
methods allow for an increase of clarity of new information, relation of new knowledge
to prior knowledge, and ability to logically organize thoughts into a coherent sequence.
James, Abbott, and Greenwood (2001) tested a research-based model comprised
of three main components: graphic organizers, a six-trait model for assessment, and a
process-writing-model, termed writer’s workshop. The model was implemented for nine
weeks. Students were divided into two groups based on writing abilities. The higher-
level students were instructed in the model described below for the first nine weeks, and
the lower level students were instructed during the second nine weeks.
The writer’s workshop incorporated pre-writing, drafting, self- and peer-editing, a
teacher-student conference, revision, and publishing, all facilitated by the teacher. Two
graphic organizers were used during the writer’s workshop. One variation of a main-
idea-and-detail graphic organizer was used during the pre-writing stage to aid students in
formulating main ideas and details about the topic on the idea “light bulb.” Another

11
graphic organizer combining two types, the main-idea-and-detail and the sequence
graphic organizer, was implemented in the drafting stage. This “outline” graphic
organizer assisted students in separating main ideas from details and synthesizing them
into a coherent point. The high group’s “outline” graphic organizer also served as the
foundation for structuring a five paragraph essay; while the low group’s organizer was a
simplified version serving as the foundation for a single paragraph essay. The six-trait
model identified and explained six important traits of good writers.
A wait list control group design was used where each group of students
experienced an experimental phase for nine weeks, and a control, or no instruction, phase.
Students were taught for 30 minutes daily and chose their own writing topics.
Comparison of pre- and post-testing scores revealed that both groups made greater gains
during the experimental phase, but the lower level group demonstrated greater
improvement.
Graphic Organizers and Syntax
While graphic organizers have been used to support the discourse structures of
writing, the same GO chart also can be used to support sentence formation. Hierarchical
graphic organizers present information in a tree diagram with subordinate information
placed in successively lower nodes (topic at the top level; subtopics below; main ideas
below their respective subtopics; details subordinated under subtopics) (see Figure 1).
The key points printed within nodes can provide a framework to generate sentences,
including combining sentences to generate coherent ideas. The adult can help students
generate sentences by pointing to successive words to be incorporated into grammatical
utterances. The child can combine the words from the chart using function words to

12
form a sentence (e.g., “The desert is very hot during the day time.” Or “During the day, it
is very hot in the desert.”) The child can the combine the words from another subtopic to
form a second sentence and so forth, creating a passage with a coherent discourse
structure supported by the same GO chart. While this strategy has been used clinically,
no research exploring use of GO charts as a method of increasing syntactic complexity
was found in this literature search.
Figure 1. Hierarchical GO Chart Profiling Superordinate and Subordinate Nodes
The purpose of this study is to determine the effectiveness of incorporating
graphic organizers into the writing process in both discourse and sentence formation.
The specific questions of this study are:
1. Can GO charts be used as an effective tool to enable children to combine simple
sentences into compound and complex structures with assistance?
2. Will the process of writing text using graphic organizers with a focus on
combining sentences result in increases in oral and written sentence combining?
3. Will the process of writing text using graphic organizers results in more complex
discourse structures in spontaneously generated stories?

13
4. Will the use of GO charts have a differential effect on 3rd graders compared to
older but delayed writers?

14
METHODS
This study examined the effects of the use of Graphic Organizers (GO Charts) on
the sentence combining and writing skills of children across a range of ages and
developmental levels. Specifically, the effectiveness of using the same GO chart, with
adult scaffolding directed at the child’s individualized abilities, was examined.
Comparisons were made between third grade students who are just being introduced to
conjunctions and compound sentences in school versus older students who are expected
to write using a wide range of sentence types.
Participants
Participants were 10 children, nine males and one female, participating in an after
school language-reading-writing program for language based academic delays. The
program met for 2 hours one day per week. Participants were referred by their parents as
performing below peers in reading and/or writing. The third grade group, designated the
younger group (Y) was comprised of five participants ranging in age from 8;4 to 9;0
years. The older group (O) was comprised of five participants, including three fourth
graders (age 10;2-10;11), one sixth grader (13;4 years) and one eighth grader (14;5 years).
Each participant was administered an assessment battery at pre-test and post-test
comprised of the Gray Oral Reading Test – 4th Edition (GORT-4) (Wiederholt & Bryant,
2001), the Sentence Combining subtest of the Test of Language Development –
Intermediate 3rd Edition (TOLD I:3) (Newcomer & Hammill 1997), Test of Nonverbal
Intelligence (TONI-2) (Brown, Sherbenou, & Johnsen, 1990), and the spontaneous
written story subtests of the Test of Written Language – 3rd Edition (TOWL-3) (Hammill
& Larsen, 1996). TONI and GORT report quotient scores with a mean of 100 and SD of

15
15; TOWL and TOLD I-3 report scaled scores with a mean of 10 and SD of 2. Table 1
presents a profile of participants at pre-test.
Table 1 Profile of Participants by Age, Grade, Standard Writing Score, Oral Language Scores, and Nonverbal Quotient. TOWL . Oral Written Context Story Par Gender CA Grade SenCom SenCom Lang Construct GORT TONI
Younger Group
1 M 8;4 3 4 11 9 7 100 --
2 M 8;8 3 9 9 12 8 85 107
3 M 8;10 3 9 12 9 6 67 120
4 F 8;11 3 14 11 10 9 100 112
5 M 9;0 3 7 7 7 7 100 108
Older Group
6 M 10;2 4 8 11 10 10 94 115
7 M 10;5 4 4 8 7 10 85 81
8 M 10;11 4 6 -- 12 11 76 --
9 M 13;4 6 2 4 2 3 67 97
10 M 14;5 8 8 4 4 10 70 101
________________________________________________________________________
The test results revealed that all but one participant performed in the average
range for nonverbal intelligence (TONI) with missing data for two participants. Six
participants showed standard scores in reading in the average range, while eight ranged
from very poor to below average. All but two of the participants produced written stories
16
in the average range for Story Construction, while four ranged from very poor to below
average for Contextual Language. Three students scored poor to below average for
written sentence combining while five scored very poor to below average for oral
sentence combining.
Test Battery
The GORT-4 (Wiederholt & Bryant, 2001) assesses reading accuracy, fluency,
and comprehension using oral reading of passages and responses to comprehension
questions. The GORT-4 yields two standard scores (Fluency and Comprehension) that
are combined into an overall reading quotient.
The Sentence Combining subtest of the TOLD I:3 (Newcomer & Hammill, 1997)
is designed to assess complex syntactic abilities by orally combining two sentences into
the shortest form possible that includes all key elements in the stimulus sentences.
The TONI-2 (Brown, Sherbenou, & Johnsen, 1990) is a measure of intelligence
that does not rely on spoken language. It requires subjects to solve increasingly more
complex problems by completing a visual pattern in which parts of the pattern are
missing.
The TOWL-3 (Hammill & Larsen, 1996) evaluates skills of writing for children
from 7;0 years through 17;11 years of age. The contextualized subtest was given which
measures language (syntax, punctuation, spelling) and story construction within stories
generated in response to a picture stimulus. One of the contrived subtests, Sentence
Combining, was administered to all subjects. Two different forms of the test were given
at pre-test and post-test.

17
Materials
GO Charts. A series of Hierarchical Graphic Organizers (i.e., GO Charts) were
used across eight weeks of intervention. Each GO Chart was used to generate the writing
for the week (i.e., two sessions) and contributed to the theme of similarities and
differences between brown bears and polar bears. The theme corresponded with a focus
on bears in the stories each group read. The GO Charts included information about topics
such as comparing physical appearance, habitat, diet, and care of young. An example GO
Chart is shown in Figure 2.
Figure 2. Example of GO Chart Used to Organize Information for Writing
Probes. Two pairs of sentences were presented each week as a sentence
combining probe. For one set, both sentences were simple, following a NP + VP + Ob
pattern. The object of the sentence varied, including a NP, PP, Adverb or Adjective.
The second set was composed of more complex sentence structures. The children were
instructed to combine the sentences by generating two written sentences that combined
each pair. The two sentence pairs were read to the subjects while they followed along.

18
They then wrote the combined sentences with no assistance or feedback. The probe was
discontinued after six minutes.
The probes were scored using a 0-1 scale, with 0.5 credit possible. The following
rubric was used to score the sentences generated by the subjects:
Score Criteria
0 Did not combine sentences in any way
Key constituents of one or more sentences missing
No added conjunctions or relative pronouns
Re-copied sentences verbatim
.5 Combined sentences, but not with the appropriate conjunction or
relative pronoun
Combined sentences appropriately, but key constituents of one or
more sentences missing
1 Combined sentences using adverbial clause or relative
clause
All key constituents of both sentences present
Procedure
The concepts to be explored were prepared ahead of time, but a blank GO Chart
was presented on a white board. Illustrated picture books were used to explore the
planned concepts interactively with the children. The adult then prompted the children to
determine what key concepts should be written on the GO Chart and where they should
be placed. Once constructed, the adult prompted the children to generate a sentence by
asking children to combine key words into a complete sentence. For example, as the

19
adult pointed successively to the words “diet” “brown bear” “plants” “berries” “grass”
the children generated a sentence such as “The diet of the brown bear includes plants like
berries and grass.” Several children were invited to generate a sentence using the key
words, and assisted by the adult as needed. The procedure would then be repeated using
the next nodes on the GO Chart.
Following the oral practice creating sentences using the GO Chart, each child
would begin to write his passage using the GO Chart. During this time, the clinician
would provide feedback to the child on the syntax, word choice, punctuation, or spelling.
Children with less developed writing skills would be helped to write a sentence using
only a few key concepts. More advanced writers would be encouraged to write a more
challenging sentence, such as one that compared and contrasted the brown bear and polar
bear.
Data Analysis
Following seven weeks of intervention, alternate forms of the TOLD oral
sentence combining and the TOWL writing subtests were administered. Results were
subjected to a two-way analysis of variance to compare gain scores between pre-test and
post-test for age groups for the oral sentence combining and writing measures.
Inter-rater consistency for the probe measures were determined by comparing
scores of a doctorate student from the Department of Communication Sciences and
Disorders at LSU and the scores of the experimenter who independently scored all daily
probes for all subjects. Inter-rater agreement was 84.8%. Disagreements in scoring
were resolved using consensus between the two scorers.

20
RESULTS
For each dependent variable a 2 (age group) by 2 (time of measurement) mixed
model analysis of variance was calculated. If Mauchly’s Test of Spericity indicated that
the error covariance matrix of the dependent variable was proportional to an identity
matrix, the uncorrected F values were used. Otherwise, the Greenhouse-Geisser
correction was applied.
Oral Sentence Combining
The mean pre-test and post-test scores for the younger and older subjects are
profiled in Figure 3 for Oral Sentence Combining. At pre-test the younger group
produced a mean oral sentence score of 8.60 (standard deviation = 3.65) compared to the
older group’s mean of 5.60 (standard deviation = 3.38). The younger group improved by
2.0 to a mean of 10.6 (standard deviation = 3.65) while the older group improved by 1.2
to a mean of 6.8 (standard deviation = 2.59).
Figure 3. Mean Oral Sentence Combining Scores by Age and Time
The significant effect for time of measurement (F = 7.642, df 1,8, p < .05) showed that
the children, as a group, improved from pre-test to post-test. The non-significant
0
2
4
6
8
10
12
pre post
Oral Sentence
Combination
younger
older

21
interaction of subject group by time of measurement (F< 1.0, df 1,8, p < .509), showed
that there was no difference in the improvements of one group compared to the other.
Written Sentence Combining
The mean pre-test and post-test scores for the younger and older subjects are
profiled in Figure 4 for Written Sentence Combining. At pre-test the younger group
produced a mean oral sentence score of 10.0 (standard deviation = 2.0) compared to the
older group’s mean of 5.40 (standard deviation = 4.22). The younger group did not
improve at post-test (mean 10.6, standard deviation = 3.65) while the older group
improved by 0.8 to a mean of 6.2 (standard deviation = 4.20). The non-significant effect
for time of measurement (F = 1.000, df 1,0, p < .347) showed no group gains from pre-
test to post-test. The non-significant interaction of subject group by time of measurement
(F = 1.000, df 1,0, p < .347) showed that there was no difference in the improvements of
one group compared to the other.
Figure 4. Mean Written Sentence Combining Scores by Age and Time
Table 2 profiles the scores for the two weekly written sentences obtained from
probes. The total number of sentences combined using conjunctions “and, “or,” or “but”
0
2
4
6
8
10
12
pre post
Written Sentence
Combination
younger
older

22
are tallied under “C” while those sentences that formed adverbial clauses (i.e., “because,”
“so,” “since”) are tallied under “A.” No instances of the use of relative clauses occurred.
Totals are provided for individuals and by groups.
Contextual Language
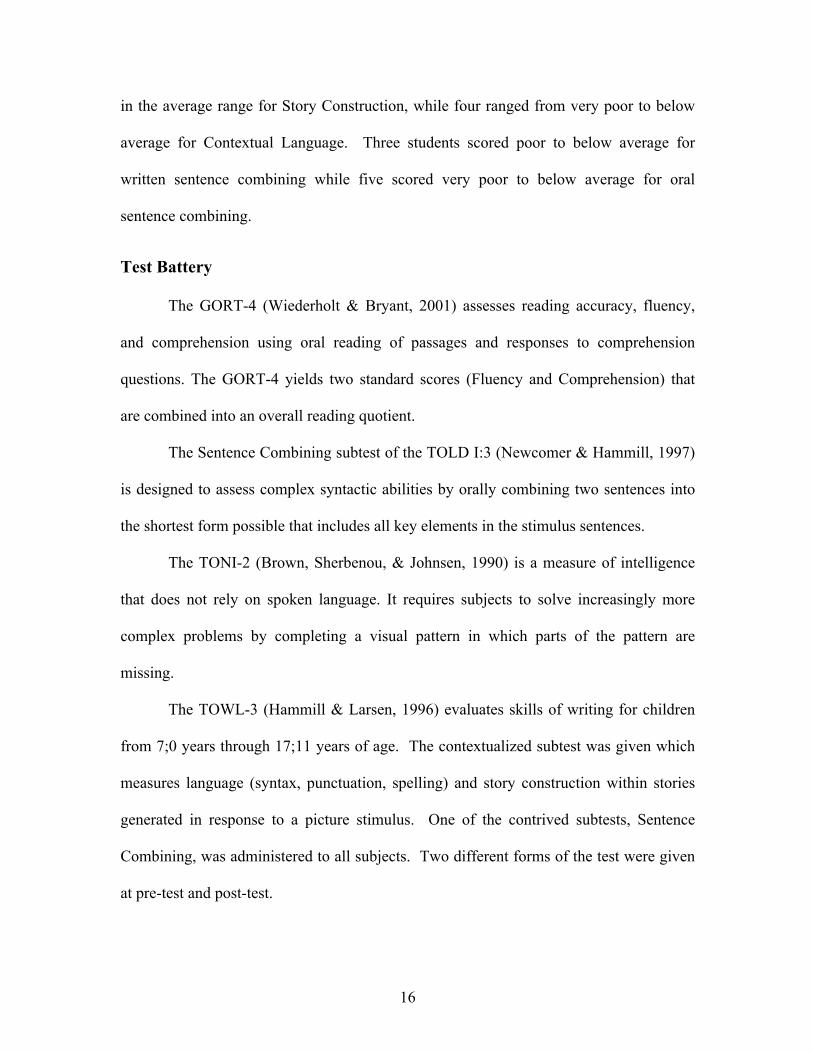
Table 3 provides an analysis of the syntactic complexity of sentences generated
using the Hierarchical GO Chart with feedback and prompts provided. All ten subjects
produced a complex syntactic structure, either a sentence using one a simple or adverbial
conjunction, or a relative pronoun. Seven of the ten subjects produced at least one
relative clause. Four of these subjects were from the younger group, and only three were
from the older group. The younger group produced more conjunctions, relative, and
adverbial clauses, thus producing a greater number of complex syntactic structures
overall. The stories were also graded using the TOWL rubric and scored using the
standard score to provide a comparison to the subject’s story with support and without
support. The rubric scores indicate that if the sentences would have been spontaneously
generated by the subject, both the Contextual Language and Story Construction would
have scored in the average to superior range.
The scaffolded story was compared to the spontaneously generated stories
generated at pre-test and post-test. The mean pre-test, post-test, and scaffolded scores for
the younger and older subjects are profiled in Figure 5 for Written Contextual Language,
measured within a written narrative. At pre-test the younger group produced a mean
standard score of 9.4 (standard deviation = 1.81) compared to the older group’s mean of
7.00 (standard deviation = 4.12). The younger group did not improve at post-test (mean
23
9.4, standard deviation = 1.67) while the older group decreased their standard score by
1.8 to a mean of 6.4 (standard deviation = 1.81).
________________________________________________________________________ Table 2 Profile of Syntactic Structures, Contextual Language, and Story Construction Scores for Final Written Stories Generated Using GO Charts and Adult Prompts and Feedback by Age. ________________________________________________________________________
Conjunctions Clauses Rubric Scores
Subject Total Types Type CL SC
Coord Corr Rel Adv SS SS
1 4 3 1 0 1 13 12
2 3 3 0 1 4 17 15
3 0 0 0 1 0 13 12
4 7 7 0 2 1 15 13
5 1 1 0 1 1 12 11
Y 15 5 7
6 3 3 0 0 0 13 12
7 4 4 0 1 1 13 10
8 1 1 0 0 0 11 11
9 2 2 0 1 0 8 9
10 0 0 0 1 3 13 13
O 10 3 4
The mean of the younger group for the scaffolded story was 14.0 (standard deviation =
2.0), while for the older group the mean was 11.6 (standard deviation 2.19).

24
________________________________________________________________________
Table 3 Profile of Conjunctions (C) and Adverbial Clauses (A) Produced by Younger and Older Subjects in the Weekly Written Sentence Combining Probes. ________________________________________________________________________
WRITTEN SENTENCE COMBINING PROBES
Week 1 Week 2 Week 3 Week 4 Week 5 Week 6 Week 7 Totals
Sus Sub S1 S2 S1 S2 S1 S2 S1 S2 S1 S2 S1 S2 S1 S2 C A
1 0 0 0 0 -- -- 0 0 0 0 0 0 0 0 0 0
2 0 .5 .5 .5 .5 .5 .5 .5 0 .5 .5 .5 1 0 10 1
3 .5 .5 .5 .5 -- -- .5 0 .5 .5 0 0 -- -- 7 0
4 0 0 0 0 1 -- 0 0 0 0 0 0 0 0 0 1
5 .5 .5 .5 .5 .5 .5 .5 .5 .5 .5 .5 .5 .5 .5 14 0
C A C A C A C A C A C A C A
Y 5 0 6 0 4 1 5 0 5 0 4 0 2 1 31 2
6 .5 .5 .5 .5 -- -- .5 1 0 .5 1 0 1 0 6 3
7 .5 .5 0 .5 1 1 .5 .5 0 0 1 0 .5 .5 7 3
8 .5 .5 -- -- -- -- .5 1 0 -- 0 0 0 1 3 2
9 -- -- -- -- -- -- 0 0 .5 .5 1 .5 .5 0 4 1
10 1 .5 0 0 1 .5 0 0 1 1 1 0 0 .5 3 5
C A C A C A C A C A C A C A
O 7 1 3 0 0 3 4 2 3 2 0 4 4 2 23 14
A significant effect for time of measurement (F = 28.98, df 1,0, p < .001) was
found. Pairwise comparisons between the stories generated by the pre-test, post-test and

25
the scaffolded stories were conducted, adjusted for multiple comparisons using
Bonferroni. Results indicated the only significant differences were for the scaffolded
stories compared to the pre and post stories. The non-significant interaction of subject
group by time of measurement (F = 1.00, df 1,0, p < .478), showed that there was no
difference in the improvements of one group compared to the other.
Figure 5. Mean Written Contextual Language Scores by Age and Time
Story Construction
The mean pre-test and post-test scores for the younger and older subjects are
profiled in Figure 6 for Written Contextual Language, measured within a written
narrative. At pre-test the younger group produced a mean standard score of 7.4 (standard
deviation = 1.14) compared to the older group’s mean of 8.8 (standard deviation = 3.27).
The younger group increased their score by 1.0 at post-test (mean 8.4, standard deviation
= 1.34) while the older group did not change (mean of 8.8, standard deviation = 1.78). In
addition, the final story generated from the Hierarchical GO Chart with scaffolding from
the clinician was graded using the TOWL rubric and scored using the standard score to
provide a comparison to the subject’s story with support and without support. The mean
0 2 4 6 8 10 12 14 16
pre post scaffolded post
Contextual Language
younger
older

26
of the younger group for the scaffolded story was 12.4 (standard deviation = 2.0), while
for the older group the mean was 11.6 (standard deviation 1.73).
A significant effect for time of measurement (F = 37.26, df 1,0, p < .0001) was
found. Pairwise comparisons between the stories generated by the pre-test, post-test and
the scaffolded stories were conducted, adjusted for multiple comparisons using
Bonferroni. Results indicated the only significant differences were for the scaffolded
stories compared to the pre and post stories. The non-significant interaction of subject
group by time of measurement (F = .929, df 1,0, p < .430), showed that there was no
difference in the improvements of one group compared to the other.
Figure 6. Mean Written Story Construction Scores by Age and Time
Summary
The subjects significantly increased their standard scores in oral sentence
combining but did not change their written language scores for sentence combining,
contextualized language, or story construction. Analysis of daily probes showed more
participants producing adverbial clauses during the final two weeks, particularly in the
older grade levels.
0 2 4 6 8 10 12 14
pre post scaffolded post
Story Construction
younger
older

27
DISCUSSION
Leaning to write is a challenge for children with language based learning
difficulties, with syntactic complexity one of the primary areas of weakness. This study
explored whether Hierarchical Graphic Organizers (GO Charts) could be used as a tool to
increase syntactic complexity and discourse structure. The GO Charts were used during
intervention to provide a scaffold to students, enabling them to generate complete
sentences and to combine sentences in oral practice prior to writing. The GO Chart also
remained in view during writing, providing visual support for producing more complex
written sentences, as well as for organizing the sentence into discourse.
Effectiveness of GO Charts
The scaffolded stories written by the subjects using the GO charts with prompts
and feedback from the adult did support the first question of this study. The subjects
were able to generate compound and complex sentences that included relative clauses as
well as coordinating, subordinating, and correlative conjunctions. The sentences were
significantly more complex than those spontaneously produced in the written stories at
post-test. Subjects did not generate relative clauses during spontaneous written narratives,
only simple conjunctions were generated in this condition. In addition, results of the
ANOVA revealed higher complexity of the scaffolded stories.
Syntax
The findings of this study suggest that the GO Charts may be an effective tool for
increasing syntactic complexity in spontaneously generated isolated sentences.
Significant gains were made in oral sentence combining from pre-test to post-test, with

28
both younger and older subjects making comparable gains. This is an expected finding
because oral language development precedes written language development (Loban,
1976). Written language requires processes such as spelling and handwriting not present
in oral language. Writing is also much slower than speech and so the intended sentence
must be retained in memory while the student writes and simultaneously tries to spell,
punctuate, and print. Oral language is free of these constraints and so changes are likely
to initially appear in this mode. However, age level differences were not found. The
changes in the younger subjects were comparable to those of the older students.
While five subjects (two younger, three older) made gains in written sentence
combining, five did not, resulting in non-significant gains for both groups. Older subjects
made relatively greater change than the younger subjects but not significantly so. Four of
the five who made written language gains had also made gains in oral sentence
combining, supporting the expectation that oral changes would develop in conjunction
with written changes. Parallel changes also were found in the daily written sentence
combining probes when the subject’s most complex structures were considered. During
the first two weeks, seven of the subjects from both high and low groups produced
sentences with conjunctions and only one subject in the high group produced an adverbial
clause. During the last two weeks, five of the subjects from both the high and low groups
produced sentences with conjunctions. One of the subjects in the low group and four of
the subjects in the high group produced an adverbial clause (two subjects from the low
group produced essentially no complex structures across all seven probes). In contrast,
all five of the older subjects produced adverbial clauses as their most complex structure
during the final two probes. These findings are consistent with the differences between
29
3rd grade writers who are just starting to be explicitly taught and expected to use
conjunction in their writing compared to older students who use a wider variety of
complex sentence types (Gregg et al., 2007; Loban, 1976). Even when taught adverbial
clauses, the younger children were not able to use them, while all of the older subjects
began to produce them.
When spontaneous narratives were examined, differences in the production of
complex sentences were not found. Neither group showed gains in the contextual
language score which measures change at the sentence level within the story. The
spontaneous narrative is a more demanding task. In both the oral and written sentence
combining tasks, the basic sentences are provided and only the transformed sentences
must be generated by the subject. In spontaneous writing, the subject must generate a
topic that fits the picture and generate a series of sentences to develop the topic. The
vocabulary, syntax, spelling, and punctuation for each sentence must be generated by the
writer without the prompts provided by the GO Chart.
Discourse
Hierarchical GO Charts display a possible discourse structure for the writer. The
nodes display the topic, main ideas, subordinate ideas and details. The discourse is
generated as one sentence is completed and the next related idea is generated. During
intervention, the GO Chart was visible throughout the writing process. In addition, a
clinician provided prompts and feedback as the subject wrote. This scaffolding resulted
in narratives that were written at a level significantly more difficult than the child could
produce independently within the session. The sentences within the scaffolded narratives
30
also were produced at a level significantly more difficult than those in the child’s
spontaneously generated narratives at pre-test or post-test.
These findings suggest that the Hierarchical GO Charts can be used effectively to
enable the child to generate both sentences and discourse structures. However, the seven
week intervention period was not sufficient for the child to independently produce more
elaborated narratives containing complex sentences. Gains were not significant for either
age group in the sentence complexity within spontaneously generated narratives or for
story construction. However, differences in the number and complexity of syntactic
structures were noted between the groups. The younger group generated a higher number
of overall syntactic structures with four of the five subjects producing at least one relative
clause. Only three of the subjects in the older group produced a relative clause in the
scaffolded condition, and they generated a lower number of complex syntactic structures
overall. However, the older group produced more complex structures in daily probes and
sentence combining. This suggests that fourth grade subjects were less able to generalize
instruction with complex structures into sentence combining tasks or spontaneous writing.
Even with greater exposure, they were unable to use these sentence types.
Limitations
The proposed study had several limitations. There were no control groups to
which to compare the discourse structure and syntactic complexity of the experimental
groups. Thus, it cannot be conclusively shown that the GO charts prompted the changes
in oral sentence combining. While the groups differed on grade level and writing
abilities, other confounding variables including reading instruction that also occurred
during the weekly sessions may have contributed to the findings. In addition, there was

31
no scaffolded writing sample collected at pre-test to compare to the final scaffolded
stories written at post-test. A pre-test scaffolded writing sample would have provided a
better baseline for students’ discourse structure and syntactic complexity under
scaffolded conditions. Changes in the ability to write under scaffolded conditions might
reveal changes before appear in spontaneous writing.
The subjects were not provided with a model sentence introducing the probes
each week, thus generalization to the probes did not occur and subjects continued to
make errors. The sentences generated using the GO charts should have been better
controlled to include adverbial and relative clauses with specific feedback following the
probes. The writing generated using the graphic organizers was expository nonfiction but
the TOWL assesses written narrative. Several studies show that genre does make a
difference (Snow & Kim, 2010) and an assessment using the same discourse structure
may have provided a better measure of change. While the graphic organizer was
explored as a group so that everybody had the same input, the writing was assessed by a
different clinician for each subject. The complexity of the modeled sentences, prompts
during writing, and corrective feedback differed between dyads. This was determined in
part by the individual writing skills of each subject as well as the skill of the clinician and
added variability.
Future Studies
Future research should include control groups and manualized instruction to
explore the use of graphic organizers as a tool for generatin complex sentences and
discourse structures. The manualized instruction would control for the number of

32
dependent clauses taught and the difficulty of the vocabulary and sentence length, as well
as the discourse structure.
This study took place within a clinical program that required participants to be
provided instruction throughout the session. Future research should examine
spontaneous writing generated using the graphic organizer without the assistant of the
adult. Additional research should examine writing resulting from a graphic organizer
constructed either independently or with support from the adult as a pre-writing or
drafting activity. The current study examined the effects of a specific type of graphic
organizer that was completed by prompting the children to generate key concepts that
were prepared by the adult prior to the session. However, if the student is an active
participant in the creation of the type, layout, structure, and key concepts the graphic
organizer, instead of generating pre-determined specific key concepts, results may yield
greater improvements in writing and syntactic complexity. Additionally, future research
should compare hierarchical graphic organizers with different types of graphic organizers
for the same activity. The layout and structure of the graphic organizer may influence the
effects on student’s spontaneous written discourse.

33
REFERENCES
Abrahamson, R.F. (1977). The effects of formal grammar instruction vs. the effects of sentence combining instruction on student writing: A collection of evaluative abstracts of pertinent research documents. Houston, TX: M.A. Project, University of Houston. (ERIC Document Reproduction Service No. ED145450)
Amiran, E. & Mann, J. (1982). Written composition, grades K-12: Literature synthesis and report. National Institute of Education (ED), 1-100.
Anderson, Stephen R. (1982). Where's morphology?. Linguistic Inquiry 13:571-612. Andrews, R., Torgerson, C., Beverton, S., Freeman, A., Locke, T., Low, G., … Zhu, D.
(2005). The effect of grammar teaching (sentence combining) in English on 5 to 16 year olds’ accuracy and quality in written compositon. York, England: Department of Educational Studies Research Paper.
Baxendell, B.W. (2003). Consistent, coherent, creative the 3 c's of graphic organizers. Teaching Exceptional Children, Jan/Feb, 46-53.
Britton, J.N. (1993). Language and Learning: The Importance of Speech in Children's Development – 2nd Ed. Portsmouth, NH: Heinemann.
Brown, L., Sherbenou, R.J., & Johnsen, K., (1990). Test of Nonverbal Intelligence
(TONI-2). Circle Pines, MN: American Guidance Service.
Calkins, L.M. (1994). The Art of Teaching Writing. Portsmouth, NH: Heinemann. Catts, H.W. (1993). The relationship between speech-language impariments and reading
disabilities. Journal of Speech and Hearing Research, 36, 948-958.
Catts, H.W., Adlof, S.M, & Weismer, S.E. (2006). Language deficits in poor comprehenders: A case for the simple view of reading. Journal of Speech, Language, and Hearing Research, 49, 278-293.
DiCecco V.M., & Gleason, M.M. (2002). Using graphic organizers to attain relational knowledge from expository text. Journal of Learning Disabilities, 35(4), 306-320.
Ellis, E. (2004). Makes sense strategies overview. Retrieved from www.GraphicOrganizers.com
Ellis, E., & Howard, P. (2005). Graphic organizers: Power tools for teaching students with learning disabilities. Graphic Organizers and Learning Disabilities 1, 1-5.
Ellis, E., Farmer, T., & Newman, J. (2005). Big ideas about teaching big ideas. Teaching Exceptional Children 38, 34-40.

34
Gregg, N., Coleman, C., Davis, M. & Chalk, J. (2007). Timed essay writing: Implications
for high-stakes tests. Journal of Learning Disabilities, 40 (4), 306-318.
Halliday, M.A.K & Hasan, R. (1976). Cohesion in English. London: Longman. Hammill, D.D. & Larsen, S.C. (1996). Test of Written Language – 3rd Edition (TOWL-3).
Austin, Tx: Pro-Ed.
Hillocks, G. (1984). What works in teaching composition: A meta-analysis of experimental treatment studies, American Journal of Education, 93, 133-70.
Hudson, R. (2000). Grammar teaching and language skills: The research evidence. London: University College London. Retrieved from http://www.phon.ucl.ac.uk/home/dick/writing.htm
Hunt, K.W. (1970). Syntactic maturity in schoolchildren and adults. Monographs of the society for research in child development, 35(1), (Serial No. 134).
Hunt K.W. & O’Donnell, R. (1970). An Elementary School Curriculum to Develop Better Writing Skills. Washington, DC: Office of Education, Bureau of Research.
James, L.A., Abbott, M., & Greenwood, C.R. (2001). How Adam became a writer winning writing strategies for low-achieving students. The Council for Exceptional Children, Jan/Feb, 30-37.
Kim, A., Vaughn, S., Wanzek, J., & Wei, S. (2004). Graphic organizers and their effects on the reading comprehension of students with LD: a synthesis of research. Journal of Learning Disabilities, 37(2), 105-118.
Loban, W. (1976). Language Development: Kindergarten Though Grade Twelve. Urbana, IL: National Council of Teachers of English.
Louisiana Department of Education (2004). Grade-level expectations (GLE) handbook. Baton Rouge, LA.
Mellon, J. (1969). Transformational Sentence Combining. Research Report No. 10. Urbana, IL: National Council of Teachers of English.
Meyer, D.J. (1995). The effects of graphic organizers on the creative writing of third grade students. Union, NJ: M.A. Project, Kean College of New Jersey. (ERIC Document Reproduction Service No. ED380803)
Myrick, J. & Siders, J. (2007). Comparison of the effectiveness of learning styles using graphic organizers versus traditional text-based teaching on vocabulary development. The University of Alabama McNair Journal, 115-128.

35
Newcomer & Hammill (1997). Test of Language Development – Intermediate 3rd Edition (TOLD I:3). Austin, TX: Pro-Ed. O’Hare, F. (1973). Sentence Combining: Improving Student Writing without Formal
Grammar Instruction. Research Report No. 15. Urbana, IL: National Council of Teachers of English.
Perron, J. (1975). Research for Monday morning: Elementary Writing. Athens, GA: U.S. Department of Health, Education, & Welfare National Institute of Education.
Ravid, D. & Tolchinsky, L. (2002). Developing linguistic literacy: A comprehensive model. Journal of Child Language, 29, 417-447.
Ross, J.R. (1971). Doub-ling. Linguistic Inquiry, 3(1), 61-86. Schumaker, J.B. & Deshler, D.D. (2003). Can students with LD become competent
writers?. Learning Disability Quarterly, 26 (2), 129-141.
Schuster, E.H. (1977). “Back to basics”: What does it really mean?. The Cleaning House, 50(6), 237-239.
Snow, C.E. & Kim, Y. (2010). Syntactic and discourse structures: What should fourth and fifth graders know and be able to do? Harvard Graduate School of Education. Retreived from http://www.reading.org/Libraries/Book_Supplements/bk767Supp- SnowKim.sflb.ashx
Waterfall, C.M. (1978). An Experimental Study of Sentence-combining as a Means of Increasing Syntactic Maturity and Writing Quality in the Compositions of College-age Students Enrolled in Remedial English Classes. Logan, Utah: Ph.D. Project, Utah State University.
Wiederholt, J.L & Bryant, B.R. (2001). Gray Oral Reading Test – 4th Edition (GORT-4).
Chicago: Riverside Publishing Co.
Windsor, J., Scott, C.M., & Street, C.K. (2000). Verb and noun morphology in the spoken and written language of children with language learning disabilities. Journal of Speech, Language and Hearing Research, 43, 1322-1336.
Wyse, D. (2001). Grammar for writing? A critical review of empirical evidence. British Journal of Educational Studies, 49, 411-427.

36
VITA
Laura Delrose was born and raised in Palm Springs, California. She received a
Bachelor of Arts degree in Interdisciplinary Studies with concentration in psychology,
linguistics, and speech and hearing sciences at the University of California, Santa Barbara
in 2009. Her love for research began when she completed an undergraduate thesis
project under the guidance of Dr. Janis Costello Ingham entitled Whole Language: What
Is It? Is It Effective in Reading Instruction and Intervention. This paper reviewed Dr. Jan
Norris’ research of the whole language theory in depth.
Ms. Delrose moved across the country to Baton Rouge, Louisiana to continue her
educational journey to enroll in the master’s program in communication sciences and
disorders at Louisiana State University and Agricultural and Mechanical College. She
decided to complete a graduate thesis project under the guidance of Dr. Norris in partial
fulfillment of the requirements for her Master of Arts degree, to be awarded May 2011.
Ms. Delrose was a speaker at the annual American Speech-Language-Hearing
Association (ASHA) convention in November 2010, presenting ways that graphic
organizers can be used in language intervention as well as articulation and fluency. Upon
graduation, Ms. Delrose intends to fulfill her educational endeavors by continuing at LSU
to receive a doctoral degree in communication sciences and disorders and continue
research exploring language-based learning disorders under the guidance of Jan Norris,
Ph.D.