Embed Size (px)
Citation preview

CHAPTER 7:
There are differences in the proportion of variance between schools in computer and
information literacy (CIL) and computational thinking (CT) scores.
• There were considerable differences in the variance for both CIL and CT as well as the
proportion of variance found between schools across participating countries. (Table 7.1
and Table 7.6)
• Multilevel models explained most of the variance in CIL and CT scores at the school level
while less variance was accounted for within schools. (Table 7.1 and Table 7.2)
There are consistent net effects on CIL and CT by personal and social background factors.
• Female gender tended to be positively related to CIL but negatively related to CT scores.
(Table 7.2 and Table 7.7)
• Use of test language was a positive predictor of CIL and CT in some countries, in particular
those with larger proportions of students speaking another language at home. (Table 7.2
and Table 7.7)
• Both expected university education and socioeconomic background are consistent
positive predictors of both CIL and CT across countries, however, the effect sizes vary
across countries. (Table 7.2 and Table 7.7)
There are consistent net effects on CIL and CT by a number of student-level predictor
variables related to experience and use of information and communication technology (ICT)
across countries.
• Students’ daily use of ICT and experience with computers were consistent positive
predictors of both CIL and CT. (Table 7.3 and Table 7.8)
• Availability of computers at home was a positive predictor in most countries but had
weaker effects after controlling for personal and social background. (Table 7.3 and Table
7.8)
• Student reports on having learned about CIL-related tasks at school and on the use of
general ICT applications in class tended to be a positive predictor of student CIL in a
number of countries. (Table 7.3)
• Student reports on having been taught CT-related tasks had negative effects on CT scores
across countries. (Table 7.8)
There are mostly inconsistent net effects on CIL and CT by school-level predictor variables
related to ICT across countries.
family background) was a consistent positive predictor of CIL and CT in almost all countries.
(Table 7.2 and Table 7.6)
variables. (Table 7.5 and Table 7.10)
© IEA International Association for the Evaluation of Educational Achievement 2020J. Fraillon et al., Preparing for Life in a Digital World,https://doi.org/10.1007/978-3-030-38781-5_7
215

217INVESTIGATING VARIATIONS IN CIL AND CT
In previous chapters we have described some of the associations of computer and information
literacy (CIL) and computational thinking (CT) with a number of variables, for example gender
research questions:
RQ 2 What aspects of schools and education systems are related to student achievement?
RQ 3 What characteristics of students’ levels of access to, familiarity with, and self-reported
RQ 4
In this chapter, we use multilevel models to review the extent to which different factors at the
student and school level are associated with variations in CIL and CT scores. Factors of interest
will be those related to access to, use of, and familiarity with information and communications
background of students.
Prior to the International Computer and Information Literacy Study (ICILS) 2013, research into
generally been limited to national studies. In a number of countries these national evaluations
provided evidence about factors explaining variation in ICT-related capabilities among students.
Sample surveys carried out as part of the Australian National Assessment Program for ICT
literacy showed that students’ gender (female), socioeconomic background, and experience and
current use of computers were positive predictors of variation in ICT literacy (ACARA [Australian
Curriculum, Assessment and Reporting Authority] 2012, 2015; MCEECDYA [Ministerial Council
for Education, Early Childhood Development and Youth Affairs] 2010; MCEETYA [Ministerial
Council on Education, Employment, Training and Youth Affairs] 2007). In the United States,
results from the National Assessment of Educational Progress Technology and Engineering
Literacy assessment indicated substantial differences with regard to the ICT skills scale between
gender groups, parental education, ethnic background, and school location (US Department of
Education, National Center for Education Statistics 2016).
ICT literacy was also assessed as part of the Chilean national assessment of students’ ICT
competencies, known as SIMCE TIC. Multilevel analyses of these data illustrated considerable
variation among schools as well as effects of cultural background, socioeconomic status, and
school characteristics (private/public, subsidies) on digital competencies (Román and Murrillo
2013). Further analyses also provided evidence of strong effects of prior achievement in reading
and mathematics on digital competencies (San Martin et al. 2013).
Analyses of Norwegian grade 9 data collected in 2009 emphasized the importance of home
factors (such as family background) but also of having a supportive school climate (Hatlevik
2009). In their analyses of survey data from Norwegian upper-secondary schools, Hatlevik and
Christopherson (2013) revealed substantial variation within and between schools, with home
conditions and academic aspirations as important predictors of digital competence. Multilevel
analyses of data collected among grade 7 students also highlighted the importance of mastery
At the international level, the Programme for International Student Assessment (PISA) assessed the performance of 15-year-old students in digital reading across 16 countries (OECD [Organisation for Economic Cooperation and Development] 2011). Even though this international
number of variables on variations in CIL and CT including individual (student level) as well as
context (school level) variables. This chapter addresses, for both CIL and CT, the following

218 PREPARING FOR LIFE IN A DIGITAL WORLD
to CIL. Results from this study showed that socioeconomic background and computer use were positively associated with digital reading skills. However, no clear association was found with the use of computers at school.
Multilevel analyses carried out using data from ICILS 2013 showed that students’ experience
in particular the number of computers at home, did not have any effects once socioeconomic background was taken into account (Fraillon et al. 2014).
To develop a model to explain variation in each of CIL and CT we used prior research literature and the contextual framework for ICILS 2018 in order to determine possible predictors of variation in CIL and CT for inclusion in the multivariate analyses presented in this chapter. The
exploratory analyses of their conceptual importance as well as preliminary empirical evidence of their association with the two criterion variables CIL and CT.
Statistical modeling of the kind presented in this chapter assumes a logical structure where sets of predictor variables are used to explain variation in dependent variables. However, given the limitations of international studies such as ICILS and their cross-sectional design (Rutkowski and
variables and CIL or CT, which may suggest possible causal relationships but are not necessarily robust evidence of causality.
The ICILS 2018 contextual framework (Fraillon et al. 2019) assumes that students’ CIL and
classrooms, individual learner, and home) which consist of antecedents as well as process-related factors. In the analysis of CIL and CT presented in this chapter, we included variables pertaining to the school/classroom context, the context of the individual learner, and the home context. Another distinction introduced for the analysis in this report is made between (1) personal and social background factors, and (2) context variables related to ICT and the learning context for CIL and CT.
using the following broad categories:
• Personal and social background: Previous research and results from other analyses of this study (see Chapter 3) illustrated how much gender, students’ expectations of educational attainment, and parental socioeconomic status are associated with students’ CIL. These variables wereincluded at the student level in Model 1 and Model 3 (see later for more detailed discussionof the models used).
• The average socioeconomic status of the student body was usedas a factor that has been shown to be associated with a variety of learning outcomes. Thisvariable was included at the school level in Model 1 and Model 3.
• ICT resources and use at home: These predictors include ICT resources at home, personalexperience with ICT, students’ use of ICT at home and school, and students’ experiences with learning about ICT at school. These variables were included at the student level in Model 2and Model 3.
• ICT resources and use at school: Information on the schools’ ICT resources and ICT use werecollected through the ICT coordinator, principal, and teacher questionnaires. The school CILlearning context includes the expectations of school principals regarding teacher use of ICT

219INVESTIGATING VARIATIONS IN CIL AND CT
for collaboration/communication at school and teacher reports of their average experience of the use of ICT for teaching at school. These variables were included at the school level in Model 2 and Model 3.
The personal and social student background characteristics included in the analysis were:
• Students’ gender: This variable was coded as 1 for females and 0 for males.
• Students’ use of the test language: This variable was coded as 1 for speaking the test language at home most of the time and 0 for other students.
• a university education (coded as 1 = expected, 0 = not expected).
• Students’ socioeconomic background: This variable is composite index standardized to have a mean of 0 and a standard deviation of 1 within each country and centered on school averages so that it indicates the effect of socioeconomic background within schools. The index consisted of factor scores from a principal component analysis of:
– Highest parental occupation (as indicated by the international socioeconomic index of occupational status scores of both parents);
– Highest parental education (categorical variable with 0 = lower-secondary or lower education, 1 = upper-secondary education, 2 = post-secondary non-university education, 3 = university education); and
– Number of books at home (categorical variable with 0 = 0–10 books, 1 = 11–25 books, 2 = 26–100 books, 3 = more than 100 books).
The schools’ social intake was measured with the following variable:
• This variable reflects the average of student scores on the composite index of socioeconomic background. It indicates the average socio economic background of enrolled students and the resulting social context in which students learn.
The following variables indicated ICT resources and use at home:
• Number of computers at home: Students reported the number of desktop and portable computers, the resulting indicator variable was coded 1 (two or more computers) and 0 (no or only one computer).
•
of experience).
• Use of ICT: at school or outside of school for both school-related purposes or other purposes, and it was coded as 1 (daily use) and 0 (less than daily use).
• Students’ reports on using general ICT applications in class: The three-item scale is based on a question that required students to indicate with what frequency they have used word-processing software, presentation software, and computer-based information sources at school. Values are item response theory (IRT) scores, which were standardized for this analysis within each country to having a mean of 0 and a standard deviation of 1.
• Students’ reports on learning of CIL or CT: This consisted of– Students’ reports on learning of CIL-related tasks at school: The index is based on a set of
eight items that required students to indicate whether they had learned about different CIL tasks26 at school. Values are IRT scores, which were standardized for this analysis within
26 The CIL-related tasks were: provide references to internet sources; search for information using ICT; present information for a given audience or purpose using ICT; work out whether to trust information from the internet; decide what information obtained from the internet is relevant to include in school work; organize information obtained from internet sources; decide where to look for information on the internet about an unfamiliar topic; and use ICT to collaborate with others.

220 PREPARING FOR LIFE IN A DIGITAL WORLD
each country to having a mean of 0 and a standard deviation of 1. This variable was only included in the model explaining variation of CIL.
– Students’ reports on learning of CT-related tasks at school: The index is based on a set of
nine items that required students to indicate whether they had learned about different
CIL tasks27 during the current school year. Values are IRT scores, which were standardized
for this analysis within each country to having a mean of 0 and a standard deviation of 1.
This variable was only included in the model explaining variation of CT.
• Availability of ICT resources for teaching and learning: This measure, based on the ICT coordinator
questionnaire, was computed using reports on the availability of 13 different computer and
ICT resources.28 The items were coded as available to teachers and students (2), available to
either students or teachers (1), and not available (0), so that higher IRT scale scores indicate
more ICT resources at school. Values are IRT scores, which were standardized for this analysis
at the student level within each country to having a mean of 0 and a standard deviation of 1.
• Principals reported
whether teachers at the school were expected and required, expected but not required, or
not expected to collaborate or communicate via ICT with teachers, parents, and students.
The three items were used to derive an index where higher scale scores represent higher
expectations/requirements in this respect. Values are IRT scores, which were standardized for
this analysis at the student level within each country to having a mean of 0 and a standard
deviation of 1.
•
time teachers at the school reported to have used ICT for teaching purposes. Response
• Teacher reports on ICT use for class activities: This IRT scale is based on a question asking
teachers about the extent to which students used ICT for activities in class, and higher scores
the student level within each country to having a mean of 0 and a standard deviation of 1.
During multivariate analyses, any issues relating to missing data tend to become more prevalent than in other forms of analysis because of the simultaneous inclusion of numerous variables.
students for whom there were no student questionnaire data (this was viable because only small proportions of students had missing data for the student-level variables). For the variables derived from the ICT coordinator questionnaire (ICT resources at school), school principal questionnaire (expectations for teacher collaboration/communication via ICT), and the teacher survey (teacher experience with ICT use during lessons, ICT use for class activities) there were higher proportions of missing data. These were treated by setting missing values to national averages or modes
27 The CT-related tasks were: to display information in different ways; to break a complex process into smaller parts; to understand diagrams that describe or show real-world problems; to plan tasks by setting out the steps needed to complete them; to use tools to make diagrams that help solve problems ; to use simulations to help understand or
data to understand and solve a problem; and to use real-world data to review and revise solutions to problems.28 The following ICT resources were used for scaling: digital learning resources that can only be used online; access to
the internet through the school network; access to an education site or network maintained by education authorities; email accounts for school-related use; practice programs or [apps] where teachers decide which questions are asked of students (e.g., [Quizlet, Kahoot], [mathfessor]); single user digital learning games (e.g., [languages online]); multi-user digital learning games with graphics and inquiry tasks (e.g., [Quest Atlantis]); video and photo software for capture and editing (e.g., [Windows Movie Maker, iMovie, Adobe Photoshop]); concept mapping software (e.g., [Inspiration ®], [Webspiration ®]); data logging and monitoring tools (e.g., [Logger Pro]) that capture real-world data digitally for analysis (e.g., speed, temperature); a learning management system (e.g., [Edmodo], [Blackboard]); graphing or drawing software; e-portfolios (e.g., [VoiceThread]); digital contents linked with textbooks.

221INVESTIGATING VARIATIONS IN CIL AND CT
respectively, and then by adding a missing indicator variable for missing school data (for each of the two indicators) and another one for entirely missing teacher data. This particular approach (see Cohen and Cohen 1975) was chosen given its simplicity and the relatively limited amount of missing values in a majority of countries.
On average across participating countries, data from about 92 percent of tested students were included in the analysis. In two countries (Germany and Uruguay) and one benchmarking participant (North Rhine-Westphalia, Germany) this proportion was below 85 percent and the results are annotated accordingly. For these countries, as well as those that did not meet the IEA sampling participation requirements, readers should interpret results with due caution. More detailed information on the multilevel modeling and treatment of missing data will be presented in the ICILS 2018 technical report (Fraillon et al. 2020).
In Luxembourg, student sample participation requirements were met and 38 of a total of 41 schools participated in the ICILS 2018 survey. Given this relatively low number of units available for analyses at the school level, which would have led to reduced statistical power and precision at the school level, data from this country are not included in the analyses presented in this chapter.
Due to the hierarchical nature of the survey data, we conducted multivariate multilevel regression analysis (see Raudenbush and Bryk 2002). We estimated, for each national sample, two-level hierarchical models with students nested within schools. The analyses were carried out using the software package Mplus (version 7; see Muthén and Muthén 1998–2012) and estimates were obtained after applying appropriate sampling weights at the student and school level.
students to be sampled within schools as well as possible adjustments for non-response. The weights were scaled so that the sum of weights is equal to the number of units at each level.
When interpreting results from a multilevel analysis, it is also important to be aware that student level variables in a two-level model have a different meaning from those in a single-level regression
analyses reported in previous chapters.29
In addition to estimates of overall and explained variance at the two levels in each of the
p < 0.05). These predictor variables were coded in ways that allow a substantial
in CIL or CT score points equivalent with a corresponding increase of one in the predictor
what a value of one means for each factor, we can distinguish three types of predictor variables:
or CT score points between the group with code of one when compared to all other students (female versus male students, speaking test language at home versus others, expecting a
others).30
29 Multilevel analysis allows the estimation of random effects models, where within-school effects vary across schools as well as interaction effects between school-level predictors and the slopes of student-level predictors within

222 PREPARING FOR LIFE IN A DIGITAL WORLD
• For categorical indicator variables (this only applies to the estimated years of teacher experience
more year of experience across teachers in a school.
an increase of one national standard deviation in the predictor variable (students’ socioeconomic
background, students’ reports on learning about CIL- or CT-related tasks at school, students’
reports on the use of general ICT applications in class, ICT coordinators', reports on ICT
resources at school, principals’ reports on expectations of teacher communication via ICT,
teachers’ reports on students’ use of ICT for class activities).
When conducting the multilevel analysis of CIL and CT, four different models were estimated:
• Model 0 (the “null model”) which included no predictor variables other than school intercepts;
• Model 1 which included only predictor variables related to the personal and socioeconomic
background of students and schools’ social intake;
• Model 2 which included only predictor variables related to ICT as student- and school-level
predictors; and
• Model 3 which included all predictor variables from Models 1 and 2.
Using only the first group of predictors in Model 1, the second group in Model 2, and the
combined set of predictors in Model 3, allows a review of the effects of background and ICT-
related predictors by themselves, as well as after controlling for the other types of predictors
at student and school levels.
Because Model 0 provides estimates of the variance at each level (within and between schools)
before the inclusion of predictors, it provides the point from which to determine how much
the subsequent models explained the variance. Model 1 includes only those predictors that are
either personal or social background factors, while Model 2 includes only those factors that
information about how much variance is explained when both types of predictor variables are
included in the model. Comparing effects of ICT-related Model 2 predictors with those from
Model 3 illustrates the extent to which these effects are related to the effect of personal and
social background predictor variables (either at the student or school level).
Before considering the estimated effects at the student and school level, we compared the
variance estimates for CIL at each level (students and schools) and overall, as well as the
percentages of variance between schools (Table 7.1). For Chile, for example, we found that a
variance in CIL scores of 6750, of which 4790 was observed within school (i.e., at the student
level) and 1959 between schools (i.e., at the school level). This indicates that 29 percent of the
variance is due to differences between schools. The following columns indicate the percentages
of the variance that was explained by each model within and between schools. For example, in
Chile Model 3 explains 16 percent of the variance within schools and 80 percent of the variance
between schools.
Generally, we found considerable differences across participating countries. The overall variance
(i.e., the combined variance at school and student level) ranged from about 4000 in Denmark to
over 10,000 in Kazakhstan. The percentages of variance that was found between schools also
varied substantially. While in Finland, Korea, and Moscow (Russian Federation) only around a
tenth of the variance was found between schools, the corresponding estimates for Germany
and Kazakhstan were around 50 percent and in Uruguay above 40 percent.

223INVESTIGATING VARIATIONS IN CIL AND CT
Wit
hin
-sch
oo
l var
ian
ce e
xpla
ined
by
Mo
del
2 p
red
icto
rs
Ad
dit
ion
al w
ith
in-s
cho
ol v
aria
nce
exp
lain
ed b
y M
od
el 3
pre
dic
tors
Wit
hin
-sch
oo
l var
ian
ce n
ot
expl
ain
ed b
y m
od
el p
red
icto
rs
Bet
wee
n-s
cho
ol v
aria
nce
exp
lain
ed b
y M
od
el 2
pre
dic
tors
Ad
dit
ion
al b
etw
een
-sch
oo
l var
ian
ce e
xpla
ined
by
Mo
del
3 p
red
icto
rs
Bet
wee
n-s
cho
ol v
aria
nce
no
t ex
plai
ned
by
mo
del
pre
dic
tors
10
,00
05
00
05
00
01
0,0
00
No
tes:
†
Met
gu
idel
ines
for
sam
plin
g pa
rtic
ipat
ion
rat
es o
nly
aft
er r
epla
cem
ent
sch
oo
ls w
ere
incl
ud
ed.
†† N
earl
y m
et g
uid
elin
es fo
r sa
mpl
ing
part
icip
atio
n r
ates
aft
er r
epla
cem
ent
sch
oo
ls w
ere
incl
ud
ed.
^
Did
no
t m
eet
sam
plin
g pa
rtic
ipat
ion
req
uir
emen
ts fo
r te
ach
er s
urv
ey.
1 An
“(r)
” in
dic
ates
th
at d
ata
are
avai
lab
le fo
r at
leas
t 7
0%
bu
t le
ss t
han
85
% o
f stu
den
ts.
Var
ianc
e w
ithi
n sc
hool
s V
aria
nce
bet
wee
n sc
hool
s
Co
un
try
Var
ianc
e es
tim
ates
P
erce
nt o
f var
ianc
e ex
plai
ned
by:
Mod
el 0
M
odel
1
Mod
el 2
Mod
el 3
Tota
l W
ith
in
Bet
wee
n
Per
cen
t W
ith
in
Bet
wee
n
Wit
hin
B
etw
een
W
ith
in
Bet
wee
n
va
rian
ce
sch
oo
ls
sch
oo
ls
bet
wee
n
sch
oo
ls
sch
oo
ls
sch
oo
ls
sch
oo
ls
sch
oo
ls
sch
oo
lssc
ho
ols
Ch
ile
6
75
0
47
90
1
95
9
29
8
7
1
10
3
9
16
8
0
Den
mar
k† ¹
4
16
1
35
22
6
38
1
5
9
37
8
2
5
14
5
2
Fin
lan
d
6
22
7
53
88
8
40
1
3
10
3
6
17
5
0
24
6
3
Fra
nce
^
5
61
0
46
61
9
49
1
7
16
4
8
7
33
2
0
62
Ger
man
y^
(r)
86
59
3
96
5
46
94
5
4
3
73
9
5
0
12
8
5
Ital
y²
6
83
6
52
89
1
54
7
23
1
0
34
8
4
4
17
6
1
Kaz
akh
stan
¹
10
51
7
53
53
5
16
4
49
6
1
3
7
25
1
1
33
Ko
rea,
Rep
ub
lic o
f 8
86
5
80
78
7
87
9
8
4
4
12
3
0
18
5
8
Po
rtu
gal†
† ¹
5
42
9
36
24
1
80
5
33
8
5
0
6
26
1
2
61
Uru
guay
^
(r)
10
24
3
56
91
4
55
2
44
4
7
5
12
4
9
15
8
6
ICIL
S 2
01
8 a
vera
ge
29
8
4
8
10
3
7
16
6
4
No
t m
eeti
ng
sam
ple
par
tici
pat
ion
req
uir
emen
ts
Un
ited
Sta
tes^
58
11
4
54
2
12
70
2
2
11
5
7
11
6
2
18
7
9
Ben
chm
arki
ng
par
tici
pan
ts m
eeti
ng
sam
ple
par
tici
pat
ion
req
uir
emen
ts
Mo
sco
w (R
uss
ian
Fed
erat
ion
) 4
47
7
40
86
3
91
9
1
1
52
9
3
1
16
6
2
No
rth
Rh
ine-
Wes
tph
alia
(Ger
man
y)
(r)
55
76
3
39
0
21
86
3
9
4
79
6
5
3
9
90
224 PREPARING FOR LIFE IN A DIGITAL WORLD
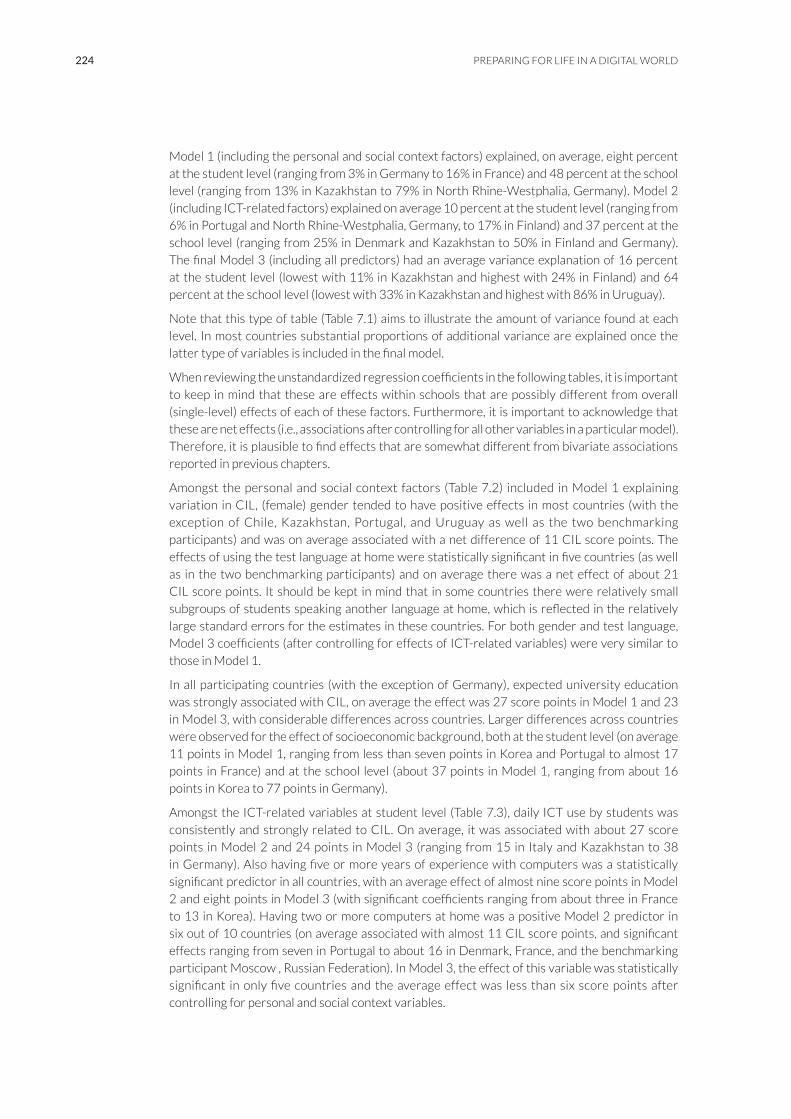
Model 1 (including the personal and social context factors) explained, on average, eight percent
at the student level (ranging from 3% in Germany to 16% in France) and 48 percent at the school
level (ranging from 13% in Kazakhstan to 79% in North Rhine-Westphalia, Germany). Model 2
(including ICT-related factors) explained on average 10 percent at the student level (ranging from
6% in Portugal and North Rhine-Westphalia, Germany, to 17% in Finland) and 37 percent at the
school level (ranging from 25% in Denmark and Kazakhstan to 50% in Finland and Germany).
at the student level (lowest with 11% in Kazakhstan and highest with 24% in Finland) and 64
percent at the school level (lowest with 33% in Kazakhstan and highest with 86% in Uruguay).
Note that this type of table (Table 7.1) aims to illustrate the amount of variance found at each
level. In most countries substantial proportions of additional variance are explained once the
to keep in mind that these are effects within schools that are possibly different from overall
(single-level) effects of each of these factors. Furthermore, it is important to acknowledge that
these are net effects (i.e., associations after controlling for all other variables in a particular model).
reported in previous chapters.
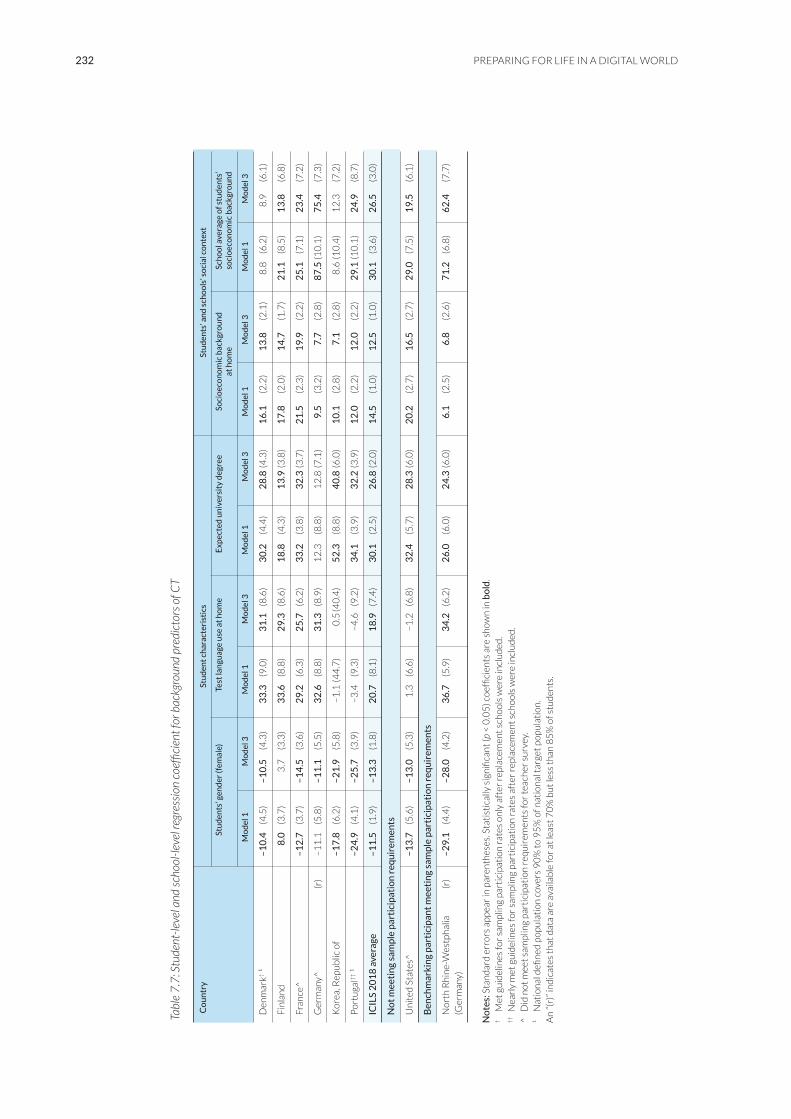
Amongst the personal and social context factors (Table 7.2) included in Model 1 explaining
variation in CIL, (female) gender tended to have positive effects in most countries (with the
exception of Chile, Kazakhstan, Portugal, and Uruguay as well as the two benchmarking
participants) and was on average associated with a net difference of 11 CIL score points. The
as in the two benchmarking participants) and on average there was a net effect of about 21
CIL score points. It should be kept in mind that in some countries there were relatively small
large standard errors for the estimates in these countries. For both gender and test language,
those in Model 1.
In all participating countries (with the exception of Germany), expected university education
was strongly associated with CIL, on average the effect was 27 score points in Model 1 and 23
in Model 3, with considerable differences across countries. Larger differences across countries
were observed for the effect of socioeconomic background, both at the student level (on average
11 points in Model 1, ranging from less than seven points in Korea and Portugal to almost 17
points in France) and at the school level (about 37 points in Model 1, ranging from about 16
points in Korea to 77 points in Germany).
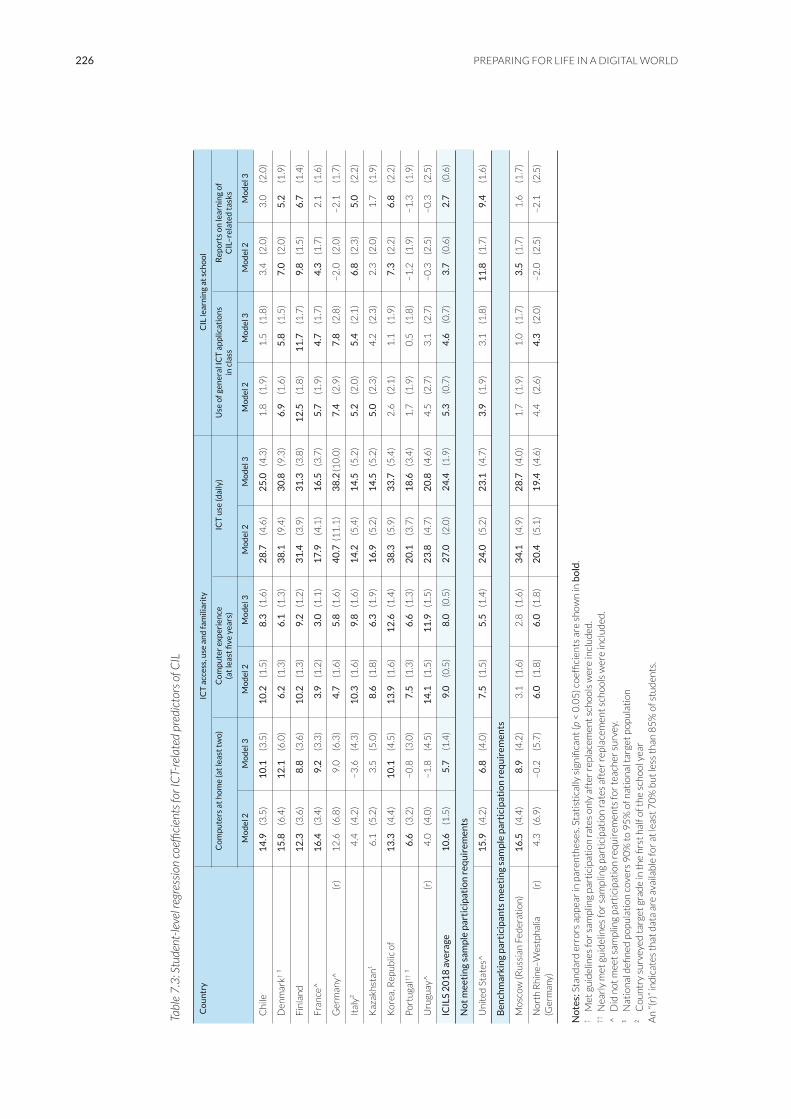
Amongst the ICT-related variables at student level (Table 7.3), daily ICT use by students was
consistently and strongly related to CIL. On average, it was associated with about 27 score
points in Model 2 and 24 points in Model 3 (ranging from 15 in Italy and Kazakhstan to 38
to 13 in Korea). Having two or more computers at home was a positive Model 2 predictor in
effects ranging from seven in Portugal to about 16 in Denmark, France, and the benchmarking
participant Moscow , Russian Federation). In Model 3, the effect of this variable was statistically
controlling for personal and social context variables.

225INVESTIGATING VARIATIONS IN CIL AND CT
No
tes:
p
bo
ld.
†
Met
gu
idel
ines
for
sam
plin
g pa
rtic
ipat
ion
rat
es o
nly
aft
er r
epla
cem
ent
sch
oo
ls w
ere
incl
ud
ed.
††
N
earl
y m
et g
uid
elin
es fo
r sa
mpl
ing
part
icip
atio
n r
ates
aft
er r
epla
cem
ent
sch
oo
ls w
ere
incl
ud
ed.
^
Did
no
t m
eet
sam
plin
g pa
rtic
ipat
ion
req
uir
emen
ts fo
r te
ach
er s
urv
ey.
An
“(r)
” in
dic
ates
th
at d
ata
are
avai
lab
le fo
r at
leas
t 7
0%
bu
t le
ss t
han
85
% o
f stu
den
ts.
Co
un
try
Stu
den
t ch
arac
teri
stic
s St
ud
ents
’ an
d s
cho
ols
’ so
cial
co
nte
xt
Stu
den
ts’ g
end
er (f
emal
e)
Test
lan
guag
e u
se a
t h
om
e E
xpec
ted
un
iver
sity
deg
ree
Soci
oec
on
om
ic b
ackg
rou
nd
Sc
ho
ol a
vera
ge o
f stu
den
ts’
at h
om
e so
cio
eco
no
mic
bac
kgro
un
d
Mo
del
1
Mo
del
3
Mo
del
1
Mo
del
3
Mo
del
1
Mo
del
3
Mo
del
1
Mo
del
3
Mo
del
1
Mo
del
3
Ch
ile
2.0
(4
.7)
1.7
(4
.3)
42
.9 (1
1.8
) 4
1.7
(11
.2)
31
.1
(3.8
) 2
5.6
(3
.8)
12
.0
(2.3
) 8
.0
(2.3
) 3
6.1
(4
.2)
32
.2
(3.9
)
Den
mar
k† ¹
7
.3
(3.5
)8
.1
(3.4
) 2
6.2
(6
.7)
22
.1
(6.6
) 2
4.4
(3
.6)
22
.1 (
3.5
) 9
.1
(1.7
) 6
.9
(1.6
) 1
8.7
(6
.5)
19
.3
(6.1
)
Fin
lan
d
25
.9
(3.0
) 2
2.2
(2
.7)
40
.2
(7.6
) 3
6.8
(7
.1)
14
.2
(3.7
) 9
.5 (
3.3
) 1
4.2
(1
.9)
11
.2
(1.6
) 2
2.1
(7
.6)
13
.0
(6.0
)
Fra
nce
^
18
.0
(3.1
) 1
7.0
(3
.1)
22
.7
(6.0
) 1
9.9
(5
.9)
32
.5
(3.3
) 3
0.7
(3
.2)
16
.6
(1.8
) 1
4.8
(1
.8)
27
.4
(5.9
) 2
6.0
(5
.9)
Ger
man
y^
(r)
13
.9
(4.6
) 1
5.8
(4
.0)
21
.4
(6.7
) 2
0.9
(6
.4)
1.5
(6
.6)
1.4
(5
.2)
8.1
(2
.8)
6.2
(2
.4)
77
.3 (1
4.5
) 6
0.0
(7
.5)
Ital
y²
11
.9
(3.6
) 1
0.4
(3
.6)
9.4
(5
.3)
9.4
(5
.4)
28
.8
(4.1
) 2
6.4
(3
.9)
12
.9
(2.7
) 1
1.6
(2
.8)
30
.3
(9.1
) 2
5.9
(7
.9)
Kaz
akh
stan
¹ –
0.1
(6
.1)
–1
.8
(6.1
)6
.2
(8.9
) 4
.7
(8.3
) 2
4.1
(4
.5)
20
.7 (
4.1
) 1
3.4
(2
.7)
9.3
(2
.7)
55
.7 (1
2.8
) 4
2.6
(1
2.9
)
Ko
rea,
Rep
ub
lic o
f 2
3.6
(6
.1)
21
.5
(5.2
) 1
9.7
(2
8.1
) 9
.6 (3
1.0
) 5
1.3
(6
.9)
42
.3 (
5.1
) 7
.7
(3.3
) 4
.2
(2.8
) 1
6.3
(7
.1)
20
.1
(6.2
)
Po
rtu
gal†
† ¹
4
.0
(3.4
) 4
.7
(3.3
) 3
.5
(8.7
) 5
.7
(8.5
) 2
9.9
(3
.4)
27
.6 (
3.5
) 7
.9
(2.5
) 6
.7
(2.4
) 3
0.5
(8
.8)
30
.0
(7.8
)
Uru
guay
^
(r)
3.2
(3
.8)
4.3
(3
.5)
21
.5 (1
6.0
) 2
9.3
(14
.6)
34
.2
(5.2
) 2
6.5
(4
.8)
8.8
(3
.2)
5.4
(3
.1)
57
.5
(5.7
) 4
7.4
(5
.4)
ICIL
S 2
01
8 a
vera
ge
11
.0
(1.4
) 1
0.4
(1
.3)
21
.4
(3.9
) 2
0.0
(4
.1)
27
.2
(1.5
) 2
3.3
(1
.3)
11
.1
(0.8
) 8
.4
(0.8
) 3
7.2
(2
.8)
31
.7
(2.3
)
No
t m
eeti
ng
sam
ple
par
tici
pat
ion
req
uir
emen
ts
Un
ited
Sta
tes^
17
.1
(3.7
) 1
6.3
(3
.4)
0.2
(5
.1)
–0
.6
(5.0
)3
0.5
(4
.1)
24
.8 (
4.0
) 1
5.3
(1
.8)
10
.7
(1.8
) 2
5.3
(5
.9)
17
.5
(4.8
)
Ben
chm
arki
ng
par
tici
pan
ts m
eeti
ng
sam
ple
par
tici
pat
ion
req
uir
emen
ts
Mo
sco
w (R
uss
ian
Fed
erat
ion
) 1
.3
(3.4
) 1
.2
(3.2
) 3
8.8
(10
.2)
28
.6
(8.7
) 3
6.2
(4
.3)
32
.5 (
3.7
) 6
.0
(1.9
) 5
.2
(1.8
) 2
0.1
(5
.2)
16
.7
(4.9
)
Nor
th R
hine
–Wes
tpha
lia
(r)
4.8
(5
.6)
6.3
(4
.6)
22
.2
(5.3
) 2
1.1
(5
.1)
16
.7
(4.7
) 1
3.7
(4
.6)
5.3
(2
.8)
6.1
(3
.0)
62
.4
(5.5
) 4
9.6
(5
.8)
(G
erm
any)
226 PREPARING FOR LIFE IN A DIGITAL WORLD
No
tes:
p
bo
ld.
†
Met
gu
idel
ines
for
sam
plin
g pa
rtic
ipat
ion
rat
es o
nly
aft
er r
epla
cem
ent
sch
oo
ls w
ere
incl
ud
ed.
††
N
earl
y m
et g
uid
elin
es fo
r sa
mpl
ing
part
icip
atio
n r
ates
aft
er r
epla
cem
ent
sch
oo
ls w
ere
incl
ud
ed.
^
Did
no
t m
eet
sam
plin
g pa
rtic
ipat
ion
req
uir
emen
ts fo
r te
ach
er s
urv
ey.
An
“(r)
” in
dic
ates
th
at d
ata
are
avai
lab
le fo
r at
leas
t 7
0%
bu
t le
ss t
han
85
% o
f stu
den
ts.
Co
un
try
ICT
acc
ess,
use
an
d fa
mili
arit
y
CIL
lear
nin
g at
sch
oo
l
Co
mp
ute
rs a
t h
om
e (a
t le
ast
two)
C
om
pu
ter
exp
erie
nce
IC
T u
se (d
aily
) U
se o
f gen
eral
ICT
ap
plic
atio
ns
Rep
ort
s o
n le
arn
ing
of
Mo
del
2
Mo
del
3
Mo
del
2
Mo
del
3
Mo
del
2
Mo
del
3
Mo
del
2
Mo
del
3
Mo
del
2
Mo
del
3
Ch
ile
14
.9
(3.5
) 1
0.1
(3
.5)
10
.2
(1.5
) 8
.3
(1.6
) 2
8.7
(4
.6)
25
.0
(4.3
) 1
.8
(1.9
) 1
.5
(1.8
) 3
.4
(2.0
) 3
.0
(2.0
)
Den
mar
k† ¹
1
5.8
(6
.4)
12
.1
(6.0
) 6
.2
(1.3
) 6
.1
(1.3
) 3
8.1
(9
.4)
30
.8
(9.3
) 6
.9
(1.6
) 5
.8
(1.5
) 7
.0
(2.0
) 5
.2
(1.9
)
Fin
lan
d
12
.3
(3.6
) 8
.8
(3.6
) 1
0.2
(1
.3)
9.2
(1
.2)
31
.4
(3.9
) 3
1.3
(3
.8)
12
.5
(1.8
) 1
1.7
(1
.7)
9.8
(1
.5)
6.7
(1
.4)
Fra
nce
^
16
.4
(3.4
) 9
.2
(3.3
) 3
.9
(1.2
) 3
.0
(1.1
) 1
7.9
(4
.1)
16
.5
(3.7
) 5
.7
(1.9
) 4
.7
(1.7
) 4
.3
(1.7
) 2
.1
(1.6
)
Ger
man
y^
(r)
12
.6
(6.8
) 9
.0
(6.3
) 4
.7
(1.6
) 5
.8
(1.6
) 4
0.7
(1
1.1
) 3
8.2
(10
.0)
7.4
(2
.9)
7.8
(2
.8)
–2
.0
(2.0
)–
2.1
(1
.7)
Ital
y²
4.4
(4
.2)
–3
.6
(4.3
) 1
0.3
(1
.6)
9.8
(1
.6)
14
.2
(5.4
) 1
4.5
(5
.2)
5.2
(2
.0)
5.4
(2
.1)
6.8
(2
.3)
5.0
(2
.2)
Kaz
akh
stan
¹ 6
.1
(5.2
) 3
.5
(5.0
) 8
.6
(1.8
) 6
.3
(1.9
) 1
6.9
(5
.2)
14
.5
(5.2
) 5
.0
(2.3
) 4
.2
(2.3
) 2
.3
(2.0
) 1
.7
(1.9
)
Ko
rea,
Rep
ub
lic o
f 1
3.3
(4
.4)
10
.1
(4.5
) 1
3.9
(1
.6)
12
.6
(1.4
) 3
8.3
(5
.9)
33
.7
(5.4
) 2
.6
(2.1
) 1
.1
(1.9
) 7
.3
(2.2
) 6
.8
(2.2
)
Po
rtu
gal†
† ¹
6
.6
(3.2
) –
0.8
(3
.0)
7.5
(1
.3)
6.6
(1
.3)
20
.1
(3.7
) 1
8.6
(3
.4)
1.7
(1
.9)
0.5
(1
.8)
–1
.2
(1.9
)–
1.3
(1
.9)
Uru
guay
^
(r)
4.0
(4
.0)
–1
.8
(4.5
)1
4.1
(1
.5)
11
.9
(1.5
) 2
3.8
(4
.7)
20
.8
(4.6
) 4
.5
(2.7
) 3
.1
(2.7
) –
0.3
(2
.5)
–0
.3
(2.5
)
ICIL
S 2
01
8 a
vera
ge
10
.6
(1.5
) 5
.7
(1.4
) 9
.0
(0.5
) 8
.0
(0.5
) 2
7.0
(2
.0)
24
.4
(1.9
) 5
.3
(0.7
) 4
.6
(0.7
) 3
.7
(0.6
) 2
.7
(0.6
)
No
t m
eeti
ng
sam
ple
par
tici
pat
ion
req
uir
emen
ts
Un
ited
Sta
tes^
1
5.9
(4
.2)
6.8
(4
.0)
7.5
(1
.5)
5.5
(1
.4)
24
.0
(5.2
) 2
3.1
(4
.7)
3.9
(1
.9)
3.1
(1
.8)
11
.8
(1.7
) 9
.4
(1.6
)
Ben
chm
arki
ng
par
tici
pan
ts m
eeti
ng
sam
ple
par
tici
pat
ion
req
uir
emen
ts
Mo
sco
w (R
uss
ian
Fed
erat
ion
) 1
6.5
(4
.4)
8.9
(4
.2)
3.1
(1
.6)
2.8
(1
.6)
34
.1
(4.9
) 2
8.7
(4
.0)
1.7
(1
.9)
1.0
(1
.7)
3.5
(1
.7)
1.6
(1
.7)
Nor
th R
hine
–Wes
tpha
lia
(r)
4.3
(6
.9)
–0
.2
(5.7
) 6
.0
(1.8
) 6
.0
(1.8
) 2
0.4
(5
.1)
19
.4
(4.6
) 4
.4
(2.6
) 4
.3
(2.0
) –
2.0
(2
.5)
–2
.1
(2.5
)(G
erm
any)

227INVESTIGATING VARIATIONS IN CIL AND CT
Students’ reports on the use of general ICT applications during class had positive associations with
participant Moscow (Russian Federation) in Model 2 (with an average effect of almost four points),
and in four countries in Model 3 (on average associated with less than three points).
When reviewing the effects of school-level predictors, we observe less consistency in the
associations of these variables with CIL (Table 7.4). School expectations of teacher collaboration
points) and Portugal (with 12 points), as well as in the benchmarking participant North Rhine-
CIL in Germany (24 points) for Model 2. This variable was a positive predictor in Germany and
Portugal for Model 3 after controlling for social context variables.
Model 2 predictor of CIL in Chile, Kazakhstan, Uruguay, and the benchmarking participant of
North Rhine-Westphalia (Germany). However, after controlling for personal and social background
in any of the countries meeting IEA sample participation requirements were recorded after
controlling for social context variables as part of Model 3.
per country (by accounting only for countries meeting IEA sample participation requirements)
in each of the models (Table 7.5). For example, for (female) gender, we recorded six instances
there were no countries where this variable had a negative effect. The same numbers were found
when including all predictors in Model 3. Generally, we can observe that while student-level
2 are further reduced after controlling for social context factors in Model 3.
To explain variation in students’ CT scores, we applied almost the same models as for CIL. The
related tasks at school. The analyses included data from six countries that met the IEA sampling
participation requirements, data from the United States (which were reported separately as they
Westphalia (Germany) (data which are also included in the German national sample).
The results regarding the variance estimates for CT (overall, within, and between schools) and
variance explanation by different models at each level are somewhat similar to those for CIL.
(Table 7.6). There was considerable variation with regard to the overall variance of CT scores
across countries, ranging from slightly below 7000 in Denmark and Portugal to more than 12,000
in Germany and Korea. The proportion of variance between schools also differed considerably,
ranging from seven percent in Denmark to 46 percent in Germany. On average across countries,
the proportion of variance between schools was 20 percent. Model 1 predictors (related to

228 PREPARING FOR LIFE IN A DIGITAL WORLD
No
tes:
Sta
nd
ard
err
ors
app
ear
in p
aren
thes
es.
bo
ld.
†
Met
gu
idel
ines
for
sam
plin
g pa
rtic
ipat
ion
rat
es o
nly
aft
er r
epla
cem
ent
sch
oo
ls w
ere
incl
ud
ed.
††
N
earl
y m
et g
uid
elin
es fo
r sa
mpl
ing
part
icip
atio
n r
ates
aft
er r
epla
cem
ent
sch
oo
ls w
ere
incl
ud
ed.
^
No
t m
eeti
ng
sam
plin
g pa
rtic
ipat
ion
req
uir
emen
ts fo
r te
ach
er s
urv
ey.
An
“(r)
” in
dic
ates
th
at d
ata
are
avai
lab
le fo
r at
leas
t 7
0%
bu
t le
ss t
han
85
% o
f stu
den
ts.
Co
un
try
Sch
oo
ls’ e
xpec
tati
on
s o
f tea
cher
IC
T r
eso
urc
es a
t sc
ho
ol
Ave
rage
yea
rs o
f tea
cher
exp
erie
nce
Te
ach
er r
epo
rts
on
stu
den
ts’ I
CT
co
mm
un
icat
ion
via
ICT
u
sin
g IC
T d
uri
ng
less
on
s u
se fo
r cl
ass
acti
viti
es
Mo
del
2
Mo
del
3
Mo
del
2
Mo
del
3
Mo
del
2
Mo
del
3
Mo
del
2
Mo
del
3
Ch
ile
–2
.4
(3.6
)–
3.5
(2
.3)
3.5
(4
.1)
–1
.9(2
.8)
12
.2
(6.2
) 8
.4
(3.9
)1
.5
(3.1
)1
.2
(2.3
)
Den
mar
k† ¹
–
0.2
(2
.4)
–0
.7
(2.0
) 0
.8
(3.2
) –
0.2
(2
.6)
2.0
(4
.4)
0.7
(3
.9)
–4
.3
(4.3
) –
5.1
(3
.4)
Fin
lan
d
0.9
(1
.9)
1.0
(1
.9)
1.7
(2
.8)
1.3
(2
.4)
–3
.7
(4.7
)–
3.1
(4
.8)
6.0
(2
.6)
4.6
(2
.4)
Fra
nce
^
–1
.4
(2.4
)2
.3
(1.8
) –
0.7
(2
.5)
1.7
(2
.3)
–2
.1
(4.2
)2
.2
(3.6
) 9
.0
(2.7
) –
0.3
(2
.4)
Ger
man
y^(r
)2
3.1
(7
.0)
10
.1
(3.6
) 2
3.7
(8
.8)
12
.5
(4.9
) –
18
.0 (
16
.1)
–4
.3
(9.4
)4
.1
(5.5
) –
2.9
(3
.7)
Ital
y²
8.0
(4
.5)
5.4
(4
.9)
1.0
(3
.2)
1.9
(3
.0)
0.1
(6
.6)
7.6
(6
.0)
–0
.8(3
.1)
–4
.4
(3.1
)
Kaz
akh
stan
¹ 1
1.6
(8
.0)
10
.8
(8.4
) 6
.4
(8.0
) 5
.0
(7.9
) 2
2.8
(1
0.2
) 1
9.8
(10
.6)
0.8
(8
.9)
–4
.3
(8.2
)
Ko
rea,
Rep
ub
lic o
f –
1.3
(2
.9)
–2
.8
(2.5
) –
1.5
(3
.1)
–3
.5
(2.5
) 4
.4
(5.1
) –
2.0
(4
.4)
0.5
(3
.7)
2.3
(2
.6)
Po
rtu
gal†
† ¹
1
2.2
(4
.0)
4.6
(2
.7)
6.4
(4
.9)
7.1
(3
.5)
3.7
(1
0.6
)1
0.2
(9
.5)
3.3
(4
.0)
0.2
(2
.9)
Uru
guay
^
(r)
1.6
(9
.3)
–4
.0
(5.5
)–
1.8
(6
.0)
1.0
(2
.8)
23
.7
(9.1
) 4
.9
(6.4
) 4
.6
(6.0
) –
1.1
(3
.4)
ICIL
S 2
01
8 a
vera
ge
5.2
(1
.7)
2.3
(1
.3)
4.0
(1
.6)
2.5
(1
.1)
4.5
(2
.7)
4.4
(2
.1)
2.5
(1
.5)
–1
.0
(1.2
)
No
t m
eeti
ng
sam
ple
par
tici
pat
ion
req
uir
emen
ts
Un
ited
Sta
tes^
6
.0
(3.1
) 2
.7
(2.9
) 6
.6
(2.5
) 5
.4
(2.0
) 6
.4
(2.8
) 1
.6
(2.3
) 4
.2
(2.7
) 4
.7
(1.8
)
Ben
chm
arki
ng
par
tici
pan
ts m
eeti
ng
sam
ple
par
tici
pat
ion
req
uir
emen
ts
Mo
sco
w (R
uss
ian
Fed
erat
ion
) –
3.4
(2
.6)
–2
.5
(2.2
)0
.6
(2.4
) 1
.0
(1.9
) –
2.5
(5
.5)
–4
.7
(5.2
)4
.5
(2.5
) 3
.2
(1.8
)
No
rth
Rh
ine-
Wes
tph
alia
(r
) 1
2.9
(4
.4)
3.0
(3
.0)
8.8
(3
.7)
5.9
(2
.1)
20
.5
(5.4
) 1
4.7
(3
.9)
8.6
(4
.7)
–0
.8
(3.6
)(G
erm
any)

229INVESTIGATING VARIATIONS IN CIL AND CT
Pre
dic
tor
vari
able
s M
od
el 1
: Nu
mb
er o
f co
un
trie
s w
her
e th
e M
od
el 2
: Nu
mb
er o
f co
un
trie
s w
her
e th
e
Mo
del
3: N
um
ber
of c
ou
ntr
ies
wh
ere
the
Po
siti
ve e
ffec
t N
egat
ive
effe
ct
Po
siti
ve e
ffec
t N
egat
ive
effe
ct
Po
siti
ve e
ffec
t N
egat
ive
effe
ct
Stu
den
ts p
erso
nal
an
d s
oci
al b
ackg
rou
nd
Gen
der
(fem
ale)
6
0
6
0
Test
lan
guag
e u
se a
t h
om
e 5
0
6
0
Exp
ecte
d u
niv
ersi
ty e
du
cati
on
9
0
9
0
Soci
oec
on
om
ic c
on
text
Stu
den
ts’ s
oci
oec
on
om
ic h
om
e b
ackg
rou
nd
1
0
0
8
0
Ave
rage
so
cio
eco
no
mic
bac
kgro
un
d (a
ggre
gate
) 1
0
0
10
0
Stu
den
t le
vel I
CT-
rela
ted
fact
ors
Nu
mb
er o
f co
mpu
ters
at
ho
me
6
0
5
0
Exp
erie
nce
wit
h c
om
pute
rs
10
0
1
0
0
Dai
ly c
om
pute
r u
se a
t h
om
e 1
0
0
10
0
Use
of g
ener
al IC
T a
pplic
atio
ns
in c
lass
6
0
5
0
Rep
ort
s o
n le
arn
ing
of C
IL-r
elat
ed t
asks
5
0
4
0
Sch
oo
l lev
el IC
T-re
late
d fa
cto
rs
Sch
oo
l exp
ecta
tio
ns
of t
each
er c
om
mu
nic
atio
n v
ia IC
T
2
0
1
0
ICT
co
ord
inat
or
repo
rts
on
ICT
res
ou
rces
1
0
2
0
Ave
rage
yea
rs o
f tea
cher
exp
erie
nce
usi
ng
ICT
du
rin
g le
sso
ns
3
0
1
0
ICT
use
for
stu
den
t ac
tivi
ties
(agg
rega
te)
2
0
0
0

230 PREPARING FOR LIFE IN A DIGITAL WORLD
Wit
hin
-sch
oo
l var
ian
ce e
xpla
ined
by
Mo
del
2 p
red
icto
rs
Ad
dit
ion
al w
ith
in-s
cho
ol v
aria
nce
exp
lain
ed b
y M
od
el 3
pre
dic
tors
Wit
hin
-sch
oo
l var
ian
ce n
ot
expl
ain
ed b
y m
od
el p
red
icto
rs
Bet
wee
n-s
cho
ol v
aria
nce
exp
lain
ed b
y M
od
el 2
pre
dic
tors
Ad
dit
ion
al b
etw
een
-sch
oo
l var
ian
ce e
xpla
ined
by
Mo
del
3 p
red
icto
rs
Bet
wee
n-s
cho
ol v
aria
nce
no
t ex
plai
ned
by
mo
del
pre
dic
tors
10
,00
05
00
05
00
01
0,0
00
No
tes:
†
Met
gu
idel
ines
for
sam
plin
g pa
rtic
ipat
ion
rat
es o
nly
aft
er r
epla
cem
ent
sch
oo
ls w
ere
incl
ud
ed.
†† N
earl
y m
et g
uid
elin
es fo
r sa
mpl
ing
part
icip
atio
n r
ates
aft
er r
epla
cem
ent
sch
oo
ls w
ere
incl
ud
ed.
^
Did
no
t m
eet
sam
plin
g pa
rtic
ipat
ion
req
uir
emen
ts fo
r te
ach
er s
urv
ey.
1 An
“(r)
” in
dic
ates
th
at d
ata
are
avai
lab
le fo
r at
leas
t 7
0%
bu
t le
ss t
han
85
% o
f stu
den
ts.
Co
un
try
Var
ian
ce e
stim
ates
P
erce
nt
of v
aria
nce
exp
lain
ed b
y:
Mo
del
0
Mo
del
1
Mo
del
2
Mo
del
3
Var
ianc
e w
ithi
n sc
hool
s V
aria
nce
betw
een
scho
ols
Tota
l W
ith
in
Bet
wee
n
Per
cen
t W
ith
in
Bet
wee
n
Wit
hin
B
etw
een
W
ith
in
Bet
wee
n
vari
ance
sc
ho
ols
sc
ho
ols
b
etw
een
sc
ho
ols
sc
ho
ols
sc
ho
ols
sc
ho
ols
sc
ho
ols
sc
ho
ols
sch
oo
ls
Den
mar
k† ¹
6
83
7
63
38
4
98
7
9
3
7
8
25
1
5
52
Fin
lan
d
8
76
5
76
51
1
11
4
13
7
3
2
15
4
6
19
5
8
Fra
nce
^
7
66
4
64
22
1
24
2
16
1
4
43
5
3
5
18
6
0
Ger
man
y^
(r)
12
38
1
66
48
5
73
3
46
3
7
9
5
41
8
8
6
Ko
rea,
Rep
ub
lic o
f 1
22
91
1
11
74
1
11
7
9
6
18
1
3
16
1
7
26
Po
rtu
gal†
† ¹
6
81
8
48
10
2
00
8
29
1
0
49
6
3
4
15
6
4
ICIL
S 2
01
8 a
vera
ge
20
8
4
3
9
33
1
5
58
No
t m
eeti
ng
sam
ple
par
tici
pat
ion
req
uir
emen
ts
Un
ited
Sta
tes^
10
27
9
82
68
2
01
1
20
7
5
4
6
54
1
1
73
Ben
chm
arki
ng
par
tici
pan
t m
eeti
ng
sam
ple
par
tici
pat
ion
req
uir
emen
ts
No
rth
Rh
ine-
Wes
tph
alia
(Ger
man
y)
(r)
86
63
5
95
2
27
11
3
1
10
7
8
4
41
1
3
85

231INVESTIGATING VARIATIONS IN CIL AND CT
personal and social background) explained on average eight percent within schools (ranging
from 3% in Germany to 14% in France) and 43 percent between schools (ranging from 18% in
Korea to 79% in Germany). The corresponding estimates of explained variance for Model 2 were
nine percent within schools (ranging from 5% or less in France, Germany, and the benchmarking
participant North Rhine-Westphalia, Germany, to 15% in Finland) and 33 percent between schools
(ranging from 16% in Korea to 46% in Finland). For Model 3 these were 15 percent on average
within schools (lowest was 8% in Germany and highest was 19% in Finland) and 58 percent at
the school level (lowest was 26% in Korea and 86% in Germany).
associations with female gender in all countries except Finland, where a positive relationship
was observed (Model 1). On average we recorded a net effect of about –12 score points.
When comparing these results with the (mostly smaller) gender differences reported in Chapter
schools and after controlling for other variables in the model. Typically, gender effects remained
unchanged after taking other ICT-related factors into account (Model 3). However, in some
countries (Chile, Finland, France, and Germany) and the benchmarking participant North
Rhine-Westphalia (Germany) in both Model 1 and Model 3. Expected university education was
of Germany. On average we observed a net effect of almost 21 score points, which was only
slightly lower for Model 3 where ICT-related factors were considered as well.
The within-school effects of socioeconomic background were significant and positive in all
countries, on average across participating countries one national standard deviation was
associated with a change of almost 15 score points in Model 1 and with over 12 points in Model
3. However, they ranged from less than 10 points in Germany to more than 20 score points
Denmark and Korea, in both models. For Model 1, we recorded effects of about 30 score points
in Germany.
When reviewing the effects of ICT-related variables on CT at the student level (Table 7.8), we
noted similar results to those found for CIL. The most consistent positive predictor was students’
daily use of ICT, associated with more than 33 points on average, ranging from about 20 (in
Model 3 after controlling for personal and social background factors, with an average effect
points in Model 2 (and about eight points for Model 3). Larger effects for this predictor of 10
or more score points were observed in Denmark, Finland, and Korea.
Having two or more computers at home had significant positive effects for Model 2 in all
countries except Germany and Portugal. On average across participating countries, we observed
an effect of about 12 score points. However, after controlling for factors related to personal and
controlling for personal and social background factors.
within schools with CT in Denmark, Finland, and France. For Model 2 in these countries one
232 PREPARING FOR LIFE IN A DIGITAL WORLD
No
tes:
p
bo
ld.
†
Met
gu
idel
ines
for
sam
plin
g pa
rtic
ipat
ion
rat
es o
nly
aft
er r
epla
cem
ent
sch
oo
ls w
ere
incl
ud
ed.
††
N
earl
y m
et g
uid
elin
es fo
r sa
mpl
ing
part
icip
atio
n r
ates
aft
er r
epla
cem
ent
sch
oo
ls w
ere
incl
ud
ed.
^
Did
no
t m
eet
sam
plin
g pa
rtic
ipat
ion
req
uir
emen
ts fo
r te
ach
er s
urv
ey.
An
“(r)
” in
dic
ates
th
at d
ata
are
avai
lab
le fo
r at
leas
t 7
0%
bu
t le
ss t
han
85
% o
f stu
den
ts.
Co
un
try
Stu
den
t ch
arac
teri
stic
s St
ud
ents
’ an
d s
cho
ols
’ so
cial
co
nte
xt
Stu
den
ts’ g
end
er (f
emal
e)
Test
lan
guag
e u
se a
t h
om
e E
xpec
ted
un
iver
sity
deg
ree
Soci
oec
on
om
ic b
ackg
rou
nd
Sc
ho
ol a
vera
ge o
f stu
den
ts’
at h
om
e so
cio
eco
no
mic
bac
kgro
un
d
Mo
del
1
Mo
del
3
Mo
del
1
Mo
del
3
Mo
del
1
Mo
del
3
Mo
del
1
Mo
del
3
Mo
del
1
Mo
del
3
Den
mar
k† ¹
–
10
.4
(4.5
)–
10
.5
(4.3
) 3
3.3
(9
.0)
31
.1
(8.6
) 3
0.2
(4
.4)
28
.8 (
4.3
) 1
6.1
(2
.2)
13
.8
(2.1
) 8
.8
(6.2
) 8
.9
(6.1
)
Fin
lan
d
8.0
(3
.7)
3.7
(3
.3)
33
.6
(8.8
) 2
9.3
(8
.6)
18
.8
(4.3
) 1
3.9
(3
.8)
17
.8
(2.0
) 1
4.7
(1
.7)
21
.1
(8.5
) 1
3.8
(6
.8)
Fra
nce
^
–1
2.7
(3
.7)
–1
4.5
(3
.6)
29
.2
(6.3
) 2
5.7
(6
.2)
33
.2
(3.8
) 3
2.3
(3
.7)
21
.5
(2.3
) 1
9.9
(2
.2)
25
.1
(7.1
) 2
3.4
(7
.2)
Ger
man
y^
(r)
–1
1.1
(5
.8)
–1
1.1
(5
.5)
32
.6
(8.8
) 3
1.3
(8
.9)
12
.3
(8.8
) 1
2.8
(7
.1)
9.5
(3
.2)
7.7
(2
.8)
87
.5 1
0.1
) 7
5.4
(7
.3)
Ko
rea,
Rep
ub
lic o
f –
17
.8
(6.2
)–
21
.9
(5.8
) –
1.1
(4
4.7
) 0
.5 (4
0.4
) 5
2.3
(8
.8)
40
.8 (
6.0
) 1
0.1
(2
.8)
7.1
(2
.8)
8.6
(1
0.4
) 1
2.3
(7
.2)
Po
rtu
gal†
† ¹
–
24
.9
(4.1
)–
25
.7
(3.9
)–
3.4
(9
.3)
–4
.6
(9.2
)3
4.1
(3
.9)
32
.2 (
3.9
) 1
2.0
(2
.2)
12
.0
(2.2
) 2
9.1
(10
.1)
24
.9
(8.7
)
ICIL
S 2
01
8 a
vera
ge
–1
1.5
(1
.9)
–1
3.3
(1
.8)
20
.7
(8.1
) 1
8.9
(7
.4)
30
.1
(2.5
) 2
6.8
(2
.0)
14
.5
(1.0
) 1
2.5
(1
.0)
30
.1
(3.6
) 2
6.5
(3
.0)
No
t m
eeti
ng
sam
ple
par
tici
pat
ion
req
uir
emen
ts
Un
ited
Sta
tes^
–
13
.7
(5.6
)–
13
.0
(5.3
)1
.3
(6.6
) –
1.2
(6
.8)
32
.4
(5.7
) 2
8.3
(6
.0)
20
.2
(2.7
) 1
6.5
(2
.7)
29
.0
(7.5
) 1
9.5
(6
.1)
Ben
chm
arki
ng
par
tici
pan
t m
eeti
ng
sam
ple
par
tici
pat
ion
req
uir
emen
ts
No
rth
Rh
ine-
Wes
tph
alia
(r
) –
29
.1
(4.4
) –
28
.0
(4.2
) 3
6.7
(5
.9)
34
.2
(6.2
) 2
6.0
(6
.0)
24
.3 (
6.0
) 6
.1
(2.5
) 6
.8
(2.6
) 7
1.2
(6
.8)
62
.4
(7.7
)
(Ger
man
y)

233INVESTIGATING VARIATIONS IN CIL AND CT
No
tes:
p
bo
ld.
†
Met
gu
idel
ines
for
sam
plin
g pa
rtic
ipat
ion
rat
es o
nly
aft
er r
epla
cem
ent
sch
oo
ls w
ere
incl
ud
ed.
††
N
earl
y m
et g
uid
elin
es fo
r sa
mpl
ing
part
icip
atio
n r
ates
aft
er r
epla
cem
ent
sch
oo
ls w
ere
incl
ud
ed.
^
Did
no
t m
eet
sam
plin
g pa
rtic
ipat
ion
req
uir
emen
ts fo
r te
ach
er s
urv
ey.
An
“(r)
” in
dic
ates
th
at d
ata
are
avai
lab
le fo
r at
leas
t 7
0%
bu
t le
ss t
han
85
% o
f stu
den
ts.
Co
un
try
ICT
acc
ess,
use
, an
d fa
mili
arit
y
CT
lear
nin
g at
sch
oo
l
Co
mp
ute
rs a
t h
om
e (a
t le
ast
two)
C
om
pu
ter
exp
erie
nce
IC
T u
se (d
aily
) U
se o
f gen
eral
ICT
ap
plic
atio
ns
Rep
ort
s o
n t
each
ing
of
Mo
del
2
Mo
del
3
Mo
del
2
Mo
del
3
Mo
del
2
Mo
del
3
Mo
del
2
Mo
del
3
Mo
del
2
Mo
del
3
Den
mar
k† ¹
2
1.3
(9
.9)
15
.9
(9.0
) 1
2.5
(1
.9)
11
.4
(1.9
) 3
8.8
(1
5.5
) 3
2.7
(15
.3)
9.6
(2
.4)
7.1
(2
.3)
–6
.5
(2.3
)–
7.1
(2
.2)
Fin
lan
d
15
.5
(4.2
) 9
.9
(4.2
) 1
0.6
(1
.5)
9.6
(1
.6)
38
.7
(4.2
) 3
6.6
(4
.2)
13
.9
(2.2
) 1
2.5
(2
.1)
–1
0.1
(2
.0)
–9
.8
(2.0
)
Fra
nce
^
12
.6
(4.0
) 4
.3
(4.0
) 2
.5
(1.3
) 1
.6
(1.2
) 1
9.9
(4
.4)
17
.7
(4.2
) 6
.1
(2.0
) 5
.0
(1.8
) –
10
.5
(2.1
)–
10
.1
(1.9
)
Ger
man
y^
(r)
8.5
(9
.2)
3.4
(8
.4)
3.6
(1
.8)
4.5
(1
.7)
35
.3 (
11
.0)
34
.3 (1
0.8
) 5
.9
(3.6
) 4
.8
(3.4
) –
9.7
(2
.8)
–8
.8
(2.6
)
Ko
rea,
Rep
ub
lic o
f 9
.0
(4.6
) 5
.1
(4.6
) 1
5.5
(2
.2)
14
.0
(2.0
) 4
7.5
(6
.8)
45
.3
(6.7
) 6
.9
(3.6
) 6
.1
(3.5
) –
13
.0
(3.2
)–
12
.6
(3.0
)
Po
rtu
gal†
† ¹
3
.5
(3.8
) –
7.6
(3
.8)
8.1
(1
.4)
6.8
(1
.4)
21
.5
(4.2
) 1
8.7
(4
.0)
–1
.4
(1.8
)–
2.6
(1
.5)
–8
.8
(1.9
)–
8.7
(1
.7)
ICIL
S 2
01
8 a
vera
ge1
1.7
(2
.6)
5.2
(2
.5)
8.8
(0
.7)
8.0
(0
.7)
33
.6
(3.6
) 3
0.9
(3
.5)
6.9
(1
.1)
5.5
(1
.0)
–9
.8
(1.0
)–
9.5
(0
.9)
No
t m
eeti
ng
sam
ple
par
tici
pat
ion
req
uir
emen
ts
Un
ited
Sta
tes^
2
0.1
(5
.7)
8.0
(5
.3)
8.6
(1
.8)
6.1
(1
.8)
32
.3
(7.2
) 2
9.4
(7
.2)
8.3
(2
.6)
6.7
(2
.5)
–6
.9
(2.7
)–
7.1
(2
.5)
Ben
chm
arki
ng
par
tici
pan
t m
eeti
ng
sam
ple
par
tici
pat
ion
req
uir
emen
ts
No
rth
Rh
ine-
Wes
tph
alia
(r
) 1
6.8
(7
.0)
5.9
(7
.3)
2.5
(2
.1)
2.1
(2
.0)
14
.5
(5.8
) 1
3.2
(5
.6)
5.0
(3
.3)
2.8
(3
.3)
–1
1.4
(4
.2)
–1
0.6
(4
.1)
(Ger
man
y)

234 PREPARING FOR LIFE IN A DIGITAL WORLD
national standard deviation was associated with increases of about 10, 14, and six points
respectively. Similar effects were recorded in these three countries for Model 3 where personal
and social background factors were included.
negative predictor in all countries for Models 2 and 3. One national standard deviation was on
is due to the fact that positive responses are related experiences with remedial instruction
knowledgeable students were better able to understand the content of the items and less
to these tasks at school.
For both models, schools’ expectations of teachers’ use of ICT for communication via ICT has
both countries these effects decreased after controlling for social context variables in Model 3
positive associations with CT in Portugal after controlling for social context factors (Model 3:
almost eight score points).
associations with CT across countries except in the benchmarking participant North Rhine-
Westphalia (Germany) (in both Models 2 and 3). Aggregated teacher reports on the use of ICT
however, this association was no longer statistically significant in France in Model 3 after
controlling for the schools’ socioeconomic context.
option and met IEA sample participation requirements, we can see that (female) gender had
(Table 7.10). Furthermore, we observed that school-level factors related to ICT were not
consistent predictors across countries. However, student-level factors related to ICT experience
effects of students’ reports on learning of CT-related skills in class are noteworthy and warrant
further investigation in future secondary analyses.
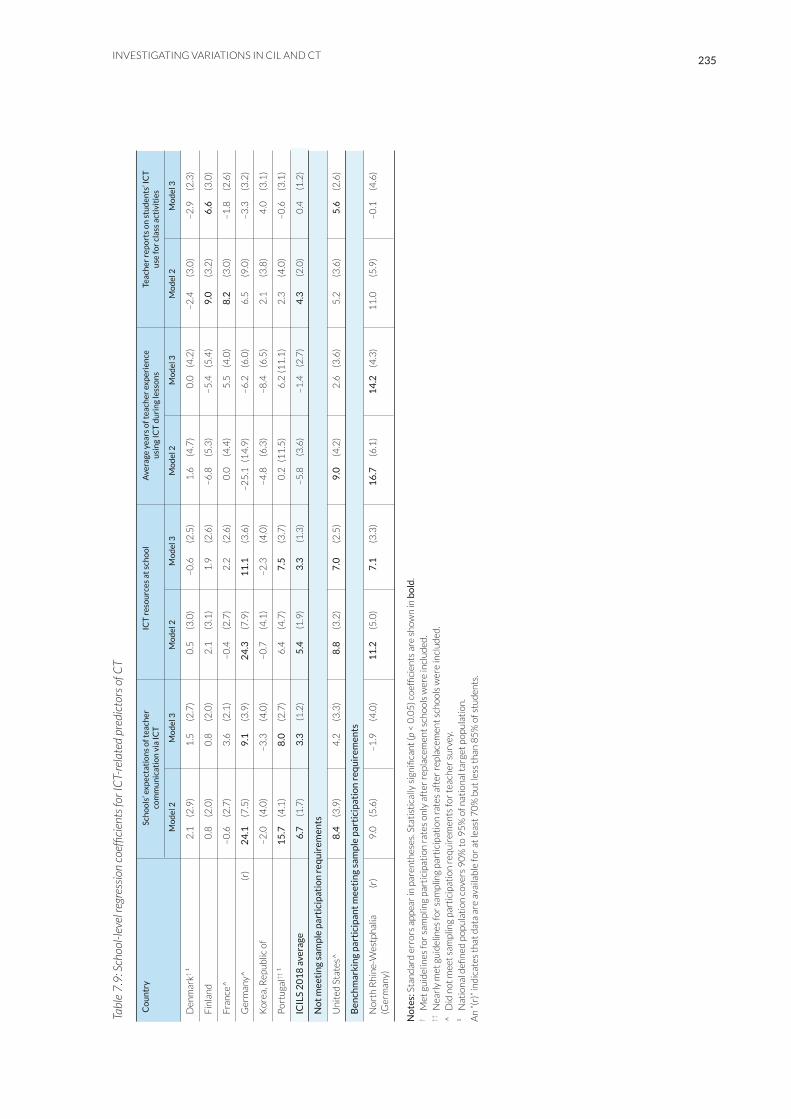
235INVESTIGATING VARIATIONS IN CIL AND CT
No
tes:
p
bo
ld.
†
Met
gu
idel
ines
for
sam
plin
g pa
rtic
ipat
ion
rat
es o
nly
aft
er r
epla
cem
ent
sch
oo
ls w
ere
incl
ud
ed.
††
N
earl
y m
et g
uid
elin
es fo
r sa
mpl
ing
part
icip
atio
n r
ates
aft
er r
epla
cem
ent
sch
oo
ls w
ere
incl
ud
ed.
^
Did
no
t m
eet
sam
plin
g pa
rtic
ipat
ion
req
uir
emen
ts fo
r te
ach
er s
urv
ey.
An
“(r)
” in
dic
ates
th
at d
ata
are
avai
lab
le fo
r at
leas
t 7
0%
bu
t le
ss t
han
85
% o
f stu
den
ts.
Co
un
try
Sch
oo
ls’ e
xpec
tati
on
s o
f tea
cher
IC
T r
eso
urc
es a
t sc
ho
ol
Ave
rage
yea
rs o
f tea
cher
exp
erie
nce
Te
ach
er r
epo
rts
on
stu
den
ts’ I
CT
co
mm
un
icat
ion
via
ICT
u
sin
g IC
T d
uri
ng
less
on
s u
se fo
r cl
ass
acti
viti
es
Mo
del
2
Mo
del
3
Mo
del
2
Mo
del
3
Mo
del
2
Mo
del
3
Mo
del
2
Mo
del
3
Den
mar
k† ¹
2
.1
(2.9
) 1
.5
(2.7
) 0
.5
(3.0
) –
0.6
(2
.5)
1.6
(4
.7)
0.0
(4
.2)
–2
.4
(3.0
) –
2.9
(2
.3)
Fin
lan
d
0.8
(2
.0)
0.8
(2
.0)
2.1
(3
.1)
1.9
(2
.6)
–6
.8
(5.3
)–
5.4
(5
.4)
9.0
(3
.2)
6.6
(3
.0)
Fra
nce
^
–0
.6
(2.7
)3
.6
(2.1
) –
0.4
(2
.7)
2.2
(2
.6)
0.0
(4
.4)
5.5
(4
.0)
8.2
(3
.0)
–1
.8
(2.6
)
Ger
man
y^(r
) 2
4.1
(7
.5)
9.1
(3
.9)
24
.3
(7.9
) 1
1.1
(3
.6)
–2
5.1
(1
4.9
)–
6.2
(6
.0)
6.5
(9
.0)
–3
.3
(3.2
)
Ko
rea,
Rep
ub
lic o
f –
2.0
(4
.0)
–3
.3
(4.0
) –
0.7
(4
.1)
–2
.3
(4.0
) –
4.8
(6
.3)
–8
.4
(6.5
) 2
.1
(3.8
) 4
.0
(3.1
)
Po
rtu
gal†
† ¹
1
5.7
(4
.1)
8.0
(2
.7)
6.4
(4
.7)
7.5
(3
.7)
0.2
(1
1.5
) 6
.2 (
11
.1)
2.3
(4
.0)
–0
.6
(3.1
)
ICIL
S 2
01
8 a
vera
ge
6.7
(1
.7)
3.3
(1
.2)
5.4
(1
.9)
3.3
(1
.3)
–5
.8
(3.6
)–
1.4
(2
.7)
4.3
(2
.0)
0.4
(1
.2)
No
t m
eeti
ng
sam
ple
par
tici
pat
ion
req
uir
emen
ts
Un
ited
Sta
tes^
8
.4
(3.9
) 4
.2
(3.3
) 8
.8
(3.2
) 7
.0
(2.5
) 9
.0
(4.2
) 2
.6
(3.6
) 5
.2
(3.6
) 5
.6
(2.6
)
Ben
chm
arki
ng
par
tici
pan
t m
eeti
ng
sam
ple
par
tici
pat
ion
req
uir
emen
ts
No
rth
Rh
ine-
Wes
tph
alia
(r
) 9
.0
(5.6
) –
1.9
(4
.0)
11
.2
(5.0
) 7
.1
(3.3
) 1
6.7
(6
.1)
14
.2
(4.3
) 1
1.0
(5
.9)
–0
.1
(4.6
)(G
erm
any)

236 PREPARING FOR LIFE IN A DIGITAL WORLD
Pre
dic
tor
vari
able
s M
od
el 1
: Nu
mb
er o
f co
un
trie
s w
her
e th
e M
od
el 2
: Nu
mb
er o
f co
un
trie
s w
her
e th
e
Mo
del
3: N
um
ber
of c
ou
ntr
ies
wh
ere
the
Po
siti
ve e
ffec
t N
egat
ive
effe
ct
Po
siti
ve e
ffec
t N
egat
ive
effe
ct
Po
siti
ve e
ffec
t N
egat
ive
effe
ct
Stu
den
ts p
erso
nal
an
d s
oci
al b
ackg
rou
nd
Gen
der
(fem
ale)
1
4
0
5
Test
lan
guag
e u
se a
t h
om
e 4
0
4
0
Exp
ecte
d u
niv
ersi
ty e
du
cati
on
5
0
5
0
Soci
oec
on
om
ic c
on
text
Soci
oec
on
om
ic h
om
e b
ackg
rou
nd
6
0
6
0
Ave
rage
so
cio
eco
no
mic
bac
kgro
un
d (a
ggre
gate
) 4
0
4
0
Stu
den
t le
vel I
CT-
rela
ted
fact
ors
Nu
mb
er o
f co
mpu
ters
at
ho
me
4
0
1
1
Exp
erie
nce
wit
h c
om
pute
rs
5
0
5
0
Dai
ly c
om
pute
r u
se a
t h
om
e 6
0
6
0
Use
of g
ener
al IC
T a
pplic
atio
ns
in c
lass
3
0
3
0
Rep
ort
s o
n t
each
ing
of C
T-re
late
d t
asks
at
sch
oo
l 0
6
0
6
Sch
oo
l lev
el IC
T-re
late
d fa
cto
rs
Sch
oo
l exp
ecta
tio
ns
of t
each
er c
om
mu
nic
atio
n v
ia IC
T
2
0
2
0
ICT
co
ord
inat
or
repo
rts
on
ICT
res
ou
rces
1
0
2
0
Ave
rage
yea
rs o
f tea
cher
exp
erie
nce
usi
ng
ICT
du
rin
g le
sso
ns
0
0
0
0
ICT
use
for
stu
den
t ac
tivi
ties
(agg
rega
te)
2
0
1
0
237INVESTIGATING VARIATIONS IN CIL AND CT
ReferencesACARA. (2012). National Assessment Program—ICT literacy. Years 6 & 10 report. 2011. Sydney, Australia: Australian Curriculum, Assessment and Reporting Authority. Retrieved from https://www.nap.edu.au/_resources/NAP_ICTL_2011_Public_Report_Final.pdf.
ACARA. (2015). National Assessment Program —ICT literacy. Years 6 & 10 report. 2014. Sydney, Australia: Australian Curriculum, Assessment and Reporting Authority. Retrieved from: http://www.nap.edu.au/_resources/D15_8761__NAP-ICT_2014_Public_Report_Final.pdf.
Cohen, J., & Cohen, P. (1975). . Hillsdale, NJ: Lawrence Erlbaum Associates.
Fraillon, J., Ainley, J., Schulz, W., Duckworth, D., & Friedman, T. (2019). IEA International Computer and Information Literacy Study 2018 assessment framework. Cham, Switzerland: Springer. Retrieved from https://www.springer.com/gp/book/9783030193881.
Fraillon, J., Ainley, J., Schulz, W., Friedman, T., & Gebhardt, E. (2014). Preparing for life in a digital age: The IEA International Computer and Information Literacy Study international report. Cham, Switzerland: Springer. Retrieved from https://www.springer.com/gp/book/9783319142210.
Fraillon, J., Schulz, W., Friedman, T., & Meyer, S. (Eds.). (2020). IEA International Computer and Information Literacy Study 2018 technical report. Amsterdam, The Netherlands: International Association for the Evaluation of Educational Achievement (IEA). Manuscript in preparation.
Hatlevik, O.E. (2009). How to identify and understand digital literacy among 9th grade Norwegian Nordic Journal of
Digital Literacy, 4(3-4), 159–174.
Hatlevik, O.E., & Christophersen, K.A. (2013). Digital competence at the beginning of upper secondary school: Identifying factors explaining digital inclusion. Computers & Education, 63(1), 240–247. Retrieved from https://doi.org/10.1016/j.compedu.2012.11.015.
Hatlevik, O.E., Ottestad, G., & Throndsen, I. (2014). Predictors of digital competence in 7th grade: a multilevel analysis. Journal of Computer Assisted Learning, 31, 220–231.
MCEECDYA [Ministerial Council for Education, Early Childhood Development and Youth Affairs]. (2010). National assessment program—ICT literacy. Years 6 & 10 report. 2008. Carlton South, Australia: Curriculum
MCEETYA [Ministerial Council for Education, Early Childhood Development and Youth Affairs]. (2007). National assessment program—ICT literacy. Years 6 and 10 report. 2005. Carlton South, Australia: Curriculum
Muthén, L.K., & Muthén, B.O. (1998–2012). Mplus user’s guide (seventh ed.). Los Angeles, CA: Muthén & Muthén. Retrieved from https://www.statmodel.com/download/usersguide/Mplus%20user%20guide%20Ver_7_r3_web.pdf.
OECD. (2011). PISA 2009 results: Students on line. Digital technologies and performance (Volume VI). Paris, France: Author. Retrieved from http://dx.doi.org/10.1787/9789264112995-en.
Raudenbush, S. W., & Bryk, A. S. (2002). Hierarchical linear models: Applications and data analysis methods. Newbury Park, CA: SAGE.
Román, M., & Murrillo, J. (2013). Estimación del efecto escolar para la competencia digital. Aporte del liceo en el desarrollo de las habilidades TIC en estudiantes de secundaria en Chile [Investigation into the effect of school on digital competency. The contribution of the lyceum to the development of ICT in Chilean high school students]. In CEPPE, Desarrollo de habilidades digitales para el siglo XXI en Chile: ¿Qué dice el SIMCE TIC?say?] (pp. 141–176). Santiago, Chile: LOM Ediciones.
Rutkowski, D., & Delandshere, G. (2016). Causal inferences with large scale assessment data: Using a validity framework. Large-scale Assessments in Education, 4(6). Retrieved from https://largescaleassessmentsineducation.springeropen.com/articles/10.1186/s40536-016-0019-1.
San Martín, E., Claro, M., Cabello, T., & Preiss, D. (2013). Habilidades TICs para el aprendizaje y su relación con el conocimiento escolar en lenguaje y matemáticas [ICT skills for learning and their relationship to school knowledge in language and mathematics]. In CEPPE. Desarrollo de habilidades digitales para el siglo XXI en Chile: ¿Qué dice el SIMCE TIC? does ICT SIMCE say?] (pp. 229–248). Santiago, Chile: LOM Ediciones.
US Department of Education, National Center for Education Statistics. (2016). The nation’s report card: . Retrieved from https://
www.nationsreportcard.gov/tel_2014/.

Open Access This chapter is licensed under the terms of the Creative Commons Attribution-NonCommercial 4.0 InternationalLicense (http://creativecommons.org/licenses/by-nc/4.0/), which permits any noncommercial use, sharing, adaptation, distributionand reproduction in any medium or format, as long as you give appropriate credit to the original author(s) and the source, provide alink to the Creative Commons license and indicate if changes were made. The images or other third party material in this chapter are included in the chapter s Creative Commons license, unless indicatedotherwise in a credit line to the material. If material is not included in the chapter s Creative Commons license and your intended useis not permitted by statutory regulation or exceeds the permitted use, you will need to obtain permission directly from the copyrightholder.
’’
238 PREPARING FOR LIFE IN A DIGITAL WORLD