Embed Size (px)
Citation preview
INVESTIGATION AND MITIGATION OF UNDER VOLTAGE
PROBLEMS IN DISTRIBUTION NETWORK BY OPTIMAL
PLACEMENT OF CAPACITOR BANKS
(A Case study at Adama Distribution System)
By : GENET LEMMA AWOKE
A Thesis Submitted to
The Department of Electrical Power and Control Engineering School of
Electrical Engineering and Computing
Presented In Partial Fulfillment of the Requirements for Degree Of
Master’s In Electrical Power Engineering and Control Engineering
(Specialization In Power System Engineering)
Office Of Graduate Studies
Adama Science And Technology University
Adama, Ethiopian
June , 2021
INVESTIGATION AND MITIGATION OF UNDER VOLTAGE
PROBLEMS IN DISTRIBUTION NETWORK BY OPTIMAL
PLACEMENT OF CAPACITOR BANKS
(Case Study: Adama Distribution Netwok)
By :GENET LEMMA AWOKE
Advisor: Dr. Mikiyas B.
A Thesis Submitted to
The Department of Electrical Power and Control Engineering School of
Electrical Engineering and Computing
Presented In Partial Fulfillment of the Requirements for Degree Of
Master’s In Electrical Power Engineering and Control Engineering
(Specialization In Power System Engineering)
Office Of Graduate Studies
Adama Science And Technology University
Adama, Ethiopian
June , 2021

Page III
Approval of Board of Examiners
We, the undersigned, members of the Board of Examiners of the final open defense by Genet
Lemma have read and evaluated his thesis entitled ―the investigation and mitigation of under
voltage problem in distribution system by optimal placement of capacitor banks‖ (Case
Study of Adama distribution Network ) and examine the candidate. This is, therefore, to
certify that the thesis has been accepted in partial fulfillment of the requirement of the Degree of
Masters of Science in Electrical Power Engineering.
______________________ __________________ _________________
Advisor Signature Date
______________________ __________________ _________________
Chair Person Signature Date
______________________ __________________ _________________
Internal Examiner Signature Date
______________________ __________________ _________________
External Examiner Signature Date

Page IV
DECLARATION
I , the undersigned , declare that this thesis is my original work , has not been presented for
fulfillment of a degree in this or any other university , and all sources and materials used for the
thesis have been acknowledged .
NAME: GENET LEMMA
Signature: ______________________
Place: Adama :Ethiopia
Date of submission: _______________________________
This thesis work has been submitted for examination with my approval as a university
Advisor
Dr. Mikiyas B. Signature ………………..
Advisor Name

Page V
ACKNOWLEDGMENTS
First of all, I would like to thank the Almighty God for giving the endurance to complete the
entire work. Next to that I would like to express my utmost gratitude to my advisor Dr. Mikias
Birhanu for his expert guidance, constructive comments, suggestions and encouragement without
which this work could have not been completed.
And also I would also like to extend my gratitude to the staff of the adama district Ethiopian
Electric utility and Oromia region Ethiopian Electric Utility, transmission substation operation
staff members, engineers and operators who helped me in collecting the necessary data for my
thesis work. Particular appreciation Solomon Atakelti; Temesgen Neri , and Abinet engineer at
SCADA planning department of adama district Ethiopian Electric utility and also Engineer
Senait gullulat Automation and scada system manager at adama district electric utility .
Finally, I would like to give special thanks to my beloved family, especially my Husband Ms.
Musie Melese for their unforgettable supports and dedication in all aspects of my thesis work.
Page VI
TABLE OF CONTENTS
CONTENTS PAGE NO
ABSTRACT................................................................................................................................................................. VIII
LIST OF TABLES ......................................................................................................................................................... IX
CHAPTER ONE ...............................................................................................................................................................1
INTRODUCTION ............................................................................................................................................................1
1.1. BACKGROUND ..................................................................................................................................................1
1.2. PROBLEM STATEMENT ...................................................................................................................................3
1.3. RESEARCH OBJECTIVE ...................................................................................................................................4
1.3.1. GENERAL OBJECTIVE ..................................................................................................................................4
1.3.2. SPECIFIC OBJECTIVE ...................................................................................................................................4
1.4. METHODOLOGY ...............................................................................................................................................4
1.5. SCOPE OF THE STUDY .....................................................................................................................................6
1.6. ORGANIZATION OF THE THESIS ...................................................................................................................6
CHAPTER TWO ..............................................................................................................................................................7
THREORETICAL BACKGOUND AND LITERATURE REVIEW ..............................................................................7
2.1. INTRODUCTION .....................................................................................................................................................7
2.2. ELECTRICAL POWER DISTRIBUTION SYSTEM ...............................................................................................7
2.3 DISTRIBUTION SYSTEM NETWORK CONFIGURATION .................................................................................8
2.3.1. RADIAL ELECTRICAL POWER DISTRIBUTION SYSTEM ............................................................................8
2.3.2 RING MAIN ELECTRICAL POWER DISTRIBUTION SYSTEM ......................................................................9
2.3. POWER QUALITY, RELIABILITY AND AVAILABILITY ............................................................................... 10
2.3.1 OVERVIEW OF POWER QUALITY ................................................................................................................... 11
2.4. THE CONCEPTS OF RELIABILITY IN DISTRIBUTION SYSTEM ................................................................ 14
2.5. RELIABILITY INDICES FOR DISTRIBUTION SYSTEM .................................................................................. 15
2.5.1. CUSTOMER-ORIENTED INDICES ................................................................................................................... 15
2.5.2. LOAD OR ENERGY-ORIENTED INDICES ..................................................................................................... 18
2.6. FACTORS AFFECTING VOLTAGE DROP AND POWER LOSS OF DISTRIBUTION FEEDERS ............ 18
2.7. DISTRIBUTION NETWORK POWER LOSS AND VOLTAGE DROP MINIMIZATION TECHNIQUES .. 20
2.8. REACTIVE POWER AND VOLTAGE DROP IN DISTRIBUTION SYSTEM .............................................. 22
2.9. REACTIVE POWER CONTROL ...................................................................................................................... 25
2.9.1. ELEMENTS OF SYSTEM THAT PRODUCES AND ABSORBS REACTIVE POWER ............................... 25
2.9.2. IMPORTANCE OF REACTIVE POWER ..................................................................................................... 25
2.9.3. PROBLEMS OF REACTIVE POWER .......................................................................................................... 26
2.9.4. REACTIVE POWER IN OPERATIONS ....................................................................................................... 27
2.10. CAPACITOR PLACEMENT FOR LOSS REDUCTION AND VOLTAGE PROFILE ............................... 28

Page VII
2.10.1. VOLTAGE PROFILE IMPROVEMENT .................................................................................................. 28
2.10.2. CONCEPT OF FIXED AND SWITCHED CAPACITORS ....................................................................... 29
2.11. INSTALLATION OF CAPACITOR BANK TO DISTRIBUTION FEEDER ............................................... 30
2.12. LITERATURE REVIEW ON POWER LOSS AND VOLTAGE DROP REDUCTION OF A
DISTRIBUTION SYSTEM ............................................................................................................................................ 31
CHAPTER THREE ........................................................................................................................................................ 33
DATA COLLECTION AND ANALYSIS ..................................................................................................................... 33
3.1. DATA COLLECTION ........................................................................................................................................... 33
3.2. DESCRIPTION OF THE STUDY AREA ............................................................................................................... 33
3.3. RELIABILITY OF DISTRIBUTION NETWORK ............................................................................................ 36
Types of voltage Disturbances in distribution system................................................................................................. 36
3.4. RELIABILITY ASSESSMENT OF ADAMA DISTRIBUTION NETWORK .................................................. 40
3.5. RELIABILITY INDICES EVALUATION OF ADAMA DISTRIBUTION NETWORK ................................. 47
3.6. COMPARISON OF RELIABILITY INDICES WITH BENCHMARKS .......................................................... 48
3.7. MODELING OF ADAMA DISTRIBUTION NETWORK IN ETAP SOFTWARE ......................................... 50
3.4. LOAD FLOW ANALYSIS OF ADAMA DISTRIBUTION FEEDER 01 ......................................................... 51
3.5. MODELING OF DISTRIBUTION NETWORK COMPONENTS .................................................................... 52
3.5.1. LINE MODEL ................................................................................................................................................ 53
3.5.2. LOAD MODEL .............................................................................................................................................. 53
3.5.3. TRANSFORMER MODEL ............................................................................................................................ 55
3.5.4. LOAD FLOW ANALYSIS............................................................................................................................. 56
CHAPTER FOUR ........................................................................................................................................................... 58
4.1. GENETIC ALGORITHM FOR OPTIMAL CAPACITOR PLACEMENT ....................................................... 58
4.2. OPTIMAL CAPACITOR PLACEMENT ............................................................................................................... 59
4.2.1. CALCULATION METHOD USING ETAPS ...................................................................................................... 62
4.2.1.1. OBJECTIVE FUNCTION OF OCP .................................................................................................................. 62
4.2.1.2 CONSTRAINTS ................................................................................................................................................. 63
4.4. RESULTS BASED ON CAPACITOR PLACEMENTS ......................................................................................... 74
4.5. OPTIMAL CAPACITOR PLACEMENTS COST SUMMARY............................................................................. 75
CHAPTER FIVE ............................................................................................................................................................ 77
CONCLUSIONS, RECOMMENDATIONS AND FUTURE WORK ........................................................................... 77
5.1. CONCLUSIONS...................................................................................................................................................... 77
5.2. RECOMMENDATION ........................................................................................................................................... 77
5.3. SUGGESTIONS FOR FUTURE WORK ................................................................................................................ 78
REFERENCES ............................................................................................................................................................... 79
Page VIII
ABSTRACT
Distribution feeders are components of distribution system which transfer power from distribution
substation to distribution transformers located near to customer’s premises. Distribution
substation feeders which have poor power factor, large loads beyond it’s’ carrying capacity and
which travel long distance to feed costumers are not efficient in transferring electrical power to
the connected costumers. To improve the efficiency of distribution feeders voltage profile
improvement techniques are required.
Adama distribution substation is one of the distribution substations found in Oromia electric utility
which has Eleven (11) outgoing feeders that feed different areas of Adama town. Among these
feeders, feeder four F1 has been selected as test system after investigation has been done through
distribution interruption due to over load regarding all outing feeders from 2018 to 2020 years
recorded data. The selected feeder has been modeled in ETAP software with built in a genetic
algorithm and load flow analysis has been simulated using Newton-Raphson method that is built
in ETAP software.
The proposed method was tested on distribution system of Adama outgoing Feeder-1. In the tested
distribution system it was found that by placing total of 9000kvar at a location (bus-4, bus-8 and
bus-13). After capacitor bank installed on the feeder -1 near bus -4; bus 8 and bus 13 the voltage
drop improvement from 14.085 to 15.005 with a percentage increment of 6.13%; from 14.050 to
15.020 with a percentage increment of 6.46% and from 14.090 to 15.011 with a percentage
increment of 6.12% consecutively. And also total power loss to decrease from 0.253MW to
0.137MW. Due to this, the Ethiopian Electric Utility can save 143,731.68 Birr per annum with the
payback period of Eighteen months. In general, Optimal Capacitor Placement in Adama
distribution network feeder -1 averagely improves voltage profile of the feeder with 6.10% and as
a result it enhanced the power quality of the distribution network.
Keywords: Genetic Algorithm, Optimal capacitor placement, ETAPs software Feeders, power loss,
Voltage drop.

Page IX
LIST OF TABLES
TABLES Page No
Table 2,1: Summary of power quality disturbances …………………………………………..14
Table 3,1: Source : socio economic profile of adama city 2019……………………….……...34
Table 3,2: overview of adama substation ……………………………………….…………….35
Table 3,3: Transmission line parameter ………………………………………………………35
Table 3,4: power transformer data of adama substation……………………………………...35
Table 3,5:The no of customer and transformer data in each outgoing feeder of adama
substation……………….……………………….….…………………….………36
Table 3,6: Overhead MV conductor Data ……….…………………………..…………..……36
Table 3,7: Adama substation medium voltage line (15 kv ) outgoing feeders frequency and
duration of interruption data for the year 2018 to 2019 G.C……….………..…..37
Table 3,8.: frequency and duration of adama substation outgoing MV line feeder
for the year of 2019 2021 G.C……..…...…………………………..…………….40
Table 3,9: adama distribution outgoing feeders frequency and duration of interruption
data of the year from 2018-2020G.C…………………..……………………...…...42
Table 3,10: Reliability indices of adama substation outgoing each feeder.…..........................44
Table 3,11: Benchmarks for Reliability Indices.................................................................…...45
Table 4,1 :Application of capacitor bank.………………………………….…………….…...56
Table 4,2 :General load flow result before OCP for 2*25MVA power transformer……........62
Table 4,3: Bus voltages before OCP.…………………………………………………….…...63
Table 4, 4: General load flow result after placement of OCP............................................…...67
Table 4,5: Bus voltages after OCP……….……………………….…………….…….…...….68
Table 4, 6: Comparison of terminal voltage before and after OCP…….………………..…....69
Table 4,7: Cost summary………………………………………………..…………….….…...71

Page X
LIST OF FIGURES
FIGURES Page No
Figure 1.1: Block diagram of the overall methodology utilized on this thesis … ……...………5
Figure 2.1: Electric Power Distribution Network..…………………… ……………....…….....7
Figure 2.2: Radial Electric Power Distribution system………………… ………….... ……..….8
Figure 2.3: Ring Electric Power Distribution system …….…………… ……….…..…..……...9
Figure 2.4: The grading of power quality, reliability, and availability… ……………..….….. 11
Figure 2.5: Dimensions of the Quality of Supply …………………… ………….….…..….....13
Figure 2.6: System Reliability Subdivisions ……………….……… ………….….… ….……15
Figure 2.7: Pole mounted capacitor bank …………………………… ………….…………....30
Figure 2.8: Pad mounted capacitor bank ……………………………… ………….……….....31
Figure 3.1: Adama distribution network frequency and duration of interruption based on
fault type of the year 2018-2019 G.C ………………………………...……...…..38
Figure 3.2: Frequency and duration of interruption on adama substation of MV line( 15kv)
outgoing feeder for the year of 2018 – 2019 G.C………………................................39
Figure 3.3: Adama distribution feeder frequency and duration of interruption for the year
2019-2020G.C………………………………………………………………….….….40
Figure 3.4: Frequency and duration of interruption on adama substation of MV line (15kv)
outgoing feeder based on fault type for the year of 2019 – 2020 G.C….……...….…41
Figure 3.5: Two year data of interruption regarding frequency and duration of adama
distribution network from 2018 -2020G.C……………………………..…....….……43
Figure 3.6: Modeling of adama substation outgoing feeder……………………...………….47
Figure 3.7: General Load Model……………………………….………………..….…...…...50
Figure 4.1: Single Line Diagram of Outgoing Line-1…………….………………..……...…60
Figure 4.2: Outgoing Line-1 load flow result before OCP…………….…………..…..…….61
Figure 4.3: The load flow result After Optimal Capacitor Placement……….……..……......65
Figure 4.4: The load flow result after OCP ………………………………….……...…...….66
Figure 4.5: Comparison of terminal voltage before and after OCP ………………..….........69

Page XI
LIST OF ABBREVATIONS
OCP Optimal Capacitor Placement
DLOL Distribution Line over Load
DPET Distribution permanent earth fault
DPSC Distribution permanent short circuit
EEP Ethiopian Electric Power
EEU Ethiopian Electric Utility
PFC Power Factor Correction
IEC International Electro technical Commission
IEEE International of Electrical and Electronics Engineers
DNOs Distribution Network Operators
OLTC on Load Tap Changer
VVC Volt/Var Control
AVR Automatic Voltage Regulator
OPF Optimal Power Flow
SVC Static var Compensator
KVAR Kilovolt Ampere Reactive
KVA Kilovolt Ampere
MW Mega watt
MVA Mega volt Ampere
KV Kilovolt
PF Power factor
GA Genetic Algorithm
DPEF Distribution permanent fault
DPSC Distribution Permanent Short Circuit
DTEF Distribution Temporarily Fault
DTSC Distribution Temporarily Short Circuit
DLOL Distribution Line Over Load
SOL (LDC) System Over Load ; Load Dispatch Center
Page 1
CHAPTER ONE
INTRODUCTION
1.1.Background
The Ethiopian Electric Utility (EEU), the state-owned electric power distribution company, is
established as a separate entity, pursuant to Council of Ministers Regulation No. 303/2013, on
December 27, 2013. The Regulation stated that EEU is established to construct and maintain
electric distribution networks; contract out the distribution networks construction to contractors
as required; administer electric distribution networks, to purchase bulk electric power and sell
electric energy to customers; initiate electric tariff amendments and, upon approval, to
implement same, in line with directives and policy guidelines issued by the Ministry of Finance
and Economic Development, to sell and pledge bonds and to negotiate and sign loan
agreements with local and international financial sources; and undertake any other related
activities necessary for the attainment of its purposes.
EEU currently provides electricity to a total of about 3.2 million customers in approximately
7000 towns and communities in Ethiopia. According to current figures only about 58.4% of the
population is estimated to have access to electricity and the per capita energy consumption is
100 kWh, which is the lowest in the world.
Since July 8, 2018 EEU is reorganized with a decentralized local administration structure
which composed of regional offices in nine regional government states and two city
administrations. [1]
The Ethiopian transmission and distribution system consists of 500kV (where it is under
construction), 400kV, 230kV, 132kV primary transmission systems and 66kV, 45kV as sub
transmission system and 33kV and 15kV as distribution system. The power distribution system
is made up of sub-transmission lines, power transformers, 33kV lines, 15kV lines, distribution
transformers, LV lines, etc.
Currently in Ethiopia there are 144 functional substation exist which are divided in to eight (8)
zones, such as zone-1 is Addis Ababa region it contains 22 substation, zone-2 is central region
27 substation, zone-3 Eastern region 13 substation, zone-4 north eastern region 11 substation,
zone-5 northern region 8 substation, zone-6 north eastern region14 substation, zone-7 western

Page 2
region 15 substation and the last zone-8 southern region 16 substation. Adama substation is
categorized in zone two central regions.
The power supply to Adama substation is coming from koka and Adama wind generation
through 1x132kV transmission line. The substation has two, 2*25MVA power transformers
and mobile substation one 50 MVA power transformer. The medium voltage side (15kV) has
five has 11 outgoing feeders.[2]
Electric Power distribution system in Adama town is something of a major poor state of
electric power distribution concern. According to annual report of 2020G.C of distribution
medium voltage interruption data, Most of the time distribution feeders are interrupted due to
over loads condition.
It is known that electric energy to end users transfer with required standards of efficiency,
quality and reliability, which requires minimizing energy losses and improving transport
processes [3]. Reactive power compensation is one of the well-recognized methods for its
contribution to the reduction of energy losses, along with other benefits; Such as power factor
correction, increase of the transport and operation capacity of lines and devices of the
distribution system, voltage stability and improvement of the voltage profile, all of them
subject to different operating restrictions [4].
The distribution circuits, in spite of the typical nature of their loads, are predominantly
inductive due to their short distances and medium voltage levels, predominating the aerial type
of construction [5].The reactive power flows are consumed in the grid and the reactive
components of the currents that demand these inductive loads normally circulate throughout
the distribution circuit, causing high losses due to the Joule effect. For this reason, the reactive
power compensation, subject to the proper selection and location of compensating devices, is
of great importance in minimizing losses of power and for voltage profile improvement.
Ensuring the reliability and stability of medium voltage distribution system is one of the
biggest challenges for energy distribution companies, since energy must reach end users with
quality standards that demand constant improvement to maintain the levels of stable voltages
within the parameters governed by the standards established in each country for the different
voltage levels [6]. The improvement of the voltage profiles in distribution system, seeking to
Page 3
increase stability and reliability, has been achieved through the insertion reactive power
compensators. [7].
This thesis focuses on the investigation and mitigation of under voltage problems on Adama
distribution network by capacitor bank placement.
1.2. Problem Statement
Ethiopian Government is currently making all rounded effort to change the country‘s economic
status from the current least developed level to a medium income level. Of the many aspects of
this effort, expanding and strengthening of the electric power supply sector is one among the
most emphasized economic dimensions. In Ethiopia like many other countries, the overall grid
system has generation, transmission, substation and distribution. But most of distributions
networks have problems have high power loss due to voltage drop which is caused by system
overloading and reactive power. This problem results in poor voltage regulation, and poor
efficiency, under and over loading of lines thought out the system. Nowadays, demand of
electrical power is increasing from time to time. As a result, the distribution feeders which
transfer power from substation to the customers are overloaded beyond their carrying capacity.
Overloaded distribution feeders that travel long distances have large losses and voltage drop
problems. Utility and connected customers both suffer from these loss and voltage drop
problems. The equipment used by utility and customers are designed to operate at a certain
voltage level. If they operate below that level, it will draw large current. This has dangerous
effect on the life time of the connected equipment‘s and devices. Since adama town is the
capital city of the oromia regional state and is a preferred location for most of the industries in
the country, and currently new industrial zone are developing that need reliable and quality
power supply. But, in adama town distribution network electric power interruption is becoming
a day to day phenomenon. Even there are times that electric power interruption occurs several
times a day, not only at the low voltage but also at the medium voltage distribution systems
In this regard, finding loss reduction and voltage profile improvement mechanisms for the
distribution networks is a pressing issue. There are different such mechanisms as shunt
capacitor placement, Distributed Generation (DG) placement, conductor upgrading and feeder
reconfiguration, to list a few. Loss reduction and voltage profile improvement mechanism for

Page 4
distribution feeders need feasibility analysis. In addition to the feasibility issue, proper sizing
and locating of the selected mechanism in the distribution system is another problem.
Therefore, finding feasible mechanism for loss reduction and voltage profile improvement of
distribution feeders with appropriate size and location of capacitor placement is a challenging
problem for especially Ethiopian electric utility company.
To solve this challenging problem, investigation and mitigation of under voltage problem in
Adama distribution network are done using ETAP software.
1.3.Research Objective
1.3.1. General Objective
The general objective of this thesis is investigation of under voltage problem and to provide
mitigation mechanism by optimal placement of capacitor bank in Adama distribution outgoing
feeder F1.
1.3.2. Specific Objective
The specific objectives of this thesis are:
Investigate the drawbacks and strengths of the existing network.
Implementation of optimal placement of capacitor placing.
Implementing the algorithm to obtain the optimal size of capacitor bank and thereby
reducing the losses.
Model the existing network on ETAPS software and simulate for the network
performance for different scenarios.
Evaluate and compare the result before and after OCP
Draw relevant conclusions and recommendations based on the research result.
1.4.Methodology
Raw data of the existing network is collected from the respective work units of Ethiopian
Electric Power (EEP) and Ethiopian Electric Utility (EEU). For instance, data from Adama
distribution substation and central EEP office that include fault statistics (interruption), peak
load, power transformer rating and other equipment ratings. And also 15kV feeder data from the

Page 5
distribution network such as number of 15kV transformer in each outgoing feeder‘s conductor
length, size and type, distribution transformers data, and number customer in each feeder.
Specifically, the following methodologies have been followed in this thesis work:
Data
Computer
Literature Data Analysis
Review Collection simulation
Conclusion and
Voltage
profile
recommendation analysis
Fig 1,1: Block diagram of the overall methodology utilized on this thesis
Under the topic called literature review the work of different authors; articles, journals, books,
thesis done in similar topics and others have been reviewed and it has been considered one of
the methodology used to do this Thesis.
The total task of data collection is accomplished through
Conducting interviews with the respective personnel of the substations.
Direct measurement
From recorded data and equipment specifications
Physical observation in the substations.
Data from Ethiopian Electric Utility (EEU) engineering offices.
Adama substation operation department section unit.
Adama district distribution operation and maintenance office.
Computer analysis or Simulation
There are different types of software which can be applicable on electrical power distributions
simulation ETAPs, Power world, PSS, MATLAB, and DIgSILENT. From the software

Page 6
mentioned above ETAP version 19.1 the most comprehensive power system enterprise solution
in the market ,highly compatible , combined reliability and flexible system modeling capability
with built in Genetic algorithms (GA).The data is organized using EXCEL sheet and modeling
of the single layout diagram and newton raphson power flow analysis is done using ETAP
Software for optimal placement of capacitor bank .Comparison voltage profile has been done
on each bus of the system before and after capacitor bank placement,
1.5. Scope of the study
The scope of this research is limited to the Existing Distribution networks as per EEP and EEU
standard voltages definition and it focus on distribution system that is only supplied from the
33kv Feeder system. Although there are many ways of solving this research problem, this
research investigates the use of ETAP Software to solve the above mentioned optimization
problem. ETAP Software has been specifically chosen due to their reliability, robustness and
versatility of consistently finding solutions to the objective optimization problems. In this case
an optimal capacitor position needs to be located for various levels of network dynamics (i.e.
different loading conditions and different network configurations).
1.6.Organization of the Thesis
The thesis is organized into five chapters. Chapter one presents the introduction, background,
statement of the problem, research objectives, methodology and scope followed in the thesis
work and the organization of the thesis. Chapter two deals the theoretical background and
literature review of the study, mainly on importance voltage stability, reactive power control in
electrical systems, the aim of power factor correction, voltage and reactive power control
method, ways of improving voltage profile. Chapter three discusses techniques of optimization,
choice of optimization, optimal capacitor placement. Chapter four collections of data and
analysis of the distribution line of the selected area. In this chapter all main data‘s that are
needed for power flow analysis are provided and analyzed. Chapter five discusses about
simulation results and detailed discussion of the gain in forms of, tables and column charts for
comparison of the system before and after OCP. Conclusion and recommendations are
incorporated under chapter six.
Page 7
CHAPTER TWO
THREORETICAL BACKGOUND AND LITERATURE REVIEW
2.1. Introduction
Improving voltage profile is one of the biggest challenges in electric power utility of developing
countries. The electricity demand has been grown rapidly. As a result, a poor voltage profile
with higher loss has not reliability if no proper measures are put in place. While the utilities
have no sufficient funds for expansion their grid and source, it is necessary to reduce power
loss. This chapter presents overview of distribution system and different voltage profile
improvement technique in distribution system [8].
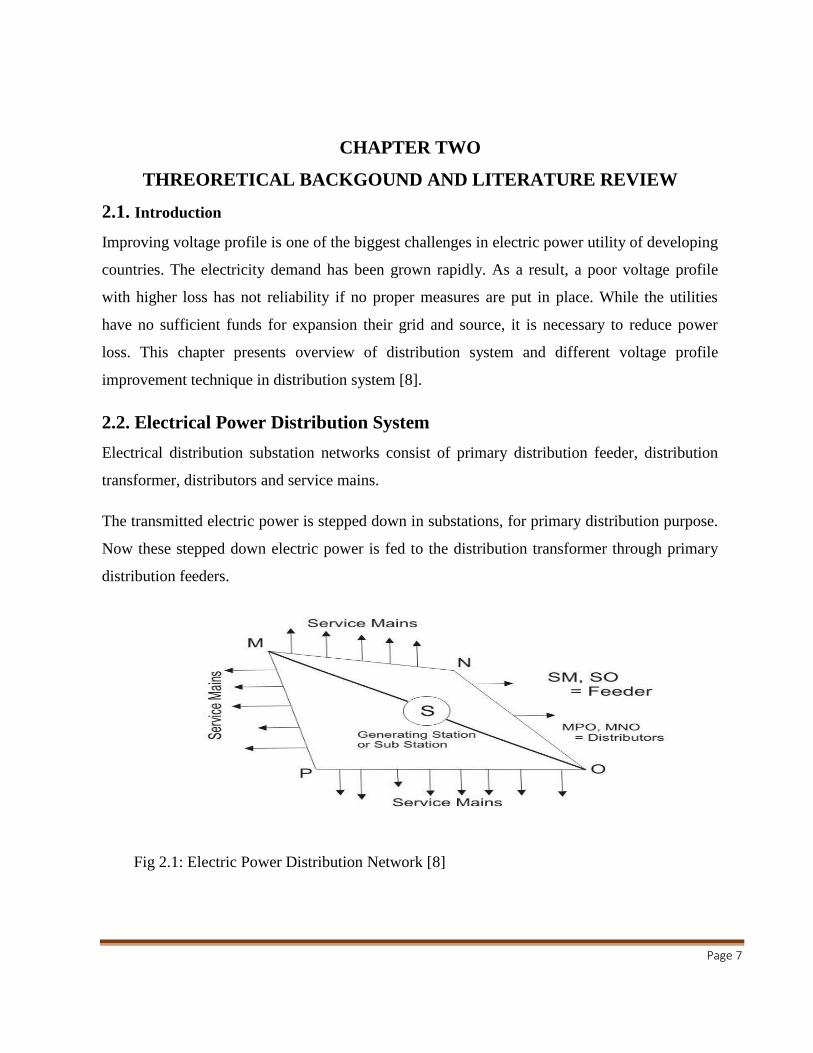
2.2. Electrical Power Distribution System
Electrical distribution substation networks consist of primary distribution feeder, distribution
transformer, distributors and service mains.
The transmitted electric power is stepped down in substations, for primary distribution purpose.
Now these stepped down electric power is fed to the distribution transformer through primary
distribution feeders.
Fig 2.1: Electric Power Distribution Network [8]

Page 8
Distribution transformers are mainly three phase pole mounted type. The secondary of the
transformer is connected to distributors. Different consumers are fed electric power by means of
the service mains. These service mains are tapped from different points of distributors. The
distributors can also be re-categorized by distributors and sub distributors. Distributors are
directly connected to the secondary of distribution transformers whereas sub distributors are
tapped from distributors. Service mains of the consumers may be either connected to the
distributors or sub distributors depending upon the position and agreement of consumers. In this
discussion of electrical power distribution system, we have already mentioned about both feeders
and distributors. Both feeder and distributor carry the electrical load, but they have one basic
difference. Feeder feeds power from one point to another without being tapped from any
intermediate point. As because there is no tapping point in between, the current at sending end is
equal to that of receiving end of the conductor. The distributors are tapped at different points for
feeding different consumers; and hence the current varies along their entire length.[8]
2.3 Distribution System Network Configuration
2.3.1. Radial Electrical Power Distribution System
In early days of electrical power distribution system, different feeders came out in radial from the
substation and connected to the primary of distribution transformer.
Fig 2.2: Radial Electric Power Distribution system [8]
Page 9
But radial electrical power distribution system has one major drawback that in case of any
feeder failure, the associated consumers would not get any power as there was no alternative
path to feed the transformer. In case of transformer failure also, the power supply is
interrupted. In other words the consumer in the radial electrical distribution system would
be in darkness until the feeder or transformer was rectified [8].
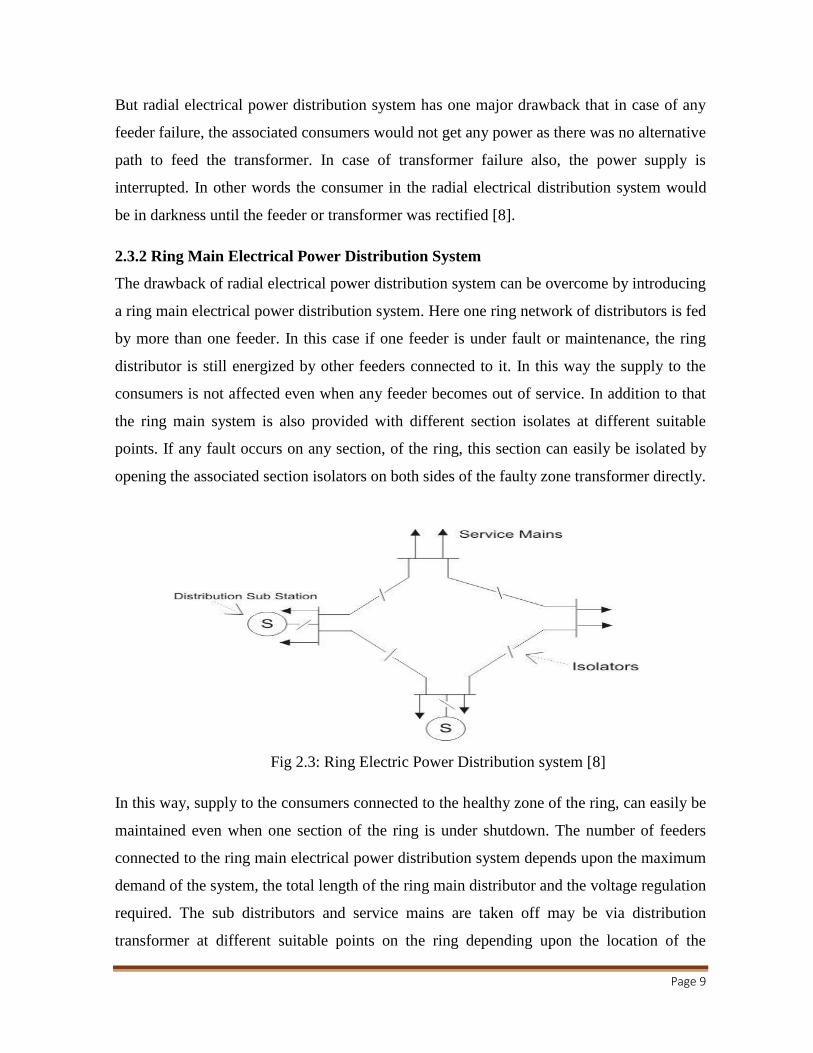
2.3.2 Ring Main Electrical Power Distribution System
The drawback of radial electrical power distribution system can be overcome by introducing
a ring main electrical power distribution system. Here one ring network of distributors is fed
by more than one feeder. In this case if one feeder is under fault or maintenance, the ring
distributor is still energized by other feeders connected to it. In this way the supply to the
consumers is not affected even when any feeder becomes out of service. In addition to that
the ring main system is also provided with different section isolates at different suitable
points. If any fault occurs on any section, of the ring, this section can easily be isolated by
opening the associated section isolators on both sides of the faulty zone transformer directly.
Fig 2.3: Ring Electric Power Distribution system [8]
In this way, supply to the consumers connected to the healthy zone of the ring, can easily be
maintained even when one section of the ring is under shutdown. The number of feeders
connected to the ring main electrical power distribution system depends upon the maximum
demand of the system, the total length of the ring main distributor and the voltage regulation
required. The sub distributors and service mains are taken off may be via distribution
transformer at different suitable points on the ring depending upon the location of the

Page 10
consumers. Sometimes, instead of connecting service main directly to the ring, sub
distributors are also used to feed a group of service mains where direct access of ring
distributor is not possible [8].
2.3. Power Quality, Reliability and Availability
Power quality problem from a customer perspective might be defined as any electric
supply condition that causes appliances to malfunction or stops their use. Power quality
problem from a utility perspective might be perceived as non-fulfillment of various
standards such as RMS voltage or harmonics. Power is equivalent to the instantaneous
product of current and voltage, and formulating a meaningful definition of power quality
is difficult. The best a utility can do is to supply customers with a perfect sinusoidal
voltage source with constant frequency and amplitude. Less than perfect power quality
occurs when a voltage waveform was distorted by transients or harmonics, changes it was
amplitude, or deviates in frequency [9].
Reliability is primarily concerned with customer interruptions, therefore a subsection of
power quality [9]. Sustained interruptions have continuously been categorized as a
reliability issue, but many utilities have categorized momentary interruptions as a power
quality issue. Momentary interruptions are an important customer issue and most
distribution engineers consider them a reliability issue. Therefore, reliability is all aspects
of customer interruptions, together with momentary interruptions [10].
Availability is defined as the proportion of time a voltage source was uninterrupted. It is
complement, unavailability, is the fraction of time a voltage source was interrupted. Since
availability and unavailability deal strictly with interruptions, they are classified as a
subsection of reliability [10].

Page 11
Fig 2.4: The grading of power quality, reliability, and availability [11]
2.3.1 Overview of power quality
The quality of delivered electricity, like quality of other goods and services, is difficult to
define and quantify. There is not one accepted definition of quality electricity. The quality is
mainly determined by the quality of the voltage waveform, as it is impossible to control the
currents drawn by customer loads. Voltage quality is not only the responsibility of the
network operator but also, in certain respects, depends on producers and customers.
Power quality is the combination of current quality and voltage quality, involving the
interaction between the system and the load. Voltage quality concerns the deviation of the
voltage waveform from the ideal sinusoidal voltage of constant magnitude and constant
frequency. Current quality is a complementary term and it concerns the deviation of the
current waveform from the ideal sinusoidal current of constant magnitude and constant
frequency. Voltage quality involves the performance of the power system towards the load,
while current quality involves behavior of the load towards the power system.
There is always close relationship between voltage and current in any practical power
system.
Page 12
Although the generators may provide a near-perfect sinusoidal voltage, the current passing
through the impedance of the system can cause a variety of disturbances to the voltage. To
understand the basis of many power quality problems is necessary to deal with the
interaction between the load and the power system. The power system can only control the
quality of the supply voltage; it has no control over the currents that particular loads might
draw. Therefore, the standards in the power quality area are devoted to maintaining the
supply voltage within certain limits.[12]
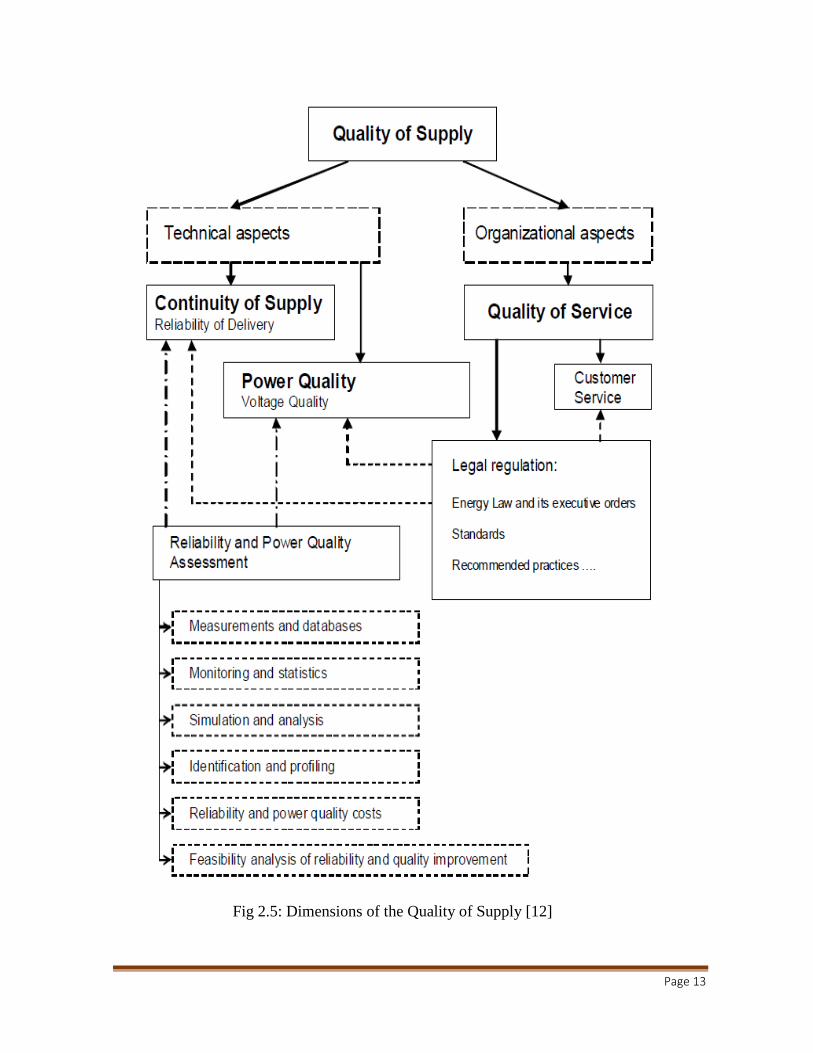
Quality of supply is a combination of voltage quality and the non-technical aspects of the
interaction between the utility and its customers. Quality of service in electricity supply has
a number of different dimensions, which can be grouped under three general headings:
commercial relationships between a supplier and an end-user, continuity of supply, and
voltage quality.
Continuity of supply (also referred to as Reliability of delivery) is characterized by the
number and duration of interruptions. Several indicators are used to evaluate the continuity
of supply in transmission and distribution systems (e.g. SAIDI, SAIFI).
Voltage quality is concerned with deviations of the voltage from the ideal. The ideal voltage
is a single-frequency sine wave of constant frequency and constant magnitude. Voltage
quality is described according to the European standard EN 50160 by the characteristics of
the supply voltage concerning: frequency, magnitude, waveform and symmetry of the
phases.
Quality of service (also referred to as Commercial quality) concerns the quality of
relationships between a supplier and a customer. It covers many aspects of the relationship
(e.g. transparency of the tariff structure, information supply, responses on customers‘
complaints, metering, reading and billing), but only some of them can be measured and
regulated through standards or other instruments.[12]
Page 13
Fig 2.5: Dimensions of the Quality of Supply [12]
Page 14
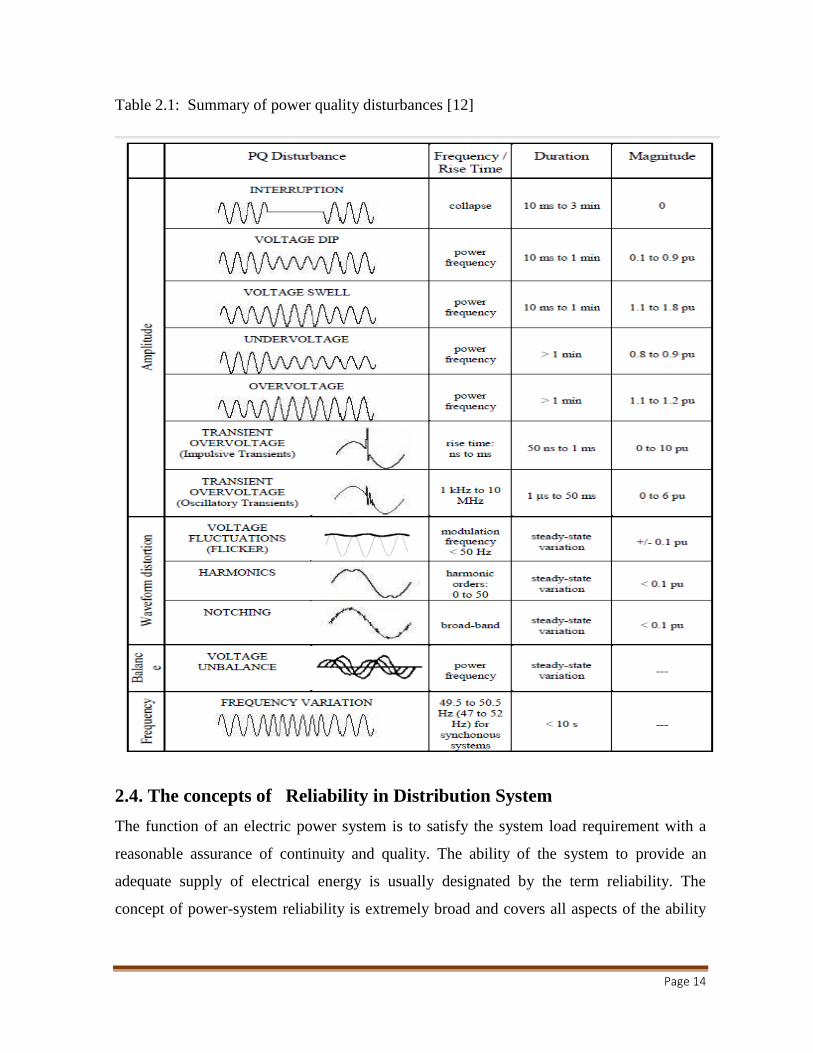
Table 2.1: Summary of power quality disturbances [12]
2.4. The concepts of Reliability in Distribution System
The function of an electric power system is to satisfy the system load requirement with a
reasonable assurance of continuity and quality. The ability of the system to provide an
adequate supply of electrical energy is usually designated by the term reliability. The
concept of power-system reliability is extremely broad and covers all aspects of the ability

Page 15
of the system to satisfy the customer requirements. There is a reasonable subdivision of the
concern designated as system reliability which is shown in Figure 2.6.
Fig 2.6: System Reliability Subdivisions [13]
Adequacy: Relates to the existence of sufficient facilities within the system to
satisfy the consumer load demand. These include
The facilities necessary to generate sufficient energy and
The associated transmission and distribution facilities required to transport
the energy to the actual consumer load points.
Security: Relates to the ability of the system response to disturbances arising within
that system. Security is therefore associated with the response of the system to
whatever perturbations it is subject to [33].
2.5. Reliability Indices for Distribution system
To measure system performance, the electric utility industry has developed several
performance measures of reliability. These reliability indices include measures of outage
duration, frequency of outages, system availability, and response time.
A common way of defining reliability is in terms of
1. customer-oriented indices and
2. Energy or load-oriented indices.
2.5.1. Customer-Oriented Indices
These indices are directly related to customers. Some of these indices are listed below.
System Reliability
System adequacy System security
Page 16
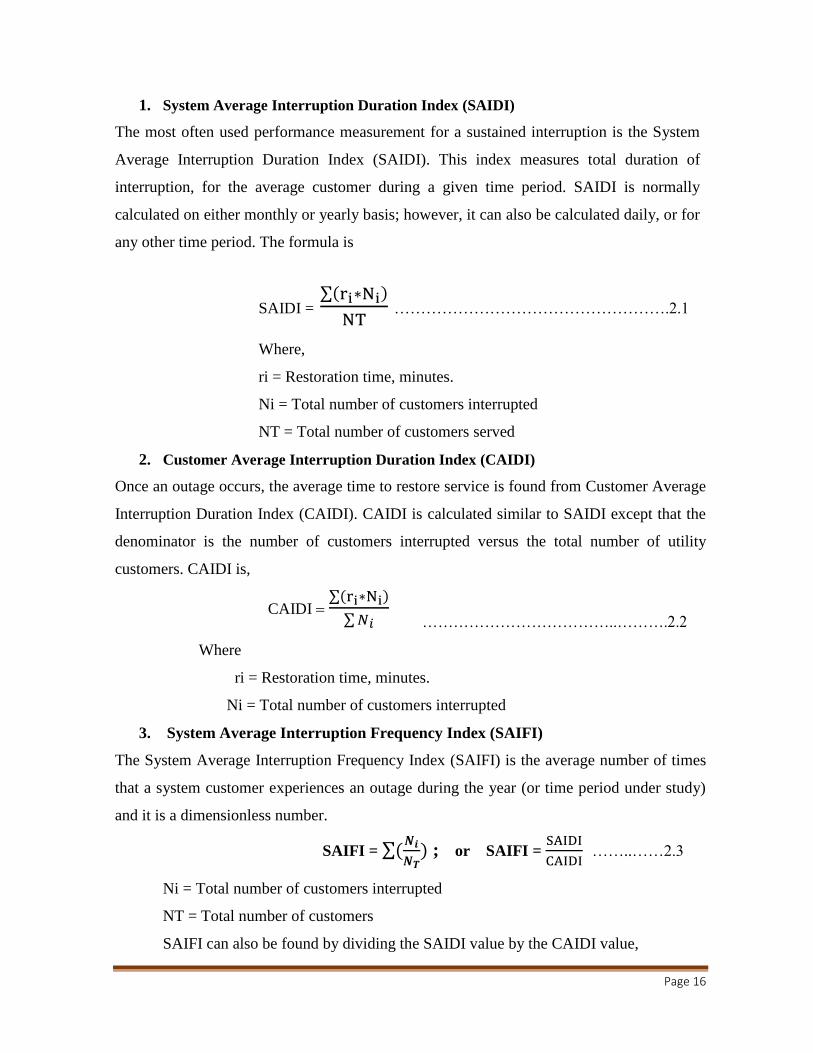
1. System Average Interruption Duration Index (SAIDI)
The most often used performance measurement for a sustained interruption is the System
Average Interruption Duration Index (SAIDI). This index measures total duration of
interruption, for the average customer during a given time period. SAIDI is normally
calculated on either monthly or yearly basis; however, it can also be calculated daily, or for
any other time period. The formula is
SAIDI = ∑( )
…………………………………………….2.1
Where,
ri = Restoration time, minutes.
Ni = Total number of customers interrupted
NT = Total number of customers served
2. Customer Average Interruption Duration Index (CAIDI)
Once an outage occurs, the average time to restore service is found from Customer Average
Interruption Duration Index (CAIDI). CAIDI is calculated similar to SAIDI except that the
denominator is the number of customers interrupted versus the total number of utility
customers. CAIDI is,
CAIDI
∑( )
∑
………………………………..……….2.2
Where
ri = Restoration time, minutes.
Ni = Total number of customers interrupted
3. System Average Interruption Frequency Index (SAIFI)
The System Average Interruption Frequency Index (SAIFI) is the average number of times
that a system customer experiences an outage during the year (or time period under study)
and it is a dimensionless number.
SAIFI = ∑(
) ; or SAIFI =
……..……2.3
Ni = Total number of customers interrupted
NT = Total number of customers
SAIFI can also be found by dividing the SAIDI value by the CAIDI value,
Page 17
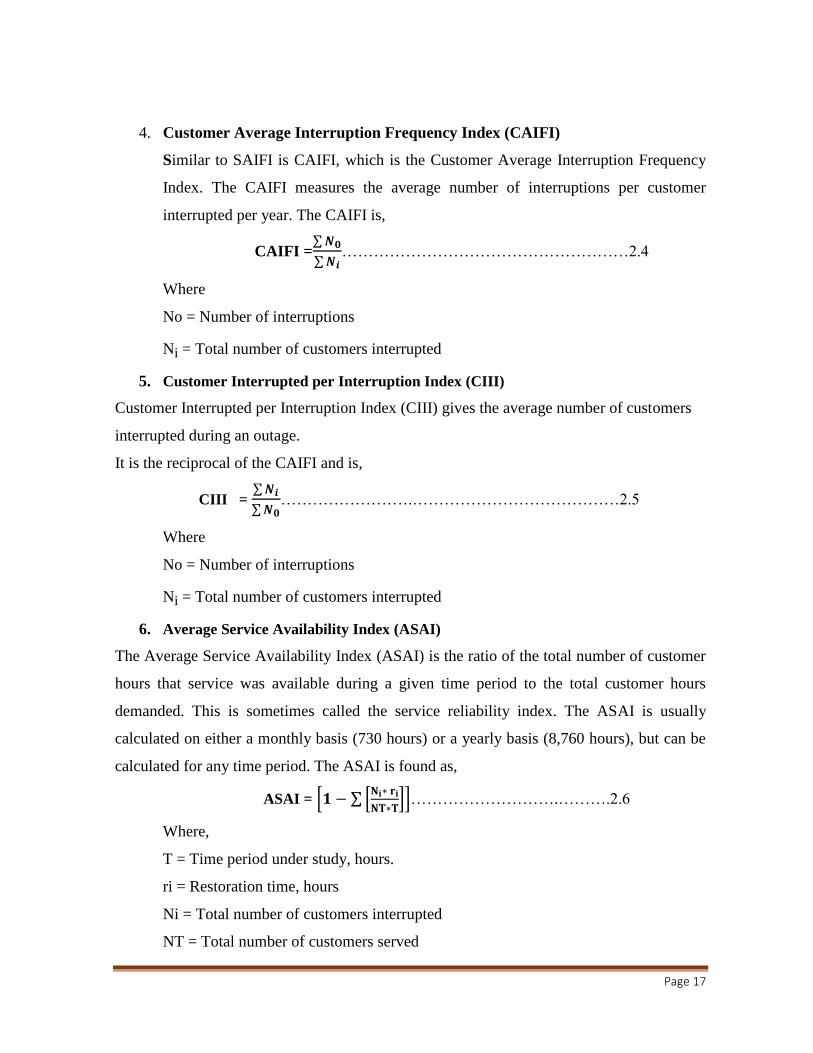
4. Customer Average Interruption Frequency Index (CAIFI)
Similar to SAIFI is CAIFI, which is the Customer Average Interruption Frequency
Index. The CAIFI measures the average number of interruptions per customer
interrupted per year. The CAIFI is,
CAIFI =∑
∑ ………………………………………………2.4
Where
No = Number of interruptions
Ni = Total number of customers interrupted
5. Customer Interrupted per Interruption Index (CIII)
Customer Interrupted per Interruption Index (CIII) gives the average number of customers
interrupted during an outage.
It is the reciprocal of the CAIFI and is,
CIII = ∑
∑ …………………….…………………………………2.5
Where
No = Number of interruptions
Ni = Total number of customers interrupted
6. Average Service Availability Index (ASAI)
The Average Service Availability Index (ASAI) is the ratio of the total number of customer
hours that service was available during a given time period to the total customer hours
demanded. This is sometimes called the service reliability index. The ASAI is usually
calculated on either a monthly basis (730 hours) or a yearly basis (8,760 hours), but can be
calculated for any time period. The ASAI is found as,
ASAI = [ ∑ [
]]……………………….……….2.6
Where,
T = Time period under study, hours.
ri = Restoration time, hours
Ni = Total number of customers interrupted
NT = Total number of customers served

Page 18
In this calculation, the restoration time, ri, is in hours instead of minutes.
Another way of looking at ASAI on an annual basis is,
ASAI=[
] ...........................................................................2.7
2.5.2. Load or Energy-Oriented Indices
1. Total energy not supplied (ENS)
The ENS (Total energy not supplied) is the sum of each load times its outage duration:
ENS = L x ri(kwh / yr)…………………………………………..……2.8
Where
L=Load (KW)
ri= Outage Duration
2. Average Energy Not Supplied (AENS)
AENS (Average Energy Not Supplied) can be calculated by dividing the ENS and the total
number of customers:
AENS Total Energy not supplied kWh/ customer yr.......................2.9
Number of customers
Note: A customer here is defined as an electric meter, which can be an individual
customer, a commercial entity or organization etc.
2.6. Factors Affecting Voltage Drop and Power Loss of Distribution Feeders
Voltage deviation and loss of the distribution feeders are increasing in distribution
network due to various factors. Some of them are listed below [14].
A. Poor jointing and termination: poor jointing and termination on the distribution
networks are resulted from loose contact; there will be high opposition to current flow
which generates heat at that point. This lead to an increase in resistance and
subsequently result to voltage drop at that point.
B. Use of undersized conductors: voltage can be considered as the pressure pushing
charges along a conductor, while resistance of the conductor is a measure of how
difficult it is to push the charges along. The small size conductors have high resistance
consequently large voltage drop.

Page 19
C. Use of different types of conductor material: corrosion is an important factor to be
considered in the selection of conductor materials. The two types of corrosion which
exhibit greatest influence on the electrical properties of a metal are oxidation and
galvanic corrosion. Galvanic corrosion, which is caused by the difference in electrical
potential between two or more metals, has to be given careful consideration when
selecting conductor materials
D. Hot spots: whenever a mechanically joint or termination is made, high resistance
point is created. Thus, the joint or termination will undergo a progressive failure. High
resistance creates localized heating and since heating increases oxidation and creep,
the connection become less tight and further heating occurs, until the contact tends
glow.
E. Loads on the main feeder: the currents in a feeder segment along the distribution
feeder are function of the loads connected to the downstream portion of the feeder.
Although the current will not affect the feeder impedance, it does affect voltage
deviation [14].
F. Length of distribution feeder: the series impedance of a feeder is linearly
proportional to the length of the feeder. Therefore, the length of the feeder has a
significant effect on voltage deviation.
G. Phase imbalance: a network which does not have its load evenly distributed across all
three phases will have higher currents in at least one phase meaning it is not optimized
for losses [6]. There will also be currents flowing in the neutral conductors if they are
present. Therefore, due to the quadratic dependence of losses on current, this load
imbalance across the three phases will increase losses.
H. Harmonics: harmonic effects are essentially distortions to an AC current profile.
They can occur in transformer windings because the AC magnetizing current is not
perfectly sinusoidal. However, this usually occurs on the triple harmonics (3rd
, 6th
, 9th
).
So, on normal three phase system they are all in phase and do not result in any real
harmonics. However, if other equipment connected to the network produces
harmonics they will not cancel in the neutral conductor. Therefore, these can cause
additional loss the distribution system.

Page 20
I. Power factor: the power factor is the ratio of real power to apparent power. For two
power factor systems distributing the same amount of real power, the system with the
lower power factor will have the higher reactive power current which should cause the
higher voltage drop and produce the higher loss.
J. Rated capacity of substation transformer: the variance of node voltage along the
feeder can be lessened by increasing the rated capacity of their feeding substation
transformer. The larger the transformer capacity has minimum voltage variation effect
on the system. However, one of the major disadvantages for increasing rated capacity
of substation transformer is the rise in the short-circuit fault current level on the
secondary side of a substation transformer.
K. Location of distribution transformer: in appropriate location of distribution
transformer may leads to energy loss in the distribution system. The farthest consumer
will get an extremely low voltage as compared to the consumer nearer to distribution
transformer.
2.7.Distribution Network Power Loss and Voltage Drop Minimization Techniques
There are different techniques to reduce loss and voltage deviation of a distribution feeder.
Some of the power loss and voltage drop reduction techniques are: network
reconfiguration, network re conducting (conductor grading), distribution transformer
locating and sizing, reactive power compensation, using highly efficient transformer, using
high voltage distribution system, using distributed generation and building new substation.
The power loss and voltage drop reduction techniques have been discussed in the following
section.
A. Network Reconfiguration: Network reconfiguration is the process of operating switches
to change the circuit topology so that operating costs are reduced while satisfying the
specified constraints [15].
Network reconfiguration is one of the possible methods in distribution system for reducing
loss in which the power flow is altered by the formation of new links with a feeder to form
tree structure or by opening or closing the appropriate switches on the feeder. Feeder
reconfiguration allows the transfer of loads from heavily-loaded feeders to relatively
lightly-loaded feeders and form higher-resistance routs to lower resistance routs to obtain
the least loss, where the resistance route is the total resistance from the source to the load
Page 21
point. Such transfers are effective not only in terms of altering the level of loads on the
feeder being switched, and reducing the losses, but also in improving the voltage profile
along the feeders and affecting reductions in the overall system power losses [16].
But feeder reconfiguration is effective if distribution feeders are automated and not far
apart to each other. For un automated and far apart feeders, feeder reconfiguration may not
be cost effective.
B. Conductor Grading: Conductor grading is the technique of replacing the existing
conductor on the feeder by conductor of optimal size for optimal (in terms of cost) length
of feeder to reduce the resistance. This can be achieved by replacing the small size
conductors with a larger cross-sectional area, or by installing auxiliary conductors to work
in parallel with the existing ones. So that the equivalent resistance is reduced. Although
these methods could give a large loss reduction, it is not cost effective, and it is not used
unless there is a special need, as the cost of conductors and their installation are usually in
excess of the cost of the energy saved [16].
This technique is used when existing conductor is no more optimal because of rapid growth
of load [17]. This technique is also good for the developing countries where annual
Population (energy demand) growth rates are high and the conductors are chosen to
minimize power loss and voltage drop of the distribution system.
C. Distribution Transformer Locating and Sizing: If distribution transformers are not
located centrally with respect to consumers, the farthest consumers will obtain extremely
low voltage even though a reasonably good voltage level is maintained at secondary of
transformer.
This leads to higher losses in distribution system. So, distribution transformers should be
located nearer to the load center as possible and replace large transformers by the
transformers of small rating such that it serves small number of consumers so that optimum
voltage level is maintained.
D. Reactive Power Compensation: Reactive power compensation is defined as the
management of reactive power to improve the performance of ac power system.
The beer mug analogy [18] is useful to understand the theory of reactive power
compensation. If the mug capacity is the apparent power (kVA) that we can transmit
through a system, then the foam is the reactive power (kVAr) and the beer is the real

Page 22
power (kw). If we use capacitors to provide the foam (KVAr) when we drink the beer, then
we free up mug capacity so you don‘t have to buy a bigger mug and/or so you can pay less
for your beer.
The benefits of reactive power compensation in the transmission and distribution system
include [19]: voltage profile improvement, increase power flow capacity (by decreasing
feeder impedance), increase system capacity (the distribution system capacity can be
increased by controlling reactive power flow using capacitors) and reduce power losses.
In general, reactive power compensation is an important method to improve voltage profile
and loss of a distribution network if the size and location has done optimally.
E. Using Highly Efficient Transformers: The use of highly efficient transformers will
reduce losses of the distribution system. Like amorphous core transformers which have
high magnetic susceptibility and high electrical resistance. The high resistance in
transformers leads to low losses by eddy currents.
F. High Voltage Distribution System: Using high voltage distribution system will reduce
the loss and voltage deviation of the distribution system. This technique aims extending
high voltage lines as nearer to the load as possible and replacing large transformers with
various small rating transformers. Also, conversion of existing low voltage distribution
systems to high voltage distribution system is done. This technique is most effective and
efficient in reducing the technical losses and improving the power quality in distribution
system. Because the current is low in high voltage system. But the initial investment cost is
very high for this reason it may not be feasible.
2.8.Reactive Power and voltage drop in distribution System
In general power system can have sub division power generation, transmission and
distribution, from this all distribution part is highly affected by problem of voltage drop due
to overloading and most distribution lines supply different type of loads that result on load
unbalance. These different types of loads can be factors that used more reactive power that
also another result for voltage drop. There are different literatures which describe
mechanisms of solution for voltage drop and reactive power. From the literature review
there are different methods as a solution;
distributed generation,
FACT devices,
Page 23
Dis-connector or section opening ,
Developing of load sharing.
For the analysis of these problems, most researchers use different algorithms and software.
Reactive power compensation mainly refers to the effective use of reactive power
compensation devices and equipment. In order to obtain the required reactive power, it
reduces the energy consumption of grid operation and promote the power system effectively
improve the power factor, and ultimately improved grid voltage quality goals [20]. An
effective way to improve the power factor is to take the appropriate means of reactive power
compensation. Researcher T.Xu, P.C. Taylor use distributed generation as power loss
minimization mechanisms by implementing the DG for reactive power reduction by
increasing the real or active power that leads to improve the voltage regulation[21].
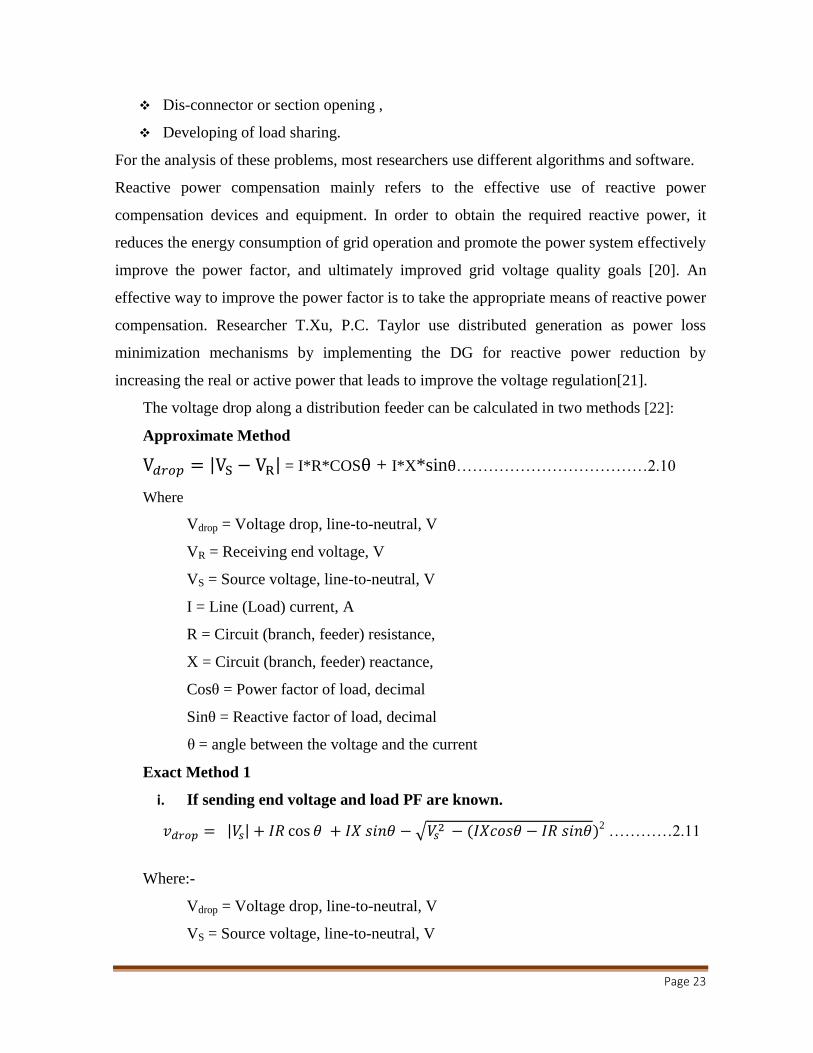
The voltage drop along a distribution feeder can be calculated in two methods [22]:
Approximate Method
| | = I*R*COS + I*X*sin ………………………………2.10
Where
Vdrop = Voltage drop, line-to-neutral, V
VR = Receiving end voltage, V
VS = Source voltage, line-to-neutral, V
I = Line (Load) current, A
R = Circuit (branch, feeder) resistance,
X = Circuit (branch, feeder) reactance,
Cosθ = Power factor of load, decimal
Sinθ = Reactive factor of load, decimal
θ = angle between the voltage and the current
Exact Method 1
i. If sending end voltage and load PF are known.
| | √ ( )2 …………2.11
Where:-
Vdrop = Voltage drop, line-to-neutral, V
VS = Source voltage, line-to-neutral, V

Page 24
I = Line (Load) current, A
R = Circuit (branch, feeder) resistance,
X = Circuit (branch, feeder) reactance,
Cosθ = Power factor of load, decimal
Sinθ = Reactive factor of load, decimal
θ = angle between the voltage and the current
ii. If the receiving end voltage, load current and power factor (PF) are known.
= ( )2 +√( ) ……………2.12
Exact Method 2
If receiving or sending MVA and its power factor are known at a known sending or
receiving voltage.
( )
+ ( ) …………….2.13
or
( )
+2*ZMVAs* cos( ( ) ……………………2.14
Where:
VR = Receiving line-line voltage in kV
VS = Sending line-line voltage in kV
MVAR = Receiving three-phase, MVA
MVAS = Sending three-phase, MVA
Z = Impedance between sending and receiving ends
γ = the angle of impedance Z
θR = Receiving end PF ; θS = Sending end PF, positive when lagging
In electric power distribution system, voltage drop depends upon numerous factors. The
type and nature of conductor, the size of conductor and the length of circuit are the few out
of many. The supply conductor, if not of reasonable size, will cause excessive
voltage drop in an electrical circuit. The voltage drop is in direct proportion to the circuit
length. Proper starting and running of motors, lighting equipment, and other loads having
inrush currents should be considered. The NEC recommends that the steady-state voltage

Page 25
drop in power, heating, or lighting feeder be no more than 3%, and the total drop including
feeders and branch circuits be no more than 5% overall.
Poor performance of equipment‘s, overheating; nuisance tripping of over current protective
devices and excessive burnouts are the sign of unsatisfactory voltage at customer‘s
terminals. When the voltage at the terminals of utilizing equipment deviates from the value
of nameplate of electrical appliances, the performance and the operating life of the
equipment is affected. The effect may be minor or prominent depending on the
characteristics of the equipment and amount of the voltage drop deviation from the
nameplate rating. Generally performance conforms to the utilization voltage limits specified
in American National Standard Institute (ANSI) but it may vary for specific items of voltage
sensitive equipment [23].
2.9. Reactive Power Control
2.9.1. Elements of System that Produces and Absorbs Reactive Power
Loads: normally absorb a reactive power. A typical load bus supplied by a power system is
composed of a large number of devices. The composition changes depending on the day,
season and weather conditions. The composite characteristics are normally such that a load
bus absorbs reactive power. Both active and reactive of the composite loads vary as a
function of voltage magnitude. Load low-lagging power factors leads to excessive voltage
drops in the transmission network.
Underground cables: owning to their high capacitance, have high natural loads. They are
always loaded below their natural loads, and hence generate reactive power under all
operating conditions. Overhead line: depending on the load current either absorb or supply
reactive power. At loads below the natural load, the lines produce net reactive power. On
the contrary, at loads above natural load lines absorb reactive power [24].
2.9.2. Importance of Reactive Power
Voltage control in an electrical power system is important for proper operation of electrical
power equipment to prevent damage by overheating, to reduce transmission losses and to
maintain the ability of the system to prevent voltage collapse. In general terms, decreasing
reactive power causes voltage to fall while increasing it causing voltage to rise. A voltage
collapse occurs when the system try to serve much more load than the voltage can support.
When reactive power supply is lower in a lower voltage condition, as voltage drops current

Page 26
must increase to maintain power supplied, causing system to consume more reactive power
and the voltage drops further. If the current increases too much, transmission lines go off
line, overloading other lines and potentially causing cascading failures. If the voltage drops
too low, some generators will disconnect automatically to protect themselves. Voltage
collapse occurs when an increase in load or less generation or transmission facilities causes
dropping voltage, which causes a further reduction in reactive power from capacitor and
line charging, and still there further voltage reductions. If voltage reduction continues, these
will cause additional elements to trip, leading further reduction in voltage and loss of the
load. The result in these entire progressive and uncontrollable declines in voltage is that the
system unable to provide the reactive power required supplying the reactive power demand
[25].
2.9.3. Problems of Reactive Power
Though reactive power is needed to run many electrical devices, it can cause harmful effects
on appliances and other motorized loads, as well as electrical infrastructure. Since the
current flowing through electrical system is higher than that necessary to do the required
work, excess power dissipates in the form of heat as the reactive current flows through
resistive components like wires, switches and transformers. Keep in mind that whenever
energy is expended, it has payment. It makes no difference whether the energy is expended
in the form of heat or useful work. A power factor of 1 or 100% ideally means that all
electrical power is applied towards real work. Homes typically have overall power factors in
the range of 70% to 85%, depending upon which appliances may be running. Newer homes
with the latest in energy efficient appliances can have an overall power factor in the
nineties.
The typical residential power meter only reads real power, i.e. which would have with a
power factor of 100%. While most electric companies do not charge residences directly for
reactive power, it‘s a common misconception to say that reactive power correction has no
economic benefit. To begin with, electric companies correct for power factor around
industrial complexes, or they will request the offending customer to do so at his expense, or
they will charge more for reactive power. Clearly electric companies benefit from power
factor correction, since transmission lines carrying the additional (reactive) current to
heavily industrialized areas costs them money.
Page 27
In an electrical power system, balanced reactive power is the carrier of the true power. If it
is Consumed, the voltage decreases, and hence its ability to transport the true power
decreases. So, reactive power in power system is required to deliver the active power
through transmission lines, and to produce magnetic fields in Electric motors and
transformers for their operation. If the reactive power of the system is not sufficient to
support the terminal voltage of bus terminals, it can be supported using shunt reactive
compensation system, so that, the reactive power which has to come from the system is to
be provided by the compensation system and therefore the main equipment of the power
system which were forced to deliver the reactive power to the load are getting relaxed and
utilized the reactivity for their own operation. The Shunt reactive compensation can modify
the parameters of the system to give enhanced VAR compensation [26].
It can do quite satisfactorily job of generating reactive power with a faster time response
and come under Flexible AC Transmission Systems (FACTS).This allows an increase in
transfer of apparent power through a transmission line, and much better stability by the
adjustment of parameters that govern the power system i.e. current, voltage, phase angle,
frequency and impedance. Unnecessary voltage drops lead to increased losses which needs
to be supplied by the source and in turn leading to outages in the line due to increased stress
on the system to carry this imaginary power. Thus we can infer that the compensation of
reactive power not only mitigates all these effects but also helps in better transient response
to faults and disturbances. In recent times there has been an increased focus on the
techniques used for the compensation and with better devices included in the technology,
the compensation is made more effective. The terminal voltage at bus bar of the substations
is influenced by loading [27].
2.9.4. Reactive Power in Operations
Reactive power affects power system operation in numerous ways:
Loads consume reactive power, so this must be provided by some source.
The delivery system (transmission lines and transformers) consumes reactive power,
so this must be provided by some source (even if the loads do not consume reactive
power). Note however that all transmission lines do provide some reactive power
from their shunt line charging which offsets their consumption of reactive power in
their series line losses.

Page 28
The flow of reactive power from the supplies to the sinks causes additional heating
of the lines and voltage drops in the network.
The generation of reactive power can limit the generation of real power.
So, one primary dilemma with reactive power is that a sufficient quantity of it is needed to
provide the loads and losses in the network, but having too much reactive power flowing
around in the network causes excess heating and undesirable voltage drops. The normal
answer to this dilemma is to provide reactive power sources exactly at the location where
the reactive power is consumed. And, since strictly speaking it does not take any fuel to
provide reactive power, it should be possible to distribute reactive power sources (such as
capacitors) all around the network to avoid the problem of heating the conductors and
causing voltage drops [27].
Unfortunately, this is not practical in the extreme since there are literally millions of lines
and loads connected to the grid and so this would require millions of reactive power sources
which controlled to provide exactly the right amount of reactive power at the right time in
every second of every day. The best we can do in most cases is work with some type of
aggregation of load at the terminal of feeder leaving a substation and at terminals of major
lines and transformers. This also brings up the issue of the difference between power factor
control (trying to exactly provide the right amount of reactive power needed to equal that
which is consumed) and voltage control (trying to keep voltage levels at exactly the right
level no matter how much reactive power it takes).
Reactive power is both the problem and the solution to network voltage control. There are
many authors and researchers who have worked voltage and reactive power control for
power loss minimization using different techniques [28].
2.10. Capacitor Placement for Loss Reduction and Voltage Profile
2.10.1. Voltage Profile Improvement
Capacitors have been very commonly used to provide reactive power compensation in
distribution systems. Also, capacitors have been provided to minimize power and energy
loss and to maintain the voltage profile within the acceptable limits. The amount of
compensation provided is very much linked to the placement of capacitors in the
distribution system, which is essentially determination of the location, size, number and
Page 29
type of capacitors to be placed in the system. The capacitor placement problem is a well-
researched topic and has been addressed by many authors in the past [28].
2.10.2. Concept of fixed and switched capacitors
Fixed and switched capacitors play a large role in line-loss reduction and voltage-profile
improvement because they depend on the optimal reactive power flow that is controlled by
fixed and switched capacitors. The use of fixed and on/off switched capacitors provides
considerable reduction in power losses and improvement in the voltage profile when the
capacitors are controlled to respond to daily, weekly, or seasonal changes in feeder reactive
loads [29]. The power factor during off-peak hours is normally high; therefore, heavy
capacitor compensation may lead to over-voltage problems during this time. This situation
poses certain limitations regarding capacitor compensation and hence leads to the concept
of fixed and switched capacitor applications .The minimum size of capacitors connected at
all load levels can be considered as fixed capacitors, and others are considered as switched
capacitors[30].
2.10.3. Capacitor Operating Mode
Fixed mode – the capacitor is permanently put in service and is only taken out of service
during either planned or unplanned maintenance.
Switched mode – the capacitor is only put in service when needed or during predefined
times. Switched banks require a switch and control circuit/ device, which makes it more
costly compared to the fixed bank.
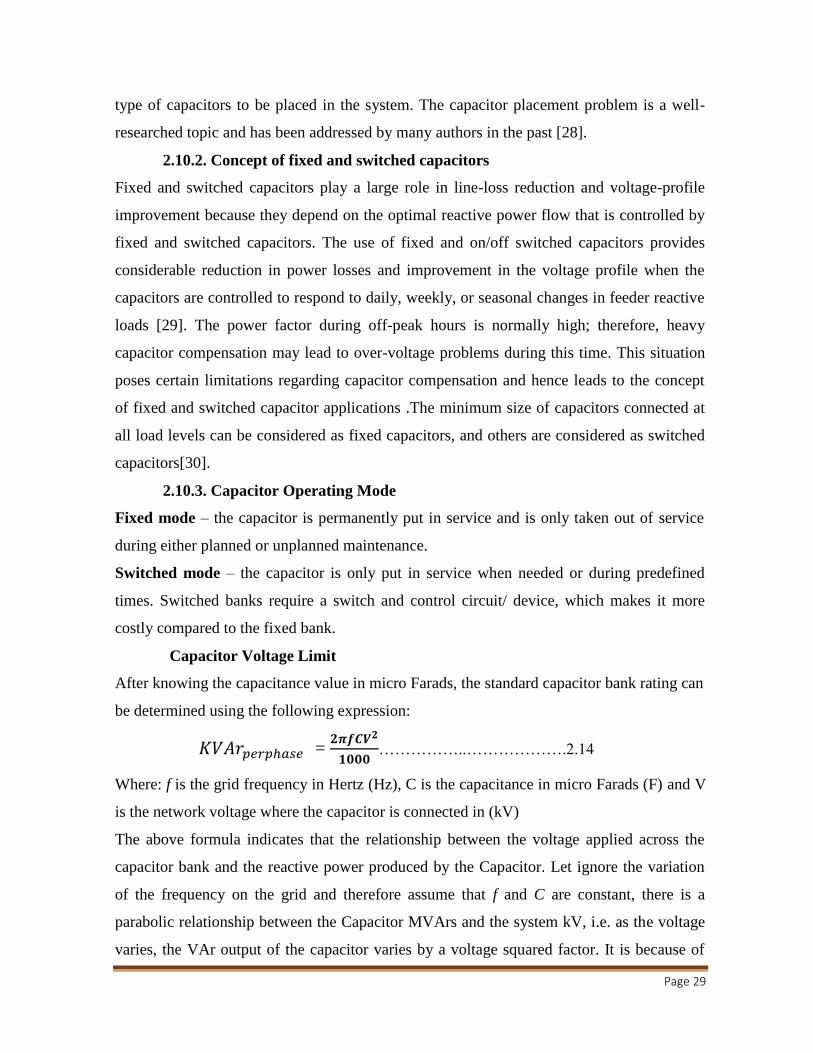
Capacitor Voltage Limit
After knowing the capacitance value in micro Farads, the standard capacitor bank rating can
be determined using the following expression:
=
……………..……………….2.14
Where: f is the grid frequency in Hertz (Hz), C is the capacitance in micro Farads (F) and V
is the network voltage where the capacitor is connected in (kV)
The above formula indicates that the relationship between the voltage applied across the
capacitor bank and the reactive power produced by the Capacitor. Let ignore the variation
of the frequency on the grid and therefore assume that f and C are constant, there is a
parabolic relationship between the Capacitor MVArs and the system kV, i.e. as the voltage
varies, the VAr output of the capacitor varies by a voltage squared factor. It is because of

Page 30
this mathematical relationship that Capacitors need to be switched into service shortly
before the network voltages are depressed due to the rising load profile [31].
2.11. Installation of capacitor bank to distribution feeder
Shunt capacitor are connected in parallel with the primary distribution feeder of a system
.distribution capacitors can be pole mounted or pad mounted.
Pole mounted capacitor are the least expensive way for providing the reactive power
from the point of view of installation.
Pad mounted capacitors are used where the power distribution circuit is placed
underground. The disadvantage of this kind of capacitors can be the big size and aesthetics.
In the figure 2.7: and figure 2.8: below an example of installed pole mounted and pad
mounted capacitors bank in distribution system are shown.
Fig 2.7: A pole-mounted capacitor bank with switch (photo credit: Power cap Capacitors
Pvt. Ltd)
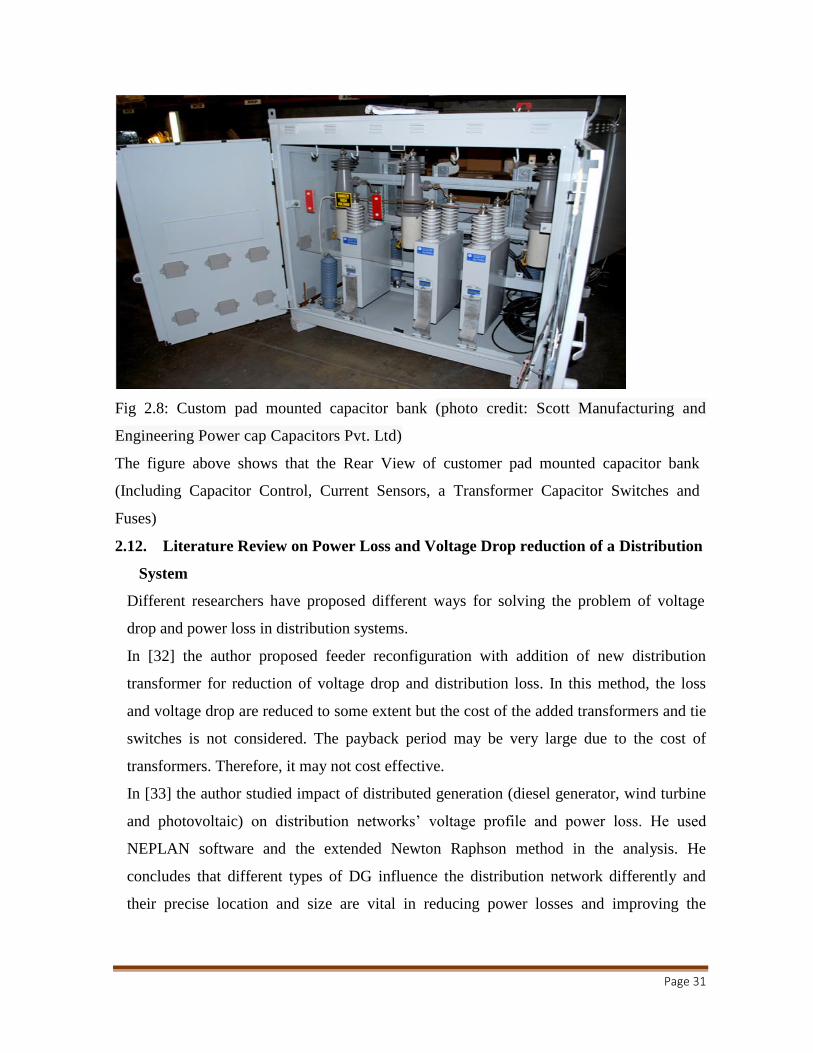
Page 31
Fig 2.8: Custom pad mounted capacitor bank (photo credit: Scott Manufacturing and
Engineering Power cap Capacitors Pvt. Ltd)
The figure above shows that the Rear View of customer pad mounted capacitor bank
(Including Capacitor Control, Current Sensors, a Transformer Capacitor Switches and
Fuses)
2.12. Literature Review on Power Loss and Voltage Drop reduction of a Distribution
System
Different researchers have proposed different ways for solving the problem of voltage
drop and power loss in distribution systems.
In [32] the author proposed feeder reconfiguration with addition of new distribution
transformer for reduction of voltage drop and distribution loss. In this method, the loss
and voltage drop are reduced to some extent but the cost of the added transformers and tie
switches is not considered. The payback period may be very large due to the cost of
transformers. Therefore, it may not cost effective.
In [33] the author studied impact of distributed generation (diesel generator, wind turbine
and photovoltaic) on distribution networks‘ voltage profile and power loss. He used
NEPLAN software and the extended Newton Raphson method in the analysis. He
concludes that different types of DG influence the distribution network differently and
their precise location and size are vital in reducing power losses and improving the

Page 32
voltage stability. But he did not consider the intermittent nature of the loads and the wind
turbine.
In [34] the author studied effects of distribution generation on distribution loss and voltage
profile. Voltage stability index-based approach is used to identify the candidate buses. The
author tried to show distribution losses are reduced and voltage profile is improved more
by type 2 DG (generating both real and reactive power) than type 1 DG (generating real
power only). The objective functions has not written clearly and not include voltage
deviation, he did not use optimizing tool, feasibility issue of the type of DG did not
considered and during candidate bus selection loss sensitivity index was not used.
In [35] the author presented a GA-IPSO based approach which utilizes combined
sensitivity factor analogy to locate and size multi-type DG in IEEE 57-bus test system
.with the aim of reducing power loss and improving voltage profile. The author showed
that the system power loss and voltage drop is reduced with the introduction of DGs in to
the network up to an optimal number where any further DG inclusion resulted to an
increase in system loss and voltage deviation outside the acceptable limits. Even though,
the loss and voltage drop are reduced, the effect of DG on the protection coordination, the
type of DG and feasibility issue have not considered yet.
In [36], the author proposed capacitor placement with feeder reconfiguration to reduce
distribution loss and voltage deviation. The author showed that by using DIgSILENT
simulation tools, capacitor placement with feeder reconfiguration improve the loss and
voltage drop of the distribution system. But the cost of tie switches and the separation
distance between each feeder have not considered. This has significant impact on the
initial investment cost of the suggested solution.
In [37], the author studied the improvement of voltage profile of radial distribution system
by capacitor placement using plant growth simulation algorithm. Loss sensitivity factor is
used to identify the candidate buses then plant growth simulation algorithm is used to
select the size of the capacitors. The author tested his solution on IEEE 9 bus system and
got a considerable voltage profile improvement. The author assumed a constant load
model but in reality, the distribution load is variable. Switchable type capacitors are not
also considered. If the compensating capacitor is not switchable type, the voltage rise
problem may be occurred during off peak periods.

Page 33
CHAPTER THREE
DATA COLLECTION AND ANALYSIS
3.1. DATA COLLECTION
The required data from Adama distribution substation regarding distribution network are
collected from respective office of Adama district distribution maintenance and operation office
and also from Adama substation work unit section. The collected data are a recorded data that
includes peak load, type of faults, frequency and duration of interruption of all medium voltage
(15kV) outgoing feeders of the distribution system. The collected data is a recorded data of two
consecutive years from 2018 to 2020G.C.
Adama substation has 11 outgoing feeders, around 80MW peak load, it provides electric supply
for about 55,772 customers with different tariff categories such as industrial, commercial and
residential. Currently there is one dedicated outgoing feeder line that for industrial park. The
collected data for Adama town Substation are shown in Table 3.1. The frequency of interruption
and duration of interruption for the Adama town distribution network for 24 Months are
analyzed and interpreted as shown in Tables 3.2 and 3.3 and Figures 3.1 and 3.2 respectively.
3.2. Description of the study area
Adama city had electric supply dated back to 1929 E.C which was generated from diesel
generator After Awash river has been dammed in three places in the vicinity of Adama city ,the
city was supplied with power generated from the nearby domestic hydropower plants of koka
Dam and connected with national interconnected electric transmission lines , since 1963 E.C.
And currently renewable energy that is wind power currently supply to Adama substation.
Adama that situated in strategic position of along the vibrant transport corridor that leads to the
eastern and southeastern parts of the country was established beneath of kechema ridge as a
railways station in 1916 E.c At a distance of 99 k m via old road and now 84.7 km via express
ways from southeast of addis abeba in economically and geographically strategic position at the
junction of major routes to addis abeba ,Arsi,Harar and other areas of economic importance.

Page 34
Table 3.1: Socio economic profile of Adama city 2019
Types of industries Quantity in number
1. Agro processing 67
2. Chemicals 5
3. Metal ;plastic and wood engineering 66
4. Textile 6
Industrial Development Park is also on the verge of launching its product. Thus this indicates
there is high demand of electric power for such industries and micro enterprises.
Adama 132kV distribution substation is one of the existing substation in the EEP power system
network that are found in the oromiya region of the country and the power supply is coming
from koka substation through 1x132kV transmission line. In this substation it has two 132/15
KV, 2*25MVA transformers and mobile substation one 132/15 KV, 50 MVA transformer. The
15kV side has five (5) (L1.L3.L4.L5.L7) out-going feeders and also the 15kV sides have six
(6)(M1.M2.M3.M4.M5.M6) outgoing feeders.
At Adama and surrounding area there is industry zone which has a big contribution on earning of
foreign currency for the country. The government has a plan to expand the industry zone around
the area and the high demand together with the small and large scale industries power demand
increases from the last two consecutive years on ward according to the power service sector
reports on 2011 E.C due to this facts the load growth of the area will be high in near future.
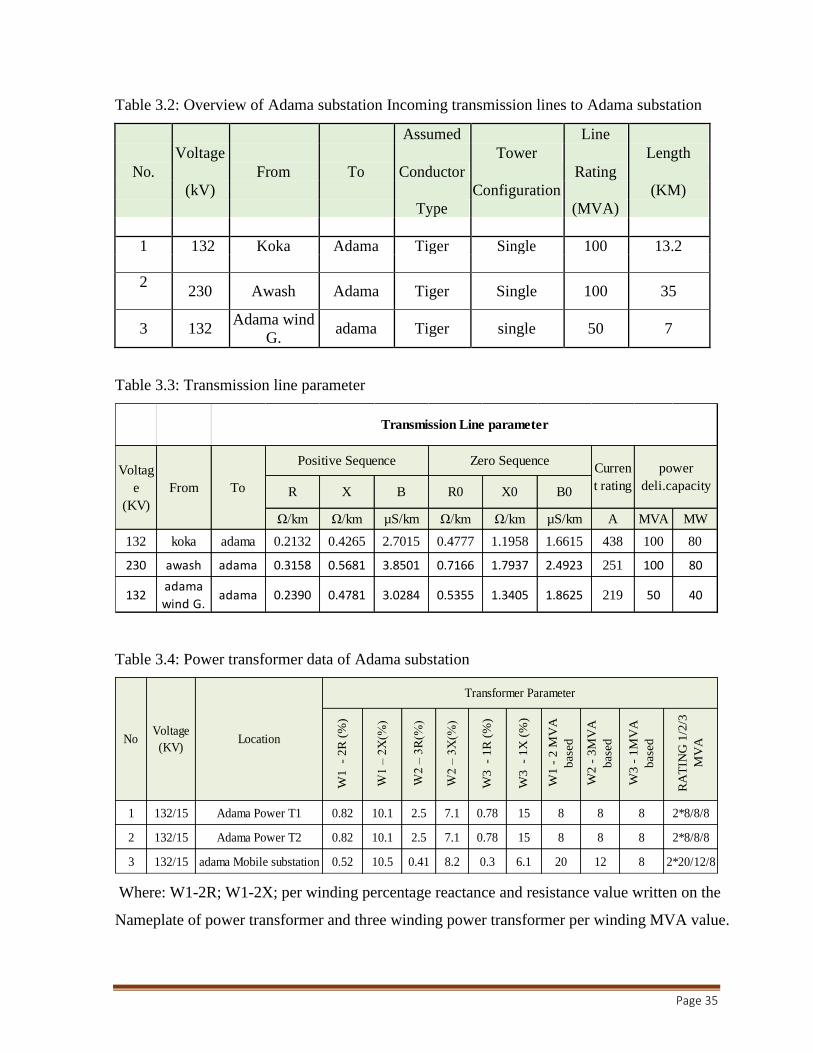
Page 35
Table 3.2: Overview of Adama substation Incoming transmission lines to Adama substation
Voltage
Assumed
Tower
Line
Length
No. From To Conductor Rating
(kV) Configuration (KM)
Type (MVA)
1 132 Koka Adama Tiger Single 100 13.2
2
230 Awash Adama Tiger Single 100 35
3 132 Adama wind
G. adama Tiger single 50 7
Table 3.3: Transmission line parameter
Table 3.4: Power transformer data of Adama substation
Where: W1-2R; W1-2X; per winding percentage reactance and resistance value written on the
Nameplate of power transformer and three winding power transformer per winding MVA value.
Ω/km Ω/km µS/km Ω/km Ω/km µS/km A MVA MW
132 koka adama 0.2132 0.4265 2.7015 0.4777 1.1958 1.6615 438 100 80
230 awash adama 0.3158 0.5681 3.8501 0.7166 1.7937 2.4923 251 100 80
132adama
wind G.adama 0.2390 0.4781 3.0284 0.5355 1.3405 1.8625 219 50 40
Positive Sequence
Transmission Line parameter
Curren
t rating
power
deli.capacityToFrom
Voltag
e
(KV)
Zero Sequence
B0R X B R0 X0
1 132/15 Adama Power T1 0.82 10.1 2.5 7.1 0.78 15 8 8 8 2*8/8/8
2 132/15 Adama Power T2 0.82 10.1 2.5 7.1 0.78 15 8 8 8 2*8/8/8
3 132/15 adama Mobile substation 0.52 10.5 0.41 8.2 0.3 6.1 20 12 8 2*20/12/8
No
W1
-
2R
(%
)
W1
– 2
X(%
)
W2
– 3
X(%
)
Location
W2
- 3
MV
A
base
d
W3
- 1
MV
A
base
d
RA
TIN
G 1
/2/3
MV
A
Voltage
(KV)
Transformer Parameter
W2
– 3
R(%
)
W3
-
1R
(%
)
W3
-
1X
(%
)
W1
- 2
MV
A
base
d

Page 36
Table 3.5: The no of customer and transformer data in each outgoing feeder of Adama substation
Table 3.6: Overhead MV conductor Data
No Conductor
type
Nominal
Area
(mm²)
Actual
Area
(mm²)
Stranding
and wire
Diameter
overall
Diameter
(mm)
Actual
Diameter
GMR
(mm)
Resistance
(u/km)
1 AAC 50 49.48 7/3.00 9 7.9377 2.88 0.5786
2 AAC 95 93.27 19/2.5 12.5 10.8975 4.129 0.3084
3.3. Reliability of distribution network
The term reliability in the utility context usually refers to the amount of time end users are totally
without power for an extended period of time (i.e., a sustained interruption). Definitions of what
constitutes a sustained interruption vary among utilities in the range of 1 to 5 min. This is what
many utilities refer to as an ―outage.‖ Current power quality standards efforts are leaning toward
calling any interruption of power for longer than 1 min, a sustained interruption. In any case,
reliability is affected by the permanent faults on the system that must be repaired before service
can be restored.
Types of voltage Disturbances in distribution system
Long-Duration Voltage Variations
Short-Duration Voltage Variations
A. Long-Duration Voltage Variations
25 50 100 200 315 500 630 800 1250 3000 8000
Line-1 6,542 10.4295 8.0260 1 1 2 4 2 1 1 1 2
Line-2 2,896 4.5581 3.4642 9 8 11 15 20 1
Line-3 12,227 7.5055 6.0795 13 9 19 21 7
Line-4 6,221 7.7860 5.2945 8 10 14 12 19
Line-5 3,325 4.3279 2.5535 1 1
Line-6 4,290 3.7389 2.5799 7 7 16 4 11 2 1
Line-7 6,757 9.6263 6.4496 9 5 15 9 11 1 2 1
Line-8 2,896 3.8964 2.2209 8 14 9 15 20
Line-9 2,681 2.8976 2.2312 7 5 17 5 11 2 2
Line-10 3,861 9.2905 4.4594 9 15 8 20 1 2 1
Line-11 4,076 8.0325 4.3376 8 16 12 15 15 1
Total 55,772 72 48 79 90 123 120 116 3 7 4 6 3 1
Feeder
Name
No of
customer
Adama Distribution transformer Capacity in (KVA)average
active
power
Average
reactive
power

Page 37
When the rms value of voltage deviates for duration more than 1 minute, it is termed as long
duration voltage variation. This condition occurs due to Load variations, System switching
operation in distribution substation.
It may be categorized into following types.
1. Over Voltage: An overvoltage is an increase in the rms ac voltage greater than 110 percent at
the power frequency for duration longer than 1 min.
(a) Overvoltage is usually the result of load switching (e.g., switching off a large load or
energizing a capacitor bank).
(b)Incorrect tap settings on transformers can also result in system over voltages.
2. Under Voltage: An under voltage is a decrease in terms ac voltage to less than 90 percent at
the power frequency for a duration longer than 1 min. This condition occurs due to a load
switching on or a capacitor bank switching off.
3. Sustained Interruptions: excess of 1 min, the interruption.
When the supply voltage becomes zero for a period of time in long-duration voltage
variation is considered a sustained
A. Short-Duration Voltage Variations
When the rms value of voltage deviates for duration less than 1 minute, it is termed as long
duration voltage variation. Each type of variation can be designated as instantaneous,
momentary, or temporary, depending on its duration.
It may be categorized into following types.
1. Interruption: An interruption occurs when the supply voltage or load current decreases to less
than 0.1 pu for a period of time not exceeding 1 min. Such Interruptions can be the result of
power system faults, equipment failures, and control malfunctions.
2. Voltage Sags (dips): Voltage sags are probably the most problematic of all power quality
problems. At this time, a number of standards-making bodies, including IEEE, ANSI, and IEC,
are working on standards related to voltage sags. In most cases, sags are generally agreed to be
more severe and outside of the scope of ANSI C84.1 and they are temporary in nature due to the
operation of system protection elements. Because the electrical system is a continuous
electrical circuit, faults in any location will have some impact on voltages throughout the
network. Of course, areas closer to the faulted area will see a greater voltage sag due to the fault
than other, more (electrically) remote areas. Sags can originate anywhere in a system, but are
more pronounced in utility distribution systems because of the greater exposure of low-voltage
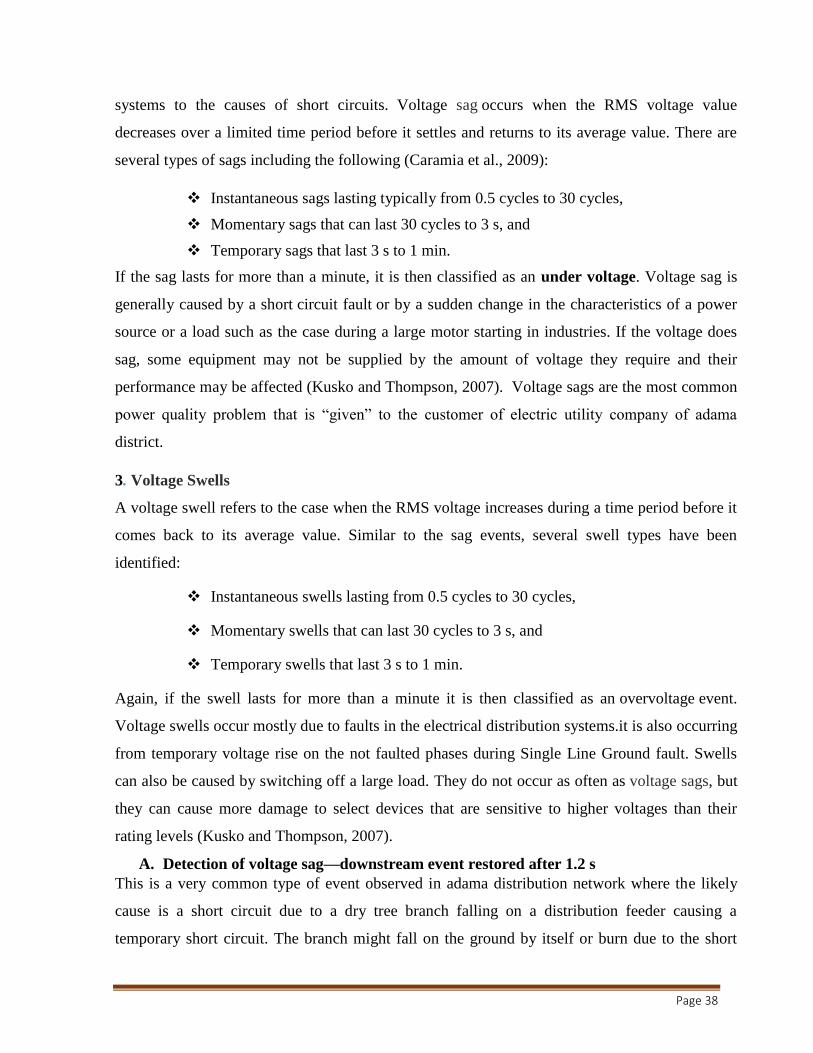
Page 38
systems to the causes of short circuits. Voltage sag occurs when the RMS voltage value
decreases over a limited time period before it settles and returns to its average value. There are
several types of sags including the following (Caramia et al., 2009):
Instantaneous sags lasting typically from 0.5 cycles to 30 cycles,
Momentary sags that can last 30 cycles to 3 s, and
Temporary sags that last 3 s to 1 min.
If the sag lasts for more than a minute, it is then classified as an under voltage. Voltage sag is
generally caused by a short circuit fault or by a sudden change in the characteristics of a power
source or a load such as the case during a large motor starting in industries. If the voltage does
sag, some equipment may not be supplied by the amount of voltage they require and their
performance may be affected (Kusko and Thompson, 2007). Voltage sags are the most common
power quality problem that is ―given‖ to the customer of electric utility company of adama
district.
3. Voltage Swells
A voltage swell refers to the case when the RMS voltage increases during a time period before it
comes back to its average value. Similar to the sag events, several swell types have been
identified:
Instantaneous swells lasting from 0.5 cycles to 30 cycles,
Momentary swells that can last 30 cycles to 3 s, and
Temporary swells that last 3 s to 1 min.
Again, if the swell lasts for more than a minute it is then classified as an overvoltage event.
Voltage swells occur mostly due to faults in the electrical distribution systems.it is also occurring
from temporary voltage rise on the not faulted phases during Single Line Ground fault. Swells
can also be caused by switching off a large load. They do not occur as often as voltage sags, but
they can cause more damage to select devices that are sensitive to higher voltages than their
rating levels (Kusko and Thompson, 2007).
A. Detection of voltage sag—downstream event restored after 1.2 s
This is a very common type of event observed in adama distribution network where the likely
cause is a short circuit due to a dry tree branch falling on a distribution feeder causing a
temporary short circuit. The branch might fall on the ground by itself or burn due to the short

Page 39
circuit, thus clearing the fault in the next reclosure (if there is a trip event, which is not the case
in this particular event); also, the protection relay may survive the overcurrent for the said period
(as per the protection logic) and normalcy will thus be restored after 1.2 s
B. Equipment Sensitivity to Voltage Sags
The equipment‘s within an end user facility that are sensitive to voltage sags are very
dependent on specific load type, control settings, and applications.
The most commonly used characteristics are the duration and magnitude of the sag.
Generally, equipment sensitivity to voltage sags can be divided into following three categories:
1. Equipment sensitive to only the magnitude of voltage sag: Devices in this group are
sensitive to the minimum (or maximum) voltage magnitude experienced during a sag (or swell).
This group includes devices such as under-voltage relays, process controls, motor drive controls,
and many types of automated machines (e.g., semiconductor manufacturing equipment). The
duration of the disturbance is usually of secondary importance for these devices.
2. Equipment sensitive to both the magnitude and duration of a voltage Sag: This group
includes all equipment that uses electronic power supplies. Such equipment not properly operates
or fails when the power supply output voltage drops below specified values. Thus, the important
characteristic for this type of equipment is the duration that the rms voltage is below a specified
threshold at which the equipment trips.
3. Equipment sensitive to characteristics other than magnitude and Duration: Some
devices are affected by other sag characteristics such as the phase unbalance during the sag
event, the point-in-the wave at which the sag is initiated, or any transient oscillations occurring
during the disturbance. These characteristics are more subtle than magnitude and duration, and
their impacts are much more difficult to generalize. As a result, the rms variation performance
indices defined here are focused on the more common magnitude and duration characteristics.
For end users with sensitive processes, the voltage sag ride-through capability is usually the most
important characteristic to consider.
Fault-Induced Voltage Sags
The majority of voltage sags are caused by faults on the power systems and the subsequent
operations of protective devices. Consider a customer that is supplied from the feeder supplied

Page 40
by circuit breaker. If there is a fault on the same feeder, the customer will experience voltage sag
during the fault followed by an interruption when the breaker opens to clear the fault. If the fault
is temporary in nature, a reclosing operation on the breaker should be successful and the
interruption will only be temporary. It will usually require about 5 or 6 cycles for the breaker to
operate, during which time a voltage sag occurs. The breaker will remain open for typically a
minimum of 12 cycles up to 5 s depending on utility reclosing practices. Sensitive equipment
will almost surely trip during this interruption.
A much more common event would be a fault on one of the other feeders from the substation,
that is, a fault is on a parallel feeder, or a fault somewhere on the transmission system. In either
of these cases, the customer will experience voltage sag during the period that the fault is
actually on the system. As soon as breakers open to clear the fault, normal voltage will be
restored at the customer. In case of two lines supplying the distribution substation and only one
has a fault. Therefore, customers supplied from the substation should expect to see only voltage
sag and not an interruption. The distribution fault on the other feeder may be cleared either by
the lateral fuse or the breaker, depending on the utility fuse saving practice. Any of these fault
locations can cause equipment not properly operate in customer facilities.
3.4. Reliability assessment of Adama distribution network
The analytical method uses mathematical solutions to evaluate mathematical models; this
technique has been used for many years. In this approach, the impact to all load points due to
each component failure will be considered as well as the average failure rate of the component.
Then, the interruption frequency and duration at each load point is calculated to eventually
calculate the system reliability indices such as SAIFI and SAIDI [38]. When calculations are
performed, the mean values are the results produced and they represent the reliability indices,
which prove to be very useful however, that does not give a realistic picture. The reliability
indices are in fact variable [39]; therefore, it is beneficial to be able to look at its distribution.
The probability distribution offers a way for the variations in the reliability indices to be shown.
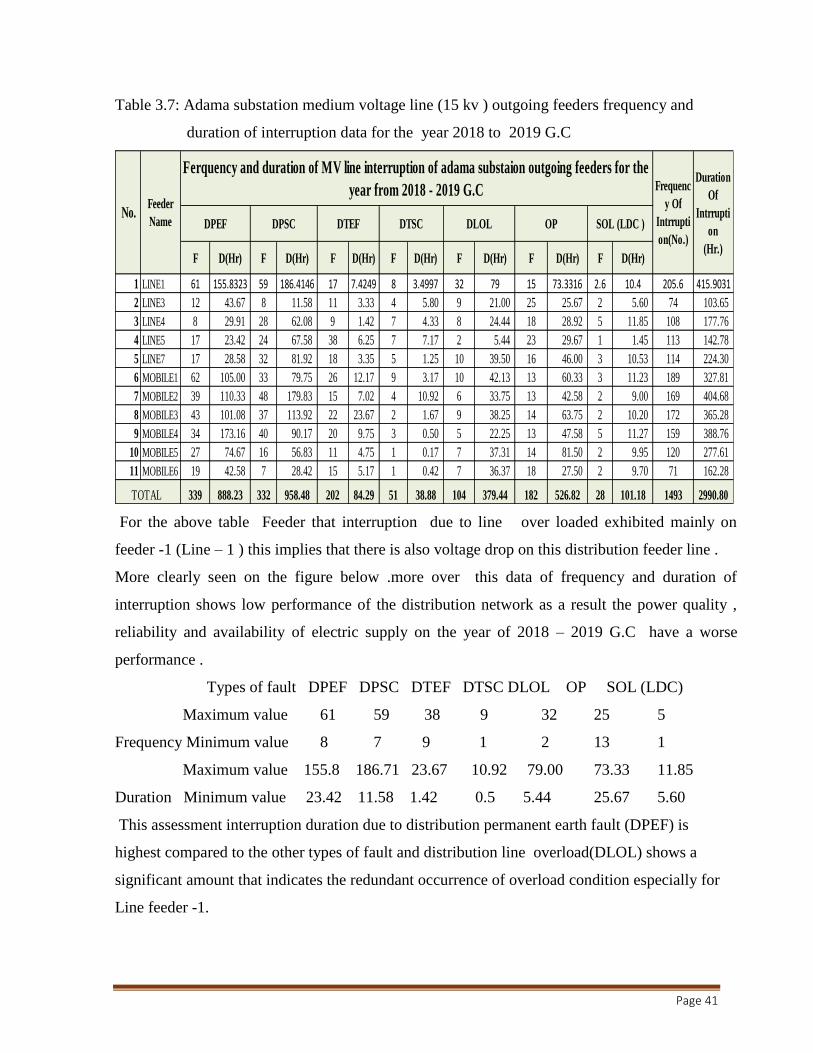
Page 41
Table 3.7: Adama substation medium voltage line (15 kv ) outgoing feeders frequency and
duration of interruption data for the year 2018 to 2019 G.C
For the above table Feeder that interruption due to line over loaded exhibited mainly on
feeder -1 (Line – 1 ) this implies that there is also voltage drop on this distribution feeder line .
More clearly seen on the figure below .more over this data of frequency and duration of
interruption shows low performance of the distribution network as a result the power quality ,
reliability and availability of electric supply on the year of 2018 – 2019 G.C have a worse
performance .
Types of fault DPEF DPSC DTEF DTSC DLOL OP SOL (LDC)
Maximum value 61 59 38 9 32 25 5
Frequency Minimum value 8 7 9 1 2 13 1
Maximum value 155.8 186.71 23.67 10.92 79.00 73.33 11.85
Duration Minimum value 23.42 11.58 1.42 0.5 5.44 25.67 5.60
This assessment interruption duration due to distribution permanent earth fault (DPEF) is
highest compared to the other types of fault and distribution line overload(DLOL) shows a
significant amount that indicates the redundant occurrence of overload condition especially for
Line feeder -1.
F D(Hr) F D(Hr) F D(Hr) F D(Hr) F D(Hr) F D(Hr) F D(Hr)
1 LINE1 61 155.8323 59 186.4146 17 7.4249 8 3.4997 32 79 15 73.3316 2.6 10.4 205.6 415.9031
2 LINE3 12 43.67 8 11.58 11 3.33 4 5.80 9 21.00 25 25.67 2 5.60 74 103.65
3 LINE4 8 29.91 28 62.08 9 1.42 7 4.33 8 24.44 18 28.92 5 11.85 108 177.76
4 LINE5 17 23.42 24 67.58 38 6.25 7 7.17 2 5.44 23 29.67 1 1.45 113 142.78
5 LINE7 17 28.58 32 81.92 18 3.35 5 1.25 10 39.50 16 46.00 3 10.53 114 224.30
6 MOBILE1 62 105.00 33 79.75 26 12.17 9 3.17 10 42.13 13 60.33 3 11.23 189 327.81
7 MOBILE2 39 110.33 48 179.83 15 7.02 4 10.92 6 33.75 13 42.58 2 9.00 169 404.68
8 MOBILE3 43 101.08 37 113.92 22 23.67 2 1.67 9 38.25 14 63.75 2 10.20 172 365.28
9 MOBILE4 34 173.16 40 90.17 20 9.75 3 0.50 5 22.25 13 47.58 5 11.27 159 388.76
10 MOBILE5 27 74.67 16 56.83 11 4.75 1 0.17 7 37.31 14 81.50 2 9.95 120 277.61
11 MOBILE6 19 42.58 7 28.42 15 5.17 1 0.42 7 36.37 18 27.50 2 9.70 71 162.28
339 888.23 332 958.48 202 84.29 51 38.88 104 379.44 182 526.82 28 101.18 1493 2990.80TOTAL
DPEF DPSC DTEF DTSC DLOL OP SOL (LDC ) No.
Feeder
Name
Ferquency and duration of MV line interruption of adama substaion outgoing feeders for the
year from 2018 - 2019 G.C Frequenc
y Of
Intrrupti
on(No.)
Duration
Of
Intrrupti
on
(Hr.)

Page 42
Fig
3.1
: A
dam
a dis
trib
uti
on n
etw
ork
fr
equen
cy a
nd d
ura
tion o
f in
terr
upti
on b
ased
on f
ault
ty
pe
of
the
yea
r 2018
-2019 G
.C

Page 43
Fig 3.2: Frequency and duration of interruption on Adama substation of MV line (15kv)
outgoing feeder for the year of 2018 – 2019 G.C
The Figure above shows that the yearly majority of frequency interruption and duration of
interruption falls is distribution Permanent short circuit faults ( DPSCF) that is mainly occurred
due to Line to Line contact of mv line and it contributes the major fault for the stated year
respectively. So the main contributors for this outage ranked accordingly
1. Distribution Permanent short circuit faults ( DPSCF)
2. Distribution Permanent Earth faults ( DPEF)
3. Distribution line over load ( DLOL)
4. Distribution operational work (DOP)
From the figure 3.2: the highest frequency of interruption occurred on the M-4 line which is
202.60 and the lowest value happened on the line no M- 6 .this means that preventive
maintenance and rehabilitation work and planed interruption is properly done on line no M-6.
And also line no 1 ranked five as compared to the rest distribution feeders that need to be
focused and different mitigation measure should need to be taken by respective office.
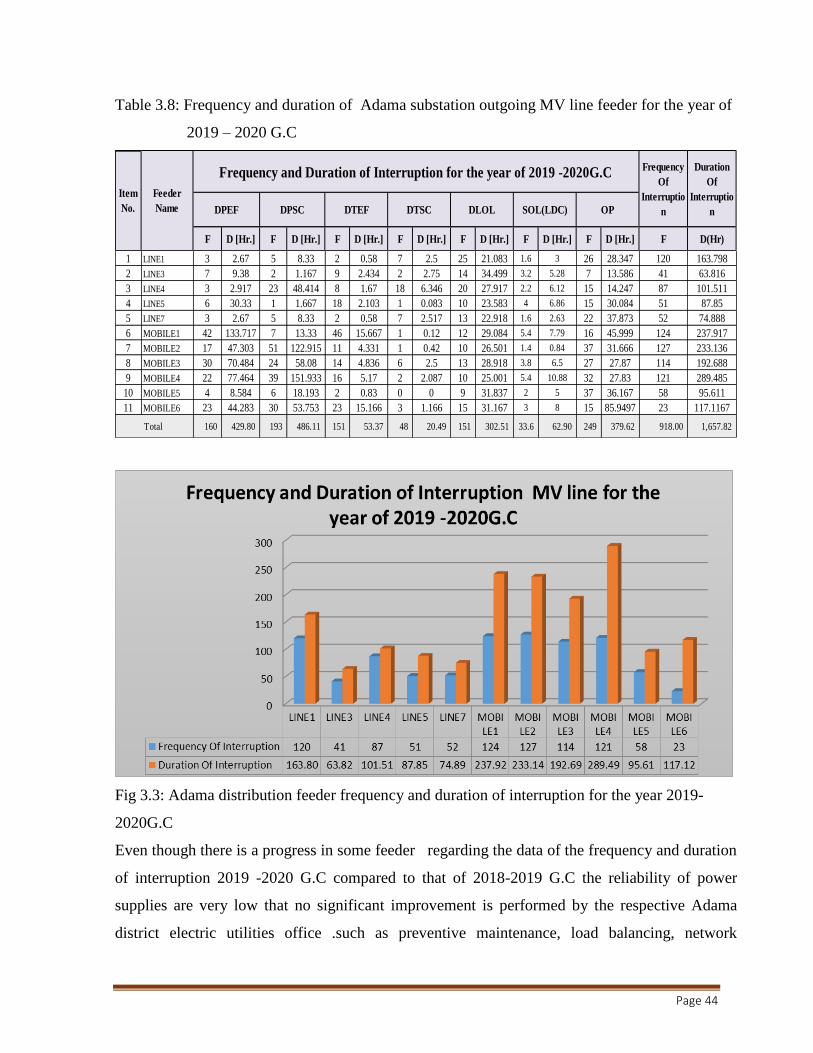
Page 44
Table 3.8: Frequency and duration of Adama substation outgoing MV line feeder for the year of
2019 – 2020 G.C
Fig 3.3: Adama distribution feeder frequency and duration of interruption for the year 2019-
2020G.C
Even though there is a progress in some feeder regarding the data of the frequency and duration
of interruption 2019 -2020 G.C compared to that of 2018-2019 G.C the reliability of power
supplies are very low that no significant improvement is performed by the respective Adama
district electric utilities office .such as preventive maintenance, load balancing, network
F D [Hr.] F D [Hr.] F D [Hr.] F D [Hr.] F D [Hr.] F D [Hr.] F D [Hr.] F D(Hr)
1 LINE1 3 2.67 5 8.33 2 0.58 7 2.5 25 21.083 1.6 3 26 28.347 120 163.798
2 LINE3 7 9.38 2 1.167 9 2.434 2 2.75 14 34.499 3.2 5.28 7 13.586 41 63.816
3 LINE4 3 2.917 23 48.414 8 1.67 18 6.346 20 27.917 2.2 6.12 15 14.247 87 101.511
4 LINE5 6 30.33 1 1.667 18 2.103 1 0.083 10 23.583 4 6.86 15 30.084 51 87.85
5 LINE7 3 2.67 5 8.33 2 0.58 7 2.517 13 22.918 1.6 2.63 22 37.873 52 74.888
6 MOBILE1 42 133.717 7 13.33 46 15.667 1 0.12 12 29.084 5.4 7.79 16 45.999 124 237.917
7 MOBILE2 17 47.303 51 122.915 11 4.331 1 0.42 10 26.501 1.4 0.84 37 31.666 127 233.136
8 MOBILE3 30 70.484 24 58.08 14 4.836 6 2.5 13 28.918 3.8 6.5 27 27.87 114 192.688
9 MOBILE4 22 77.464 39 151.933 16 5.17 2 2.087 10 25.001 5.4 10.88 32 27.83 121 289.485
10 MOBILE5 4 8.584 6 18.193 2 0.83 0 0 9 31.837 2 5 37 36.167 58 95.611
11 MOBILE6 23 44.283 30 53.753 23 15.166 3 1.166 15 31.167 3 8 15 85.9497 23 117.1167
160 429.80 193 486.11 151 53.37 48 20.49 151 302.51 33.6 62.90 249 379.62 918.00 1,657.82 Total
DTEF DTSC DLOL OPSOL(LDC)
Item
No.
Feeder
Name
Frequency and Duration of Interruption for the year of 2019 -2020G.C Frequency
Of
Interruptio
n
Duration
Of
Interruptio
nDPEF DPSC
Page 45
upgrading, upgrading of distribution transformer based on the identified loaded distribution
transformer.
Fig 3.4: Frequency and duration of interruption on Adama substation of MV line (15kv)
outgoing feeder based on fault type for the year of 2019 – 2020 G.C
The Figure above shows that the yearly majority of frequency interruption and duration of
interruption falls is distribution Permanent short circuit faults (DPSCF) that is mainly occurred
due to Line to Line contact of mv line and it contributes the major fault for the stated year
respectively. So the main contributors for this outage ranked accordingly
1. Distribution Permanent short circuit faults ( DPSCF)
2. Distribution Permanent Earth faults ( DPEF)
3. Distribution line over load ( DLOL)
The other forced measured interruption like System over load in case of the interruption is done
from direct order of the Ethiopian electric utility load dispatch center (LDC) respective work
units to down size the maximum load which among the eleven feeders have carried. The
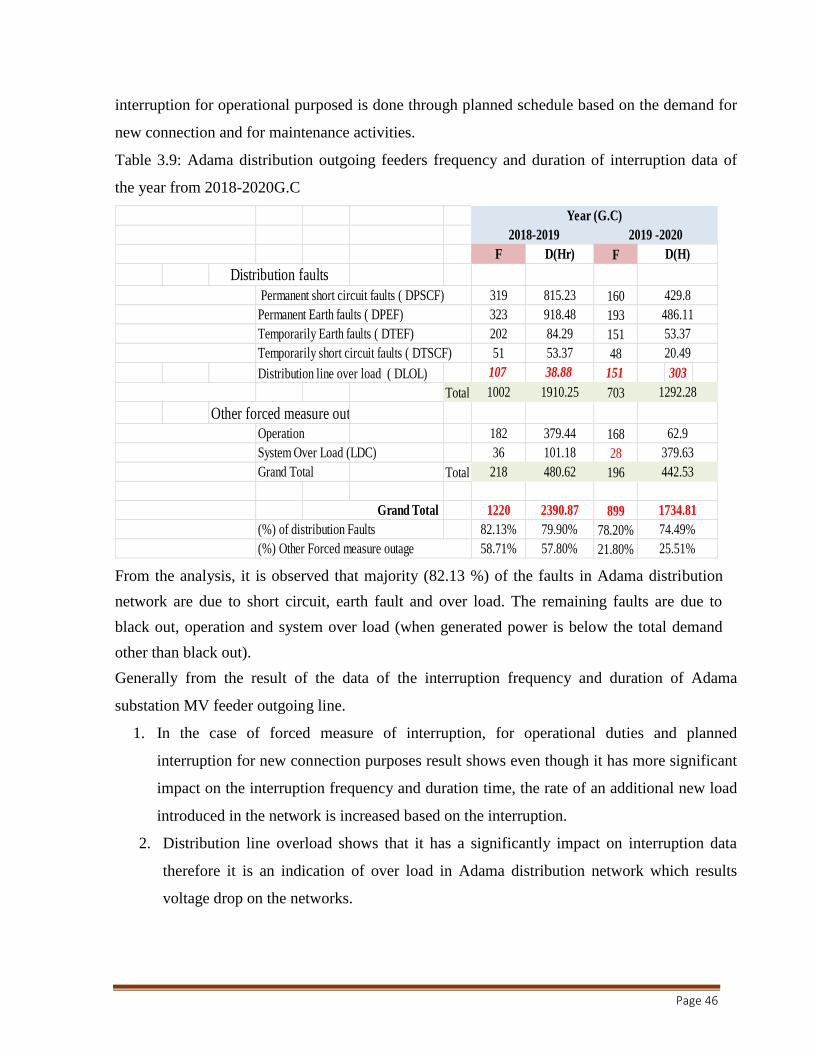
Page 46
interruption for operational purposed is done through planned schedule based on the demand for
new connection and for maintenance activities.
Table 3.9: Adama distribution outgoing feeders frequency and duration of interruption data of
the year from 2018-2020G.C
From the analysis, it is observed that majority (82.13 %) of the faults in Adama distribution
network are due to short circuit, earth fault and over load. The remaining faults are due to
black out, operation and system over load (when generated power is below the total demand
other than black out).
Generally from the result of the data of the interruption frequency and duration of Adama
substation MV feeder outgoing line.
1. In the case of forced measure of interruption, for operational duties and planned
interruption for new connection purposes result shows even though it has more significant
impact on the interruption frequency and duration time, the rate of an additional new load
introduced in the network is increased based on the interruption.
2. Distribution line overload shows that it has a significantly impact on interruption data
therefore it is an indication of over load in Adama distribution network which results
voltage drop on the networks.
F
160
193
151
48
Distribution line over load ( DLOL) 151 303
Total 703
Other forced measure outages
168
28
Total 196
899
78.20%
21.80%
Distribution faults
(%) of distribution Faults 82.13% 79.90% 74.49%
(%) Other Forced measure outage 58.71% 57.80% 25.51%
Grand Total 1220 2390.87 1734.81
Grand Total 218 480.62 442.53
62.9
System Over Load (LDC) 36 101.18 379.63
Operation 182 379.44
107 38.88
1002 1910.25 1292.28
Temporarily short circuit faults ( DTSCF) 51 53.37 20.49
Temporarily Earth faults ( DTEF) 202 84.29 53.37
Permanent short circuit faults ( DPSCF) 319 815.23 429.8
Permanent Earth faults ( DPEF) 323 918.48 486.11
F D(Hr) D(H)
Year (G.C)
2018-2019 2019 -2020

Page 47
Fig 3.5: two year data of interruption regarding frequency and duration of Adama distribution
network from 2018 -2020G.C
From the above figurative explanation it is clear that there is a few progress is seen in frequency
of and duration of interruption of Adama distribution network. if plan preventive maintenance ,
trimming of trees, load balancing ;rehabilitation of distribution line and designed base upgrading
of distribution transformer all this duties are done based on the area identified then the reliability
;availability and quality of electric supply will be enhanced.
3.5.Reliability Indices Evaluation of Adama Distribution network
As one object of this thesis work is to investigate under voltage problems of Adama
distribution network using a more adopted method for determining distribution network
reliability, this part of the thesis work used IEEE1366 indices to evaluate the reliability indices
of Adama distribution system. The availability of power for customers from this substation is
performed on the medium voltage side of the customer transformers (15kV). The reliability is
highly affected by outages occurred on the customer side secondary distribution lines which
unable to collect data for analysis due to lack of resource, lack of organized data and advanced
technology at the substation to view the performance of the customer side secondary
distribution network. The causes occurred on the secondary sides of customer transformers
0
100
200
300
400
5002018 -2019 G.C Frequency OfIntrruption(No.)
2018 -2019 G.C Duration OfIntrruption(Hr.)
2019 -2020G.C Frequency OfIntrruption(No.)
2019 -2020G.C Duration OfIntrruption(Hr.)

Page 48
that may affect the service reliability of the feeders. Reliability analysis and calculations for
the Adama distribution system had been done using equation 2.1 -2.5 for the indices (such as
SAIFI, SAIDI, CAIDI, and ASAI) and tabulated as follow
Table 3.10: Reliability indices of Adama substation outgoing feeders
3.6.Comparison of Reliability Indices with Benchmarks
Reliability benchmarks are the standards against which analyzed or measured reliability is
judged. The purposes of reliability benchmarks are to define minimum average reliability
performance, by feeder type, for a distribution network and provide a basis against which a
distribution network service provider‘s reliability performance can be assessed.
The benchmarks were calculated using the IEEE Guide for electric power distribution reliability
indices – IEEE Standard 1366‐2012.Reliability analysis and calculations for the Adama
distribution system had been done for the indices (such as SAIFI, SAIDI, CAIDI, and ASAI)
using the equation 2.1-2.5.
A benchmark of SAIDI, CAIDI, SAIFI and ASAI for nine countries is shown in Table 3.11
From the calculation and analysis considered in reliability evaluation of Adama distribution
system feeder 01 has an average value of SAIDI=504.04 minutes, SAIFI=7.3
interruptions/customer, CAIDI=75.45 minutes and ASAI=99.43%. A lower number for
SAIDI, SAIFI and CAIDI index indicates better reliability performance; i.e., a lower frequency
2018-
2019
G.C
2019-
2020
G.C
2018-
2019
G.C
2019-
2020
G.C
2018-
2019
G.C
2019-
2020
G.C
2018-
2019
G.C
2019-
2020
G.C
2018-
2019
G.C
2019-
2020
G.C
LINE1 7.30 6.79 504.04 448.60 75.45 68.66 99.43 99.23 1.15 1.12
LINE3 2.74 2.55 261.48 232.72 72.38 65.87 99.70 99.50 0.60 0.58
LINE4 4.23 3.93 379.47 337.73 77.86 70.85 99.57 99.37 0.87 0.84
LINE5 0.42 0.39 39.21 34.90 27.32 24.86 99.96 99.76 0.09 0.09
LINE7 4.21 3.92 343.44 305.66 60.35 54.92 99.61 99.41 0.78 0.76
MOBILE1 0.90 0.84 70.23 62.51 20.27 18.45 99.92 99.72 0.16 0.16
MOBILE2 1.32 1.22 149.28 132.86 25.67 23.36 99.83 99.63 0.34 0.33
MOBILE3 6.15 5.72 294.42 262.03 48.53 44.16 99.60 99.40 0.81 0.79
MOBILE4 1.24 1.15 90.65 80.68 14.20 12.92 99.90 99.70 0.21 0.20
MOBILE5 3.55 3.30 257.38 229.06 37.70 34.30 99.71 99.51 0.59 0.57
MOBILE6 4.90 4.55 463.00 412.07 58.66 53.38 99.47 99.27 1.06 1.03
SAIFI SAIDI CAIDI ASAI ASUI
Feeder
Name

Page 49
of outages or shorter outage duration. A higher SAIDI, SAIFI and CAIDI index number
indicates worse performance. Compare the average SAIDI, SAIFI, CAIDI and ASAI value of
feeder of Adama distribution with the benchmarks shows that has worse performance.
Table 3.11: Benchmarks for Reliability Indices
No Country SAIDI SAIFI CAIDI ASAI
(Hours/year) (Interruptions/Customer) (Hours/outage) (%)
1 United States 4 1.5 2.05 99.91
2 Austria 1.2 0.9 1.866 99.97
3 Denmark 0.4 0.5 1.166 99.981
4 France 1.03 1 0.966 99.97
5 Germany 0.383 0.5 0.833 99.9999
6 Italy 0.966 2.2 1.767 99.9991
7 Netherlands 0.55 0.3 1.25 99.97
8 Spain 1.733 2.2 1.90 99.968
9 UK 1.5 0.8 1.67 99.964
10 Adama
(Ethiopia)
Line -1 333.54 2.105 42.26 99.24
Line -3 220.85 1.17 61.13 99.495
Line -4 168.515 0.61 34.575 99.615
Line -5 19.55 0.11 13.625 99.96
Line -7 147.49 0.9 25.915 99.66
M - 1 274.5 3.45 41.09 99.375
M - 2 88.385 0.58 15.2 99.795
M - 3 211.165 2.87 28.835 99.52
M - 4 69.37 0.64 10.865 99.84
M - 5 171.445 1.765 25.11 99.61
M - 6 50.58 0.35 14.16 99.89
A typical customer expects to have a power at all times. In reality a utility will be able to make
power available between 99.9 and 99.999 percent of the time. To put it in another way, the
average customer may be dissatisfied if there is no electricity for more than for less than an hour

Page 50
in a year. (Source: APPA distribution system reliability and operations survey report, by Alex
Hofmann, Nov 2018, published by American Public power association).
Outgoing Feeder 1 (L- 1) of adama substation has a deviation of 0.504% . Consequently,
customers experienced life without electricity on average for about 5 hours per month
3.7. Modeling of Adama distribution network in ETAP software
The above collected data is analyzed quantitatively and qualitatively using ETAPs software for
load flow analysis and capacitor placement. ETAP software performs power flow analysis and
voltage drop calculations with accurate and reliable result. Built-in features like automatic
equipment evaluation, alerts and warnings summary, load flow result analyzer, and intelligent
graphics make it the most efficient electrical power flow analysis tool available today.
ETAP load flow calculation program calculate bus voltages, brunch power factors, currents and
power flows throughout the electrical system. ETAP allows for swing, voltage regulated, and
unregulated power sources with unlimited power grids generator calculations. This load flow
calculation software is capable of performing analysis on both radial and loop systems. ETAP
allows to select from several different load flow calculation methods in order to achieve the most
efficient and accurate results.
The modeling and simulation of this work is done based on real and valid data which represents
real condition of the network ETAP is used to perform the load flow analysis. They are fully
integrated suite of electrical software applications that provides intelligent power monitoring,
energy management, optimal power flow.

Page 51
Fig 3.6: Modeling of Adama substation outgoing feeder
3.4. Load Flow Analysis of Adama distribution feeder 01
In this part, Load flow analysis is used to analyze the selected power systems under steady-state
using ETAPs software. The load flow calculates the active and reactive power flows for all
branches, loading of distribution lines and transformers, the voltage magnitude at each bus bar of
the network in terms of kilo Volt (kV) and or V%.
The main areas for the application of load flow calculations are: Calculation of branch loadings,
voltage profiles for system planning and operation at normal conditions and compares with a
system after introducing capacitor bank.
Under normal operating conditions the feed power as well as the loads is known, and it is
therefore sufficient for the load flow calculation to represent these in feed power and to provide
the active and reactive power of all loads. The results of the load flow calculation should
represent a system condition in which none of the branch or generator limits are exceeded. The
calculation methods and the options provided by ETAPs load flow analysis function allow the
Page 52
accurate representation of any 3-phase AC systems. For very fast and reliable analysis of
complex networks, only the flow of active and reactive power through the branches and voltage
profile at bus bar of the system is considered.
As a general concept, ETAPs software is implemented as a single executable program. The
programming method employed allows for a fast 'walk around' the execution environment, and
eliminates the need to reload modules and update or transfer results between different program
applications. As an example, the power flow, fault analysis, and harmonic load flow analysis
tools can be executed sequentially without resetting the program, enabling additional software
modules and engines or reading external data files.
These thesis works aimed at solving this problem by proposing optimize capacitor bank
location and size while considering both real and reactive power losses. Both real and reactive
power flow and power loss sensitivity factors were utilized in identifying the candidate buses
for capacitor bank allocation. This reduced the search space for the algorithm and thus
increased its rate of convergence [40].
3.5. Modeling of Distribution network components
In power engineering, the load flow of a power network provides the steady state solution
through which various parameters of interest like currents, voltages and losses can be calculated.
The load flow study is an important part of distribution systems analysis and it is used in
operational as well as planning stages. Many real time applications in the distribution automation
system such as networks optimization, reactive power planning, switching, state estimation and
so forth, need the support of a robust and efficient power flow method. Such a power flow
solution method must be able to model the special features of distribution system [41].
Modeling of system elements and distribution load flow analysis are discussed in section. Power
distribution system is the heart of power system, it constitutes of major portion of any power
system. Distribution systems are mostly radial or near radial in structure, multi-phase,
unbalanced, grounded or ungrounded operation. It has a larger R/X ratio, Distributed load are
mostly unbalanced. It consists of large number of nodes and branches.
Power distribution network plays the role of providing energy to end users connected at low or
medium voltage and still considered as a mere termination of the transmission grid. It is
Characterizing by unidirectional power flow and simple protection ensuring safe and economical
operation of the power system.
Page 53
The inability of the conventional load flow techniques coupled with the above raised issues
demands a power flow technique that gives the status of the distribution system for planning and
operation purpose. To run a load flow, it is necessary with appropriately model the different
components in the distribution system.
The following sections will show how lines, loads, transformer and capacitors can be modeled
for load flow technique [40].
3.5.1. Line Model
The overhead line models described in this thesis is applicable to both the line element for single
circuits and the line coupling for multiple coupled circuits [41].
Lumped parameters: this model can be used with acceptable accuracy for short lines or relative
long lines at low frequencies.
Distributed parameters: It should be preferred to model long lines or in calculations when high
frequencies. The models are available for steady-state calculations (load flow, short circuit or
frequency sweep calculations among others).
Line Models for Steady-State Analysis
Line models for steady-state analysis are formulated in frequency domain. An accurate
representation of the transmission line, including the effect of its distributed parameters is
therefore possible [41].
3.5.2. Load Model
The load model plays a significant role in customer load energy consumption, in reactive power
compensation, in a voltage reduction program and in voltage stability analysis of a distribution
network system. When shunt capacitors are connected to a feeder line to compensate the reactive
power, current flowing through the line is reduced, and as a result, the line voltage drop (Z*I)
decreases, resulting in an increase in node voltage (VJ = VI – Z*I). Since the node voltage
increases, voltage-dependent loads consume more power after the reactive power compensation.
This energy consumption depends on the type of the load model. A balanced load can be
represented either as constant power, constant current, constant impedance or as an exponential
load [42].
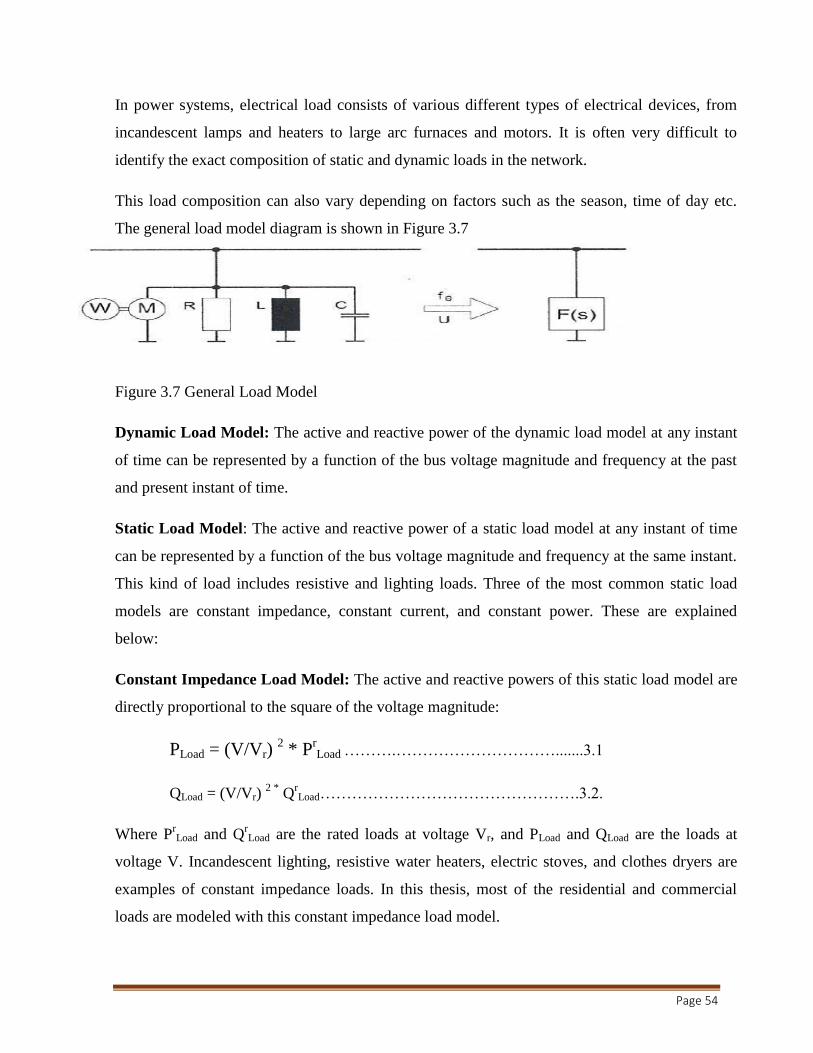
Page 54
In power systems, electrical load consists of various different types of electrical devices, from
incandescent lamps and heaters to large arc furnaces and motors. It is often very difficult to
identify the exact composition of static and dynamic loads in the network.
This load composition can also vary depending on factors such as the season, time of day etc.
The general load model diagram is shown in Figure 3.7
Figure 3.7 General Load Model
Dynamic Load Model: The active and reactive power of the dynamic load model at any instant
of time can be represented by a function of the bus voltage magnitude and frequency at the past
and present instant of time.
Static Load Model: The active and reactive power of a static load model at any instant of time
can be represented by a function of the bus voltage magnitude and frequency at the same instant.
This kind of load includes resistive and lighting loads. Three of the most common static load
models are constant impedance, constant current, and constant power. These are explained
below:
Constant Impedance Load Model: The active and reactive powers of this static load model are
directly proportional to the square of the voltage magnitude:
PLoad = (V/Vr) 2 * P
rLoad ……….………………………….......3.1
QLoad = (V/Vr) 2 *
QrLoad………………………………………….3.2.
Where PrLoad and Q
rLoad are the rated loads at voltage Vr, and PLoad and QLoad are the loads at
voltage V. Incandescent lighting, resistive water heaters, electric stoves, and clothes dryers are
examples of constant impedance loads. In this thesis, most of the residential and commercial
loads are modeled with this constant impedance load model.

Page 55
Constant Current Load Model: The active and reactive power of this static load model is
directly proportional to the voltage magnitude:
PLoad = (V/Vr)* Prload ……………………………………………3.3
QLoad = (V/Vr)* Qrload……………………………………………3.4.
Welding units and electroplating processes are constant current loads. The small industries
mainly use constant loads with big percentage, so our research use constant current load model
for most of small industries.
Constant Power Load Model: The active and reactive powers of this static load model are
constant, i.e., its power does not vary with voltage magnitude. An induction motor operating
close to its rated voltage, fluorescent lighting, and washing machines are examples of constant
power loads. The big industries are modeled with constant power load Model in ETAP Power
factory Environment [43].
3.5.3. Transformer Model
1. The Two winding transformer model
The two-winding transformer model is a very detailed model for various kinds of three-phase,
two-winding transformers in power systems. It can represent e.g. network transformers, block
transformers, phase shifters or MV-voltage regulators. The model makes special consideration
for auto-transformers [44].
The Three winding transformer
Three winding transformer is a Three port element connecting Three cubicles in the network.
Power factory comes with a built-in model for three-winding transformers. The sequence
equivalent models of the three-winding transformer including generalized tap changers (for
phase and magnitude). The Negative sequence models are identical to the positive sequence
model. In this thesis paper the positive and zero sequence models are selected for both Two
Winding and Three winding [44].
Page 56
3.5.4. Load Flow Analysis
Load flow calculations are used to analyze power systems under steady state conditions. The
load flow calculates the active and reactive power flows for all branches, and the voltage
magnitude and phase for all nodes [45].
Network Representation
A load flow calculation determines the voltage magnitude and the voltage angle of the nodes,
and the active and reactive power flow on branches. Usually, the network nodes are represented
by specifying two of these four quantities. Depending on the quantities specified, nodes can be
classified as [45]:
PV nodes: constant active power and voltage magnitude are specified. This type of node is used
to represent generators whose active power and voltage magnitude are controlled, and
synchronous condensers. In order to consider equipment limits under abnormal conditions (as
mentioned in the previous section), reactive power limits for the corresponding network
components are also used as input information.
PQ nodes: active and reactive powers are specified. This type of node is used to represent loads
and generators with fixed dispatch. Loads can also be set to change (from their original Po and Qo
values at nominal voltage) as a function of the voltage of the node to which the load itself is
connected.
Slack bus: voltage magnitude and angle are fixed. In traditional load flow calculations the slack
node (associated with a synchronous generator or an external network) carries out the balancing
of power in the system.
Device nodes: special nodes used to represent devices such as HVDC converters, SVSs, etc.,
with specific control conditions (for example the control of active power flow at a certain MW
threshold in a HVDC converter).
In contrast to other power system calculation programs, Power factory does not directly define
the node characteristic of each bus bar. Instead, more realistic control conditions for the network
elements connected to these nodes are defined.

Page 57
For example, synchronous machines are modeled by controlled power factor, controlled by
constant active and reactive power (PQ), controlled by constant voltage, constant active power
(PV) on the connected bus and by secondary controller ('slack', SL).
AC Load Flow
In Power factory the nodal equations used to represent the analyzed networks are implemented
using Newton-Raphson (Current Equations) and Newton-Raphson (Power Equations, classical).
In both formulations, the resulting non-linear equation systems must be solved by an iterative
method. The Newton-Raphson method is used as its non-linear equation solver. For large
transmission systems, especially when heavily loaded, the standard Newton-Raphson algorithm
using the "Power Equations" formulation usually converges best. Distribution systems,
especially unbalanced distribution systems, usually converge better using the "Current
Equations" formulation. This paper are assumed, the three-phase radial distribution networks are
to be balanced and hence represented by their single-line diagram. The system is represented by
its positive-phase sequence network. The operating conditions of the system are selected. The
static operating state of the system is then specified by the constraints on voltage at the network
buses [44].

Page 58
CHAPTER FOUR
SIMULATION STUDIES AND ANALYSIS OF RESULTS
4.1. Genetic Algorithm for Optimal Capacitor Placement
GA is a search algorithm based on the mechanic of natural selection. Basically, a GA makes a
population that evolves through time using reproduction and mutation process. Only individuals
representing good solutions of the capacitor placement problem will survive longer, and their
genetic information will be present in the next generation. At the end, after several generations,
the interaction between these high quality individuals will produce a final population which
represent the best solutions set of the problem [45].
Three most important aspects of using GA are:
Definition of objective function
Definition and implementation of genetic representation
Definition and representation of genetic operators
Before of the genetic algorithm procedure, the real parameters of the problem must be
represented in genetic algorithm language. It means that location and size of the capacitors used
are codified as a chromosome. The representation chosen for this application is a chromosome
divided in two parts. First part is location of the capacitors. The second part indicates the size of
the capacitors used. In reproduction process, first we randomly select a pair of chromosomes,
with the same structure. In the next step, chromosomes are treated separately; one for binary part
and another for integer part. In binary part, for a given position, if two parents share value, the
chromosome produced by reproduction will keep it. If values are different, the result for new
chromosome is selected at random. In integer part, for a given position, result will be the average
of values found in the parents. If result is not an integer value, it will be approximated until
closer value at random in mutation process, chromosome structure is modified. This change is
performed at random, but there is a difference between binary and integer part. The GA was able
to improve the quality of the randomly generated population very fast, and created good
solutions in a very short time. In the selection of individuals for recombination, selection of a
leader uniformly at random is required. The next step is to choose which one of the three
supporters will take part in the recombination. This choice is also uniformly at random.
Following this selection strategy, any pair of parents will belong to the same cluster. That makes

Page 59
the population act similarly to a multiple-population approach with a high migration rate. After
the parents were selected, following the criterion described before, they are utilized as input
parameters in the recombination operator. The recombination returns a new individual the
offspring. Since the chromosome is composed of two distinct parts, they should be treated
separately during the recombination process. The mutation operator aims to add diversity to the
population of individuals. Similarly to the crossover, the mutation is divided into two parts.
The first is modifies the binary portion of the chromosome by choosing a position of the
individual at random. The second part acts on the integer values by adding or subtracting a unity
from its value. The choice of whether to add or subtract is also decided at random. Mutation is
applied to 10% of the offspring. In general, higher mutation rates may slow down evaluation
speed and hence should be avoided. After recombination and mutation, GA submits all or some
of the new individuals to a local search procedure for the purpose of improving their fitness
function. This local search acts at the first part of the chromosome, i.e., trying to improve
capacitor location. If a specific location already has a capacitor, the local search tests the
possibility of dropping that capacitor (‗drop‘). In case of deterioration of the solution, the
position returns to the original value and the local search proceeds to the next one. This local
search acts on the second part of the chromosome. It adjusts the sizes of the capacitors already
present in the solution, trying to find the best size for each location. Only the sizes immediately
above and below the present capacitor‘s size are tested [45].
Calculation of the power losses requires the execution of a load-flow algorithm. The objective of
optimal capacitor placement is to minimize the cost of the system. This cost is measured in four
ways:
1. Fixed capacitor installation cost
2. Capacitor purchase cost
3. Capacitor bank operating cost (maintenance and depreciation)
4. Cost of real power losses
4.2. Optimal Capacitor Placement
The majority of power systems operate at a lagging power factor due to inductive loads and
delivery apparatus (lines and transformers). Power systems are inductive in nature, and require
additional reactive power flow from the power grid. But excessive reactive power demands
result in reduced system capacity, increased losses, and decreased voltage, as well as higher

Page 60
operating costs. Shunt capacitor banks are able to compensate for VAR requirements, but bank
size, location, the capacitor control method, and cost considerations are important issues that
need to be optimized during the design phase. An ideal solution would be a capacitor placement
tool able to weigh all these factors and that considers load levels. This solution should also be
able to place capacitors for voltage support and power factor correction, while minimizing the
total cost of installation and operation. ETAP now provides just such an application in its
Optimum Capacitor Placement (OCP) module [46].
As described in the IEEE Standard 1036-1992 (IEEE Guide for Application of Shunt Power
Capacitors), the purposes of shunt capacitor applications are:
Table 4.1: Application of capacitor bank
Purpose Benefits
Var support
Yields a primary benefit for transmission systems and a
Secondary benefit for distribution systems.
Voltage control
Yields a primary benefit for both transmission and
Distribution systems.
System capacity
increase
Yields a secondary benefit for transmission systems and a
Primary benefit for distribution systems.
System power loss
reduction
Yields a secondary benefit for transmission systems and a
Primary benefit for distribution systems.
Billing charge
reduction
Does not apply to transmission systems, but yields a
primary Benefit for distribution systems.
To place shunt capacitors in power systems, it is necessary to:
1. Determine bank size in KVAr
2. Determine connection location
3. Determine a control method
4. Determine a connection type (wye or delta)
The capacitor size and the appropriate location for voltage support and power factor correction
can be determined in different ways. A common method applies ―rules of thumb‖ techniques,
and then runs multiple load flow studies to fine-tune the size and location. Unfortunately, this
method may not yield the optimal solution. And it can also be very time consuming and
impractical for large systems. It is also important to minimize cost, while mathematically
determining the capacitor size and location. Because this is an optimization issue, an
optimization approach should be employed. This is where the ETAP OCP module excels. It is an
Page 61
extremely powerful simulation tool specifically designed for this application. The OCP module
allows you to place capacitors for voltage support and power factor correction while minimizing
total cost. The advanced graphic interface provides the flexibility to control the capacitor
placement process, while allowing you to view the results instantly. The precise calculation
approach automatically determines the best location and bank sizes. In addition, it reports the
branch capacity release and savings during the planning period due to var loss reduction [46]. Optimal Capacitor Placement module in ETAP consist,
Optimal location & bank size
Minimize installation & operation costs
Individual source or average energy cost
Voltage & power factor objectives
Minimum, maximum, & average loading
Branch capacity release & cost savings
Review capacitor impact on the system
Capacitor control method To place shunt capacitors in power systems
The capabilities of the OCP module are summarized below:
Key Features
Calculate the most cost-effective installation locations and best bank size
Minimize total installation and operation cost
Consider voltage support and power factor correction
Evaluate Capacitor control method
Allow review of capacitor impact on the system
Employ most advanced optimum techniques
Flexible Operation
Show available locations
Apply user-selected load categories
Utilize individual and global constraints
Handle unlimited network configurations
Use only user selected installation locations
Constrain maximum capacitors installed at a location to user specified quantity

Page 62
Capability
Advanced graphic user interface
User friendly input and output
Instantly view new capacitors
Speed and precision control
Integrated load flow results
Standard Crystal reports
Plotting
Loss reduction savings during the planning period
Capacitor operation cost during the planning period
Profit during the planning period
Reporting
Capacitor properties
Capacitor locations and sizes
Load flow results for maximum, average and minimum loads
Branch capacity release
Cost summary
4.2.1. Calculation Method using ETAPs
ETAP currently utilizes the genetic algorithm for optimal capacitor placement. The genetic
algorithm is an optimization technique based on the theory of natural selection. A genetic
algorithm starts with a generation of solutions with wide diversity to represent characteristics of
the whole search space. By mutation and crossover, good characteristics are selected and carried
to the next generation. The optimal solution can be reached through repeated generations. OCP
uses the present worth method to perform alternative comparisons. It considers initial installation
and operating costs, which include maintenance, depreciation, and loss reduction savings [47].
4.2.1.1. Objective Function of OCP
The objective of optimal capacitor placement is to minimize the cost of the system [47]. This
cost is measured in four ways:
Fixed capacitor installation cost
Capacitor purchase cost
Capacitor bank operating cost (maintenance and depreciation)

Page 63
Cost of real power losses
Cost can be represented mathematically as:
MIN F(x,u) ∑ ( XiC01 + QciC1i +BiC2iT) + C2∑ (
TlPlL)......................................4.1
N bus => Number of bus candidates
Xi -0/1 => 0 means no capacitor installed at a bus i
C0i => Installation cost
C1i => Per KVar cost of capacitor banks
Qci => capacitor bank size in KVar
Bi => Number of capacitor banks
C2i => operating cost of capacitor bank ; per year
T => planning period (years)
C2 => cost of each kWh loss; in $/kwh
l => load levels ;maximum; average; minimum
Tl => Time duration; in hours; of load level l
PlL => Total system loss at load level l
4.2.1.2 Constraints
The main constraints for capacitor placement are to meet the load flow constraints. In addition,
all voltage magnitudes of load (PQ) buses should be within the lower and upper bars [48]. Load
Power Factor (PF) should be greater than the minimum. It may be a maximum power factor bar.
Load flow : F(x ; u) = 0
V min V Vmax ; PFmin PFmax for all PQ bus………………………….…….4.2
To simulate the distribution system, the following points has been considered as an inputs. In
order to analysis the problem of the existing adama substation system and put the mitigation
technique, simulations have been made under different scenarios.
To simulate the given system the following inputs are applied.
Distributions line parameters
Transformer ratings
Bus bar rating
Loads

Page 64
It is necessary to determine bank size in KVAr, determine connection location, determine a
control method and determine a connection type. The capacitor size and the appropriate location
for voltage support and power factor correction can be determined in different ways. A common
method applies ―rules of thumb‖ techniques, and then runs multiple load flow studies to fine-
tune the size and location Based on the investigation
Adama distribution feeder 1 has overload problems as result there existed voltage drop as
compared to the other feeders therefore study only focus on 15kV outgoing line-1 in order to
mitigate this under voltage problems.
Figure 4: 1 Single Line Diagram of Outgoing Line-1
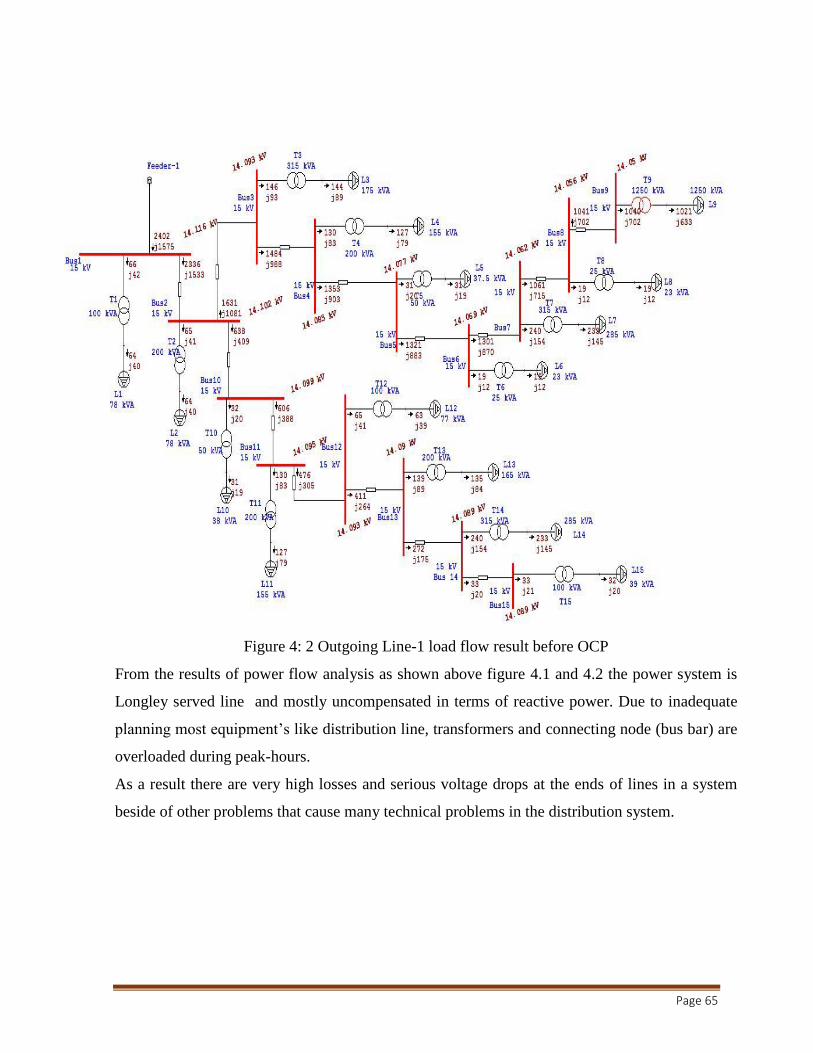
Page 65
Figure 4: 2 Outgoing Line-1 load flow result before OCP
From the results of power flow analysis as shown above figure 4.1 and 4.2 the power system is
Longley served line and mostly uncompensated in terms of reactive power. Due to inadequate
planning most equipment‘s like distribution line, transformers and connecting node (bus bar) are
overloaded during peak-hours.
As a result there are very high losses and serious voltage drops at the ends of lines in a system
beside of other problems that cause many technical problems in the distribution system.

Page 66
Table 4. 2: General load flow result before OCP for 2*25MVA power transformer
Study ID General Load flow
Study Case ID LF
Data Revision Base
Configuration Normal
Loading Category Design
Generation Category Design
Diversity Factor Normal Loading
Buses 179
Branches 178
Generators 0
Power Grids 1
Loads 63
Load-MW 37.434
Load-Mvar 29.507
Generation-MW 37.434
Generation-Mvar 29.507
Loss-MW 0.253
Loss-Mvar 4.201
The above table shows that the power transformer with a capacity values of 2*25 MVA
/135/15KV the average active and reactive value and its associated loss. The overall capacity
of the power transformer at a power factor 0.8 is about 40MW. It clearly indicates that the power
transformer is almost working at full capacity. As a result transformer heats up; the high
temperatures can gradually weaken the insulation system. The net result of small, incremental
increases in loading capacity over time is a weakened insulation system. Overloading causes
overheating, and eventually thermal degradation that acts through cracks in the insulation and
lead to transformer to be burned.
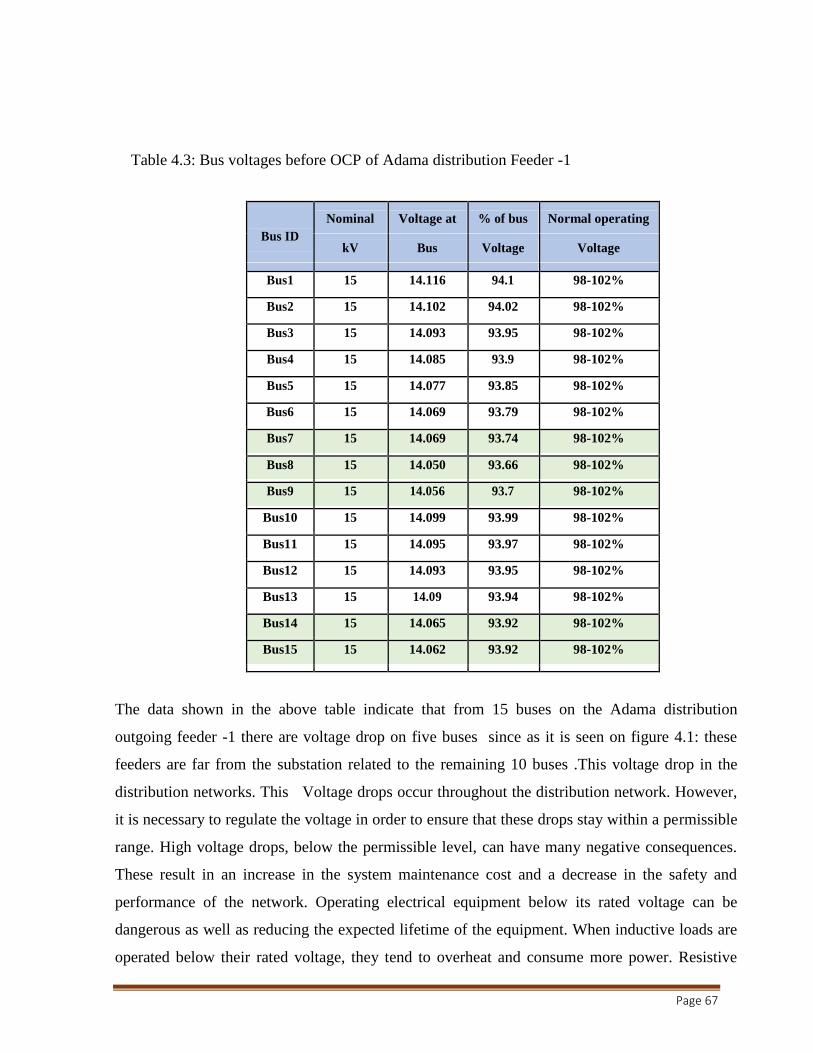
Page 67
Table 4.3: Bus voltages before OCP of Adama distribution Feeder -1
Bus ID
Nominal Voltage at % of bus Normal operating
kV Bus Voltage Voltage
Bus1 15 14.116 94.1 98-102%
Bus2 15 14.102 94.02 98-102%
Bus3 15 14.093 93.95 98-102%
Bus4 15 14.085 93.9 98-102%
Bus5 15 14.077 93.85 98-102%
Bus6 15 14.069 93.79 98-102%
Bus7 15 14.069 93.74 98-102%
Bus8 15 14.050 93.66 98-102%
Bus9 15 14.056 93.7 98-102%
Bus10 15 14.099 93.99 98-102%
Bus11 15 14.095 93.97 98-102%
Bus12 15 14.093 93.95 98-102%
Bus13 15 14.09 93.94 98-102%
Bus14 15 14.065 93.92 98-102%
Bus15 15 14.062 93.92 98-102%
The
The data shown in the above table indicate that from 15 buses on the Adama distribution
outgoing feeder -1 there are voltage drop on five buses since as it is seen on figure 4.1: these
feeders are far from the substation related to the remaining 10 buses .This voltage drop in the
distribution networks. This Voltage drops occur throughout the distribution network. However,
it is necessary to regulate the voltage in order to ensure that these drops stay within a permissible
range. High voltage drops, below the permissible level, can have many negative consequences.
These result in an increase in the system maintenance cost and a decrease in the safety and
performance of the network. Operating electrical equipment below its rated voltage can be
dangerous as well as reducing the expected lifetime of the equipment. When inductive loads are
operated below their rated voltage, they tend to overheat and consume more power. Resistive

Page 68
loads which are operated at a too low voltage will not be able to produce the desired output.
Reducing the voltage by 10% will reduce the power output by 19%, since power output
correlates to the voltage squared. A reduction in the network voltage can cause lights to flicker
when other appliances are turned on. Therefore voltage improvements mechanisms need to be
implement in the distribution network so as to avoid the effect of voltage drop in the network.
Thus this thesis tried to improve voltage profile by optimal placement of capacitor bank in the
Adama distribution network of based on the analytical investigation done in chapter three to
select the outgoing feeder that have a redundant voltage drop compared to the other remaining
feeders and through reliability assessment feeder one is selected .
As shown above Table 4.2 the result of power flow analysis of Adama town distribution system
the total load and power loss of the system is (37.434+j29.507) MVA and (0.253+j4.201) MVA
respectively.
To compensate the distribution line loss and to improve voltage profile we are applying optimal
capacitor placements for this works. From fifteen bus system select 9 candidate locations selects,
such as bus4, bus5, bus6, bus7, bus8, bus9, bus13, bus14, and bus15 as shown table 4.3 out of
nine minimum voltages occurs at bus-8.

Page 69
Fig 4.3: The load flow result After Optimal Capacitor Placement
From the result above figure 4.5 the optimal location s and size of the capacitors are bus-4 with
3000kVAr, bus-8 with 3000kVAr and bus-13 with 3000kVA a total 9000kVAr is installed this
distribution systems.

Page 70
Fig 4.4: load flow result after OCP

Page 71
Table 4.4: General load flow result after placement of capacitor bank
Study ID General load flow
Study Case ID LF
Data Revision Base
Configuration Normal
Loading Cat Design
Generation Cat Design
Diversity Factor Normal Loading
Buses 179
Branches 178
Generators 0
Power Grids 1
Loads 53
Load-MW 37.743
Load-Mvar 20.158
Generation-MW 37.743
Generation-Mvar 10.158
Loss-MW 0.137
Loss-Mvar 2.065
As shown in the table the result of power flow analysis after placement of capacitor bank in the
distribution feeder 1 of Adama distribution network indicates the reactive power reduction on the
overall system compared to the value in table 4.2: this reactive power reduction on the network
is useful to minimize power loss as compared to the value in the table 4.2: before placement of
capacitor bank in the network. The total active power losses along the distributors and
transformers are reduced by 45.849%. The increase in power factor, and the power losses
reduction was as a result of the reactive power being compensated by optimally placed capacitor
banks on the network. The leading reactive power injected into the network through the capacitor
bank partly neutralized the lagging reactive power of the network which reduced the excessive
lagging current drawn by the network inductive loads and subsequently reduced the losses in the
distribution apparatus (distribution lines and transformers)..
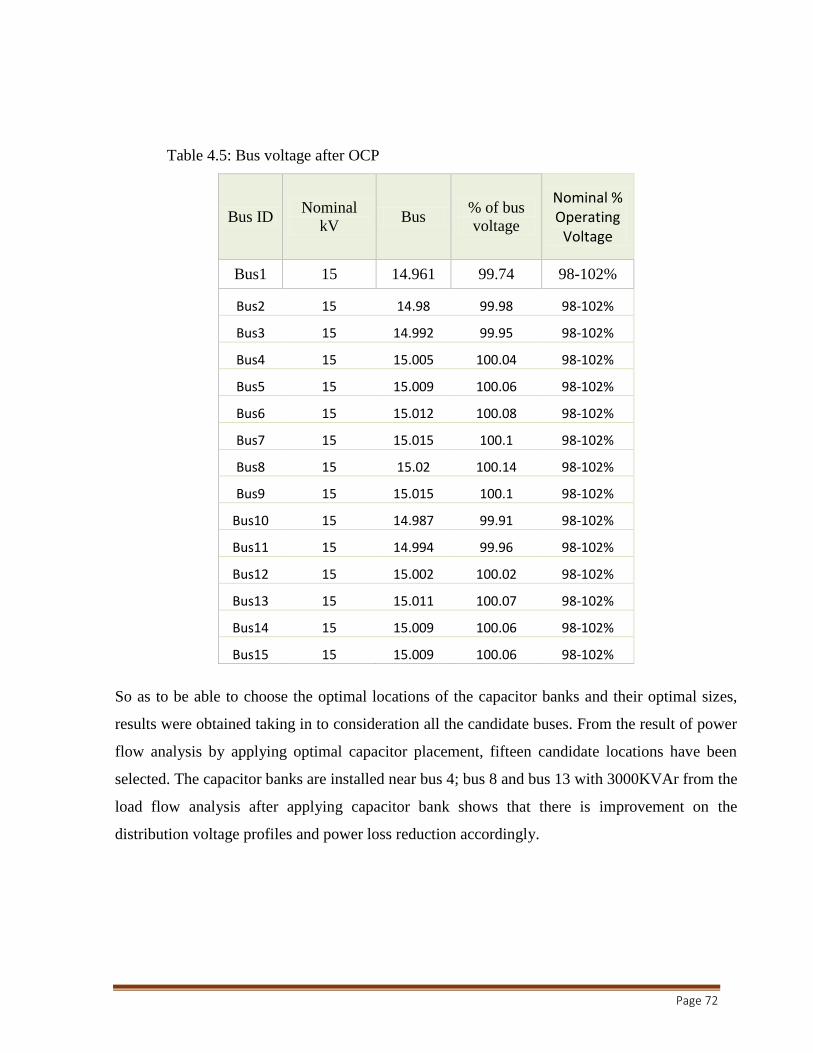
Page 72
Table 4.5: Bus voltage after OCP
Bus ID Nominal
kV Bus
% of bus
voltage
Nominal % Operating
Voltage
Bus1 15 14.961 99.74 98-102%
Bus2 15 14.98 99.98 98-102%
Bus3 15 14.992 99.95 98-102%
Bus4 15 15.005 100.04 98-102%
Bus5 15 15.009 100.06 98-102%
Bus6 15 15.012 100.08 98-102%
Bus7 15 15.015 100.1 98-102%
Bus8 15 15.02 100.14 98-102%
Bus9 15 15.015 100.1 98-102%
Bus10 15 14.987 99.91 98-102%
Bus11 15 14.994 99.96 98-102%
Bus12 15 15.002 100.02 98-102%
Bus13 15 15.011 100.07 98-102%
Bus14 15 15.009 100.06 98-102%
Bus15 15 15.009 100.06 98-102%
So as to be able to choose the optimal locations of the capacitor banks and their optimal sizes,
results were obtained taking in to consideration all the candidate buses. From the result of power
flow analysis by applying optimal capacitor placement, fifteen candidate locations have been
selected. The capacitor banks are installed near bus 4; bus 8 and bus 13 with 3000KVAr from the
load flow analysis after applying capacitor bank shows that there is improvement on the
distribution voltage profiles and power loss reduction accordingly.

Page 73
Table 4. 6: Comparison of terminal voltage before and after OCP
Bus ID Nominal
Kv
Terminal
Voltage
Terminal voltage
enhanced
after OCP
Voltage after before
OCP OCP
Bus1 15 14.116 14.961 0.845
Bus2 15 14.102 14.981 0.879
Bus3 15 14.093 14.992 0.899
Bus4 15 14.085 15.005 0.92
Bus5 15 14.077 15.009 0.932
Bus6 15 14.069 15.012 0.943
Bus7 15 14.062 15.015 0.953
Bus8 15 14.056 15.025 0.969
Bus9 15 14.056 15.015 0.959
Bus10 15 14.099 14.987 0.888
Bus11 15 14.095 14.994 0.899
Bus12 15 14.093 15.002 0.909
Bus13 15 14.093 15.011 0.918
Bus14 15 14.089 15.009 0.92
Bus15 15 14.116 15.009 0.893
Fig 4.5: Comparison of terminal voltage before and after OCP

Page 74
4.4. Results Based on Capacitor Placements
The method of loss reduction by capacitor placement was tested on portion of the distribution
system. The results obtained in this system are described as follows:-
The portion of adama town distribution system before OCP has a total load of (37.74+j29.507)
MVA and active and reactive power loss is 253 kW and 4,201 KVAr respectively. After
employing capacitor bank the power loss improved by 45.58% that is total load of
(37.74+j20.158) MVA and active and reactive power loss is 137 kW and 2,065 KVAr. The loss
reduced to by 116 kw and the voltage level at buses of the distribution feeder voltage profile is
improved by on average 5.99%. Therefore optimal capacitor placement in distribution network
of Adama outgoing feeder -1 made significant change regarding on power loss reduction and to
improve voltage level on each buses as stated below.
1. Bus 1 from 14.116 to 14.961 with a percentage increment of 5.63%
2. Bus 2 from 14.102 to 14.980 with a percentage increment of 5.86%
3. Bus 3from 14.093 to 14.992 with a percentage increment of 5.99%
4. Bus 4 from 14.085 to 15.005 with a percentage increment of 6.13%
5. Bus 5 from 14.077 to 15.009 with a percentage increment of 6.12%
6. Bus 6 from 14.069 to 15.012 with a percentage increment of 6.29%
7. Bus 7 from 14.062 to 115.015 with a percentage increment of 6.35%
8. Bus 8 from 14.050 to 15.020 with a percentage increment of 6.46%
9. Bus 9 from 14.056 to 15.015 with a percentage increment of 6.39%
10. Bus 10 from 14.099 to 14.987 with a percentage increment of 6.92%
11. Bus 11from 14.095 to 14.994 with a percentage increment of 5.99%
12. Bus 12 from 14.093 to 15.002 with a percentage increment of 6.06%
13. Bus 13 from 14.090 to 15.011 with a percentage increment of 6.12%
14. Bus 14 from 14.089 to 15.009 with a percentage increment of 6.13%
15. Bus 15 from 14.089to 15.009 with a percentage increment of 5.95%
From the above data after capacitor bank installed on the feeder -1 network near bus -4; bus 8
and bus 13 the average voltage profile improvement is about 6.10% with validating the voltage
constraint maximum level .thus the installing capacitor bank on feeder 1 of Adama distribution
network enhanced the under voltage problems and also reduce power loss in the system.

Page 75
4.5. Optimal Capacitor Placements Cost Summary
Table 4.7 :Cost summary
Cost($) Saving($)
Month
Supply &
Operation in
dollars ($)
Loss Monthly
Profit in
dollars ($)
Accumulation
Installation
($ dollars)
Reduction (in
dollars) Profit
1 290,700.00 900 15,928.05 275,671.95 275,671.95
2 0 900 15,928.05 15,028.05 260,643.90
3 0 900 15,928.05 15,028.05 245,615.85
4 0 900 15,928.05 15,028.05 230,587.80
5 0 900 15,928.05 15,028.05 215,559.75
6 0 900 15,928.05 15,028.05 200,531.70
7 0 900 15,928.05 15,028.05 185,503.65
8 0 900 15,928.05 15,028.05 170,475.60
9 0 900 15,928.05 15,028.05 155,447.55
10 0 900 15,928.05 15,028.05 140,419.50
11 0 900 15,928.05 15,028.05 125,391.45
12 0 900 15,928.05 15,028.05 110,363.40
13 0 900 15,928.05 15,028.05 95,335.35
14 0 900 15,928.05 15,028.05 80,307.30
15 0 900 15,928.05 15,028.05 65,279.25
16 0 900 15,928.05 15,028.05 50,251.20
17 0 900 15,928.05 15,028.05 35,223.15
18 0 900 15,928.05 15,028.05 20,195.10
0 900 15,928.05 15,028.05 5,167.05
Purchasing cost and installation for 9000KVAr is about 290700 USA dollars and its‘ operational
and maintenance cost per months is about 900 USA dollar.
Monthly saving in USA dollar is 15,928.05 with excluding of operational and maintenance cost.
Thus total monthly saving is 15,028.05 USA dollars.

Page 76
Rate of investment calculation
Total cost in Ethiopian Birr (taking currency rate 37Birr/$)
=Capacitor cost in USA Dollar *37
=291,600*37
=10,789,200
Therefore, power loss reduction due to capacitor placement is:
0.253MW - 0.137MW = 0.116MW
After capacitor placement total energy saved for one year is:
0.116MW *24hr/day*365days =1016.1MWH
Saving in terms of Ethiopian Birr is:
=1016.1MWH*1000(K/W) *0.58 (Birr/KWH)
=589,338 birr
= (589,338/
= $15,928.05) (taking currency rate 37Birr/$)
Return of investment (ROI) for capacitor placement is calculated as follows:
ROI= 10,789,200/589,338 =18.31 months
From this calculation the cost expenditure for capacitor installing and on the distribution system
returned after 18 months.

Page 77
CHAPTER FIVE
CONCLUSIONS, RECOMMENDATIONS AND FUTURE WORK
5.1. CONCLUSIONS
Minimization of distribution feeder loss due to optimum reactive power compensation in the
distribution networks is successfully achieved through identifying the optimal location and size
of capacitors. Optimal placement of shunt capacitor in the distribution system reduces the
current flows in each section of the feeder and hence the voltage drop in the section reduced.
Therefore the voltage profile is improved after the feeder line is compensated and the quality of
the supply is improved.
This thesis studies the existing power system of an area in Adama town distribution system
voltage profile of bus terminals. The method first finds a sequence of candidate buses to be
compensated through finding the highest loss saving by a single located capacitor. The proposed
method was tested on distribution system of Adama outgoing line-1. In the tested distribution
system it was found that by placing total 9000kvar, optimal capacitors at a location (bus-4, bus-8
and bus-13).
As results of the study shows an improvement of voltage profile at a bus terminal and also
minimize the line losses of the distribution systems. For examples voltage at bus-1is corrected
from 14.116kV to 14.961kV. Thus after implemented OCP the system voltage profile improved
by 6.10%.Conclusively, Optimal Capacitor Placement in Adama distribution network feeder -1
shows that placement of capacitor optimally in 15kv distribution network improve power quality
of a network.
5.2. RECOMMENDATION
In the present energy cries that is a society-wide economic problem caused by a constricted
supply of energy, leading to diminished availability and increased price to consumers,
implementing energy loss reduction techniques has a paramount effect in the development of
country socially and economically . capacitor for loss minimizations has a relatively low cost and
shorter return period than other methods and it is advisable to implement this method in
conjunction with other natural compensation methods such as phase balancing to satisfy the
increased load demand .distribution feeder having short length had lower line losses despite of

Page 78
higher reactive current flow . Therefore it is recommended to compensate the high reactive
power flow by the electric utility rather than company the consumers.
The repeated simulation results could be used to develop a model using any artificial
intelligence technique which can be accurately predict the location and size of capacitor
for any load conditions which gives a great promise for practical implementation of the
proposed technique.
The study focuses only improving weak voltage profile and power transfer capability of
the town, the impact of shunt capacitor to the rest system shall be examined.
Detail economical and technical analysis shall be done for future works.
5.3. Suggestions for Future Work
In this thesis the way of voltage profile improvement through active power loss reduction
method with proper application of reactive power sources to the system is discussed and
analyzed. However the method considers and the simulation has been done only for the peak
hour operations, when the system is heavy loaded. During the rest of the time load is decreased
and therefore the system is becoming able to transfer the needed power without overloading the
system components. Accordingly the losses are becoming lower. In such a case, when the loads
are lowered, the reactive power sources, which we applied to the system during the peak hour
operations, become excessive and their injected reactive power can cause even more losses and
destructive over voltages. Therefore it‘s very important the reactive power sources to be
properly operated and switched to the system only in case when they will be needed, i.e. during
the heavy loads of the system. Another issue to be considered is the transient on the system at
the moment of connecting reactive power sources on the system. As it is essential to apply the
reactive power sources to the system only during peak hours, the problem of transients becomes
urgent for consideration while planning the locations and sizing of reactive sources. The other
point is that the scope of this research is covered only on the optimal capacitor placement for
voltage profile improvement in Adama distribution system only feeder -1 due to COVID -19
epidemics constraints and therefore researcher should need to cover more feeders on this
regards.

Page 79
References
[1] E. P. office, "Feasibilitiy Study Report," Addis Ababa, January, 2007.
[2] EEU office ―Ethiopia electric utility strategic plan up to 2030 ―April 2019
[3] T.M. Krishna, N.V. Ramana, S. Kamakshaiah, A Novel Algorithm for the Loss Estimation
and Minimization of Radial Distribution System with Distributed Generation, 2013, pp.
1289 -1293.
[4] A. Aguila, J. Wilson, Technical and economic assessment of the implementation of measures
for reducing energy losses in distribution systems, in: IOP Conf. Ser. Earth Environ. Sci.,
vol. 73, 2017, 012018.
[7] K.M. Muttaqi, A.D.T. Le, M. Negnevitsky, G. Ledwich, An algebraic approach for
determination of DG parameters to support voltage profiles in radial distribution networks,
IEEE Trans. Smart Grid 5 (2014) 1351-1360.
[8] Intensive Programme ―Renewable Energy Sources‖, May 2011, UWB, CZ
[9] Anthony J. Pansini, E.E., P.E., Electrical Distribution Engineering 3rd Edition, CRC Press.
[10] Elmakias, New computational methods in power system reliability, volume 111, Springer-
Verlag Berlin Heidelberg, 2017
[11] Ulas Eminoglu, Ridvan Uyan, Reliability Analyses of Electrical Distribution System,
International Refereed Journal of Engineering and Science (IRJES), Volume 5, Issue 12
(December 2016), PP.94-102
[12] Intensive Programme ―Renewable Energy Sources‖, May 2011, UWB, CZ
[13] Ezeolisah, C. (July- December 2015). TCN Transmission News. In-House Journal of
Transmission Company of Nigeria, Vol. 4, 1-76
[14] R. I. Satrio, "Reduction Technique of Drop Voltage and Power Losses to Improve Power
Quality using ETAP Power Station Simulation Model," 2018.
[15] T. H. Chen, Examination of major factors affecting voltage variation on distribution,
National Taiwan University of Science and Technology.
[16] E. J. singh, "Real Time Study on Technical and non-technical Losses in Distribution System
and reduction techniques," international journal of innovative research in technology, 2018
[17] G. Kour, "Different Techniques of Loss Minimization in Distribution System," International
journal of enhanced research in science technology & Engineering, vol. 2, no. 2, 2013

Page 80
[18] S. Ahmed, Network Reconfiguration for Loss Reduction in Electrical Distribution System
Using Genetic Algorithm, Al-Azhar University, 2012
[19] M. Aman, "Optimum shunt capacitor placement in distribution system—A review and
comparative study," ELSEVIER, vol. 30, pp. 429-439, 2014.
[20] V. Vita, "The Impact of Distributed Generation in the Distribution Networks‘ Voltage
Profile and Energy Losses," IEEE, 2015.
[21] K. Satish, B. Sai, B. Tyagi and V. Kumar, "Optimal placement of distributed generation in
distribution networks," International Journal of Engineering, Science and Technology, vol.
3, pp. 47-55, 2011.
[21] S.Chaw and L. S. Pyone, Journal of Electrical and Electronic Engineering, vol. 3, no. 3, pp.
36- 41, 2015.
[22] Guerra G, Martinez-Velasco JA (2016) Optimum allocation of distributed generation in
multi-feeder systems using long term evaluation and assuming voltage-dependent loads.
Sust. Energy Grids Netw5: 13–26.
[23] Bill Glennon, Christina Kusch, and Elijah Nelson, -Improve Reliability and Power Quality
on Any System‖, Schweitzer Engineering Laboratories, Inc, Buenos Aires, Argentina,
September 24–26, 2018.
[23] S. T. Chavhan, C. Bhattar, P. V. Koli, and V. S. Rathod, ‗‗Application of STATCOM for
power quality improvement of grid integrated wind mill,‘‘ in Proc. IEEE 9th Int. Conf.
Intell. Syst. Control (ISCO), Jan. 2015, pp. 1–7.
[25] Ulas Eminoglu, Ridvan Uyan, Reliability Analyses of Electrical Distribution System,
International Refereed Journal of Engineering and Science (IRJES), Volume 5, Issue 12
(December 2016), PP.94-102.
[26] Akwukwaegbu I. O, Okwe Gerald Ibe ‗concepts of Reactive Power control and Voltage
Stability Methods in Power System Network‘Department of Electrical/Electronic
Engineering Federal University of Technology Owerri Imo State 2017.
[27] G. I. Akwukwaegbu I.O, "Concepts of Reactive Power Control and Voltage Stability
Methodes in Power System Netwurk," IOSR Journal of Computer Engineering (IOSR-
JCE), vol. 11, no. 2, p. 11, May-Jun. 2013.
[28] Arash Bashardoust, Meisam Farrokhifar, Amin Yousefzadeh Fard, Amin Safari, Ehsan
Mokhtarpour, -Optimum Network Reconfiguration to Improve Power Quality and
Reliability in Distribution System‖, Vol. 9, No. 4 (2016), pp.101-110.
Page 81
[29] Abeba B., Getachew Biru (Dr.-Ing.), Study of Distributed Generation in Improving Power
System Reliability ‖, AddisAbaba University Ethiopia, master‘s thesis, June 2016.
[30] Amache J., Dr. Getachew B. -Reliability assesment of radial distribution system with
distributed generation: (A case study of cottebe substations) ‖, Addis Ababa institute of
technology, Addis Ababa University, June 2016.
[31] A. Ahmed (Aug. 13, 2017). DC Power Supplies—Protection of Systems from
SurgesandTransients.[Online].Availablehttp://www.industrialelectronics.com/DC_pwr_9.ht
ml A Akhikpemelo, N. Eyibo, A. Adeyi, ―Reliability Analysis of Power Distribution
Network‖. Continental J. Engineering Sciences, 2016
[32] Azami, R. and Fard, A.F., ―Impact of demand response programs on system and nodal
reliability of a deregulated power system,‖ Sustainable Energy Technologies, IEEE
International Conference on, November 2015.
[32] R. I. Satrio, "Reduction Technique of Drop Voltage and Power Losses to Improve Power
Quality using ETAP Power Station Simulation Model," 2018.
[33] V. Vita, "The Impact of Distributed Generation in the Distribution Networks‘ Voltage
Profile and Energy Losses," IEEE, 2015.
[34] S.Chaw and L. S. Pyone, Journal of Electrical and Electronic Engineering, vol. 3, no. 3, pp.
36- 41, 2015.
[35] J. K. Charles, "Effects of Distributed Generation penetration on system power losses and
voltage profiles," International Journal of Scientific and Research Publications, vol. 3, no.
12, 2013.
[36] S. M. Banteywalu, "distribution system loss reduction in Addis Ababa north sub-station,"
International Conference on Innovations in Power and Advanced Computing Technologies,
2017.
[37] T. Manglani, "Voltage Profile Improvement in Radial Distribution System using Plant
Growth Simulation Algorithm," International Journal of Computer Science and
Management Research, vol. 2, no. 5, 2013.
[38] Bill Glennon, Christina Kusch, and Elijah Nelson, -Improve Reliability and Power
Quality on Any System‖, Schweitzer Engineering Laboratories, Inc, Buenos Aires,
Argentina, September 24–26, 2018.
[39] C.O.A. Reliability Analysis of power Distribution System ,Lecture Notes on Power Sytem
Analysis. 2010.
Page 82
[40] IEEE Std. 1127, ―IEEE Guide for the Design, Construction, and Operation of Safe and
Reliable Substations for Community Acceptance and Environmental Compatibility.‖
[41] IEEE Power and Energy Society, ―IEEE guide for electric power distribution reliability
Indices,‖ IEEE Standard 1366 (2016)
[42] IEEE, IEEE Guide for Electric Power Distribution Reliability Indices, New York:
IEEE Power & Energy Society, 2015
[43] International Energy Agency. World Energy Outlook 2016 Executive Summary;
International Energy Agency: Paris, France, 2016.
[44] L. Wright, Lee. A. -Mitigation of Undesired Operation of Recloser Controls Due to
Distribution Line Inrush‖, IEEE Rural Electric Power Conference, Asheville, North
Carolina, April 19-21, 2015.
[45] J. Carr, An Introduction to Genetic Algorithm, 2014.
[46] R. Srinivasas Rao, S.V.L. Narasimham and M. Ramalingaraju, "Optimal capacitor
placement in a radial distribution system using plant growth simulation
algorithm", Electrical Power and Energy Systems, vol. 33, pp. 1133-1139, 2011
[47] International Journal of Innovative Research in Advanced Engineering (IJIRAE) ISSN:
2349-2163 Issue 5, Volume 2 (May 2015).
[48] Meng Zhang, Optimal capacitor placement for distribution feeder maximum savings,
Electricity Distribution (CICED), 2012 China International Conference on Year: 2012 ,
Page(s): 1 – 4.
[49] Deepti Sharma and Amita Mahor, Optimal Placement of Capacitor in Radial Distribution
System Using Real Coded Genetic Algorithm, International Journal of Electrical,
Electronics ISSN No. (Online): 2277-2626 and Computer Engineering 2(2): PP:23-29 Year-
2013
[50] Yan Xu ; Zhao Yang Dong ; Kit Po Wong ; Liu, E. ; Yue, B. , Optimal Capacitor Placement
to Distribution Transformers for Power Loss Reduction in Radial Distribution Systems, Vol.
28 , Issue: 4 Year: 2013 , Page(s): 4072 - 4079
[51] J. K. Charles, system loss reduction and voltage profile improvement by optimal placement
and sizing of distributed generation (DG) using a hybrid of genetic algorithm (GA).
[52] S. S. K. N. T.N.Shukal, "Allocation of Optimal capacitor bank using GA for minimum
system losses in radial distrbution networks," International Journal of Engineering,
Science and technology, vol. 2, pp. 91-106, 2013.

Page 83
[52] Olamaei, J. ; Moradi, M. ; Kaboodi, T., A new adaptive modified Firefly Algorithm to solve
optimal capacitor placement problem, Electrical Power Distribution Networks (EPDC), 2013
18th Conference on Publication Year: 2013 , Page(s): 1 -6
[53] P. Chopade and M. Bikdash, "Minimizing cost and power loss by optimal placement of
capacitor using ETAP," in 2011 IEEE 43rd Southeastern Symposium on System Theory,
2011, pp. 24-29.
[54] A. Kumar and R. Bhatia, "Optimal capacitor placement in radial distribution system," in
2014 IEEE 6th India International Conference on Power Electronics (IICPE), 2014, pp.1-6.
[55] C. B. Ferreira and D. Gebbran, "Simulation and Analysis of Reactive Power Compensation
Methods in Presence of Solar Distributed Generation and Development of Optimal
Capacitor Placement and Sizing," UC Irvine, 2017.

Page i
Appendix A
ETAPs Load Flow Result
02.05.21
02.05.21

Page ii
02.05.21
02.05.21

Page iii
02.05.21
02.05.21

Page iv
02.05.21
02.05.21

Page v
02.05.21

Page vi
02.05.21