Embed Size (px)
Citation preview

Earth, Life & Social Sciences
Van Mourik Broekmanweg 6
2628 XE Delft
P.O. Box 49
2600 AA Delft
The Netherlands
www.tno.nl
T +31 88 866 30 00
TNO report
TNO 2016 R10735v2
Investigation into a Periodic Technical
Inspection test method to check for presence
and proper functioning of Diesel Particulate
Filters in light-duty diesel vehicles
Date 10 October 2016
Author(s) G. Kadijk
J.S. Spreen
P.J. van der Mark
Copy no 2016-TL-RAP-0100297306
Number of pages 63 (incl. appendices)
Number of
appendices
Sponsor Dutch Ministry of Infrastructure and the Environment
PO Box 20901
2500 EX THE HAGUE
The Netherlands
Project name In use compliance program for light-duty vehicles
Project number 060.14432
All rights reserved.
No part of this publication may be reproduced and/or published by print, photoprint,
microfilm or any other means without the previous written consent of TNO.
In case this report was drafted on instructions, the rights and obligations of contracting
parties are subject to either the General Terms and Conditions for commissions to TNO, or
the relevant agreement concluded between the contracting parties. Submitting the report for
inspection to parties who have a direct interest is permitted.
© 2016 TNO

TNO report | TNO 2016 R10735v2 | 10 October 2016 2 / 57
Samenvatting
Aanleiding
Om de uitstoot van roetdeeltjes terug te dringen, zijn moderne dieselauto’s uitgerust
met een roetfilter. Roetfilters zijn zeer effectief: een goed werkend filter vermindert
de uitstoot van roet met 95 tot 99%.
Roetfilters hebben in 2002 hun intrede gedaan op de Nederlandse markt voor
personenauto’s, en worden sinds 2007 grootschalig toegepast als gevolg van
fiscale stimulering. De Europese Euro 5 en Euro 6 normen hebben ertoe geleid dat
roetfilters inmiddels worden toegepast op alle nieuwe dieselpersonenauto’s (sinds
2011) en dieselbestelwagens (sinds 2012).
Een roetfilter kan verstopt raken of kapot gaan. Het filter moet dan worden
gereinigd of vervangen. Met name het vervangen van een roetfilter kan een
kostbare zaak zijn. Daarom kiezen autobezitters er soms voor om het filter te laten
verwijderen. Ook wordt het verwijderen van een roetfilter aangeboden als onderdeel
van chip-tuning van voertuigen. Uit in 2014 uitgevoerd onderzoek van TNO en de
RDW blijkt dat bij circa 5 tot 7% van de dieselpersonenauto’s met een affabriek
roetfilter het filter verwijderd of defect was.
Met de huidige APK is het niet mogelijk om vast te stellen of een goed werkend
roetfilter aanwezig is. Moderne dieselvoertuigen met roetfilter worden op uitstoot
gecontroleerd door het uitlezen van het On-Board-Diagnostics-systeem (OBD).
Omdat bij het fysieke verwijderen van het roetfilter het roetfilter ook wordt
‘weggeprogrammeerd’ in de software van de auto, wordt een verwijderd roetfilter in
de OBD-controle niet opgemerkt.
Als bij de OBD-uitlezing foutcodes worden aangetroffen, moet een roetmeting
worden uitgevoerd. Deze roetmeting is echter al decennia oud. De bijbehorende
limieten voor de roetuitstoot zijn dermate ruim dat alleen (oude) dieselauto’s met
een zeer hoge uitstoot worden afgekeurd. Dieselauto’s met een defect of verwijderd
roetfilter voldoen in de regel aan deze test.
Controle op verwijderde roetfilters in de APK kan alleen als de eisen strenger
worden en een nieuwe, meer nauwkeurige testmethode wordt ingevoerd. Als geen
roetfiltertest in de APK wordt ingevoerd, kan dit tot gevolg hebben dat bij een
aanzienlijk deel van de dieselauto’s het roetfilter wordt verwijderd om
onderhoudskosten uit te sparen.
Doel
In opdracht van het Ministerie van Infrastructuur en Milieu heeft TNO daarom een
verkennend onderzoek uitgevoerd naar de wijze waarop in de toekomst in de APK
kan worden gecontroleerd of een goed werkend roetfilter aanwezig is. In het
onderzoek is niet alleen gekeken naar aanpassingen van de nu gebruikte methode,
de roetmeting, maar is ook onderzoek gedaan naar nieuwe meetmethoden en
limietwaarden.

TNO report | TNO 2016 R10735v2 | 10 October 2016 3 / 57
Aanpak
TNO heeft in het verkennend onderzoek vier meetmethodes onderzocht:
1 Als indicatieve test een veegtest voorafgaand aan elke meting, om een indruk
te krijgen van de zwarting in de uitlaat;
2 De nu bestaande conventionele roet- of opaciteitsmeting bij vrije acceleratie
van de bedrijfswarme motor, uitgevoerd met:
a. een conventionele of ‘standaard’ roet- of opaciteitsmeter, én;
b. een moderne, ‘verbeterde’ roet- of opaciteitsmeter, met een hogere
nauwkeurigheid dan de oude meters.
De daarbij gemeten grootheid is de opaciteit of roet- of rookwaarde uitgedrukt
in m-1
. Bij vrije acceleratie wordt het gaspedaal maximaal ingetrapt, en wordt de
maximale rookemissie gemeten;
3 een meting van het aantal deeltjes (Particle Number of PN) bij een
bedrijfswarme motor en stationair toerental in de uitlaatgassen met behulp van
een deeltjesteller. Dit is een meetmethode die momenteel niet in de APK wordt
toegepast.;
4 als indicatieve test een doekjestest bij voertuigen die daar op basis van de
voorgaande metingen aanleiding toe gaven, om te beoordelen of een voertuig
bij 3 minuten stationair draaien op een papieren tissue zwarting veroorzaakt.
In totaal zijn gedurende het onderzoek 213 Euro 5 en Euro 6 dieselvoertuigen
gemeten. De voertuigen zijn beschikbaar gesteld door diverse lease- en
garagebedrijven in Nederland.
Conclusies
Op basis van de metingen aan de 213 dieselvoertuigen, concludeert TNO per type
meting als volgt:
1 de veegtest is niet geschikt om in de APK vast te stellen of het roetfilter
aanwezig is of goed functioneert. Hoewel een schone uitlaat een goede
indicatie is voor een goed werkend roetfilter, kan van een zwarte, vervuilde
uitlaat niet met zekerheid worden gesteld dat het filter niet goed functioneert of
afwezig is. Dit komt met name omdat niet bekend is over welk tijdsspanne de
vervuiling in de uitlaat is afgezet. Ook kan de vervuiling, in plaats van door
roetemissies uit de motor, andere oorzaken hebben, zoals bijvoorbeeld
olielekkage. Bovendien kan deze test makkelijk worden gemanipuleerd door
voor de APK de uitlaat schoon te maken.
2 de opaciteitsmeting bij vrije acceleratie, uitgevoerd met:
a. de standaard opaciteitsmeter is niet geschikt om in de APK vast te
stellen of het roetfilter aanwezig is of goed functioneert. Deze apparatuur
is te onnauwkeurig en te ongevoelig om de lage roetemissies van
moderne Euro 5 en Euro 6 dieselwagens te meten;
b. de verbeterde opaciteitsmeter is een van de opties om in de APK
vast te stellen of een roetfilter aanwezig is of goed functioneert.

TNO report | TNO 2016 R10735v2 | 10 October 2016 4 / 57
Voordelen
Met zijn hogere nauwkeurigheid dan de standaard opaciteitsmeter is de
moderne opaciteitsmeter beter in staat ook bij de lage roetemissies van
moderne diesels onderscheid te maken tussen een auto met goed
functionerend roetfilter en een auto met een defect of verwijderd
roetfilter. Daarbij moet worden opgemerkt dat ook bij de verbeterde
rookmeter nog altijd onderin het bereik wordt gemeten, waardoor het
discriminerend vermogen van deze meter ten opzichte van de
deeltjesteller kleiner is. De prijs van opaciteitsmeters is echter wel lager
dan de huidige prijs van deeltjestellers.
Nadelen / verder onderzoek
Metingen met opaciteitsmeter vinden plaats in een vrije acceleratietest.
Deze test veroorzaakt veel geluidsoverlast en is relatief lastig uit te
voeren. Voor het vaststellen van een adequate grens-rookwaarde is
aanvullend onderzoek nodig naar de correlatie tussen rookwaardes in de
APK en de emissielimieten voor fijnstof gesteld in de typegoedkeuring.
Verder is er op dit moment onvoldoende inzicht in de filtering van de
electronische meetsignalen van rookmeters.Toepassen van filtering leidt
tot een reductie van de meetwaarden met een factor 2 a 3. Het is op dit
moment onvoldoende duidelijk waarop deze filtering is gebaseerd. TNO
baseert zich in dit onderzoek op de ongefilterde meetsignalen van de
geteste opaciteitsmeter, mede vanwege het feit dat de leverancier TNO
heeft geadviseerd ongefilterde waarden te meten om een goede
vergelijking met de deeltjesteller mogelijk te maken;
3 de meting van het aantal deeltjes in uitlaatgas met behulp van een
deeltjesteller bij stationair toerental is een van de opties om in de APK vast
te stellen of het roetfilter aanwezig is en goed functioneert.
Voordelen
De deeltjesteller levert de beste resultaten. Dit type meter heeft een significant
beter onderscheidend vermogen dan de verbeterde rookmeter. Bovendien kan
een meting met een deeltjesteller bij stationair toerental worden uitgevoerd. De
monsternameslang van de deeltjesteller wordt gedurende korte tijd in de uitlaat
van de auto gehouden. De methode is hierdoor zeer snel. Doordat de meting
van het aantal deeltjes niet bij vrije acceleratie van de motor hoeft te worden
uitgevoerd, is deze methode minder belastend voor de auto en de keurmeester.
Uit technisch en arbotechnisch oogpunt heeft de meting met een deeltjesteller
dan ook de voorkeur boven de verbeterde opaciteitsmeter. Een ander voordeel
is dat deze meting minder eenvoudig te manipuleren is dan de opaciteitsmeting.
Nadelen / verder onderzoek
De gebruikte apparatuur is niet specifiek ontwikkeld voor toepassing in de APK
en is nog relatief duur.
4 de doekjestest is niet geschikt om in de APK vast te stellen of het roetfilter
aanwezig is of goed functioneert. Niet in alle gevallen laten auto’s waarvan het
doekje grijs of zwart kleurt ook een hoge opaciteitswaarde en hoge
deeltjesaantallen zien. Auto’s met een schone tot licht verkleurde doek laten
daarentegen in 21 van de 63 gevallen verhoogde deeltjesaantallen zien en in 7
van de 63 wagens een verhoogde opaciteit.

TNO report | TNO 2016 R10735v2 | 10 October 2016 5 / 57
Aanbevelingen
Ten aanzien van de twee hierboven genoemde opties om in de APK vast te stellen
of een roetfilter aanwezig is en goed functioneert, doet TNO de volgende
aanbevelingen:
Voor beide testmethodes, de deeltjes- en de opaciteitsmeting, is in het rapport
voor drie verschillende grenswaarden aangegeven welk percentage voertuigen
van de geteste vloot in de APK zou worden goedgekeurd. Voor het
daadwerkelijk toepassen in de APK verdient het aanbeveling onderzoek te doen
naar de correlatie tussen enerzijds deeltjesaantallen (PN) in [#/cm3] zoals
gemeten met de deeltjesteller en opaciteit gemeten in [m-1
] én anderzijds de
deeltjesmassa (PM) in [g/km] en deeltjesaantallen (PN) in [#/km] zoals
gemeten in de typegoedkeuringstest.
Voor beide meetmethodes moeten de mogelijkheden voor doorontwikkeling en
prijs in nauwe samenwerking met onder meer de RDW en leveranciers van de
meetapparatuur verder worden onderzocht. Daarbij is het van belang te zorgen
voor goede kalibratiemethoden, om de apparatuur bij de garagebedrijven te
kunnen ijken.
Voor goede toepassing van de opaciteitsmeting moet de wijze van filtering van
de rookwaardes verder worden onderzocht. Er dienen criteria voor de filtering
van de meetsignalen te worden onderzocht en gedefinieerd.
Verwacht wordt dat de deeltjesteller niet kan worden ingezet bij een APK-test
van dieselvoertuigen zonder roetfilter. Voor deze voertuigen wordt aanbevolen
om gebruik te blijven maken van de huidige APK testprocedure voor roetmeting.
Welke meetmethode hiervoor zal worden toegepast, hangt voor een belangrijk
deel af van de kosten voor garagebedrijven en keuringsstations. In dit rapport is
een beknopte berekening uitgevoerd waaruit blijkt dat de kosten van een APK-
test met een deeltjesteller bij een groot aantal testen per jaar vergelijkbaar zijn
met een APK-test met een opaciteitsmeting; om een afgewogen besluit te
kunnen nemen over invoering dient dit nader te worden onderzocht.
Het is een gebruikelijke praktijk om bij oudere dieselauto’s zonder filter de APK-
rooktest te manipuleren door speciale additieven of benzine aan de diesel toe te
voegen. Tegenwoordig is er ook fischer tropsch diesel zoals GTL beschikbaar
waarmee de rookemissie kan worden teruggebracht. Verder onderzoek is nodig
naar het effect van deze (manipulatie-)mogelijkheden op de meetresulaten van
de verbeterde rookmeter en de deeltjesteller.

TNO report | TNO 2016 R10735v2 | 10 October 2016 6 / 57
Extended summary
Background
Wall flow diesel particulate filters (DPFs) are a very effective means to reduce
emissions of soot particles in the exhaust gases of diesel cars. In 2002, diesel
particulate filters made their appearance on the Dutch market for passenger cars
and diesel particulate filters are used on a large scale since 2007, due to a fiscal
stimulus. European Euro 5 and Euro 6 standards have meant that DPFs are now
being applied to all new passenger diesel cars (since 2011) and diesel vehicles
(since 2012). However, in 2014, research conducted by TNO and RDW shows that
for approximately 5 to 7 % of diesel passenger cars with an DPF, the particulate
filter was removed or defect.
It is known that possible losses in filtration efficiency or removal of DPF’s
significantly affect real-world PM emissions [2]. In first studies [3,4] at least 21 of the
355 assessed Dutch vehicles with a DPF (6%) showed elevated smoke emissions
with a k-value higher than 0,3 m-1
. This indicates that the DPF’s of these vehicles
were either damaged or removed. The collection of measuring data was performed
by many stakeholders in different workshops with different smoke meters, this
yields a certain inaccuracy in the test results. Consequently, on basis of the
collected data, an accurate determination of a smoke emission limit value for a PTI
test is not possible. Therefore an additional test program was required.
Aim and approach
The Ministry of Infrastructure and the Environment asked TNO to investigate test
methods and to obtain more reliable smoke emission data as a basis for
determination of a smoke emission limit value for periodic technical inspections
(PTI) and to start new research regarding PN measurements of diesel vehicles with
a DPF. In this report the results of this project are described.
Within this project 213 light-duty vehicles with diesel particulate filters were tested
by TNO using different smoke test procedures. The vehicles were mostly Euro 5
class vehicles. All tests were performed by a fixed team of TNO employees to
assure the same type of handling procedures during all measurements and with a
defined set of instruments. The tests occurred in different vehicle maintenance
workshops and storage sites of lease companies in the Netherlands.
Apart from providing insight into the number of vehicles with increased PM and PN
emissions, the test results were also used to design and propose a new
roadworthiness smoke emission test procedure able to identify vehicles with a
malfunctioning or removed DPF. A new test procedure is required because
generally, the current roadworthiness test procedure is not able to identify such
failures.
All 213 light-duty vehicles were subjected to four different tests:
1 A tailpipe swipe test;
2 Free acceleration and high idle smoke emission test with two opacity meters;
3 Low idle speed emission test with a particulate number meter;
4 Tissue filter test at low idle speed.

TNO report | TNO 2016 R10735v2 | 10 October 2016 7 / 57
On the measurement of the number of particles in exhaust gases
Different methods exist to measure the number of particles in exhaust gas. In the
type approval test of vehicles, the particulate numbers are determined by means of
the official Particulate Measurement Programme (PMP) method, which quickly
dilutes and heats the exhaust gas, and strips it of the organic components. The
remaining solid particulates are limited to a size of 23 nanometer minimally. As of
Euro 5b, diesel passenger cars may not exceed the PN emission limit of 6,0*E11
per kilometer in the PMP test.
The handheld condensation particle counter (CPC) used in this project does not
remove volatile particles and it measures particles with a size down to 10
nanometer. The number of particles measured in this project is therefore likely to be
higher than the values encountered during type approval testing.
Conclusions
The results of the above tests lead to the following conclusions for roadworthiness
testing of diesel vehicles with diesel particulate filters (DPF):
Tailpipe Swipe Tests (TST) are not suited as an official PTI test because the
test result is not related to the actual condition of the DPF. The TST result can,
however, support the judgement of a DPF condition.
In very conditioned roadworthiness tests with 213 (mainly ex business use)
Euro 5 and 6 diesel vehicles, at least 12 vehicles (5.6%) showed elevated
smoke emissions (opacity value k > 0.10 m-1
). This indicates that the Diesel
Particulate Filters of these vehicles are either damaged or removed. If a smoke
emission limit value of 0.30 m-1
is applied only 3.3% of the vehicles fail. This
result is not in line with former failure rates of 6% of random selected vehicles.
Possibly the relatively low failure rate is caused by the relatively young and well
maintained test vehicles in this project. From the 5% highest emitting vehicles,
most vehicles are older than 48 months. This indicates that deterioration of
diesel particulate filters is related to DPF-age, supporting the need for DPF
testing in PTI’s.
In former research projects it was found that the current smoke emission test
procedure with an improved opacity meter was the best option because no
better alternative for PTI-purposes was available. However, after detailed
research in this project it must be stated that the current PTI test procedure is
not very accurate and can be manipulated. This is mainly caused by the poor
definition of the execution of the PTI emission test, the characteristics of the
dynamic test procedure, the undefined dynamic sample flow characteristics of
sample lines and the measurement techniques applied in (improved) opacity
testing. Moreover, with a measuring range of 0 to 10 m-1
, the screening
performance of improved opacity meters is unsufficient. Most vehicles with DPF
have opacity results that are significantly lower than 0.10 m-1
while reasonable
limit values are in the range of 0.10 - 0.20 m-1
.
Furthermore, the execution of free acceleration tests is not very comfortable
and tester friendly and evokes sometimes resistance with vehicle owners
because they think the engine is being overloaded during the test.
It is therefore concluded that opacity tests using improved smoke meters are
not preferred for detection of DPF failures. An opacity meter measures black
smoke by the principle of light absorption but particulates are not always black.
As a result, other particulates cannot be detected by an opacity meter. Due to

TNO report | TNO 2016 R10735v2 | 10 October 2016 8 / 57
the relatively low smoke emissions of a modern diesel engine itself (0.30 – 0.50
m-1
) and the very high filtration efficiency of a DPF, small DPF leakages can
hardly be detected by an opacity meter.
Within this project, alternative DPF tests were carried out with a handheld
Particulate Number (PN) tester at low idle engine speed with a hot engine. This
PN test procedure is relatively easy and one measurement takes only 15
seconds. It has a good screening performance and yields very robust test
results. Due to the clear and simple definition of the static test and the speedy
and accurate performance of the PN tester, manipulation is not very likely.
In low idle speed tests with a hot engine and a particulate number limit value of
250,000 particles per cm3, 8.5% of the vehicles failed.
Futher improvement of the PN tester may be realized by use of a water
separator and sample dilution system.
Figure 1 shows the PTI failure percentages of this fleet-under-test for the smoke
test using the standard and the improved opacity meters and for the test using
the PN counter.
From the test results with a standard opacity meter (blue bars) and a limit value
of 0.10 m-1
3,3% of the vehicles fail. This percentage increases to 5.6% with an
improved opacity meter (blue/white bars). Due to the very low opacity limit value
of 0.10 m-1
(1% of the full scale), the sensitivity, accuracy and stability of the
equipment around this value of 0.10 become very important. Furthermore, a
shortcoming is that these characteristics cannot be evaluated in the current
standard static calibration procedures of the smoke opacity meter. Seen from
this perspective, the reliability of the smoke emission test result is poor.
PN-tests (brown bars) allow a higher screening performance (because PN limit
values can be set from 50,000 – 250,000 #/cm3.
Figure 1: Percentages of DPF failures based on different test procedures and limit values
The costs of the measurement per PTI depend on the price and economic life time
of test equipment, yearly maintenance and calibration costs as well as labour time
per PTI test and the number of PTI’s executed per year. For an improved smoke
1,4% 1,4%
3,3% 3,3% 3,8%
5,6%
8,5%
12,2%
16,4%
0%
2%
4%
6%
8%
10%
12%
14%
16%
18%
Fa
ilure
perc
enta
ge [
%]

TNO report | TNO 2016 R10735v2 | 10 October 2016 9 / 57
meter of € 4000,- and a life time of five years and on the basis of 100-1000 PTI’s
per year, the estimated price per test is in the range of € 3.30 - €15.00. For a PN-
meter of € 10.000,- and a life time of 5 years and 100-1000 PTI’s per year the
estimated price per test is in the range of € 3.30 - € 28.50. Table 1 an overview and assessment of parameters of three different test methods is shown. Table 1: Overview assessment of parameters of three different test methods
Parameter Free Acceleration Free Acceleration Low idle
Standard Opacity Improved Opacity PN
Comment Current method Improved 1 ‘CITA’ Improved 2
Representativeness +/- +/- ++
Sensitivity, threshold -- +/- ++
Accuracy - + ++
Reliability +/- + ++
Screening performance -- - ++
Reproducability - - ++
Repeatability +/- +/- ++
Executibility +/- +/- ++
Costs + + +/-
Costs [€/test] 3.30 – 15.00 3.30 – 15.00 3.30 – 28.50
Test duration +/- +/- ++
Comfort for tester - - +
Acceptance vehicle owner +/- +/- ++
Maturity ++ + +
Limit values -- + ++
Limit values 0.7 m-1
0.10 m-1
250,000 #/cm3
Recommendations
In this project, smoke emission tests were performed with opacity meters as well as
with Particulate Number measurement equipment as a basis for the determination
of a(n) (smoke) emission limit value for periodic technical inspections (PTI). On
basis of the results, it is recommended to develop dedicated PN-meters for PTI
purposes because the results of the PN-test at low idle engine speed are very
robust and reflect the condition of the DPF. In order to avoid too high measured PN
concentrations sample dilution with a factor 10 is advised. With respect to the
measurement equipment, a cost saving can probably be reached by not
implementing a catalytic stripper which removes volatile fractions from the sample.
Furthermore it is recommended to develop a calibration procedure for PN-meters
that can be executed in a simple way by service personnel in the workshop.
It is expected that a new PN-meter cannot be applied for PTI’s of diesel engines
without DPF. For these vehicles it is recommended to stick with the current PTI
smoke emission test procedure.
In the past, PTI smoke emission tests were manipulated by adding special liquids or
petrol to the diesel tank to reduce smoke emission levels. In general currently it is
very hard to detect malfunctioning or removal of a DPF because smoke emissions
of modern engines are very low. In addition new fuels, like BTL and GTL, even
reduce smoke emissions with more than 50%. Therefore it is recommended to

TNO report | TNO 2016 R10735v2 | 10 October 2016 10 / 60
investigate the effects of such manipulation practices on the measurement results
of the improved smoke opacity meter and the PN-counter.

TNO report | TNO 2016 R10735v2 | 10 October 2016 11 / 60
Contents
Samenvatting ........................................................................................................... 2
Summary .................................................................................................................. 6
1 Introduction ............................................................................................................ 12 1.1 Background .............................................................................................................. 12 1.2 Objectives and approach ......................................................................................... 14 1.3 Project partners ....................................................................................................... 15 1.4 Structure of this report ............................................................................................. 15
2 Test programme ..................................................................................................... 16 2.1 Tested vehicles ........................................................................................................ 16 2.2 Test equipment ........................................................................................................ 17 2.3 Test Protocol ............................................................................................................ 21
3 Test results ............................................................................................................. 29 3.1 Vehicle ages and mileages ...................................................................................... 29 3.2 Tailpipe Swipe Test results ...................................................................................... 30 3.3 Opacity results of free acceleration tests................................................................. 31 3.4 Opacity results of high idle speed tests ................................................................... 33 3.5 Particulate number test results at low idle speed .................................................... 34 3.6 Tissue Filter Test results ......................................................................................... 35
4 Analysis of test results ......................................................................................... 38 4.1 Vehicle ages and test results of smoke and PN meters .......................................... 38 4.2 Suitability of Tailpipe Swipe Test ............................................................................. 40 4.3 Suitability of smoke emission tests with opacity meters .......................................... 40 4.4 Investigation into the effect of filter modes of the opacity meters ........................... 41 4.5 Suitability of emission tests with Particulate Number-meters .................................. 45 4.6 Relation between smoke and particulate number emissions .................................. 47 4.7 Suitability of Tissue Filter Test ................................................................................. 48 4.8 Pass and fail criteria ................................................................................................ 48 4.9 Overall assessment of test methods and limit values ............................................. 50
5 Cost estimates of different test methods and testers ....................................... 52
6 Overview and assessment of test methods ........................................................ 53
7 Conclusions ........................................................................................................... 54
8 Recommendations................................................................................................. 58
9 References ............................................................................................................. 59
10 Signature ................................................................................................................ 60
Appendices
A Tested vehicles B Cost estimates PTI DPF tests

TNO report | TNO 2016 R10735v2 | 10 October 2016 12 / 60
1 Introduction
1.1 Background
In order to decrease their particulate matter (PM) emissions, modern diesel
passenger cars are fitted with a Diesel Particulate Filter, or DPF. DPF’s are a very
effective means of reducing PM emissions: when functioning well, DPF’s are found
to be capable of reducing the PM emissions to practically zero. Since 2011, a PN
limit value for DPF-equipped vehicles is also applied (Euro 5b). The exact
determination of PM and PN emissions is however only possible on a chassis
dynamometer with a dilution tunnel. This sophisticated, expensive technique is not
available for everyday roadworthiness checks in service shops.
Figure 2 A deinstalled DPF, in this case originating from a Citroen C4 (left). Whereas DPF’s
vary in size and shape, the height of this DPF is approximately 20 cm; its radius is
about 10 cm. A DPF is installed in the exhaust pipe of the vehicle. The zoom-in at the
right clearly shows the channels designed to trap the particles.
In order to verify the smoke emission of vehicles in roadworthiness tests, a free
acceleration test was developed in which the peak smoke emission or opacity is
determined. In general, no correlation between PM/PN emissions and smoke
emission exists. Table 2 shows an overview of emission limit values.
Table 2 PM and PN emission limit values of light-duty diesel passenger cars.
Type approval
Emission
class
Entry into
force
Particle Mass limit value (PM) Particle Number limit value (PN)
[mg/km] [#/km]
Euro 1 1993 140 -
Euro 2 1996 80 -
Euro 3 2000 50 -
Euro 4 2005 25 -
Euro 5a 2009 5 -
Euro 5b 2011 4,5 6 * 1011
Euro 6b 2014 4,5 6 * 1011
Euro 6c 2017 4,5 6 * 1011

TNO report | TNO 2016 R10735v2 | 10 October 2016 13 / 60
In type approval and roadworthiness free acceleration tests, the smoke emissions
of diesel vehicles are determined with opacity meters with a so-called k-value,
which has a range of 0 - 10 m-1
. Due to production variation of diesel engines the
smoke emission in free acceleration tests also has a certain variation. Therefore, a
margin of 0.5 m-1
is added to the measured type approval smoke emission. For
example, an engine with a measured k-value of 0.4 m-1
will be registered with a
plate value of 0.9 m-1
. In roadworthiness tests the plate value of this vehicle is valid
and the measured smoke emission may not exceed a value of 0.9.
The maximum allowed smoke emission limit plate values are reported in Table 2.
Table 3 Maximum allowed smoke emissions of LD diesel vehicles in free acceleration tests
over the years.
Year Maximum allowed k-value [m-1]
With turbocharger 1980 3,0
Without turbocharger 1980 2,5
All diesel vehicles 2008 1,5
All diesel vehicles 2018 0,7
Diesel vehicles equipped with a DPF have very low smoke emissions, with k-values
typically not exceeding 0,05 m-1
. Consequently test equipment and test procedures
that are currently used in PTI1 testing are not capable of adequately assessing
these low smoke emission levels of modern DPF-equipped diesel vehicles.
Furthermore, the applied procedure for determination of the plate value does not
match the smoke emission levels of diesel vehicles with a DPF.
Little is known on the actual PM emissions of modern diesel cars in operation.
Moreover, there have been indications of DPF’s being removed or replaced by
dummies to avoid maintenance, cleaning or replacement costs. Also, in some case,
DPF’s are removed as part of chip tuning of the engine. In case of DPF removal,
the DPF is also ‘removed’ from the car’s software, so that DPF removal cannot be
detected in a PTI.
From an air quality perspective, it is important that the presence and proper
functioning of a vehicle’s DPF is adequately established during the car’s life.
Therefore, the Ministry of Infrastructure and the Environment asked TNO to collect
information on the performance of DPF’s in the Dutch car park and, based on this
information, to design a PTI test procedure that enables PTI inspectors to reliably
determine whether a DPF is present and functioning well.
In the past several research projects and field tests for the development of new
roadworthiness emission tests [1], [2], [3], [4], [5] were performed. Most of these
experiments were carried out with opacity meters in so called free acceleration or
increased engine idle speed tests. The overall conclusion of these experiments is
that diesel vehicles with DPF must be tested in roadworthiness tests or PTI’s by
means of a free acceleration test and with an improved opacity meter. CITA [5]
proposes a pass/fail limit k-value of 0.20 m-1
.
In these projects the collection of measuring data was performed by many
stakeholders in different countries with different smoke meters. This yields a certain
inaccuracy in the test results. Consequently, the determination of a limit value is not
1 PTI is a Periodic Technical Inspection or roadworthiness test

TNO report | TNO 2016 R10735v2 | 10 October 2016 14 / 60
very accurate. Moreover, if the limit value is set near 0.10 or 0.20 m-1
, the accuracy
of the test method and the quality of the measuring data become even more
important. In order to determine an appropriate and reliable (smoke) emission limit
value more controlled conditions of experiments are needed. In addition to former
research projects, a new Particulate Number (PN) test procedure is investigated in
this research and development project.
1.2 Objectives and approach
The objectives of the research presented here are:
1 to gather information on the particulate matter emissions of a large number of
in-use Euro 5 and Euro 6 diesel passenger cars, and, subsequently;
2 to advise on a new PTI procedure capable of detecting cars with a removed or
faulty DPF.
To this end, TNO performed opacity measurements using two types of opacity
meters or smoke meters. To get indicative results on the particulate number
emissions of the cars, tailpipe tests were performed using a handheld Condensation
Particle Counter. Additionally, a tailpipe swipe test was performed on all cars. Cars
that indicated poor results during the aforementioned tests were tested by means of
tailpipe tissue filter test.
All measurement equipment and supporting materials were placed in a van, thus
creating a mobile laboratory capable of performing measurements throughout the
Netherlands.
The tests were performed on a total of 215 diesel cars (24 trade marks). Test cars
were kindly made available by four large Dutch car lease companies and three car
shops. The measurements were carried out on the premises of these companies.

TNO report | TNO 2016 R10735v2 | 10 October 2016 15 / 60
Figure 3 The measurements were carried out on-site at various lease companies and car shops
using a ‘mobile laboratory’.
In order to create stable test results the measurements were carried out by a fixed
test team in January and February of 2016. In this project the team members had
defined and fixed tasks.
1.3 Project partners
As stated above, several lease companies and car shops were of great help in this
project. The cooperating companies gratuitously provided test cars and their
facilities. TNO thanks Arval BV, ALD Automotive, Business Lease Nederland B.V.,
Athlon, Vakgarage Van ‘t Hoog, Bovag Autobedrijf Alewijn Ott and Digicar
Engineering.
Apart from the participating companies, several others offered assistance as well.
TNO values very much the response of Autobedrijf Bloemberg B.V., Delsink Auto’s,
MAK Auto & Techniek, Herwersgroep, Automobielbedrijf Hooijer B.V., Autobedrijf
Bloemberg B.V. and other companies.
Additionally, TNO thanks the Dutch Association of Car Leasing Companies VNA
and BOVAG for reaching out to their members on behalf of TNO.
Finally, measurement equipment and assistance was kindly made available by TEN
Automotive Equipment and TSI / j.j. bos b.v..
1.4 Structure of this report
The test programme is described in chapter 2, after which chapter 3 presents the
test results. The results are further analysed in chapter 4. Cost estimates for two
different PTI test methods are given in chapter 5 and an overview and assessment
of test methods is presented in chapter 6. Conclusions and recommendations are
given in chapters 7 and 8.

TNO report | TNO 2016 R10735v2 | 10 October 2016 16 / 60
2 Test programme
2.1 Tested vehicles
As stated in the introduction, several car lease companies and car shops made test
cars available. Test cars provided by lease companies were ex-lease diesel
passenger cars, i.e. cars of which the lease term finished, and were offered for sale.
The test cars made available by car shops were used cars, also offered for sale.
As Table 4 shows, a total of 215 diesel cars were tested. The majority of the tested
cars were Euro 5 diesel passenger cars.
Table 4 The tested diesel vehicles, categorized by euro class and vehicle type.
Euro Class Passenger cars Light Commercial Vehicles Total
4 0 2 2
R* 6 0 6
5 196 7 203
6 4 0 4
Total 206 9 215
* Euro 4 cars fitted with a DPF
In this report, the two Euro 4 LCV’s are not taken into account as they are not fitted
with a DPF. Cars designated ‘Euro R’ by the Netherlands Vehicle Authority (“RDW”)
are Euro 4 cars fitted with a DPF to fulfil the Euro 5a particle emission limit of 5
mg/km. DPF’s at that time were not yet obligatory, but in anticipation of the Euro 5a
legislation car manufacturers introduced this technology about halfway the Euro 4
era. As the DPF technology in these ‘Euro R’ cars is identical to the DPF’s Euro 5
and 6 cars are equipped with, the passenger cars of ‘Euro R’ were included in this
project. All investigations of the test results are therefore based on 213 vehicles,
which are all equipped with a closed DPF.
Table 5 shows the odometer readings of the tested cars, categorized into six
odometer ranges.
Table 5 Odometer readings of the tested vehicles, excluding the Euro 4 LCV’s of Table 4.
Odometer [km] Passenger cars Light Commercial Vehicles Total
0 – 50,000 7 0 7
50,001 – 100,000 45 2 47
100,001 – 150,000 70 2 72
150,001 – 200,000 58 2 60
200,000 – 250,000 18 1 19
250,000 – 300,000 5 0 5
Unknown 3 0 3
Total 206 7 213

TNO report | TNO 2016 R10735v2 | 10 October 2016 17 / 60
2.2 Test equipment
TNO performed opacity measurements in free acceleration tests using two types of
opacity meters or smoke meters, the TEN EDA2 and the TEN LPA (Figure 4). The
particle number (PN) measurements were performed at idle engine speed using the
TSI 3007, a handheld Condensation Particle Counter (CPC, Figure 5, Figure 6)

TNO report | TNO 2016 R10735v2 | 10 October 2016 18 / 60
Figure 4 Opacity was measured using two types of opacity or smoke meters. The conventional
EDA2 (right), and the modern, more accurate LPA (left). Both smoke meters are
manufactured by TEN Automotive Equipment. As the picture shows, the in-line opacity
meters were inserted into the exhaust pipe simultaneously.
Figure 5 The particle number (PN) measurements were performed using the TSI 3007, a
handheld Condensation Particle Counter (CPC). A sample hose, connected to the
3007, was kept in the exhaust flow with the engine running at idle engine speed.

TNO report | TNO 2016 R10735v2 | 10 October 2016 19 / 60
Figure 6 The sample hose was kept in the exhaust pipe until the read-out stabilized.
Table 6 gives an overview of the technical specifications of the test equipment.
Table 6 Specifications of TEN EDA2 and LPA smoke meters and the TSI 3007 Condensation
Particle Counter used in this project.
Tester TEN TEN TSI
Name EDA2 LPA 3007
Principle Opacity (k) Opacity (k) PN counter
Measuring unit [m-1] [m-1] [#/cm3]
Measuring range 0 - 10 0 - 10 0 - 100,000
Maximum reading 10 10 100,000*
Resolution 0.01 0.001 1
Minimum measurement value 0.01 0.001 1
Size range [nm] n/a n/a 10 – 1,000
Applied measurement
frequency [Hz] 5 5 1
Accuracy [m-1, %] +/- 0.3 +/- 0.01 +/-20%
Response time T95 [s] n/a n/a 9
Sampling line Non heated Non heated No
Sample pump No No Yes
Sample flow [cm3/min] - - 700
* The measuring cell of the TSI PN meter is able to reliably detect up to 100,000 particles per cm3. PN
readings above 100,000 particles per cm3 are likely to underrepresent the actual number of particles as
the measuring cell can no longer distinguish all separate particles.
The EDA2 opacity meter has been on the market for several years now, and has a
limited resolution of 0,01 m-1
. It is currently used in PTItests to measure smoke
emissions of older diesel vehicles, and was therefore included in this project.
The LPA opacity meter is a newly developed opacity meter, with a much higher
resolution than that of the EDA2: 0,001 m-1
. Based on this resolution, it is thought

TNO report | TNO 2016 R10735v2 | 10 October 2016 20 / 60
the LPA might enable reliable opacity measurements on modern diesel cars and
that it might be able to identify cars with a missing or faulty DPF.
In order to prevent noise in the opacity measurements, opacity signals in periodic
technical inspections (PTI) are filtered. In a filtered mode, the opacity meters yield
less peaky and more stable readings. In the unfiltered mode, the opacity meters
respond more quickly and produce more accurate test results.
One of the sub goals of this project is to investigate if a correlation between PN
measurements and opacity measurements can be found. The PN meters are quite
fast and accurate meters. Given this fact and in consultation with the manufacturer
of the opacity meters, the opacity measurements in this project were carried out in
the unfiltered mode. This allows for a better comparison of particle emissions and
opacity. The data analysis in this project is mainly based on the test results of the
new, accurate LPA, data of which is referred to as “improved opacity” or “improved
opacity values”, and the TSI 3007 PN counter.
The measuring cell of the TSI PN meter is able to reliably detect up to 100,000
particles per cm3. As the number of particles exceeds 100,000 per cm
3, the
measuring cell is no longer able to ‘perceive’ all particles due to the fact that
particles start to cover other particles. This means that PN readings above 100,000
particles per cm3 are likely to show values that are lower than the actual PN
emissions. For example, when the PN meter reports 500,000 particles per cm3, the
real-world PN emissions are likely to be higher than 500,000 cm3. Although there is
no exact data available on the deviation between reported PN emissions and actual
PN emissions, this deviation grows with increasing numbers of particles. As a
further example: if car A has an emission of for example 250,000 particles per cm3,
and another car (B) has an emission of 400,000 particles per cm3, it is safe to say
that car B emits more than car A – although no exact emission level can be given.
The smoke meters were connected to a laptop and data was logged using
dedicated software. The TSI 3007 logs data internally, and test data was retrieved
from the device by connecting it to a laptop at the end of a measurement day.

TNO report | TNO 2016 R10735v2 | 10 October 2016 21 / 60
Figure 7 The smoke meters were connected to a laptop and data was logged using dedicated
software. The TSI 3007 logs data internally, and test data was retrieved from the
device by connecting it to a laptop at the end of a measurement day.
Additionally, a Tailpipe Swipe Test (TST) was performed on all cars. The tailpipe
swipe test was performed by swiping the end of exhaust pipe with a clean finger.
Cars that indicated poor results during the aforementioned tests were tested by
means of Tissue Filter Test (TFT). For this test, normal napkins were used.
2.3 Test Protocol
Whenever possible, participating car lease companies and car shops beforehand
shared the license plate numbers of the cars available for testing. Based on this,
TNO checked the Euro class and type fuel for these cars to establish the set of
vehicles to be tested. On the day of testing, the cars were localized and then
underwent the following test sequence:
1 Registration and check of the vehicle
2 Tailpipe Swipe Test (TST)
3 Engine warm-up
4 Free Acceleration tests (FA)
5 High Idle speed test (HI)
6 Low Idle speed test (LI)
7 Tissue Filter Test (TFT)
Using this well-defined test protocol for each vehicle allows for reliable test results
to be obtained.
2.3.1 Registration and check of the vehicle
Cars to be tested were photographed and their main characteristics were
registered. Cars were checked for damage and error codes on the dashboard. In

TNO report | TNO 2016 R10735v2 | 10 October 2016 22 / 60
case a car signalled error codes relevant to functioning of the DPF or the car
showed abnormal engine operation, the car was rejected for the test.
2.3.2 Tailpipe Swipe Test (TST)
The tailpipe swipe test is a very simple test, yielding a first impression of the
vehicle’s PM emission. The test allows the tailpipe to be checked for soot by simply
swiping it with a finger. The finger touches the inner tailpipe and swipes over a
small surface. In case of loose layers a finger or tissue will collect deposits, which in
most cases can be recognised as black soot.
The results were categorized into four groups or scores: clean or no darkening (0),
grey (1), black (2) and deep black (3). Clean tailpipes generally show no soot at all
and leave fingers absolutely clean, indicating a well-functioning DPF. In case of
heavily soiled tailpipes, a black, sticky and greasy layer of soot can be found. This
black soot may indicate a malfunctioning or removed DPF.
Figure 8 Example of two tailpipe swipe tests resulting in a deep black finger, scoring 3.
2.3.3 Engine warm-up
In order to prevent engine damage, free acceleration tests must be performed with
a hot engine. After having performed the tailpipe swipe test, the engine of the test
cars was therefore properly warmed up. As due to insurance matters the test cars
were not allowed to be driven off the companies’ premises and free space was
limited, the engines of the test cars were warmed up by letting them idle. Idling time
was at least 30 minutes and on average, cars had idled for almost 2 hours before
the tests were performed. In order to load the engines, the airconditioning and lights
were switched on to let the engine warm faster.
2.3.4 Free Acceleration test (FA)
In a free acceleration test, the accelerator pedal is depressed quickly (< 1 s) to
speed up the engine. Most engines emit measurable black smoke during a free
acceleration test, but, as the DPF almost completely filters smoke emissions,
opacity meters in use today normally measure a zero emission on modern diesel
vehicles with a DPF.

TNO report | TNO 2016 R10735v2 | 10 October 2016 23 / 60
In the free accerelation test, the probes of both smoke meters were inserted into
the tailpipe, in line with the exhaust flow (Figure 9). It is assumed that both meters
are charged with equal exhaust gas mixture.
Figure 9 The probes of the LPA and EDA2 opacity meters were both inserted into the tailpipe
during the free acceleration test and the high idle speed test. This way, both smoke
meters measured simultaneously. Also see Figure 4.
Figure 10 shows an example of an LPA opacity measurement on a high-emission
Euro 5 vehicle, with the LPA in the unfiltered mode. Its pattern is typical for an
opacity measurement: first, one or more high(er) peaks occur, which can be
associated with lubricating oil, soot or other substances still present in the exhaust.
Usually, during the first couple of free accelerations these remaining substances are
removed from the tailpipe, after which a more or less stable opacity value is found.
In this project, whenever possible, the final opacity value for a car was the average
smoke value of three stable opacity readings. In the example of Figure 10, the first
two peaks of 0,9 m-1
and 0,65 m-1
are associated with remaining pollution in the
exhaust pipe; the signal in the end stabilizes at three opacity readings of 0,4 m-1
.
Compared to most other Euro 5 vehicles measured, this car showed elevated
opacity.

TNO report | TNO 2016 R10735v2 | 10 October 2016 24 / 60
Figure 10 Example of opacity measurement of a Euro 5 diesel passenger car, measured during
a Free Acceleration test using the LPA opacity meter. This car shows elevated opacity
compared to most Euro 5 vehicles measured.
Figure 11 shows the results of a free acceleration test on a low-emission Euro 5
passenger car. This kind of low smoke values were frequently encountered for Euro
5 and Euro 6 cars during the measurement series. 52 of the tested cars had
average opacity values not exceeding 0,005 m-1
. In case of the vehicle in Figure 11,
opacity during the three accelerator operations even reached a value of 0.000 m-1
,
as the figure shows. With clean cars, the free acceleration tests cannot always be
easily discerned from the opacity measured in between free acceleration tests.
Therefore, opacity values were written down during testing. After performing the
experiments, opacity profiles were looked back to verify the results.
Figure 11 Example of opacity measurement of a Euro 5 diesel passenger car, measured during
a Free Acceleration test using the LPA opacity meter. This car shows low opacity
values, comparable to many of the tested Euro 5 and 6 vehicles.
0
0,1
0,2
0,3
0,4
0,5
0,6
0,7
0,8
0,9
1
11
:45:0
011
:45:0
111
:45:0
311
:45:0
511
:45:0
711
:45:0
911
:45:1
111
:45:1
211
:45:1
411
:45:1
611
:45:1
811
:45:2
011
:45:2
111
:45:2
311
:45:2
511
:45:2
711
:45:2
911
:45:3
011
:45:3
211
:45:3
411
:45:3
611
:45:3
811
:45:3
911
:45:4
111
:45:4
311
:45:4
511
:45:4
711
:45:4
811
:45:5
011
:45:5
211
:45:5
411
:45:5
611
:45:5
711
:45:5
911
:46:0
111
:46:0
311
:46:0
511
:46:0
611
:46:0
811
:46:1
011
:46:1
211
:46:1
4
Free acceleration test on a high-opacity Euro 5 diesel passenger car using LPA opacity meter in the unfiltered mode
0
0,001
0,002
0,003
0,004
0,005
0,006
14
:18:3
8
14
:18:4
2
14
:18:4
5
14
:18:4
9
14
:18:5
2
14
:18:5
6
14
:19:0
0
14
:19:0
3
14
:19:0
7
14
:19:1
1
14
:19:1
4
14
:19:1
8
14
:19:2
1
14
:19:2
5
14
:19:2
9
14
:19:3
2
14
:19:3
6
14
:19:3
9
14
:19:4
3
14
:19:4
7
14
:19:5
0
14
:19:5
4
14
:19:5
8
14
:20:0
1
14
:20:0
5
14
:20:0
8
14
:20:1
2
14
:20:1
6
14
:20:1
9
14
:20:2
3
14
:20:2
6
14
:20:3
0
14
:20:3
4
14
:20:3
7
14
:20:4
1
14
:20:4
4
14
:20:4
8
14
:20:5
2Free acceleration test on a low-opacity Euro 5 passenger
car using LPA opacity meter in the unfiltered mode

TNO report | TNO 2016 R10735v2 | 10 October 2016 25 / 60
2.3.5 High Idle speed test (HI)
After the free acceleration test, the engine speed was kept at high idle speed of
2500 rpm for approximately 10 seconds and the smoke emissions were registered
by both smoke meters.
Figure 12 High idle speed test on a Euro 5 vehicle, directly following a free acceleration test on
the same vehicle. In a high idle speed test, engine speed was kept at approximately
2500 rpm for 10 seconds.
Smoke emissions during high idle speed tests are generally lower than peak
emissions during free acceleration tests, as Figure 12 clearly shows. For the vehicle
at hand, smoke emissions during high idle testing are approximately 0,005 – 0,007
m-1
; two peaks occur at 0,02 and 0,025 m-1
(Figure 13).
Figure 13 Zoom-in on the high idle test of Figure 12, showing emissions of approximately
0,005 – 0,007 with two peaks of 0,02 and 0,025 m-1.
0
0,05
0,1
0,15
0,2
0,25
0,312
:08:5
0
12
:08:5
1
12
:08:5
2
12
:08:5
3
12
:08:5
4
12
:08:5
5
12
:08:5
6
12
:08:5
7
12
:08:5
8
12
:08:5
9
12
:09:0
0
12
:09:0
1
12
:09:0
2
12
:09:0
3
12
:09:0
4
12
:09:0
5
12
:09:0
6
12
:09:0
7
12
:09:0
8
12
:09:0
9
12
:09:1
0
12
:09:1
1
12
:09:1
2
12
:09:1
3
12
:09:1
4
12
:09:1
5
12
:09:1
6
12
:09:1
7
12
:09:1
8
12
:09:1
9
12
:09:2
0
12
:09:2
1
12
:09:2
2
12
:09:2
3
12
:09:2
4
12
:09:2
5
LPA opacity measurement of a Euro 5 vehicle: free acceleration test followed by high idle speed test
free
high idle
0
0,005
0,01
0,015
0,02
0,025
0,03
12
:09:1
4
12
:09:1
4
12
:09:1
4
12
:09:1
5
12
:09:1
5
12
:09:1
6
12
:09:1
6
12
:09:1
6
12
:09:1
7
12
:09:1
7
12
:09:1
8
12
:09:1
8
12
:09:1
8
12
:09:1
9
12
:09:1
9
12
:09:2
0
12
:09:2
0
12
:09:2
0
12
:09:2
1
12
:09:2
1
12
:09:2
2
12
:09:2
2
12
:09:2
2
12
:09:2
3
12
:09:2
3
12
:09:2
4
12
:09:2
4
12
:09:2
4
12
:09:2
5
12
:09:2
5
LPA high idle speed test on Euro 5 vehicle #78
TNO report | TNO 2016 R10735v2 | 10 October 2016 26 / 60
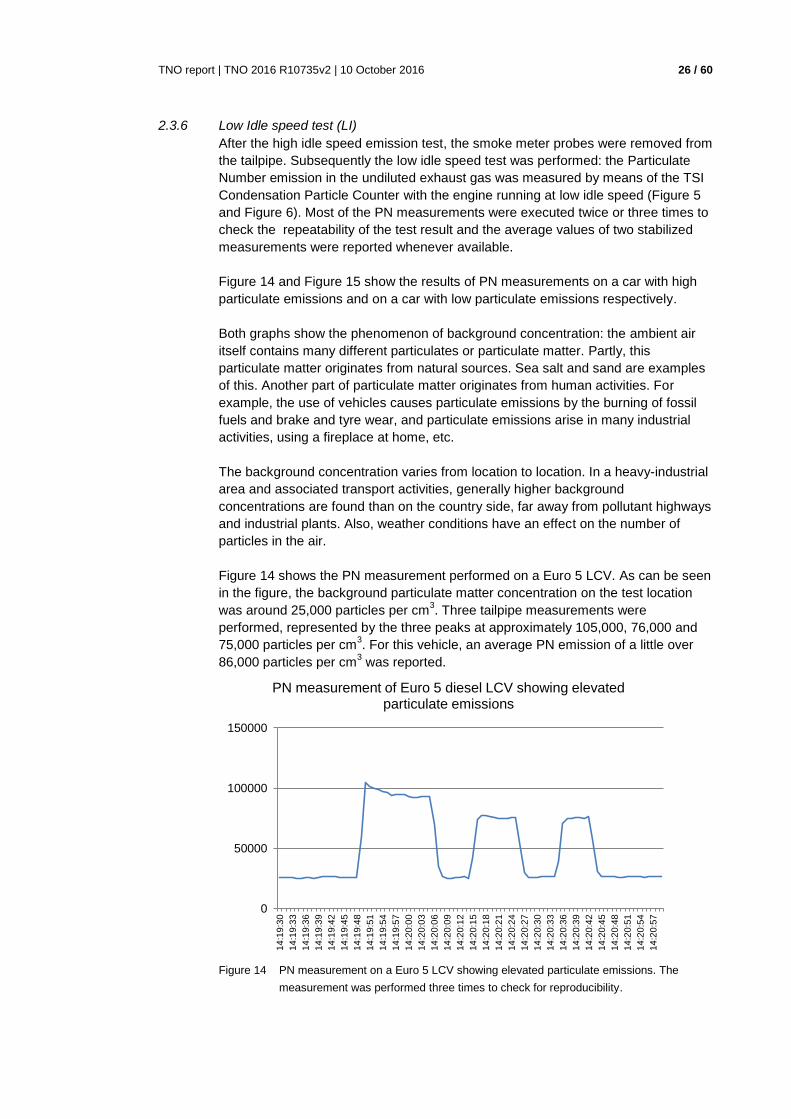
2.3.6 Low Idle speed test (LI)
After the high idle speed emission test, the smoke meter probes were removed from
the tailpipe. Subsequently the low idle speed test was performed: the Particulate
Number emission in the undiluted exhaust gas was measured by means of the TSI
Condensation Particle Counter with the engine running at low idle speed (Figure 5
and Figure 6). Most of the PN measurements were executed twice or three times to
check the repeatability of the test result and the average values of two stabilized
measurements were reported whenever available.
Figure 14 and Figure 15 show the results of PN measurements on a car with high
particulate emissions and on a car with low particulate emissions respectively.
Both graphs show the phenomenon of background concentration: the ambient air
itself contains many different particulates or particulate matter. Partly, this
particulate matter originates from natural sources. Sea salt and sand are examples
of this. Another part of particulate matter originates from human activities. For
example, the use of vehicles causes particulate emissions by the burning of fossil
fuels and brake and tyre wear, and particulate emissions arise in many industrial
activities, using a fireplace at home, etc.
The background concentration varies from location to location. In a heavy-industrial
area and associated transport activities, generally higher background
concentrations are found than on the country side, far away from pollutant highways
and industrial plants. Also, weather conditions have an effect on the number of
particles in the air.
Figure 14 shows the PN measurement performed on a Euro 5 LCV. As can be seen
in the figure, the background particulate matter concentration on the test location
was around 25,000 particles per cm3. Three tailpipe measurements were
performed, represented by the three peaks at approximately 105,000, 76,000 and
75,000 particles per cm3. For this vehicle, an average PN emission of a little over
86,000 particles per cm3 was reported.
Figure 14 PN measurement on a Euro 5 LCV showing elevated particulate emissions. The
measurement was performed three times to check for reproducibility.
0
50000
100000
150000
14
:19:3
0
14
:19:3
3
14
:19:3
6
14
:19:3
9
14
:19:4
2
14
:19:4
5
14
:19:4
8
14
:19:5
1
14
:19:5
4
14
:19:5
7
14
:20:0
0
14
:20:0
3
14
:20:0
6
14
:20:0
9
14
:20:1
2
14
:20:1
5
14
:20:1
8
14
:20:2
1
14
:20:2
4
14
:20:2
7
14
:20:3
0
14
:20:3
3
14
:20:3
6
14
:20:3
9
14
:20:4
2
14
:20:4
5
14
:20:4
8
14
:20:5
1
14
:20:5
4
14
:20:5
7
PN measurement of Euro 5 diesel LCV showing elevated particulate emissions

TNO report | TNO 2016 R10735v2 | 10 October 2016 27 / 60
Figure 15 is a typical example of a PN measurement on a low-emission vehicle. As
can be seen in the figure, the PN counter first reports a background concentration
of around 9,000 particles per cm3. Upon insertion of the sample hose, the number
of particles starts to drop significantly. As little as 6 to 8 particles per cm3 were
found.
Figure 15 PN measurement on a Euro 5 car showing low particulate emissions. The graph
shows that the ambient concentration was around 9,000 to 10,000 particles per cm3.
The three minima unmistakably represent the tailpipe measurements. Zooming in on
the left picture shows the particulate emissions are as low as 6 to 8 particles per cm3.
As the next chapter will show, this kind of results was found frequently during the
measurement series. A modern diesel car equipped with a well-functioning diesel
particulate filter is capable of reducing the particulate emissions to practically zero.
The number of particles in the car’s exhaust in such cases is lower than the number
of particles in the outside air.
2.3.7 Tissue Filter Test (TFT)
Vehicles scoring 3 on the tailpipe swipe test and showing high opacity values and/or
high PN emissions were selected for a tissue filter test. A tissue was attached to the
end of the exhaust pipe, as can be seen in Figure 16, after which the engine was let
running at idle speed for three minutes.
0
2000
4000
6000
8000
10000
12000
14000
16000
12
:19:5
0
12
:19:5
6
12
:20:0
2
12
:20:0
8
12
:20:1
4
12
:20:2
0
12
:20:2
6
12
:20:3
2
12
:20:3
8
12
:20:4
4
12
:20:5
0
12
:20:5
6
12
:21:0
2
12
:21:0
8
12
:21:1
4
12
:21:2
0
12
:21:2
6
12
:21:3
2
12
:21:3
8
PN measurement on a Euro 5 passenger with low particulate
emissions
0
5
10
15
20
25
30
35
40
45
50
12
:19:5
0
12
:19:5
8
12
:20:0
6
12
:20:1
4
12
:20:2
2
12
:20:3
0
12
:20:3
8
12
:20:4
6
12
:20:5
4
12
:21:0
2
12
:21:1
0
12
:21:1
8
12
:21:2
6
12
:21:3
4
Zoom-in of left graph

TNO report | TNO 2016 R10735v2 | 10 October 2016 28 / 60
Figure 16 In the tissue filter test, a tissue was attached to the end of the exhaust pipe after which
the engine was let running at idle speed for three minutes. Cars showing elevated
emissions in previous tests were selected for the TFT.
The tissue was then removed and the discoloration or blackening of the tissue was
reviewed and scored in a way similar to the tailpipe swipe test scoring. All tissues
were photographed. Figure 17 shows examples of results of tissue filter tests
scoring 0, 1, 2 and 3. As with the Tailpipe Swipe Test, these scores were
designated clean or no darkening, grey, black and deep black respectively.
0
1
3
2
Figure 17 Examples of tissue filter test results with score 0 (no darkening or clean), 1 (grey), 2
(black) and 3 (deep black) - clockwise, starting in the top left corner. The shape of the
exhaust pipe are indicated. In case of the upper figures, the black contaminations are
the result of touching the outer tailpipe while placing the tissue and do not result from
the idling of the engine

TNO report | TNO 2016 R10735v2 | 10 October 2016 29 / 60
3 Test results
3.1 Vehicle ages and mileages
Figure 18 and Figure 19 show information on the odometer readings and age of the
213 tested vehicles. The group of tested vehicles covers a wide range of vehicle
ages and mileages. 179 vehicles were ex-lease diesel cars or LCV’s, i.e. cars that
were mainly used for business use. Lease cars in general drive larger distances in
shorter periods of time and are well-maintained. The test set therefore is not per se
representative for the total Dutch diesel car fleet.
Figure 18 Odometer reading of the tested vehicles.
In Figure 19, the so-called 10% high-emitters are shown in red. Based on a
Particulate Number (PN) emission of more than 250,000 #/cm3, the 10% ‘highest-
PN vehicles’ were identified. As can be seen, most of the vehicles with high PN
numbers are 4 to 5 years old, with a mileage between 130,000 and 190,000 km.
7
47
72
60
19
5 3
0
10
20
30
40
50
60
70
80
Num
ber
of
vehic
les
Odometer [km]

TNO report | TNO 2016 R10735v2 | 10 October 2016 30 / 60
Figure 19 Age and odometer readings of the tested vehicles.
The results in Figure 19 show a relation of vehicle age and odometer readings. In
case of increased smoke emissions most of the 10% highest emitting vehicles are
older than 48 months.
3.2 Tailpipe Swipe Test results
The Tailpipe Swipe Test (TST, also refer to section 2.3.2) gives a first impression of
the vehicle’s PM emission. The tailpipes of all vehicles were swiped using a clean
finger, yielding the test results depicted in Table 7 and Figure 20.
Table 7 Tailpipe Swipe Test results.
Results Color deposit Score Vehicles Percentage
Clean No darkening 0 103 48%
Some deposits Grey 1 67 31%
Moderate deposits Black 2 27 13%
Heavy deposits Deep black 3 16 8%
Total 206 100%

TNO report | TNO 2016 R10735v2 | 10 October 2016 31 / 60
Figure 20 21% of the tested vehicles showed a noticeable darkening in the TST.
79% of the vehicles were found to have a clean exhaust pipe or showed some
deposits (scoring 0 or 1). Most of these vehicles showed low smoke values and PN
counts in the following tests. A total of 43 vehicles (21%) had tailpipes that were
blackened or severely blackened, scoring 2 or 3.
3.3 Opacity results of free acceleration tests
Table 8 and Figure 21 show the test results of both opacity meters. Based on the
standard opacity meter test results (“SO-EDA2” in the table), seven vehicles (3,3%)
have an opacity of over 0,10 m-1
. Using the improved opacity meter, the opacity of
twelve vehicles exceeds 0,10 m-1
(5,6%). In other words, based on these
measurements 3,3 to 5,6% of tested vehicles have a malfunctioning or missing
DPF; 94 to 96 percent of the tested vehicles has a well-functioning DPF.
Table 8 Opacity test results with a standard (SO) and an improved (IO) opacity meter.
Opacity meter SO-EDA2 IO-LPA
Filter mode Mode A (Low pass filter OFF) Low pass filter OFF
Opacity [m-1] # vehicles percentage # vehicles percentage
0,00 - 0,10 206 96.6% 201 94.3%
0,11 - 0,20 4 1.9% 4 1.9%
0,21 - 0,30 0 0.0% 1 0.5%
0,31 - 0,40 1 0.5% 1 0.5%
0,41 - 0,50 1 0.5% 1 0.5%
0,51 - 1,00 1 0.5% 2 0.9%
1,01 - 1,50 0 0.0% 2 0.9%
1,51 - 2,00 0 0.0% 1 0.5%
No reading 0 0.0% 0 0.0%
Total 213 100.0% 213 100.0%
48%
31%
13%
8%
0%
10%
20%
30%
40%
50%
60%
No darkening Grey Black Deep black
Perc
enta
ge o
f vehic
les
Color of tailpipe

TNO report | TNO 2016 R10735v2 | 10 October 2016 32 / 60
In this project one of the tested cars was found to have a missing DPF, as stated by the vehicle owner. This car had an improved opacity of 0,44 m
-1 and a standard
opacity of 0,17 m-1
.
Figure 21 Standard and improved opacity test results.
Taking a closer look at the 201 vehicles with an opacity not exceeding 0,1 m-1
yields
Figure 22. As this figure illustrates, 192 of those 201 vehicles have an opacity not
exceeding 0,050 m-1
. These test results indicate that modern diesel vehicles are
well capable of reaching opacity values below 0,050 m-1
. In the course of the
measurements, 0,10 m-1
was considered to be a relative high opacity. All this
provides a basis for defining an opacity limit of 0,10 m-1
in future smoke
measurements if applicable.
206
4 0 1 1 1 0 0 0
201
4 1 1 1 2 2 1 0
0
50
100
150
200
250
Num
ber
of
vehic
les
Opacity @ free acceleration [m-1]
Standard opacity Improved opacity

TNO report | TNO 2016 R10735v2 | 10 October 2016 33 / 60
Figure 22 Further analysis of the 201 vehicles that do not exceed 0,10 m-1 using the improved
opacity meter. 192 of those vehicles have an opacity not exceeding 0,005 m-1,
justifying a limit of 0,10 m-1.
34 of the 201 vehicles shown in Figure 22 had a TST score of 2 or 3.
3.4 Opacity results of high idle speed tests
In general, it can be stated that opacity in high idle speed tests is low: based on the
improved opacity meter, 202 cars showed smoke values equal to or smaller than
0,05 m-1
. What is more, 178 cars did not exceed 0,01 m-1
during the high idle speed
test. Five cars showed opacities during high idle tests between 0,10 and 0,45 m-1
.
Of those five cars, four had tailpipes that were blackened or severely blackened and
all of them showed high PN emissions and their opacity in free acceleration tests
varied between 0,021 and 1,481 m-1
. For six cars, no opacity results in high idle
tests were obtained.
Figure 23 plots free acceleration versus high idle speed smoke test results. No clear
correlation between these two test types exists.
11
70 70
20 21
6
3
0
10
20
30
40
50
60
70
80
Num
ber
of
vehic
les [
-]
Opacity @ free acceleration [m-1]

TNO report | TNO 2016 R10735v2 | 10 October 2016 34 / 60
Figure 23 Improved opacity results in free acceleration and high idle speed tests.
3.5 Particulate number test results at low idle speed
Table 9 and Figure 24 show the results of the particle number measurements
performed at low idle engine speed.
Table 9 Particulate Number test results at low idle speed.
PN-TSI PN-TSI
PN [#/cm3] # vehicles percentage
0 - 1,000 142 66,7%
1,000 - 5,000 19 8,9%
5,000 - 50,000 17 8,0%
50,000 - 100,000 6 2,8%
100,000 - 250,000 10 4,7%
250,000 - 500,000 11 5,2%
500,000 - 750,000 8 3,8%
750,000 - 1,000,000 0 0,0%
Total 213 100.0%

TNO report | TNO 2016 R10735v2 | 10 October 2016 35 / 60
Figure 24 Particulate emission test results measured in low idle speed tests.
PN tests were performed on cars with a hot engine at low idle engine speed. Under
such conditions, virtually all hydrocarbons are oxidized in the oxidation catalyst.
This means a particle counter does not perceive hydrocarbons as particles.
Background particulate matter concentration measured on most testing days
ranged between approximately 8,000 and 15,000 particles per cm3. 142 of the 213
cars in the test had particulate emissions lower than 1,000 per cm3. In other words:
the exhaust gas of these cars contains significantly less particles than the ambient
air. For 114 of the 142 aforementioned vehicles, particulate emissions were below
100 particles per cm3. The particulate emissions of many tested cars even were
close to zero particles per cm3, an example of which was given in Figure 15. These
results reconfirm the effectiveness of DPF’s.
3.6 Tissue Filter Test results
As explained in section 2.3.7, vehicles with blackened tailpipes and high opacity
and/or high PN emissions were subject to a tissue filter test. Results of the test are
shown in Table 10; Figure 25 relates the TFT to opacity outcomes.
Table 10 Results of tissue filter tests.
Results Score Vehicles
No test - 145
Clean 0 55
Some deposits 1 8
Moderate deposits 2 2
Heavy deposits 3 3
Total 213
142
19 17
6 10 11 8
0 0
20
40
60
80
100
120
140
160
Num
ber
of
vehic
les [
-]
Particulate Number [#*1000/cm3]

TNO report | TNO 2016 R10735v2 | 10 October 2016 36 / 60
Figure 25 Improved opacity versus TFT results.
The five cars scoring 3 or 2 in the TFT, i.e. coloring the tissue black to deep black
(Figure 17), have an opacity higher than 0,1 m-1
. What is more, those cars all had
high PN emissions, ranging from 291,500 to 623,000 particles per cm3. As an
illustrative example, the score 3 tissue in Figure 17 is the result of a TFT on a Euro
5 passenger car scoring 3 on the tailpipe swipe test (TST), an average opacity of
1,481 m-1
and a PN reading of 623,000 particles per cm3. This car almost certainly
has a defective or missing DPF.
Opacity of the eight cars scoring 1 in the TFT ranged between 0,027 and 1,263 m-1
.
Five of those vehicles had an opacity of over 0,10 m-1
in free acceleration. One car
had PN emissions of 96,000 #/cm3; the other seven cars had an average PN
emission of a little over 423,000 particles per cm3.

TNO report | TNO 2016 R10735v2 | 10 October 2016 37 / 60
Figure 26 PN emissions versus TFT results.
Vehicles with a (high) score (1, 2 or 3) on the TFT have significant particulate
emissions, i.e. there are no vehicles with a deep black tissue having low PN
emissions. The reverse is not true however: vehicles with a clean TFT tissue can in
fact have significant PN emissions. Whereas a vehicle showing a contaminated
tissue almost certainly represents a DPF problem, a car’s DPF having a clean TFT
tissue is not necessarily performing well. The test could therefore be applied by car
buyers to identify a car with a DPF problem (score 1, 2 or 3), but it has a serious
shortcoming in that a clean TFT tissue does not mean a clean car per se.

TNO report | TNO 2016 R10735v2 | 10 October 2016 38 / 60
4 Analysis of test results
4.1 Vehicle ages and test results of smoke and PN meters
The results in Figure 27, Figure 28 and Figure 29 show a relation between vehicle
age and smoke or PN emissions. In case of increased smoke or PN emissions most
vehicles are older than 48 months.
Figure 27 shows the PN emission of 213 vehicles at low idle speed. The PN test
results vary between 0 and 623,000 #/cm3 and have a relative good power of
discernment variation over the measuring scale than opacity test results in a free
acceleration test. It can be concluded that PN meters at low idle engine speed yield
a relatively good screening performance.
Figure 27: Particulate Number low idle speed test results of 213 vehicles.
In Figure 28 it is shown that the results of the improved opacity meter are less
pronounced than the PN-results of Figure 27. This implies that PN-tests are more
sensitive than smoke emission tests with an improved opacity meter and have a
better screening performance.

TNO report | TNO 2016 R10735v2 | 10 October 2016 39 / 60
Figure 28: Improved opacity free acceleration test results of 213 vehicles.
In Figure 29 it is shown that the results of the standard opacity meter are lower than
the results of the improved opacity meter of Figure 28. Furthermore the scatter of
test results with the improved opacity meter are more detailed. These two meters
are equipped with different light sources (emitters) and light sensors (receivers).
The difference in opacity test results are probably caused by the different
sensitivities of the two opacity meters. For DPF-equipped vehicles, the screening
performance of opacity meters with a measuring range of 0-10 m-1
is very low as
most vehicles have opacity values that are lower than 0,10 m-1
.
Figure 29: Standard opacity free acceleration test results of 213 vehicles.

TNO report | TNO 2016 R10735v2 | 10 October 2016 40 / 60
4.2 Suitability of Tailpipe Swipe Test
Tailpipe Swipe Test results are a very good first indication of the DPF condition.
The colour and intensity of the deposits in the tailpipe indicate a typical DPF
leakage. However, it is generally not known over which period of time the
contamination in the tailpipe has accumulated. Although a clean tailpipe in many
cases seems to indicate that a DPF is installed and functioning well (see section
3.5), a black tailpipe does not necessarily mean the DPF is missing or
malfunctioning. Therefore, the TST does not give accurate information on the
present-day condition of the DPF and a car cannot be said to fail the PTI based on
the TST. As such, the TST is not suited as an official PTI test.
4.3 Suitability of smoke emission tests with opacity meters
Are current smoke emission tests suitable?
The current free acceleration test is carried out with a hot engine and the gearbox in
neutral and than the accelerator pedal must be pressed down fully within 1 second.
Consequently, the engine speed increases from low idle speed to the maximum
speed in approximately 2 to 3 seconds and the peak smoke emission is measured.
It is well known that the speed of activation of the accelerator pedal influences the
peak smoke emission.
In addition to this, engine smoke emissions can be reduced by adding dopes to the
fuel or by applying a diesel fuel without heavy fractions (GTL or BTL). Because a
fuel check is not part of a PTI, this enables possibilities for manipulation of black
smoke emissions.
Due to the very poor definition of the activation of the accelerator pedal, which
results in different executions of a free acceleration test, the current smoke
emission test is not very robust and may cause very different smoke emissions.
Are current smoke emission opacity tests suitable for vehicles with a DPF?
For most used vehicles with DPF the opacity test results are 0,00 m-1
. This implies
that a DPF is a very effective means to reduce PM emissions. Also, as most of the
vehicles with higher smoke emissions are older than 48 months (section 4.1), it
seems to function well over a long period of time. However, some vehicles show
increased opacity test results.
The currently applied standard opacity meter with the filtered smoke measuring
signal is not sensitive. Only 3,4% of the vehicles have a smoke emission that is
higher than 0,10 m-1
, as Figure 29 showed. The improved opacity meter with non-
filtered measuring signals yields 5,7% of the vehicles with smoke emission levels
that are higher than 0,10 m-1
in the same tests (Figure 28).
In general the question raises if free acceleration tests with opacity meters are
suitable for detection of DPF’s with failures. The smoke emissions of diesel vehicles
with DPF are nearly zero and moderate DPF leakages create in general very low
smoke emissions. First it must be mentioned that current standard opacity meters
with an accuracy of +/- 0,3 m-1
are not sufficiently sensitive to detect DPF failures.
Improved opacity meters, with a measuring scale of 0 – 10 m-1
and higher
accuracies of +/- 0,01 m-1
and more stable readings, seem to perform better, see
Figure 30. However, a smoke emission limit value of 0,10 or 0,20 m-1
is very low
and noise on measuring signals in service shops might disturb the smoke emission
test. Furthermore, the screening performance of an opacity test with these limit

TNO report | TNO 2016 R10735v2 | 10 October 2016 41 / 60
values of 0,10 or 0,20 m-1
is very low and it may cause false test results. Opacity
tests with improved smoke meters are a poor means to detect DPF failures.
Figure 30: Relationship between improved and standard opacity free acceleration test results.
Although the opacity results of the Improved Opacity (IO) tester seem very stable its
screening performance is very poor. Furthermore the execution of free acceleration
tests is not very comfortable and tester friendly.
4.4 Investigation into the effect of filter modes of the opacity meters
As was explained in section 2.2, the opacity measurements in this project were
carried out in the unfiltered mode as this would allow for a better comparison of
particle emissions and opacity. It was found that, in the unfiltered mode, the smoke
meters presented different results. Therefore an investigation into the effect of the
filtering modes of the equipment was performed. This was done by performing
opacity measurements on two high-opacity cars and two low-opacity cars, see
Table 11. The opacity measurements were performed both in the filtered mode as
well as in the unfiltered mode. The cars tested in this filter mode investigation were
not tested as part of the larger testing programme.
Table 11 Properties of the cars tested in the smoke meter filter mode investigation.
Car Euro Class [-] Odometer [km]
Car A (high opacity) 3 308,784
Car B (high opacity) R 234,488
Car C (low opacity) 6 6,879
Car D (low opacity) 6 7,172
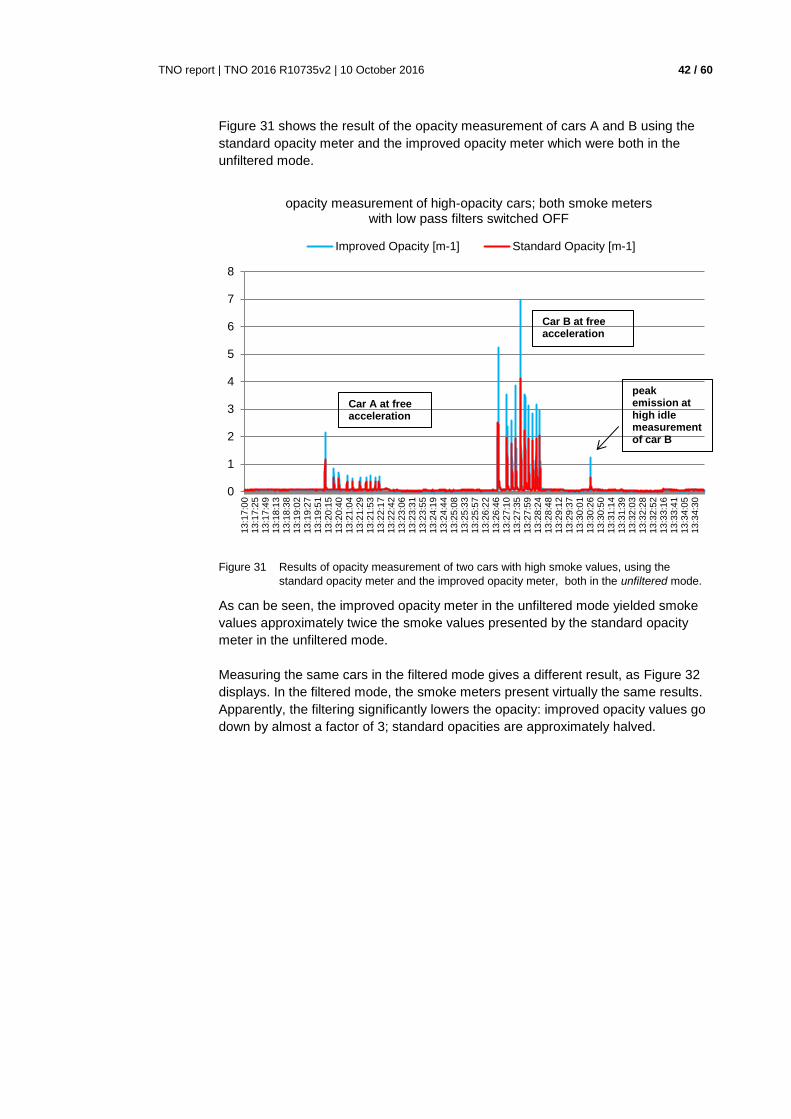
TNO report | TNO 2016 R10735v2 | 10 October 2016 42 / 60
Figure 31 shows the result of the opacity measurement of cars A and B using the
standard opacity meter and the improved opacity meter which were both in the
unfiltered mode.
Figure 31 Results of opacity measurement of two cars with high smoke values, using the
standard opacity meter and the improved opacity meter, both in the unfiltered mode.
As can be seen, the improved opacity meter in the unfiltered mode yielded smoke
values approximately twice the smoke values presented by the standard opacity
meter in the unfiltered mode.
Measuring the same cars in the filtered mode gives a different result, as Figure 32
displays. In the filtered mode, the smoke meters present virtually the same results.
Apparently, the filtering significantly lowers the opacity: improved opacity values go
down by almost a factor of 3; standard opacities are approximately halved.
0
1
2
3
4
5
6
7
8
13
:17:0
013
:17:2
513
:17:4
913
:18:1
313
:18:3
813
:19:0
213
:19:2
713
:19:5
113
:20:1
513
:20:4
013
:21:0
413
:21:2
913
:21:5
313
:22:1
713
:22:4
213
:23:0
613
:23:3
113
:23:5
513
:24:1
913
:24:4
413
:25:0
813
:25:3
313
:25:5
713
:26:2
213
:26:4
613
:27:1
013
:27:3
513
:27:5
913
:28:2
413
:28:4
813
:29:1
213
:29:3
713
:30:0
113
:30:2
613
:30:5
013
:31:1
413
:31:3
913
:32:0
313
:32:2
813
:32:5
213
:33:1
613
:33:4
113
:34:0
513
:34:3
0
opacity measurement of high-opacity cars; both smoke meters with low pass filters switched OFF
Improved Opacity [m-1] Standard Opacity [m-1]
Car A at free acceleration
Car B at free acceleration
peak emission at high idle measurement of car B

TNO report | TNO 2016 R10735v2 | 10 October 2016 43 / 60
Figure 32 Results of opacity measurement of two cars with high smoke values, using the
standard opacity meter and the improved opacity meter, both in the filtered mode.
The same measurements were performed on ‘clean’, low-opacity cars. Figure 33
shows the measurements with the low pass filters switched off; Figure 34 gives an
impression of clean car test results with the low pass filter switched on.
Figure 33 Results of opacity measurement of two cars with low smoke values, using the
standard opacity meter and the improved opacity meter, both in the unfiltered mode.
0
0,1
0,2
0,3
0,4
0,5
0,6
0,7
0,8
0,9
1
14
:08
:00
14
:08
:14
14
:08
:28
14
:08
:42
14
:08
:56
14
:09
:10
14
:09
:24
14
:09
:38
14
:09
:52
14
:10
:06
14
:10
:20
14
:10
:34
14
:10
:48
14
:11
:02
14
:11
:16
14
:11
:30
14
:11
:44
14
:11
:58
14
:12
:12
14
:12
:26
14
:12
:40
14
:12
:54
14
:13
:08
14
:13
:22
14
:13
:36
14
:13
:50
14
:14
:04
14
:14
:18
14
:14
:32
14
:14
:46
14
:15
:00
14
:15
:14
14
:15
:28
14
:15
:42
14
:15
:56
14
:16
:10
14
:16
:24
14
:16
:38
14
:16
:52
14
:17
:06
14
:17
:20
14
:17
:34
14
:17
:48
14
:18
:02
14
:18
:16
14
:18
:30
14
:18
:44
14
:18
:58
14
:19
:12
opacity measurement of high-opacity cars; both smoke meters with low pass filters switched ON
Improved Opacity [m-1] Standard Opacity [m-1]
Car B at free acceleration
Car A at free acceleration
0
0,05
0,1
0,15
0,2
0,25
0,3
15
:31:0
015
:31:1
715
:31:3
415
:31:5
215
:32:0
915
:32:2
615
:32:4
315
:33:0
015
:33:1
815
:33:3
515
:33:5
215
:34:0
915
:34:2
615
:34:4
415
:35:0
115
:35:1
815
:35:3
515
:35:5
215
:36:1
015
:36:2
715
:36:4
415
:37:0
115
:37:1
815
:37:3
615
:37:5
315
:38:1
015
:38:2
715
:38:4
415
:39:0
215
:39:1
915
:39:3
615
:39:5
315
:40:1
015
:40:2
815
:40:4
515
:41:0
215
:41:1
915
:41:3
615
:41:5
415
:42:1
115
:42:2
8
opacity measurement of low-opacity cars; both smoke meters with low pass filters switched OFF
Standard Opacity [m-1] Improved Opacity [m-1]
Car C at free acceleration
Car D at free acceleration

TNO report | TNO 2016 R10735v2 | 10 October 2016 44 / 60
The improved smoke meter measures opacities for car C in free acceleration
ranging between 0,01 and 0,04 m-1
in the unfiltered mode. In the filtered mode, the
same smoke meter present smoke values in free acceleration between 0,004 and
0,007 m-1
. For car D, in the unfiltered mode, the improved smoke meter reports an
opacity between 0,008 m-1
and 0,035 m-1
, whereas in the filtered mode opacity
ranges from 0,007 to 0,01 m-1
.
Figure 34 Results of opacity measurement of two cars with low smoke values, using the
standard opacity meter and the improved opacity meter, both in the filtered mode.
The standard smoke meter presented only a zero-signal and four erroneous spikes
in both filter modes. This behaviour was encountered often in the measurement
series, which was performed in the unfiltered mode: the standard opacity meter
most of the time shows a flat line at zero m-1
when testing low-opacity, clean cars.
This is not surprising, given the standard opacity meter’s low(er) resolution.
From this experiment with two different smoke meters the next lessons can be
learnt: In free acceleration smoke emission tests with a standard and improved
smoke meter with unfiltered measuring signals different smoke emission results are
measured. If the dynamic measuring signals are filtered with the applied low pass
electronic filters the smoke emission results of the two meters are equal. This
implies that the sensitivity and dynamic response of opacity meters are mainly
determined by the applied light sources, sensors, electronic filters and the design of
the smoke measuring chamber. From this experiment it is very clear that the
dynamic flow of exhaust gas and the sensitivity of the applied light sensor in the
measuring chamber mainly influence the measured smoke emission value.
Furthermore, standard calibration procedures of smoke meters are based on static
optic measurements, the light absorption is only tested. Unfortunately the calibration
procedure of smoke meters does not contain a dynamic response test with a
dynamic exhaust gas flow that contains a certain smoke emission.
0
0,01
0,02
0,03
0,04
0,05
0,06
0,07
15
:45:0
015
:45:1
315
:45:2
515
:45:3
815
:45:5
015
:46:0
315
:46:1
615
:46:2
815
:46:4
115
:46:5
315
:47:0
615
:47:1
915
:47:3
115
:47:4
415
:47:5
615
:48:0
915
:48:2
215
:48:3
415
:48:4
715
:48:5
915
:49:1
215
:49:2
515
:49:3
715
:49:5
015
:50:0
215
:50:1
515
:50:2
815
:50:4
015
:50:5
315
:51:0
515
:51:1
815
:51:3
115
:51:4
315
:51:5
615
:52:0
815
:52:2
115
:52:3
415
:52:4
6
opacity measurement of low-opacity cars; both smoke meters with low pass filters switched ON
improved opacity [m-1] standard opacity [m-1]
Car C at free acceleration
Car D at free acceleration
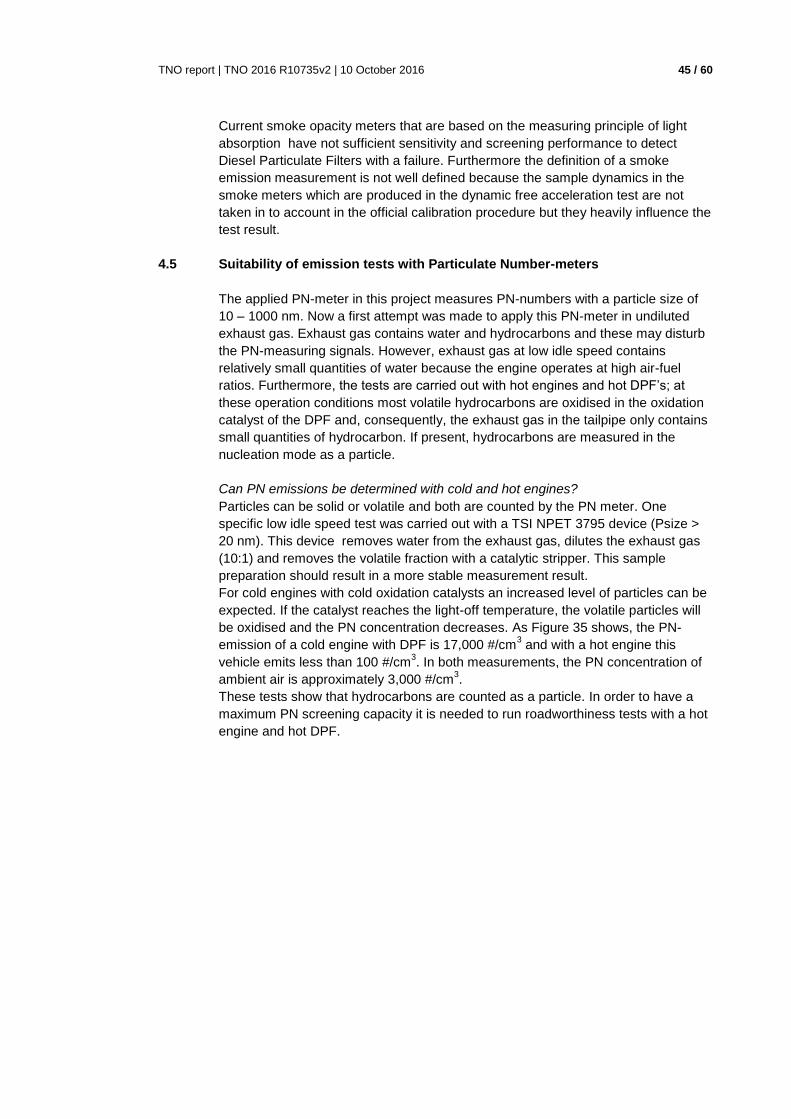
TNO report | TNO 2016 R10735v2 | 10 October 2016 45 / 60
Current smoke opacity meters that are based on the measuring principle of light
absorption have not sufficient sensitivity and screening performance to detect
Diesel Particulate Filters with a failure. Furthermore the definition of a smoke
emission measurement is not well defined because the sample dynamics in the
smoke meters which are produced in the dynamic free acceleration test are not
taken in to account in the official calibration procedure but they heavily influence the
test result.
4.5 Suitability of emission tests with Particulate Number-meters
The applied PN-meter in this project measures PN-numbers with a particle size of
10 – 1000 nm. Now a first attempt was made to apply this PN-meter in undiluted
exhaust gas. Exhaust gas contains water and hydrocarbons and these may disturb
the PN-measuring signals. However, exhaust gas at low idle speed contains
relatively small quantities of water because the engine operates at high air-fuel
ratios. Furthermore, the tests are carried out with hot engines and hot DPF’s; at
these operation conditions most volatile hydrocarbons are oxidised in the oxidation
catalyst of the DPF and, consequently, the exhaust gas in the tailpipe only contains
small quantities of hydrocarbon. If present, hydrocarbons are measured in the
nucleation mode as a particle.
Can PN emissions be determined with cold and hot engines?
Particles can be solid or volatile and both are counted by the PN meter. One
specific low idle speed test was carried out with a TSI NPET 3795 device (Psize >
20 nm). This device removes water from the exhaust gas, dilutes the exhaust gas
(10:1) and removes the volatile fraction with a catalytic stripper. This sample
preparation should result in a more stable measurement result.
For cold engines with cold oxidation catalysts an increased level of particles can be
expected. If the catalyst reaches the light-off temperature, the volatile particles will
be oxidised and the PN concentration decreases. As Figure 35 shows, the PN-
emission of a cold engine with DPF is 17,000 #/cm3 and with a hot engine this
vehicle emits less than 100 #/cm3. In both measurements, the PN concentration of
ambient air is approximately 3,000 #/cm3.
These tests show that hydrocarbons are counted as a particle. In order to have a
maximum PN screening capacity it is needed to run roadworthiness tests with a hot
engine and hot DPF.
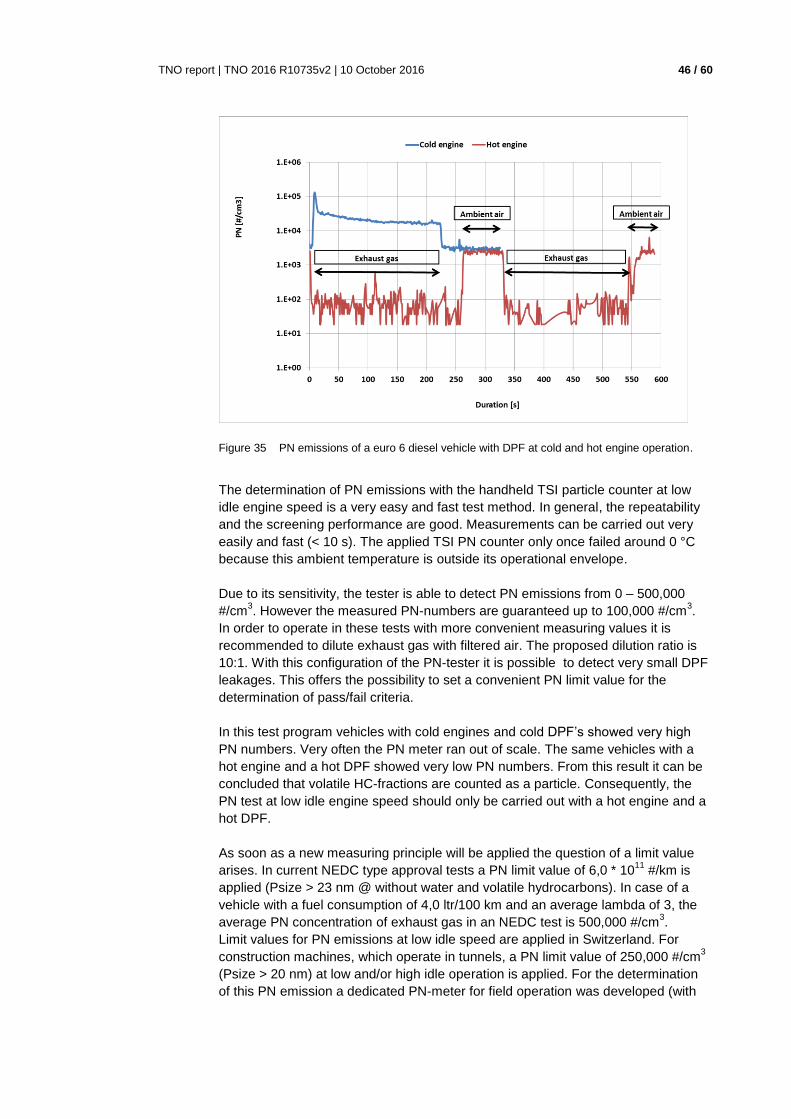
TNO report | TNO 2016 R10735v2 | 10 October 2016 46 / 60
Figure 35 PN emissions of a euro 6 diesel vehicle with DPF at cold and hot engine operation.
The determination of PN emissions with the handheld TSI particle counter at low
idle engine speed is a very easy and fast test method. In general, the repeatability
and the screening performance are good. Measurements can be carried out very
easily and fast (< 10 s). The applied TSI PN counter only once failed around 0 °C
because this ambient temperature is outside its operational envelope.
Due to its sensitivity, the tester is able to detect PN emissions from 0 – 500,000
#/cm3. However the measured PN-numbers are guaranteed up to 100,000 #/cm
3.
In order to operate in these tests with more convenient measuring values it is
recommended to dilute exhaust gas with filtered air. The proposed dilution ratio is
10:1. With this configuration of the PN-tester it is possible to detect very small DPF
leakages. This offers the possibility to set a convenient PN limit value for the
determination of pass/fail criteria.
In this test program vehicles with cold engines and cold DPF’s showed very high
PN numbers. Very often the PN meter ran out of scale. The same vehicles with a
hot engine and a hot DPF showed very low PN numbers. From this result it can be
concluded that volatile HC-fractions are counted as a particle. Consequently, the
PN test at low idle engine speed should only be carried out with a hot engine and a
hot DPF.
As soon as a new measuring principle will be applied the question of a limit value
arises. In current NEDC type approval tests a PN limit value of 6,0 * 1011
#/km is
applied (Psize > 23 nm @ without water and volatile hydrocarbons). In case of a
vehicle with a fuel consumption of 4,0 ltr/100 km and an average lambda of 3, the
average PN concentration of exhaust gas in an NEDC test is 500,000 #/cm3.
Limit values for PN emissions at low idle speed are applied in Switzerland. For
construction machines, which operate in tunnels, a PN limit value of 250,000 #/cm3
(Psize > 20 nm) at low and/or high idle operation is applied. For the determination
of this PN emission a dedicated PN-meter for field operation was developed (with

TNO report | TNO 2016 R10735v2 | 10 October 2016 47 / 60
water separator, 10:1 diluter and catalytic stripper of the volatile fraction).
Summarizing this discussion, it is recommended to apply a PN limit value of
250,000 #/cm3 (Psize > 20 nm) in roadworthiness tests.
91% of the 140 under ‘1,000 #/cm3-cars’ had clean tailpipes or showed only minor
deposits in the tailpipe swipe test. This seems to indicate that a vehicle having a
clean exhaust pipe is very likely to have a well-functioning DPF. A reverse
deduction, i.e. that a black tailpipe means a DPF is not present functioning properly,
is usually not valid.
Initially, some vehicles showed a non-stable PN emission. In those cases, the
vehicles were further warmed up by driving over the test site. After this additional
warming-up, most vehicles showed a very low PN emission (< 1000 #/cm3).
This indicates that a well warmed-up vehicle is needed for a PN-test.
Particulate Number tests at low idle engine speed are easy to carry out, the results
are very stable and repeatable and the screening performance of this test method is
good. Moreover, the fact that the engine does not have to be tested at full throttle
but rather is tested at low idle speed means a smaller health burden to the tester.
4.6 Relation between smoke and particulate number emissions
In Figure 36 the relation of improved opacity in free acceleration tests and PN
emission results in low idle engine speed tests is shown. Not all 10% high emitters
(PN-based) have also a high smoke emission. From this figure it is clear that PN
results are more sensitive than opacity results and they have a better screening
performance because the PN test results of the vehicles are more distributed over
the measuring range than the opacity test results.
Figure 36: Relation between improved opacity in FA-tests and PN emission at low idle speed.
TNO report | TNO 2016 R10735v2 | 10 October 2016 48 / 60
4.7 Suitability of Tissue Filter Test
The Tissue Filter Test is a very easy test method but the results are very poor. Only
5 of 68 potential high emitting vehicles were detected as high emitters (moderate or
heavy deposits) with this test method. From this result it is concluded that the
Tissue Filter Test method is not suitable for detection of DPF failures.
4.8 Pass and fail criteria
In Figure 37 and Figure 38 the pass and fail percentages of the two opacity test
methods (SO and IO) and of the PN test method are shown.
In opacity tests, limit values of 0,10 – 0,50 m-1
must be chosen to detect DPF
failures. In this test program with a smoke limit value of 0,10 m-1
, only 3-6% of the
tested vehicles fail. This is a maximum percentage and it is determined with
measuring signals without electronic filtering. In current daily PTI-practice all opacity
tests are carried out in a filtered test mode and opacity results are probably around
50% lower. This signal filtering reduces the screening performance of the test
method and a maximum failure rate of approximately 1,5 to 3% is expected.
The PN test method shows a linear correlation between PN emission limit values
and failure rates. This provides the possibility to set a PN limit value in relation to an
expected failure rate and enable stakeholders (Governments & Type Approval
Authorities) to choose an accepted failure rate between 0 and 25%. As an example
a limit value of 250,000 #/cm3 is applied for Swiss non-mobile machinery.

TNO report | TNO 2016 R10735v2 | 10 October 2016 49 / 60
Figure 37: Relation of percentage of passed opacity and PN tests and limit values
Figure 38: Relation of percentage of failed opacity and PN tests and limit values

TNO report | TNO 2016 R10735v2 | 10 October 2016 50 / 60
4.9 Overall assessment of test methods and limit values
In Figure 39 and Figure 40 the number and percentages of DPF failures which are
based on the different test methods and limit values are shown. It is clear that the
test method and limit values determine a certain failure rate.
From the Tailpipe Swipe Test it is known that it cannot be applied in PTI-tests
because it can be manipulated. However a tailpipe with a certain black soot layer is
a first impression and can be marked as a trigger because it is known that well
functioning DPF’s have a real clean tail pipe. The opposite statement (a clean
tailpipe is a marker of a well functioning DPF) is not valid because a clean tailpipe
can be arranged.
In general a free acceleration PTI test is experienced as a load because it takes 60-
120 s, the test is relatively complicated, a lot of noise is produced and currently only
a very small percentage of the vehicles with DPF fail. From the measured results of
the free acceleration opacity tests it is clear that the possible limit values (0,10 or
0,20) are in the lower part of the measuring range (0-10) and this offers a very poor
screening performance. Furthermore due to margins of execution of free
acceleration tests and different designs of smoke meters opacity these test results
may even differ. This creates a basis for discussions between vehicle owners, PTI
testers and PTI inspectors but also a basis for manipulation.
From the results of the Particulate Number Tests at low idle engine speed the
highest sensitivity and screening performance have been determined. The test can
not easily be manipulated because it must be carried in a static condition (low idle
speed with a hot engine) and it can be easily and fast (15 s) executed in PTI-
workshops. For PTI purposes cheap PN-testers must be developed. These testers
contain a water separator, a sample diluter (10:1) for a better match between
expected PN-emissions and the measuring range and a particle counter. In the next
paragraph some cost estimations of application of PN-testers in PTI’s are shown.
Figure 39: Number of DPF failures based on different test criteria and limit values

TNO report | TNO 2016 R10735v2 | 10 October 2016 51 / 60
Figure 40: Percentages of DPF failures based on different test procedures and limit values

TNO report | TNO 2016 R10735v2 | 10 October 2016 52 / 60
5 Cost estimates of different test methods and testers
Table 12 and Figure 41 present a specification and cost estimate of different PTI
DPF emission tests with different economic lifetime of test equipment. Detailed
numbers are reported in Appendix B.
Table 12 PTI DPF emission tests.
Smoke PN
Costs test equipment € 4,000 € 10,000
Costs test facility Test set up No
Vehicle preparation Warming up engine
Installation sample tube and engine
speed sensor
Warming up engine
Test specification 1-6 * free acceleration tests Low idle speed
Test duration 2 minutes 30 seconds
Environment Noise
Acceptance customer Bad Good
Quality test result - ++
Cost per test* See Figure 41
Figure 41 Cost estimate of single PTI DPF tests with smoke or PN meters with economic
lifetimes of test equipment of 5 and 10 years.
In case of an economic lifetime of 5 years of a smoke or PN tester and 500 PTI’s
per year, the costs per PTI emission test with an opacity meter are € 4.60 and in
case of the PN-tester each PTI emission test costs € 6.10. The break even point of
the two methods can be reached at 1,000 test per year. At that number of yearly
tests, the costs per test for both methods are estimated at € 3,30.

TNO report | TNO 2016 R10735v2 | 10 October 2016 53 / 60
6 Overview and assessment of test methods
In Table 13 an overview and assessment of parameters of three different test
methods is shown.
Table 13: Overview assessment of parameters of three different test methods
Parameter Free Acceleration Free Acceleration Low idle
Standard Opacity Improved Opacity PN
Comment Current method Improved 1 ‘CITA’ Improved 2
Representativeness +/- +/- ++
Sensitivity, threshold -- +/- ++
Accuracy - + ++
Reliability +/- + ++
Screening performance -- - ++
Reproducability - - ++
Repeatability +/- +/- ++
Executibility +/- +/- ++
Costs + + +/-
Costs [€/test] 3.30 – 15.00 3.30 – 15.00 3.30 – 28.50
Test duration +/- +/- ++
Comfort for tester - - +
Acceptance vehicle owner +/- +/- ++
Maturity ++ + +
Limit values -- + ++
Limit values 0.7 m-1
0.10 m-1
250,000 #/cm3

TNO report | TNO 2016 R10735v2 | 10 October 2016 54 / 60
7 Conclusions
In order to develop an improved PTI smoke emission test procedure for diesel
vehicles with a diesel particulate filter, the smoke emissions of 213 Euro 5 and Euro
6 in-use light-duty diesel vehicles with a DPF were investigated. The condition of
the DPF’s was investigated by means of four different test methods: (1) the tailpipe
swipe test, (2) a tissue filter test, (3) a smoke emission test using a standard opacity
meter and using an improved opacity meter and (4) a particulate number (PN)
measurement using a particulate number counter. The two opacity meters were
used in free acceleration and high idle tests; the PN test with the handheld PN-
meter was used in low idle speed tests.
What can be expected from Tailpipe Swipe Tests?
On the basis of the results of the executed Tailpipe Swipe Tests (TST) and expert
opinion it must be concluded that the TST is not suited as an official PTI test
because the result of a TST test is not related to the actual condition of the DPF.
However the TST result can support the judgement of a DPF condition.
How do smoke emission results of the 213 vehicles of this project relate to
former results?
In very conditioned roadworthiness tests with 213 (mainly ex business use) Euro 5
and 6 diesel vehicles, at least 12 vehicles (5.6%) showed elevated smoke
emissions (k > 0.10 m-1
with an improved opacity meter without signal filtering). This
indicates that these 12 Diesel Particulate Filters are either damaged or removed.
If a smoke emission limit value of 0.30 m-1
is applied only 3.3% of the vehicles fail.
This result is not in line with former failure rates of 6% (based on filtered measuring
signals of a standard opacity meter and a limit value of 0.30 m-1
) of random
vehicles. Possibly, the relatively low failure rate is caused by the relatively young
and well-maintained test vehicles in this project.
Is an emission test in PTI’s needed?
From the 10% highest emitting vehicles, most vehicles are older than 48 months.
This indicates that deterioration of diesel particulate filters is related to DPF age and
its performance must be checked in periodic technical inspections by means of an
adequate test procedure in which also removal of DPF’s can be detected.
What is the quality of the current smoke emission test procedure in a PTI?
In former research projects it was found that the current smoke emission test
procedure with an improved opacity meter was the best option because no better
alternative for PTI-purposes was available. However, after detailed research in this
project, it must be stated that the current PTI test procedure is not the most
accurate procedure and it can be manipulated. This is mainly caused by the poor
definition of the execution of the PTI emission test, the characteristics of the
dynamic test procedure and the undefined dynamic sample flow characteristics of
sample lines and measuring chambers of (improved) opacity meters. In the official
static calibration procedure of opacity meters the sample dynamics in the meters
are not taken in to account but they may heavily influence the test result.
Moreover the screening performance of improved opacity meters with a measuring
range of 0-10 m-1
is low because most vehicles with DPF have opacity results that

TNO report | TNO 2016 R10735v2 | 10 October 2016 55 / 60
are lower than 0.10 m-1
while reasonable limit values are in the range of 0.10 - 0.20
m-1
.
Furthermore the execution of free acceleration tests is not very comfortable and
tester friendly and evokes sometimes resistance for vehicle owners because they
think the engine is overloaded.
Are opacity meters suitable for PTI tests of DPF-equipped vehicles?
The experiments confirmed that opacity tests using a standard smoke meter are not
suited to determine whether the vehicle is fitted with a well-functioning DPF. Using a
modern, improved smoke meter a smoke test can be used to detect DPF failures.
Can PN measurements be an alternative for black smoke emission tests?
In this project, alternative DPF tests were carried out with a handheld Particulate
Number (PN) tester at low idle engine speed with a hot engine. This PN test
procedure is relatively easy and the measurement takes only around 15 seconds.
It has a good screening performance and yields very robust test results. Due to the
clear and simple definition of the static test, manipulation is not very likely.
In low idle speed tests with a hot engine and a particulate number limit value of
250,000 #/cm3, 8,5% of the vehicles failed. From these results it can be concluded
that a particulate emission test with a PN tester is a very good option for PTI’s.
In order to realise a final PN test procedure it is needed to adapt PN test equipment
with a water separator and sample dilution system.
How do current smoke emission test results and PN test results relate?
From the results in Figure 42 it is clear that PN-results are more sensitive than
opacity results . A PN test shows a better screening performance because the PN
test results of the vehicles are more distributed over the measuring range than the
opacity test results.
Figure 42: Relation of improved opacity in FA-tests and PN emission at low idle speed

TNO report | TNO 2016 R10735v2 | 10 October 2016 56 / 60
Are PN meters suitable for PTI tests of DPF-equipped vehicles?
The PN test method shows a much better linear correlation between PN-emission
limit values and failure rates, see Figure 43. This provides the possibility to set a PN
limit value in relation to an expected failure rate and enable stakeholders such as
governments and type approval authorities to choose an accepted failure rate
between 0 and 25%. Currently, a limit value of 250,000 #/cm3 is applied for Swiss
non-mobile machinery.
Figure 43: Relation of percentage of failed opacity and PN tests and limit values
What can be expected from Tissue Filter Tests?
The Tissue Filter Test is a very easy test method but the results are very poor. Only
5 of 68 potential high emitting vehicles were detected as high emitters (moderate or
heavy deposits) with this test method. From this result it is concluded that the
Tissue Filter Test method is not suitable for detection of DPF failures.
What is the screening performance of the different PTI emission tests?
In Figure 44, PTI failure percentages of this fleet are reported for the four different
test methods. As stated earlier the Tailpipe Swipe Test cannot be applied for PTI
purposes but the test result may indicate a serious DPF failure.
From the test results with a standard opacity meter and a limit value of 0.10 m-1
3,3% fail. This percentage increases to 5.6% with an improved opacity meter. Due
to the very low opacity limit value of 0.10 m-1
(1% of the full scale), sensitivity,
accuracy and stability of the equipment around this value of 0.10 m-1
become very
important but they cannot be checked in standard static calibration procedures of
the smoke meter. From this perspective the reliability of the smoke emission test
result is poor.
PN tests allow a higher screening performance (because PN limit values can be set
from 50,000 – 250,000 #/cm3). Due to its sensitivity and linearity, the potential

TNO report | TNO 2016 R10735v2 | 10 October 2016 57 / 60
screening performance of PN tests is the highest of all test methods because low
PN concentrations can be measured accurately.
Figure 44: Percentages of DPF failures based on different test procedures and limit values
What are the estimated costs for different PTI emission tests?
The costs per PTI depend on the price and economic life time of test equipment,
yearly maintenance and calibration costs as well as labour time per PTI test and the
number of executed PTI’s per year. For an improved smoke meter of € 4000,- and a
life time of five years and on the basis of 100-1000 PTI’s per year the estimated
price per test is € 3.30 - €15.00. For a PN-meter of € 10.000,- and a life time of 5
years and 100-1000 PTI’s per year the estimated price per test is € 3.30 - € 28.50.

TNO report | TNO 2016 R10735v2 | 10 October 2016 58 / 60
8 Recommendations
In this project a preliminary investigation with handheld Particulate Number test
equipment is carried out. It is recommended to develop dedicated PN meters for
PTI purposes because the results of the PN test at low idle engine speed are very
robust and reflect well the condition of the DPF. In order to avoid too high measured
PN concentrations, sample dilution with a factor 10 is advised. A cost saving can
probably be reached by not implementing the PN meter with a catalytic stripper
which removes volatile fractions from the sample. Furthermore it is recommended
to develop a dynamic calibration procedure for PN-meters that can be executed in a
simple way by service personnel in the workshop.
It is expected that a new PN meter cannot be applied for PTI’s of diesel engines
without DPF. For these vehicles it is recommended to stick with the current PTI test
procedure with opacity meters.
In the past, PTI smoke emission tests were manipulated by adding special liquids or
petrol to the diesel tank to reduce smoke emission levels. In general, it is currently
very hard to detect malfunctioning or removal of a DPF because smoke emissions
of modern engines are very low. In addition new fuels, like BTL and GTL, even
reduce smoke emissions with more than 50%. Therefore it is recommended to
investigate the effects of such manipulation practices on the results of the improved
smoke opacity meter and the PN-counter.

TNO report | TNO 2016 R10735v2 | 10 October 2016 59 / 60
9 References
[1] Boulter et al., A new roadworthiness emission test for diesel vehicles involving
NO, NO2 and PM measurements, CITA report, December 2011.
[2] Kadijk, Roadworthiness Test Investigations of Diesel Particulate Filters, TNO
report 2013 R10160
[3] Bussink, Onderzoek beoordeling roetfilters, RDW report March 2014.
[4] Kadijk et al., Roadworthiness Test Investigations of Diesel Particulate Filters on
vehicles, TNO report 2015 R10307
[5] Barlow et al., Sustainable Emission Tests, SET project, CITA report, September
2015

TNO report | TNO 2016 R10735v2 | 10 October 2016 60 / 60
10 Signature
Delft, 10 October 2016 TNO
Peter van der Mark Gerrit Kadijk Project leader Author

Appendix A | 1/1
TNO report | TNO 2016 R10735v2 | 10 October 2016
A Tested vehicles
Table 14: Tested vehicles
Trade Mark Number
Alfa Romeo 5
Audi 16
BMW 11
Citroën 7
Fiat 2
Ford 18
Honda 1
Hyundai 3
Kia 1
LANCIA 1
LAND
ROVER
1
MAZDA 1
Mercedes 7
Mini 1
MITSUBISHI 1
NISSAN 2
Opel 19
Peugeot 13
Renault 30
Seat 14
Skoda 15
Toyota 2
Volkswagen 26
Volvo 16
Total 213

Appendix B | 1/2
TNO report | TNO 2016 R10735v2 | 10 October 2016
B Cost estimates PTI DPF tests
Cost estimation PTI DPF emission testsAll prices excl. VAT
Costs per test Smoke PN
Equipment+fin. [€] 5000 12500
Test time [min] 2 0,5
Labour rate [€/hour] 60 60
Calibration [€/year] 300 300
Economic life time [year 5 5
Tests per year Smoke (5) PN (5)
100 15,00 28,50
200 8,50 14,50
300 6,33 9,83
400 5,25 7,50
500 4,60 6,10
600 4,17 5,17
700 3,86 4,50
800 3,63 4,00
900 3,44 3,61
1000 3,30 3,30
Costs per test

Appendix B | 2/2
TNO report | TNO 2016 R10735v2 | 10 October 2016
Cost estimation PTI DPF emission testsAll prices excl. VAT
Costs per test Smoke PN
Equipment+fin. [€] 6000 15000
Test time [min] 2 0,5
Labour rate [€/hour] 60 60
Calibration [€/year] 300 300
Economic life time [year 10 10
Tests per year Smoke (10) PN (10)
100 11,00 18,50
200 6,50 9,50
300 5,00 6,50
400 4,25 5,00
500 3,80 4,10
600 3,50 3,50
700 3,29 3,07
800 3,13 2,75
900 3,00 2,50
1000 2,90 2,30
Costs per test