Embed Size (px)
Citation preview
ABSTRACT
SMITH, ERIN GAYLE. Consumer Preferences of Home Textile Products: An Investigation into Hispanic Shoppers’ Buying Behavior. (Under the direction of Michelle Jones.) The purposes of this study were to define the U.S. home textile industry by means of
an industry profile, explore the buyer characteristics and purchase decision factors that may
be important to U.S. Hispanic consumers as it relates to their purchases of home textile
products, and determine if products are currently available to satisfy the expressed
preferences of the Hispanic home textile consumer. Using known variables for consumer
preferences for apparel and pairing them with variables unique to home textiles (e.g. thread
count, bed-in-a-bag packaging, sateen weave), this study explored the relative importance
Hispanic consumers place on traditional purchase variables when shopping for home
fashions. This research provides a foundation for future research in an emerging area of
consumer study by establishing a framework for investigations into home textile markets.
Two research objectives were investigated during the course of this study. Research
Objective One profiled the U.S. home textile industry by exploring the manufacturing and
specialty retail leaders of bedding and bath products. Archival records, documents and direct
observation were used to gather information to satisfy Research Objective One, which was
comprised of two Research Questions. The two leading home textile manufacturers were
WestPoint Stevens and Springs Industries; the two leading home textile mass specialty
retailers were Bed Bath & Beyond and Linens ‘n Things.
Research Objective Two sought to ascertain the level of importance that traditional
buyer decision factors such as price, color and style have within the Hispanic consumer
market for home textiles, and to determine if the specialty retail market for home textiles

offers products that satisfy the preferences of the Hispanic consumer market. A survey was
used to gather information from thirty Hispanic women, and observations were made at three
locations of each home textile mass specialty retailer. After the women completed a
questionnaire regarding their home textile preferences for product characteristics and retail
channel, the data were analyzed with descriptive statistics and one-sample t-tests; ANOVA
tests were performed post hoc for further analysis. The five most important purchase criteria
were found to be price, color and style for bedding; and price and color for bath products.
Products matching the preferences of the survey subjects were largely available in home
textile mass specialty retailers.

CONSUMER PREFERENCES OF HOME TEXTILE PRODUCTS: AN INVESTIGATION INTO HISPANIC SHOPPERS’ BUYING BEHAVIOR
by ERIN GAYLE SMITH
A thesis submitted to the Graduate Faculty of North Carolina State University
in partial fulfillment of the requirements for the Degree of
Master of Science
TEXTILE AND APPAREL, TECHNOLOGY AND MANAGEMENT
Raleigh
2004
APPROVED BY:
_______________________________ _______________________________ Dr. Nancy Cassill Dr. Gary Smith
_____________________________________________
Dr. Michelle Jones, Chair of Advisory Committee

ii
BIOGRAPHY
Erin Gayle Smith was born on April 26, 1980, in Painesville, Ohio. Her parents are
William and Deborah Smith, and she has one sister, Shannon. Her family moved to
Charlotte, North Carolina in 1988.
She attended East Mecklenburg High School in Charlotte, North Carolina. After
graduating from high school in 1998, Erin began her undergraduate education at North
Carolina State University. Erin graduated in the spring of 2002 with a Bachelor of Science in
Textile and Apparel, Technology and Management. She then went on to pursue her Master
of Science degree the following fall semester, also at North Carolina State University. Erin
graduated with a Master of Science in Textile Technology Management in the summer of
2004.

iii
TABLE OF CONTENTS
LIST OF TABLES............................................................................................................. ix
LIST OF FIGURES ............................................................................................................ x
CHAPTER I ........................................................................................................................ 1
Introduction..................................................................................................................... 1
Purpose of the Study ....................................................................................................... 3
Research Objectives........................................................................................................ 3
Scope............................................................................................................................... 3
Limitations ...................................................................................................................... 4
Significance of the Study................................................................................................ 4
Definition of Terms ........................................................................................................ 5
CHAPTER II....................................................................................................................... 7
Review of Literature ....................................................................................................... 7
Buyer Decision Factors................................................................................................... 7
Model of Buyer Behavior ........................................................................................... 7
Buyer Characteristics .................................................................................................. 8
The U.S. Hispanic Market ............................................................................................ 17
Income and Buying Power........................................................................................ 19
Advertising to Hispanic Markets .............................................................................. 19
Hispanic Buying Behavior ........................................................................................ 20
Marketing Efforts towards the Hispanic Market ...................................................... 22
Summary....................................................................................................................... 24
CHAPTER III ................................................................................................................... 25

iv
Research Methodology ................................................................................................. 25
Research Objectives.................................................................................................. 25
Research Design........................................................................................................ 27
Research Objective One............................................................................................ 29
Research Objective Two ........................................................................................... 30
Instrument ................................................................................................................. 31
Retail Channels for Bedding and Bath Products................................................... 33
Coordinated Bedding and Bath Products.............................................................. 33
Buyer Decision Factors for Bedding..................................................................... 34
Buyer Decision Factors for Bath Products............................................................ 34
Demographics ....................................................................................................... 34
Questions................................................................................................................... 35
Survey Data Collection ......................................................................................... 35
Pretest of Instrument ............................................................................................. 35
Survey Sample ...................................................................................................... 37
Retailer Observation ................................................................................................. 40
Store Sample ......................................................................................................... 40
In-Store Observation Procedure............................................................................ 40
Data Analysis ............................................................................................................ 41
CHAPTER IV ................................................................................................................... 43
Results........................................................................................................................... 43
Research Objective One: .............................................................................................. 43
Product Market Shares .............................................................................................. 44

v
Home Textile Manufacturers ........................................................................................ 47
Research Question One: Who are the leading Manufacturers in the Home Textile
Industry? ............................................................................................................... 49
Company Development ............................................................................................ 49
Product Offerings and Customers ............................................................................. 51
Market Strategy......................................................................................................... 54
Research Question Two: Who are the Leading Home Textile Mass Specialty
Retailers?............................................................................................................... 55
Company Development ............................................................................................ 56
Product Offerings...................................................................................................... 57
Market Strategy......................................................................................................... 58
Research Objective Two:.............................................................................................. 59
Demographics ........................................................................................................... 61
Frequency of Purchase.......................................................................................... 62
Fashion Orientation............................................................................................... 63
The Importance of Decision Criteria for Bed and Bath........................................ 64
Research Question Four: How Important is Color when Deciding upon Home Textile
Products (Bedding and Bath)? .............................................................................. 67
Research Question Five: How Important is Style when Deciding upon Home Textile
Products (Bedding and Bath)? .............................................................................. 67
Research Question Six: How Important is Brand Name when Deciding upon Home
Textiles Products (Bedding and Bath)? ................................................................ 68

vi
Research Question Seven: How Important is Fiber Content when Deciding upon
Home Textile Products (Bedding and Bath)? ....................................................... 68
Research Question Eight: How Important is the Availability of Packaged Product Sets
when Deciding upon Bedding Products?.............................................................. 69
Research Question Nine: How Important is Fabric Type when Deciding upon
Bedding Products? ................................................................................................ 70
Research Question Ten: How Important is Thread Count when Deciding upon
Bedding Products? ................................................................................................ 70
Research Question Eleven: How Important is Coordination of Bedding? How
Important is Coordination of Bath Products? How Important is Coordination
Between Bedding and Bath?................................................................................. 70
Research Question Twelve: What is the Preferred Retail Channel for Purchasing
Home Textile Products? What is the Most Frequently Used Retail Channel? .... 74
Research Question Thirteen: Does the Retail Market make Available Home Textile
Products that Satisfy the Preferences of Specialty Markets?................................ 75
Bedding ................................................................................................................. 76
Bath ....................................................................................................................... 77
Research Question Fourteen: Does the Level of Importance for Bedding and Bath
Criteria Differ Based on the Consumer’s Cultural Influence?.............................. 77
Findings ........................................................................................................................ 84
Research Objective One............................................................................................ 84
Research Question One......................................................................................... 84
Research Question Two ........................................................................................ 84
vii
Research Objective Two............................................................................................... 85
Bedding ..................................................................................................................... 85
Bath ........................................................................................................................... 86
Coordination ............................................................................................................. 87
Retail Channels, Shopping Frequency and Orientation............................................ 87
Cultural Influence ..................................................................................................... 87
Research Considerations............................................................................................... 88
CHAPTER V .................................................................................................................... 89
Summary....................................................................................................................... 89
Conclusions................................................................................................................... 89
Research Objective One............................................................................................ 89
Research Objective Two ........................................................................................... 90
Implications .................................................................................................................. 91
Recommendations for Future Research........................................................................ 95
REFERENCES.................................................................................................................98
APPENDIX A................................................................................................................. 105
APPENDIX B ................................................................................................................. 106
APPENDIX C ................................................................................................................. 108
APPENDIX D................................................................................................................. 109
APPENDIX E ................................................................................................................. 110
Table E1. Descriptive Statistics from ANOVA: 9c1 and Importance of Bedding Criteria
.................................................................................................................................... 110
Table E2. Descriptive Statistics from ANOVA: 9c1 and Importance of Bath Criteria111
Table E3. ANOVA Results for 9c1 and Importance of Bedding Criteria ................. 112

viii
Table E4. ANOVA Results for 9c1 and Importance of Bath Criteria ....................... 113
Table E5. Least Squared Differences Analysis for 9c1 and Bedding Criteria .......... 114
Table E6. Least Squared Differences Analysis for 9c1 and Bath Criteria ................ 115
ix
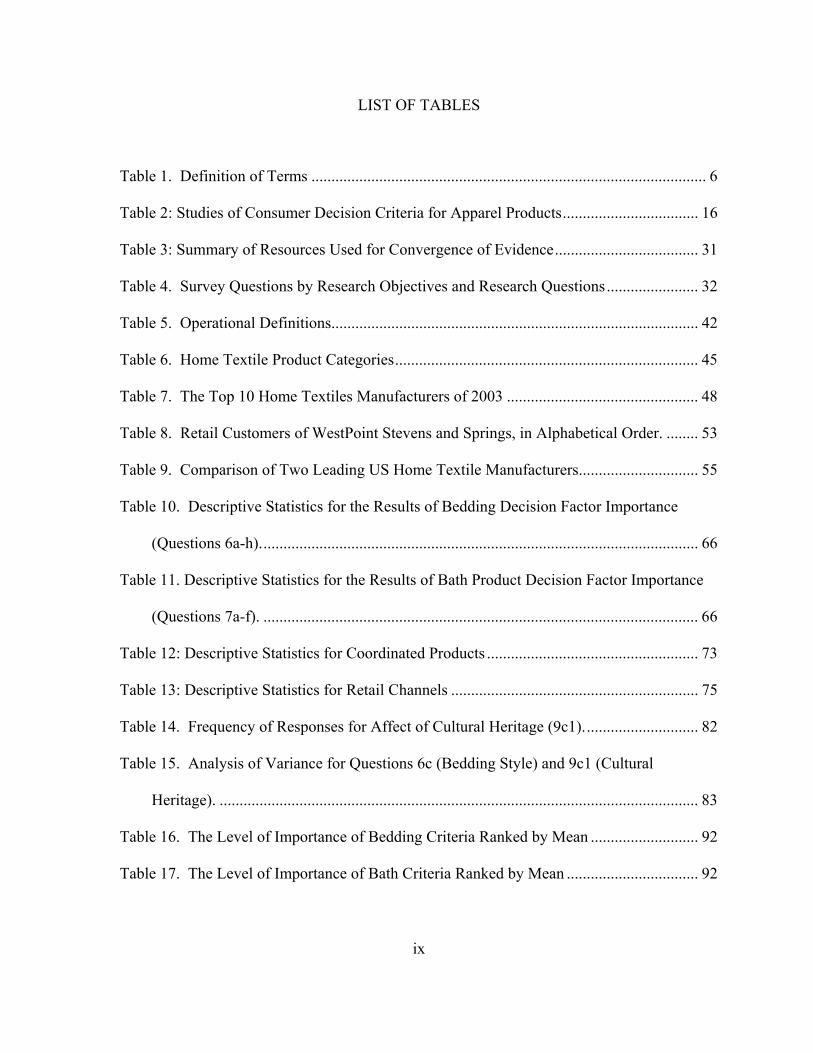
LIST OF TABLES
Table 1. Definition of Terms ................................................................................................... 6
Table 2: Studies of Consumer Decision Criteria for Apparel Products.................................. 16
Table 3: Summary of Resources Used for Convergence of Evidence.................................... 31
Table 4. Survey Questions by Research Objectives and Research Questions....................... 32
Table 5. Operational Definitions............................................................................................ 42
Table 6. Home Textile Product Categories............................................................................ 45
Table 7. The Top 10 Home Textiles Manufacturers of 2003 ................................................ 48
Table 8. Retail Customers of WestPoint Stevens and Springs, in Alphabetical Order. ........ 53
Table 9. Comparison of Two Leading US Home Textile Manufacturers.............................. 55
Table 10. Descriptive Statistics for the Results of Bedding Decision Factor Importance
(Questions 6a-h).............................................................................................................. 66
Table 11. Descriptive Statistics for the Results of Bath Product Decision Factor Importance
(Questions 7a-f). ............................................................................................................. 66
Table 12: Descriptive Statistics for Coordinated Products ..................................................... 73
Table 13: Descriptive Statistics for Retail Channels .............................................................. 75
Table 14. Frequency of Responses for Affect of Cultural Heritage (9c1)............................. 82
Table 15. Analysis of Variance for Questions 6c (Bedding Style) and 9c1 (Cultural
Heritage). ........................................................................................................................ 83
Table 16. The Level of Importance of Bedding Criteria Ranked by Mean ........................... 92
Table 17. The Level of Importance of Bath Criteria Ranked by Mean ................................. 92

x
LIST OF FIGURES
Figure 1. Model of Buyer Behavior. Adapted from Kotler & Armstrong, 2001, p. 171........ 7
Figure 2. Hispanics by Origin: 2000. From U.S. Census Bureau, Current Population Survey,
March 2000. .................................................................................................................... 18
Figure 3. Operationalized Model of Buyer Behavior. Adapted from Kotler & Armstrong
2001................................................................................................................................. 28
Figure 4. Convergence of Evidence Approach. Adapted from Yin (2003). ......................... 29
Figure 5. Bathroom Product Market, 2002. Adapted from Lazich, 2004............................. 45
Figure 6. Bedding Market Sales, 2003. Adapted from Lazich, 2004 ................................... 46
Figure 7. Respective Market Share of the Top Five US Home Textile Manufacturers......... 49
Figure 8. Question 8d: Respondent Age ................................................................................ 61
Figure 9. Question 8f: Respondent Income ........................................................................... 62
Figure 10. Frequency of Responses for Questions 8a and 8b: Frequency of Purchase of
Bedding and Bath Products............................................................................................. 63
Figure 11. Question 8c: The Importance of Keeping Up with the Latest Home Fashion Trend
......................................................................................................................................... 64
Figure 12. Purchase Criteria for Bedding and Bath............................................................... 65
Figure 13. Question 3: Packaging Preferences of Bedding Products. ................................... 69
Figure 14. Question 4a: The Importance of the Availability of Coordinated Bedding
Products........................................................................................................................... 71
Figure 16. Question 5: The Importance of the Availability of Coordination Between Bedding
and Bath Products. .......................................................................................................... 73

xi
Figure 17. Question 1: Most Frequented Retail Channel ...................................................... 74
Figure 18. Questions 9a and 9b: Frequency of Color Preferences for Bed and Bath. ........... 79
1
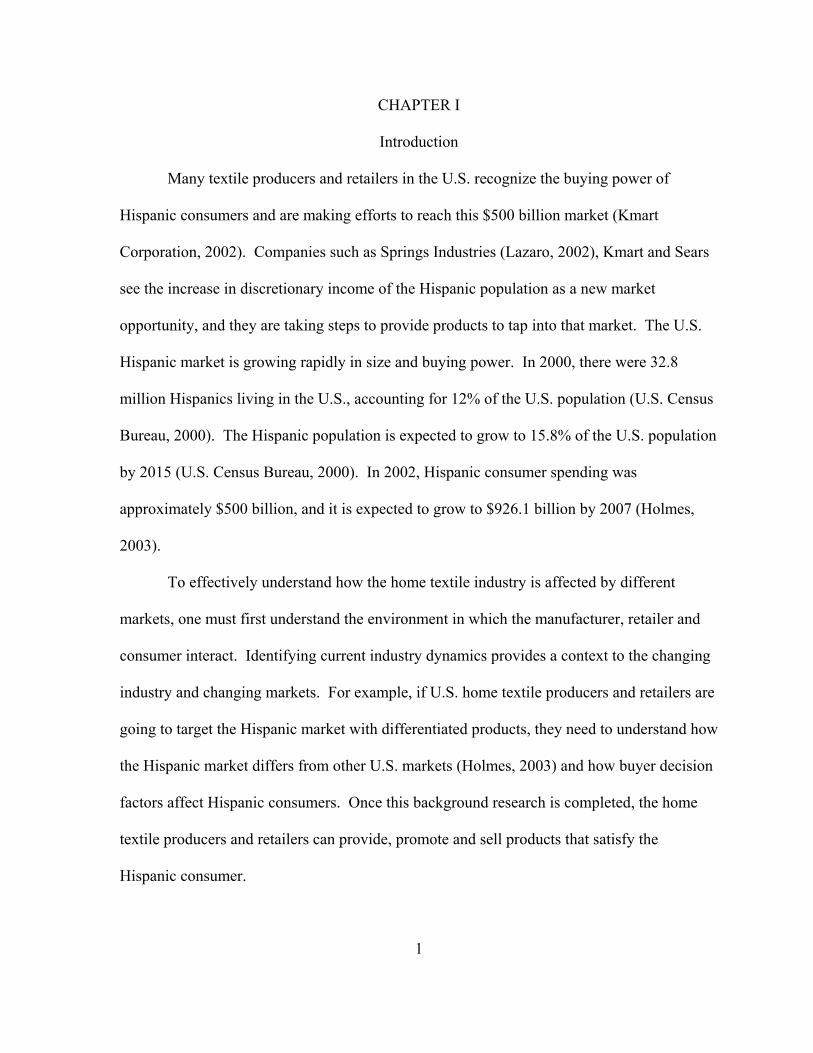
CHAPTER I
Introduction
Many textile producers and retailers in the U.S. recognize the buying power of
Hispanic consumers and are making efforts to reach this $500 billion market (Kmart
Corporation, 2002). Companies such as Springs Industries (Lazaro, 2002), Kmart and Sears
see the increase in discretionary income of the Hispanic population as a new market
opportunity, and they are taking steps to provide products to tap into that market. The U.S.
Hispanic market is growing rapidly in size and buying power. In 2000, there were 32.8
million Hispanics living in the U.S., accounting for 12% of the U.S. population (U.S. Census
Bureau, 2000). The Hispanic population is expected to grow to 15.8% of the U.S. population
by 2015 (U.S. Census Bureau, 2000). In 2002, Hispanic consumer spending was
approximately $500 billion, and it is expected to grow to $926.1 billion by 2007 (Holmes,
2003).
To effectively understand how the home textile industry is affected by different
markets, one must first understand the environment in which the manufacturer, retailer and
consumer interact. Identifying current industry dynamics provides a context to the changing
industry and changing markets. For example, if U.S. home textile producers and retailers are
going to target the Hispanic market with differentiated products, they need to understand how
the Hispanic market differs from other U.S. markets (Holmes, 2003) and how buyer decision
factors affect Hispanic consumers. Once this background research is completed, the home
textile producers and retailers can provide, promote and sell products that satisfy the
Hispanic consumer.

2
An abundance of market research exists on consumer buying behavior for apparel
products (Beaudoin, Lachance & Robitaille, 2003; Lee, Kunz, Fiore & Campbell, 2002;
Parks & Widdows, 2001; Thomas, Cassill, & Forsythe, 1991). This existing market research
reveals that consumers typically use price, style, quality, size/fit, color, fabric, brand name
and country of origin most frequently when making choices for apparel. These findings have
enabled manufacturers and retailers to tailor their marketing efforts (product, price,
placement and promotion) to accommodate consumer preferences for purchases of apparel
products. While empirical research exists on purchase behavior for apparel, little to no
empirical research exists on consumer preferences for home textile products (i.e., bed and
bath).
Current trade literature is replete with information indicating that home textile
manufacturers and retailers are emphasizing home fashion as a focus in their product line
development (SanFillipo, 2003; Scardino, 2003). The home textiles industry, once
considered primarily commodity manufacturers, is currently experiencing a shift towards
product differentiation. As consumers demand, and are willing to pay for, innovations and
new trends in home textiles, home textile companies have the opportunity for higher profit
margins. This development toward a fashion forward home textile industry is a strong
rationale for academic research on the topic. Identifying consumer preferences for home
textiles will allow manufacturers and retailers of home textiles to adapt their offerings to
capitalize on product trends and consumer preferences.

3
Purpose of the Study
The purposes of this study were to define the U.S. home textile industry by means of
an industry profile of the leading producers and specialty retailers of bedding and bath
products, explore the buyer characteristics and purchase decision factors that may be
important to U.S. Hispanic consumers as it relates to their purchases of home textile
products, and determine if products are currently available to satisfy the expressed
preferences of the Hispanic home textile consumer. Using known variables for consumer
preferences for apparel and pairing them with variables unique to home textile products (e.g.
bed-in-a-bag, thread count, sateen weave), this study explored the relative importance
Hispanic consumers place on traditional purchase variables when shopping for home
fashions.
Research Objectives
• Research Objective One: To profile the U.S. home textile industry by exploring the
manufacturing and specialty retail leaders of bedding and bath products.
• Research Objective Two: To ascertain the level of importance that traditional buyer
decision factors such as price, color and style have within the Hispanic consumer
market for home textile products.
Scope
The domestic home textile industry includes a broad range of home textile products
including kitchen, wallcoverings, bedding and bath. Due to the exploratory nature of this
research, the focus was narrowed to bed and bath products to gain a more in-depth look at

4
consumer decision factors. Although the scope of this project is limited to a small subset of
U.S. consumers of home textile products, the results of the study can be used as the
foundation for developing more extensive quantitative studies in the area of consumer
preferences for home textiles.
Limitations
The limitations of the study are associated with the exploratory research approach and
the sample size of the survey. The case study approach uses the convergence of evidence,
which allows a research phenomenon to be studied at an in-depth level from multiple angles.
By nature of the case study design, the results are not generalizable to all home textile
products and all populations. However, this approach affords a unique perspective in the
examination of a research phenomenon in which little to no empirical research exists. A
convenience sample was used in the survey portion of the data collection procedure. The
survey comprised a relatively small number of respondents (n=30), thus significance levels
found and reported in this study are limited. The results will, however, provide indications
for points of future investigation.
Significance of the Study
This research provides insight into Hispanic consumers’ preferences and buying
factors for home textiles, which is an area that has not been studied. The increasing buying
power of the fast-growing Hispanic population makes it important for the U.S. textile
industry to understand what products can be successfully targeted at Hispanic consumers. In
addition, this study will offer a profile of the fast-changing U.S. home textile industry, for
which a concise description of the industry is not currently available.

5
The textile industry’s increasing focus on home textiles may be because those
products are simpler and less time- and labor-intensive to manufacture than apparel products.
Thus, the U.S. textile industry may be able to gain new competitive advantages in
commodity products and differentiated products. The methodology of this study may serve
as a template for future research in the area of home textile product preferences.
Definition of Terms
Wide inconsistencies have been noted in the terminology and definitions of the home
textile terms. In trade literature, “home fashions,” “home furnishings,” “household textiles”
and other terms like “home goods lines” are often used interchangeably. In addition, there
are differences between terminology used by technical sectors of the textile industry and the
terminology that is used by marketers in relating product information to the consumer. For
example, “thread count” is often used by marketers to express the technical aspect of the
number of yarns per unit measure. These inconsistencies provide additional opportunity for
future research. Table 1 provides a list of major terms associated with home textiles.

6
Table 1. Definition of Terms
Term Definition
Buying decision factors The variables involved when considering a product for purchase. Also
called: “evaluative criteria” ( Hsu & Burns), “purchase decision-making”
(Kim, 2001), “purchase decision,” “buying criteria” and “decision
criteria.”
Domestics Textile products for the home such as bed and bath linens, pillows, and
kitchen linens (Jernigan & Easterling, 1990, p. 12).
Hispanic consumer Defined for the purpose of this study as an individual, characterized by
self-identity with an ethnic Hispanic group, who is a consumer in the
U.S. textile market.
Home fashions Textile products used for home end-uses such as towels, bedding,
upholstery fabrics, area floor coverings, draperies, and table linens, and
whose styles change over time in response to changing fashion trends
(Burns & Bryant, 1997, p. 391). Also referred to as “home textiles.”
Home furnishings Home furnishings are classified into six categories:
Furniture (upholstery, slip covers), Hangings (drapes, curtains),
Domestics (sheets, pillowcases, bed spreads, blankets, mattress covers),
Linens (table cloths, napkins, towels and wash cloths), Floor Coverings
(indoor and outdoor carpets, rugs, padding), Miscellaneous (lamp shades,
throw pillows) (Cohen, 1989).
Household textiles All textile products used within the home, except carpets, drapes and
curtains, wallcoverings, and upholstery, are usually considered household
textiles. Bedsheets, pillowcases, mattress pads, towels, blankets,
tablecloths, and the like constitute this category (Hatch, 1993, p.11-12).
7
CHAPTER II
Review of Literature
In this chapter, background information on existing literature that established buyer
purchase decision factors is provided. In addition, literature that describes the U.S. home
textile industry is included to establish terminology specific to the home textiles sector. This
chapter concludes with information on Hispanic buying characteristics currently defined by
existing literature, general characteristics of the Hispanic market, and discussion of industry
efforts in targeting Hispanic consumers with differentiated product mixes.
Buyer Decision Factors
Model of Buyer Behavior
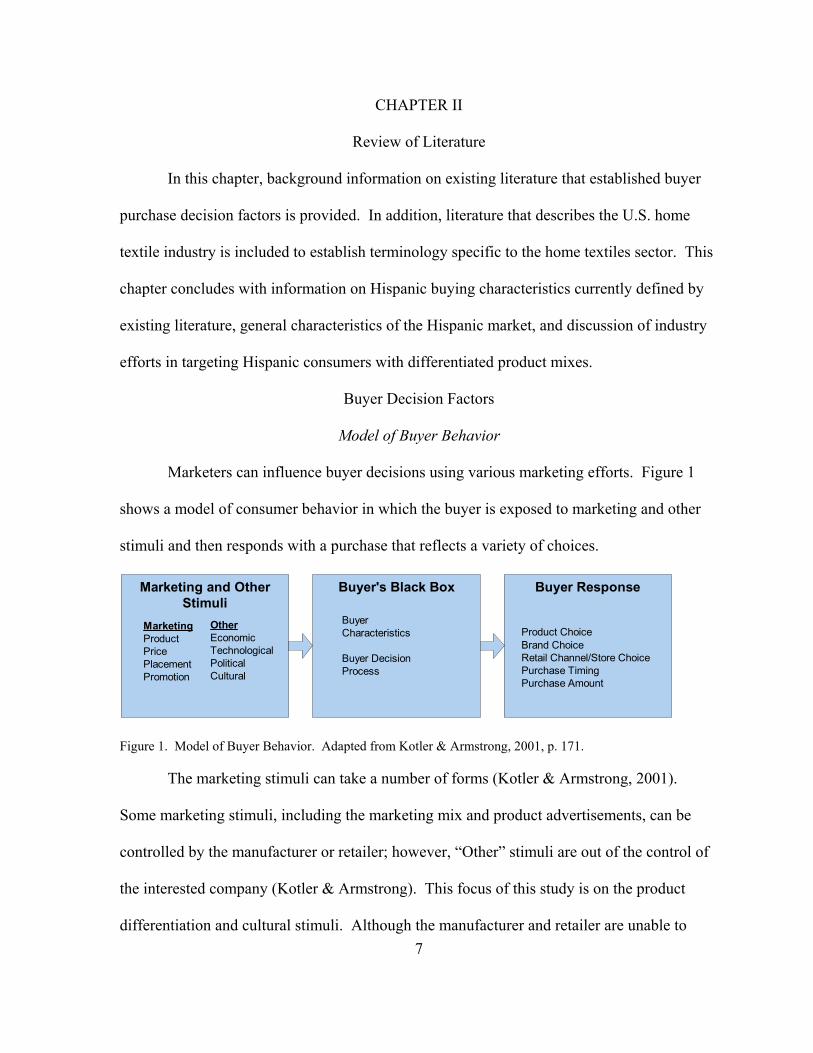
Marketers can influence buyer decisions using various marketing efforts. Figure 1
shows a model of consumer behavior in which the buyer is exposed to marketing and other
stimuli and then responds with a purchase that reflects a variety of choices.
Marketing and OtherStimuli
MarketingProductPricePlacementPromotion
OtherEconomicTechnologicalPoliticalCultural
Buyer's Black Box Buyer Response
Product ChoiceBrand ChoiceRetail Channel/Store ChoicePurchase TimingPurchase Amount
BuyerCharacteristics
Buyer DecisionProcess
Figure 1. Model of Buyer Behavior. Adapted from Kotler & Armstrong, 2001, p. 171.
The marketing stimuli can take a number of forms (Kotler & Armstrong, 2001).
Some marketing stimuli, including the marketing mix and product advertisements, can be
controlled by the manufacturer or retailer; however, “Other” stimuli are out of the control of
the interested company (Kotler & Armstrong). This focus of this study is on the product
differentiation and cultural stimuli. Although the manufacturer and retailer are unable to
8
control cultural influences, they can tailor their products to targeted consumers based on what
they know about a given consumer’s cultural influences.
The buyer’s black box is where the decision process takes place, and is the hardest
piece of the buyer decision model for marketers and companies to understand (Kotler &
Armstrong, 2001). The black box is so named because marketers can only guess how the
buyer makes his or her decision based on the stimuli they receive from the first box in the
model. Buyer characteristics that affect the decision process can include cultural, social,
personal and psychological characteristics (Kotler, 2000).
The final step in the buyer behavior model is the buyer’s response (Kotler &
Armstrong, 2001). Buyer response reflects the results of the decision process that occurred
in the black box, but does not reveal why the consumer made the choice he or she did.
Although marketers do not know how the consumer considered the stimuli they experienced,
the marketer receives feedback based on the buyer response; which products the consumer
purchases, where they purchase, when they purchase and the quantity of the item that is
purchased.
Buyer Characteristics
According to Kotler and Armstrong (2001), consumer behavior is impacted by
cultural, social, personal and psychological factors. A person’s preferences are shaped by
factors such as their age, gender, occupation, ethnicity and location. These factors differ
between consumer markets, and this study focuses on those differences between ethnic
markets, described by countless researchers, including Kim (2001) who identified purchase
decision-making in apparel and electronics.

9
Research has revealed that consumers from different markets, including markets
differentiated by ethnicity, shop in different ways (Kim, 2001). The differences in how
consumers shop for products must be considered as well as what criteria consumers use to
choose which products they will buy. For example, in examining shopping behavior within
the Hispanic market, research shows that shopping with companions or with family members
is not unique to Hispanic shoppers, but is an important part of the product buying experience
(Kim, 2001; Nichols, 1997). The time spent shopping also tends to vary between markets,
including between Hispanic markets (Nichols).
O’Neal reported in 1998 that U.S. retailers have found sufficient differences in
apparel preferences between African American consumers and other markets to offer special
apparel assortments. African American apparel consumers prefer specific aesthetic elements
of clothing that are different from the preferences of other markets (O’Neal, 1998).
Desirable characteristics of clothing were identified as “bold” and “high affect” colors and
“off beat” patterns. Similarly, Holmes (2003) reported that bright color is an expressed
preference of the Hispanic community. This preference should be taken advantage of in
product color as well as packaging (Holmes), and in the development and marketing of
apparel lines.
Hsu and Burns (2002) conducted a study to determine the difference in purchase
criteria used by Taiwanese and U.S. apparel consumers. The purpose of the study was to
compare the importance of purchase criteria for apparel items between Taiwanese and U.S.
women. One hundred nineteen Taiwanese and 84 U.S. women from a nonprobability sample
filled out a questionnaire about the importance and relative importance of the evaluative
criteria used when choosing apparel. The clothing criteria investigated were price, style,

10
quality, size/fit, color, fabric, brand name, location of manufacturer, suitability for wear on
campus, how pleasing it was to others, coordination with other clothes and comfort. The first
null hypothesis of the study was rejected—that there would be no difference between the
groups in the evaluative criteria used. The second null hypothesis—that both groups would
identify the same criteria as most important—was not rejected. Size/fit was found to be the
most important criterion for both groups, but it was found that U.S. consumers placed more
importance on comfort and quality, while Taiwanese consumers placed more importance on
appropriateness and location of manufacturer.
Kulkarni (1995) described consumer apparel selection from a psychological
perspective. The paper noted the difference between customer-oriented properties and
consumer-oriented properties. The customer-oriented properties, those that are usually
considered during the purchase process, include texture, drape and expected resistance to
shrinking of the fabric and color, style and comfort of the entire garment. The consumer-
oriented properties are those that influence the performance of the garment, and include
fabric weight, crease retention and colorfastness to washing and sunlight. According to
Kulkarni, the consumer-oriented properties are often overlooked at the time of purchase
because the buyer considers aesthetic properties and only evaluates performance factors after
purchase, causing a reduction in the perceived value if the garment does perform to the
buyer’s expectation.
Oliver (1985) examined how sex-role impacts apparel purchases. The study
examined buying patterns in traditional (husband works, wife is a homemaker) and modern
(husband and wife both work and share home responsibilities) gender roles within married
households. Husbands and wives were asked, among other topics, who in their household

11
makes decisions on color, style fabric and price of a garment. The study found few
differences purchasing patterns between modern and traditional households, but found that
the husband is responsible for much of the decision making for his own clothing—a finding
counter to the assumption stated in the paper that wives usually choose most of their
husbands’ clothing.
Coley and Burgess (2003) studied gender differences in buying. The study compared
men and women to identify differences in affective (emotional) and cognitive (thinking)
processes involved in impulse buying. The study also sought to identify gender differences
relating to the product category of impulse purchases. Research subjects were 227 college
students chosen because impulsive buying behavior is most prominent in younger adults with
some education beyond high school. Based on existing literature, Coley and Burgess
hypothesized that there would not be a significant gender difference between the impulsive
buying behaviors of men and women regarding affective processes, cognitive processes, or
product category. The data collection tool was a survey. Statistical analysis of variance tests
were used to evaluate the survey results. All three hypotheses were rejected; there was a
significant difference in the buying behaviors of men and women.
Workman and Kidd (2000) studied the buying motivation of fashion consumer groups
using the Need for Uniqueness scale. The study aimed to test the hypothesis that people who
were fashion change agents would have more need for uniqueness than fashion followers.
Subjects in the study were 264 college students selected for convenience and because college
students possess characteristics of fashion change agents and are a large market segment.
The subjects were categorized as fashion change agents or fashion followers based on the
Measure of Innovativeness and Opinion Leadership scale and then evaluated on the Need for

12
Uniqueness scale. The hypothesis was supported in the conclusions of the research. The
study found that, when fashion change agents feel similar to others in a group, they exhibit
negative emotions and discard a current style in favor of adopting a new style. When fashion
followers feel similar to a group, they exhibit positive emotions and take no action—if the
fashion following individual feels dissimilar to the group, they exhibit behavior change by
adopting the prevalent style.
Johnson, Schofield and Yurchisin (2002) conducted research on the psychological
aspect of apparel. They studied if and how people use the appearance and dress of others to
gather information about them. The purpose of the research was to determine what
impression research subjects formed of others and what cues they used to form those
impressions. The subjects were 39 women gathered by placing an advertisement in a
newspaper. During the research, the subjects were asked questions in an interview format,
the answers were classified and categorized, and frequencies were established for each of the
responses. The study found that the subjects did form impression of others based on
appearance and dress, and that the subjects believed that others used appearance and dress
cues to form opinions about them.
As demonstrated in the research findings discussed previously, the physical (gender),
psychological (fashion orientation) and cultural (ethnicity) attributes of markets all play a
major role in shaping the way individuals in a market interpret marketing and other stimuli.
The consumer’s interpretation of that stimuli, in turn, affects the buyer decision process and
ultimately the buyer response.
13
Buyer Decision Process
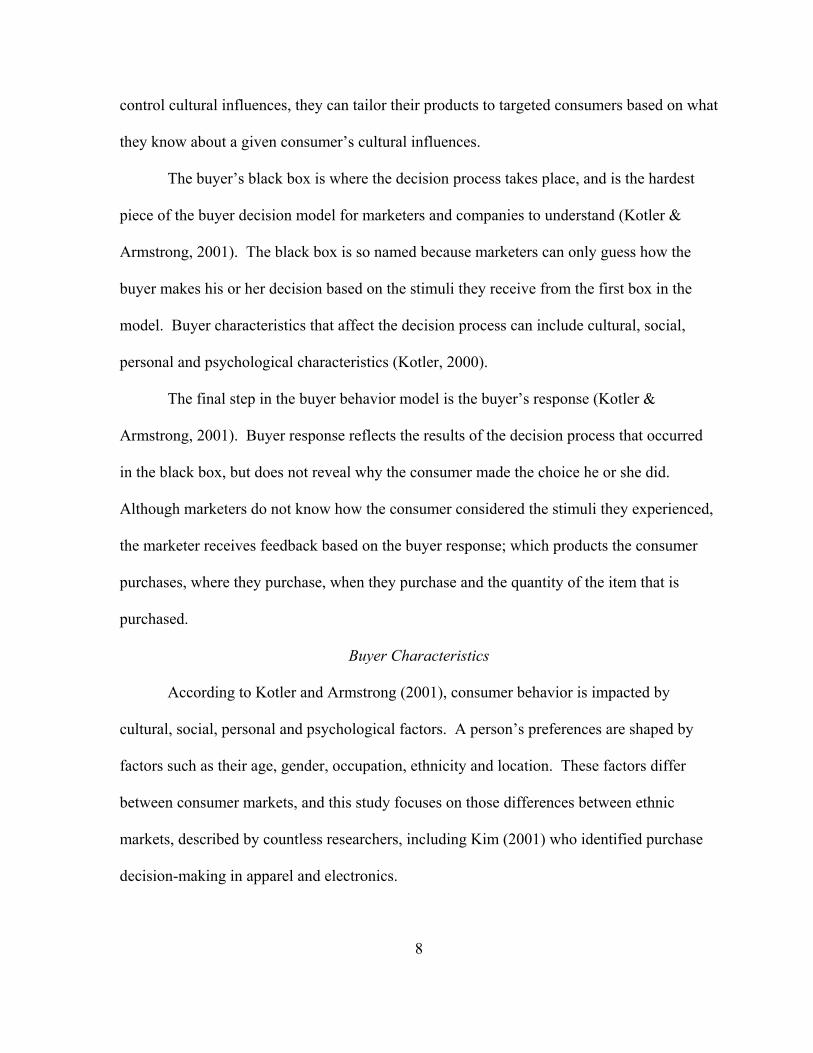
Figure 1 shows that both buyer characteristics and the buyer decision process affect
the decision made during the purchase process. Consumers use a wide range of criteria when
making decisions about purchases. According to Hsu and Burns (2002), researchers have
most often investigated the following clothing criteria: price, style, quality, size/fit, color,
fabric, brand name and country of origin. Style has been reported as the category most used
in the study of consumer clothing evaluation (Eckman, Damhorst & Kandolph, 1990). The
importance of the criteria depends on the level of involvement of the purchase (Thomas,
Cassill & Forsythe, 1991) and a wide variety of consumer variables.
Thomas, Cassill and Forsythe (1991) studied apparel involvement dimensions in
consumer purchase decisions. The study sought to find out if there are multiple dimensions
to apparel involvement and if differences in apparel involvement dimensions are related to
fiber information sources and respondent demographics. The research instrument used in the
study was a questionnaire. Examining the 177 useable responses from female apparel
consumers in malls in the southern U.S., it was found that apparel involvement has two
dimensions, “dress to express personality,” which describes women who use their apparel to
communicate who they are, and “dress as a signaling device,” which describes women who
determine how others see them based on their apparel. The study also found that current
apparel marketing did not sufficiently emphasize fiber content. The research project is
germane to this study because a similar research instrument was used on female subjects to
investigate purchase behavior.
A staff report published in Home Textiles Today (2000) reported on the opinions of
six merchandisers from various companies at the Spring Home Textile Market in High Point,

14
North Carolina. The merchandisers were asked if consumers make product decisions based
on the aesthetics of a product, or based on the brand or designer of the product. A respondent
in the study identified brands and designer names as part of the product differentiation within
a store. A merchandise manager for an online retailer indicated that designer labels are rarely
carried by internet-only home textile retailers. Design, color and timing of product
availability were identified as important consumer decision factors. Similarly, another
merchandiser said designer names are important to product sales, but that carrying
merchandise for targeted customers is more important.
Eckman, Damhorst and Kandolph (1990) conducted a two-part study to identify the
criteria used by consumers to evaluate women’s apparel. The study first summarized
findings from 22 studies published between 1971 and 1988 that looked at evaluative criterion
for apparel. Rating scales were used in more than half of those existing studies. Four
categories of intrinsic and one category of extrinsic criteria were established to group the
criteria identified in the studies: product composition (style, color, appearance etc.),
performance (care, size/fit, durability, comfort etc.), quality (construction, fabric etc.), sex
appropriateness and extrinsic criteria (brand, price, store, approval of others, etc.). The
second part of the study, conducted in 1986, involved asking 80 female consumers open-
ended questions about the criteria they had used when evaluating a piece of apparel during a
shopping trip. Responses from the interviews were grouped into four separate criteria
categories: aesthetic, usefulness, performance/quality and extrinsic criteria. The researchers
noted that none of the responses included the apparel item’s country of origin. The most
frequent responses were style, color, fit, fabric, appearance and price. The results of this
study reflect preferences of consumers in 1986, when the data was collected.

15
No existing research has been found on decision factors for home textiles purchases.
In the absence of such research, this study will draw a parallel from the ample research on the
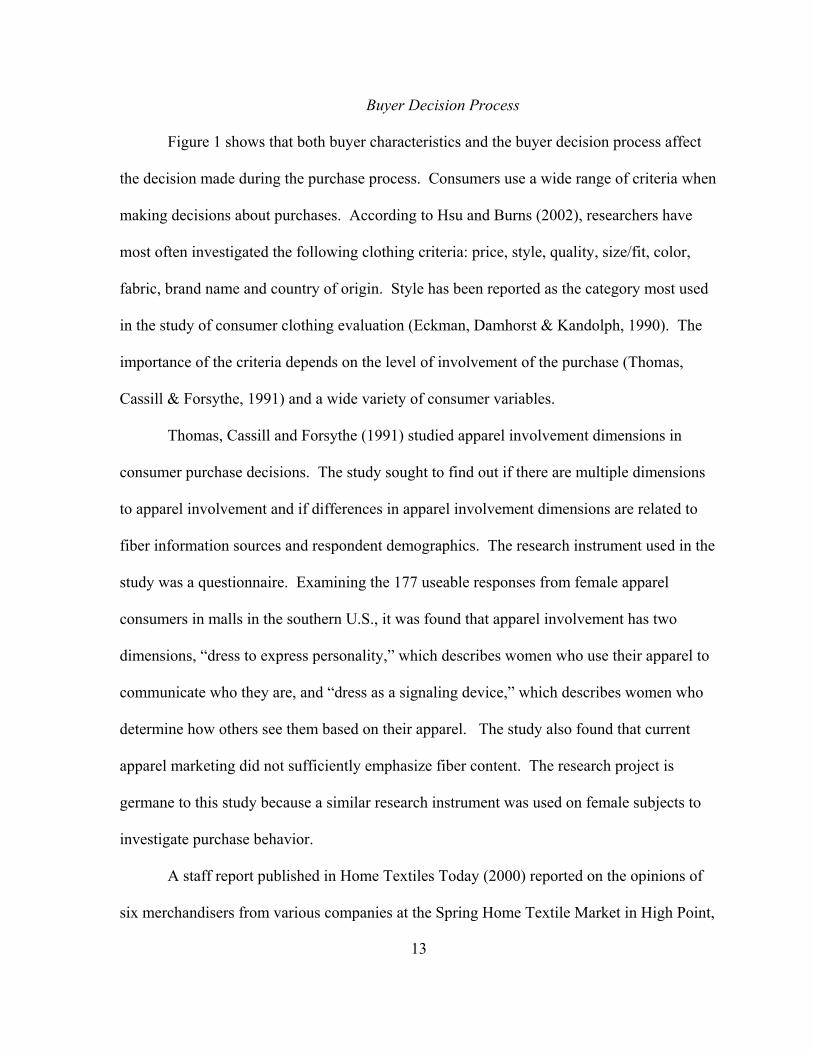
criteria used by consumers to evaluate clothing for purchase. Table 2 lists the decision
criteria identified by other studies of consumer buying behavior.
16
Table 2: Studies of Consumer Decision Criteria for Apparel Products
Study Type of Research
Criteria Subjects Product Question method
Buying Decisions may depend on look, label (2000)
Trade Style, color, brand/designer name, timing of availability
Trade Professionals
Home Textiles Open-ended
Eckman, Damhorst & Kandolph (1990)
Academic Part 1: 22 Existing Studies Varied Apparel Rating Scales/ Lists
Extrinsic:
Price, brand/label, country of origin, store, coordination with wardrobe, salesperson's evaluation, department in store, approval of others, warranty
Intrinsic (4 categories):
Product composition: style, color/design, fabric, appearance, fiber content
Performance: care, size/fit, durability, comfort, safety, colorfastness
Quality: Construction, physical, fabric
Sex appropriateness
Academic Part 2: 1990 Study Consumers Apparel Open-ended
Responses coded into 4 categories:
Aesthetic, usefulness, performance and quality, extrinsic
Hsu & Burns (2002) Academic College Students Apparel
7 Point Rating Scale
Fabric, comfort, size/fit, quality, location of manufacturer, color, how pleasing the apparel is to others, brand name, appropriateness for campus wear, price, style, coordination with other clothing
Kim (2001) Academic
Ethnic group, product, informational influences, store image, store convenience Consumers
Apparel and Electronics
5 Point Rating Scale
Kulkarni (1995) Academic Customer Oriented Properties (aesthetics) Unidentified Apparel Unidentified
Comfort, color, style and tactile properties of fabric
Consumer Oriented Properties (performance)
Fabric weight, crease retention, color fastness to washing and light
Oliver (1985) Academic Color, style, fabric, price Newly-married couples Apparel Lists
Thomas, Cassill & Forsythe (1991) Academic
Apparel involvement, demographics, fiber information sources Consumers Apparel
Rating Scales
17
The U.S. Hispanic Market
According to the 2000 U.S. Census, there were 32.8 million Hispanics living in the
United States, accounting for 12% of the U.S. population (U.S. Census, 2000). Hispanics are
now the largest minority group in the U.S. (Schmidt, 2003). Furthermore, U.S. residents of
Hispanic origin are expected to make up 13.3% of the U.S. population in 2005 and 15.8% of
the population by 2015 (U.S. Census, 2002). Discrepancies in numbers exist between some
reports because the Hispanic community is growing so quickly. Georgia has the fastest-
growing Hispanic population of all U.S. states, followed by North Carolina, Nevada,
Kentucky and South Carolina (Armas, 2003). It is noteworthy to mention that the terms
Latino and Hispanic are used interchangeably in the 2000 Census study and in others, which
adds additional complexity to the accuracy in the total population count.
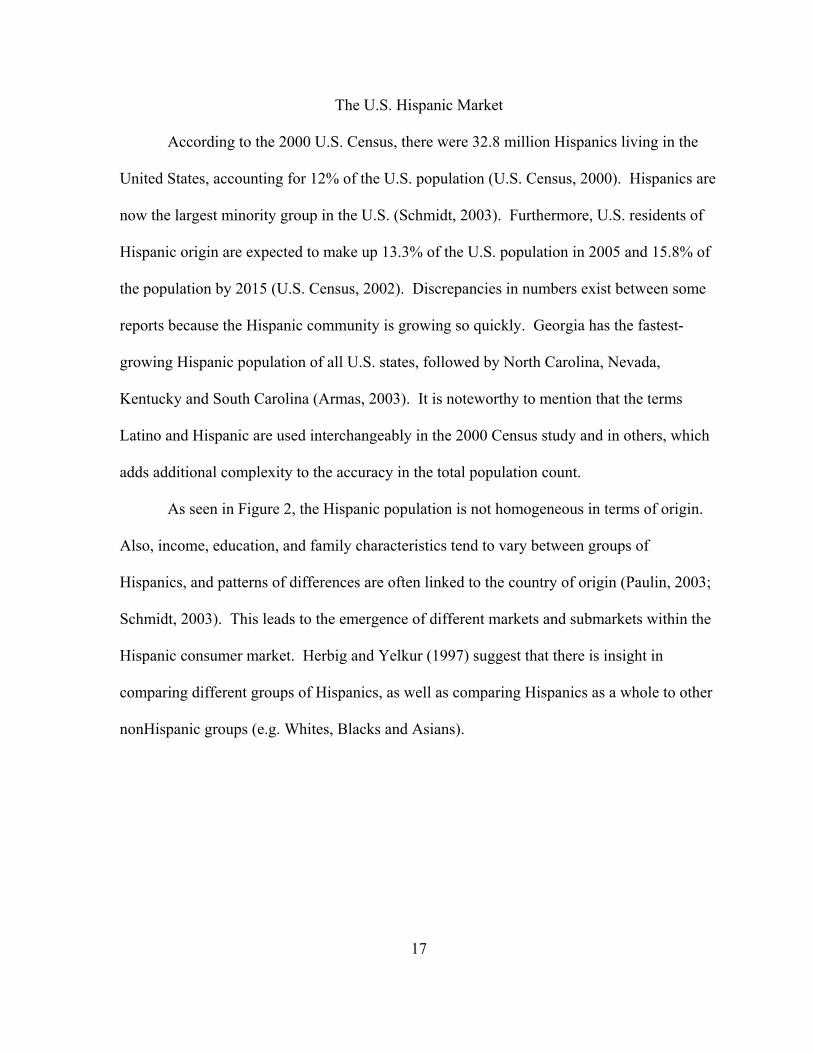
As seen in Figure 2, the Hispanic population is not homogeneous in terms of origin.
Also, income, education, and family characteristics tend to vary between groups of
Hispanics, and patterns of differences are often linked to the country of origin (Paulin, 2003;
Schmidt, 2003). This leads to the emergence of different markets and submarkets within the
Hispanic consumer market. Herbig and Yelkur (1997) suggest that there is insight in
comparing different groups of Hispanics, as well as comparing Hispanics as a whole to other
nonHispanic groups (e.g. Whites, Blacks and Asians).
18
Figure 2. Hispanics by Origin: 2000. From U.S. Census Bureau, Current Population Survey, March 2000.
In regard to education, Hispanic students are making up more of the student
population at universities around the country (Schmidt, 2003). Hispanics currently account
for 9.5% of students at higher-education institutions, and this figure is expected to rise
dramatically as the large population of Hispanic children reaches college age (Schmidt). As
of 2003, more than 240 colleges in the U.S. (including Puerto Rico) have been designated
“Hispanic-serving institutions,” and have a student population of at least 25% Hispanics
(Schmidt). However, not all Hispanic groups are entering college at the same rate.
Hispanics of Cuban descent are just as likely as their White counterparts to go to college,
while Hispanics of Mexican decent attend college at about half the rate of White people of
the same age. Hispanics of any origin are more likely to graduate from high school and
attend college if they were born in the U.S. than if they were born abroad.
Hispanics by Origin: 2000(In Percent)
14.5
9.0
4.0
6.466.1
Central and South American Puerto RicanCuban Other HispanicMexican

19
Income and Buying Power
Companies are trying to capture the $500 billion-plus buying power of the Hispanic
market (Kmart Corporation, 2002). Hispanic buying patterns are already being observed.
For example, the U.S. Department of Labor indicates that Hispanics spend more on furniture
and footwear compared to nonHispanics (Dybis, 2003). Because the buying power of the
Hispanic community is increasing rapidly, marketers are looking for ways to get their
products to the Hispanic buyer. Between 2000 and 2007, Hispanic consumer spending is
expected to grow from $490.7 billion to $926.1 billion (Holmes, 2003). It should be noted
that there is a similar amount of variation in average income for Hispanic household as
compared to the average incomes of other groups (U.S. Census, 2003), and the number of
Hispanic households in the U.S. are increasing.
Advertising to Hispanic Markets
TV networks are a promising outlet for reaching Hispanic consumers, and companies
are realizing this. Even during economic slowdowns, advertisers continue their marketing to
Hispanic consumers because the Hispanic market is growing and highly desirable (Webster,
2001). The 2000 census was partly responsible for the latest surge in advertising to
Hispanics via Spanish-language television stations. The census opened many marketers’
eyes to the growth of the Hispanic market. Spending on Latino TV increased by 15 % in the
second quarter of 2003 (Mucha, 2003). Even when most marketers might reduce advertising
budgets for the majority of their products due to an economic slowdown, Spanish-language
TV networks continue to benefit from product advertisements because marketers want to
reach the growing population of Hispanics (Webster). This information is key to U.S.
20
manufacturers and retailers of home textile products, especially those targeting Hispanic
consumers.
Herbig and Yelkur (1997) report that U.S. corporations are aware of the growing
Hispanic market and the increasing buying power of that market. Herbig and Yelkur cite
Hispanic demographics and the manner in which Hispanics are portrayed by advertisers.
There are three main mistakes made by marketers when trying to reach Hispanics. The most
frequent is the inclination to treat the Hispanic market as a part of the nonHispanic White
market. The marketing strategies that are proven to work with existing markets need to be
modified to be effective with Hispanics. Second, the Spanish language must be understood
to ensure that messages are correctly translated, and direct translations must be examined for
alternative colloquial meanings. Finally, distinctions must be made between different
Hispanic groups from different areas of origin. Different Hispanic groups will have different
demographic factors that affect their preferences, including income, education and family
characteristics.
As the home textile industry experiences a general shift towards being fashion
forward, market segmentation will increase as Hispanic consumers demand new styles.
Identifying Hispanic consumer preferences for home textiles will allow manufacturers and
retailers of home textiles to adapt their current and new product offerings to capitalize on
fashion trends and consumer preferences.
Hispanic Buying Behavior
Mulhern and Williams (1994) investigated Hispanic shopping behavior to determine
if store-level retail sales in areas with high concentrations of Hispanics of Mexican decent
were consistent with purchase behaviors described in self-reports of the same population.

21
Hispanics of Mexican decent were chosen as the population of interest because Hispanics of
Mexican decent make up two-thirds of Hispanics in the U.S.. The researchers tested
hypotheses related to price sensitivity, brand substitution, store brands, and national brands.
Using retail scanner data from grocery stores, market response models were estimated for
market areas with very high concentrations of Hispanic consumers, and separate market
response models were estimated for areas with very low concentrations of Hispanic
consumers. The two market response models were compared. Price responsiveness was
found to be substantial in Hispanic markets, but was not consistently higher than in
nonHispanic markets. Brand substitution was hypothesized to be less in Hispanic markets,
but was not found to be statistically different than in nonHispanic markets. Most
interestingly, and contrary to other research, Mulhern and Williams found that the Hispanic
areas did not have any more of a national brand preference than the nonHispanic markets in
this study. This refutes the common assertion that Hispanic consumers are more brand-loyal
than other consumer markets.
Kotler (2000) points out that the U.S. Hispanic subculture has grown large enough to
account for a distinct market and warrants specialized marketing programs. Kotler also
highlights that the Hispanic market is segmented by level of acculturation. For example,
Chicago and Miami are two of the top five Hispanic markets in the U.S., but the less-
acculturated Cuban-American population of Miami demands different products than the
highly-acculturated Puerto Rican population of Chicago. Less-acculturated markets have a
higher demand for traditional foods including canned sliced cactus and fried plantains.
Solomon and Rabolt (2004) describe a variety of ways to segment the Hispanic
market. Like other markets, the U.S. Hispanic market can be segmented by age, but it is
22
important to note that the Hispanic market is a relatively young market—the number of
Hispanic teens is expected to increase at six times the overall rate of teen growth. Like other
authors, Solomon and Rabolt distinguish between Hispanics of different countries of origin.
For example, Cuban Americans are different than Mexican Americans in that they tend to be
wealthier than other segments, but make up a relatively small proportion of Hispanics.
Mexican Americans are the largest proportion of Hispanic Americans and often have larger
household sizes.
Marketing Efforts towards the Hispanic Market
Kmart is trying to cater to its Hispanic demographic, which accounts for 17% of
Kmart’s sales, with a new apparel line (Kmart spices up apparel mix, 2003). The exclusive
Kmart brand, Thalia, is designed to appeal to Hispanic consumers of women’s and girls’
apparel from teens to middle-aged adults (Scardino, 2003). Attracting more Hispanic
consumers with an apparel line could help increase Kmart’s penetration of Hispanic markets
and lead to increased sales of other profitable merchandise. This investment may give Kmart
a strategic advantage over other mass-merchandisers like Target and Wal-mart by being the
first to attract the Hispanic audience (Dybis, 2003).
Thalia’s Misses size apparel products range from t-shirts with Spanish-language logos
to trendy, brightly colored apparel, which are much different than Kmart’s standard apparel
offering. Thalia product lines currently include a home textile line and women’s and girls’
apparel including footwear, accessories, and lingerie. The home goods line consists of five
collections and includes bedding (ensembles contain a comforter, shams, bed skirt and sheet
set), and bath (bath towels, hand towels, wash cloths, shower curtains, bath rugs and
nontextile accessories) as well as a valance and small table cover for each collection. The

23
five home collections vary slightly in their product offerings (not all collections include all
bedding and bath items), and consist of the Apasionado, Flamenco, Peacock Feathers,
Sangria and Safari collections. The Safari collection features black and white patterns
including zebra stripes; other collections have bold colors or vibrant bright patterns.
The Thalia brand is based on a partnership with Latina singer Thalia Sodi. The brand
will be exclusive to Kmart stores, supplementing their existing collection of exclusive brands
(Kmart Corporation, 2002). Kmart’s brand-dependent strategy has worked well with its
Martha Stewart Everyday and Joe Boxer brands, both exclusive to Kmart. The July 2002
launch of Joe Boxer is credited with helping Kmart emerge from bankruptcy (Scardino,
2003).
Kmart’s careful look at the true buyers of these trendy clothes is a strong indication
that the product will succeed. Another strong approach is Kmart’s dedication to becoming a
“Store of the Neighborhood” (Scardino, 2003). To help target the most profitable consumers
for the Thalia line, it is only being offered in select stores where Hispanic consumers are
expected to patronize most. As of mid-2003, Thalia lines were only offered in 335 of
Kmart’s more than 1500 stores (Scardino).
Kmart is not the only company targeting apparel directly at Hispanic consumers.
Sears, the nation’s largest chain of department stores, is offering a women’s apparel line
under the name of a well-known Hispanic celebrity (Mucha, 2003). Cuban-American Lucy
Pereda is the host of a popular Spanish-language TV show, En Casa de Lucy, and has been
called the Hispanic Martha Stewart (Yue, 2003). Sears has already been courting the
Hispanic community with Nuestra Gente, a Spanish-language quarterly magazine. Nuestra
Gente has featured articles authored by Pereda (Mucha).
24
In contrast to Kmart’s Thalia label, the Lucy Pereda line is targeted at Hispanic
consumers older than 25 (Yue, 2003). The new line is sensible but very feminine, with
brighter colors to appeal to the Hispanic market.
The Lucy Pereda line currently available in 227 Sears stores—those that are
Hispanic-designated (Lisanti, 2003) as well as in additional stores in Puerto Rico (New Sears
apparel licensor looks toward home, 2003). Hispanic-designated stores are those Sears stores
in areas where the population is at least 15 % Hispanic. Because the line is presently limited
to Hispanic-designated stores, it is only available in 22 states (Yue 2003). By spring 2004,
the collection will be introduced to general markets for a total of 450 stores (New Sears,
2003). The next step for the Lucy Pereda line will be a home collection focusing on home
textiles. The home collection is expected to be in stores in 2004 or early in 2005 (New Sears,
2003).
Summary
The literature for buyer behavior reveals that price, style, size/fit, color, fabric, brand
name and country of origin appear to be the most frequently tested variables in studies
related to consumer purchase behavior for apparel. These variables will be used as part of
the framework in exploring consumer preferences for home textile products. The literature
also demonstrates that the rapidly expanding Hispanic consumer population is well-
documented by governmental, academic, and news sources. Based on existing research in
the apparel industry, the U.S. Hispanic market is one in which an academic focus for
consumer preferences for home textile products is warranted and will have implications for
home textile manufacturers and retailers who are attempting to provide differentiated
products to meet the needs of the U.S. Hispanic market.
25
CHAPTER III
Research Methodology
The purposes of this study were to define the U.S. home textile industry by
constructing an industry profile, and to explore the buyer characteristics and decision factors
that may influence U.S. Hispanic consumers as it relates to their preferences for home textile
products. Consumer preferences for apparel have been researched extensively for many
years (Eckman, Damhorst & Kandolph, 1990; Hsu & Burns, 2002; Kulkarni, 1995; Thomas,
Cassill & Forsythe, 1991; Workman & Kidd, 2000). Concepts from the body of knowledge
of apparel purchase decisions were applied to this study to understand Hispanic consumers’
preferences for home fashions. Understanding home textile purchase decisions for specific
markets is especially important in the current home textile industry as manufacturers and
retailers of bed and bath products increasingly participate in product differentiation as
competitive strategies.
Research Objectives
There are fourteen research questions, segmented by the two main research
objectives.
• Research Objective One: To profile the U.S. home textile industry by exploring the
manufacturing and specialty retail leaders of bedding and bath products.
Research Question One: Who are the leading manufacturers in the U.S. home textile
industry? What are their respective approaches to
a. Customer
b. Product
c. Market Strategy

26
Research Question Two: Who are the leading specialty retailers of bedding and bath
products? What are their respective approaches to
a. Customer
b. Product
c. Market Strategy
• Research Objective Two: To ascertain the level of importance that traditional buyer
decision factors such as price, color and style have within the Hispanic consumer
market for home textile products.
Research Question Three: How important is price when deciding upon home textile
products (bedding and bath)?
Research Question Four: How important is color when deciding upon home textile
products (bedding and bath)?
Research Question Five: How important is style when deciding upon home textile
products (bedding and bath)?
Research Question Six: How important is brand name when deciding upon home
textile products (bedding and bath)?
Research Question Seven: How important is fiber content when deciding upon home
textile products (bedding and bath)?
Research Question Eight: How important is the availability of packaged product sets
when deciding upon home textile products (bedding and bath)?
Research Question Nine: How important is fabric type when deciding upon bedding
products?
27
Research Question Ten: How important is thread count when deciding upon bedding
products?
Research Question Eleven: How important is coordination of bedding? How
important is coordination of bath products? How important is coordination between
bedding and bath?
Research Question Twelve: What is the preferred retail channel for purchasing home
textile products? What is the most frequently used retail channel?
Research Question Thirteen: Does the retail market make available home textile
products that satisfy the preferences of specialty markets?
Research Question Fourteen: Does the level of importance for bedding and bath
criteria differ based on the consumer’s cultural influence?
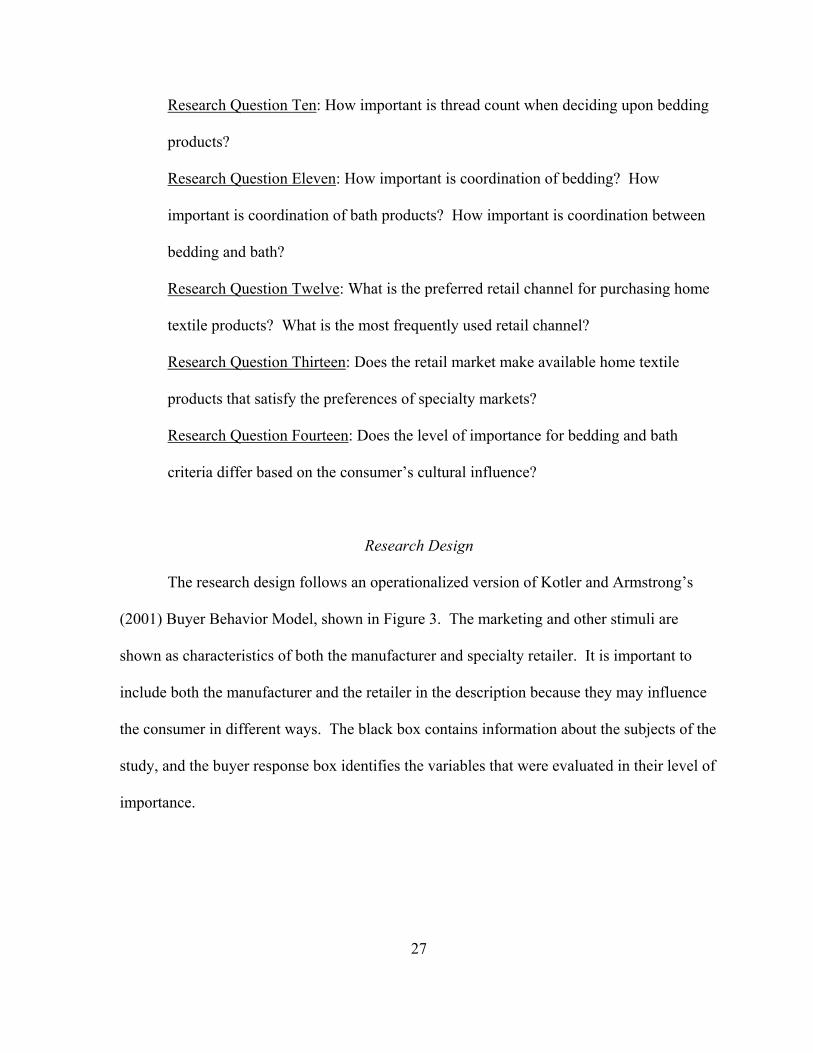
Research Design
The research design follows an operationalized version of Kotler and Armstrong’s
(2001) Buyer Behavior Model, shown in Figure 3. The marketing and other stimuli are
shown as characteristics of both the manufacturer and specialty retailer. It is important to
include both the manufacturer and the retailer in the description because they may influence
the consumer in different ways. The black box contains information about the subjects of the
study, and the buyer response box identifies the variables that were evaluated in their level of
importance.

28
Manufacturer SpecialtyRetailers
Black Box
*Women*Age 18-23*College Student*Hispanic*live in NorthCarolina
Hispanic BuyerResponses
Marketing:
ProductOther:
Cultural
Bed Bath Bed Bath
*Price*Color*Style*Brand Name*Fiber Content*Packaged Sets*Fabric Type*Thread Count*Frequency of Purchase*Retail Channel
Marketing:
ProductOther:
Cultural
Figure 3. Operationalized Model of Buyer Behavior. Adapted from Kotler & Armstrong 2001.
First described in Figure 1, the most important feature of the marketing stimuli for the
purposes of this study is the marketing of the product, while the most important of the
“other” stimuli is the influence of the consumer’s culture. For this study, the buyer
characteristics that affect the decision process shown in the “black box” were determined by
the sample. The buyer responses in the final box reflect the preferences indicated by the
respondents of the survey.
A case study methodology, using Yin’s (2003) convergence of evidence approach
was selected as the framework to study the consumer buying preferences in home textiles.
No prior empirical research has been conducted in this area thus this research provides a
foundation for future study.
The convergence of evidence approach (Yin, 2003) identifies six of many potential
sources of information from which to draw information for a case study: archival records,
documents, observations (direct and participant), structured interviews and surveys, focus
groups and open-ended interviews. As illustrated in Figure 4, four sources of evidence are
used: archival records, observations, documents and structured interviews and surveys.

29
FACT
ArchivalRecords
DirectObservations Documents
StructuredInterviews
and Surveys
Figure 4. Convergence of Evidence Approach. Adapted from Yin (2003).
The four sources of evidence used in this study describe the U.S. home textile
industry on the whole instead of identifying four separate topics. In order to fully describe
the U.S. home textile industry, the industry, retailer and consumer aspects must all be
addressed. Although different sources of evidence were used for the different objectives of
this study, using these four approaches together establishes a framework for understanding
the home textile industry and for establishing a basis for understanding consumer preferences
for home textile products.
Research Objective One
Archival records, documents and direct observation were used to answer Research
Objective One, which created a profile of the U.S. home textile industry. As part of Research
Objective One, Springs Industries and WestPoint Stevens were evaluated as the two leading
home textile manufacturers using archival data and documents. Bed Bath & Beyond and

30
Linens ‘n Things, the two leading mass specialty retailers, were evaluated and compared
using archival records, documents and observation.
Archival records that are used in this study are among the sources indicated as
appropriate by Yin (2003) and include maps and charts (geographic information system, or
GIS), lists of names (gathered from university organization websites) and census records.
Yin specifies that documents may include formal studies (existing academic studies) and
periodical articles. Documentation can be reviewed repeatedly, and it includes a broad
coverage of time and topics, but can be subject to reporting bias (Yin). One major benefit of
archival records is that they are stable sources of information that can contain precise
quantitative data. However, archives may be made deliberately inaccessible due to privacy
interests. Structured interviews were used in two instances in the course of this study. A
designer at Springs Industries was interviewed by phone and a survey was designed to gather
information from Hispanic women. Interviews and surveys collect data specific to the topic
of study and allow for emergent information, but may be subject to response bias. Direct
observations were used to gather information about Bed Bath & Beyond and Linens ‘n
Things stores to collect data about the stores’ operations and to evaluate the availability of
merchandise that reflected the preferences indicated in the survey. Direct observation is a
strong tool, and provides coverage of topics in the context of the study. The strength of
direct observation can be limited by selectivity if broad coverage is unavailable (Yin).
Research Objective Two
Research Objective Two uses a survey to gather information from research subjects.
The questionnaire instrument was developed by the researcher using variables established in
the Review of Literature (Appendix B), and includes demographic questions and questions
31
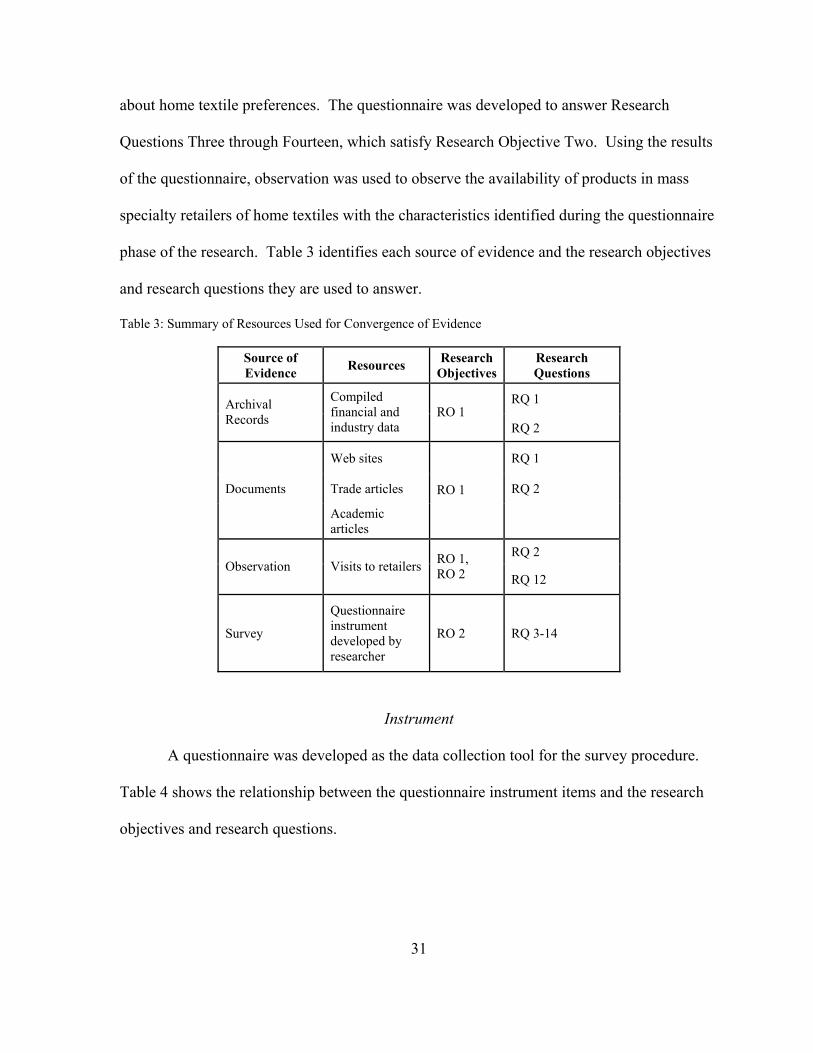
about home textile preferences. The questionnaire was developed to answer Research
Questions Three through Fourteen, which satisfy Research Objective Two. Using the results
of the questionnaire, observation was used to observe the availability of products in mass
specialty retailers of home textiles with the characteristics identified during the questionnaire
phase of the research. Table 3 identifies each source of evidence and the research objectives
and research questions they are used to answer.
Table 3: Summary of Resources Used for Convergence of Evidence
Source of Evidence Resources Research
Objectives Research Questions
RQ 1 Archival Records
Compiled financial and industry data
RO 1 RQ 2
Web sites RQ 1
Documents Trade articles RQ 2
Academic articles
RO 1
RQ 2 Observation Visits to retailers RO 1,
RO 2 RQ 12
Survey
Questionnaire instrument developed by researcher
RO 2 RQ 3-14
Instrument
A questionnaire was developed as the data collection tool for the survey procedure.
Table 4 shows the relationship between the questionnaire instrument items and the research
objectives and research questions.
32
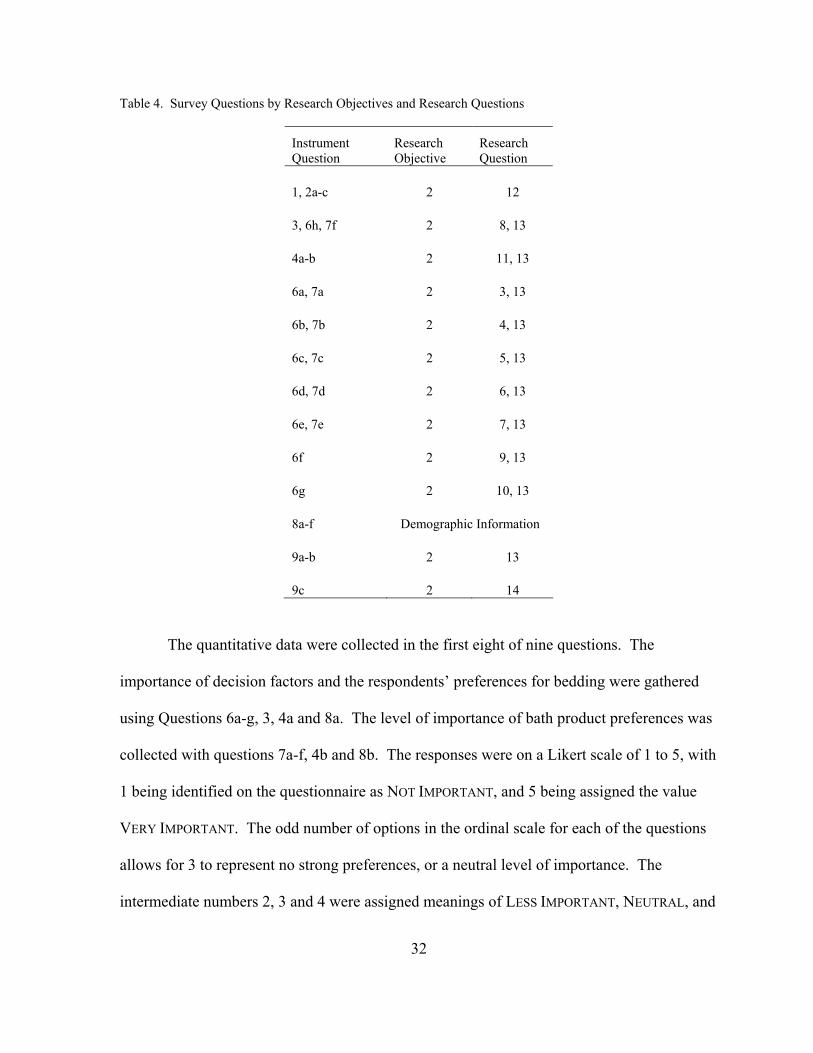
Table 4. Survey Questions by Research Objectives and Research Questions
Instrument Question
Research Objective
Research Question
1, 2a-c 2 12
3, 6h, 7f 2 8, 13
4a-b 2 11, 13
6a, 7a 2 3, 13
6b, 7b 2 4, 13
6c, 7c 2 5, 13
6d, 7d 2 6, 13
6e, 7e 2 7, 13
6f 2 9, 13
6g 2 10, 13
8a-f Demographic Information
9a-b 2 13
9c 2 14
The quantitative data were collected in the first eight of nine questions. The
importance of decision factors and the respondents’ preferences for bedding were gathered
using Questions 6a-g, 3, 4a and 8a. The level of importance of bath product preferences was
collected with questions 7a-f, 4b and 8b. The responses were on a Likert scale of 1 to 5, with
1 being identified on the questionnaire as NOT IMPORTANT, and 5 being assigned the value
VERY IMPORTANT. The odd number of options in the ordinal scale for each of the questions
allows for 3 to represent no strong preferences, or a neutral level of importance. The
intermediate numbers 2, 3 and 4 were assigned meanings of LESS IMPORTANT, NEUTRAL, and
33
MORE IMPORTANT, respectively, for the purposes of analysis. Question 5 investigated the
importance of integrating coordinated bedding and bath products. The retail channel
preferences were investigated in Questions 1 and 2a-c. Demographic results were also
gathered using qualitative responses in Questions 8c-f. Qualitative data about the
preferences were collected in the last two questions (Questions 9a-c and 10), which asked
first about bedding preferences, then bath preferences, and how the respondent felt her
cultural heritage affected those preferences. Question 10 requested general comments and
feedback about the study.
Retail Channels for Bedding and Bath Products
Question 1 addresses which retail channel is most frequently shopped by Hispanic
consumers for bedding and bath products. The measurement of the scale is: discount,
department store and specialty, with examples provided for each channel. Question 2 asks
respondents to identify their preference for shopping at each type of retail channel (discount,
department and specialty). For Question 2, a five-point Likert scale was used to capture
respondent preferences with 1 representing LEAST PREFER and 5 representing MOST PREFER.
Question 3 addresses subjects’ preferred way to purchase bedding products in terms of
packaging. Subjects were given a choice of “Individual Items,” where flat sheets, fitted
sheets and pillowcases are sold separately; “Packaged Set,” where flat sheets, fitted sheets
and pillowcases are sold together; and “Bed-in-a-bag,” where the three products, a comforter
and bed skirt are sold as one unit.
Coordinated Bedding and Bath Products
Questions 4a, 4b and 5 address the respondent’s perceived level of importance for
coordinated themes or collections of bedding products and bath products separately, and for

34
coordinated items for bedding and bath products together. For each question, the subjects
were asked to respond to a five-point Likert scale that ranged from 1 (NOT IMPORTANT) to 5
(VERY IMPORTANT).
Buyer Decision Factors for Bedding
Questions 6a-h address subjects’ perceived level of importance for price, color, style,
brand name/designer, fiber content, fabric type, thread count and the availability of packaged
sets. Fiber content, fabric type and thread count were followed by examples for clarity.
Each factor was measured on a five-point Likert scale that ranged from 1 (NOT IMPORTANT)
to 5 (VERY IMPORTANT).
Buyer Decision Factors for Bath Products
Questions 7a-f address subjects’ perceived level of importance for price, color, style,
brand name/designer, fiber content and the availability of packaged sets. Each factor was
measured on a five-point Likert scale that ranged from 1 (NOT IMPORTANT) to 5 (VERY
IMPORTANT).
Demographics
Questions 8a and 8b inquired about the number of times per year the respondent
purchases bedding (8a) and bath (8b) products. The questions had an ordinal scale of five
options with one being designated as “less than 1 [time per year],” two being designated as
“two [times per year],” three being designated as “three [times per year],” four being
designated as “four [times per year]” and five being designated as “more than five [times per
year].” The rationale for including the 8a and 8b was to establish a pattern of buying
behavior. Questionnaire items 9a through 9c were open-ended questions that allowed the
respondents to offer their own preferences in addition to those expressed in other
35
questionnaire items. These questions were formulated to answer Research Questions
Thirteen and Fourteen, which address the availability of products satisfying the preferences
of the Hispanic market and the effect of the consumer’s cultural influence. The expressed
preferences of the subjects were compared to the current offerings available in retail outlets.
Questions
There were three types of questions on the questionnaire. Multichotomous questions
(Questions 1, 3, 8 d, 8 e, and 8 f) asked the respondent to choose the item that best described
them or their preference. Questions 2 a - c, 4 a - b, 5, 6 a – h, 7 a – f and 8 a –c were
presented in a Likert scale with 1 being NOT IMPORTANT (or LESS OFTEN) and 5 being VERY
IMPORTANT (or MORE OFTEN). Questions 9a–c and Question 10 were open-ended questions.
Survey Data Collection
Initially, the questionnaire was intended to be administered in paper form during
meetings of university-affiliated groups at a number of universities in North Carolina. But
because the data collection process took place near the end of a semester, many groups had
no scheduled meetings for the next several months, or expected reduced attendance at their
scheduled meetings. To overcome this lack of accessibility to research subjects, an on-line
version of the questionnaire was developed to capture the data.
Pretest of Instrument
Before the questionnaire was administered to the subjects of the survey, it was tested
on six nonHispanic and two Hispanic pilot subjects. Throughout the course of the pilot
36
study, questions were adjusted if pilot subjects reported that the questions were unclear or
hard to answer. Adjustments that were made include:
• Store names for each retail channel—discount (Wal-Mart, Kmart, Target), department
(Sears, JCPenney, Nordstrom), and specialty (Bed Bath & Beyond, Linens ‘n Things)—
were added to clarify the retail channels in Question 1.
• Item 3 on the questionnaire was defined with examples of individual items (single fitted
sheet sold separately from flat sheet and pillowcase), packaged set (flat sheet, fitted sheet
and pillow case sold together) and bed-in-a-bag (includes sheets, pillowcase, comforter
and bed skirt).
• The format of Question 2 of the questionnaire was changed to allow respondents to
describe their preferences for each channel of distribution, regardless of their answer to
question one.
• The phrasing of Question 5 was changed to include the word “between” to distinguish the
coordination between bed and bath products from coordination of the products in bedding
only or bath only.
• Examples were added to describe fiber content, fabric type and thread count in Questions
6e, 6f and 6g, and fiber content examples were added to question 7e. The examples were
included because some of the pilot subjects indicated they did not know what the terms
meant, and suggested that less technical terminology be included.
• The responses for Questions 9a and 9b were changed from multichotomous to open-
ended questions to gather less-biased information from the questionnaire subjects. The
37
pilot study prepared the questionnaire instrument to effectively gather information from
the sample of Hispanic women.
After the online version of the questionnaire was developed, another pretest with
seven subjects took place. No rephrasing was necessary, but several changes to the
alignment and page format took place, including adjustments to the wrapping of text and
centering of radio buttons. The subjects of the online pilot study included three of the pilot
subjects from the first pretest in addition to four new subjects who had not participated in the
first pretest. The second pilot study did not include Hispanic subjects.
Survey Sample
As home textile companies focus more on the college side of back-to-school, more
information is needed to understand how college students make decisions about home
textiles. Of the $25.8 billion spent on back to college preparations in 2003 (National Retail
Federation, 2003).
College students have been used as subjects of a convenience sample in existing
published textile-related studies. For example, Lee, Kunz, Fiore, and Campbell (2002)
studied merchandising issues associated with consumer acceptance of mass customization of
apparel. The purpose of the research was to identify the type of apparel and the apparel
features that customers want to customize, preferences in customization processes and where
the customer would like to participate in the mass customization process. A convenience
sample of 131 college students was used to identify subjects for the study. College students
were chosen because they are comfortable with technology and are highly involved with
apparel and shopping. The data-gathering instrument was a quantitative survey-type

38
collection of questions. The responses of that study were analyzed using descriptive
statistics, t-tests, McNemar tests, ANOVA and Bonferroni multiple comparisons.
Targeting college students for the back to school season is becoming more common
for home textile retailers, and there is increasing competition for the market. According to
the National Retail Federation, consumers spent approximately $25.8 billion in their back to
college preparations in 2003. Of the $25.8 billion, $11.3 billion was spent by college
students (National Retail Federation, 2003). Trendy product offerings are being modified to
appeal to college students (LNT Registers at BTS, 2003) and fit their dormitory needs
(Rohrlich, 2003).
For this study Hispanic college students were targeted, and the sampling method was
a nonprobability convenience sample using the snowball approach—that is, eligible subjects
from Hispanic/Latino university organizations were asked to respond and forward the
questionnaire to other eligible subjects (Churchill & Iacobucci, 2002). Salant and Dillman
(1994) specify that, when no list from which a sample may be drawn is available, a list may
be compiled from several sources. There was no publicly available list of Hispanic women at
North Carolina universities. In this research, the web pages of universities in the North
Carolina piedmont area were searched for Hispanic, Latino or multicultural student
organizations. Seventeen organizations Hispanic or multi-cultural organizations were
initially identified. Originally, a paper version of the questionnaire was developed and the
seventeen groups were contacted via email with a request for the researcher to attend a
meeting to administer the questionnaire. From that list, thirteen organizations responded and,
of those responding organizations, three declined to participate. Five of the first seventeen
groups contacted indicated that they had no scheduled meetings for the remainder of the

39
semester, but would be willing to participate remotely. Due to the low accessibility of the
groups, the online version of the questionnaire was developed and the groups were contacted
again with a request that they distribute a link to the questionnaire. Because the second
contact regarding the online version of the questionnaire was made one week after the
original email, it served as a follow-up communication.
Three of the responding groups agreed to send a link to the online questionnaire to
their organizations’ listservs, and an additional three groups agreed to forward the
information to additional members of their organizations, but the formal listserv information
was not provided to the researcher. Several responses were obtained from members whose
organizations did not initially respond, indicating that the snowball method was relatively
effective in identifying desired participants.
After the online version of the questionnaire was developed, additional groups were
contacted because there was more geographic flexibility, as the researcher would not be
required to visit each group. In the process of locating additional student organizations, one
diversity office was identified and contacted, and responded with a list of possible
participants’ email addresses. No additional responses were received from the organizations
that were contacted after the data collection process began. Because no response to the
researcher was necessary for participation in the questionnaire, and because the number of
members of each listserv was not revealed to the researcher, the response rate was could not
be determined. By the end of the eleven-day data collection period, 30 responses had been
gathered. One hundred percent of the responses were useable.
40
Retailer Observation
Store Sample
Analysis of the survey data provided an understanding of the preferences of the
survey sample. To ascertain the availability of products matching the preferences expressed
in the survey, the researcher used the direct observation technique in the visits to Bed Bath &
Beyond and Linens ‘n Things, the two largest mass specialty retailers of home textile
products. Three cities in North Carolina were chosen for store observation. Because the
target survey sample was comprised of subjects in the Piedmont of North Carolina, the three
cities chosen were Raleigh, Greensboro and Charlotte. There were three of each store in
Raleigh and Charlotte and one of each store in Greensboro. To determine which of each
store to visit in Raleigh and Charlotte, a geographic information system (GIS) was used.
Using GIS, the exact latitude and longitude of each store was plotted, and the program used
U.S. Census data to determine the size of the Hispanic population within a 10-mile radius of
each plotted point. The stores near the highest Hispanic population were noted and visited
for observation.
In-Store Observation Procedure
Based on the results of Questions 9a and 9b of the questionnaire, data collection
sheets were created to gather information about product availability in the bedding
(Appendix C) and bath (Appendix D) areas of each store that was visited. To gather
information about the availability of bedding, products with the expressed preferences for
color, patterns, fiber content, thread count, fabric type and labeling were sought in both
packaged sets and bed-in-a-bag packaging. To gather information about the availability of
bath products, products matching the expressed preferences for color, patterns, fiber content

41
and labeling were sought in the towel, rug and shower curtain categories. Visual observation
of the products on the sales floor was used to determine which items were available. Items
matching the criteria gathered in the survey were marked as available or unavailable.
Data Analysis
Data analysis was completed in different steps for each research objective. For
Research Objective One, data on the U.S. home textile industry was collected. The industry
was described broadly, and the two leading manufacturers and two leading specialty mass
retailers were identified and described in more detail with respect to their customers,
products and market strategies. For Research Objective Two, the results of the questionnaire
were collected. The quantitative responses were evaluated using descriptive statistics. One-
sample t-tests were used for Questions 2a-c, 4a-b, 6a-h, 7a-f and 8c to see if there was a
significant preference for a given criteria. An informal null hypothesis was formed for each
question tested with the t-test; M=3. One sample t-tests are often used by market researchers
to make statements about a single variable against a standard (Malhotra, 1999, p. 471).
Qualitative, open-ended responses were coded by the most common responses. A one-way
ANOVA test was run post hoc to determine if segmenting the respondents by whether they
thought their culture influenced their preferences (Question 9c) would explain differences in
their rating of the importance of Questions 6a-h and 7a-f and differences in their level of
fashion interest (Question 8c). An alpha level of .05 was used for all statistical tests. Finally,
a product scan was conducted at three locations of each Bed Bath & Beyond and Linens ‘n
Things store to determine if products satisfying the expressed preferences of the
questionnaire subjects were available in the current retail setting.

42
Table 5. Operational Definitions
Term Definition
Bath Towels, shower curtains, bath rugs and related bath
accessories.
Bedding Flat sheets, fitted sheets, pillowcases, comforters, bed
skirts.
Buying decision factors Price, color, style, brand name/designer, fiber content,
availability of packaged sets, fabric type, thread count,
retail channel.
Buyer characteristics Hispanic or Latina (self-described) college student in
North Carolina above the age of 18.
Home textiles Bedding and bath products.
Home textile manufacturer WestPoint Stevens and Springs Industries.
Home Textile Mass Specialty Retailer Bed Bath & Beyond and Linens ‘n Things.

43
CHAPTER IV
Results
This study defines the U.S. home textile industry by means of an industry profile and
explores the preferences U.S. Hispanic consumers have for home textile products,
specifically bedding and bath. In the first of two parts of data collection, industry
information was gathered from published sources. In the second part of data collection, a
questionnaire was administered to Hispanic subjects. Using known variables for consumer
preferences for apparel and pairing them with variables unique to the home textiles market,
this study explored the relative importance Hispanic consumers place on traditional purchase
variables when shopping for home fashions, an area in which no academic research had been
conducted. This research provides a foundation for future research in an emerging area of
consumer study for home textiles, in general and based on market segmentation.
Research Objective One:
To Profile the U.S. Home Textiles Industry by Exploring the Manufacturing and Retail
Leaders of Bedding and Bath Products
Home textiles manufactures and retailers of bed and bath products are undergoing
changes to differentiate products and target products to specific markets. Current trends in
the bedding industry include innovative fiber blends, such as including silk in sheets and the
coordinating decorative pillows and curtain panels (Sloan, 2003). Other fiber-related
innovations include using wicking technology that has been developed for apparel to increase
the comfort of bedding. Higher thread counts in sheets are being used to impart a luxury feel
44
and image (Silverstein & Fiske, 2004). Private labels, which are labels owned by the retailer,
are becoming more common in retailers and have been reported to be especially effective in
bath textiles (Duff, 2003). Private labels will be discussed in detail in the following section.
Product Market Shares
The U.S. home textile industry produces a wide variety of products, as shown in
Table 5. However, the focus of this study is on bedding and bath products. Home textile
products are simpler and less time- and labor-intensive to manufacture than apparel products,
which may give the U.S. textile industry an area in which to establish new competitive
advantages. Increased mechanization can be used to facilitate lower priced products for
volume producers and discounters who compete on cost, as well as enable differentiation
based on quality and product variety.
In terms of production, 62% of the 2001 bathroom product market was produced
domestically (Lazich, 2004). Bath towels made up more than half the sales of the bathroom
product market, accounting for 55% (Lazich) of 2002’s $2.8 billion in bathroom product
sales (Corral, 2003a), as shown in Figure 5. Bath accessories, such as ceramic counter items,
are considered nontextile products, and tank sets, which are considered textile products,
include toilet tank and lid covers and matching contour rugs.

45
Table 6. Home Textile Product Categories
Bed Bath Kitchen Other
Blankets Bath Accessories Kitchen Textiles Rugs
Comforters Bath Rugs Table Linens Window Coverings
Curtains/ Draperies Bath Towels
Decorative Pillows Shower Curtains
Down Comforters
Foam Pillows/ Toppers
Mattress Pads
Quilts
Throws Note. Sources: A year of Change, 2004;The Facts: Kitchen Textiles, 2003.
Bathroom Product Market, 2002
55%
24%
12%
7%
1%
1%
Bath Towels
Bath/Scatter Rugs
Bath Accessories
Shower Curtains
Tank Sets
Other
Figure 5. Bathroom Product Market, 2002. Adapted from Lazich, 2004
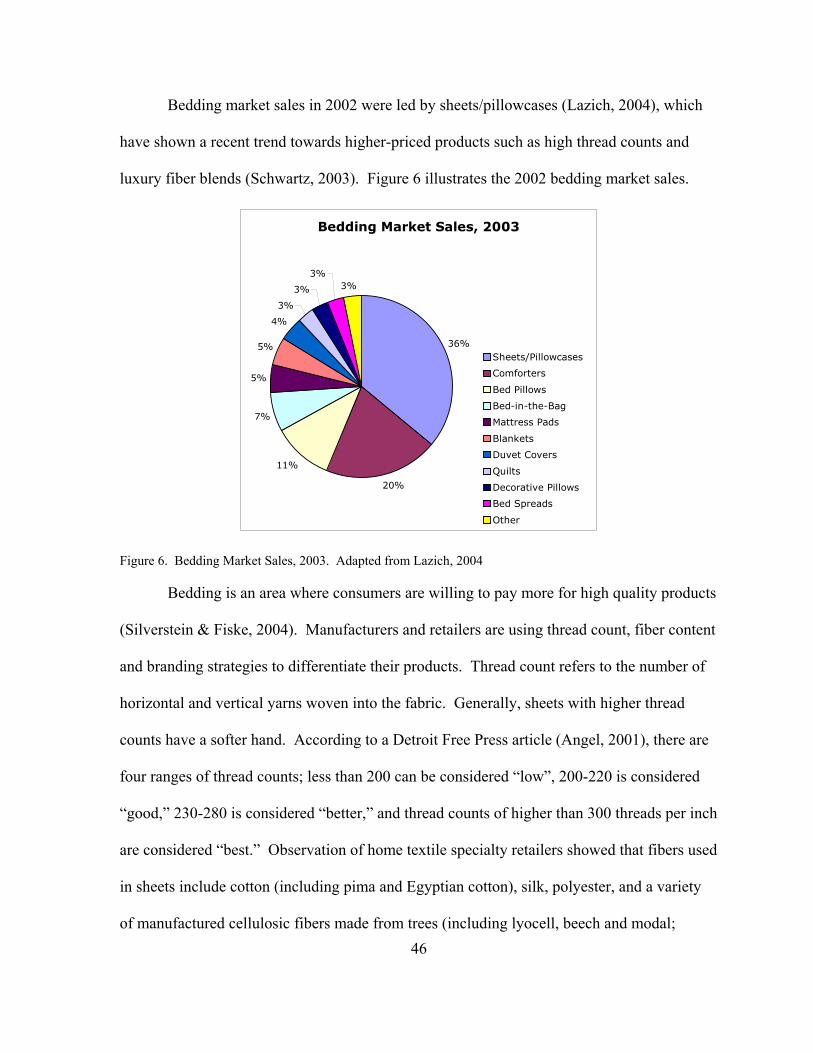
46
Bedding market sales in 2002 were led by sheets/pillowcases (Lazich, 2004), which
have shown a recent trend towards higher-priced products such as high thread counts and
luxury fiber blends (Schwartz, 2003). Figure 6 illustrates the 2002 bedding market sales.
Bedding Market Sales, 2003
36%
20%
11%
7%
5%
5%
4%
3%
3%
3%3%
Sheets/Pillowcases
Comforters
Bed Pillows
Bed-in-the-Bag
Mattress Pads
Blankets
Duvet Covers
Quilts
Decorative Pillows
Bed Spreads
Other
Figure 6. Bedding Market Sales, 2003. Adapted from Lazich, 2004
Bedding is an area where consumers are willing to pay more for high quality products
(Silverstein & Fiske, 2004). Manufacturers and retailers are using thread count, fiber content
and branding strategies to differentiate their products. Thread count refers to the number of
horizontal and vertical yarns woven into the fabric. Generally, sheets with higher thread
counts have a softer hand. According to a Detroit Free Press article (Angel, 2001), there are
four ranges of thread counts; less than 200 can be considered “low”, 200-220 is considered
“good,” 230-280 is considered “better,” and thread counts of higher than 300 threads per inch
are considered “best.” Observation of home textile specialty retailers showed that fibers used
in sheets include cotton (including pima and Egyptian cotton), silk, polyester, and a variety
of manufactured cellulosic fibers made from trees (including lyocell, beech and modal;
47
Hatch, 1993; Tondl, 1997). Branding strategies range from lower-priced store brands like
Linens ‘n Things’ “LNT” to high-priced designer bedding from Nautica and Tommy
Hilfiger.
Home Textile Manufacturers
The goal of Research Objective One is to profile the manufacturing and retail leaders
in the bed and bath category of the U.S. home textile industry. The home textiles industry is
in a period of aggressive change (A year of change for top 5 players, 2004). The exit of
Pillowtex left the potential for other manufacturing companies to gain new market share, and
the exit had the most impact on the basic bedding categories (A year of change). At the end
of 2003, the top five vendors according to Home Textiles Today were Springs Industries,
WestPoint Stevens, Mohawk Home, Dan River and Pacific Coast Feather (See Table 7).
Springs Industries and WestPoint Stevens are discussed in greater detail because they
represent the largest companies in the U.S. home textile manufacturing industry for bedding
and bath products.

48
Table 7. The Top 10 Home Textiles Manufacturers of 2003
2003 Rank Company
Est. '03 Sales ($Mil)
% of Total
1 Springs Industries $2,400 36.2
2 WestPoint Stevens 1,656 25.0
3 Mohawk Home 655 9.9
4 Dan River 374 5.6
5 Pacific Coast Feather 353 5.3
6 Croscill 293 4.4
7 Franco Mfg. 237 3.6
8 Maples Rugs 230 3.5
9 Hollander Home Fashions 228 3.4
10 CHF Corp. 195 2.9
Total 6,621 100.0 Note. Adapted from Top 15 Vendors—2003
The top five U.S. home textile manufacturers account for more than 80% of the top
10 vendors of home textiles, in terms of sales. As shown in Figure 7, Springs Industries and
WestPoint Stevens dominate the top five manufacturers. Because these are the two most
influential U.S. home textile manufacturers, they are the companies described in Research
Question One.

49
Market Share of the Top Five Home Textile Manufacturers
45%
30%
12%
7%6%
Springs Industries
WestPointStevensMohawk Home
Dan River
Pacific CoastFeather
Figure 7. Respective Market Share of the Top Five U.S. Home Textile Manufacturers
Research Question One: Who are the leading Manufacturers in the Home Textile Industry?
Research Question One addresses the leading U.S. home textiles manufacturers.
According to the convergence of evidence approach shown in Figure 4, archival records and
current documents were used to identify the top ten home textile companies. These top ten
companies were evaluated, and the top two were described in detail because they are the
most influential companies in the industry based on sales.
Company Development
Originally named Fort Mill Manufacturing Co., Springs Industries began in 1887
(Krippel, 2004c). After undergoing a series of name changes and a number of presidents,
Springs became a publicly traded company in 1966 under the name Springs Mills (Krippel,
2004c). The company established its Springmaid bedding line in 1945, began working with
Bill Blass in 1970, and acquired Graber industries in 1979 (Krippel, 2004c). These changes
helped the company recover from several periods of declining profits (Krippel, 2004c). In
1982, the name was changed to the current Springs Industries (Krippel, 2004c). To recover
50
from a $7 million loss in 1991, Springs expanded its successful home furnishings segment,
finally dropping its apparel fabric production altogether in 1999 (Krippel, 2004c). In 2001,
Springs became a private company by buying 55% of the stock and partnering with a private
equity firm which now owns 45% of the company. Based out of Fort Mill, South Carolina,
Springs has around 40 manufacturing plants in 12 states, Canada and Mexico (Krippel,
2004c). Although Springs closed four mills during 2003 (Elkins, 2004), its closings have
been limited compared to other textile companies including WestPoint Stevens. According
to 2003 estimates, Springs has around 17,000 employees (Krippel, 2004c).
WestPoint Stevens began in the 19th century as Westpoint Manufacturing Company,
and merged with Pepperell Manufacturing Company in 1965 to form WestPoint Pepperell
(WestPoint Stevens, 2003). WestPoint Stevens took its current form in 1993, when
WestPoint Pepperell acquired J.P. Stevens & Co. The three separate companies produced a
variety of products throughout their histories including flannel, sail cloth and woolen fabrics
(WestPoint Stevens, 2003), but now WestPoint, a publicly traded company, focuses
exclusively on bedding and bath products, with special attention to sheets and towels. Since
filing for Chapter 11 bankruptcy protection in June 2003, WestPoint has begun to focus more
on bedding, which provides a higher profit margin (Krippel, 2004d). Hoovers Company
Capsules and Profiles reports that WestPoint employed 13,886 people during 2003 (Krippel,
2004d). Since filing for bankruptcy, WestPoint has reduced its number of retail outlet stores
from 57 to 30 (WestPoint Stevens Reports, 2004). WestPoint has also closed a number of
manufacturing plants in the last two years, with the current number around 20 (WestPoint
Stevens, 2003).

51
Product Offerings and Customers
Springs Industries was the top vendor of home textiles in 2003 (Top 15 Vendors—
2003, 2004), and focused its expansion efforts on increasing volume, particularly in the mass
channel (A year of change, 2004). Springs had an estimated sales volume of $2.4 billion in
2003 (Top 15 Vendors—2003, 2004). As shown in Figure 9, Wal-Mart is one of many retail
stores where Springs’ products are sold. Wal-Mart accounts for about 25% of Springs’ total
sales (Krippel, 2004c). Springs’ 2003 sales growth increased the sales gap between Springs
and WestPoint Stevens, which has the next highest sales overall (A year of change). Springs
had the highest sales in the industry in bath accessories, comforters, sheets and pillowcases
and shower curtains categories, and gained Pillowtex’ market share in bath rugs (A year of
change). Springs’ brand focus include its own popular Springmaid, Daisy Kingdom, and
Wamsutta, and it licenses JCPenney Home Collection products as well as NASCAR, Coca-
Cola, My Little Pony and Cat in the Hat kids’ bedding (Springs Industries, n.d.). About 25%
of Springs sales are to Wal-Mart stores, but Springs also sells to catalogs, department stores
and other mass retailers as depicted in Figure 9 (Krippel, 2004c).
In the absence of Pillowtex, WestPoint Stevens is now the top seller of down
comforters in the industry (A year of change, 2004, Top 15 vendors—2003, 2004). Although
WestPoint Stevens went through a bankruptcy filing in 2003, its down comforter category
sales increased by 125% (A year of change). Strong licensing partnerships including the
Ralph Lauren Home line and Disney Home have contributed to WestPoint Stevens’ rebound
(A year of change). WestPoint also has strong brands of its own including Martex, Vellux
and Grand Patrician. Even in 2002 before the exit of Pillowtex, WestPoint Stevens also led
the industry in production of bath towels (Lazich, 2004).

52
WestPoint Stevens recognizes specialty stores as one of the fastest growing of the
retail channels, along with discount retailers and warehouse clubs (WestPoint Stevens, 2003).
Notably absent from WestPoint’s online description of high-growth distribution channels is
growth in the department store market for home textiles. WestPoint’s sales are largely
represented by Kmart, Wal-Mart, JCPenney, Federated Department Stores, and Costco,
which together make up about half of WestPoint’s sales (Krippel, 2004d). Federated
Department Stores includes Bloomingdale’s, Bon-Macy’s, Goldsmith’s-Macy’s, Lazarus-
Macy’s, Macy’s East, Macy’s West, Macy’s Home Store and Rich’s-Macy’s. Increasing its
sales to specialty stores would help with its strategy to provide products across to diverse
distribution channels.

53
Table 8. Retail Customers of WestPoint Stevens and Springs, in Alphabetical Order.
WestPoint Stevens Retail Customers Spring Industries Retail Customers
AAFES BC Moore
Bed Bath & Beyond Bed Bath & Beyond
Bon Marche Belk
Boscov's Bloomingdale's
Burdine's Burdine's
Costco Carson Pirie Scott
Dillard's Famous Barr
Famous Barr Filene's
Filene's Foley's
Foley's Fred Meyer
Hecht's Hecht's
JCPenney Linen Source
Kmart Linens 'n Things
Kaufman's Luxury Linens
Kohl's Macy's
Linens 'n Things Mervyn's
Macy's Proffitt's
Robinson's-May's Robinson's-May's
Mervyn's Springs Outlet Stores
Rich's The Bon Ton
Sam's Wal-Mart
Sears www.amazon.com
Target

54
Table 8 (continued). Wal-Mart
WestPoint Stevens Stores
www.WPSstores.com
www.amazon.com
Note: Highlighted cells indicate common customers. Sources: WestPoint Stevens, 2003; Springs Industries, n.
d.; Federated Department Stores, Inc., 2004.
Both WestPoint Stevens and Springs sell their products to companies in specialty,
discount and department store retail channels. There is no marked difference in the
proportion of sales to each channel between WestPoint and Springs.
Market Strategy
Springs is not a publicly traded company, so it is able to take more risks and reinvest
without focusing on an immediate return on investment for its shareholders. As CEO,
Crandall Bowles said she will use the freedom of being a private company to pursue longer
term strategies (Elkins, 2004). Springs is focusing on brand recognition, including increasing
brand recognition for its own Wamsutta and Springmaid brands (Springs Industries). Springs
also designs products specifically for stores like JCPenney and partners with designers to
produce licensed lines like Kmart’s Thalia home line (E. Barragan, personal communication,
April 29, 2004).
As a publicly traded company, WestPoint Stevens’ industry approach centers around
return on investment for its shareholders. The company employs a brand-based strategy that
focuses on delivering diverse brands through a variety of distribution channels. WestPoint
owns rights to national brands (such as Martex), as well as producing products under their

55
own private label brands for specific retailers (such as Martha Stewart Everyday for Kmart)
and licensing brand names from other companies. One of WestPoint’s most successful
licensed brands is Ralph Lauren Home. According to the company website, WestPoint
Stevens is focusing its efforts on progress with an “eight-point plan.” The company wants to
expand its own brands to gain a strong market position, explore licensing possibilities, keep
manufacturing at a level that matches demand for its products, consolidate to reduce
overhead, increase international sourcing, improve the logistics of its supply chain and make
its capital structure more flexible.
Table 9. Comparison of Two Leading U.S. Home Textile Manufacturers
Springs Industries WestPoint Stevens
Products Rugs, ceramic bath accessories, comforters, bedding, sheets, shower curtains, towels
Sheets, towels, curtains, blankets, comforters, bath rugs, mattress pads, pillows, feather/down/natural fill items
Major Customers Wal-Mart, Target, JCPenney, Springs Outlet Stores
JCPenney, Kmart, Wal-Mart, Costco, Federated Department Stores
Top Brands Beaulieu, Daisy Kingdom, Dundee, Regal, Springmaid, Wamsutta
Martex, Grand Patrician, Utica, Chatham, Vellux, Lady Pepperell
Licenses JCPenney Home Collection, NASCAR, Coca-Cola, My Little Pony, Cat in the Hat
Ralph Lauren Home, Disney Home, Simmons Beautyrest, Glynda Turley, Martha Stewart, Joe Boxer
Number of Employees (2003) 17,000 13,886
Research Question Two: Who are the Leading Home Textile Mass Specialty Retailers?
Research Question Two utilizes compiled financial and industry data and documents
to identify the leading specialty retailers in the U.S., and then to compare the companies.
The mass specialty retailers were selected for evaluation a priori the data collection because

56
it was expected that consumers would have the most access to home textile products at the
fast-growing mass specialty retail channel. In this section, the companies are described in
terms of their target customer, product offerings, pricing and general market strategy.
According to a 2001 company analysis by the University of Oregon Investment
Group, Bed Bath & Beyond held 3% of the home goods market, while Linens ‘n Things held
2%. However, specialty home textile stores accounted for about 20% of the home goods
market in 2001 (Bed Bath & Beyond, Inc, 2001). Smaller specialty stores and boutiques
make up the remaining 15% of the home goods market accounted for by specialty retailers.
The other 80% of the home goods market is comprised of a variety of types of stores
including department stores, discount stores, and other stores that do not specialize in home
goods (Bed Bath & Beyond, Inc, 2001).
Company Development
Bed Bath & Beyond is the largest superstore retailer (by sales volume) that
specializes in domestics (Krippel, 2004a). The company was founded in 1971 by Warren
Eisenberg and Leonard Feinstein as a smaller store, only offering linens (Krippel, 2004a).
Originally named Bed n Bath, the company adopted the superstore layout and started
carrying home furnishings in 1985 and changed its name to Bed Bath & Beyond in 1987 to
reflect the change in product offerings (Krippel, 2004a). Bed Bath & Beyond went public in
1992 and is currently traded on the NASDAQ National Market. Based in Union, New
Jersey, Bed Bath & Beyond had 29,000 employees at the end of fiscal year in February, 2004
(Krippel, 2004a). The company currently operates 573 stores in the United States and two
stores in Puerto Rico.

57
Based in Clifton, New Jersey, Linens ‘n Things is the second largest superstore
retailer of domestics in the U.S., behind Bed Bath & Beyond. Linens ‘n Things was founded
in 1975 by Eugene Kalkin. In 1983, the chain of stores was sold to Melville Corp. (now
called CVS). Melville sold all shares of the company in 1997, and Linens ‘n Things shares
are now traded on the New York Stock Exchange. At the end of the 2003 fiscal year, Linens
‘n Things had 17,200 employees and operated 423 stores in the U.S. and 17 stores in Canada.
Product Offerings
Bed Bath & Beyond divides its products into two main categories: domestics, which
include bed linens, bathroom, and kitchen linens and home furnishings, which is comprised
of, among other products, cookware, cutlery, appliances and picture frames (Krippel, 2004a).
Linens ‘n Things divides its products into six departments throughout the store: bath, home
accessories, housewares, storage and cleaning, bedding and window treatments (Krippel,
2003b). One reason for the difference in product categorization may be that Bed Bath &
Beyond gives its store managers flexibility in their product offerings depending on which
products sell well in each store (Bed Bath & Beyond, 2001). It uses this approach to cater to
local tastes and approach the customer like a neighborhood store (Byrnes, 2004). While
offering products based on sales performance may help company profits, one drawback of
this strategy is that store inventories may be inconsistent between stores, causing problems
for consumers interested in using gift registries, which are available through both Bed Bath
& Beyond and Linens ‘n Things.
58
Market Strategy
Bed Bath & Beyond focuses on a ‘better quality than department stores, with
reasonable prices’ strategy without spending on national licenses and brands (Bed Bath &
Beyond, 2001). Bed Bath & Beyond focuses on variety and price, but offers nationally
known name brands such as Nautica, Nicole Miller and Liz Claiborne, which are featured in
bed and bath categories. The company holds no debt, and grows mostly by new store
openings. Bed Bath & Beyond saves money by forgoing distribution centers and having
inventory delivered directly to the stores from the suppliers (Bed Bath & Beyond, 2001).
Linens ‘n Things sells licenses in all six of its departments to help support its strategy
of offering a wide selection of name brands at low prices (Linens ‘n Things, 2003a). Linens
‘n Things sells a wide variety of brands, including Nautica, Waverly and Laura Ashley as
well as private label LNT that accounted for 10% of the store’s sales in 2002. Linens ‘n
Things grows through new store openings, while maintaining profit by closing under-
performing stores. In contrast to Bed Bath & Beyond, Linens ‘n Things maintains a
centralized infrastructure with three distribution centers in the eastern U.S. in North Carolina,
New Jersey and Kentucky.
Bed Bath & Beyond and Linens ‘n Things carry similar product mixes and target the
same customers. They seem to share the same strategy, but approach it in different ways.
Bed Bath & Beyond is focused on quality and variety; it strives to carry better quality than
department stores at prices lower than those of department stores, while Linens ‘n Things has
a more brand-focused approach, carrying the same brands as department stores at lower
prices. Visual observation of the stores revealed more similarities than differences. Both
stores feature a “big box” layout (large, often stand-alone stores with an exhaustive

59
inventory), with a nearly identical floor layout, described by one analysis as a race track
layout designed to draw customers through the entire store (Bed Bath & Beyond, Inc, 2001).
The visual similarities within stores may increase difficulty in differentiation between the
two stores.
Research Objective Two:
To Ascertain the Level of Importance that Traditional Buyer Decision Factors Such as Price,
Color and Style have within the Hispanic Consumer Market for Home Textile Products
Research Objective Two used the survey method and the questionnaire instrument to
gather data for Research Questions Three through Twelve which investigated the importance
of price, color, style, brand name, fiber content, packaging, fabric type, thread count,
coordination and retail channel for bed and bath products. Questionnaire results also
provided data for Research Question Thirteen, which evaluates the product availability of
bed and bath products consistent with the preferences of the respondents, and Research
Question Fourteen, which investigates if the level of importance for bedding and bath criteria
differ based on the consumer’s cultural influence.
For this part of the research, 30 female Hispanic respondents completed a
questionnaire evaluating the importance of price, color, style, brand name, fiber content,
packaging, fabric type, thread count and retail channel on their purchases of bed and bath
textiles. Twenty percent (n=6) of the responses were collected using the paper questionnaire
and 80% (n=24) were collected using the online version. The online version of the
questionnaire was located at the temporary website www.hometextileresearch.org. The

60
response rate for the multiple choice questions on the questionnaire was 100% (N=30). The
response rate for the open-ended questions is discussed later this chapter.
As described in Chapter III, there were three types of questions on the questionnaire.
Nominal questions (Questions 1, 3, 8d, 8e, and 8f) asked the respondent to choose the item
that best described their preferences toward bed and bath products and retail channels.
Questions 2a-c, 4a-b, 5, 6a–h, 7a–f and 8a–c were multichotomous in that they gave the
respondent a limited number of responses, but the responses were presented in an ordinal
Likert scale format with 1 being identified on the questionnaire as NOT IMPORTANT (or LESS
OFTEN) and 5 being VERY IMPORTANT (or MORE OFTEN). For the purposes of interpretation,
the intermediate values of 2, 3 and 4 have been assigned the relative values of LESS
IMPORTANT, NEUTRAL and MORE IMPORTANT. Questions 9a–c and Question 10 were open-
ended questions.
The ordinal questions on the questionnaire had a consistent scale from 1 to 5, but had
three different response titles. Questions 4a, 4b, 5, 6a-h, 7a-f and 8c had an ordinal scale of
five options with 1 being designated as NOT IMPORTANT and 5 being designated as VERY
IMPORTANT. For the purposes of interpretation, the intermediate values of 2, 3 and 4 have
been assigned the relative values of LESS IMPORTANT, NEUTRAL and MORE IMPORTANT. The
odd number of options in the ordinal scale for each of the questions allows for 3 to represent
no strong preferences, or a neutral level of importance.
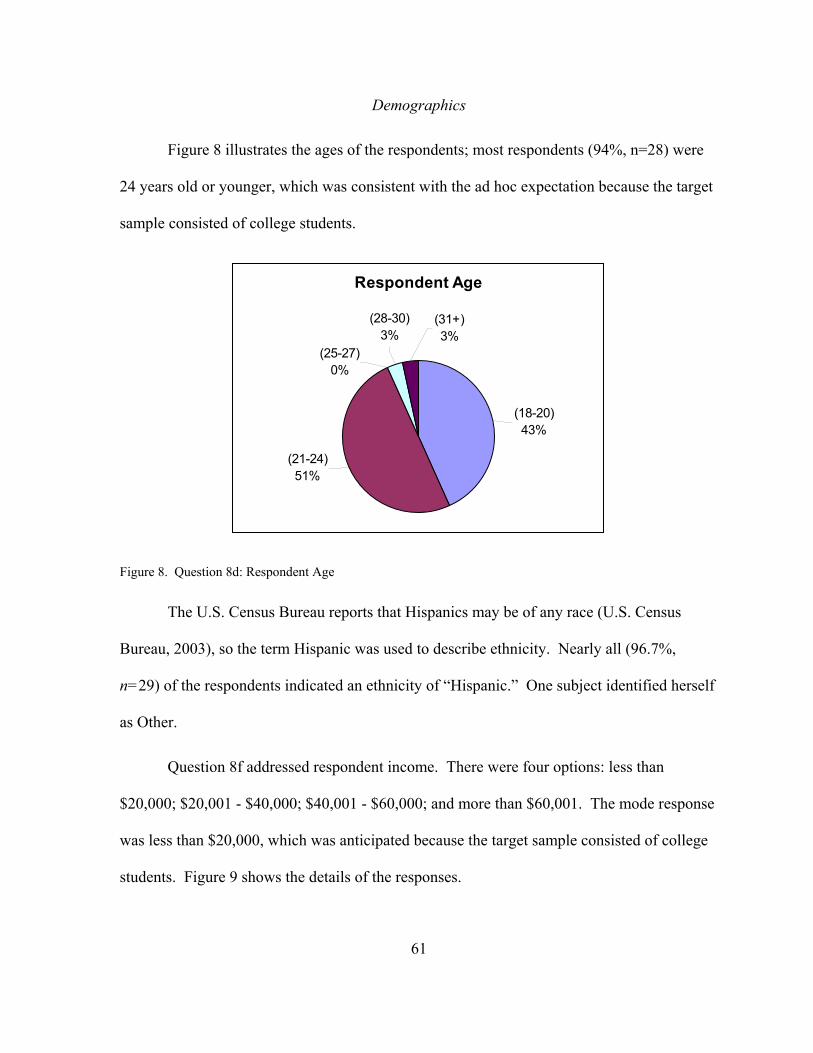
61
Demographics
Figure 8 illustrates the ages of the respondents; most respondents (94%, n=28) were
24 years old or younger, which was consistent with the ad hoc expectation because the target
sample consisted of college students.
Respondent Age
(28-30)3%
(25-27)0%
(31+)3%
(18-20)43%
(21-24)51%
Figure 8. Question 8d: Respondent Age
The U.S. Census Bureau reports that Hispanics may be of any race (U.S. Census
Bureau, 2003), so the term Hispanic was used to describe ethnicity. Nearly all (96.7%,
n=29) of the respondents indicated an ethnicity of “Hispanic.” One subject identified herself
as Other.
Question 8f addressed respondent income. There were four options: less than
$20,000; $20,001 - $40,000; $40,001 - $60,000; and more than $60,001. The mode response
was less than $20,000, which was anticipated because the target sample consisted of college
students. Figure 9 shows the details of the responses.

62
Income
less than $20,000
74%
more than $60,001
13%
$40,001 - $60,000
13%
$20,001 - $40,000
0%
Figure 9. Question 8f: Respondent Income
Frequency of Purchase
Questions 8a and 8b inquired about the number of times per year the respondent
purchased bedding (8a) and bath (8b) products. The questions had an ordinal scale of five
options: “less than 1 [time per year],” “2 [times per year],” “3 [times per year],” “4 [times per
year],” and “more than 5 [times per year].” In retrospect, the scale would have been more
inclusive if it had included options for “1 [time per year]” and “5 [times per year].”
The modes for both 8a and 8b were “less than 1” time per year. Figure 10 shows a
histogram with the frequencies of responses for 8a and 8b. The responses for bath purchases
were more widely distributed than for bedding. No respondents indicated that they shopped
for bedding products more than 3 times per year, but 20% of respondents (n=6) indicated that
they shopped for bath products 4 times per year, but not more than 5.

63
Frequency of Purchase of Bedding and Bath Products
02468
10121416
lessthan 1
2 3 4 morethan 5
Times per Year
Freq
uenc
y of
R
espo
nse
Bedding (8a)Bath (8b)
Figure 10. Frequency of Responses for Questions 8a and 8b: Frequency of Purchase of Bedding and Bath Products.
Fashion Orientation
The final demographic question of the questionnaire, Question 8c, has ordinal
answers on a scale of 1 to 5, with 1 representing an opinion of NOT IMPORTANT and 5
representing an opinion of VERY IMPORTANT. Question 8c determines the respondents’ level
of fashion interest with regard to home textiles. Overall, the respondents found keeping up
with the latest home fashion trends to be LESS IMPORTANT (M=2.23). More than one-third of
the respondents reported 3 as their importance rating, indicating a neutral opinion. No
respondents indicated that they think keeping up with the latest home fashion trend is VERY
IMPORTANT (5). The frequency of responses for Question 8c is shown in Figure 11.
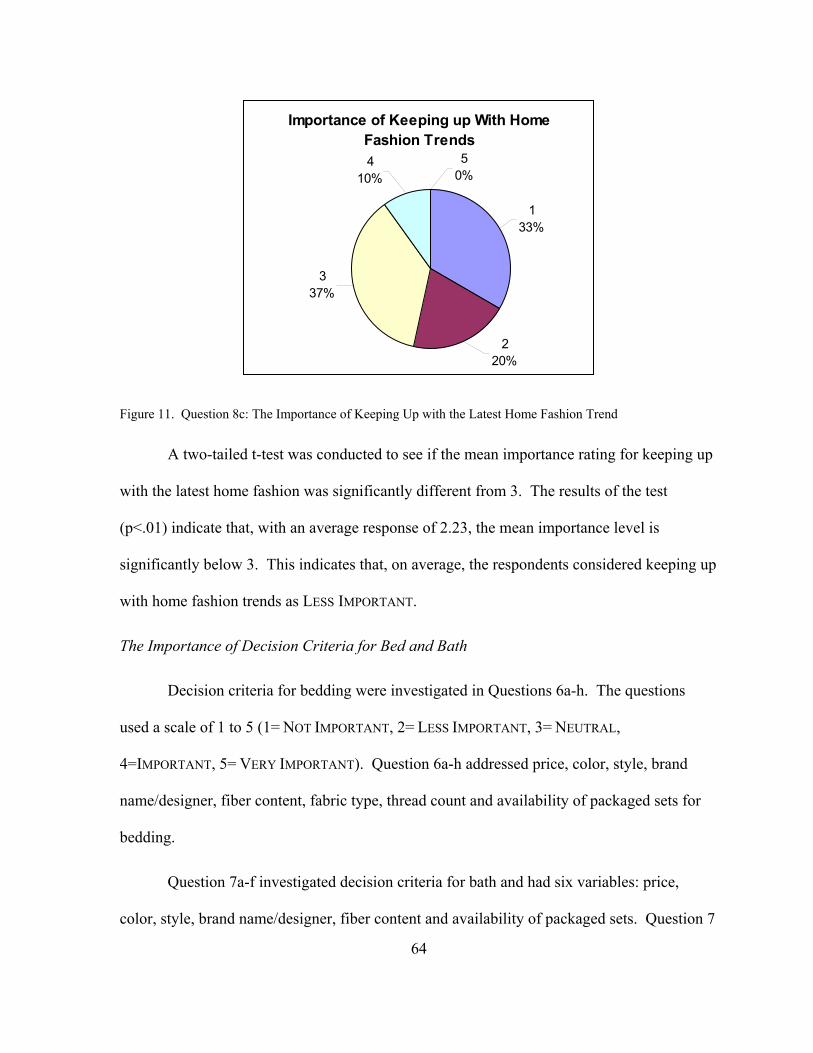
64
Importance of Keeping up With Home Fashion Trends
50%
133%
220%
337%
410%
Figure 11. Question 8c: The Importance of Keeping Up with the Latest Home Fashion Trend
A two-tailed t-test was conducted to see if the mean importance rating for keeping up
with the latest home fashion was significantly different from 3. The results of the test
(p<.01) indicate that, with an average response of 2.23, the mean importance level is
significantly below 3. This indicates that, on average, the respondents considered keeping up
with home fashion trends as LESS IMPORTANT.
The Importance of Decision Criteria for Bed and Bath
Decision criteria for bedding were investigated in Questions 6a-h. The questions
used a scale of 1 to 5 (1= NOT IMPORTANT, 2= LESS IMPORTANT, 3= NEUTRAL,
4=IMPORTANT, 5= VERY IMPORTANT). Question 6a-h addressed price, color, style, brand
name/designer, fiber content, fabric type, thread count and availability of packaged sets for
bedding.
Question 7a-f investigated decision criteria for bath and had six variables: price,
color, style, brand name/designer, fiber content and availability of packaged sets. Question 7

65
mirrors the format of questionnaire item 6, but omits a priori fabric type and thread count
because those are not pertinent criteria to bath products. Figure 12 shows the relationship
between the mean importance rating of bedding and bath products.
Purchase Criteria for Bedding and Bath
0
0.5
1
1.5
2
2.5
3
3.5
4
4.5
5
Price Color Style BrandName
FiberContent
FabricType
ThreadCount
PackagedSets
Criteria
Mea
n R
atin
g
BeddingBath
Figure 12. Purchase Criteria for Bedding and Bath.
Tables 10 and 11 show the descriptive statistics for the respective purchase criteria.
Each research question is later discussed in more detail.
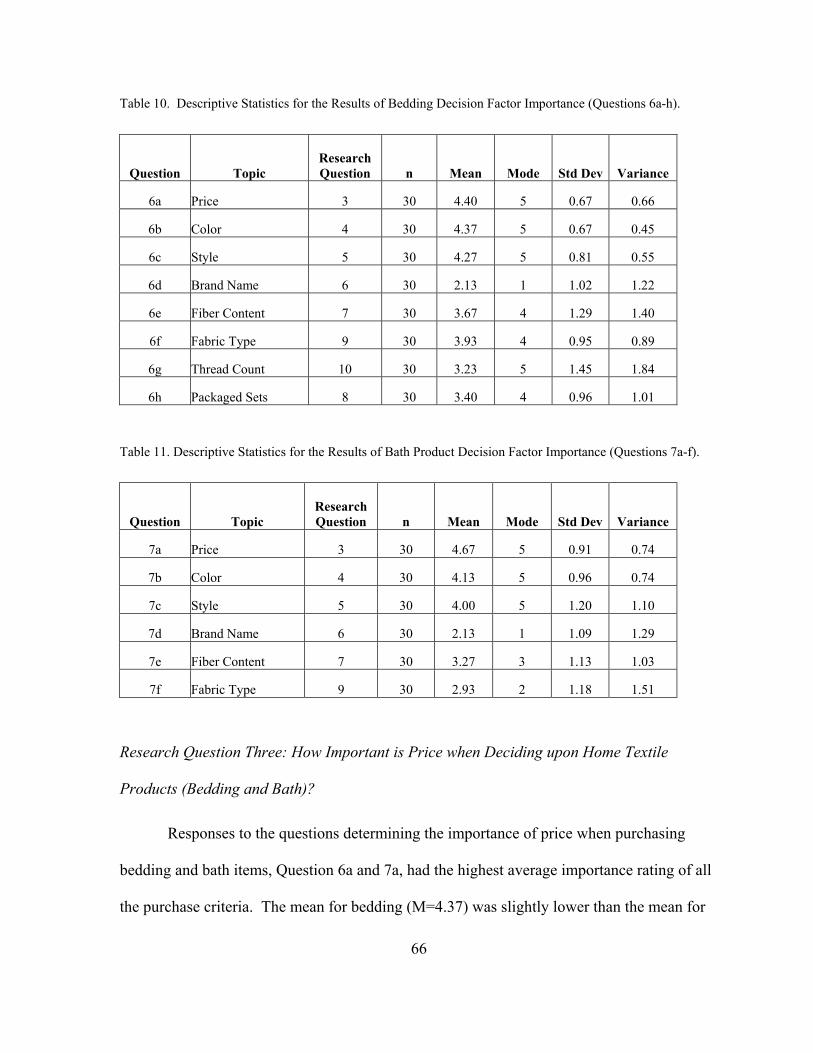
66
Table 10. Descriptive Statistics for the Results of Bedding Decision Factor Importance (Questions 6a-h).
Question Topic Research Question n Mean Mode Std Dev Variance
6a Price 3 30 4.40 5 0.67 0.66
6b Color 4 30 4.37 5 0.67 0.45
6c Style 5 30 4.27 5 0.81 0.55
6d Brand Name 6 30 2.13 1 1.02 1.22
6e Fiber Content 7 30 3.67 4 1.29 1.40
6f Fabric Type 9 30 3.93 4 0.95 0.89
6g Thread Count 10 30 3.23 5 1.45 1.84
6h Packaged Sets 8 30 3.40 4 0.96 1.01
Table 11. Descriptive Statistics for the Results of Bath Product Decision Factor Importance (Questions 7a-f).
Question Topic Research Question n Mean Mode Std Dev Variance
7a Price 3 30 4.67 5 0.91 0.74
7b Color 4 30 4.13 5 0.96 0.74
7c Style 5 30 4.00 5 1.20 1.10
7d Brand Name 6 30 2.13 1 1.09 1.29
7e Fiber Content 7 30 3.27 3 1.13 1.03
7f Fabric Type 9 30 2.93 2 1.18 1.51
Research Question Three: How Important is Price when Deciding upon Home Textile
Products (Bedding and Bath)?
Responses to the questions determining the importance of price when purchasing
bedding and bath items, Question 6a and 7a, had the highest average importance rating of all
the purchase criteria. The mean for bedding (M=4.37) was slightly lower than the mean for
67
bath (M=4.47), though the mode for both was 5. No respondents rated bedding price as 1
(NOT IMPORTANT). Question 7a focused on the importance of price for purchasing bath
products. Most (93%, n=28) respondents gave a response of 4 or 5 for the importance of
price for bath products. A t-test indicated that for both bedding (p<.000) and bath (p<.000),
the mean response indicated a higher than NEUTRAL importance.
Research Question Four: How Important is Color when Deciding upon Home Textile
Products (Bedding and Bath)?
Question 6b, which evaluated the importance of color when purchasing bed products,
had the second highest average rating of the bed criteria (M=4.37), and a mode of 5. No
respondents reported an importance rating of 1 or 2 for bedding product color. Question 7b
evaluated the respondents’ value of color when purchasing bath products (M=4.13). The
mode was 5 for this question item. The mean responses for bed (p=.002) and bath (p<.000)
were significantly greater than NEUTRAL.
Research Question Five: How Important is Style when Deciding upon Home Textile Products
(Bedding and Bath)?
Question 6c evaluated the level of importance placed on the style of bedding products
(M=4.27). Question 6c had a mode of 5. No respondents indicated that style had a low
importance level of 1 or 2 for bedding products. The answers for Question 7c reveal the
level of importance placed on the style of bath products by the respondents (M=4.0). The
mode was 5. A t-test indicated that responses for both 6c and 7c were significantly greater
than NEUTRAL (p<.000 for both responses).
68
Research Question Six: How Important is Brand Name when Deciding upon Home Textiles
Products (Bedding and Bath)?
The importance of brand name/designer was evaluated in Question 6d. Brand
name/designer had the lowest mean score of the bedding criteria (M=2.13), with a mode of 1.
No respondents identified brand name/designer as VERY IMPORTANT (5). Question 7d was
concerned with the importance of the brand name/designer in the purchase of bath products.
Parallel to 6d, 7d had the lowest mean score of the bath criteria (M=2.13). Nearly half of the
respondents (43.3%, n=13) selected NOT IMPORTANT (1). None of the respondents indicated
that the brand name/designer of bath products was VERY IMPORTANT (5) when purchasing
the bath products. The mean responses to 6d and 7d were significantly lower than NEUTRAL
(p<.000 for both responses).
Research Question Seven: How Important is Fiber Content when Deciding upon Home
Textile Products (Bedding and Bath)?
In Question 6e, examples of fiber content were included (“ex: 100% cotton or 60%
cotton, 40% polyester”) to ensure clarity of the question. Although the mean importance was
only slightly higher than 3 (M=3.67), the t-test revealed a significant difference from 3
(p<.01). The mode for the importance of fiber content for bedding was 4. The importance of
fiber content in bath product purchasing decisions was explored in Question 7e. The mode
was 3 (M=3.27). The average importance rating was not significantly different from 3
(p=.16), which indicates that the respondents were NEUTRAL in their rating of fiber content
for bath products.

69
Research Question Eight: How Important is the Availability of Packaged Product Sets when
Deciding upon Bedding Products?
To determine how the respondents prefer to purchase bedding products, Question 3 of
the questionnaire had three options, each followed by a brief explanation. The options were:
“Individual Items,” “Packaged Set” and “Bed-in-a-bag.” Results of the responses are shown
in Figure 13.
Packaging Preferences of Bedding Products
Packaged Set40%
Bed-in-a-bag50%
Individual Items10%
Figure 13. Question 3: Packaging Preferences of Bedding Products.
The most frequent response to Question 3 was “Bed-in-a-bag,” which accounted for 50%
(n=15) of the responses. There is an apparent preference for packaged sets (both “packaged”
as defined in the questionnaire instrument as a flat sheet, fitted sheet and pillow case together
as well as the bed-in-a-bag packaging approach) over individually sold bedding items. In
support of the responses to Question 3 (packaging preferences), results of a one-sample t-test
indicated that respondents’ average importance rating for Question 6h was significantly

70
above 3. This may provide a connection for future study of the level of preference for each
type of bedding packaging.
Research Question Nine: How Important is Fabric Type when Deciding upon Bedding
Products?
The importance of fabric type was evaluated in Question 6f, and examples of woven,
satin, sateen and t-shirt were given for clarification. The mean response was a value of 3.9,
and the question had a mode of 4. No questionnaire respondents indicated that fabric type
was NOT IMPORTANT (1). A t-test indicated that the mean response was significantly higher
than NEUTRAL (p<.000).
Research Question Ten: How Important is Thread Count when Deciding upon Bedding
Products?
Question 6g asked respondents about the importance of thread count when purchasing
bedding. The average response was 3.23 and the mode was 4. An importance rating of
greater than 3 appears to indicate some level of interest in thread count, which has been a
recent trend in the quality differentiation of sheets. However, the mean response was not
significantly different than NEUTRAL (p=.354), indicating thread count may have a lower
relative importance to other purchase criteria.
Research Question Eleven: How Important is Coordination of Bedding? How Important is
Coordination of Bath Products? How Important is Coordination Between Bedding and
Bath?
On a scale of NOT IMPORTANT (1) to VERY IMPORTANT (5), survey respondents
indicated their feelings about coordination of bedding products (4a), bath products (4b), and
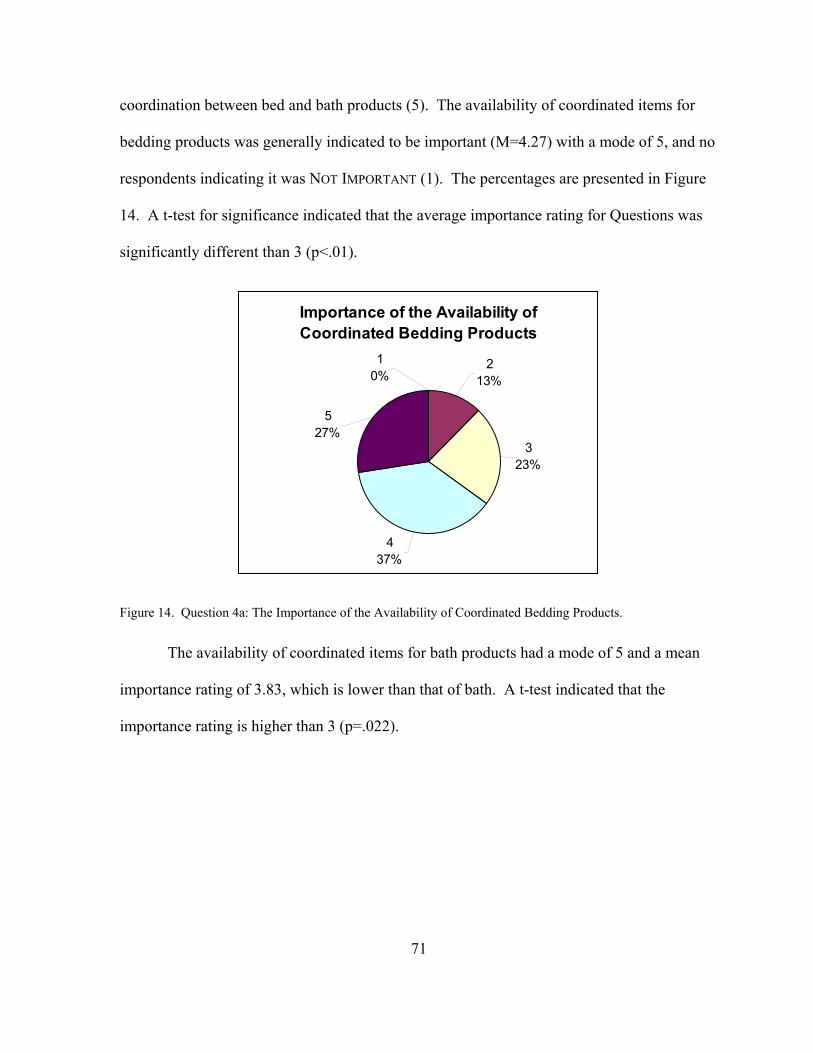
71
coordination between bed and bath products (5). The availability of coordinated items for
bedding products was generally indicated to be important (M=4.27) with a mode of 5, and no
respondents indicating it was NOT IMPORTANT (1). The percentages are presented in Figure
14. A t-test for significance indicated that the average importance rating for Questions was
significantly different than 3 (p<.01).
Importance of the Availability of Coordinated Bedding Products
437%
323%
213%
527%
10%
Figure 14. Question 4a: The Importance of the Availability of Coordinated Bedding Products.
The availability of coordinated items for bath products had a mode of 5 and a mean
importance rating of 3.83, which is lower than that of bath. A t-test indicated that the
importance rating is higher than 3 (p=.022).

72
Importance of the Availability of Coordinated Bath Products
17% 2
13%
320%
427%
533%
Figure 15. Question 4b: The Importance of the Availability of Coordinated Bath Products.
Question 5 of the questionnaire asked respondents to rate the importance of the
availability of coordination between bed and bath products. This question deals with the
continuance of a theme, motif or color scheme through multiple rooms of the house rather
than the coordination of products within one room. The mean response suggested that
coordination between bed and bath is LESS IMPORTANT (M=2.43). The breakdown of
responses is illustrated in Figure 16. A t-test for significance indicated that the average
importance rating for Question 4b was significantly different than 3 (p<.01).

73
Importance of Availability of Coordination Between Bedding and Bath Products
17%
213%
320%
427%
533%
Figure 16. Question 5: The Importance of the Availability of Coordination Between Bedding and Bath
Products.
A summary of the descriptive statistics of all three coordination questions is provided
in Table 12. It is apparent from Table 12 that coordination of bedding is the most important,
while coordination between both bath and bedding is less important.
Table 12: Descriptive Statistics for Coordinated Products
Question Coordination of: n Mean Mode Std Dev Variance
4a Bedding 30 4.27 5 0.87 0.75
4b Bath 30 3.83 5 1.32 1.73
5 Between Both Bath and Bedding
30 2.43 3 1.28 1.63
Means for both 4a and 4b are higher than 3, indicating that coordination is
IMPORTANT (M=4.27, M=3.83). However, the mean for coordination between both bedding
and bath was below 3 (M=2.43), suggesting less importance. This may be an important
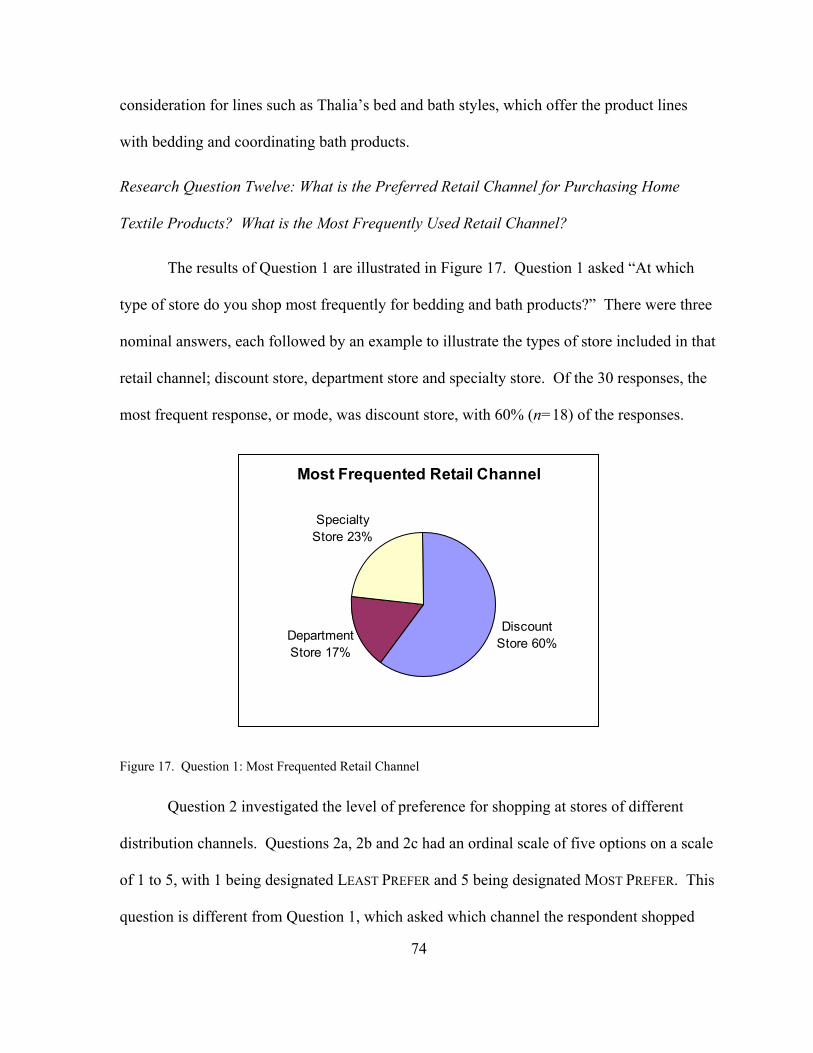
74
consideration for lines such as Thalia’s bed and bath styles, which offer the product lines
with bedding and coordinating bath products.
Research Question Twelve: What is the Preferred Retail Channel for Purchasing Home
Textile Products? What is the Most Frequently Used Retail Channel?
The results of Question 1 are illustrated in Figure 17. Question 1 asked “At which
type of store do you shop most frequently for bedding and bath products?” There were three
nominal answers, each followed by an example to illustrate the types of store included in that
retail channel; discount store, department store and specialty store. Of the 30 responses, the
most frequent response, or mode, was discount store, with 60% (n=18) of the responses.
Most Frequented Retail Channel
Discount Store 60%Department
Store 17%
Specialty Store 23%
Figure 17. Question 1: Most Frequented Retail Channel
Question 2 investigated the level of preference for shopping at stores of different
distribution channels. Questions 2a, 2b and 2c had an ordinal scale of five options on a scale
of 1 to 5, with 1 being designated LEAST PREFER and 5 being designated MOST PREFER. This
question is different from Question 1, which asked which channel the respondent shopped

75
most frequently in that it asks how much they prefer shopping at stores of each channel.
Question 2a referred to the level of preference for shopping at discount stores, 2b referred to
the level of preference for shopping at department stores and 2c referred to the level of
preference for shopping at specialty stores. Table 13 gives the descriptive statistics for
Question 2 parts a-c.
Table 13: Descriptive Statistics for Retail Channels
Channel n Mean Mode Std Dev Variance P =
Discount 30 3.70 4 1.32 1.73 .007
Department 30 3.33 4 1.12 1.26 .115
Specialty 30 3.40 5 1.52 2.32 .161
The descriptive statistics show that the respondents’ mean preference was highest for the
discount channel. Results of t-tests revealed significance only for discount stores. However,
specialty stores received the highest mode rating. The variance is highest for the specialty
channel.
Research Question Thirteen: Does the Retail Market make Available Home Textile Products
that Satisfy the Preferences of Specialty Markets?
The availability of home textile products that satisfy the preferences of Hispanic
consumers based on the collected survey responses is evaluated in Research Question
Thirteen. One Linens ‘n Things store and one Bed Bath & Beyond store were visited in each
of the following North Carolina piedmont cities: Raleigh, Greensboro and Charlotte. The
results of the visual observation of available products were recorded on the data capture
76
sheets shown in Appendix C and Appendix D. Generally, bath products that satisfied the
preferences of the survey respondents were more widely available than bedding products.
Bedding
The data capture sheet in Appendix C was created from the responses to survey
Question 9a, which was open-ended. Based on color categories and pattern descriptions
from 9a, bright dark and pastel colors and solid colors, simple patterns and contrasting (light
against dark) patterns were sought. The two items evaluated in the bedding component of
store observation were packaged sets (identified in the questionnaire as a flat sheet, fitted
sheet and pillowcase sold together) and bed-in-a-bag items (identified in the questionnaire as
sheets, pillowcase, comforter and bed skirt). In packaged sets, most preferences were
available with the exception of orange colored sheets and sheets with patterns of light against
dark contrast.
Bed-in-a-bag sets were not available with many of the expressed preferences of the
survey respondents. “Bright” colors were not readily available. All of the six stores
evaluated had bed-in-a-bag products available in bright colors, but in three stores, the colors
were not available in “simple” patterns or were only available in “floral” patterns. In
addition to many floral patterns, there were also sets that had small repeating patterns,
another expressed dislike (respondents described a preference for “simple” patterns).
Respondents of the survey indicated a preference for simple patterns and a dislike for floral
patterns in their bedding products. Additionally, other characteristics that were lacking from
all stores’ bed-in-a-bag selections were the availability of t-shirt sheets in the bed-in-a-bag
sets, the availability of 100% cotton sheets (present in the stores, but only in a few of the
77
product selections), high thread count sheets (300-400), and solid patterns. Solid colors were
available in comforters sold individually, but not as a bed-in-a-bag set.
Bath
Bath products matching the preferences of survey respondents were more widely
available than the bedding products. As in the evaluation of bedding products, bright, dark
and pastel color categories were sought in addition to explicitly mentioned colors (from
Question 9b). Orange was the most difficult color to locate, but other “bright” colors were
available. Price was indicated as the most important purchase criteria in bath products, but
towels were generally the only product with store signage indicating low prices. Bed Bath &
Beyond stores had signs in various locations in their stores (in some cases, in the towel area)
that advertised “Great Savings Everyday.” Shower curtains with the desired characteristics
(with the exception of low pricing tags, signs or apparent marketing) were available in all
stores. Rugs were available in bright colors, but had a limited pattern selection.
Research Question Fourteen: Does the Level of Importance for Bedding and Bath Criteria
Differ Based on the Consumer’s Cultural Influence?
Research Objective Two focuses on the Hispanic consumer market for home textiles.
Questions 9a, 9b and 9c were open-ended questions located at the end of the questionnaire,
and were designed to determine if there were other important decision factors based on the
Hispanic heritage of the respondents. In contrast to the quantitative questions, which had a
100% response rate, the qualitative open-ended questions had varying response rates.
Questions 9a and 9b were present on both the paper version and online version of the
questionnaire, and all respondents had an opportunity to participate in those questions. There
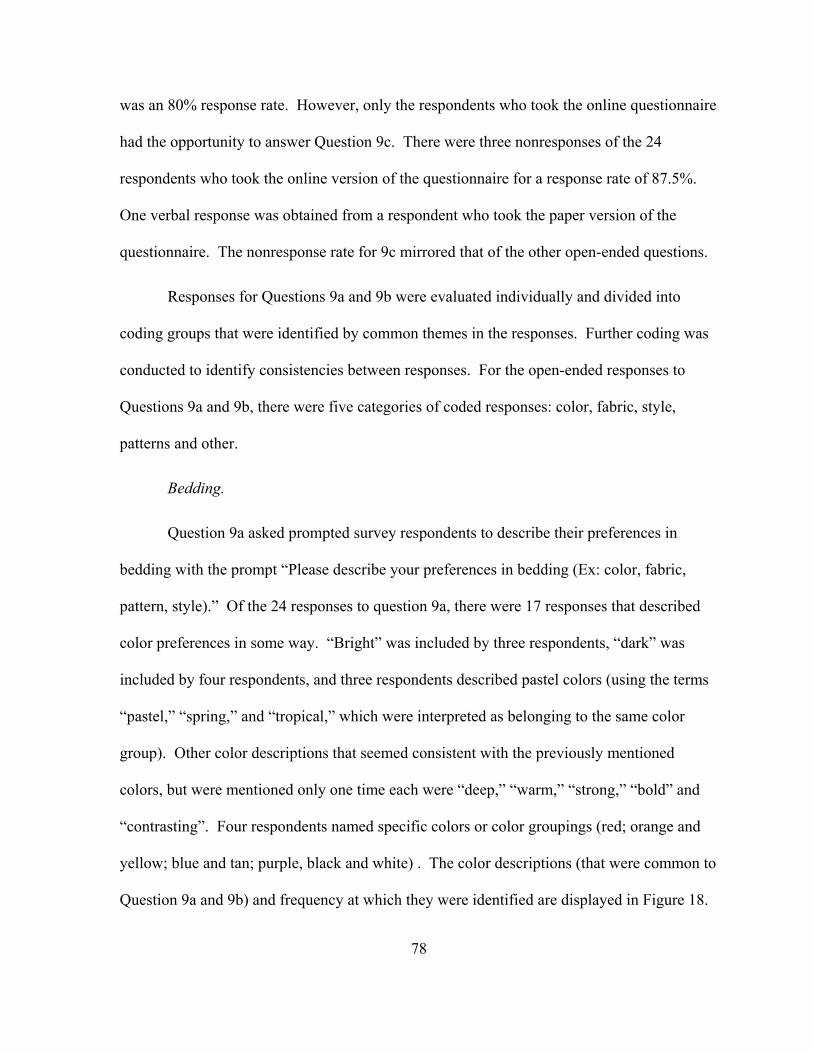
78
was an 80% response rate. However, only the respondents who took the online questionnaire
had the opportunity to answer Question 9c. There were three nonresponses of the 24
respondents who took the online version of the questionnaire for a response rate of 87.5%.
One verbal response was obtained from a respondent who took the paper version of the
questionnaire. The nonresponse rate for 9c mirrored that of the other open-ended questions.
Responses for Questions 9a and 9b were evaluated individually and divided into
coding groups that were identified by common themes in the responses. Further coding was
conducted to identify consistencies between responses. For the open-ended responses to
Questions 9a and 9b, there were five categories of coded responses: color, fabric, style,
patterns and other.
Bedding.
Question 9a asked prompted survey respondents to describe their preferences in
bedding with the prompt “Please describe your preferences in bedding (Ex: color, fabric,
pattern, style).” Of the 24 responses to question 9a, there were 17 responses that described
color preferences in some way. “Bright” was included by three respondents, “dark” was
included by four respondents, and three respondents described pastel colors (using the terms
“pastel,” “spring,” and “tropical,” which were interpreted as belonging to the same color
group). Other color descriptions that seemed consistent with the previously mentioned
colors, but were mentioned only one time each were “deep,” “warm,” “strong,” “bold” and
“contrasting”. Four respondents named specific colors or color groupings (red; orange and
yellow; blue and tan; purple, black and white) . The color descriptions (that were common to
Question 9a and 9b) and frequency at which they were identified are displayed in Figure 18.

79
Color Preferences for Bed and Bath
4 3 3 4
14 5
5
0
2
4
6
8
10
Dark Bright Pastel NamedColors
Color Preferences
Freq
uenc
y
BathBed
Figure 18. Questions 9a and 9b: Frequency of Color Preferences for Bed and Bath.
Seven respondents included descriptions of their fabric preferences. Four responses
indicated that they preferred high thread count, and four responses indicated a preference for
cotton fabrics. Three responses were gathered that pertained to bedding styles. Two
respondents specified that they prefer “simple” styles for their bedding, and a third described
her style preference as “antique.”
Twelve of the responses included information about pattern preferences. Of these 12,
several specified more than one type of preference. There were six comments that indicated
the respondents did not like patterns on their bedding. Four responses specifically stated that
floral patterns were undesirable. Another four identified a preference for solid-colored
bedding. Two responses said that “simple” patterns were preferred.

80
Twelve responses that did not fit into one of the four categories described above were
received for Question 9a. Eight respondents said that softness or comfort was important,
while two respondents specified that bedding should be washable.
Bath Products.
Question 9b prompted the respondent for their bath preferences. The question read
“Please describe your preferences in bath products (Ex: color, fabric, pattern, style etc).”
Sixteen of the responses referred to color preferences. Four respondents indicated that they
liked “bright” colors in the bathroom, five described pastel colors (using the terms “pastel,”
“light” and “tropical”), and five respondents named their bathroom decorating colors. Only
one respondent indicated that she prefers “dark” colors in the bathroom, compared to four
respondents who indicated a preference for “dark” colors in the bedroom.
Two respondents expressed a preference toward 100% cotton bath products,
compared with four references to cotton content for bedding. Four respondents described
their taste in style as “simple,” and two specified that matching was important. The
respondents (respondents number 4 and number 6) who indicated in Question 9a that
matching was important were the same respondents who specified consistent themes or
matching in Question 9b. In the quantitative section of the questionnaire, respondent 4 rated
the importance of availability of coordinated items as VERY IMPORTANT for bedding (4a),
bath products (4b) and between bed and bath products (5). Respondent 6 gave an importance
rating of 4 for the availability of coordinated bedding (4a) and bath products (4b), but only
rated the importance of coordination between bedding and bath as 3, or approximately
NEUTRAL.
81
In describing their preferences for bath products, nine respondents gave information
about their preferred patterns. Three respondents indicated that they preferred bathroom
products without patterns: one respondent explicitly stated that they preferred not to have
patterns, and another two said they like solid colors in the bathroom. An additional five
respondents described “simple” patterns in their preferences.
Eleven respondents gave answers in the ‘other’ coding category. Four responses
described softness and comfort as important, and two separate answers described the
importance of functionality (water resistance of shower curtains and “bleachability” of
towels). Price was mentioned in two responses to 9b, and was not mentioned at all in the
responses to 9a. This suggests that price may be a more important factor in choosing bath
products than for bedding. Two unexpected responses indicated that the scent of bath
products was important. This could present an opportunity for co-branding between a bath
line and laundry detergent.
Influence of Hispanic Heritage.
Question 9c asks how the respondents feel their cultural heritage influences their
colors or style preferences. Twenty two of the completed questionnaires included responses
to Question 9c. Of the 22, 12 stated that they feel their cultural heritage does influence their
home textile preferences. Of those 12, five stated that their preferences for bright colors
were due to their heritage. An additional four respondents indicated that their Hispanic
heritage affects other color or style preferences, but not their preferences for bed and bath.
Six respondents stated that they feel their Hispanic heritage had little or no influence on the
color or style preferences they have for home textiles.

82
Because ethnicity was the most important defining factor for this specific consumer
group, an ANOVA test was conducted post hoc to find out if segmenting the respondents by
whether they thought their culture influenced their preferences would explain differences in
their rating of the importance of the following variables: color (for bedding and bath), style
(for bedding and bath), brand name (for bedding and bath), fiber content (for bedding and
bath), the availability of packaged product sets (for bedding and bath), fabric type (for
bedding) and thread count (for bedding). Question 9c asked respondents how they felt their
cultural heritage influenced their preferences for color and style in home textiles. This
question was chosen as the independent variable because the responses may present a gauge
of how strongly the respondents represent the Hispanic home textile market.
Question 9c is an open-ended question; therefore, it was necessary to convert the
responses into a nominal scale before a statistical test could be run. Nonresponses to
Question 9c were coded as 0; responses indicating that the respondents did not feel that their
cultural heritage affected their home textile preferences were coded as 1; responses indicating
that cultural heritage did affect home textile preferences in some way were coded as 2. The
resulting variable is called 9c1 to differentiate it from the more specific responses to
Question 9c. The frequency of each response is shown in Table 14.
Table 14. Frequency of Responses for Affect of Cultural Heritage (9c1).
Response Code Frequency
Non Response 0 8
Does Not Affect 1 10
Does Affect 2 12

83
SPSS 11.0 was used to run a one-way ANOVA test with an alpha level of .05. The
responses for 9c1 were used as the independent variable, and the responses to Questions 6a-h
and 7a-f were the dependent variables. Appendix E shows the descriptive statistics, ANOVA
and multiple comparisons outputs from SPSS.
As shown in the significance column of Table E3 of Appendix E, Question 6c
(bedding style) was the only dependent variable with a resulting significance of less than .05
(p=.036). Table 15 shows the significant information.
Table 15. Analysis of Variance for Questions 6c (Bedding Style) and 9c1 (Cultural Heritage).
Source df F η p
Between subjects
6c 2 3.786 1.738 0.036
Within subjects
6c 27 3.786 0.459 0.036
As shown in Table E1 of Appendix E, the highest mean (M=4.62) was for the
nonresponse group (0), which had the lowest standard deviation (SD=.518). Group 1, which
indicated that they did not feel that their cultural heritage influenced their home textile
preferences had the lowest mean (M=3.80) and the highest standard deviation (SD=.789).
Group 2, which indicated that they felt their cultural heritage influenced their home textile
preferences in some way had a mean nearly as high as Group 0 (M=4.42) and had a standard
deviation of (SD=.669). Further analysis of the least squares differences (Appendix E Table
E5) showed that Group 0 was different from Group 1 and that Group 1 was different than
Group2. Groups 0 and 2 were not different from one another. This may indicate that the
respondents who did not give an answer for Question 9c were likely to be influenced by their

84
cultural heritage when choosing home textile products and the importance placed on bedding
style.
Additional post hoc analysis was conducted using variable 9c1 and the subjects’
interest in fashion (8c). An ANOVA test was run to determine if the responses for keeping
up with home fashion trends differ based on the respondents’ perceived cultural influence.
The results of the test yielded F=2.247 with p=.125, thus, indicating that the fashion interest
level was not influenced by the respondent’s perceived cultural influence.
Those respondents who said that their cultural heritage had no influence on their
home textile preferences, on average, gave a lower importance rating to the style of bedding.
Further study should be done with larger groups to clarify this hypothesis.
Findings
Research Objective One
Research Question One
The two leading U.S. home textile manufacturing companies were found to be
WestPoint Stevens and Springs Industries. Privately held Springs is larger than publicly
traded WestPoint Stevens in terms of sales volume. Research indicates that WestPoint
Stevens focuses more on sheets and towels while Springs offers additional products including
ceramic bath accessories which have a lower profit margin, but are often necessary to
complete a product line. The two companies have similar customer bases, both making most
of their sales to retailers, with only small proportions going to hospitality or institutional
supply companies. Table 8 highlights these similarities.
Research Question Two
85
Bed Bath & Beyond and Linens ‘n Things were found to be the two leading home
textile mass specialty retailers. The two companies have nearly identical product offerings,
share similar business strategies and seem to cater to the same customer base. Both
companies are publicly traded, though Bed Bath & Beyond, which is larger in terms of total
sales and number of stores, operates without debt (in contrast to Linens ‘n Things which uses
leverage in its accounting practices), and gives its individual stores more control over the
merchandise mix available in each store. The companies place stores in similar areas,
frequently within the same shopping centers, offer similar products at similar price points,
and accept each other’s coupons. There seems to be very little differentiation between Bed
Bath & Beyond and Linens ‘n Things.
Research Objective Two
Bedding
Price, color and style were, in order, the three most important factors in the purchase
decision process for bedding products. Brand name was the least important factor in the
purchase decision process for bedding and bath products. Brand name was significantly
below neutral and was rated LESS IMPORTANT. Fiber content was rated as slightly, but
significantly above neutral importance when purchasing bedding products. The availability
of packaged sets for bedding was rated as slightly but statistically above neutral importance
when making purchase decisions for bedding products. Fabric type was rated as MORE
IMPORTANT when purchasing bed products. Thread count was significantly a small amount
above NEUTRAL when purchasing bedding.
It is not surprising that price, color and style were the most important purchase
criteria for bedding because those criteria have been identified as some of the most important

86
purchase criteria for apparel in many documented studies. Many existing studies suggest
that, in general, Hispanic markets tend to be more brand-loyal than other markets, though this
research supports the studies that contradict that finding. The importance of price may have
been skewed in this study due to the fact that the subjects were college students, who may
have less disposable income than the general Hispanic population, and due to the fact that
there was an expressed preference for discount stores.
Bath
Price, color and style were the three most important factors when purchasing bath
products. This result mirrors the result for bedding factors. Also parallel to bedding, brand
name was the least important factor when purchasing bath products. It was significantly
below neutral and rated LESS IMPORTANT. For the purchase of bath products, fiber content
was not rated significantly different than NEUTRAL. The mean importance for the availability
of packaged sets of bath products was rated slightly below NEUTRAL, but was not statistically
different than NEUTRAL.
Like those of bedding, the purchase criteria for bath were expected to mirror the
purchase criteria of apparel. In general, the average importance of bath product purchase
criteria was less than that of bedding, indicating that the Hispanic consumers in my study
were not as involved with their bath product purchases as they were with their bedding
purchases.
Because the survey was administered online (or in the case of six questionnaires,
distributed by the organization’s President), there was the potential for bias due to
misinterpretation of the questionnaire. One respondent answers comparable to the rest of the
respondents on all questions except 7a-f. For those answers, the respondent indicated an
87
importance rating of 1 for all criteria. This may have not have meant that the criteria were all
unimportant, but that she did not have an interest in bath products and was not very involved
in the purchases.
Coordination
Coordination of bedding products was MORE IMPORTANT. Coordination of bath
products was only slightly, but significantly, higher than NEUTRAL. Coordination between
bedding and bath products was LESS IMPORTANT. These findings support the finding that the
bed-in-a-bag is the preferred packaging method for purchasing bedding. However, a lack of
interest in coordination between bedding and bath products may be an important
consideration for lines such as Thalia, which offers the product lines with bedding that
coordinates with bath products.
Retail Channels, Shopping Frequency and Orientation
Discount stores seem to be the preferred retail channel for purchasing home textile
products, but specialty and discount channels received only slightly lower levels of
preference. Discount stores are the most frequently used retail channel for purchasing home
textile products. There was not a large difference in the level of preference between
specialty, department and discount channels, indicating that shopping frequency at a given
channel may be due to convenience and location rather than preference. Location can be
especially important to college students who may have limited access to transportation.
Cultural Influence
Many of the products that satisfy the preferences of the Hispanic home textile market
are available at specialty mass retailers. Products featuring simple patterns and bright colors
were the most clearly absent. Bed-in-a-bag products, which are the preferred bed packaging,

88
do not offer enough high thread count sheets, cotton sheets, or solid patterns. Those
respondents who indicated that they did not feel that their cultural heritage influenced their
home textile preferences gave a lower score to style than those who indicated that they felt
their cultural heritage did influence their home textile preferences in some way.
Research Considerations
While one sample t-tests and post hoc ANOVA analyses were conducted,
interpretation is limited to the sample and is not generalizable to a larger population. As
indicated in Chapter III, the goal of this study is to use a convergence of evidence, thereby
providing information about possible trends in consumer preferences based on a variety of
sources of evidence. Therefore, this preliminary investigation offers a basis for further
research in the area of consumer preferences of home textile products.
One limitation of using a Likert scale is that not all respondents interpret the scale in
the same way. Also, the researcher as well as each respondent may assign different
meanings to the headers provided on the survey instrument. For instance, a respondent may
choose NOT IMPORTANT instead of NEUTRAL when they are trying to express having no
preference.
The researcher introduced bias into the observation technique in that interpretations
of the open-ended responses were filtered by the researcher’s existing assumptions about
home textile products.

89
CHAPTER V
Summary
The purposes of this study were to define the U.S. home textile industry by means of
an industry profile, explore the buyer characteristics and purchase decision factors that may
be important to U.S. Hispanic consumers as it relates to their purchases of home textile
products, and determine if products are currently available to satisfy the expressed
preferences of the Hispanic home textile consumer. Using known variables for consumer
preferences for apparel and pairing them with variables unique to home textiles (e.g. thread
count, bed-in-a-bag packaging, sateen weave), this study explored the importance Hispanic
consumers place on traditional purchase variables when shopping for home fashions. Thirty
Hispanic women completed a questionnaire regarding their home textile preferences for
product characteristics and retail channel. The data were analyzed with descriptive statistics
and one-sample tests for significance. This research provides a foundation for future
research in an emerging area of consumer study by establishing a framework for
investigations into home textile markets.
Conclusions
Research Objective One
Privately held Springs is larger in terms of sales volume than publicly traded
WestPoint Stevens, and WestPoint Stevens focuses more on sheets and towels while Springs
offers additional products including ceramic bath accessories. The two companies have
similar customer bases, both making most of their sales to retailers, including discount,
specialty and department store channels, as opposed to hospitality or institutional customers.
Table 8 highlights these similarities.
90
The two largest specialty retailers were found to have more similarities than the two largest
home textiles manufacturers. Bed Bath & Beyond and Linens ‘n Things have nearly
identical product offerings, share similar business strategies and seem to cater to the same
customer base. Both companies are publicly traded, though Bed Bath & Beyond is larger,
operates without debt (in contrast to Linens ‘n Things which uses leverage in its accounting
practices), and gives its individual stores more control over the merchandise mix available in
each store. The companies place stores in similar areas, frequently within the same shopping
centers, offer similar products at similar price points, and accept each other’s coupons. There
seems to be very little differentiation between Bed Bath & Beyond and Linens ‘n Things.
Research Objective Two
According to t-tests for differences in means, ANOVA and descriptive statistics, the
five most important purchase criteria for home textiles for female Hispanic college students
in North Carolina are the price, color and style of bedding and the price and color of bath
products. Two-tailed t-tests indicated that the importance levels of price, color, style, fiber
content and fabric type were all significantly higher than 3. The same test showed that brand
name had an importance level of significantly lower than 3. Thread count was the only
factor of the bedding decision criteria that was not statistically different than 3, meaning the
respondents felt generally neutral about the thread count of bedding products. This finding
runs counter to the current industry trend that favors increased thread count as a source of
differentiation among products. For both bedding and bath products, the importance of brand
name was rated significantly less than 3. This result challenges existing research that
91
suggests Hispanic buyers are brand-loyal, and supports reports that Hispanic buyers shop
based on price rather than brand.
The observation of home textile mass specialty retailers revealed that bath products
satisfying the preferences of the respondents were more widely available than bedding
products satisfying those same preferences.
Implications
The results of this research provide advancement in the knowledge of consumer
preferences for home textiles products. Prior to this study, little to no empirical research had
addressed consumer preferences using variables unique to the home textile industry. The
context of this study addresses the increasing buying power of the fast-growing Hispanic
population. In finding that price, color and style were the most important purchase criteria
for home textiles, a link has been formed between consumer purchase decision criteria for
home textiles and the more thoroughly studied area of consumer purchase behavior for
apparel products which was addressed in the literature review (Eckman, Damhorst &
Kandolph, 1990; Kim, 2001, Kulkarni, 1995, Thomas, Cassill & Forsythe, 1991).
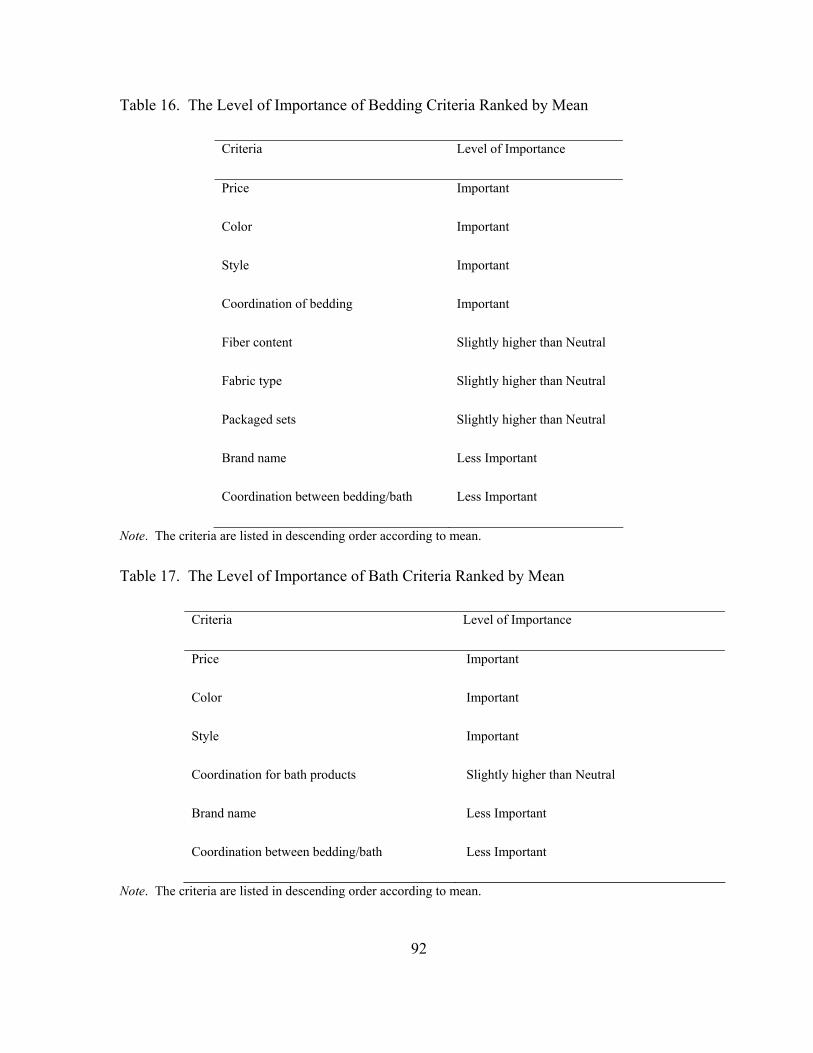
92
Table 16. The Level of Importance of Bedding Criteria Ranked by Mean
Criteria Level of Importance
Price Important
Color Important
Style Important
Coordination of bedding Important
Fiber content Slightly higher than Neutral
Fabric type Slightly higher than Neutral
Packaged sets Slightly higher than Neutral
Brand name Less Important
Coordination between bedding/bath Less Important
Note. The criteria are listed in descending order according to mean.
Table 17. The Level of Importance of Bath Criteria Ranked by Mean
Criteria Level of Importance
Price Important
Color Important
Style Important
Coordination for bath products Slightly higher than Neutral
Brand name Less Important
Coordination between bedding/bath Less Important
Note. The criteria are listed in descending order according to mean.

93
A t-test for significance indicated that the average importance ratings for Questions
4a and 4b were significantly different than 3 (p<.01, p<.01). Both are higher than 3,
indicating that coordination is IMPORTANT (M=4.27, M=3.83). However, the mean for
coordination between both bedding and bath was below 3 (M=2.43), suggesting less
importance. This may be an important consideration for home textile lines such as Thalia’s
bed and bath styles, which offer the product lines with bedding and coordinating bath
products.
Both the manufacturer and retailer of a product have an influence on the consumer.
In the case of the U.S. home textile industry, Springs Industries and WestPoint Stevens
represent the largest manufacturers while Bed Bath & Beyond and Linens ‘n Things
represent the largest mass specialty retailers. Mass specialty retailers of home textile
products are an important retail channel because they are quickly gaining market share of
home textile sales.
The results of the survey portion of this research offer clarification to the effects of
buyer characteristics on the decision process that takes place with influence from the
manufacturers and retailers of home textiles. The importance a consumer market places on
various purchase decision criteria can be a function of that market’s characteristics. Future
research should expand on the exploratory concepts presented in this study. There was an
apparent contradiction in the preferences for thread count. The results of Question 6d
indicated that the average response was NEUTRAL. However 17% (four of the twenty four
responses) of the open ended question about bedding preferences indicated that high thread
count was important. This could be due to a wide variability in thread count preferences
which may be linked to a demographic factor such as age or income. However, the average
94
response indicated a preference for discount stores. NEUTRAL interest in thread count might
be linked to the retail channel preference.
Retailers and manufacturers can benefit from an understanding of buyer purchase
decision criteria, and can use it to more accurately forecast buyer responses. If a retailer
knows how to adjust its marketing mix based on environmental stimuli, understanding what
occurs in the black box of buyer behavior will provide additional insight into consumers’
demand for a potential product. The Convergence of Evidence approach (Yin, 2003) was
effective in providing a preliminary examination of the purchase decision factors that were
important to the respondents of the study. The approach provided a multifaceted perspective
of the Hispanic market which can be used by manufacturers and retailers as they begin to
further explore new market opportunities for home textile products.
Several responses to Question 9b support information found in a Home Textiles
Today trade article (Silverstein & Fiske, 2004). ‘America Loves to Trade Up’ describes one
current trend in which consumers enjoy their disposable income most by saving money in
some areas (“trading down”) so they have extra money to spend in other areas (“trading up”).
The article reported that consumers trade up in bedding and trade down in bath linens. Part
of survey respondent 9’s answer to Question 9b was “towels are towels,” providing evidence
that she trades down on towels. Survey respondent 19 included the following in her response
to Question 9b: “I’d much rather invest my money in quality bedding than shower curtains,”
clearly showing her preference to trade up in bedding.
95
Recommendations for Future Research
The disparity between government reports and personal comments of the respondents
indicates an opportunity for further study of the use of the terms Latino (and Latina) and
Hispanic and understanding the impact of country of origin on the buyer decision process.
The U.S. Census Bureau reports that Hispanics may be of any race (U.S. Census Bureau,
2003), so the term Hispanic was used to describe ethnicity throughout the course of this
study. Of the survey respondents, 96.7% (n=29) indicated an ethnicity of “Hispanic.” The
single respondent who indicated her ethnicity as “other” specified in Question 10 of the
questionnaire, which asks for general comments and feedback about the study, that she
considers there to be a difference between Hispanic and Latina. If the research had used
different terminologies, the respondents may have provided different responses to the
questions. A market may also be defined differently based on subtle differences in the
connotations of terminologies used to describe it.
A study that evaluates the level of ethnic identification compared to the variation in
levels of criteria importance would increase understanding of buyer characteristics. As
Question 9c1 was used in Research Question Fourteen to identify how much the respondents
thought their cultural heritage influenced their home textile preferences, a measure of how
strongly the subject identifies as a member of their ethnic group could be used as the
independent variable to examine patterns of segmentation for additional preferences.
Wide inconsistencies in the terminology and definitions of home textile terms provide
an additional opportunity for future research in the form of a literature review to establish a
lexicon of home textile terminology. A more complete collection of currently published

96
home textile definitions as well as an industry survey could be used to find out how
manufactures and retailers define their products.
In future studies, income level could be compared to preferences in retail channel.
Retrospectively, Question 8f regarding respondent income was not as helpful as it could have
been because it did not specify if the respondents were financially independent, or supported
by other members of their families and it did not specify if the income level was the entire
household income or the respondent’s personal income. This presents an area for
clarification in future studies in which a more specific aspect of income could be compared
to aspects of the buying process such as preferred retail channel.
A connection for continued study of the level of preference for each type of
bedding packaging would clarify the apparent preference for bed-in-a-bag packaging found
in this study. Half of the respondents indicated that their preferred packaging of bedding
products was the bed-in-a-bag. Results of a one-sample t-test indicated that respondents’
average importance rating for question 6h (importance of the availability of packaged sets)
was significantly above 3.
Observations of additional retail channels, including online retailers, for
availability of products would shed light on the availability of preferred products and could
be compared to the preferred channel for a variety of markets. In this study, the availability
of specific products was determined by a visual assessment of home textile mass specialty
retail floors. The preferred retail channels vary based on the target market. It would be
beneficial to ascertain whether the preferred retail channel offers specifically demanded

97
products more readily than other retail channels, based on the characteristics of the target
market.
Replications of any part of this research with larger samples, random samples or
samples from other markets would further contribute to the current body of knowledge about
the home textile preferences of consumers. Following the blueprint of the convergence of
evidence approach or focusing one facet of the approach in a quantitative manner would
provide useful information about concepts that were investigated in an exploratory fashion in
this research.
98
REFERENCES
A year of change for top 5 players (2004, January 12). Home Textiles Today, 25, 1-8. Retrieved March 6, 2004, from InfoTrac database.
Agresti, A. & Finlay, B. (1999). Statistical methods for the social sciences (3rd ed.). Upper
Saddle River, NJ: Prentice Hall. Angel, C. (2001, January 6). Consumer guide: Linens. Detroit Free Press. Retrieved May
14, 2004, from http://www.freep.com/money/consumer/guide7_20010107.htm Armas, G. C. (2003, September 18). Hispanic population keeps growing. The Miami
Herald. Retrieved May 18, 2004, from http://www.broward.com/mld/miamiherald/2003/09/18/news/nation/6799315.htm
Beaudoin, P., Lachance, M. J., & Robitaille, J. (2003). Fashion innovativeness, fashion
diffusion and brand sensitivity among adolescents. Journal of Fashion Marketing and Management, 7, 23-30.
Bed Bath & Beyond, Inc. (2001) [Electronic version]. University of Oregon Investment
Group. Retrieved April 8, 2004, from http://www.uoregon.edu/~uoig/reports/02Spring/BBBY_4172001.PDF
Bed Bath & Beyond Inc. (2003). Retrieved April 5, 2004, from Standard & Poor’s Net
Advantage database. Blackwell, R. D., Miniard, P. W., & Engel, J. F. (2001). Consumer Behavior (9th ed.).
Ohio: South-Western. Burns, L. D. & Bryant, N. O. (1997). The business of fashion: Designing, manufacturing,
and marketing. New York: Fairchild Publications. Buying decisions may depend on look, label [Electronic version.] (2000, April). Home
Textiles Today, 21, 31-32. Retrieved March 22, 2004, from EBSCOhost database. Byrnes, N. (2004, January 19). What’s Beyond for Bed Bath & Beyond? [Electronic
version.]. Business Week, 3866, 46. Retrieved May 8, 2004, from ProQuest database.
Churchill, G. A., Jr., & Iacobucci, D. (2002). Marketing research: Methodological
foundations (8th ed.). Mason, OH: South-Western. Cohen, A. C. (1989). Marketing textiles: From fiber to retail. New York: Fairchild
Publications.

99
Coley, A. & Burgess, B. (2003). Gender differences in cognitive and affective impulse buying. Journal of Fashion Marketing and Management, 7, 282-295.
Corral, C. B. (2003a). The facts: Bath products. Home Textiles Today, 38-39. Retrieved
May 12, 2004, from ProQuest database. Corral, C. B. (2003b). The facts: Rugs. Home Textiles Today, 36-37. Retrieved May 12,
2004, from ProQuest database. Corral, C. B. (2003c). The facts: Table linens. Home Textiles Today, 44-45. Retrieved May
12, 2004, from ProQuest database. Corral, C. B. (2004, April 19). Suppliers eye hip Hispanic market [Electronic version].
Home Textiles Today, 25, 1. Creswell, J. W. (1994). Research design: Qualitative and quantitative approaches.
Thousand Oaks, CA: Sage. Domestics menu: Hot Launch (2003, March 10). DSN Retailing Today. Retrieved May 20,
2004, from http://www.findarticles.com/cf_dls/m0FNP/5_42/98998145/p1/article.jhtml
Donthu, N. & Cherian, J. (1994). Impact of strength of ethnic identification on Hispanic
shopping behavior. Journal of Retailing, 70, 383-393. Retrieved March 7, 2004, from ProQuest database.
Duff, M. (2003, August 18). National brands, private labels snuggle up [Electronic version].
DSN Retailing Today, 42, 18. Retrieved April 23, 2004, from ProQuest database. Dybis, K. (2003, July 20). Kmart targets Hispanic buyers with new brand [Electronic
version]. The Detroit News. Retrieved February 4, 2004, from http://www.detnews.com/2003/business/0307/21/b01-221696.htm
E. Barragan (personal communication, April 29, 2004) Eckman, M., Damhorst, M. L., & Kandolph, S. J. (1990). Toward a model of the in-store
purchase decision process: Consumer use of criteria for evaluating women’s apparel. Clothing and Textiles Research Journal, 8, 13-22.
Elkins, K. (2004, January 2). Crandall Bowles launches a plan to remake Springs
[Electronic version]. Charlotte Business Journal. Retrieved May 20, 2004, from http://www.bizjournals.com/charlotte/stories/2004/01/05/story10.html?page=1
Hatch, K. L. (1993). Textile science. St. Paul, MN: West Publishing.

100
Herbig, P. & Yelkur, R. (1997). Differences between Hispanic and Anglo consumer expectations [Electronic version]. Management Decision, 85, 123-132. Retrieved January 19, 2004 from Emerald FullText.
Holmes, T. E. (2003, September). Rule Hispania [Electronic version]. Promo, 16, 45-47.
Retrieved January 12, 2004, from Wilson OmniFile database. Hsu, H-J. & Burns, L. D. (2002). Clothing evaluative criteria: A cross-national comparison
of Taiwanese and United States consumers. Clothing and Textiles Research Journal, 20, 246-252.
Jernigan, M. H., & Easterling, C. R. (1990). Fashion merchandising and marketing. New
York: Macmillan Publishing Company. Johnson, K. K. P, Schofield, N. A., & Yurchisin, J. (2002). Appearance and dress as a source
of information: A qualitative approach to data collection. Clothing and Textiles Research Journal, 20, 125-137.
Kim, Y-K. (2001, March). The effects of ethnicity and product on purchase decision
making. Journal of Advertising Research, 41. Kmart Corporation. (2002, December 10). Kmart and Latin superstar Thalia announce
long-term partnership: Mexican entertainer to launch exclusive apparel and accessories collection at Kmart for back-to-school 2003. Retrieved February 4, 2004, from http://kmartcorp.com/corp/story/pressrelease/news/pr021210.stm
Kmart spices up apparel mix (2003, January 6) [Electronic version]. DSN Retailing Today,
42, 41. Retrieved January 16, 2004 from InfoTrac OneFile. Kotler, P. (2000). Marketing Management: Analysis, planning, implementation, and control
(Millennium ed). New Jersey: Prentice-Hall. Kotler, P., and Armstrong, G. (2001). Principles of Marketing (9th ed.). New Jersey:
Prentice-Hall. Krippel, J. (2004a). Bed Bath & Beyond Inc. Retrieved April 5, 2004 from Hoover’s
Company Capsules and Profiles via ProQuest database. Krippel, J. (2004b). Linens ‘n Things, Inc. Retrieved April 5, 2004 from Hoover’s
Company Capsules and Profiles via ProQuest database. Krippel, J. (2004c). Springs Industries, Inc. Retrieved April 28, 2004, from Hoover’s
Company Capsules and Profiles via ProQuest database.

101
Krippel, J. (2004d). WestPoint Stevens Inc. Retrieved April 28, 2004, from Hoovers Company Capsules and Profiles via ProQuest database.
Kulkarni, D. S. (1995, May). Consumer’s psychology of apparel selection. Journal of the
Textile Association, 56, 31-32. Lazaro, M. (2002, March). Springs gains Hispanic appeal with new deal. Home Textiles
Today, 24, 18. Retrieved March 19, 2004, from ProQuest database. Lazaro, M. (2003a). The facts: Bedding. Home Textiles Today, 32. Retrieved May 12,
2004, from ProQuest database. Lazaro, M. (2003b). The facts: Window coverings. Home Textiles Today, 24, 10.
Retrieved May 12, 2004, from ProQuest database.
Lazich, R. S. (Ed.). (2004). Market share reporter: An annual compilation of reported market share data on companies, products, and services. Detroit: Thomson Gale.
Lee, S.-E., Kunz, G. I., Fiore, A. M., & Campbell, J. R. (2002). Acceptance of mass
customization of apparel: Merchandising issues associated with preference for product, process, and place. Clothing and Textiles Research Journal, 20, 138-146.
Linens ‘n Things, Inc. (2003a) [Electronic version]. University of Oregon Investment Group.
Retrieved April 8, 2004, from http://darkwing.uoregon.edu/~uoig/reports/03Fall/LIN.pdf
Linens ‘n Things Inc. (2003b). Retrieved April 5, 2004, from Standard & Poor’s Net
Advantage database. Lisanti, T. (2003, September 22). Three factors that will drive growth [Electronic version].
DSN Retailing Today, 42, 6. Retrieved February 12, 2004, from ABI/Inform Global. LNT registers at BTS (2003, June) [Electronic version]. Home Textiles Today, 24, 2.
Retrieved March 19, 2004, from ProQuest database. Malhotra, N. K. (1999). Marketing research: An applied orientation. Upper Saddle River,
New Jersey: Prentice-Hall. McManus, J. & Fetto, J. (2003, July). Street wiser [Electronic version]. American
Demographics, 25, 32. Retrieved March 8, 2004, from ProQuest database. Mucha, T. (2003, July 31). The Latino Side of Sears: A retail giant tries to tap a powerful
demographic. Business 2.0. Retrieved February 12, 2004, from http://www.business2.com/b2/subscribers/articles/0,17863,515928-1,00.html
102
Mulhern, F. J. & Williams, J.D. (1994, Fall). A comparative analysis of shopping behavior in Hispanic and non-Hispanic market areas. Journal of Retailing, 70, 231-251. Retrieved March 5, 2004, from ProQuest database.
National Retail Federation (2003). Back-to-college spending to reach $26 billion. Retrieved
March 20, 2004, from http://retailindustry.about.com/cs/stats_consumers/a/bl_nrf081903.htm
New Sears apparel licensor looks toward home [Electronic version]. (2003, September 12).
Home Textiles Today. Retrieved February 19, 2004, from http://www.hometextilestoday.com/article/CA322678/htt?text=lucy+pereda
Nichols, J. A. F. (1997). Time and companionship: Key factors in Hispanic shopping
behavior. The Journal of Consumer Marketing, 14, 194-205. Retrieved March 5, 2004, from ProQuest Database.
Oliver, B. (1985). Sex-role plays part in purchasing. Bobbin, 26, 170, 172, 174, 176. O’Neal, G. S. (1998). African-American aesthetic of dress: Current manifestations.
Clothing and Textiles Research Journal, 16, 167-175. Parks, S., Widdows, R. (2001). Korean households’ clothing expenditures by categories.
Clothing and Textile Research Journal, 19, 1-10. Paulin, G. D. (2003, August). A changing market: Expenditures by Hispanic consumers,
revisited. Monthly Labor Review, 126, 12. Retrieved March 16, 2004, from ProQuest database.
Retailers goose opening prices (2003, March 3) [Electronic version]. Home Textiles Today,
24, 16. Retrieved April 14, 2005, from ProQuest database. Retailing giants: Top 50 home textiles retailers (2004, January 30). Home Textiles Today,
23, 43-47. Retrieved March 6, 2004, from InfoTrac database. Rohrlich, M. (2003, August 7). College-Bound, Dorm Linens 101. New York Times.
Retrieved March 20, 2004, from InfoTrac database. Salant, P., & Dillman, D. A. (1994). How to conduct your own survey. New York: John
Wiley &Sons, Inc. SanFillipo, M. (2003, October 27). Pacific Designs ramps up creative touch [Electronic
version]. Home Textiles Today, 25, 6. Retrieved May 18, 2004, from ProQuest database.

103
Scardino, E. (2003, August 18). Viva Thalia! Kmart bets big on rising Latina star [Electronic version]. DSN Retailing Today, 42, 1-2. Retrieved February 4, 2004 from Business Source Elite.
Schmidt, P. (2003). Academe’s Hispanic Future. The Chronicle of Higher Education,
Special Report, 8. Schwartz, D. B. (2003, November). Better in bed [Electronic version]. LBD Interior
Textiles. Retrieved March 6, 2004, from http://www.ldbinteriortextiles.com/pdf/nov_2003/1.cfm
Silverstein, M. & Fiske, N. (2004, January 26). America loves to trade up [Electronic
version]. Home Textiles Today, 26, 4. Retrieved March 6, 2004, from ProQuest database.
Sloan, C. (2003, October 27). Silk major trend at High Point [Electronic version]. Home
Textiles Today, 25, 8. Retrieved April 23, 2004, from ProQuest database. Solomon, M. J. & Rabolt, N. J. (2004). Consumer behavior: In fashion. Upper Saddle River,
New Jersey: Pearson Education. Springs Industries (n.d.). About Springs. Retrieved May 4, 2004, from
http://www.springs.com/corporateinfo/about_springs/ The facts: Kitchen textiles. (2003). Home Textiles Today, 42-43. Retrieved May 12, 2004,
from ProQuest database. Thomas, J. B., Cassill, N. L., & Forsythe, S. M. (1991). Underlying dimensions of apparel
involvement in consumers’ purchase decisions. Clothing and Textiles Research Journal, 9, 45-48.
Tondl, R. M. (1997). Tencel Lyocell, the New Generic Fiber. University of Nebraska
Cooperative Extension. Retrieved June 8, 2004, from http://ianrpubs.unl.edu/textiles/nf350.htm
Top 15 vendors—2003 (2004, February 17). Home Textiles Today. Retrieved March 7,
2004, from http://www.hometextilestoday.com/article/CA381955/htt?industry=Top+15+Vendors&industryid=1523
U.S. Census Bureau (2000, March). The Hispanic Population in the United States (Current
Population Reports, P20-535, U.S. Census Bureau). Washington DC.

104
U.S. Census Bureau (2002). Statistical Abstract of the United States: 2001 [Electronic version]. Washington DC. Retrieved 21 February 2004, from http://www.census.gov/prod/2002pubs/01statab/pop.pdf
U.S. Census Bureau (2003). Income in the United States: 2002 [Electronic version].
Washington DC. Retrieved March 8, 2004, from http://www.census.gov/prod/2003pubs/p60-221.pdf
Voyteshonock, D. (2003). Linens ‘n Things, Inc. [Electronic version]. University of Oregon
Investment Group. Retrieved April 8, 2004, from http://uoig.uoregon.edu/reports/03Fall/LIN.pdf
Webster, N. C. (2001, January 1). Experts: Ethnic market to weather ad slowdown.
Advertising Age, 72, 20. Retrieved February 2, 2004, from ABI/Inform Global. WestPoint Stevens (2004). Retrieved April 5, 2004, from Standard & Poor’s Net Advantage
database. WestPoint Stevens (2003). Retrieved May 4, 2004, from http://www.westpointstevens.com WestPoint Stevens Reports First Quarter 2004 Results (2004, May). WestPoint Stevens
News Release. Retrieved May 19, 2004, from http://www.investorwestpoint.com/performance/pressReleases.asp
Workman, S. E., & Kidd, L. K. (2000). Use of the Need for Uniqueness scale to characterize
fashion consumer groups. Clothing and Textiles Research Journal, 18, 227-236. Yin, R. K. (2003). Case study research: design and methods (3rd ed.). Thousand Oaks, CA:
Sage. Yue, L. (2003, June 19). Sears ties brand to Hispanic celebrity [Electronic version].
Chicago Tribune. Retrieved February,18 2004, from http://www.chicagotribune.com/business/chi-0306190279jun19,1,3536357.story?coll=chi-business-hed
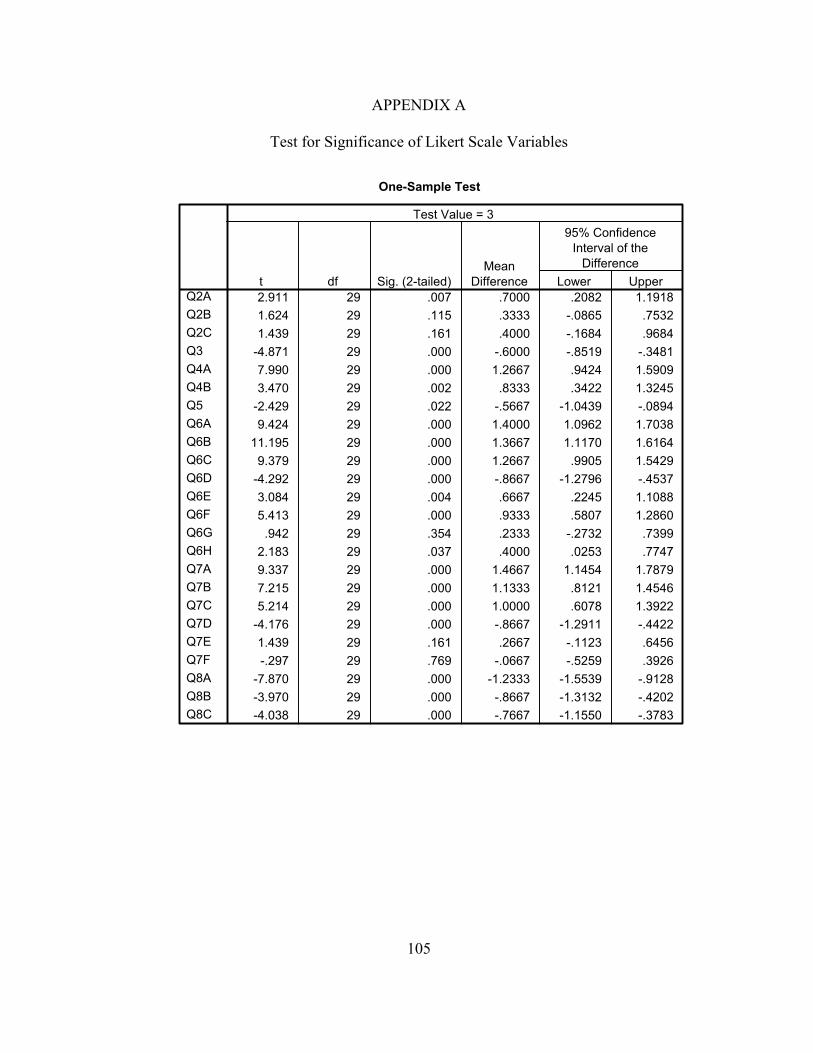
105
APPENDIX A
Test for Significance of Likert Scale Variables
One-Sample Test
2.911 29 .007 .7000 .2082 1.19181.624 29 .115 .3333 -.0865 .75321.439 29 .161 .4000 -.1684 .9684
-4.871 29 .000 -.6000 -.8519 -.34817.990 29 .000 1.2667 .9424 1.59093.470 29 .002 .8333 .3422 1.3245
-2.429 29 .022 -.5667 -1.0439 -.08949.424 29 .000 1.4000 1.0962 1.7038
11.195 29 .000 1.3667 1.1170 1.61649.379 29 .000 1.2667 .9905 1.5429
-4.292 29 .000 -.8667 -1.2796 -.45373.084 29 .004 .6667 .2245 1.10885.413 29 .000 .9333 .5807 1.2860
.942 29 .354 .2333 -.2732 .73992.183 29 .037 .4000 .0253 .77479.337 29 .000 1.4667 1.1454 1.78797.215 29 .000 1.1333 .8121 1.45465.214 29 .000 1.0000 .6078 1.3922
-4.176 29 .000 -.8667 -1.2911 -.44221.439 29 .161 .2667 -.1123 .6456-.297 29 .769 -.0667 -.5259 .3926
-7.870 29 .000 -1.2333 -1.5539 -.9128-3.970 29 .000 -.8667 -1.3132 -.4202-4.038 29 .000 -.7667 -1.1550 -.3783
Q2AQ2BQ2CQ3Q4AQ4BQ5Q6AQ6BQ6CQ6DQ6EQ6FQ6GQ6HQ7AQ7BQ7CQ7DQ7EQ7FQ8AQ8BQ8C
t df Sig. (2-tailed)Mean
Difference Lower Upper
95% ConfidenceInterval of the
Difference
Test Value = 3
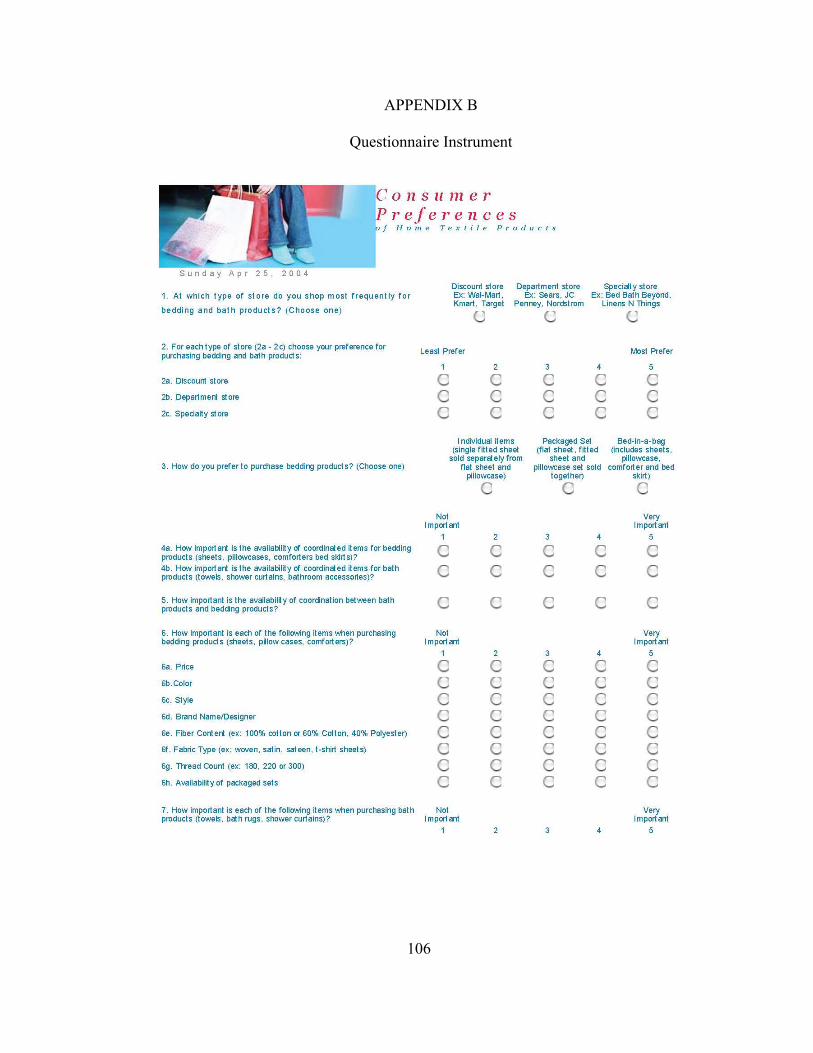
106
APPENDIX B
Questionnaire Instrument

107

108
APPENDIX C
Home Textile Mass Specialty Retailer Bedding Product Availability Data Capture Sheet
Store Visit Data Capture Sheet Store: Bedding
Location: Bed-in-a-Bag Packaged Sets Color Categories Bright Dark Spring/Pastel/Tropical Named Colors Blue/Tan Orange/Yellow Purple/Black/White Red Patterns Light against dark No pattern (solid colors) Simple patterns Other 100% Cotton High thread count: 230-280: better 300-400: best T-shirt sheets available? Labeled as Soft/comfortable Washable/functional
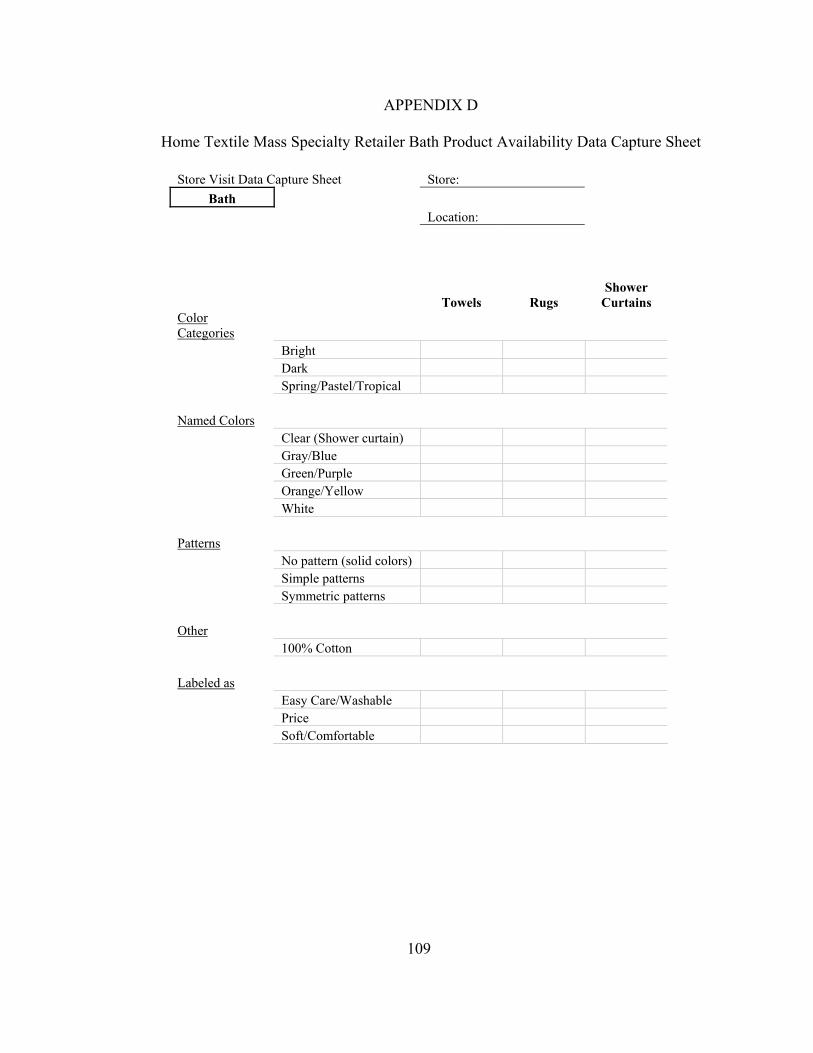
109
APPENDIX D
Home Textile Mass Specialty Retailer Bath Product Availability Data Capture Sheet
Store Visit Data Capture Sheet Store: Bath
Location:
Towels Rugs Shower
Curtains Color Categories Bright Dark Spring/Pastel/Tropical Named Colors Clear (Shower curtain) Gray/Blue Green/Purple Orange/Yellow White Patterns No pattern (solid colors) Simple patterns Symmetric patterns Other 100% Cotton Labeled as Easy Care/Washable Price Soft/Comfortable

110
APPENDIX E
Post Hoc Analysis of Ordinal Questionnaire Results
Table E1. Descriptive Statistics from ANOVA: 9c1 and Importance of Bedding Criteria
Descriptives
8 4.6250 .74402 .26305 4.0030 5.2470 3.00 5.0010 4.0000 1.05409 .33333 3.2459 4.7541 2.00 5.0012 4.5833 .51493 .14865 4.2562 4.9105 4.00 5.0030 4.4000 .81368 .14856 4.0962 4.7038 2.00 5.00
8 4.3750 .74402 .26305 3.7530 4.9970 3.00 5.0010 4.1000 .73786 .23333 3.5722 4.6278 3.00 5.0012 4.5833 .51493 .14865 4.2562 4.9105 4.00 5.0030 4.3667 .66868 .12208 4.1170 4.6164 3.00 5.00
8 4.6250 .51755 .18298 4.1923 5.0577 4.00 5.0010 3.8000 .78881 .24944 3.2357 4.3643 3.00 5.0012 4.4167 .66856 .19300 3.9919 4.8414 3.00 5.0030 4.2667 .73968 .13505 3.9905 4.5429 3.00 5.00
8 2.1250 1.24642 .44068 1.0830 3.1670 1.00 4.0010 2.0000 1.05409 .33333 1.2459 2.7541 1.00 4.0012 2.2500 1.13818 .32856 1.5268 2.9732 1.00 4.0030 2.1333 1.10589 .20191 1.7204 2.5463 1.00 4.00
8 4.0000 .92582 .32733 3.2260 4.7740 3.00 5.0010 3.3000 1.25167 .39581 2.4046 4.1954 1.00 5.0012 3.7500 1.28806 .37183 2.9316 4.5684 1.00 5.0030 3.6667 1.18419 .21620 3.2245 4.1088 1.00 5.00
8 4.2500 .88641 .31339 3.5089 4.9911 3.00 5.0010 3.4000 .84327 .26667 2.7968 4.0032 2.00 4.0012 4.1667 .93744 .27061 3.5710 4.7623 2.00 5.0030 3.9333 .94443 .17243 3.5807 4.2860 2.00 5.00
8 3.2500 1.58114 .55902 1.9281 4.5719 1.00 5.0010 3.0000 1.33333 .42164 2.0462 3.9538 1.00 5.0012 3.4167 1.31137 .37856 2.5835 4.2499 1.00 5.0030 3.2333 1.35655 .24767 2.7268 3.7399 1.00 5.00
8 3.8750 .99103 .35038 3.0465 4.7035 3.00 5.0010 2.9000 .99443 .31447 2.1886 3.6114 1.00 4.0012 3.5000 .90453 .26112 2.9253 4.0747 2.00 5.0030 3.4000 1.00344 .18320 3.0253 3.7747 1.00 5.00
.001.002.00Total.001.002.00Total.001.002.00Total.001.002.00Total.001.002.00Total.001.002.00Total.001.002.00Total.001.002.00Total
Q6A
Q6B
Q6C
Q6D
Q6E
Q6F
Q6G
Q6H
N Mean Std. Deviation Std. Error Lower Bound Upper Bound
95% Confidence Interval forMean
Minimum Maximum
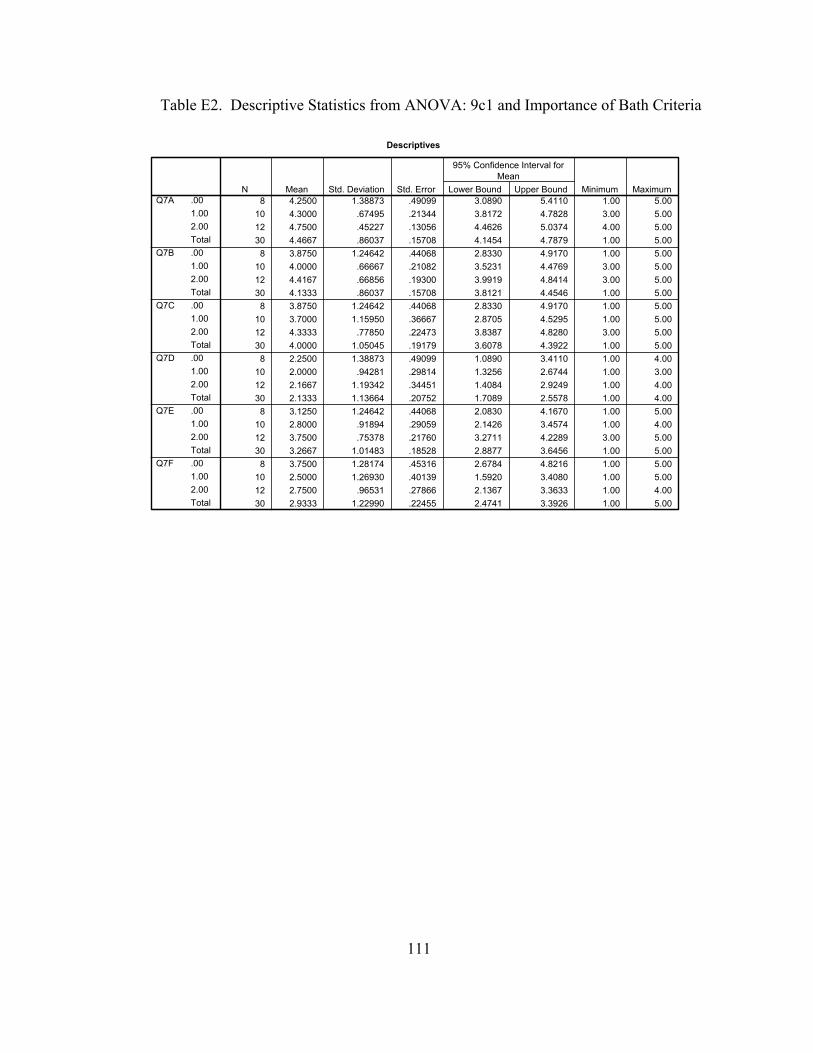
111
Table E2. Descriptive Statistics from ANOVA: 9c1 and Importance of Bath Criteria
Descriptives
8 4.2500 1.38873 .49099 3.0890 5.4110 1.00 5.0010 4.3000 .67495 .21344 3.8172 4.7828 3.00 5.0012 4.7500 .45227 .13056 4.4626 5.0374 4.00 5.0030 4.4667 .86037 .15708 4.1454 4.7879 1.00 5.00
8 3.8750 1.24642 .44068 2.8330 4.9170 1.00 5.0010 4.0000 .66667 .21082 3.5231 4.4769 3.00 5.0012 4.4167 .66856 .19300 3.9919 4.8414 3.00 5.0030 4.1333 .86037 .15708 3.8121 4.4546 1.00 5.00
8 3.8750 1.24642 .44068 2.8330 4.9170 1.00 5.0010 3.7000 1.15950 .36667 2.8705 4.5295 1.00 5.0012 4.3333 .77850 .22473 3.8387 4.8280 3.00 5.0030 4.0000 1.05045 .19179 3.6078 4.3922 1.00 5.00
8 2.2500 1.38873 .49099 1.0890 3.4110 1.00 4.0010 2.0000 .94281 .29814 1.3256 2.6744 1.00 3.0012 2.1667 1.19342 .34451 1.4084 2.9249 1.00 4.0030 2.1333 1.13664 .20752 1.7089 2.5578 1.00 4.00
8 3.1250 1.24642 .44068 2.0830 4.1670 1.00 5.0010 2.8000 .91894 .29059 2.1426 3.4574 1.00 4.0012 3.7500 .75378 .21760 3.2711 4.2289 3.00 5.0030 3.2667 1.01483 .18528 2.8877 3.6456 1.00 5.00
8 3.7500 1.28174 .45316 2.6784 4.8216 1.00 5.0010 2.5000 1.26930 .40139 1.5920 3.4080 1.00 5.0012 2.7500 .96531 .27866 2.1367 3.3633 1.00 4.0030 2.9333 1.22990 .22455 2.4741 3.3926 1.00 5.00
.001.002.00Total.001.002.00Total.001.002.00Total.001.002.00Total.001.002.00Total.001.002.00Total
Q7A
Q7B
Q7C
Q7D
Q7E
Q7F
N Mean Std. Deviation Std. Error Lower Bound Upper Bound
95% Confidence Interval forMean
Minimum Maximum

112
Table E3. ANOVA Results for 9c1 and Importance of Bedding Criteria
ANOVA
2.408 2 1.204 1.936 .16416.792 27 .62219.200 29
1.275 2 .638 1.472 .24711.692 27 .43312.967 29
3.475 2 1.738 3.786 .03612.392 27 .45915.867 29
.342 2 .171 .131 .87735.125 27 1.30135.467 29
2.317 2 1.158 .816 .45338.350 27 1.42040.667 29
4.300 2 2.150 2.692 .08621.567 27 .79925.867 29
.950 2 .475 .245 .78552.417 27 1.94153.367 29
4.425 2 2.213 2.411 .10924.775 27 .91829.200 29
Between GroupsWithin GroupsTotalBetween GroupsWithin GroupsTotalBetween GroupsWithin GroupsTotalBetween GroupsWithin GroupsTotalBetween GroupsWithin GroupsTotalBetween GroupsWithin GroupsTotalBetween GroupsWithin GroupsTotalBetween GroupsWithin GroupsTotal
Q6A
Q6B
Q6C
Q6D
Q6E
Q6F
Q6G
Q6H
Sum ofSquares df Mean Square F Sig.

113
Table E4. ANOVA Results for 9c1 and Importance of Bath Criteria
ANOVA
1.617 2 .808 1.099 .34719.850 27 .73521.467 29
1.675 2 .838 1.143 .33419.792 27 .73321.467 29
2.358 2 1.179 1.074 .35629.642 27 1.09832.000 29
.300 2 .150 .109 .89737.167 27 1.37737.467 29
5.142 2 2.571 2.807 .07824.725 27 .91629.867 29
7.617 2 3.808 2.837 .07636.250 27 1.34343.867 29
Between GroupsWithin GroupsTotalBetween GroupsWithin GroupsTotalBetween GroupsWithin GroupsTotalBetween GroupsWithin GroupsTotalBetween GroupsWithin GroupsTotalBetween GroupsWithin GroupsTotal
Q7A
Q7B
Q7C
Q7D
Q7E
Q7F
Sum ofSquares df Mean Square F Sig.

114
Table E5. Least Squared Differences Analysis for 9c1 and Bedding Criteria
Multiple Comparisons
LSD
.6250 .37407 .106 -.1425 1.3925
.0417 .35995 .909 -.6969 .7802-.6250 .37407 .106 -1.3925 .1425-.5833 .33766 .095 -1.2762 .1095-.0417 .35995 .909 -.7802 .6969.5833 .33766 .095 -.1095 1.2762.2750 .31214 .386 -.3655 .9155
-.2083 .30036 .494 -.8246 .4079-.2750 .31214 .386 -.9155 .3655-.4833 .28176 .098 -1.0615 .0948.2083 .30036 .494 -.4079 .8246.4833 .28176 .098 -.0948 1.0615.8250* .32135 .016 .1657 1.4843.2083 .30922 .506 -.4261 .8428
-.8250* .32135 .016 -1.4843 -.1657-.6167* .29007 .043 -1.2118 -.0215-.2083 .30922 .506 -.8428 .4261.6167* .29007 .043 .0215 1.2118.1250 .54103 .819 -.9851 1.2351
-.1250 .52060 .812 -1.1932 .9432-.1250 .54103 .819 -1.2351 .9851-.2500 .48837 .613 -1.2520 .7520.1250 .52060 .812 -.9432 1.1932.2500 .48837 .613 -.7520 1.2520.7000 .56532 .226 -.4599 1.8599.2500 .54398 .649 -.8661 1.3661
-.7000 .56532 .226 -1.8599 .4599-.4500 .51030 .386 -1.4970 .5970-.2500 .54398 .649 -1.3661 .8661.4500 .51030 .386 -.5970 1.4970.8500 .42394 .055 -.0198 1.7198.0833 .40793 .840 -.7537 .9203
-.8500 .42394 .055 -1.7198 .0198-.7667 .38268 .055 -1.5519 .0185-.0833 .40793 .840 -.9203 .7537.7667 .38268 .055 -.0185 1.5519.2500 .66091 .708 -1.1061 1.6061
-.1667 .63596 .795 -1.4716 1.1382-.2500 .66091 .708 -1.6061 1.1061-.4167 .59659 .491 -1.6408 .8074.1667 .63596 .795 -1.1382 1.4716.4167 .59659 .491 -.8074 1.6408.9750* .45438 .041 .0427 1.9073.3750 .43722 .399 -.5221 1.2721
-.9750* .45438 .041 -1.9073 -.0427-.6000 .41015 .155 -1.4416 .2416-.3750 .43722 .399 -1.2721 .5221.6000 .41015 .155 -.2416 1.4416
(J) Q9C11.002.00.002.00.001.001.002.00.002.00.001.001.002.00.002.00.001.001.002.00.002.00.001.001.002.00.002.00.001.001.002.00.002.00.001.001.002.00.002.00.001.001.002.00.002.00.001.00
(I) Q9C1.00
1.00
2.00
.00
1.00
2.00
.00
1.00
2.00
.00
1.00
2.00
.00
1.00
2.00
.00
1.00
2.00
.00
1.00
2.00
.00
1.00
2.00
Dependent VariableQ6A
Q6B
Q6C
Q6D
Q6E
Q6F
Q6G
Q6H
MeanDifference
(I-J) Std. Error Sig. Lower Bound Upper Bound95% Confidence Interval
The mean difference is significant at the .05 level.*.
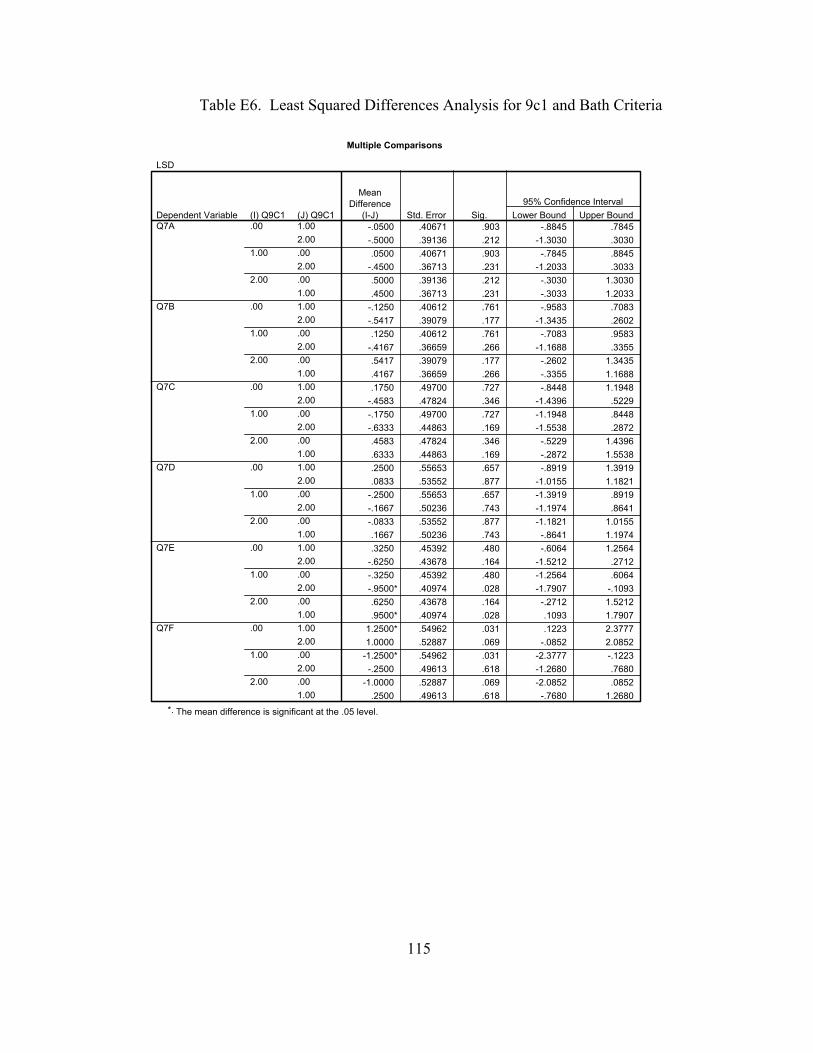
115
Table E6. Least Squared Differences Analysis for 9c1 and Bath Criteria
Multiple Comparisons
LSD
-.0500 .40671 .903 -.8845 .7845-.5000 .39136 .212 -1.3030 .3030.0500 .40671 .903 -.7845 .8845
-.4500 .36713 .231 -1.2033 .3033.5000 .39136 .212 -.3030 1.3030.4500 .36713 .231 -.3033 1.2033
-.1250 .40612 .761 -.9583 .7083-.5417 .39079 .177 -1.3435 .2602.1250 .40612 .761 -.7083 .9583
-.4167 .36659 .266 -1.1688 .3355.5417 .39079 .177 -.2602 1.3435.4167 .36659 .266 -.3355 1.1688.1750 .49700 .727 -.8448 1.1948
-.4583 .47824 .346 -1.4396 .5229-.1750 .49700 .727 -1.1948 .8448-.6333 .44863 .169 -1.5538 .2872.4583 .47824 .346 -.5229 1.4396.6333 .44863 .169 -.2872 1.5538.2500 .55653 .657 -.8919 1.3919.0833 .53552 .877 -1.0155 1.1821
-.2500 .55653 .657 -1.3919 .8919-.1667 .50236 .743 -1.1974 .8641-.0833 .53552 .877 -1.1821 1.0155.1667 .50236 .743 -.8641 1.1974.3250 .45392 .480 -.6064 1.2564
-.6250 .43678 .164 -1.5212 .2712-.3250 .45392 .480 -1.2564 .6064-.9500* .40974 .028 -1.7907 -.1093.6250 .43678 .164 -.2712 1.5212.9500* .40974 .028 .1093 1.7907
1.2500* .54962 .031 .1223 2.37771.0000 .52887 .069 -.0852 2.0852
-1.2500* .54962 .031 -2.3777 -.1223-.2500 .49613 .618 -1.2680 .7680
-1.0000 .52887 .069 -2.0852 .0852.2500 .49613 .618 -.7680 1.2680
(J) Q9C11.002.00.002.00.001.001.002.00.002.00.001.001.002.00.002.00.001.001.002.00.002.00.001.001.002.00.002.00.001.001.002.00.002.00.001.00
(I) Q9C1.00
1.00
2.00
.00
1.00
2.00
.00
1.00
2.00
.00
1.00
2.00
.00
1.00
2.00
.00
1.00
2.00
Dependent VariableQ7A
Q7B
Q7C
Q7D
Q7E
Q7F
MeanDifference
(I-J) Std. Error Sig. Lower Bound Upper Bound95% Confidence Interval
The mean difference is significant at the .05 level.*.