Embed Size (px)
Citation preview
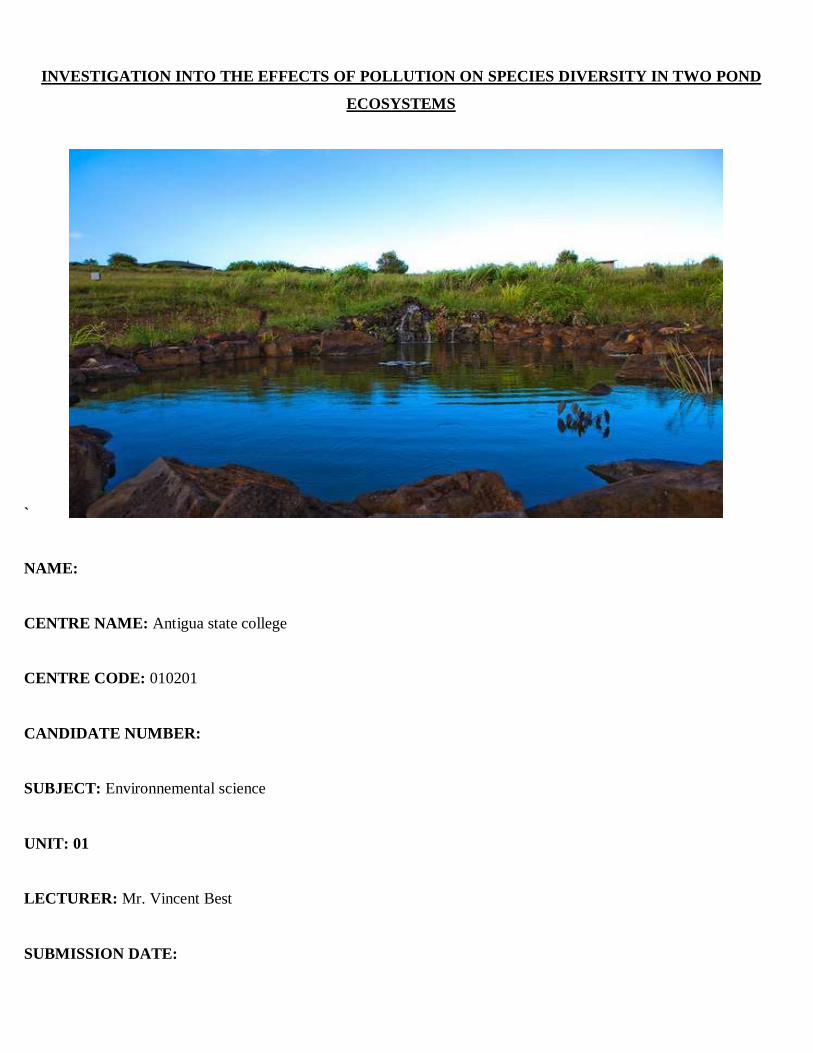
INVESTIGATION INTO THE EFFECTS OF POLLUTION ON SPECIES DIVERSITY IN TWO POND
ECOSYSTEMS
`
NAME:
CENTRE NAME: Antigua state college
CENTRE CODE: 010201
CANDIDATE NUMBER:
SUBJECT: Environnemental science
UNIT: 01
LECTURER: Mr. Vincent Best
SUBMISSION DATE:
Table of contents
Problem statement
Purpose of project
Methods of data collection
Literature review
Site visits and labs
Journals (Site visits 1 to 4 to city and Natty dread ponds)
Labs 1a & 1b species diversity index for City pond
Labs 2a & 2b species diversity index for Natty dread pond
Lab 3 (pH of soil & water from both systems)
Lab 4 (Phosphate content of water from both systems)
Lab 5 (nitrate in water from both sites)
Lab 6 (nitrite in water from both sites
Presentation & analysis of data
Discussion of findings
Conclusion
Recommendations
Bibliography
Problem statement
Species diversity: Darwin’s theories have provided logical evidence to explain the complexity of life’s diversity on
Earth. The diversity can be measured at three levels
Genetic diversity refers to the variety of genetic information contained in all of the individual plants, animals and
microorganisms. Genetic diversity occurs within and between populations of species as well as between species.
Species diversity refers to the variety of living species.
Ecosystem diversity relates to the variety of habitats, biotic communities, and ecological processes, as well as the
tremendous diversity present within ecosystems in terms of habitat differences and the variety of ecological
processes.
Collectively this diversity is being threatened directly and indirectly by the relentless exploitation of the Earth and its
resources by humans. The increase in the human population has resulted in increased urbanization, industrialization,
economic development and subsequent resource consumption & degradation; these factors of ‘development’ have
long been known to result in negative environmental impacts, such as deforestation, desertification, increased global
warming, forms of environmental pollution and species losses at phenomenal rates (See document on Easter Island
in appendix).
These impacts affect literally all of the Earth’s natural resources, chief among them is water. Everyday human
activity has degraded the quality of water to levels which mean that certain water bodies upon which people
depended as potable sources are no longer fit for this purpose along with this is the associated species loss around
these freshwater ecosystems primarily due to inputs of pollution.
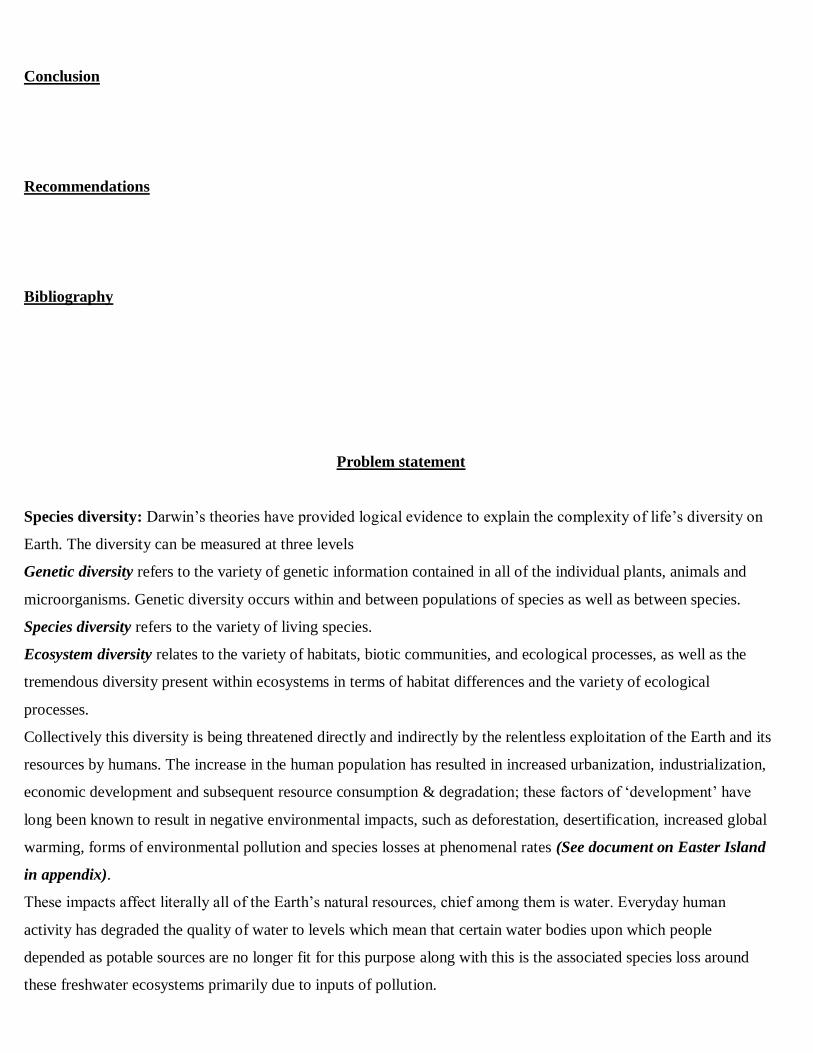
As such this body of research aims to present and foster some understanding of how human activities may influence
species diversity around freshwater systems by making a direct comparison of two such ecosystems; one directly
located in close proximity to the island’s main urban development (St. John; see fig 1) the other in close proximity to
a sparsely populated and somewhat diffuse rural area (Bolands: see fig 1).
Purpose of project
The purpose of this project is to ‘investigate the effects human activity has on species diversity `around two
freshwater ecosystems by examining the effect if any of pollution run-off into the ecosystems’.
In the Caribbean, human activity has been a historic factor in the destruction of many pristine ecosystem
communities, e.g. via pollution or fire, which may result in the destruction of the ecosystem’s plant community and
subsequently the destruction and or migration of its animal community and/or Habitat destruction to facilitate
building e.g. tourism or residential development etc. In Antigua historically many pristine ecosystems have been
deliberately or inadvertently destroyed to facilitate building for industry especially recently the tourism sector and
much residential development has been constructed without prior planning and/or consideration for natural habitats.
Two freshwater ecosystems were selected to study the possible impact of human activity namely pollution discharge
on freshwater species diversity. Both ecosystems comprise a freshwater pond and their immediate natural
surrounding; the first system is located near to a local hotel and residential development where assorted chemicals,
mild sewage and other forms of domestic run-off are being discharged in varying amounts into the natural
environment.
The second system is located near to a rural development consisting of a scattering of rural residential developments
many of which are large enough to facilitate some form of subsistence farming method within their lands.
Once the diversity of the areas is determined tests will be done on physical samples from locations within the studied
systems to determine if human discharges of these samples are a factor in the composition of species at each site.
Methods of data collection
In order to collect information for this research, two types of sources were used. These were primary and secondary
sources. The primary source mostly utilized was direct field research. This entailed visits to the two freshwater
ecosystems where observations were made as to the general condition of said ecosystems, their species composition
etc Each ecosystem was visited over a period of four months and observations pertaining to changes in species
composition, and factors responsible for these changes etc. were examined using relevant scientific methodology; to
get some idea of the species richness, evenness and hence diversity and thus form a statistical data set which would be
used to make comparisons between the two studied ecosystems. A line transect and quadrat etc were used to estimate
species diversity, and a suitable diversity formula (Simpson’s) was calculated. Further simple laboratory experiments
were done to test for elevated level of certain abiotic factors (phosphorous & nitrogen and pH) which would give an
indication of any possible inputs into the systems which could prove to be detrimental to them functioning optimally.
The researcher underwent the collection of soil and water samples from the two ecosystems in order to test for the
aforementioned abiotic factors which may have been discharged from the adjacent infrastructures. Other primary
sources used were interviews in which knowledgeable individuals, such as the environmental science lecturer,
individuals within the ministries responsible for the environment, development, tourism & agriculture etc. were
consulted. Secondary sources were also used to collect information for this project. These included books, lectures,
notes and advice from knowledgeable persons, internet articles, watching and reading of media and journals relating
to the specific topic.
Literature review
Regular monitoring of our islands biodiversity is of the utmost importance; the biodiversity of islands is paramount as
much of this biodiversity is unique and essential to the optimal functioning of systems on these islands and the wider
world. A paper by Dr. Justin Gerlach Scientific Coordinator - Nature Protection Trust of Seychelles states that
‘Islands are recognized as having exceptionally high numbers of endemic species, with 15% of bird, reptile and plant
species in only 3% of the world’s land area. The conservation significance of islands is highlighted by global
analyses showing that 67% of the centers of marine endemism and 70% coral reef hotspots are centered on islands,
with 47% of Endemic Bird Areas, 25% of the terrestrial Global 200 Eco-regions, and 30% of the biodiversity
hotspots’.
The factors responsible for the depletion of island biodiversity must be continually identified and arrested for many
reasons; primary among these reasons is the fact that island biodiversity though unique is relatively fragile in nature,
according to a document by the Convention on biological diversity ‘The unique characteristics that make island
biodiversity so special also leave it particularly fragile and vulnerable. Despite the high levels of biodiversity and the
prevalence of endemism, island species are present in relatively small numbers, making them very vulnerable to
extinction. Furthermore, because island species have diminished dispersal capability and evolve in competition with
relatively few other species, they develop survival strategies based on interdependency, co-evolution, and mutualism
rather than defence mechanisms against a broad range of predators and competitors. Factors responsible for island
species depletion are many including development and the ensuing environmental problems such as habitat
destruction, pollution etc, again these factors are well chronicled, e.g. with reference to factors constituting
development a CBD document states that ‘As a result, many island species have become rare or threatened, and
islands have a disproportionate number of recorded species extinctions when compared to continental systems. Of
the 724 recorded animal extinctions in the last 400 years, about half were of island species. At least 90% of the bird
species that have become extinct in that period were island-dwellers’. Further ‘Biodiversity loss is a particular
concern on islands. The Report of the Global Conference on the Sustainable Development of Small Island
Developing States referred to the biological diversity of island ecosystems as “among the most threatened in the
world”, due to their small size, isolation and fragility’.
It is an acknowledged fact that intact biodiversity are essential for the sustainable functioning of the Earth’s various
systems such as the nutrient cycles including the hydrological system. This system has a variety of components
including freshwater systems which are prone to degradation from a multitude of external inputs ‘Freshwater
ecosystems are essential for human survival, providing the majority of people's drinking water. The ecosystems are
home to more than 40 percent of the world's fish species. Despite their value and importance, many lakes, rivers, and
wetlands around the world are being severely damaged by human activities and are declining at a much faster rate
than terrestrial ecosystems. (National geographic)
According to Wikipedia, ‘Freshwater ecosystems are a subset of Earth's aquatic ecosystems. They include lakes and
ponds, rivers, streams and springs, and wetlands. They can be contrasted with marine ecosystems, which have a
larger salt content. Freshwater habitats can be classified by different factors, including temperature, light
penetration, and vegetation. Freshwater ecosystems can be divided into lentic ecosystems (still water) and lotic
ecosystems (flowing water)’Antigua has a scant amount of lentic freshwater systems all of which are vital to the
residents of the island either as sources of potable water or as irrigation sources for the farmers on the island. This
scant amount is periodically depleted due to various factors, this is a well chronicled fact, indeed a UNEP document
stated that ‘Due to a combination of geological factors such as low average rainfall and environmental factors such
as deforestation, Antigua and Barbuda has minimal water resources for its agricultural sector and occasionally
struggles even to fulfill domestic demand during drought years. Desalinization is increasingly used to meet the rising
water demand and now provides two-thirds of the country’s water needs. There are various measures in place to
protect the islands limited water resources for example the UNEP has stated that ‘46 separate pieces of legislation
govern the management of Antigua and Barbuda’s water supply directly (land use, water, waste management) or
indirectly (protected areas, forestry, agriculture)’. Despite these facts there has been a long history of abuse of the
islands water courses via inputs of varying pollutants (refrigerators, washing machines, animal wastes, chemicals,
plastics and other solid forms etc.) Considering the importance of the water resource to the economy of Antigua it
would seem essential that measures be put in place to ensure that our water bodies are not prone to the effects of
pollution inputs as these inputs could be primarily harmful, ultimately to humans; indeed the CDC has recommended
hepatitis and typhoid vaccines for travelers to the island ‘because you can get hepatitis A through contaminated food
or water in Antigua and Barbuda, regardless of where you are eating or staying.’ And ‘You can get typhoid through
contaminated food or water in Antigua and Barbuda especially if you are staying with friends or relatives, visiting
smaller cities or rural areas, or if you are an adventurous eater’. Pollutant discharges also upset water bodies
directly by causing water to become prone to eutrophication and other alterations to its physical structure.
Eutrophication is recognized as being the result of excessive amounts of nutrients entering water bodies; the world
resources institute reported that ‘Within the past 50 years, eutrophication—the over-enrichment of water by nutrients
such as nitrogen phosphorus—has emerged as one of the leading causes of water quality impairment. The two most
acute symptoms of eutrophication are hypoxia (or oxygen depletion) and harmful algal blooms, which among other
things can destroy aquatic life in affected areas. The rise in eutrophic and hypoxic events has been attributed to the
rapid increase in intensive agricultural practices, industrial activities, and population growth which together have

increased nitrogen and phosphorus flows in the environment’. These events may also lead to early changes in species
composition which may be used as an early warning that the phenomenon will occur.
Journal entries (Site visits and labs)
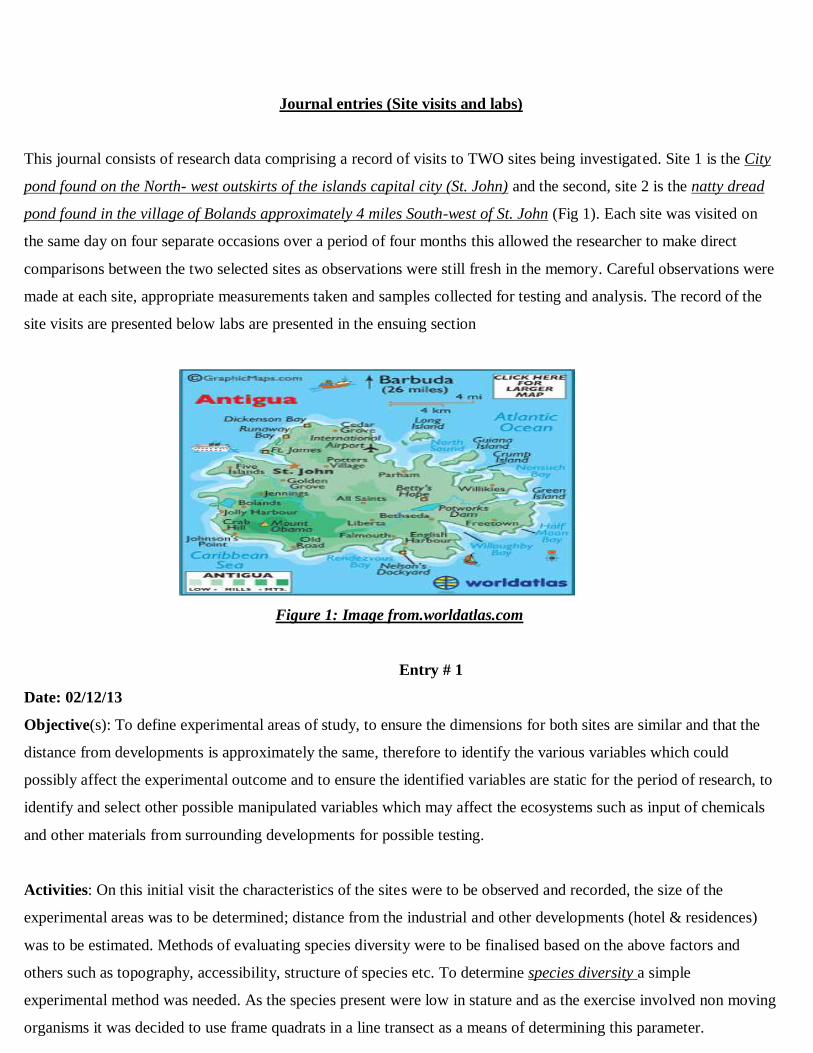
This journal consists of research data comprising a record of visits to TWO sites being investigated. Site 1 is the City
pond found on the North- west outskirts of the islands capital city (St. John) and the second, site 2 is the natty dread
pond found in the village of Bolands approximately 4 miles South-west of St. John (Fig 1). Each site was visited on
the same day on four separate occasions over a period of four months this allowed the researcher to make direct
comparisons between the two selected sites as observations were still fresh in the memory. Careful observations were
made at each site, appropriate measurements taken and samples collected for testing and analysis. The record of the
site visits are presented below labs are presented in the ensuing section
Figure 1: Image from.worldatlas.com
Entry # 1
Date: 02/12/13
Objective(s): To define experimental areas of study, to ensure the dimensions for both sites are similar and that the
distance from developments is approximately the same, therefore to identify the various variables which could
possibly affect the experimental outcome and to ensure the identified variables are static for the period of research, to
identify and select other possible manipulated variables which may affect the ecosystems such as input of chemicals
and other materials from surrounding developments for possible testing.
Activities: On this initial visit the characteristics of the sites were to be observed and recorded, the size of the
experimental areas was to be determined; distance from the industrial and other developments (hotel & residences)
was to be estimated. Methods of evaluating species diversity were to be finalised based on the above factors and
others such as topography, accessibility, structure of species etc. To determine species diversity a simple
experimental method was needed. As the species present were low in stature and as the exercise involved non moving
organisms it was decided to use frame quadrats in a line transect as a means of determining this parameter.
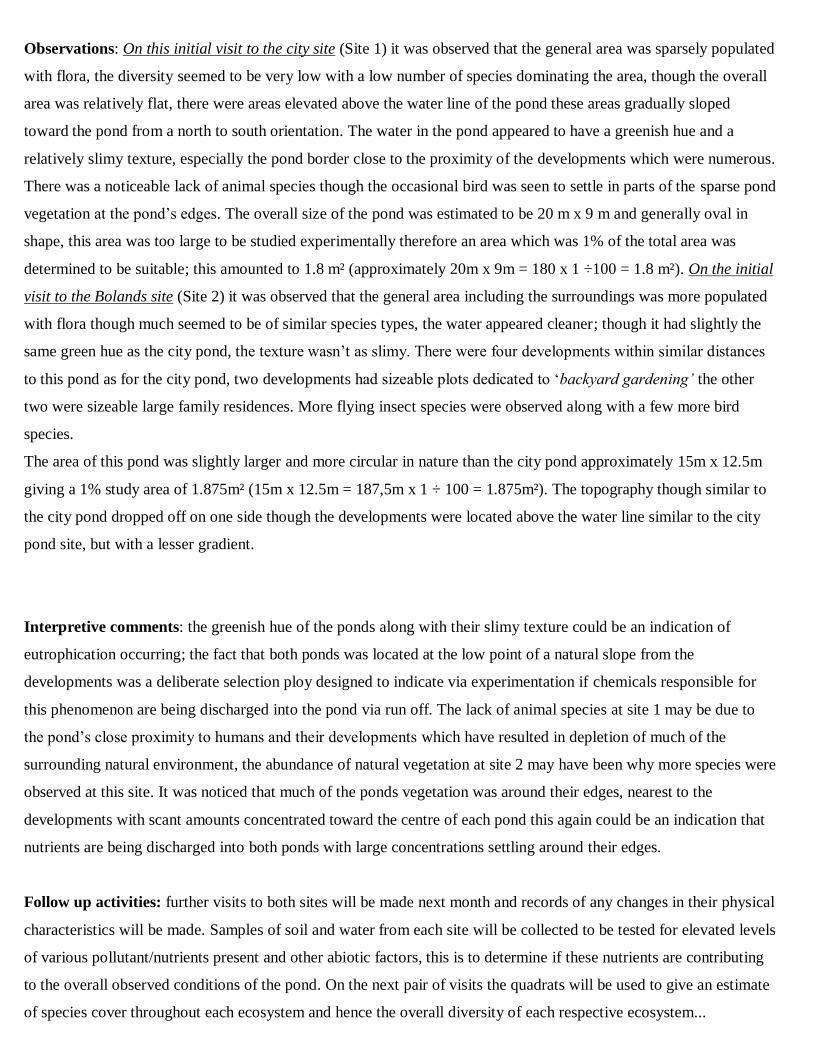
Observations: On this initial visit to the city site (Site 1) it was observed that the general area was sparsely populated
with flora, the diversity seemed to be very low with a low number of species dominating the area, though the overall
area was relatively flat, there were areas elevated above the water line of the pond these areas gradually sloped
toward the pond from a north to south orientation. The water in the pond appeared to have a greenish hue and a
relatively slimy texture, especially the pond border close to the proximity of the developments which were numerous.
There was a noticeable lack of animal species though the occasional bird was seen to settle in parts of the sparse pond
vegetation at the pond’s edges. The overall size of the pond was estimated to be 20 m x 9 m and generally oval in
shape, this area was too large to be studied experimentally therefore an area which was 1% of the total area was
determined to be suitable; this amounted to 1.8 m² (approximately 20m x 9m = 180 x 1 ÷100 = 1.8 m²). On the initial
visit to the Bolands site (Site 2) it was observed that the general area including the surroundings was more populated
with flora though much seemed to be of similar species types, the water appeared cleaner; though it had slightly the
same green hue as the city pond, the texture wasn’t as slimy. There were four developments within similar distances
to this pond as for the city pond, two developments had sizeable plots dedicated to ‘backyard gardening’ the other
two were sizeable large family residences. More flying insect species were observed along with a few more bird
species.
The area of this pond was slightly larger and more circular in nature than the city pond approximately 15m x 12.5m
giving a 1% study area of 1.875m² (15m x 12.5m = 187,5m x 1 ÷ 100 = 1.875m²). The topography though similar to
the city pond dropped off on one side though the developments were located above the water line similar to the city
pond site, but with a lesser gradient.
Interpretive comments: the greenish hue of the ponds along with their slimy texture could be an indication of
eutrophication occurring; the fact that both ponds was located at the low point of a natural slope from the
developments was a deliberate selection ploy designed to indicate via experimentation if chemicals responsible for
this phenomenon are being discharged into the pond via run off. The lack of animal species at site 1 may be due to
the pond’s close proximity to humans and their developments which have resulted in depletion of much of the
surrounding natural environment, the abundance of natural vegetation at site 2 may have been why more species were
observed at this site. It was noticed that much of the ponds vegetation was around their edges, nearest to the
developments with scant amounts concentrated toward the centre of each pond this again could be an indication that
nutrients are being discharged into both ponds with large concentrations settling around their edges.
Follow up activities: further visits to both sites will be made next month and records of any changes in their physical
characteristics will be made. Samples of soil and water from each site will be collected to be tested for elevated levels
of various pollutant/nutrients present and other abiotic factors, this is to determine if these nutrients are contributing
to the overall observed conditions of the pond. On the next pair of visits the quadrats will be used to give an estimate
of species cover throughout each ecosystem and hence the overall diversity of each respective ecosystem...
Entry # 2
Date: 02/01/14
Objective(s): On this second visit changes in the characteristics of each site were observed and recorded, the
diversity of flora species present was recorded using the quadrat which is a recognized suitable scientific method.
Another objective was also to determine if the adjacent human developments appeared to be discharging any form of
waste or liquid substances into either area and if so to observe if the flora or soils close to said developments had
different characteristics than elsewhere within the site.
Activities: Sites along the edges of each pond were selected. Further observations were made and recorded regarding
the general state of both sites. Having estimated the size of the experimental area for each site, a 1% sample area was
selected for study during the first visit this was determined to be an area of 1.8m² for site 1 and 1.875m² for site 2... It
was decided to use 0.50cm x 0.50cm frame quadrats (0.25m²). Quadrats were used along a line transect in the 1.8m²
and 1.875m² experimental sample areas to determine the species diversity. (Size of experimental area 1.8m² ÷ quadrat
size 0.25m² = 7.4) therefore 7 quadrats were to be used for site 1 and (Size of experimental area 1.875m² ÷ quadrat
size 0.25m² = 7.5) though 8 quadrats could have been used for site 2 it was decided to use an average of 7 quadrats
for each site. (Lab 1a & 2a)
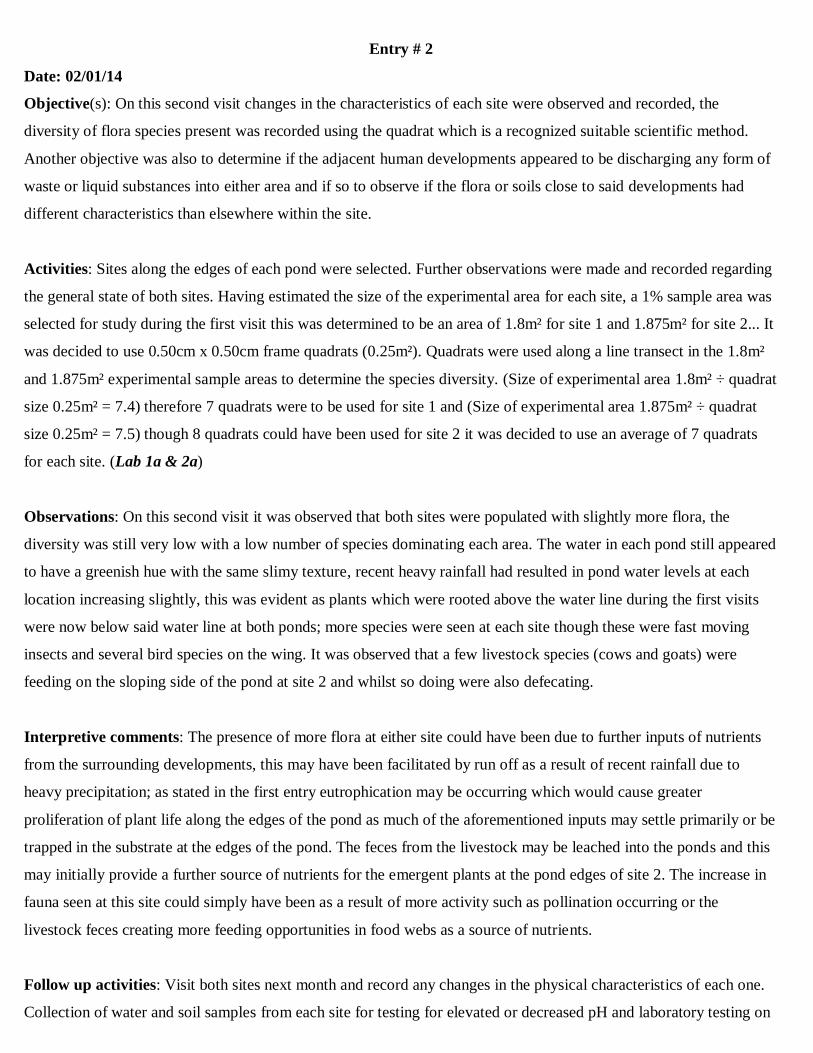
Observations: On this second visit it was observed that both sites were populated with slightly more flora, the
diversity was still very low with a low number of species dominating each area. The water in each pond still appeared
to have a greenish hue with the same slimy texture, recent heavy rainfall had resulted in pond water levels at each
location increasing slightly, this was evident as plants which were rooted above the water line during the first visits
were now below said water line at both ponds; more species were seen at each site though these were fast moving
insects and several bird species on the wing. It was observed that a few livestock species (cows and goats) were
feeding on the sloping side of the pond at site 2 and whilst so doing were also defecating.
Interpretive comments: The presence of more flora at either site could have been due to further inputs of nutrients
from the surrounding developments, this may have been facilitated by run off as a result of recent rainfall due to
heavy precipitation; as stated in the first entry eutrophication may be occurring which would cause greater
proliferation of plant life along the edges of the pond as much of the aforementioned inputs may settle primarily or be
trapped in the substrate at the edges of the pond. The feces from the livestock may be leached into the ponds and this
may initially provide a further source of nutrients for the emergent plants at the pond edges of site 2. The increase in
fauna seen at this site could simply have been as a result of more activity such as pollination occurring or the
livestock feces creating more feeding opportunities in food webs as a source of nutrients.
Follow up activities: Visit both sites next month and record any changes in the physical characteristics of each one.
Collection of water and soil samples from each site for testing for elevated or decreased pH and laboratory testing on
these water and soil samples collected to discover said pH levels (lab 3) & calculation of plant species diversity for
the sites.
Entry # 3
Date: 02/02/14
Objective(s): On this third visit changes in the characteristics of each site were observed and recorded, the diversity
of flora species present was again recorded using the quadrat which is a recognized suitable scientific method.
Similar to entry #s 1 & 2 another objective was also to look for clues to help determine if the adjacent human
developments appeared to be discharging any form of waste or liquid substances into either area and if so to observe
if the flora or soils close to said developments had different characteristics than elsewhere within the site.
Activities: the selected site along the edges of each pond was studied. Further observations were made and recorded
regarding the general state of both sites. The 1% sample area was closely scrutinized (1.8m² for site 1 and 1.875m²
for site 2). The frame quadrats (0.25m²). were again used along a line transect in the 1.8m² and 1.875m² experimental
sample areas to determine the species diversity. Seven quadrats were distributed from a central location in each site;
species found within each quadrat were counted and recorded (See labs 1b & 2b)
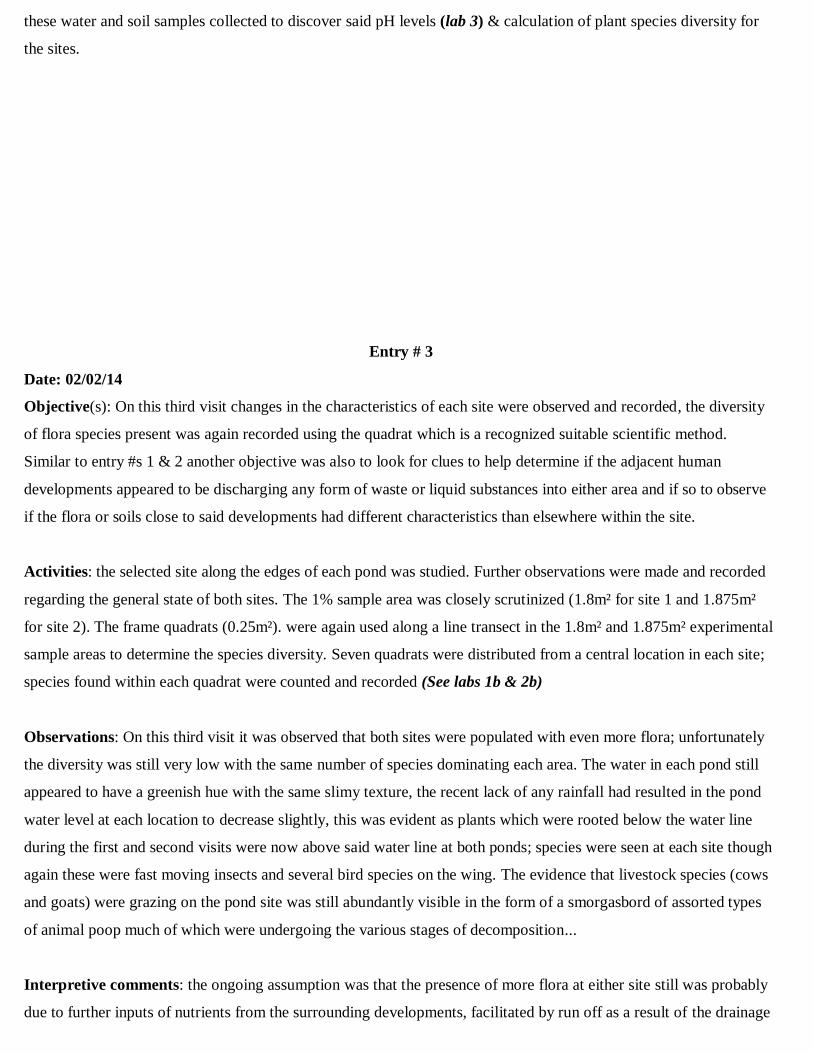
Observations: On this third visit it was observed that both sites were populated with even more flora; unfortunately
the diversity was still very low with the same number of species dominating each area. The water in each pond still
appeared to have a greenish hue with the same slimy texture, the recent lack of any rainfall had resulted in the pond
water level at each location to decrease slightly, this was evident as plants which were rooted below the water line
during the first and second visits were now above said water line at both ponds; species were seen at each site though
again these were fast moving insects and several bird species on the wing. The evidence that livestock species (cows
and goats) were grazing on the pond site was still abundantly visible in the form of a smorgasbord of assorted types
of animal poop much of which were undergoing the various stages of decomposition...
Interpretive comments: the ongoing assumption was that the presence of more flora at either site still was probably
due to further inputs of nutrients from the surrounding developments, facilitated by run off as a result of the drainage
characteristics of the general locations and leaching; as stated in the first entry eutrophication may be occurring which
would cause greater proliferation of plant life along the edges of both ponds as much of the aforementioned inputs
may settle primarily or be trapped in the substrate at the edges of the pond. The feces from the livestock may be
leached into the pond or decomposers may be breaking down the manure and depositing the component elements
(Carbon, Nitrogen etc) into the soil at site 2, this may initially provide a further source of nutrients for the emergent
plants at the pond edges of site 2. As stated for entry # 2 the increase in fauna seen at this site could simply have been
as a result of more activity such as pollination occurring, or the livestock feces creating more feeding opportunities in
food webs as a source of nutrients.
Follow up activities: Visit both sites next month and record any changes in the physical characteristics of each one.
Second testing & analysis of water and soil samples from each site for elevated levels of nutrients such as
phosphorous (labs 4) which may be contributing to the physical characteristic seen and felt at either site (slimy water
with green hue, abundant plant at certain edges of the pond) calculation of plant species diversity for the sites.
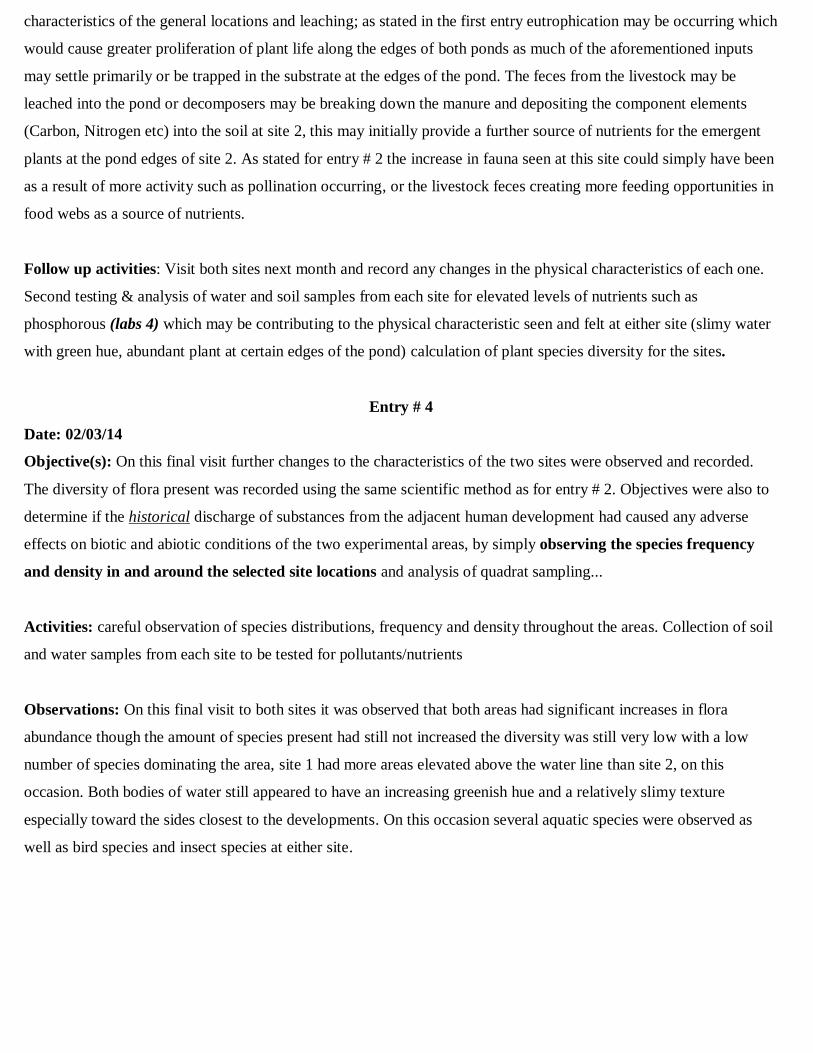
Entry # 4
Date: 02/03/14
Objective(s): On this final visit further changes to the characteristics of the two sites were observed and recorded.
The diversity of flora present was recorded using the same scientific method as for entry # 2. Objectives were also to
determine if the historical discharge of substances from the adjacent human development had caused any adverse
effects on biotic and abiotic conditions of the two experimental areas, by simply observing the species frequency
and density in and around the selected site locations and analysis of quadrat sampling...
Activities: careful observation of species distributions, frequency and density throughout the areas. Collection of soil
and water samples from each site to be tested for pollutants/nutrients
Observations: On this final visit to both sites it was observed that both areas had significant increases in flora
abundance though the amount of species present had still not increased the diversity was still very low with a low
number of species dominating the area, site 1 had more areas elevated above the water line than site 2, on this
occasion. Both bodies of water still appeared to have an increasing greenish hue and a relatively slimy texture
especially toward the sides closest to the developments. On this occasion several aquatic species were observed as
well as bird species and insect species at either site.
Interpretive comments: the increases in abundance of species at either site is a clear indication that conditions are
optimal for the growth of certain species, the low diversity signifies that the species which were present had adapted
well to the abiotic conditions of the sites. There was a visibly noticeable increase in species at site 2 said species also
appeared to be healthier as they had slightly more stature than those at site 1. the lower water level at site 1 may have
been due to better drainage, though vehicular tracks were seen leading to and away from the site this may indicate the
water is being used for human purposes perhaps irrigation by the local residents for their crops and backyard
gardening practices or washing vehicles.
Follow up activities: Record any changes in the physical characteristics of each site. Third collecting testing &
analysis of water and soil samples from each site for elevated levels of nutrients such as nitrate & nitrite (labs 5 & 6)
Analyse the collected data and formulate conclusions about the overall health of the two studied sites based on said
results
Formulate projections regarding the long term ‘environmental’ condition of the sites, use of a simple calculation
(Simpson’s diversity index (See labs 1a to 2b)
Labs
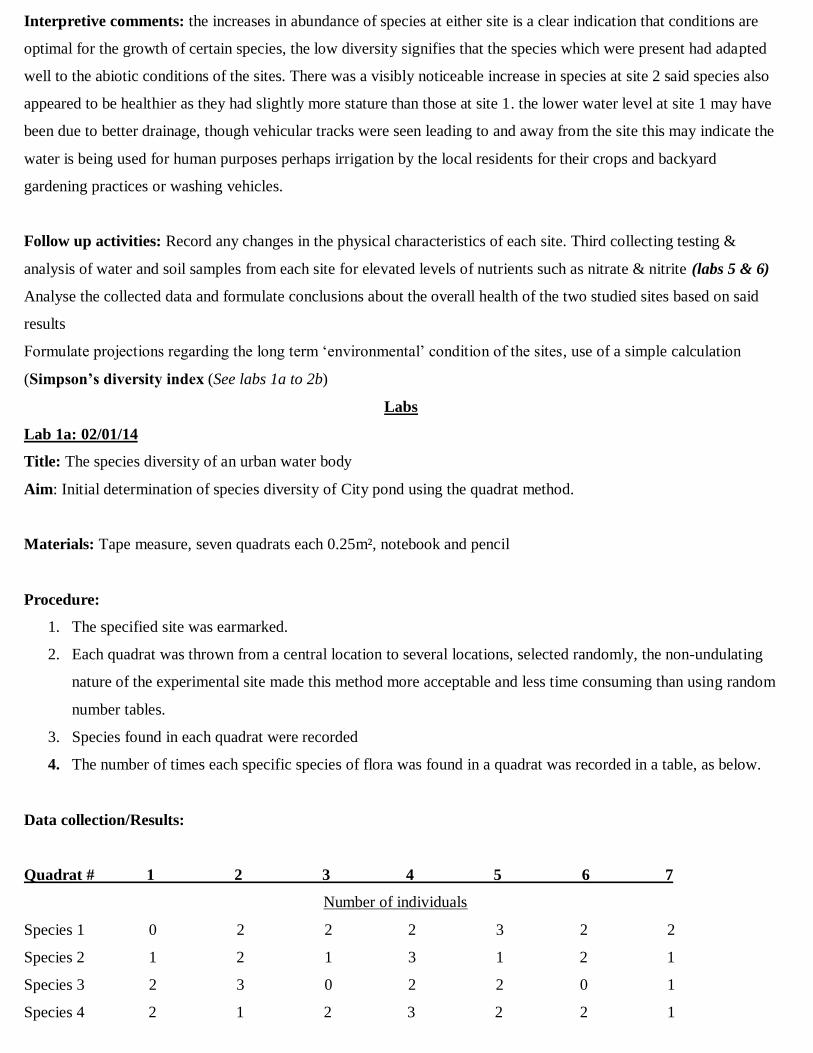
Lab 1a: 02/01/14
Title: The species diversity of an urban water body
Aim: Initial determination of species diversity of City pond using the quadrat method.
Materials: Tape measure, seven quadrats each 0.25m², notebook and pencil
Procedure:
1. The specified site was earmarked.
2. Each quadrat was thrown from a central location to several locations, selected randomly, the non-undulating
nature of the experimental site made this method more acceptable and less time consuming than using random
number tables.
3. Species found in each quadrat were recorded
4. The number of times each specific species of flora was found in a quadrat was recorded in a table, as below.
Data collection/Results:
Quadrat # 1 2 3 4 5 6 7
Number of individuals
Species 1 0 2 2 2 3 2 2
Species 2 1 2 1 3 1 2 1
Species 3 2 3 0 2 2 0 1
Species 4 2 1 2 3 2 2 1
Species 5 3 2 1 2 0 0 2
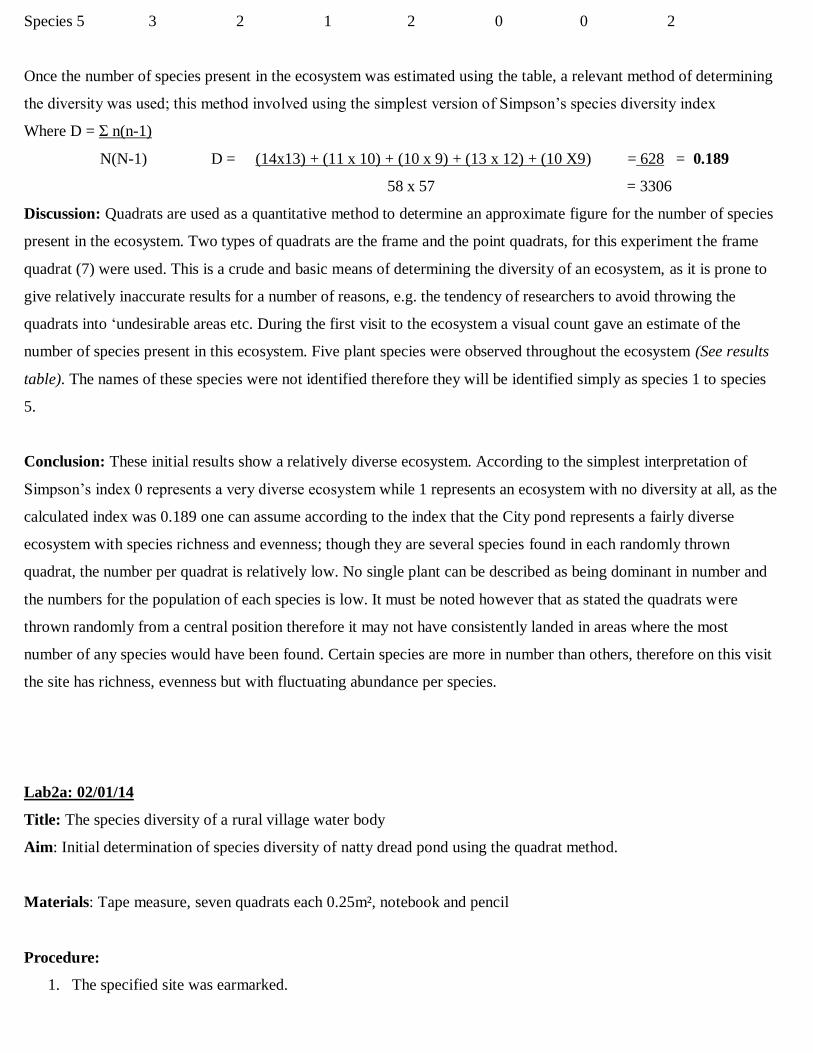
Once the number of species present in the ecosystem was estimated using the table, a relevant method of determining
the diversity was used; this method involved using the simplest version of Simpson’s species diversity index
Where D = Σ n(n-1)
N(N-1) D = (14x13) + (11 x 10) + (10 x 9) + (13 x 12) + (10 X9) = 628 = 0.189
58 x 57 = 3306
Discussion: Quadrats are used as a quantitative method to determine an approximate figure for the number of species
present in the ecosystem. Two types of quadrats are the frame and the point quadrats, for this experiment the frame
quadrat (7) were used. This is a crude and basic means of determining the diversity of an ecosystem, as it is prone to
give relatively inaccurate results for a number of reasons, e.g. the tendency of researchers to avoid throwing the
quadrats into ‘undesirable areas etc. During the first visit to the ecosystem a visual count gave an estimate of the
number of species present in this ecosystem. Five plant species were observed throughout the ecosystem (See results
table). The names of these species were not identified therefore they will be identified simply as species 1 to species
5.
Conclusion: These initial results show a relatively diverse ecosystem. According to the simplest interpretation of
Simpson’s index 0 represents a very diverse ecosystem while 1 represents an ecosystem with no diversity at all, as the
calculated index was 0.189 one can assume according to the index that the City pond represents a fairly diverse
ecosystem with species richness and evenness; though they are several species found in each randomly thrown
quadrat, the number per quadrat is relatively low. No single plant can be described as being dominant in number and
the numbers for the population of each species is low. It must be noted however that as stated the quadrats were
thrown randomly from a central position therefore it may not have consistently landed in areas where the most
number of any species would have been found. Certain species are more in number than others, therefore on this visit
the site has richness, evenness but with fluctuating abundance per species.
Lab2a: 02/01/14
Title: The species diversity of a rural village water body
Aim: Initial determination of species diversity of natty dread pond using the quadrat method.
Materials: Tape measure, seven quadrats each 0.25m², notebook and pencil
Procedure:
1. The specified site was earmarked.
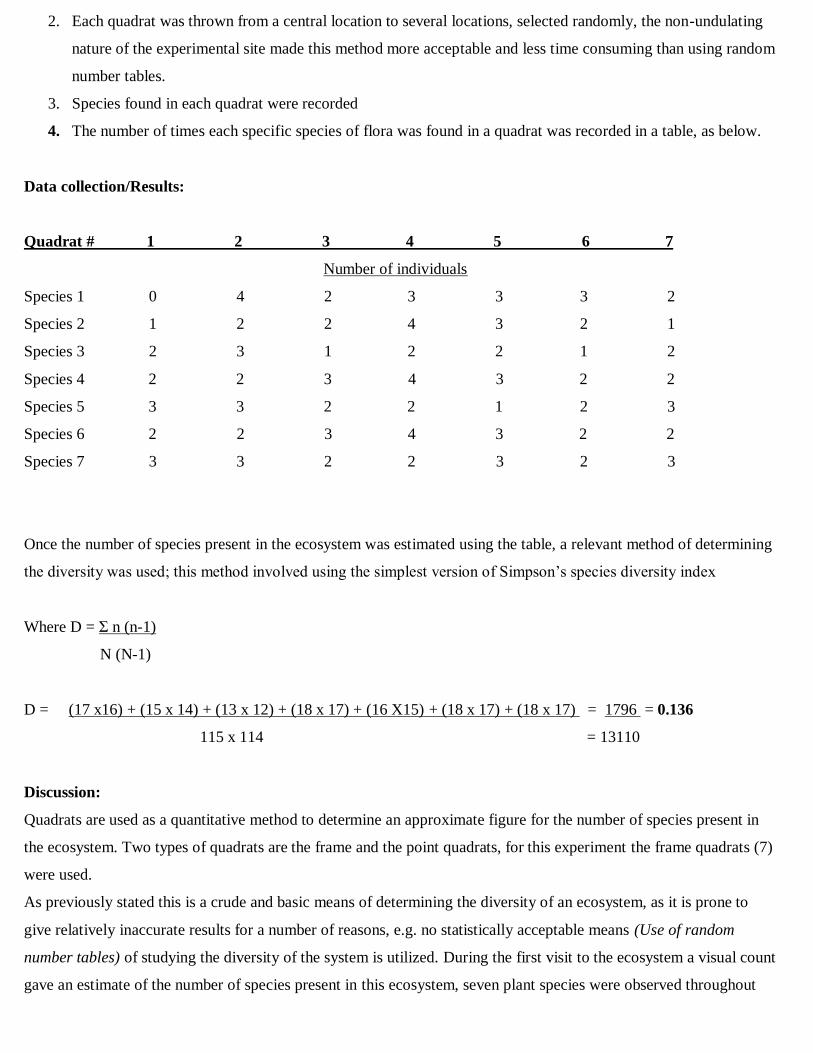
2. Each quadrat was thrown from a central location to several locations, selected randomly, the non-undulating
nature of the experimental site made this method more acceptable and less time consuming than using random
number tables.
3. Species found in each quadrat were recorded
4. The number of times each specific species of flora was found in a quadrat was recorded in a table, as below.
Data collection/Results:
Quadrat # 1 2 3 4 5 6 7
Number of individuals
Species 1 0 4 2 3 3 3 2
Species 2 1 2 2 4 3 2 1
Species 3 2 3 1 2 2 1 2
Species 4 2 2 3 4 3 2 2
Species 5 3 3 2 2 1 2 3
Species 6 2 2 3 4 3 2 2
Species 7 3 3 2 2 3 2 3
Once the number of species present in the ecosystem was estimated using the table, a relevant method of determining
the diversity was used; this method involved using the simplest version of Simpson’s species diversity index
Where D = Σ n (n-1)
N (N-1)
D = (17 x16) + (15 x 14) + (13 x 12) + (18 x 17) + (16 X15) + (18 x 17) + (18 x 17) = 1796 = 0.136
115 x 114 = 13110
Discussion:
Quadrats are used as a quantitative method to determine an approximate figure for the number of species present in
the ecosystem. Two types of quadrats are the frame and the point quadrats, for this experiment the frame quadrats (7)
were used.
As previously stated this is a crude and basic means of determining the diversity of an ecosystem, as it is prone to
give relatively inaccurate results for a number of reasons, e.g. no statistically acceptable means (Use of random
number tables) of studying the diversity of the system is utilized. During the first visit to the ecosystem a visual count
gave an estimate of the number of species present in this ecosystem, seven plant species were observed throughout

the ecosystem (See results table). Similar to species found at City pond the names of these species were not
researched therefore they will be identified simply as species 1 to species 7.
Conclusion: though they are several species found in each randomly thrown quadrat, the number per quadrat is
relatively low, no single plant can again be described as being dominant in number and the numbers for the
population of each species is low. It must be noted however that there were seven species of plant identified at site 2
as opposed to 5 at site 1, this has resulted in a slightly more diverse index calculated using Simpson’s index. As stated
for Lab 1a the quadrats were thrown randomly from a central position therefore it may not have consistently landed in
areas where the most number of any species would have been found. These initial results show a relatively diverse
ecosystem. According to the simplest interpretation of Simpson’s index 0 represents a very diverse ecosystem while 1
represents an ecosystem with no diversity at all, as the calculated index was 0.136 one can assume according to the
index that the Natty dread pond represents a slightly more diverse ecosystem with good richness and evenness.
Lab 1b: 02/02/14
Title: The species diversity of an urban water body
Aim: Second determination of species diversity of City pond using the quadrat method.
Materials: Tape measure, seven quadrats each 0.25m², notebook and pencil
Procedure:
1. The specified site was earmarked.
2. Each quadrat was thrown from a central location to several locations, selected randomly, the non-undulating
nature of the experimental site made this method more acceptable and less time consuming than using random
number tables.
3. Species found in each quadrat were recorded
4. The number of times each specific species of flora was found in a quadrat was recorded in a table, as below.
Data collection/Results:
Quadrat # 1 2 3 4 5 6 7
Number of individuals
Species 1 3 3 2 2 3 2 2
Species 2 4 3 3 3 1 2 1
Species 3 2 3 1 2 2 1 1
Species 4 2 1 2 3 2 2 3
Species 5 3 2 2 3 1 2 2
Once the number of species present in the ecosystem was estimated using the table, a relevant method of determining
the diversity was used; this method involved using the simplest version of Simpson’s species diversity index
Where D = Σ n (n-1)
N (N-1)
D = (17 x16) + (17 x 16) + (12 x 11) + (15 x 14) + (16 x 15) = 1126 = 0.192
77 X 76 = 5852
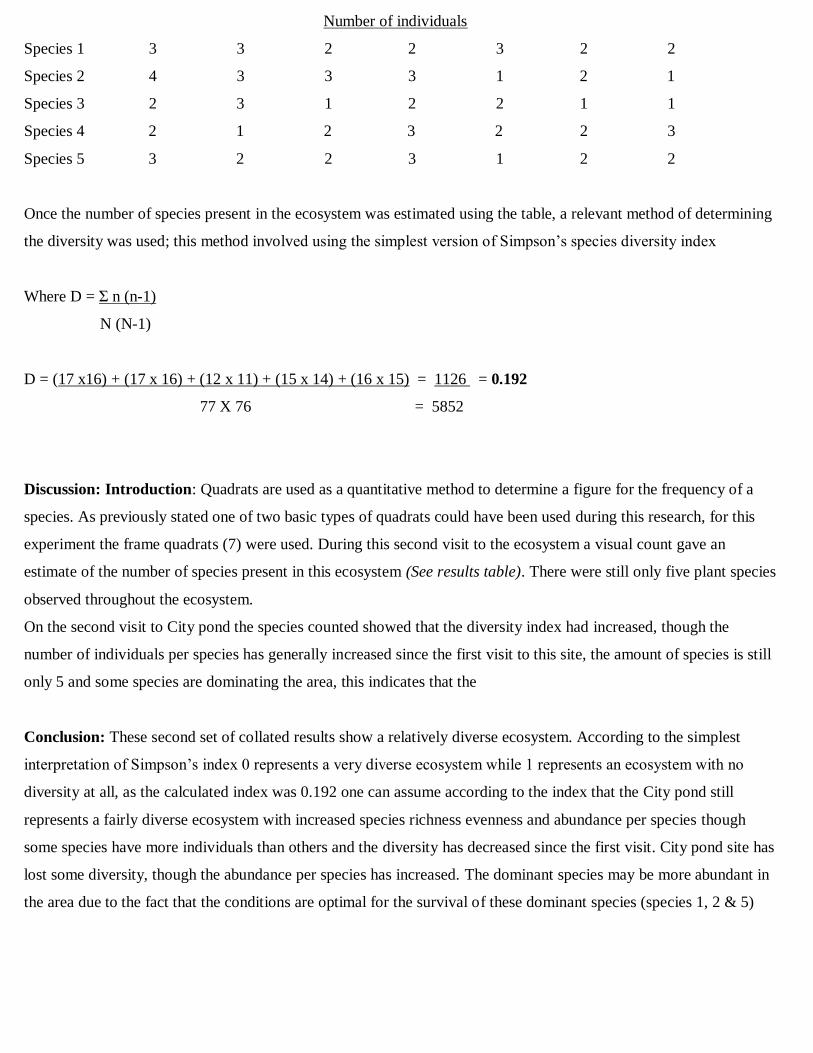
Discussion: Introduction: Quadrats are used as a quantitative method to determine a figure for the frequency of a
species. As previously stated one of two basic types of quadrats could have been used during this research, for this
experiment the frame quadrats (7) were used. During this second visit to the ecosystem a visual count gave an
estimate of the number of species present in this ecosystem (See results table). There were still only five plant species
observed throughout the ecosystem.
On the second visit to City pond the species counted showed that the diversity index had increased, though the
number of individuals per species has generally increased since the first visit to this site, the amount of species is still
only 5 and some species are dominating the area, this indicates that the
Conclusion: These second set of collated results show a relatively diverse ecosystem. According to the simplest
interpretation of Simpson’s index 0 represents a very diverse ecosystem while 1 represents an ecosystem with no
diversity at all, as the calculated index was 0.192 one can assume according to the index that the City pond still
represents a fairly diverse ecosystem with increased species richness evenness and abundance per species though
some species have more individuals than others and the diversity has decreased since the first visit. City pond site has
lost some diversity, though the abundance per species has increased. The dominant species may be more abundant in
the area due to the fact that the conditions are optimal for the survival of these dominant species (species 1, 2 & 5)
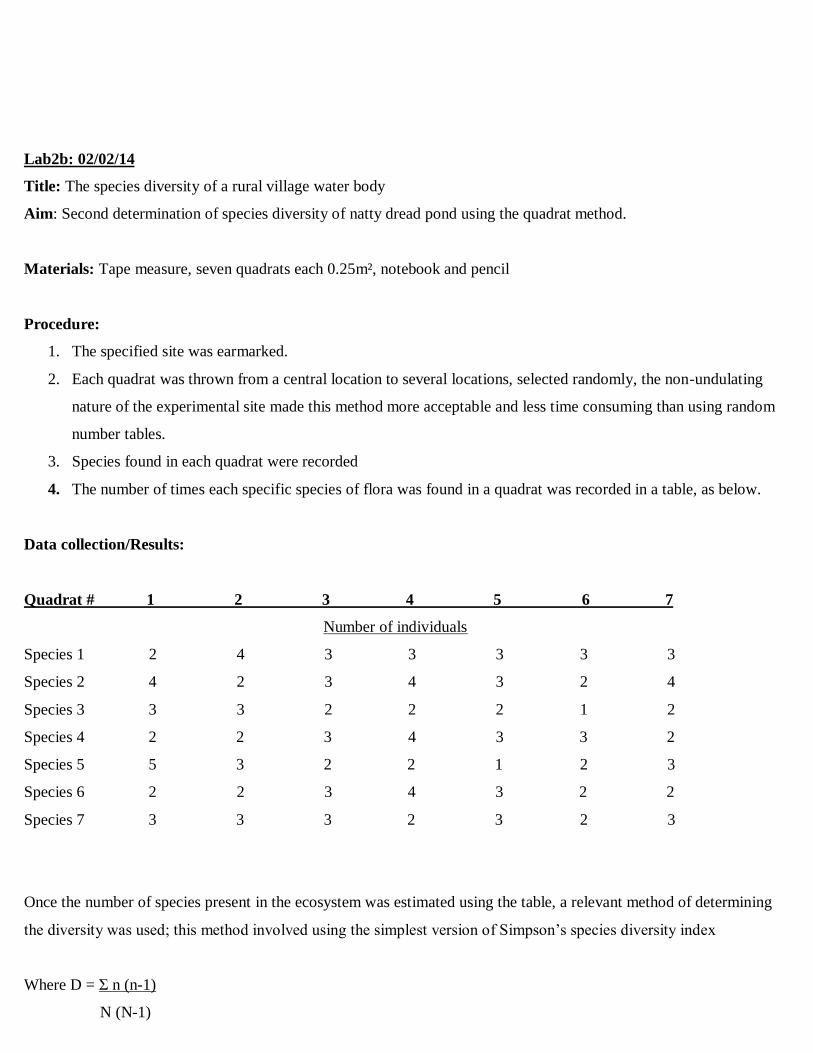
Lab2b: 02/02/14
Title: The species diversity of a rural village water body
Aim: Second determination of species diversity of natty dread pond using the quadrat method.
Materials: Tape measure, seven quadrats each 0.25m², notebook and pencil
Procedure:
1. The specified site was earmarked.
2. Each quadrat was thrown from a central location to several locations, selected randomly, the non-undulating
nature of the experimental site made this method more acceptable and less time consuming than using random
number tables.
3. Species found in each quadrat were recorded
4. The number of times each specific species of flora was found in a quadrat was recorded in a table, as below.
Data collection/Results:
Quadrat # 1 2 3 4 5 6 7
Number of individuals
Species 1 2 4 3 3 3 3 3
Species 2 4 2 3 4 3 2 4
Species 3 3 3 2 2 2 1 2
Species 4 2 2 3 4 3 3 2
Species 5 5 3 2 2 1 2 3
Species 6 2 2 3 4 3 2 2
Species 7 3 3 3 2 3 2 3
Once the number of species present in the ecosystem was estimated using the table, a relevant method of determining
the diversity was used; this method involved using the simplest version of Simpson’s species diversity index
Where D = Σ n (n-1)
N (N-1)
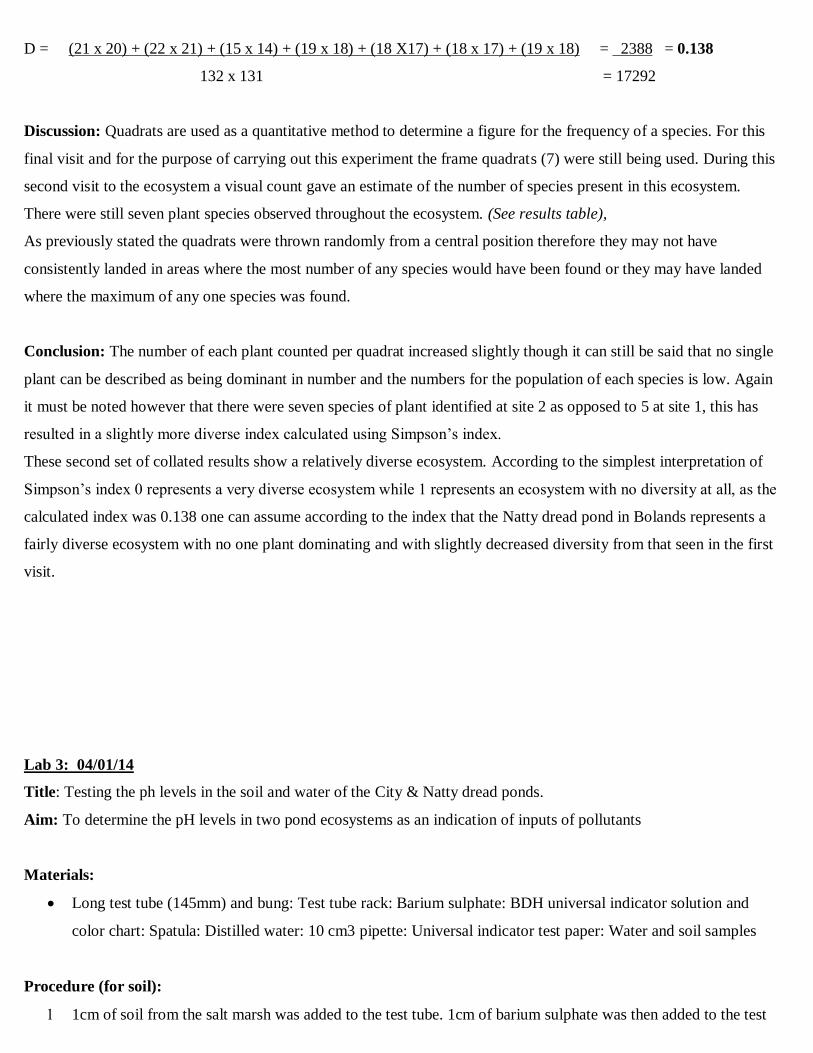
D = (21 x 20) + (22 x 21) + (15 x 14) + (19 x 18) + (18 X17) + (18 x 17) + (19 x 18) = 2388 = 0.138
132 x 131 = 17292
Discussion: Quadrats are used as a quantitative method to determine a figure for the frequency of a species. For this
final visit and for the purpose of carrying out this experiment the frame quadrats (7) were still being used. During this
second visit to the ecosystem a visual count gave an estimate of the number of species present in this ecosystem.
There were still seven plant species observed throughout the ecosystem. (See results table),
As previously stated the quadrats were thrown randomly from a central position therefore they may not have
consistently landed in areas where the most number of any species would have been found or they may have landed
where the maximum of any one species was found.
Conclusion: The number of each plant counted per quadrat increased slightly though it can still be said that no single
plant can be described as being dominant in number and the numbers for the population of each species is low. Again
it must be noted however that there were seven species of plant identified at site 2 as opposed to 5 at site 1, this has
resulted in a slightly more diverse index calculated using Simpson’s index.
These second set of collated results show a relatively diverse ecosystem. According to the simplest interpretation of
Simpson’s index 0 represents a very diverse ecosystem while 1 represents an ecosystem with no diversity at all, as the
calculated index was 0.138 one can assume according to the index that the Natty dread pond in Bolands represents a
fairly diverse ecosystem with no one plant dominating and with slightly decreased diversity from that seen in the first
visit.
Lab 3: 04/01/14
Title: Testing the ph levels in the soil and water of the City & Natty dread ponds.
Aim: To determine the pH levels in two pond ecosystems as an indication of inputs of pollutants
Materials:
Long test tube (145mm) and bung: Test tube rack: Barium sulphate: BDH universal indicator solution and
color chart: Spatula: Distilled water: 10 cm3 pipette: Universal indicator test paper: Water and soil samples
Procedure (for soil):
1cm of soil from the salt marsh was added to the test tube. 1cm of barium sulphate was then added to the test
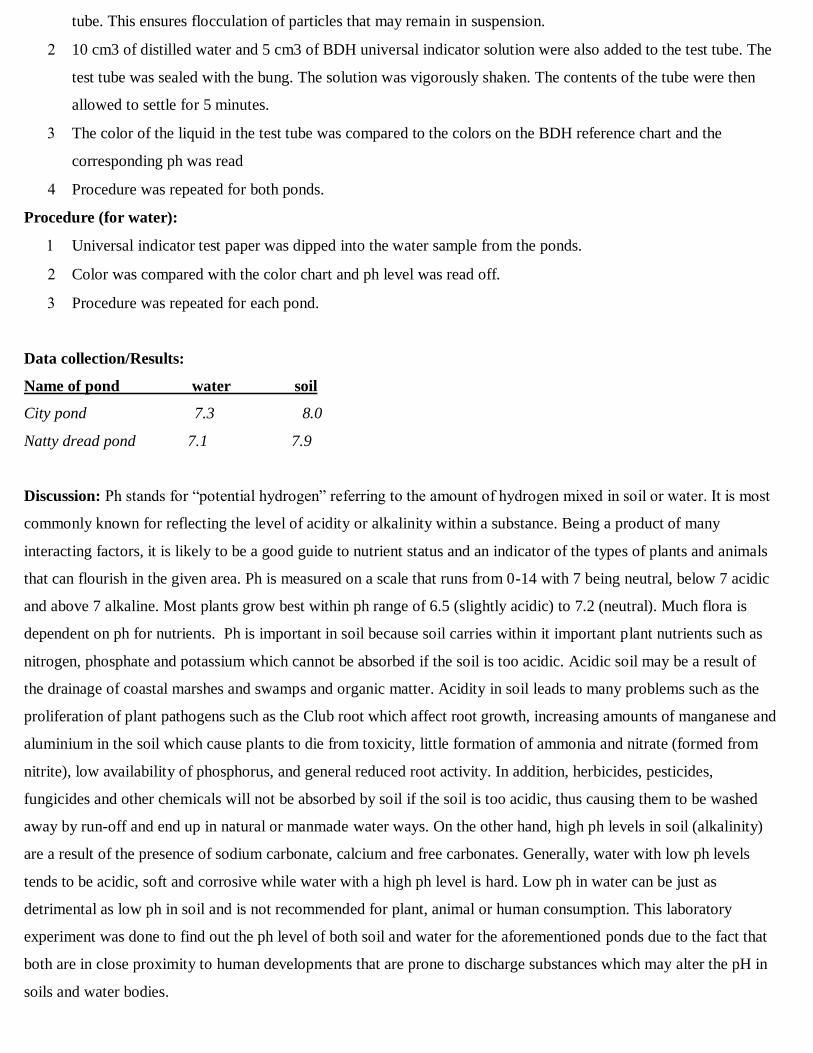
tube. This ensures flocculation of particles that may remain in suspension.
10 cm3 of distilled water and 5 cm3 of BDH universal indicator solution were also added to the test tube. The
test tube was sealed with the bung. The solution was vigorously shaken. The contents of the tube were then
allowed to settle for 5 minutes.
The color of the liquid in the test tube was compared to the colors on the BDH reference chart and the
corresponding ph was read
Procedure was repeated for both ponds.
Procedure (for water):
Universal indicator test paper was dipped into the water sample from the ponds.
Color was compared with the color chart and ph level was read off.
Procedure was repeated for each pond.
Data collection/Results:
Name of pond water soil
City pond 7.3 8.0
Natty dread pond 7.1 7.9
Discussion: Ph stands for “potential hydrogen” referring to the amount of hydrogen mixed in soil or water. It is most
commonly known for reflecting the level of acidity or alkalinity within a substance. Being a product of many
interacting factors, it is likely to be a good guide to nutrient status and an indicator of the types of plants and animals
that can flourish in the given area. Ph is measured on a scale that runs from 0-14 with 7 being neutral, below 7 acidic
and above 7 alkaline. Most plants grow best within ph range of 6.5 (slightly acidic) to 7.2 (neutral). Much flora is
dependent on ph for nutrients. Ph is important in soil because soil carries within it important plant nutrients such as
nitrogen, phosphate and potassium which cannot be absorbed if the soil is too acidic. Acidic soil may be a result of
the drainage of coastal marshes and swamps and organic matter. Acidity in soil leads to many problems such as the
proliferation of plant pathogens such as the Club root which affect root growth, increasing amounts of manganese and
aluminium in the soil which cause plants to die from toxicity, little formation of ammonia and nitrate (formed from
nitrite), low availability of phosphorus, and general reduced root activity. In addition, herbicides, pesticides,
fungicides and other chemicals will not be absorbed by soil if the soil is too acidic, thus causing them to be washed
away by run-off and end up in natural or manmade water ways. On the other hand, high ph levels in soil (alkalinity)
are a result of the presence of sodium carbonate, calcium and free carbonates. Generally, water with low ph levels
tends to be acidic, soft and corrosive while water with a high ph level is hard. Low ph in water can be just as
detrimental as low ph in soil and is not recommended for plant, animal or human consumption. This laboratory
experiment was done to find out the ph level of both soil and water for the aforementioned ponds due to the fact that
both are in close proximity to human developments that are prone to discharge substances which may alter the pH in
soils and water bodies.
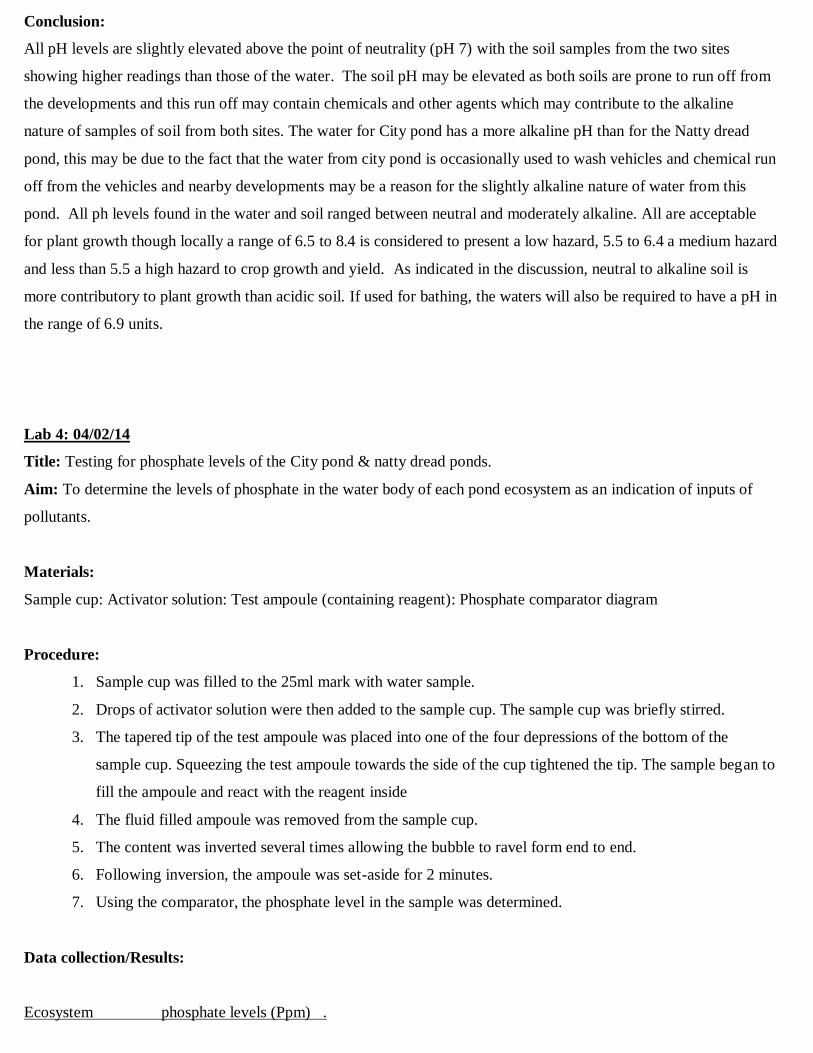
Conclusion:
All pH levels are slightly elevated above the point of neutrality (pH 7) with the soil samples from the two sites
showing higher readings than those of the water. The soil pH may be elevated as both soils are prone to run off from
the developments and this run off may contain chemicals and other agents which may contribute to the alkaline
nature of samples of soil from both sites. The water for City pond has a more alkaline pH than for the Natty dread
pond, this may be due to the fact that the water from city pond is occasionally used to wash vehicles and chemical run
off from the vehicles and nearby developments may be a reason for the slightly alkaline nature of water from this
pond. All ph levels found in the water and soil ranged between neutral and moderately alkaline. All are acceptable
for plant growth though locally a range of 6.5 to 8.4 is considered to present a low hazard, 5.5 to 6.4 a medium hazard
and less than 5.5 a high hazard to crop growth and yield. As indicated in the discussion, neutral to alkaline soil is
more contributory to plant growth than acidic soil. If used for bathing, the waters will also be required to have a pH in
the range of 6.9 units.
Lab 4: 04/02/14
Title: Testing for phosphate levels of the City pond & natty dread ponds.
Aim: To determine the levels of phosphate in the water body of each pond ecosystem as an indication of inputs of
pollutants.
Materials:
Sample cup: Activator solution: Test ampoule (containing reagent): Phosphate comparator diagram
Procedure:
1. Sample cup was filled to the 25ml mark with water sample.
2. Drops of activator solution were then added to the sample cup. The sample cup was briefly stirred.
3. The tapered tip of the test ampoule was placed into one of the four depressions of the bottom of the
sample cup. Squeezing the test ampoule towards the side of the cup tightened the tip. The sample began to
fill the ampoule and react with the reagent inside
4. The fluid filled ampoule was removed from the sample cup.
5. The content was inverted several times allowing the bubble to ravel form end to end.
6. Following inversion, the ampoule was set-aside for 2 minutes.
7. Using the comparator, the phosphate level in the sample was determined.
Data collection/Results:
Ecosystem phosphate levels (Ppm) .
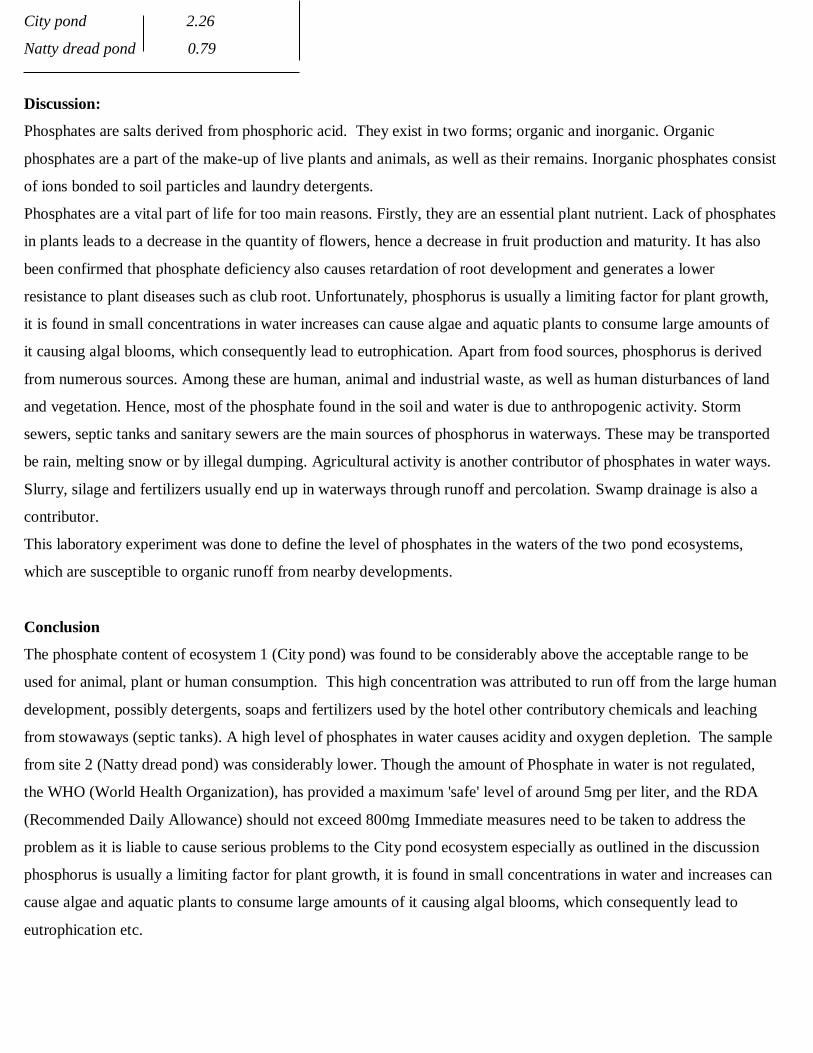
City pond 2.26
Natty dread pond 0.79
Discussion:
Phosphates are salts derived from phosphoric acid. They exist in two forms; organic and inorganic. Organic
phosphates are a part of the make-up of live plants and animals, as well as their remains. Inorganic phosphates consist
of ions bonded to soil particles and laundry detergents.
Phosphates are a vital part of life for too main reasons. Firstly, they are an essential plant nutrient. Lack of phosphates
in plants leads to a decrease in the quantity of flowers, hence a decrease in fruit production and maturity. It has also
been confirmed that phosphate deficiency also causes retardation of root development and generates a lower
resistance to plant diseases such as club root. Unfortunately, phosphorus is usually a limiting factor for plant growth,
it is found in small concentrations in water increases can cause algae and aquatic plants to consume large amounts of
it causing algal blooms, which consequently lead to eutrophication. Apart from food sources, phosphorus is derived
from numerous sources. Among these are human, animal and industrial waste, as well as human disturbances of land
and vegetation. Hence, most of the phosphate found in the soil and water is due to anthropogenic activity. Storm
sewers, septic tanks and sanitary sewers are the main sources of phosphorus in waterways. These may be transported
be rain, melting snow or by illegal dumping. Agricultural activity is another contributor of phosphates in water ways.
Slurry, silage and fertilizers usually end up in waterways through runoff and percolation. Swamp drainage is also a
contributor.
This laboratory experiment was done to define the level of phosphates in the waters of the two pond ecosystems,
which are susceptible to organic runoff from nearby developments.
Conclusion
The phosphate content of ecosystem 1 (City pond) was found to be considerably above the acceptable range to be
used for animal, plant or human consumption. This high concentration was attributed to run off from the large human
development, possibly detergents, soaps and fertilizers used by the hotel other contributory chemicals and leaching
from stowaways (septic tanks). A high level of phosphates in water causes acidity and oxygen depletion. The sample
from site 2 (Natty dread pond) was considerably lower. Though the amount of Phosphate in water is not regulated,
the WHO (World Health Organization), has provided a maximum 'safe' level of around 5mg per liter, and the RDA
(Recommended Daily Allowance) should not exceed 800mg Immediate measures need to be taken to address the
problem as it is liable to cause serious problems to the City pond ecosystem especially as outlined in the discussion
phosphorus is usually a limiting factor for plant growth, it is found in small concentrations in water and increases can
cause algae and aquatic plants to consume large amounts of it causing algal blooms, which consequently lead to
eutrophication etc.
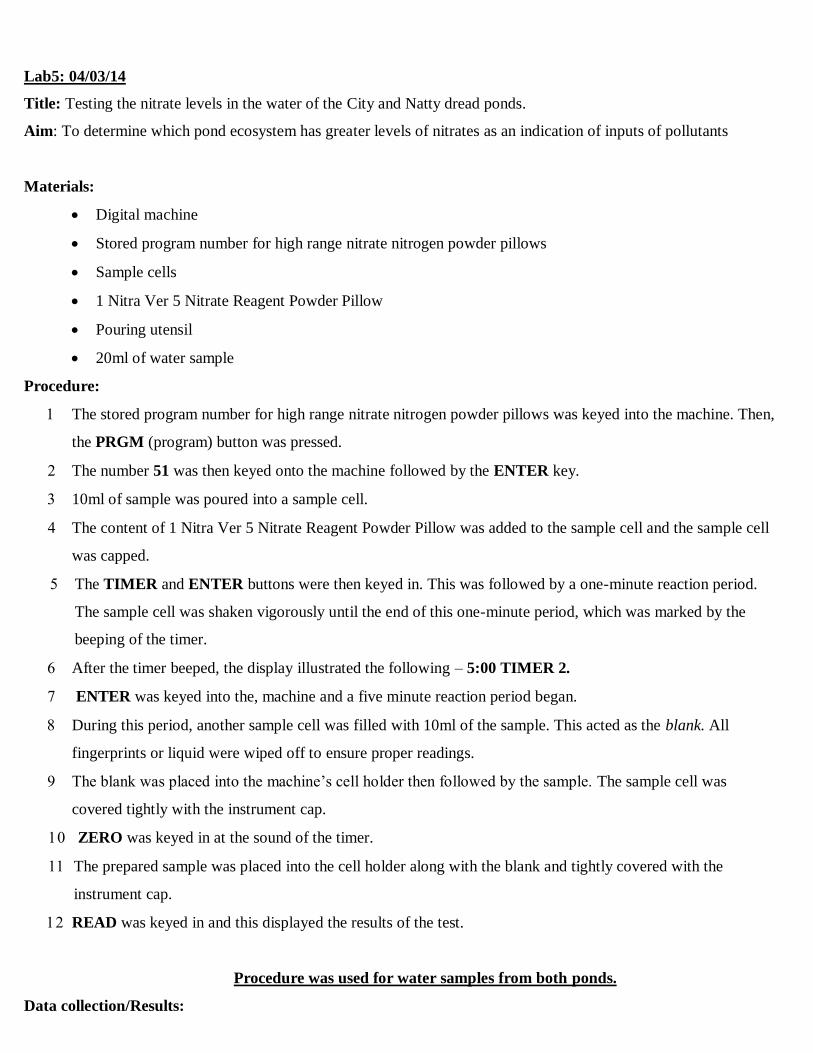
Lab5: 04/03/14
Title: Testing the nitrate levels in the water of the City and Natty dread ponds.
Aim: To determine which pond ecosystem has greater levels of nitrates as an indication of inputs of pollutants
Materials:
Digital machine
Stored program number for high range nitrate nitrogen powder pillows
Sample cells
1 Nitra Ver 5 Nitrate Reagent Powder Pillow
Pouring utensil
20ml of water sample
Procedure:
The stored program number for high range nitrate nitrogen powder pillows was keyed into the machine. Then,
the PRGM (program) button was pressed.
The number 51 was then keyed onto the machine followed by the ENTER key.
10ml of sample was poured into a sample cell.
The content of 1 Nitra Ver 5 Nitrate Reagent Powder Pillow was added to the sample cell and the sample cell
was capped.
The TIMER and ENTER buttons were then keyed in. This was followed by a one-minute reaction period.
The sample cell was shaken vigorously until the end of this one-minute period, which was marked by the
beeping of the timer.
After the timer beeped, the display illustrated the following – 5:00 TIMER 2.
ENTER was keyed into the, machine and a five minute reaction period began.
During this period, another sample cell was filled with 10ml of the sample. This acted as the blank. All
fingerprints or liquid were wiped off to ensure proper readings.
The blank was placed into the machine’s cell holder then followed by the sample. The sample cell was
covered tightly with the instrument cap.
ZERO was keyed in at the sound of the timer.
The prepared sample was placed into the cell holder along with the blank and tightly covered with the
instrument cap.
READ was keyed in and this displayed the results of the test.
Procedure was used for water samples from both ponds.
Data collection/Results:
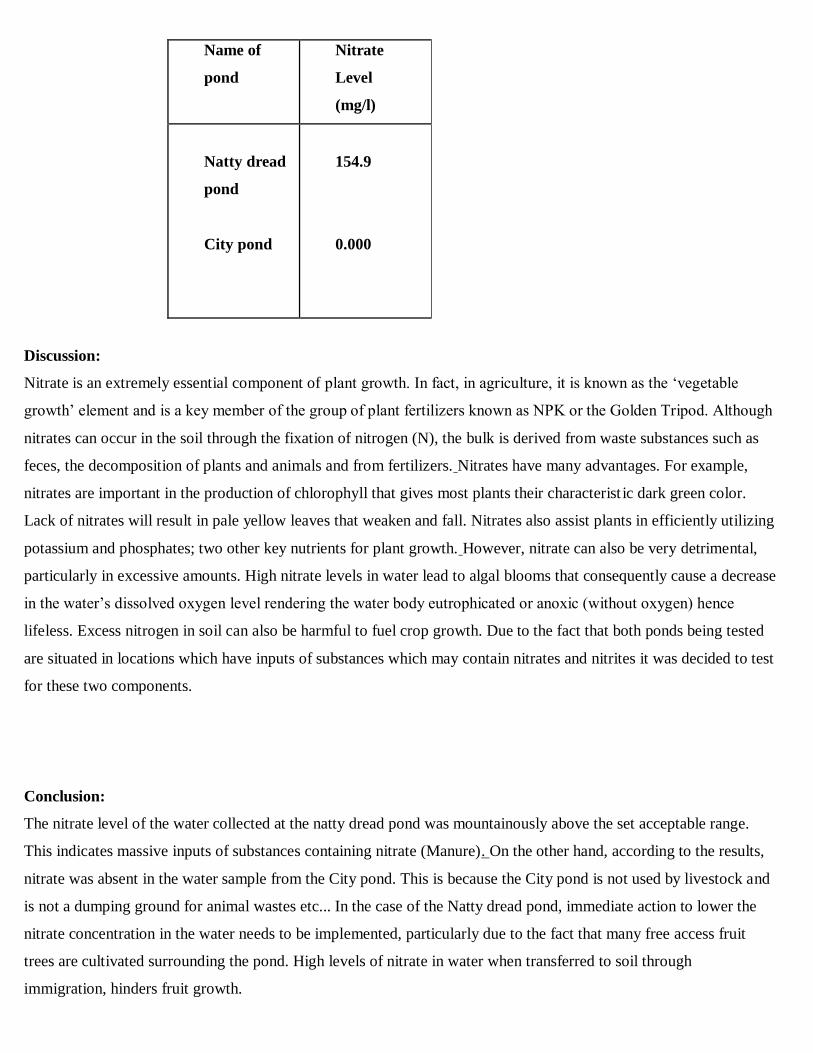
Name of
pond
Nitrate
Level
(mg/l)
Natty dread
pond
City pond
154.9
0.000
Discussion:
Nitrate is an extremely essential component of plant growth. In fact, in agriculture, it is known as the ‘vegetable
growth’ element and is a key member of the group of plant fertilizers known as NPK or the Golden Tripod. Although
nitrates can occur in the soil through the fixation of nitrogen (N), the bulk is derived from waste substances such as
feces, the decomposition of plants and animals and from fertilizers. Nitrates have many advantages. For example,
nitrates are important in the production of chlorophyll that gives most plants their characterist ic dark green color.
Lack of nitrates will result in pale yellow leaves that weaken and fall. Nitrates also assist plants in efficiently utilizing
potassium and phosphates; two other key nutrients for plant growth. However, nitrate can also be very detrimental,
particularly in excessive amounts. High nitrate levels in water lead to algal blooms that consequently cause a decrease
in the water’s dissolved oxygen level rendering the water body eutrophicated or anoxic (without oxygen) hence
lifeless. Excess nitrogen in soil can also be harmful to fuel crop growth. Due to the fact that both ponds being tested
are situated in locations which have inputs of substances which may contain nitrates and nitrites it was decided to test
for these two components.
Conclusion:
The nitrate level of the water collected at the natty dread pond was mountainously above the set acceptable range.
This indicates massive inputs of substances containing nitrate (Manure). On the other hand, according to the results,
nitrate was absent in the water sample from the City pond. This is because the City pond is not used by livestock and
is not a dumping ground for animal wastes etc... In the case of the Natty dread pond, immediate action to lower the
nitrate concentration in the water needs to be implemented, particularly due to the fact that many free access fruit
trees are cultivated surrounding the pond. High levels of nitrate in water when transferred to soil through
immigration, hinders fruit growth.
For irrigation purposes locally guidelines indicate the following levels for Nitrates: 5ppm low hazard: 6.30ppm
medium hazard: 30 + ppm high hazard. As can be seen from the results the levels of nitrates in the Natty dread pond
are way beyond the acceptable levels, action should be taken immediately to arrest the sources responsible for
depositing this excess of nitrate into this water body, which is suspected to be the wastes from free roaming livestock
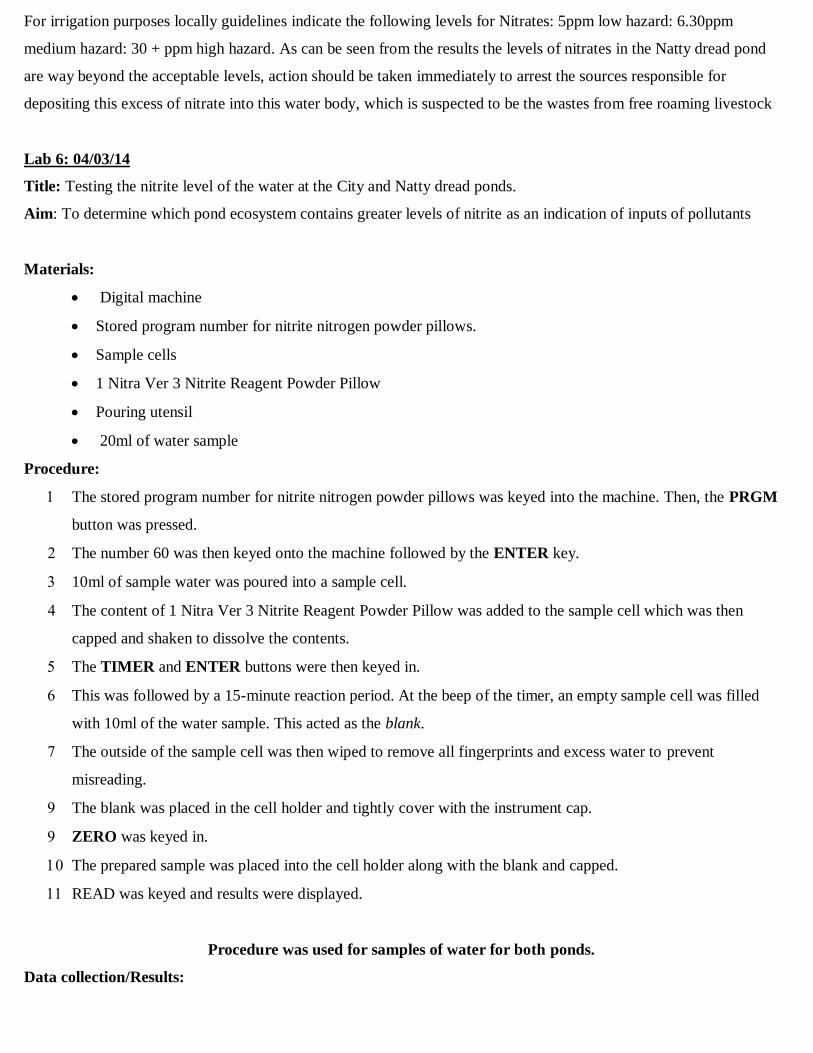
Lab 6: 04/03/14
Title: Testing the nitrite level of the water at the City and Natty dread ponds.
Aim: To determine which pond ecosystem contains greater levels of nitrite as an indication of inputs of pollutants
Materials:
Digital machine
Stored program number for nitrite nitrogen powder pillows.
Sample cells
1 Nitra Ver 3 Nitrite Reagent Powder Pillow
Pouring utensil
20ml of water sample
Procedure:
The stored program number for nitrite nitrogen powder pillows was keyed into the machine. Then, the PRGM
button was pressed.
The number 60 was then keyed onto the machine followed by the ENTER key.
10ml of sample water was poured into a sample cell.
The content of 1 Nitra Ver 3 Nitrite Reagent Powder Pillow was added to the sample cell which was then
capped and shaken to dissolve the contents.
The TIMER and ENTER buttons were then keyed in.
This was followed by a 15-minute reaction period. At the beep of the timer, an empty sample cell was filled
with 10ml of the water sample. This acted as the blank.
The outside of the sample cell was then wiped to remove all fingerprints and excess water to prevent
misreading.
The blank was placed in the cell holder and tightly cover with the instrument cap.
ZERO was keyed in.
The prepared sample was placed into the cell holder along with the blank and capped.
READ was keyed and results were displayed.
Procedure was used for samples of water for both ponds.
Data collection/Results:
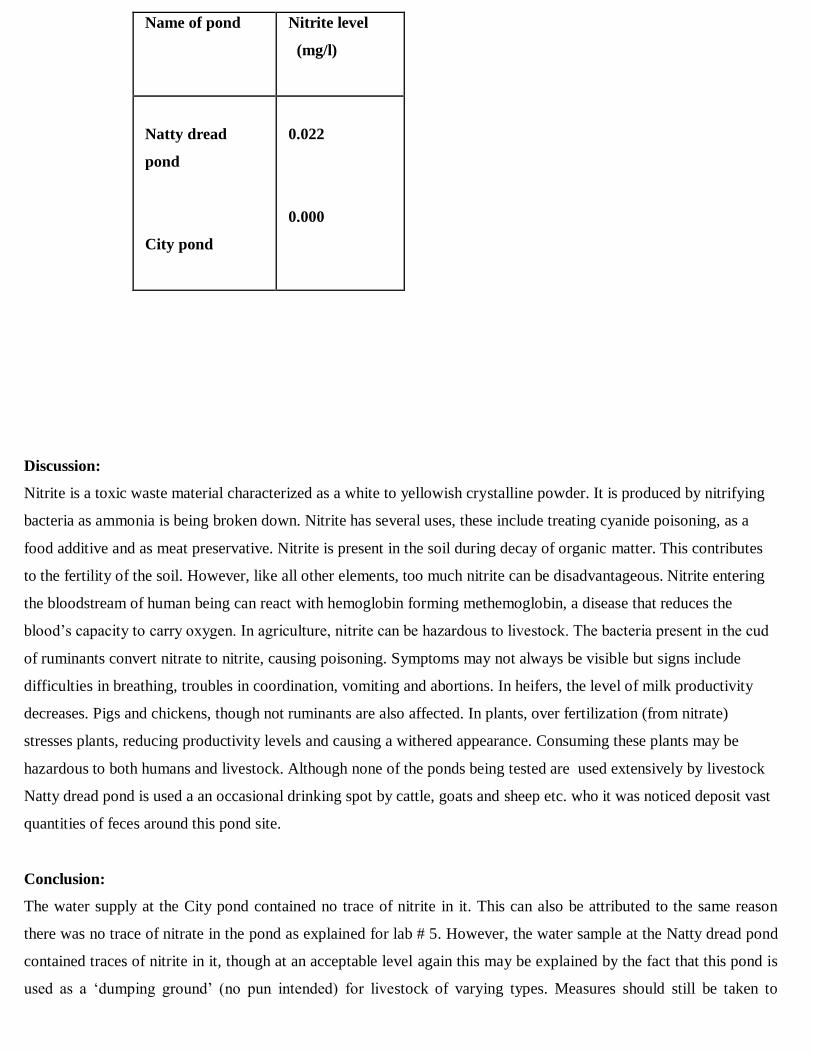
Name of pond
Nitrite level
(mg/l)
Natty dread
pond
City pond
0.022
0.000
Discussion:
Nitrite is a toxic waste material characterized as a white to yellowish crystalline powder. It is produced by nitrifying
bacteria as ammonia is being broken down. Nitrite has several uses, these include treating cyanide poisoning, as a
food additive and as meat preservative. Nitrite is present in the soil during decay of organic matter. This contributes
to the fertility of the soil. However, like all other elements, too much nitrite can be disadvantageous. Nitrite entering
the bloodstream of human being can react with hemoglobin forming methemoglobin, a disease that reduces the
blood’s capacity to carry oxygen. In agriculture, nitrite can be hazardous to livestock. The bacteria present in the cud
of ruminants convert nitrate to nitrite, causing poisoning. Symptoms may not always be visible but signs include
difficulties in breathing, troubles in coordination, vomiting and abortions. In heifers, the level of milk productivity
decreases. Pigs and chickens, though not ruminants are also affected. In plants, over fertilization (from nitrate)
stresses plants, reducing productivity levels and causing a withered appearance. Consuming these plants may be
hazardous to both humans and livestock. Although none of the ponds being tested are used extensively by livestock
Natty dread pond is used a an occasional drinking spot by cattle, goats and sheep etc. who it was noticed deposit vast
quantities of feces around this pond site.
Conclusion:
The water supply at the City pond contained no trace of nitrite in it. This can also be attributed to the same reason
there was no trace of nitrate in the pond as explained for lab # 5. However, the water sample at the Natty dread pond
contained traces of nitrite in it, though at an acceptable level again this may be explained by the fact that this pond is
used as a ‘dumping ground’ (no pun intended) for livestock of varying types. Measures should still be taken to

prevent the level of nitrite from rising. because as stated for lab 5 this pond is an obvious source of irrigation by
leaching or otherwise for the various free access fruit trees surrounding the site.
Natty dread pond contained Nitrite at a relatively low level which isn’t likely to be detrimental to the survival of
organisms as it is within acceptable ranges for the substance. City pond contained no traces of nitrite.

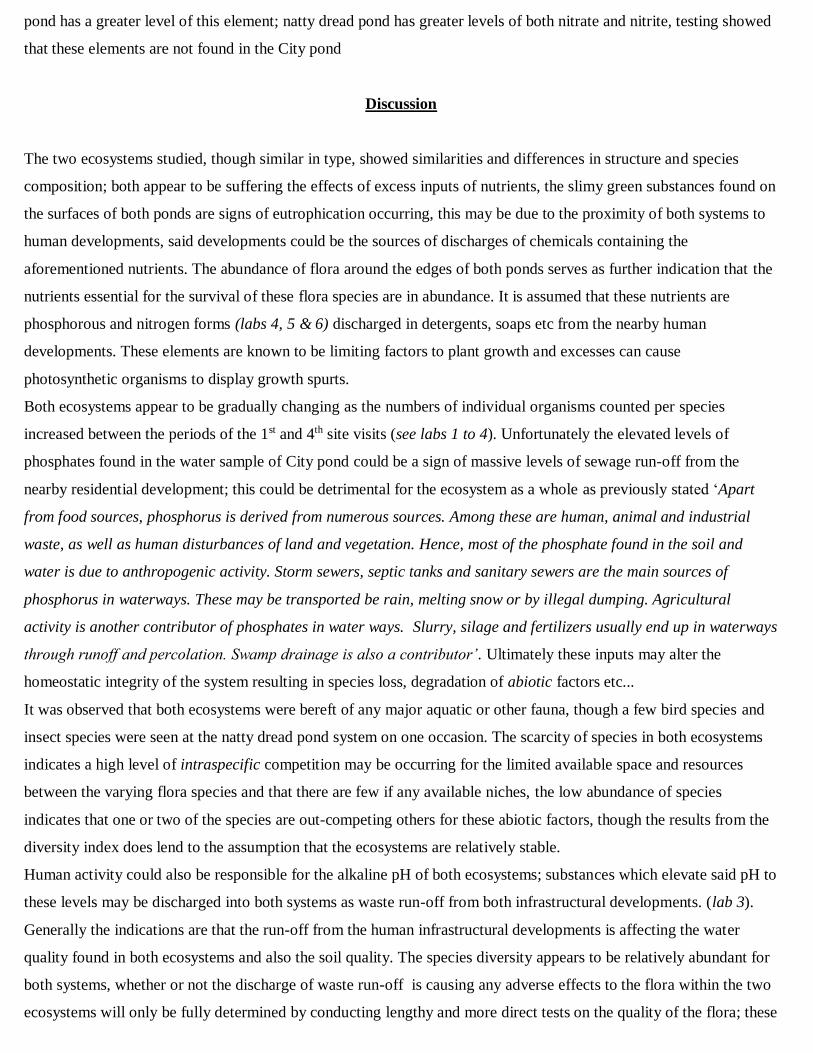
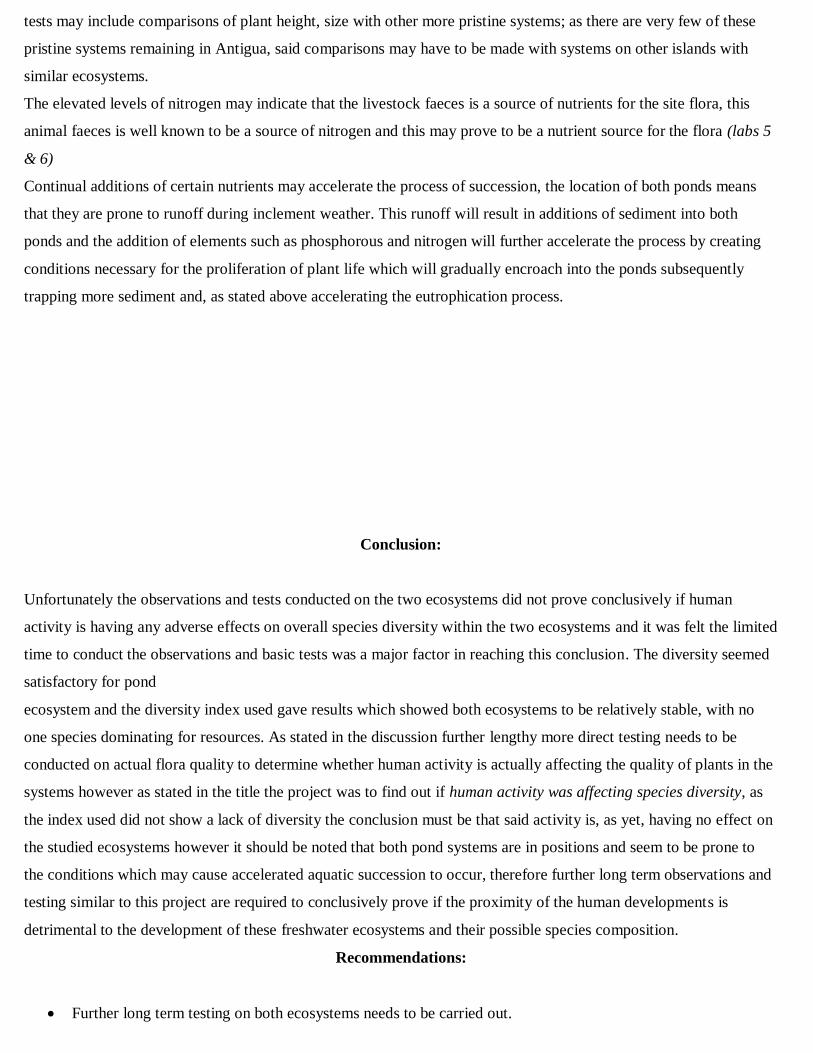
PRESENTATION & ANALYSIS OF DATA
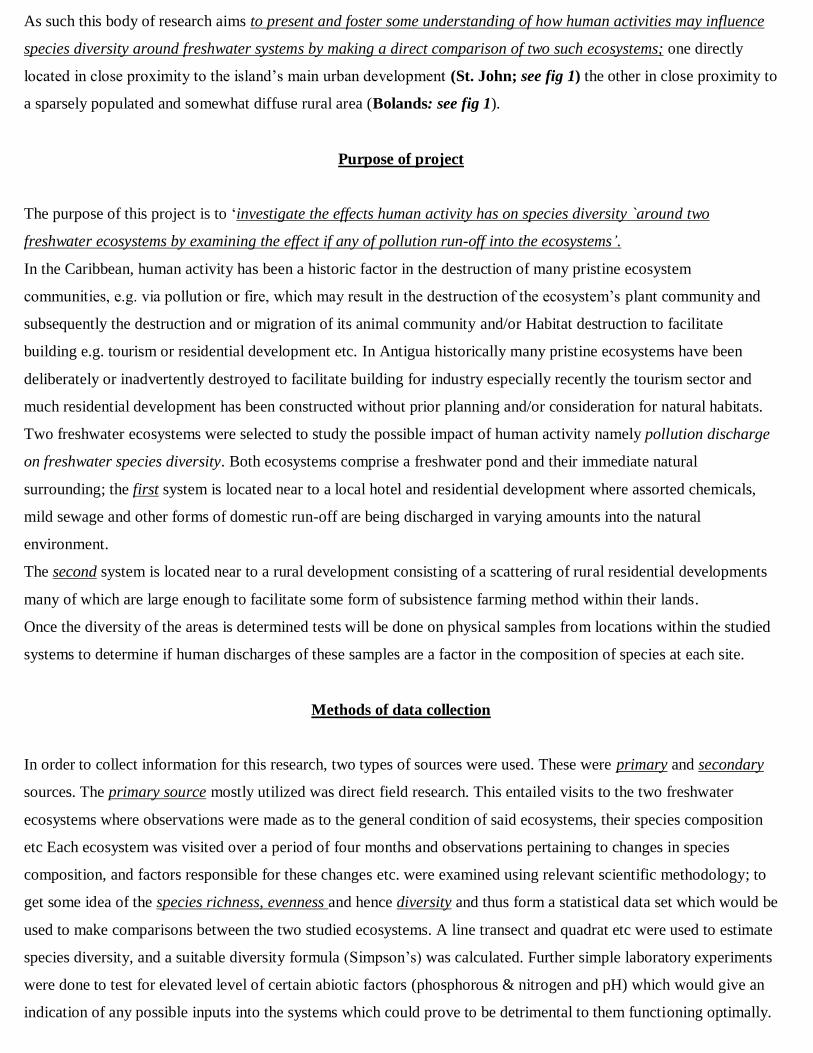
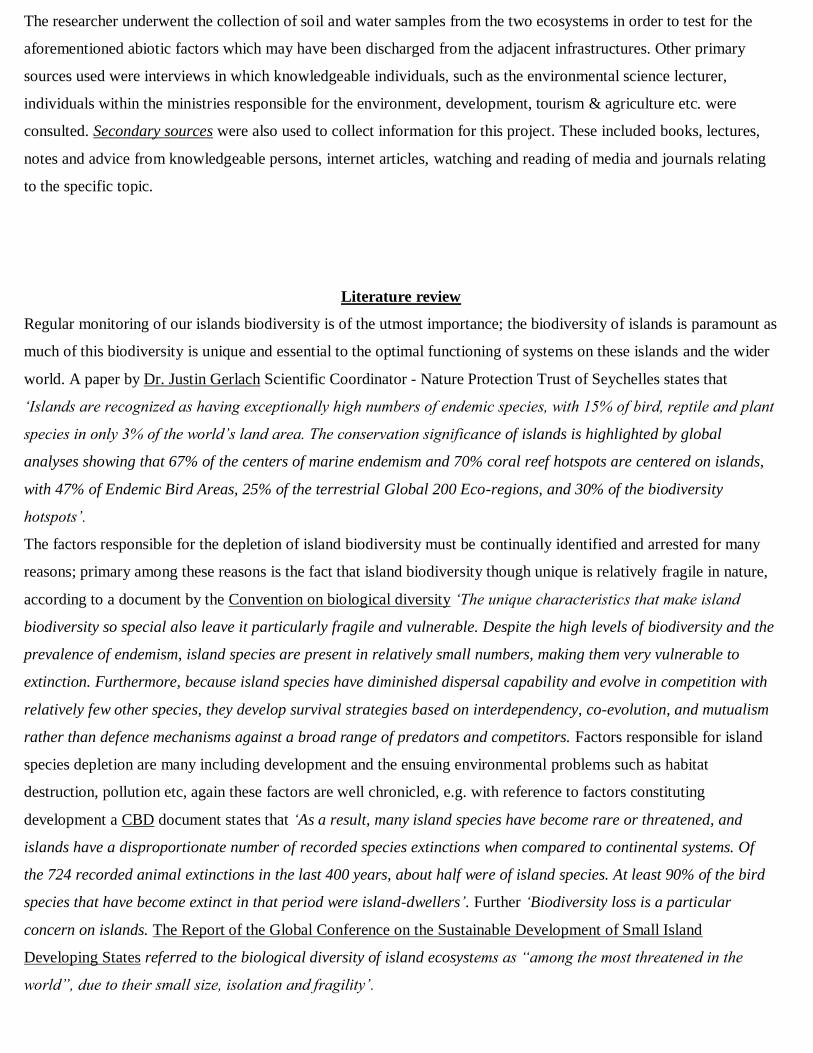
Figure 2 Natty dread pond in Bolands the residential developments are Figure 3:
picture of city pond, note the hotel
Located to the upper right hand section of the photo
in the background
Table 1: Comparison of the basic characteristics of the two studied freshwater ecosystems
Water body size location inputs surroundings .
City pond 20m x 9m St. John mostly domestic mostly residential dwellings, (Capital city) Chemicals (detergents, tourist hotel & businesses
Soaps mild forms of
Sewage etc) . Natty dread pond 15m x 12.5m Bolands copious amounts of residential, backyard
(Rural village) animal wastes, subsistence farmers
Agrochemicals
Observations of both sites showed that Natty dread pond had more flora species present than City pond this can be
seen in the photographs of the two sites above (Figs 2 & 3), this pond also attracted more fauna in the form of insects
and birds again the photographs above may suggest a possible reason for this due to the difference in flora observed
at the two sites, also various livestock were seen grazing the flora around the pond, drinking water from the pond and
depositing copious amounts of faeces around the edges of the pond, no livestock was seen around the City pond. Both
sites are situated at the bottom of gentle slopes which are prone to run off from developments located at the top of the
slopes this run off consists of various substances which are deposited in the pond especially during inclement
weather.
Table 1 outlines the basic characteristics of both freshwater systems; both sites are approximately the same size, one
site is found on the outskirts of the island’s capital city the other is located in a rural (village) location. Both sites are

prone to external inputs of chemicals and/or sewage, both are surrounded by infrastructural developments with the
city pond being surrounded by more built structures.
Table2: diversity index for the two selected ecosystems
Species diversity 1st visit 2nd visit.
City pond 0.189 0.192
Natty dread pond 0.136 0.138
This research is into the effects humans have on species diversity. Two pond ecosystems were selected to study these
effects the research also entailed a simple investigation of abiotiic factors to determine if human activity is
influencing these factors and hence the general species compositions of the selected research sites. Certain
information had to be collected and analysed to determine if human activity was affecting aspects of the natural
environment. Firstly some idea was needed as to the overall composition of species in the two sites, initially this
information was required to provide a control by which to measure any abnormal increases as a result of any adverse
additions to factors which may cause species losses or increases (Labs using Simpson’s index entries 1a, 1b, 2a &
2b). On the second visits to each pond the diversity of plant species was calculated, once quadrats were used to
estimate species present, a suitable calculation was applied to estimate the overall diversity of both areas. as can be
seen from table 2 above on the initial visit to both systems Natty dread pond is slightly more diverse than City pond
as according to the simplest interpretation of Simpson’s index 0 represents a very diverse ecosystem while 1
represents an ecosystem with no diversity at all, though as stated Natty dread pond had two more observed species
than City pond. By the time of the second visit the diversity for both systems had changed the calculated figures had
increased slightly indicating that the overall diversity of both systems had decreased with a small number of species
being more abundant than others.
Table 3: lab test results
pH Phosphorous Nitrate Nitrite
Name of pond water soil water (ppm) water (mg/L) water (mg/L).
City pond 7.3 8.0 2.26 00.00 0.000
Natty dread pond 7.1 7.9 0.79 154.9 0.022
Table 3 shows the results for the laboratory tests, it is seen that the pH of water samples from both sites for soil and
water are slightly alkaline though the pH of the water from City pond is initially greater than for Natty dread pond.
Both soil samples have a high pH with City pond being slightly higher. The tests for phosphorous shows that City
pond has a greater level of this element; natty dread pond has greater levels of both nitrate and nitrite, testing showed
that these elements are not found in the City pond
Discussion
The two ecosystems studied, though similar in type, showed similarities and differences in structure and species
composition; both appear to be suffering the effects of excess inputs of nutrients, the slimy green substances found on
the surfaces of both ponds are signs of eutrophication occurring, this may be due to the proximity of both systems to
human developments, said developments could be the sources of discharges of chemicals containing the
aforementioned nutrients. The abundance of flora around the edges of both ponds serves as further indication that the
nutrients essential for the survival of these flora species are in abundance. It is assumed that these nutrients are
phosphorous and nitrogen forms (labs 4, 5 & 6) discharged in detergents, soaps etc from the nearby human
developments. These elements are known to be limiting factors to plant growth and excesses can cause
photosynthetic organisms to display growth spurts.
Both ecosystems appear to be gradually changing as the numbers of individual organisms counted per species
increased between the periods of the 1st and 4th site visits (see labs 1 to 4). Unfortunately the elevated levels of
phosphates found in the water sample of City pond could be a sign of massive levels of sewage run-off from the
nearby residential development; this could be detrimental for the ecosystem as a whole as previously stated ‘Apart
from food sources, phosphorus is derived from numerous sources. Among these are human, animal and industrial
waste, as well as human disturbances of land and vegetation. Hence, most of the phosphate found in the soil and
water is due to anthropogenic activity. Storm sewers, septic tanks and sanitary sewers are the main sources of
phosphorus in waterways. These may be transported be rain, melting snow or by illegal dumping. Agricultural
activity is another contributor of phosphates in water ways. Slurry, silage and fertilizers usually end up in waterways
through runoff and percolation. Swamp drainage is also a contributor’. Ultimately these inputs may alter the
homeostatic integrity of the system resulting in species loss, degradation of abiotic factors etc...
It was observed that both ecosystems were bereft of any major aquatic or other fauna, though a few bird species and
insect species were seen at the natty dread pond system on one occasion. The scarcity of species in both ecosystems
indicates a high level of intraspecific competition may be occurring for the limited available space and resources
between the varying flora species and that there are few if any available niches, the low abundance of species
indicates that one or two of the species are out-competing others for these abiotic factors, though the results from the
diversity index does lend to the assumption that the ecosystems are relatively stable.
Human activity could also be responsible for the alkaline pH of both ecosystems; substances which elevate said pH to
these levels may be discharged into both systems as waste run-off from both infrastructural developments. (lab 3).
Generally the indications are that the run-off from the human infrastructural developments is affecting the water
quality found in both ecosystems and also the soil quality. The species diversity appears to be relatively abundant for
both systems, whether or not the discharge of waste run-off is causing any adverse effects to the flora within the two
ecosystems will only be fully determined by conducting lengthy and more direct tests on the quality of the flora; these
tests may include comparisons of plant height, size with other more pristine systems; as there are very few of these
pristine systems remaining in Antigua, said comparisons may have to be made with systems on other islands with
similar ecosystems.
The elevated levels of nitrogen may indicate that the livestock faeces is a source of nutrients for the site flora, this
animal faeces is well known to be a source of nitrogen and this may prove to be a nutrient source for the flora (labs 5
& 6)
Continual additions of certain nutrients may accelerate the process of succession, the location of both ponds means
that they are prone to runoff during inclement weather. This runoff will result in additions of sediment into both
ponds and the addition of elements such as phosphorous and nitrogen will further accelerate the process by creating
conditions necessary for the proliferation of plant life which will gradually encroach into the ponds subsequently
trapping more sediment and, as stated above accelerating the eutrophication process.
Conclusion:
Unfortunately the observations and tests conducted on the two ecosystems did not prove conclusively if human
activity is having any adverse effects on overall species diversity within the two ecosystems and it was felt the limited
time to conduct the observations and basic tests was a major factor in reaching this conclusion. The diversity seemed
satisfactory for pond
ecosystem and the diversity index used gave results which showed both ecosystems to be relatively stable, with no
one species dominating for resources. As stated in the discussion further lengthy more direct testing needs to be
conducted on actual flora quality to determine whether human activity is actually affecting the quality of plants in the
systems however as stated in the title the project was to find out if human activity was affecting species diversity, as
the index used did not show a lack of diversity the conclusion must be that said activity is, as yet, having no effect on
the studied ecosystems however it should be noted that both pond systems are in positions and seem to be prone to
the conditions which may cause accelerated aquatic succession to occur, therefore further long term observations and
testing similar to this project are required to conclusively prove if the proximity of the human developments is
detrimental to the development of these freshwater ecosystems and their possible species composition.
Recommendations:
Further long term testing on both ecosystems needs to be carried out.
The public should be proactive and implement measures to prevent excessive run-off of pollutants and other
harmful substances into said ecosystems for example by using environmentally benign detergents, cleaning
products & soaps etc.
The public should be educated as to the importance of pond ecosystems. Field visits should be arranged for
school children, during which knowledgeable individuals should be able to stress the ecologically important
role these ecosystems play (Hydrological cycle etc).
Fines should be imposed for deliberate discharge of harmful pollutants and chemicals and solid wastes into
the ecosystems.
Programs should be implemented to remediate damage already done to said ecosystems. (rehabilitation
efforts) Said efforts may include phyto-remediatopn and bio-remediation.
Such ecosystems should be afforded some measure of protection as places of ecological importance & natural
beauty.
Careful monitoring of human developments and their effects on these systems should be implemented by local
governments.
Bibliography:
Author Title Publisher
Box & Weave The pond environment Roots & culture (2001)
Tump & Kick Threats to ecosystem development Ital press (1997)
Kuff & Wallop Environmental science Robbem & flee (2004)
Grab & Flee Environmental degradation Cool & smooth (1999)
Friely I. P Planet Earth Bite & Chew (2006)
Baker and Cook Ecosystem succession Eclaire press (1967)
www.envsci.com Caribbean ecosystems Boogle 2011-08-25
www.earthsystems.com Succession development Bahoo 2011-08-25
http://www.cep.unep.org/programmes/amep/GEF-IWCAM/Antigua/ANUREPT.doc Bahoo 2011-08-25
Appendix:
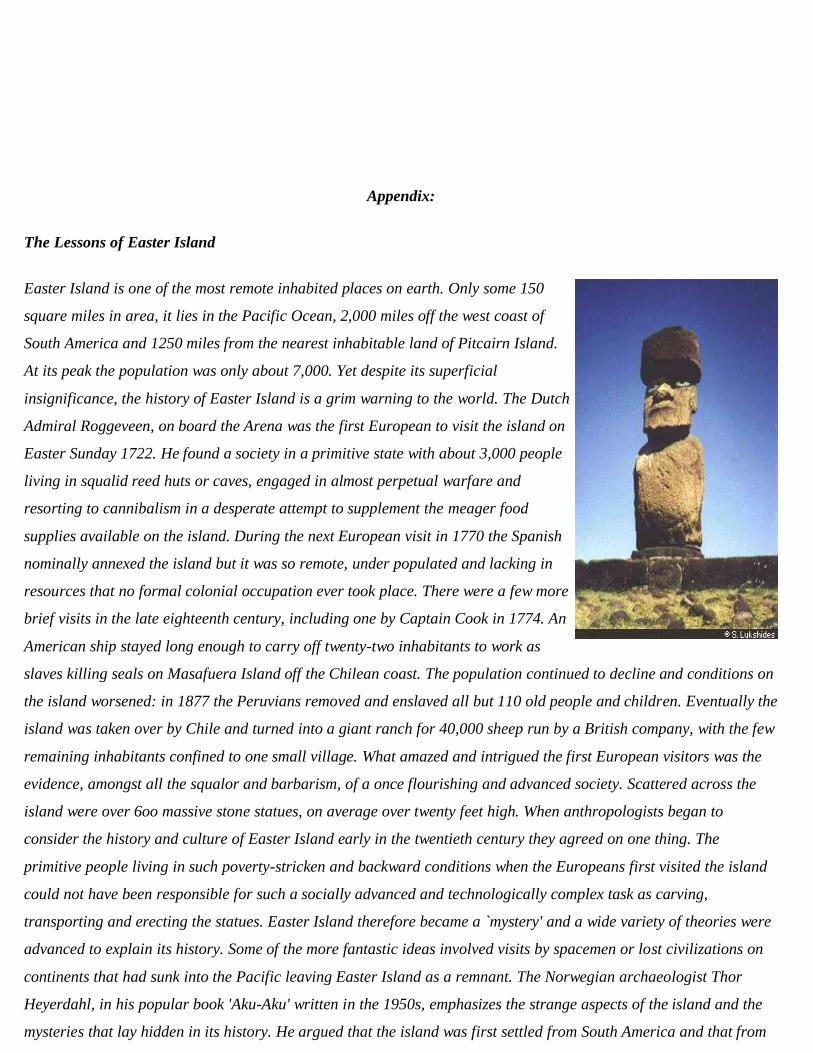
The Lessons of Easter Island
Easter Island is one of the most remote inhabited places on earth. Only some 150
square miles in area, it lies in the Pacific Ocean, 2,000 miles off the west coast of
South America and 1250 miles from the nearest inhabitable land of Pitcairn Island.
At its peak the population was only about 7,000. Yet despite its superficial
insignificance, the history of Easter Island is a grim warning to the world. The Dutch
Admiral Roggeveen, on board the Arena was the first European to visit the island on
Easter Sunday 1722. He found a society in a primitive state with about 3,000 people
living in squalid reed huts or caves, engaged in almost perpetual warfare and
resorting to cannibalism in a desperate attempt to supplement the meager food
supplies available on the island. During the next European visit in 1770 the Spanish
nominally annexed the island but it was so remote, under populated and lacking in
resources that no formal colonial occupation ever took place. There were a few more
brief visits in the late eighteenth century, including one by Captain Cook in 1774. An
American ship stayed long enough to carry off twenty-two inhabitants to work as
slaves killing seals on Masafuera Island off the Chilean coast. The population continued to decline and conditions on
the island worsened: in 1877 the Peruvians removed and enslaved all but 110 old people and children. Eventually the
island was taken over by Chile and turned into a giant ranch for 40,000 sheep run by a British company, with the few
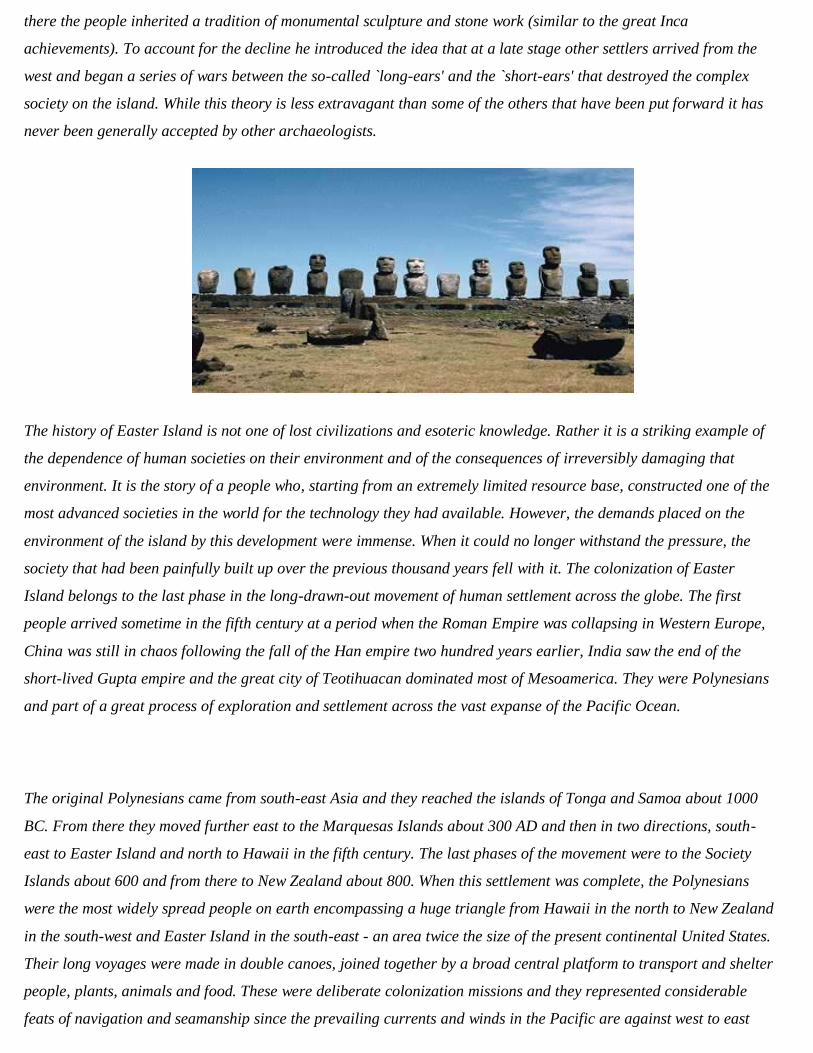
remaining inhabitants confined to one small village. What amazed and intrigued the first European visitors was the
evidence, amongst all the squalor and barbarism, of a once flourishing and advanced society. Scattered across the
island were over 6oo massive stone statues, on average over twenty feet high. When anthropologists began to
consider the history and culture of Easter Island early in the twentieth century they agreed on one thing. The
primitive people living in such poverty-stricken and backward conditions when the Europeans first visited the island
could not have been responsible for such a socially advanced and technologically complex task as carving,
transporting and erecting the statues. Easter Island therefore became a `mystery' and a wide variety of theories were
advanced to explain its history. Some of the more fantastic ideas involved visits by spacemen or lost civilizations on
continents that had sunk into the Pacific leaving Easter Island as a remnant. The Norwegian archaeologist Thor
Heyerdahl, in his popular book 'Aku-Aku' written in the 1950s, emphasizes the strange aspects of the island and the
mysteries that lay hidden in its history. He argued that the island was first settled from South America and that from
there the people inherited a tradition of monumental sculpture and stone work (similar to the great Inca
achievements). To account for the decline he introduced the idea that at a late stage other settlers arrived from the
west and began a series of wars between the so-called `long-ears' and the `short-ears' that destroyed the complex
society on the island. While this theory is less extravagant than some of the others that have been put forward it has
never been generally accepted by other archaeologists.
The history of Easter Island is not one of lost civilizations and esoteric knowledge. Rather it is a striking example of
the dependence of human societies on their environment and of the consequences of irreversibly damaging that
environment. It is the story of a people who, starting from an extremely limited resource base, constructed one of the
most advanced societies in the world for the technology they had available. However, the demands placed on the
environment of the island by this development were immense. When it could no longer withstand the pressure, the
society that had been painfully built up over the previous thousand years fell with it. The colonization of Easter
Island belongs to the last phase in the long-drawn-out movement of human settlement across the globe. The first
people arrived sometime in the fifth century at a period when the Roman Empire was collapsing in Western Europe,
China was still in chaos following the fall of the Han empire two hundred years earlier, India saw the end of the
short-lived Gupta empire and the great city of Teotihuacan dominated most of Mesoamerica. They were Polynesians
and part of a great process of exploration and settlement across the vast expanse of the Pacific Ocean.
The original Polynesians came from south-east Asia and they reached the islands of Tonga and Samoa about 1000
BC. From there they moved further east to the Marquesas Islands about 300 AD and then in two directions, south-
east to Easter Island and north to Hawaii in the fifth century. The last phases of the movement were to the Society
Islands about 600 and from there to New Zealand about 800. When this settlement was complete, the Polynesians
were the most widely spread people on earth encompassing a huge triangle from Hawaii in the north to New Zealand
in the south-west and Easter Island in the south-east - an area twice the size of the present continental United States.
Their long voyages were made in double canoes, joined together by a broad central platform to transport and shelter
people, plants, animals and food. These were deliberate colonization missions and they represented considerable
feats of navigation and seamanship since the prevailing currents and winds in the Pacific are against west to east

travel. When the first people found Easter Island, they discovered a world with few resources. The island was
volcanic in origin, but its three volcanoes had been extinct for at least 400 years before the Polynesian settlers
arrived. Both temperatures and humidity were high and, although the soil was adequate, drainage was very bad and
there were no permanent streams on the island; the only fresh water available was from lakes inside the extinct
volcanoes. Because of its remoteness the island had only a few species of plants and animals. There were thirty
indigenous species of flora, no mammals, a few insects and two types of small lizard. The waters around the island
contained very few fish. The arrival of the first humans did little to improve the situation. The Polynesians in their
home islands depended on a very limited range of plants and animals for subsistence: their only domesticated
animals were chickens, pigs, dogs and the Polynesian rat and the main crops were yam, taro, breadfruit, banana,
coconut and sweet potato. The settlers on Easter Island brought only chickens and rats with them and they soon
found that the climate was too severe for semi-tropical plants such as breadfruit and coconut and extremely marginal
for the usual mainstays of their diet, taro and yam. The inhabitants were, therefore, restricted to a diet based mainly
on sweet potatoes and chickens. The only advantage of this monotonous, though nutritionally adequate, diet was that
cultivation of the sweet potato was not very demanding and left plenty of time for other activities. It is not known how
many settlers arrived in the fifth century but they probably numbered no more than twenty or thirty at most. As the
population slowly increased the forms of social organization familiar in the rest of Polynesia were adopted. The
basic social unit was the extended family, which jointly owned and cultivated the land. Closely related households
formed lineages and clans, each of which had its own centre for religious and ceremonial activity. Each clan was
headed by a chief who was able to organize and direct activities and act as a focal point for the redistribution of food
and other essentials within the clan. It was this form of organization and the competition (and probably conflict)
between the clans that produced both the major achievements of Easter Island society and ultimately its collapse.
Settlements were scattered across the island in small clusters of peasant huts with crops grown in open fields. Social
activities were centered around separate ceremonial centers, which were occupied for part of the year. The chief
monuments were large stone platforms, similar to those found in other parts of Polynesia and known as ahu, which
were used for burials, ancestor worship and to commemorate past clan chiefs. What made Easter Island different was
that crop production took very little effort and therefore there was plenty of free time which the clan chiefs were able
to direct into ceremonial activities. The result was the creation of the most advanced of all the Polynesian societies
and one of the most complex in the world for its limited resource base. The Easter Islanders engaged in elaborate
rituals and monument construction. Some of the ceremonies involved recitation from the only known Polynesian form
of writing called rongorongo, which was probably less a true script and more a series of mnemonic devices. One set
of elaborate rituals was based on the bird cult at Orongo, where there are the remains of forty-seven special houses
together with numerous platforms and a series of high-relief rock carvings. The crucial centers of ceremonial activity
were the ahu. Over 300 of these platforms were constructed on the island, mainly near the coast. The level of
intellectual achievement of at least some parts of Easter Island society can be judged by the fact that a number of
these ahu have sophisticated astronomical alignments, usually towards one of the solstices or the equinox. At each
site they erected between one and fifteen of the huge stone statues that survive today as a unique memorial to the
vanished Easter Island society. It is these statues which took up immense amounts of peasant labor. The statues were
carved, using only obsidian stone tools, at the quarry at Rano Raraku. They were fashioned to represent in a highly
stylized form a male head and torso. On top of the head was placed a `topknot' of red stone weighing about ten tons
from another quarry. The carving was a time-consuming rather than a complex task. The most challenging problem
was to transport the statues, each some twenty feet in length and weighing several tens of tons, across the island and
the then erect them on top of the ahu. The Easter Islanders' solution to the problem of transport provides the key to
the subsequent fate of their whole society. Lacking any draught animals they had to rely on human power to drag the
statues across the island using tree trunks as rollers. The population of the island grew steadily from the original
small group in the fifth century to about 7,000 at its peak in 1550. Over time the number of clan groups would have
increased and also the competition between them. By the sixteenth century hundreds of ahu had been constructed and
with them over 600 of the huge stone statues. Then, when the society was at its peak, it suddenly collapsed leaving
over half the statues only partially completed around Rano Raraku quarry. The cause of the collapse and the key to
understanding the `mysteries' of Easter Island was massive environmental degradation brought on by deforestation
of the whole island. When the first Europeans visited the island in the eighteenth century it was completely treeless
apart from a handful of isolated specimens at the bottom of the deepest extinct volcano crater of Rano Kao. However,
recent scientific work, involving the analysis of pollen types, has shown that at the time of the initial settlement Easter
Island had a dense vegetation cover including extensive woods. As the population slowly increased, trees would have
been cut down to provide clearings for agriculture, fuel for heating and cooking, construction material for household
goods, pole and thatch houses and canoes for fishing. The most demanding requirement of all was the need to move
the large number of enormously heavy statues to ceremonial sites around the island. The only way this could have
been done was by large numbers of people guiding and sliding them along a form of flexible tracking made up of tree
trunks spread on the ground between the quarry and the ahu. Prodigious quantities of timber would have been
required and in increasing amounts as the competition between the clans to erect statues grew: As a result by 1600
the island was almost completely deforested and statue erection was brought to a halt leaving many stranded at the
quarry. The deforestation of the island was not only the death knell for the elaborate social and ceremonial life it also
had other drastic effects on every day life for the population generally. From 1500 the shortage of trees was forcing
many people to abandon building houses from timber and live in caves, and when the wood eventually ran out
altogether about a century later everyone had to use the only materials left. They resorted to stone shelters dug into
the hillsides or flimsy reed huts cut from the vegetation that grew round the edges of the crater lakes. Canoes could
no longer be built and only reed boats incapable of long voyages could be made.
Fishing was also more difficult because nets had previously been made from the paper mulberry tree (which could
also be made into cloth) and that was no longer available. Removal of the tree cover also badly affected the soil of
the island, which would have already suffered from a lack of suitable animal manure to replace nutrients taken up by
the crops. Increased exposure caused soil erosion and the leaching out of essential nutrients. As a result crop yields
declined. The only source of food on the island unaffected by these problems was the chickens. As they became ever
more important, they had to be protected from theft and the introduction of stone-built defensive chicken houses can

be dated to this phase of the island's history. It became impossible to support 7,000 people on this diminishing
resource base and numbers fell rapidly after 1600 Easter Island society went into decline and regressed to ever more
primitive conditions. Without trees, and so without canoes, the islanders were trapped in their remote home, unable
to escape the consequences of their self-inflicted, environmental collapse. The social and cultural impact of
deforestation was equally important. The inability to erect any more statues must have had a devastating effect on the
belief systems and social organization and called into question the foundations on which that complex society had
been built. There were increasing conflicts over diminishing resources resulting in a state of almost permanent
warfare. Slavery became common and as the amount of protein available fell the population turned to cannibalism.
One of the main aims of warfare was to destroy the ahu of opposing clans. A few survived as burial places but most
were abandoned. The magnificent stone statues, too massive to destroy, were pulled down. The first Europeans found
only a few still standing when they arrived in the eighteenth century and all had been toppled by the 1830s. When
they were asked by the visitors how the statues had been moved from the quarry, the primitive islanders could no
longer remember what their ancestors had achieved and could only say that the huge figures had `walked' across the
island. The Europeans, seeing a treeless landscape, could think of no logical explanation either and were equally
mystified.
Against great odds the islanders painstakingly constructed, over many centuries, one of the most advanced societies
of its type in the world. For a thousand years they sustained a way of life in accordance with an elaborate set of
social and religious customs that enabled them not only to survive but to flourish. It was in many ways a triumph of
human ingenuity and an apparent victory over a difficult environment. But in the end the increasing numbers and
cultural ambitions of the islanders proved too great for the limited resources available to them. When the
environment was ruined by the pressure, the society very quickly collapsed with it leading to a state of near
barbarism. The Easter Islanders, aware that they were almost completely isolated from the rest of the world, must
surely have realized that their very existence depended on the limited resources of a small island. After all it was
small enough for them to walk round the entire island in a day or so and see for themselves what was happening to
the forests. Yet they were unable to devise a system that allowed them to find the right balance with their
environment. Instead vital resources were steadily consumed until finally none were left. Indeed, at the very time
when the limitations of the island must have become starkly apparent the competition between the clans for the
available timber seems to have intensified as more and more statues were carved and moved across the island in an
attempt to secure prestige and status. The fact that so many were left unfinished or stranded near the quarry suggests
that no account was taken of how few trees were left on the island. The fate of Easter Island has wider implications
too. Like Easter Island the earth has only limited resources to support human society and all its demands. Like the
islanders, the human population of the earth has no practical means of escape. How has the environment of the world
shaped human history and how have people shaped and altered the world in which they live? Have other societies
fallen into the same trap as the islanders? For the last two million years humans have succeeded in obtaining more
food and extracting more resources on which to sustain increasing numbers of people and increasingly complex and
technologically advanced societies. But have they been any more successful than the islanders in finding a way of life
that does not fatally deplete the resources that are available to them and irreversibly damage their life support
system?