Embed Size (px)
Citation preview
NASA/TM--1999-209178
Investigation of Atomic Oxygen Erosion
of Polyimide Kapton H Exposed to aPlasma Asher Environment
Aaron Snyder
Glenn Research Center, Cleveland, Ohio
Prepared for the
44th International SAMPE Symposium and Exhibit
sponsored by the Society for the Advancement of Material and Process Engineering
Long Beach, California, May 23-27, 1999
National Aeronautics and
Space Administration
Glenn Research Center
May 1999
https://ntrs.nasa.gov/search.jsp?R=19990052726 2018-04-08T09:22:36+00:00Z
This report is a formal draft or workingpaper, intended to solicit comments and
ideas from a technical peer group.
Trade names or manufacturers' names are used in this report foridentification only. This usage does not constitute an official
endorsement, either expressed or implied, by the National
Aeronautics and Space Administration.
NASA Center for Aerospace Information7121 Standard Drive
Hanover, MD 21076Price Code: A03
Available from
National Technical Information Service
5285 Port Royal Road
Springfield, VA 22100Price Code: A03
INVESTIGATION OF ATOMIC OXYGEN EROSION OF POLYIMIDEKAPTON H EXPOSED TO A PLASMA ASHER ENVIRONMENT
Aaron Snyder
National Aeronautics and Space AdministrationGlenn Research Center
Cleveland, Ohio 44135
ABSTRACT
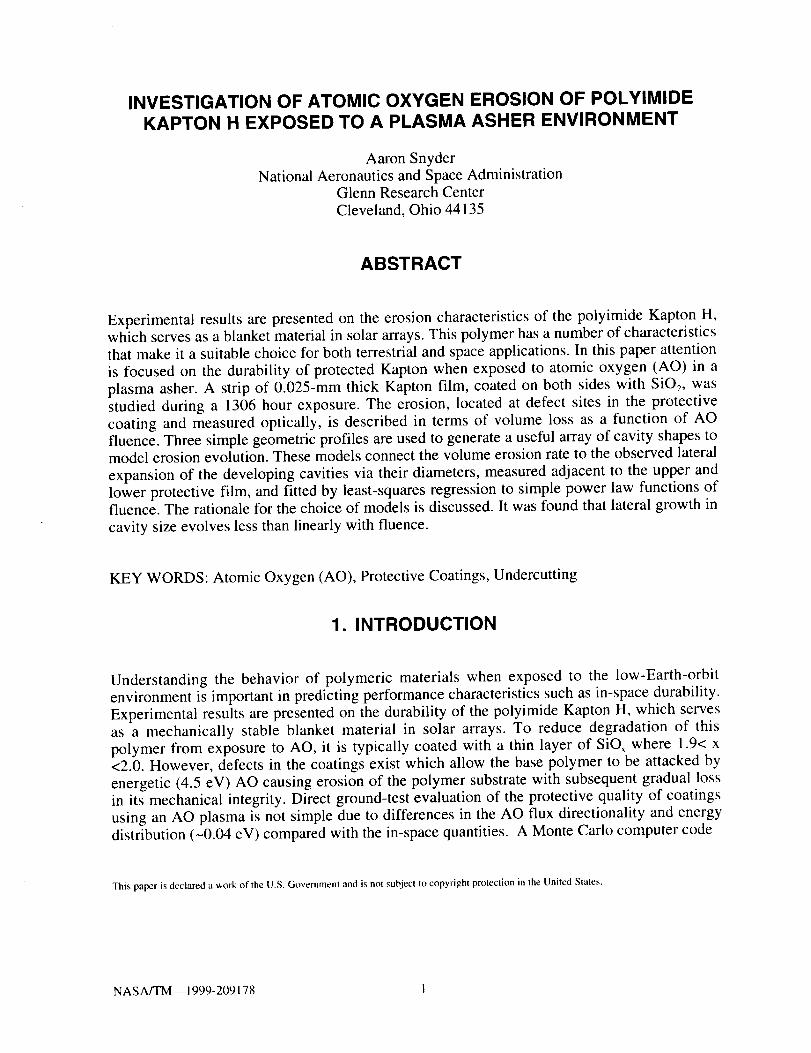
Experimental results are presented on the erosion characteristics of the polyimide Kapton H,
which serves as a blanket material in solar arrays. This polymer has a number of characteristics
that make it a suitable choice for both terrestrial and space applications. In this paper attention
is focused on the durability of protected Kapton when exposed to atomic oxygen (AO) in a
plasma asher. A strip of 0.025-mm thick Kapton film, coated on both sides with SIO2, was
studied during a 1306 hour exposure. The erosion, located at defect sites in the protective
coating and measured optically, is described in terms of volume loss as a function of AO
fluence. Three simple geometric profiles are used to generate a useful array of cavity shapes tomodel erosion evolution. These models connect the volume erosion rate to the observed lateral
expansion of the developing cavities via their diameters, measured adjacent to the upper and
lower protective film, and fitted by least-squares regression to simple power law functions offluence. The rationale for the choice of models is discussed. It was found that lateral growth in
cavity size evolves less than linearly with fluence.
KEY WORDS: Atomic Oxygen (AO), Protective Coatings, Undercutting
1. INTRODUCTION
Understanding the behavior of polymeric materials when exposed to the low-Earth-orbit
environment is important in predicting performance characteristics such as in-space durability.
Experimental results are presented on the durability of the polyimide Kapton H, which serves
as a mechanically stable blanket material in solar arrays. To reduce degradation of this
polymer from exposure to AO, it is typically coated with a thin layer of SiOx where 1.9< x
<2.0. However, defects in the coatings exist which allow the base polymer to be attacked by
energetic (4.5 eV) AO causing erosion of the polymer substrate with subsequent gradual loss
in its mechanical integrity. Direct ground-test evaluation of the protective quality of coatings
using an AO plasma is not simple due to differences in the AO flux directionality and energy
distribution (-0.04 eV) compared with the in-space quantities. A Monte Carlo computer code
This paper is declared a work of the U.S. Government and is not subject to copyright protection in the United States.
NASA/TM--1999-209178 I
is being advanced which simulates AO reactions at defect boundaries. While this code has
provided good results on erosion, its predictive capability is higher for directed atomic oxygenattack than isotropic plasma exposure.
To improve the Monte Carlo code, more faithful characterizations of AO reactions with
polymers are needed which may be obtained through better understanding of undercutting at
defect sites. Prior investigations (1-3) have yielded valuable information on cavity shape, size,and distribution. This information has guided revisions of the computational model concerning
various AO interaction assumptions. A detailed list of the interaction parameters for Kaptonused in the Monte Carlo code is given in reference (4).
The most prominent parameter affecting site-to-site variation in cavity evolution is the defect
size. In general, and as expected, larger defects produce larger cavities. In addition, it has been
observed ( 1) by examination of numerous defect sites that defect size is a factor in determining
cavity shape. Other factors affect cavity shape and evolution. These factors may actindependently or in concert in a complex fashion. For example, the present shape or size of a
cavity may measurably affect its future evolution, leading to a non-uniform or nonlinear
growth process. This may be the result of geometry, chemistry, transport phenomena or otherphysical phenomena.
Important aspects of cavity evolution can be studied without knowing the detailed nature of the
erosion process. The effort of this study was directed toward capturing the gross trends in
cavity evolution using simple models of cavity shape and fitting them to the measured
diameters. The goal of the investigation was to determine whether cavity growth could bemodeled adequately as a simple function of fluence or whether a more complex evolution
model was needed. Such results will assist in understanding the undercutting process occurringwith isotropic RF plasma asher exposures.
The following discussion involves the main rationale used in specifying cavity models. The
first assumption is that a profile in the form of a simple arc, without inflexion points, can
adequately approximate the true profile. The arc should be specifiable in terms of the upper
and lower diameter measurements for undercut cavities that extend through the full thickness
of the polymer. The second consideration is for specification during the period of evolution
prior to the lower coating being reached. During this period, it is assumed that a cavity expands
laterally at a rate approximating its vertical growth. Finally it is assumed that a cavity's profile
retains a similar form throughout its evolution, so that a linear profile proceeds to evolve as alinear profile, even after reaching the lower coating, etc.
Three profile types were selected as. models having the following forms: (1) linear arc, (2)
parabolic arc and (3) circular arc. These arcs are used to generate a corresponding set ofvolumes of revolution used to model cavity growth. In terms of volume, linear and circular
arcs produce values representing low and high bounds, respectively, with the parabolic profileproducing values between these two. These profiles are discussed in detail.
2. MATERIAL CONSIDERATIONS
The polyimide Kapton is rapidly eroded by AO. An optically transparent coating, such as SiO2,
reduces erosion significantly. These coatings are very effective, even in layers typically no
NASA/TM--1999-209178 2
thicker than 10-150nanometers.However, small defects in the coatings, originating atapplication,permeatetheprotectivelayer andserveassitesfor the AO to attacktheexposedunderlying Kapton. Although mechanically stable in its pristine form, its mechanicalcharacteristics are compromised by chemical erosion. Significant erosion can make itunsuitablefor its intendedpurpose.
3. EXPERIMENTAL
The study used a 13.56 MHz SPI Plasma Prep II operated with air. This type of asher produces
plasma by the use of a low pressure, radio-frequency induced, gaseous discharge. The opticalmeasurements were made using an Olympus Microscope. Coordinates were supplied using a
xy-positioner.
The Kapton sample was cut from a sheet of 0.025-mm thickness Sheldahl-701664, covered onboth faces with 0.13 microns (1300 k,) of SiOx where 1.9<x<2.0. The sample was mounted on
a 2.5-cm by 7.5-cm slide and trimmed to this size. It was fastened by double adhesive tape
along its periphery, designed to permit exposure to only the upper surface. During ashingsessions it was accompanied by a single 0.125-mm thick by 25-mm diameter witness coupon
consisting of unprotected Kapton with only the upper face exposed to plasma. A fresh coupon
was used for each session. Each witness coupon was weighed on a microbalance immediately
before and after ashing sessions to determine its weight loss caused by erosion. The coupons
were kept under vacuum prior to service to minimize moisture retention.
After ashing the sample for 66.5 hours, the sample was inspected and 27 defect sites were
selected, with their positions relative to a corner being recorded. The sites were picked with
emphasis on both shape circularity and the absence of nearby defects that might eventually
grow into the selected site. As an aid to identification, sites were selected in sets of three,
spaced apart by a few millimeters. The nine sets of sites were distributed more broadly about
the entire untaped portion of the sample to provide diversity in location. The sites were
inspected and measured after each session.
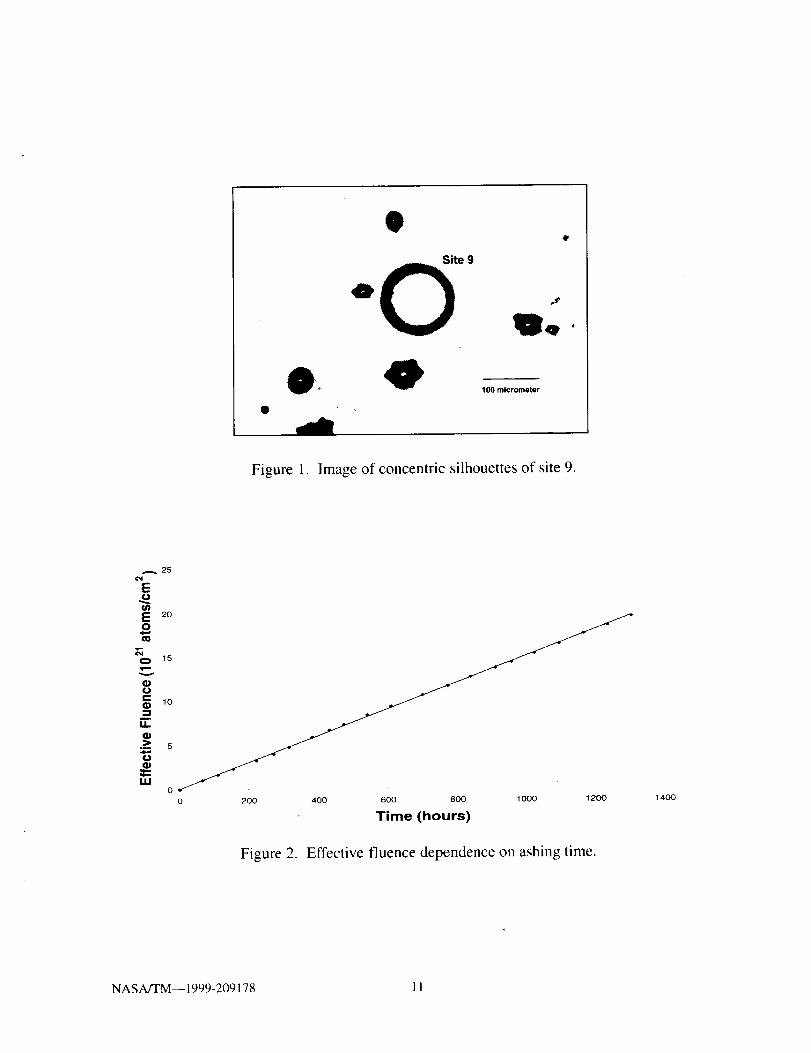
Effective cavity diameters were calculated by averaging the measurements of the silhouette
obtained in two orthogonal directions lying in the plane of the sample. Figure 1 shows a digital
image produced from an optical microscope photograph that reveals site 9. The black annulararea, concentric with the site's center, corresponds to the sloped wall of the undercut cavity.
Thus, the inner white portion represents the exposed silhouette of the lower protective coating.
Similarly, the outer boundary of the black annular ring corresponds to the silhouette of the
exposed upper coating where the defect is situated.
4. DISCUSSION OF RESULTS
Results were obtained at 27 protective coating sites on a single sample, with 26 sites surviving
the entire ashing duration. One site became occluded by adjacent cavities after 610 hours of
ashing and is thus excluded from duration-averaged statistics. The sample was ashed for
NASA/TM-- 1999-209178 3
1306 hours over a period of two months consisting of 21 continuous ashing sessions spanningabout two to three days each.
The effective fluence as determined by the witness-coupon mass lost through etching was
essentially linear with ashing time over the period of investigation. The fluence versus ashing-time relationship is illustrated in Figure 2. A linear least squares regression through the origin
gives a slope that establishes the ashing period of 1306 hours as being equivalent to a fluenceof 1.96 x 10 22 atoms/cm 2, yielding an average flux of 1.5xlO j9 atoms/cm2-hr.
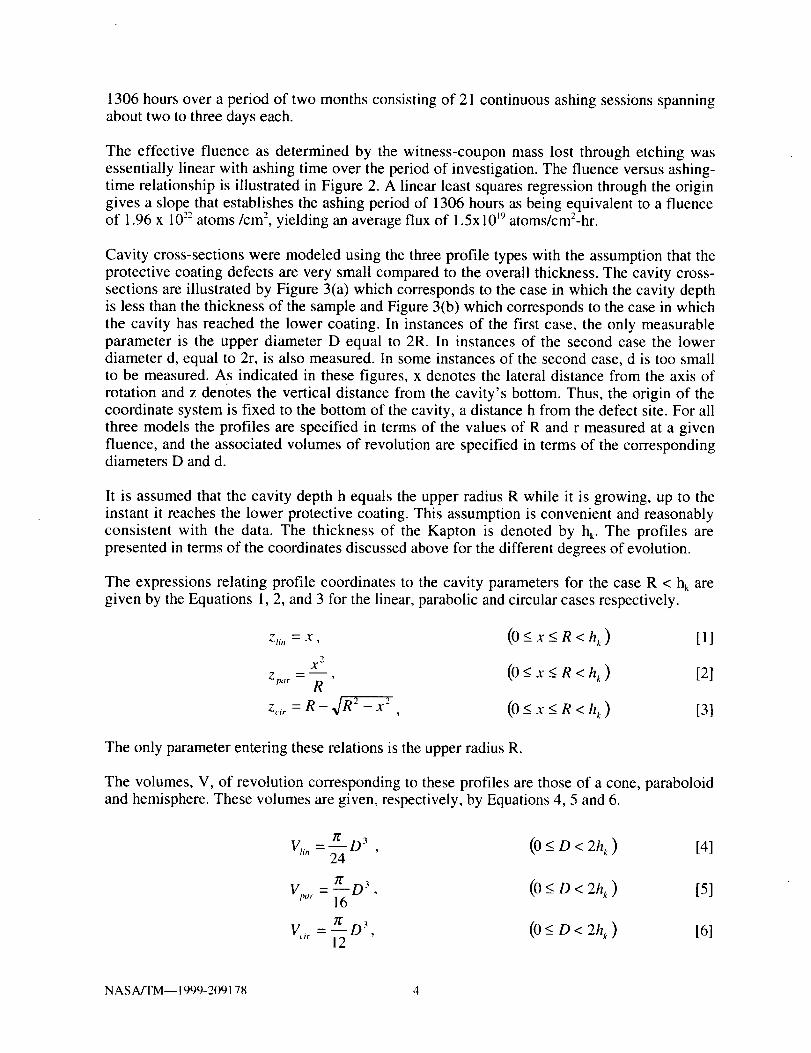
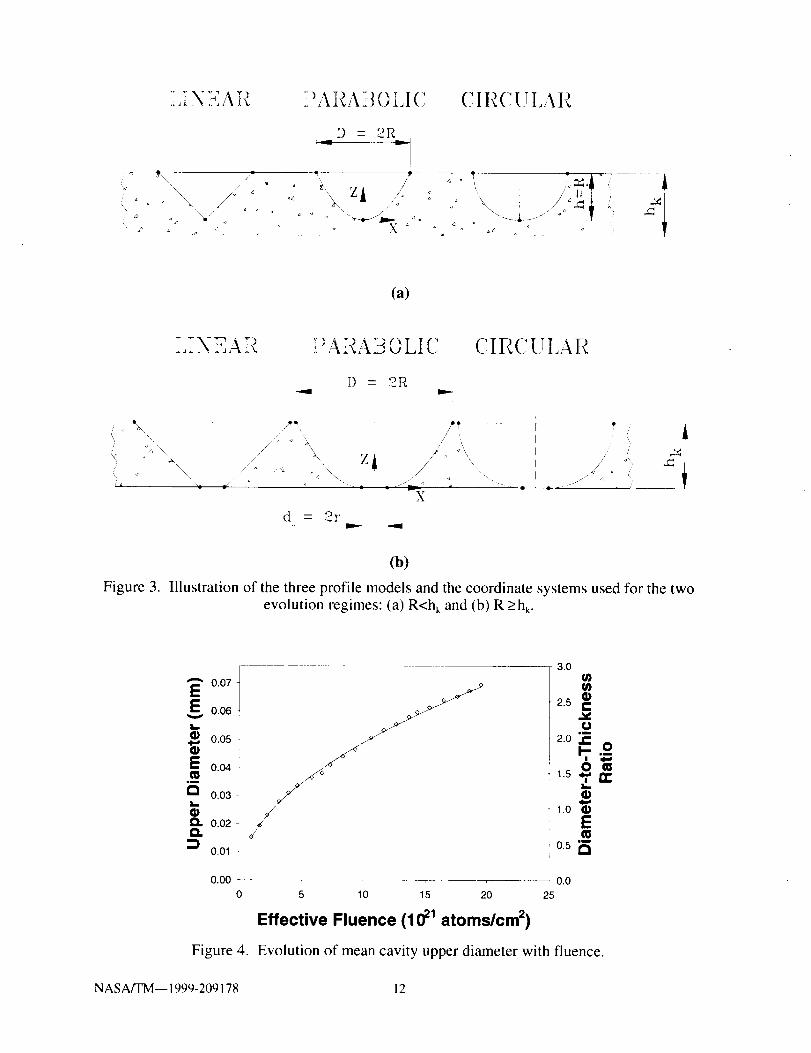
Cavity cross-sections were modeled using the three profile types with the assumption that the
protective coating defects are very small compared to the overall thickness. The cavity cross-
sections are illustrated by Figure 3(a) which corresponds to the case in which the cavity depth
is less than the thickness of the sample and Figure 3(b) which corresponds to the case in which
the cavity has reached the lower coating. In instances of the first case, the only measurable
parameter is the upper diameter D equal to 2R. In instances of the second case the lower
diameter d, equal to 2r, is also measured. In some instances of the second case, d is too small
to be measured. As indicated in these figures, x denotes the lateral distance from the axis of
rotation and z denotes the vertical distance from the cavity's bottom. Thus, the origin of the
coordinate system is fixed to the bottom of the cavity, a distance h from the defect site. For all
three models the profiles are specified in terms of the values of R and r measured at a given
fluence, and the associated volumes of revolution are specified in terms of the correspondingdiameters D and d.
It is assumed that the cavity depth h equals the upper radius R while it is growing, up to the
instant it reaches the lower protective coating. This assumption is convenient and reasonablyconsistent with the data. The thickness of the Kapton is denoted by hk. The profiles are
presented in terms of the coordinates discussed above for the different degrees of evolution.
The expressions relating profile coordinates to the cavity parameters for the case R < hk are
given by the Equations 1, 2, and 3 for the linear, parabolic and circular cases respectively.
z.,, = x. (ON xg R <h_) [11
x 2(o_<x< R < [2]
z p,,,. R
z,,r=R-4R2-x 2 , (0<_x<_R [31
The only parameter entering these relations is the upper radius R.
The volumes, V, of revolution corresponding to these profiles are those of a cone, paraboloid
and hemisphere. These volumes are given, respectively, by Equations 4, 5 and 6.
Vt_,'= n' D3 . (0<D<2h k) [4]24
V_,,,,.- rC D 3 , (0<D<2hk) [5]16
V,, r = Jr 03 , (0 < D < 2h,. ) [6]12
NASA/TM-- 1999-209178 4
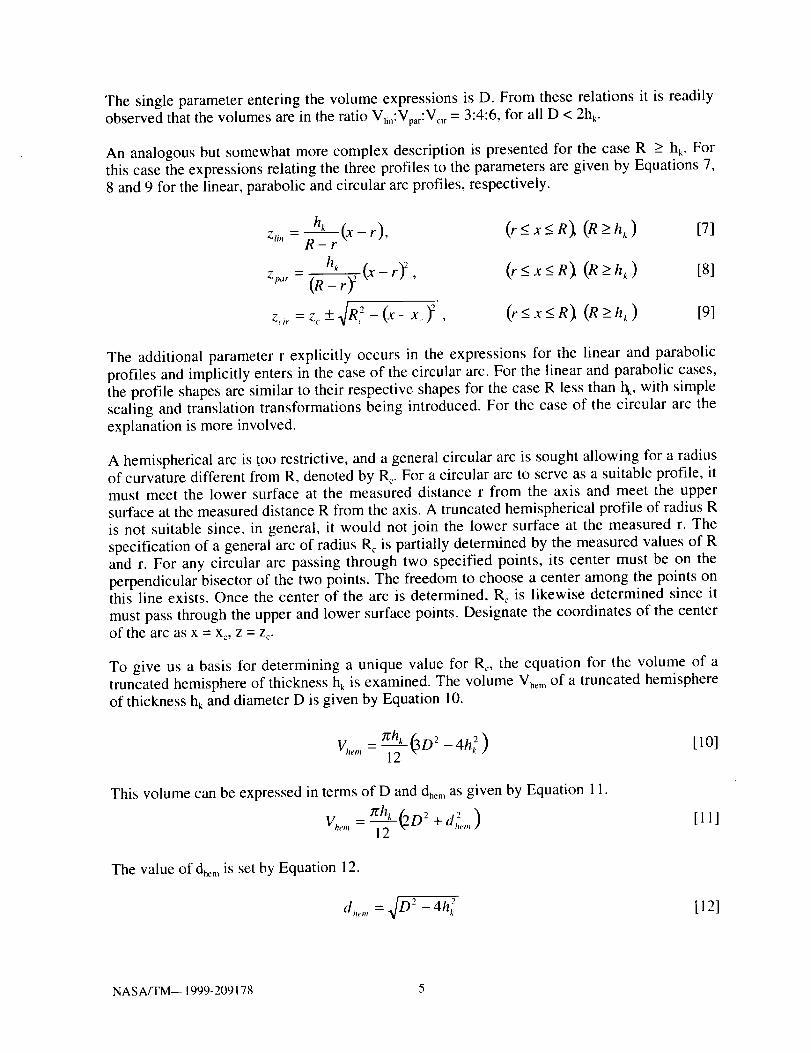
The single parameter entering the volume expressions is D. From these relations it is readily
observed that the volumes are in the ratio V_o:Vvar:Vc, r = 3:4:6, for all D < 2hk.
An analogous but somewhat more complex description is presented for the case R > hk. For
this case the expressions relating the three profiles to the parameters are given by Equations 7,
8 and 9 for the linear, parabolic and circular arc profiles, respectively.
hk (x-r), (r<x<R) (R>h_) [7]Z Im -- -- --R-r
_ hk
z,,or (R-ry (x-ry, (r<x<R) (R>h,) [8]
Z,ir=Z_+_/R_-(x-x y, (r<x<R) (R>h,) [91
The additional parameter r explicitly occurs in the expressions for the linear and parabolic
profiles and implicitly enters in the case of the circular arc. For the linear and parabolic cases,
the profile shapes are similar to their respective shapes for the case R less than Ilk, with simple
scaling and translation transformations being introduced. For the case of the circular arc the
explanation is more involved.
A hemispherical arc is 1;oo restrictive, and a general circular arc is sought allowing for a radius
of curvature different from R, denoted by R,.. For a circular arc to serve as a suitable profile, it
must meet the lower surface at the measured distance r from the axis and meet the uppersurface at the measured distance R from the axis. A truncated hemispherical profile of radius R
is not suitable since, in general, it would not join the lower surface at the measured r. The
specification of a general arc of radius R,. is partially determined by the measured values of R
and r. For any circular arc passing through two specified points, its center must be on the
perpendicular bisector of the two points. The freedom to choose a center among the points on
this line exists. Once the center of the arc is determined, Rc is likewise determined since it
must pass through the upper and lower surface points. Designate the coordinates of the center
of the arc as x = xc, z = zc.
To give us a basis for determining a unique value for Re, the equation for the volume of a
truncated hemisphere of thickness hk is examined. The volume Vhem of a truncated hemisphere
of thickness hk and diameter D is given by Equation 10.
Vhe,, = _-2k (3D: - 4h_2 ) [10]
This volume can be expressed in terms of D and dhemas given by Equation 11.
Vhe,,, = ;rt'hk(202 d 2+ )12 -- h,_,,,
[11]
The value of dhemis set by Equation 12.
d_,_,,,= 4D2 - 4h_ [12]
NASA/TM--1999-209178 5
Equation 11 is also valid for volumes Vci r generated by circular arcs obtained when general d,
not restricted by Equation 12, are substituted for dhe m. For the case of d satisfying the range
given by 0 < d < dhem, the volumes are such that Vc_r< Vhem; for the case of d in the range dhe m <
d < D, the volumes reverse order such that Vci, > Vhem. Thus, we establish a unique volume
corresponding to our measured values D and d. To obtain the profile for this arc, its radius R_is needed. This value is determined through an iteration process.
The iteration begins by selecting a preliminary value of R_. Next, values for x_ and z_ are
obtained that are consistent with the equation for a circle given by Equation 9, for x = r and x =
R. This establishes a preliminary arc. The volume contained by the surface of revolution is
calculated numerically and compared to the value Vc_r obtained from Equation 11 using themeasured d in place of _¢m. If the values agree within some specified tolerance, the arc is
acceptable, otherwise, the iteration cycle is repeated, starting with a new value for R_.
Equations 13, 14 and 15 give the volumes for the linear, parabolic and circular arc profiles just
discussed for the case R > h k .
V..-Trhk(DZ+Dd+d2), (D > 2hk) [13]12
lrh_ (_D 4 -4D3d + d 4 ), (D >_2h k ) [14]Vt"r - 24(D _ d y
V, ir-'ch"_.D2+d2), (O >2h,) [15]12
The two parameters D and d determine the volume for the three profile types. However, thereis one more situation involving cavity evolution that must be considered. This situation exists
when the cavity has reached the lower coating but the lower cavity diameter d is too small to
be measured. In this instance for the case R > hk, Equation 16 is used for either a linear or
parabolic profile, or Equation 12 for a circular arc profile to provide a value for d as requiredin the Equations 13, 14 and 15.
d = D-2h k [16]
Similarly, r as determined by the appropriate Equation 12 or 16 is substituted in the Equations
7, 8 and 9 for the profiles. The effect of the above is to smoothly extend the profile description
for the case R less than hk to cover the transition zone, where R is greater than hk but d is not
measured. The profiles and .volumes for this transition zone are expressed by the followingequations:
=x+h -R"_'lin k
1z,,,. =--(x + hk - RY
hA
Z,i,. =It t - 4R 2 - x _-
(R-h, <x<R),(R>hk) [17]
(R-h k <_x<_R),(R>h,) [18]
(R-h e <-x<R),(R>hk) [19]
Tch k L _
V,,, = --1-2--_D"-6Dh k + 4h; ), (D _>2h k ) [20]
NASA/TM--1999-209178 6
Vpar _h_r= --_6D 2 -4Dh_ + 2h_-),
V,,r = lrh__._k(3D 2 _ 4hi ).12
(D > 2hk) [21]
(/9 _>2h k ) [22]
As can be seen, the only measured parameter is R or D in Equations 17 through 22.
Individual results are given in the light of mean results. The mean upper diameter, as averaged
over all cavity sites, was found to be 0.015 mm at the end of the first ashing period, growing to
a mean upper diameter of 0.069 mm by the end of the final ashing. Figure 4 shows the
evolution, denoted by the open diamond symbol, of the mean upper diameter with effective
fluence. The diameter is expressed directly in mm on the primary dependent axis and
expressed in normalized form as a ratio with hk on a secondary axis. A single-term power
curve, illustrated by the solid line in this figure, approximates the data quite well as
represented by the following function of fluence
D = oF". [23]
Here, D represents the mean upper diameter, expressed in mm, c is a numerical coefficient
depending on employed units, n is a real-valued exponent and F is the fluence (atoms/cm2).
The exponent value obtained by regression is n = 0.51. The advantage of the single-term power
curve over a polynomial curve lies in its interpretive quality, not in its predictive quality. For
instance, the value of the exponent n gives a good measure of the degree of linearity in thedata. For a polynomial, this judgement might be hard to reach by just looking at the formula.
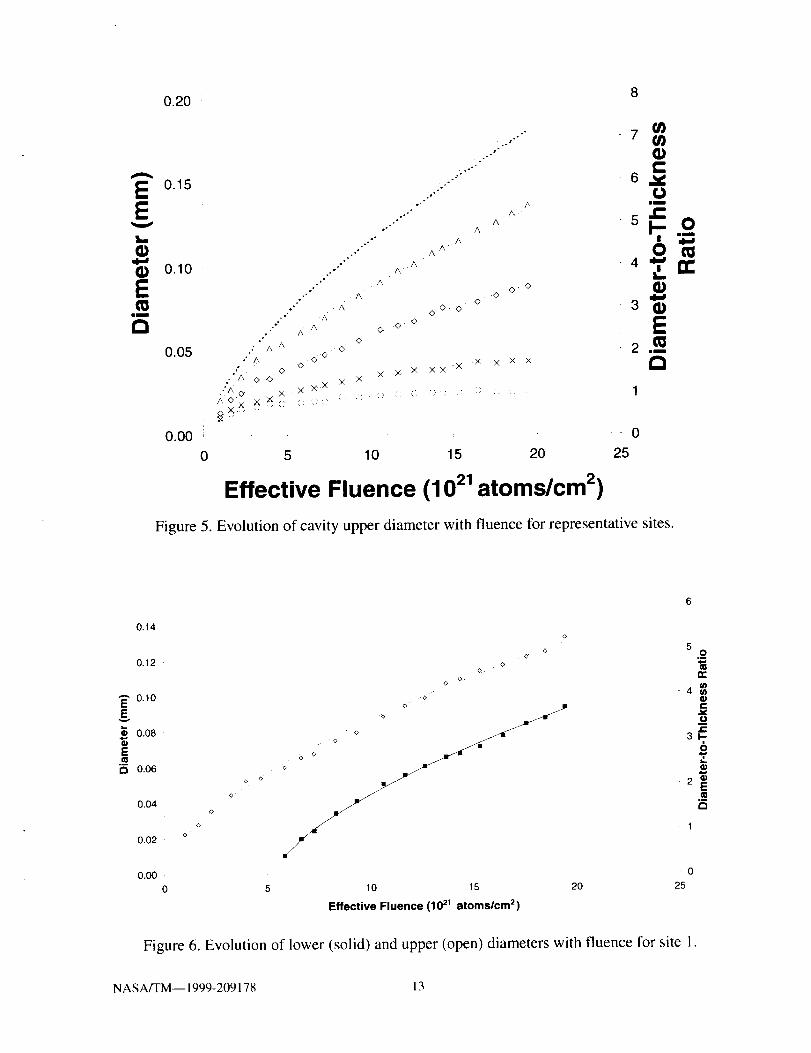
The form of diameter growth as given by Equation 23 also gives a very satisfactory description
of the evolution of individual sites. The evolution of D is shown in Figure 5 for a
representative group of sites. As indicated by the curves, the growth of D is less than linear.The volume evolution cannot be determined from these curves alone. This is because the lower
diameter begins to evolve at values of D approximately equal to 2hk. An example is presented
in Figure 6 for site 1 illustrating the onset of measurable d. This figure includes evolution of
the cavity's lower diameter as well as its upper diameter. The value of the exponent returnedby regression for the upper diameter is n = 0.61 for site 1. The lower diameter is also
adequately represented in a form similar to Equation 23, but with fluence adjusted by a
constant term representing the amount of fluence, Fo, required for the lower diameter to beginevolving. The corresponding form of evolution of the lower diameter, d, is given by
d = c(F - F _. [24]
The regression value for the lower diameter's exponent is n = 0.65, with Fo = 5.4 for this site.
The value assigned to Fo is determined by iteration, based on a measure of correlation with the
data. For this example, the exponent n obtains a higher value for the lower-diameter curve than
for the upper-diameter curve, indicative that the lower diameter is expanding at a higher ratethan the upper one. This result held for all other sites that grew to reach the lower coating. This
evolvement is as expected if one believes, for example, that cavity shape tends to the shape of
a cylinder at very large diameter. Figure 7 shows the profile of the circular-arc model at
various stages in the evolution of site 1. In Figure 8 profiles for the three model types are
shown pertaining to three stages of evolution for this site. As the evolution proceeds, the
NASAFFM-- 1999-209178 7
parabolic-arcprofile expandslaterallyatthecavity's lowerregionat afasterratethantheothertwo profiles.Forthe last two stagesshown,it extendsbeyondthecircular-arc'sprofile nearthelower coating,while remainingwithin thecircular-arc'sprofile neartheuppercoating.
The extentcavity walls becomesteepercanbe seenby plotting the differencebetweenthemeasuredupperand lower radii, R-r, over the evolution period. It is convenientto presentresultsin termsof Kaptonthicknesswheredistanceis normalizedby hk.Figure 9 showstheradius-difference-to-Kapton-thicknessratio as a function of the upper-radius-to-Kapton-thicknessratio for all theappropriatesites.Themeasureddataarepresentedasopendiamonds.The solid curve, which beginsat a ratio of one anddecreasesmonotonically,describesthecurve correspondingto a hemisphericalprofile shape.The dottedcurve representsa modelapproximatingthe variationof radiusdifference.Theinitial sectionof theplot, R/hklessthanone, is the region where the lower boundary has not been reached,and wall slopes areindeterminate.Consequently,with r definedaszeroin this region, thedatavary directly withR. As growth continues,the radius-difference-to-thicknessratio continuesto increase,until rbecomesmeasurableandincreasesfasterthanR, at whichpoint themeasuredradiusdifferencedecreasesabruptly.Thischangeis seento occurat valuesof R/hkslightly greaterthanone.Forvaluesof R/hkof about 1.25and greater,the radiusdifferenceremainsnearlyconstant,suchthat theradius-difference-to-thicknessratio, (R-r)/hk,is about0.75.Thus,at largeR-valuesthecavity wall appearsto erodelaterallywith constantmeanslope,hk/(R-r),approximatelyequalto 1.3.It is clearthat ahemisphericalprofileproducesa wall too steepto adequatelymatchthedata for radius-to-thicknessratiosgreaterthanabout 1.5.A more realistic descriptionof thevariationof radiusgapis givenby thedottedcurve.Theinitial point for the slantedportion ofthe dottedcurvecorrespondsto a valueof onefor bothr andR. This positioningof the curveisconservativeon thelow side,andapositioningof asmuchas10percenthigherseemsjustifiable.
It is reasonableto concludefrom the abovethat a cavity expandsasfastor somewhatfasterlaterally,at leastneartheuppercoating,thanit expandsvertically.Theabruptdeclinein radiusgap at radius-to-thicknessratios near 1.25may bedue to an erosionprocesswherebya thinlayer of polymer adjacentto the lower coating is removedfairly rapidly, acceleratingtheincreasein r comparedto theincreasein Roccurringat theuppercoating.Oncethis thincrustis depleted,thecavityexpandslaterallywith erosiondistributeduniformly alongthewall.
As givenabove,theequationsfor theprofilesandvolumeshavedifferent forms for thecaseRless thanhkascomparedto thecasewhereR is greaterthanor equalto hk.It is reasonabletoexaminehow thisdifferenceis manifestedin termsof curvefitting. From theexampleof site 1given in Figure6, it appearsthatD increasesfairly smoothlywith fluenceasevidencedby thecomparisonto the fitted regressionline. However, we canconsiderthe uppercurve astwosectionsjoined at R/hkequalto one,roughlyat Fo=5.4.Motivated by the knowledgethat thefunctionalform of theprofile changes,theuppercurve is fitted by regressionseparatelyfor thetwo sections.Sectionalizedregressionof theupper-diameterevolutionof site4 is illustratedinFigure 10,where the dotted lines representthe regressioncurves for each upper-diametersection.The evolution of d is also included, representedby solid symbols. For this site,regressiongives n=0.53 for the lower fluence section and n=0.66 for the higher fluencesection.For the six largestsites,theaveragedifferencein valuesof n betweenthe two uppersectionsis 0.15, with the highervalueobtainedfor thehigher fluencesection.This observedchangein the exponentvalue at R=I is consistentwith the modelequationsfor caseswherevolumeevolvessmoothlywith respectto fluence.
NASA/TM--1999-209178 8
By examining Equations 6 and 15 for the circular model, it is seen that D varies as the one-
third power of the volume for R less than hk and as the one-half power for R much greater than
hk. The latter result represents the variation of the diameter of a cylinder as a function of its
volume. It can be derived formally from the model equations by obtaining the limiting form of
V as a function of D as d approaches D, and then expressing D in terms of V. For a volumeevolution in which V varies as a constant power of F, it follows that D, when expressed by
Equation 23, has a larger exponent value for the higher fluence section as compared to thevalue for the lower fluence section. However, the exact increase in n as R increases is
complicated by terms containing d whose precise variation is unknown.
To examine the volume evolution, the volume is described as a function of fluence in a form
given by Equation 25, which is of the same form as Equation 23.
V = bF" [25]
This form was fitted by regression using values of volume obtained from the geometric
models. The regression was performed after transforming Equation 25 into the linear form
given by Equation 26.
V_, = b_,F [26]
The exponent values, m, which differ according to site, were determined by iteration.
Figure 11 shows a comparison between the measured volume evolution and predicted volumeevolution for several sites using the circular-arc profile model. The volume is expressed in
dimensional units on the primary dependent axis, and expressed as a ratio given by the site-
volume-to-unit-hemisphere-volume, where the unit-hemisphere's radius equals hk, on a
secondary axis. For instance, using the secondary measure, a hemispherical cavity of radius hkhas a volume ratio of one. It can be seen from the figure that the final volume for the largest
site shown is approximately 9 unit-hemispheres. The sites maintain a constant relative volume
ranking with fluence. It was found that the evolution of all sites is represented very
satisfactorily by an equation of the form given by Equation 25. In general, the regression
exponent for the power-law curves increases with increasing value of the final volume. To give
a representation of this variation, the site-distribution of m is presented as a function of thefinal site volume in Figure 12. In this figure m is shown as a function of the final-site-volume-
to-average-final-site-volume ratio using a log scale. The average final site volume is1.0xl0 4 mm 3 (3.0 unit hemisphere) and the largest site volume measured is 5.9x10 4 mm 3
(17.2 unit hemisphere).
Use of the linear and parabolic models produced similar evolution results as compared to the
circular-arc profile case. Figure 13 shows comparisons between the predicted volumeevolution for all three models for selected sites. The predicted volume for the parabolic modelremains between the volume of the linear model and the volume of the circular-arc model at all
fluence levels. For larger cavities, the difference in volume between the parabolic and circular-
arc cases is very slight at higher fluence levels, whereas, the difference in volume between thelinear and circular-arc volumes remains relatively constant. For smaller sites the three models
give the same values of m. For larger sites, the linear and parabolic models produce evolutions
resulting in somewhat higher values of exponent m compared to the circular-arc model. This isbecause the volume ratios for the linear, parabolic and circular-arc models start at 3:4:6,
respectively, and approach one at higher fluence. This geometric effect accordingly determines
NAS A/TM-- 1999-209178 9
the volume evolution for the three models. Compared to the circular-arc model, the other two
models lag early, then play "catch-up" later.
5. SUMMARY AND CONCLUSIONS
Cavity evolution occurring in protected Kapton, exposed to an effective fluence of about
2x10 22 atoms/cm 2 in a plasma asher, was investigated. The growth of numerous cavities
occurring underneath pin-window defects in the exposed upper protective coating was
monitored by recording cavity diameters using microscopy. Three geometric models were used
to estimate cavity volume. These models calculate volumes based on cavity diameters
measured adjacent to the upper protective coating and the lower coating.
Cavity diameters were seen to vary smoothly, but less than linearly, as a function of fluence.
The evolution of the upper and lower diameters can be fitted satisfactorily by a set of simple
fluence power-law curves. For large cavities the upper diameter was split into two sections for
regression, corresponding to the associated variation in the geometric model with cavity
diameter. The exponent obtained for the larger diameter section is generally greater than that
of the smaller diameter section. It was found that a typical wall for a large cavity has a slope
that is approximately 1.3. The corresponding site volumes were seen to evolve smoothly with
fluence. It was found that site volume is fitted satisfactorily using simple fluence power-law
curves. The sites maintained their volume ranking. Sites that were initially small compared tothe average site remained relatively small as they evolved, etc. The volumes of the smaller-
volume sites increased less than linearly, whereas, the volumes of larger-volume sites
increased greater than linearly with fluence.
6. REFERENCES
1. B. A. Banks, B. M. Auer, S. K. Rutledge, and C. M. Hill, "Atomic Interaction with SolarArray Blankets at Protective Coating Defect Sites," presented at the 4 'h Annual
Workshop on Space Operations, Automation and Robotics (SOAR 90), NM, June 1990.
2. B. A. Banks, S. K. Rutledge, K. K. de Groh, B. M. Auer, and C. M. Hill "Atomic Oxygen
Protective Coatings," presented at the NATO Advanced Study Institute Conference,Pitlochry, Scotland, July 1991.
3. B. A. Banks, K. K. de Groh, S. K. Rutledge, and F. DiFilippo, "Prediction of In-space
Durability of Protected Polymers Based on Ground Laboratory Energy AtomicOxygen," NASA Technical Memorandum TM 107209, 1996.
4. B. A. Banks, T. J. Stueber, S. A. Snyder, S. K. Rutledge, and M. J. Norris, "Atomic Oxygen
Erosion Phenomena," presented at the American Institute of Aeronautics and
Astronautics Defense and Space Programs Conference, Alabama, September 1997.
NAS A/TM--1999-209178 10
eSite 9
-0B
,¢
e
100 micrometer
Figure 1. Image of concentric silhouettes of site 9.
25
15
--I
,'7"
O
0 200 400 600 800 1000 1200
Time (hours)
Figure 2. Effective fluence dependence on ashing time.
14O0
NASA/TM-- 1999-209178 I I
< •
D = 2R
I
d
, I
'\< ] / I1 <)
\\...
<
(a)
PARA2OLIC CIRCULAR
D : :_.TR
• oo
•, / i
, 'u / ,,,\
' /i -
X
d = 2r
",
i._ <
I /
Figure 3.
(b)
Illustration of the three profile models and the coordinate systems used for the two
evolution regimes: (a) R<hk and (b) R->hk.
A 0.07E_ 0.06
L_
0.05
0_ 0.04m
in
0.03i,m
Q. 0.02Q.
0.01
0.00
3.0
0 5 10 15 20
Effective Fluence (1021 atoms/cm a)
Figure 4.
NASAFFM-- 1999-209178
2.5 g
2.o .om
0
0.5 _,_
0.0
25
Evolution of mean cavity upper diameter with fluence.
12
0.20
E 0.15
E
0.10
im
0.05
t •
oo
°°
.°° •
.• ,A
. o.-" -A
0o A
, A A ....
'° 0
°
°t _ o l°°
.°°
• o°°
°o*
"'" A
.-"" A*° A
°• /X
.-" A _._*; A
AA'
A O
<>
OO
<> O
©-
0.00
0 25
,X X X X
.'_ _o x x x ×. x xx 'x•':)" c_ x x x ,×
A ©X .K _ :1) ::: :' :1) ( _: :: ;:: ': i :: : t 1
_x .....
5 10 15 20
Effective Fluence (10 21atoms/cm 2)
t_7 t,_
C6_
0
.£
3
E2 _
im
0
Figure 5. Evolution of cavity upper diameter with fluence for representative sites.
0.14
0.12
"-" 0.10EE
0.08
E'_ 0.06
O
0.04O
0.02
0.00
0
<3
O
O. O
O
O. O •
, 00.-
0
C;
• O O -b " _
00
/5 10 15 20
Effective Fluence (1021 atoms/era 2)
50
0=n-
4,1
.231-
6
O
a
o
25
Figure 6. Evolution of lower (solid) and upper (open) diameters with fluence for site 1.
NASA/TM-- 1999-209178 13
1
_-o
°_
"5
0
0
0.0
-" -1
0.5 1.0 1.5 2.0 2.5
Radia I-Distance-to-Ka pton-Th ickness Ratio
Figure 7. Circular-arc profiles at various stages of evolution for site 1.
3.0
.ur-
l....-
t.-
_o_
0
lin par cir
0
0
///i
/ /
/
//
//
//
i
/!
/ /
/, ' /
1 2 3
Rad la I-D istance-to- Kapton-Th Ickness Ratio
Figure 8. Comparison of the profile models at three stages of evolution for site 1.
1.2
2 1.oa.
,v o
6=_ 0.8
0
g_, 0.6
_J:: 0.4
-I
m 0.2
0.0 '
/o
I
/o
o_4_, ° 4_ °
', "'_.__:o oooo_ o, o_..._._._ _s_ oo-._-4..._.,>_._ ......o.._..._............ .:.,>.. _....
y o . o_ '_ _%0 o\
0.0 0.5 1.0 1.5 2.0 2.5 3.0 3,5 4.0
Upper-Radius-to-Kapton-Thickness Ratio
Figure 9. Radius difference dependence upon upper diameter for the following: (1) data (open
diamond), (2) truncated hemisphere (line), and (3) reasonable model (dotted).
NASA/TM-- 1999-209178 14
4.5
4.0O
.m
m
er 3.5O}
0
._ 3,0
.2
2.5CoKm 2.0
6L 1.5
E 1.o°ma
0.5
o.o
..6
n .,
n.,-
., "r_
T I
5 10 15 20 25
Effective Fluence, 1021 atoms/era 2
Figure 10. Evolution of upper (open) and lower (solid) cavity diameters for site 4 withfluence, showing for comparison the sectionalized regression curves (dotted) of upper diameter
growth and the regression curve (solid) for lower diameter growth.
10
3.0
2.5
EE
2.0
o
1.5
91.0
0.5
0.0
o
o x
0 5 10 15 20
Effective Fluence (1021atoms/crn 2)
4
3
2
- 1
i1o
25
7
Q,,
6 "g:I)
5 ..,c
I1E
Figure 11. Comparison of the dependence of measured volume evolution (open symbols) upon
fluence using the circular-arc model with the dependence of power-law volume evolution
(solid curves) upon fluence for representative sites.
NASA/TM-- 1999-209178 15
2.0 ....
E
r-G)C0Q.X
UJ
3:m
4)
oa.
1.5
1.0
0.5
0.0
4 °
4
0.0
Figure 12.
0.1 1.0 10.0
FinaI-Site-Volume-to-Average-FinaI-Site-Volume Ratio
Dependence of the power-law exponent, m, upon final relative cavity volume.
5
E
"t 4o
...... Lin ........ Par Cir
20
A
,.¢'/' 15 r-,/" I_,
J, .s o_
. " E
• ' ¢" tm• " 4"*""" ,y ,- 10_) . . on
E 3 ,.'","" . ("
E2 ...-._,," ----_3.--"
1 . ._,. , .......
0 " ,,,,..,a_-'" _-,_,_--.-._.-_-_=-_--_-.._--':-'::.'.'=:- .................. . 0
0 5 10 15 20 25
Effective Fluence (10 21 atoms/cm 2 )
Figure 13. Comparison of power-law volume evolution with fluence among the three model
types: linear (broken), parabolic (dotted), and circular (solid) for representative sites.
NASA/TM-- 1999-209178 16
Form ApprovedREPORT DOCUMENTATION PAGEOMB No. 0704-0188
Public reporting burden for this collection of information is estimated to average 1 hour per response, including the time for reviewing instructions, searching existing data sources,
gathering and maintaining the data needed, and completing and reviewing the collection of information Send comments regarding this burden estimate or any other aspect of this
collection of information, including suggestions for reducing this burden, to Washington Headquarters Services, Directorale for Informalion Operations and Reports, 1215 Jefferson
Davis Highway, Suite 1204, Arlington, VA 22202-4302, and to the Office of Management and Budget, Paperwork Reduction Proiect 10704-0188), Washington, DC 205,03.
1. AGENCY USE ONLY (Leave blank) 2. REPORT DATE 3. REPORT TYPE AND DATES COVERED
May 1999 Technical Memorandum
5. FUNDING NUMBERS4. TITLE AND SUBTITLE
Investigation Of Atomic Oxygen Erosion Of Polyimide Kapton H Exposed
To A Plasma Asher Environment
6. AUTHOR(St
Aaron Snyder
7. PERFORMING ORGANIZATION NAME(S) AND ADDRESS(ES)
National Aeronautics and Space Administration
John H. Glenn Research Center at Lewis Field
Cleveland, Ohio 44135-3191
9. SPONSORING/MONITORING AGENCY NAME(S) AND ADDRESS(ES)
National Aeronautics and Space Adminiswalion
Washington, DC 20546-0001
WU-632-1A-I E--O0
8. PERFORMING ORGANIZATION
REPORT NUMBER
E-il687
10. SPONSORING/MONITORING
AGENCY REPORT NUMBER
NASA TM--1999-209178
11. SUPPLEMENTARY NOTES
Prepared for the 44th International SAMPE Symposium and Exhibit sponsored by the Society for the Advancement of
Material and Process Engineering, Long Beach, California, May 23-27, 1999. Responsible person, Aaron Snyder,
organization code 5480, (216) 433-5918.
12a. DISTRIBUTION/AVAILABILITY STATEMENT
Unclassified - Unlimited
Subject Categories: 27 and 18 Distribution: Nonstandard
This publication is available from the NASA Center for AeroSpace Information, (301) 621-0390.!
12b. DISTRIBUTION CODE
13. ABSTRACT (Maximum 200 words)
Experimental results are presented on the erosion characteristics of the polyimide Kapton H, which serves as a blanket ma-
terial in solar arrays. This polymer has a number of characteristics that make it a suitable choice for both terrestrial and space
applications. In this paper attention is focused on the durability of protected Kapton when exposed to atomic oxygen (AO)
in a plasma asher. A strip of 0.025-ram thick Kapton film, coated on both sides with Side, was studied during a 1306 hour
exposure. The erosion, located at defect sites in tbe protective coating and measured optically, is described in terms of volume
loss as a function ofAO fluence. Three simple geometric profiles are used to generate a useful array of cavity shapes to model
erosion evolution. These models connect the volume erosion rate to the observed lateral expansion of the developing cavities
via their diameters, measured adjacent to the upper and lower protective film, and fitted by least-squares regression to simple
power law functions of fluence. The rationale lot the choice of models is discussed. It was found that lateral growth in cavity
size evolves less than linearly with fiuence.
14, SUBJECT TERMS
Oxygen atoms; Protective Coatings: Erosion
17. SECURITY CLASSIFICATIONOF REPORT
Unclassified
18. SECURITY CLASSIFICATIONOF THIS PAGE
Unclassified
19. SECURITY CLASSIFICATIONOF ABSTRACT
Unclassified
15. NUMBER OF PAGES
2216. PRICE CODE
A0320. LIMITATION OF ABSTRACT
NSN 7540-01-280-5500 Standard Form 298 (Rev. 2-89)
Prescribed by ANSI Std. Z39-1 8298-102