Embed Size (px)
Citation preview
Investigation of Fuel Chemistry and Bed Performance
in a Fluidized Bed Black Liquor Steam Reformer
Annual Topical Report – Year 1
Reporting Period Start Date: 09/30/2002 Reporting Period End Date: 09/30/2003
Kevin Whitty
University of Utah
Issue Date: December 2003
DOE Cooperative Agreement DE-FC26-02NT41490
Prime (submitting) Organization: University of Utah 1471 East Federal Way Salt Lake City, UT 84102 Project Subcontractors: Brigham Young University Reaction Engineering International A-261 ASB 77 West 200 South, Suite 210 Provo, UT 84602 Salt Lake City, UT 84101 University of Maine Georgia Tech Research Corp 5717 Corbett Hall 505 Tenth Street, NW Orono, ME 04469 Atlanta, GA 30318
DISCLAIMER
This report was prepared as an account of work sponsored by an agency of the United States Government. Neither the United States Government nor any agency thereof, nor any of their employees, makes any warranty, express or implied, or assumes any legal liability or responsibility for the accuracy, completeness, or usefulness of any information, apparatus, product, or process disclosed, or represents that its use would not infringe privately owned rights. Reference herein to any specific commercial product, process, or service by trade name, trademark, manufacturer, or otherwise does not necessarily constitute or imply its endorsement, recommendation, or favoring by the United States Government or any agency thereof. The views and opinions of authors expressed herein do not necessarily state or reflect those of the United States Government or any agency thereof.

i
EXECUTIVE SUMMARY (ABSTRACT)
The University of Utah project "Investigation of Fuel Chemistry and Bed Performance in a Fluidized Bed Black Liquor Steam Reformer" (DOE award number DE-FC26-02NT41490) was developed in response to a solicitation for projects to provide technical support for black liquor and biomass gasification. The primary focus of the project is to provide support for a DOE-sponsored demonstration of MTCI's black liquor steam reforming technology at Georgia-Pacific's paper mill in Big Island, Virginia. A more overarching goal is to improve the understanding of phenomena that take place during low temperature black liquor gasification. This is achieved through five complementary technical tasks: (1) construction of a fluidized bed black liquor gasification test system, (2) investigation of bed performance, (3) evaluation of product gas quality, (4) black liquor conversion analysis and modeling and (5) computational modeling of the Big Island gasifier.
Four experimental devices have been constructed under this project. The largest facility, which is the heart of the experimental effort, is a pressurized fluidized bed gasification test system. The system is designed to be able to reproduce conditions near the black liquor injectors in the Big Island steam reformer, so the behavior of black liquor pyrolysis and char gasification can be quantified in a representative environment. The gasification test system comprises five subsystems: steam generation and superheating, black liquor feed, fluidized bed reactor, afterburner for syngas combustion and a flue gas cooler/condenser. The three-story system is located at University of Utah's Industrial Combustion and Gasification Research Facility, and all resources there are available to support the research.
A small-scale fluidized bed agglomeration test reactor has been built at Brigham Young University. The reactor is 0.15 meter square, can be heated, and has high temperature glass walls for viewing fluidization. This system will be used to identify agglomeration propensity of different compositions of bed material as a function of temperature. This information will help determine the upper limit of the operating temperature window for low temperature black liquor gasification processes.
A single particle reactor has been built at University of Utah for investigation of black liquor pyrolysis behavior and generation of char for analysis. The fundamental data from this system will augment performance information obtained in the gasification test system, and will be incorporated into computational models to describe liquor conversion.
An acrylic cold flow model of the Utah gasification test system has been constructed as an aid for system design and performance evaluation. The model is a two-thirds scale replica of the real system that has been accurately designed to replicate the behavior of the hot, steam-blown system with cold air. In addition to providing qualitative insight into the behavior of the fluidized bed, the cold flow system is used as a tool for quantifying gas and solid flow behavior. This information is used in development and validation of the computational models.
ii
Two computational models of a fluidized bed gasifier have been developed under this program. The first, the "UU model," is a user-friendly, Excel-based program that takes only a few inputs and makes several simplifying assumptions to determine gas compositions and flow rates throughout the bed. This model is useful for quickly estimating conditions and identifying the impact of changes in process variables on the performance of the system. The second, more advanced model developed by Reaction Engineering International (the REI model), considers three phases within the bed (dense, bubble and wake) and takes backmixing of solids into account. Bubble hydrodynamics (size, velocity, splitting and coalescence) are also taken into consideration. The model calculates mass and energy balances of the system and uses drying and devolatilization rates and reaction kinetics to determine the local chemistry of the system, overall conversion and gas composition throughout the bed and freeboard.
Results from the cold flow reactor and computational modeling of the Utah gasifier indicate that slugging will not be a problem in that system; the horizontal heating tubes within the bed break up the bubbles so they cannot grow large enough to produce bubble slugs. Bubbles do not seem to bypass the tube bundles, which was a concern, but the degree to which they pass through the core of the tube bundles has yet to be established. As in a fluidized bed without in-bed tubes, solids do circulate downwards against the walls in the region below the heaters; solids circulation patterns in the center and upper regions of the bed are less obvious. The observations for the Utah gasifier are not necessarily applicable to the full scale system.
Computational modeling of the Big Island steam reformer indicates that organic carbon conversion will be on the order of 98.7%, and that the solids removed from the bed will contain approximately 1.5% unreacted carbon. Conversion and carbon concentration in the bed are relatively sensitive to the char gasification rate, which in turn is sensitive to temperature. A 20°C decrease in bed temperature approximately halves the gasification rate and reduces carbon conversion by 1-1.5%.
As gas in the Big Island system flows upwards from the distributor, its velocity nearly quadruples over the height of the bed. The velocity approximately doubles near the liquor injectors when water in the liquor turns to steam and volatiles released during pyrolysis are added to the gas phase. Further increases result from addition of gas-phase products of heterogeneous gasification and decreasing pressure higher in the bed. Bubbles formed in the lower part of the bed grow to approximately 0.45 meters (18 inches) before encountering the heater bundles. Within the bundles the bubble size does not exceed 30 millimeters (1.2 inches). Above the tube bundles the bubbles coalesce and grow to an average of 0.7 meters (28 inches) by the time they reach the surface of the bed.
The composition of the gas shifts as it travels through the reactor, with steam concentration decreasing and concentrations of hydrogen and carbon monoxide increasing as carbon is converted. The gas does not come to equilibrium in the bed; rather, water-gas shift and methane-steam reforming reactions occur in the freeboard. The final product gas from the reactor is near equilibrium, however. The final heating value (HHV) of the dry syngas is on the order of 9.3 MJ/m3 (250 Btu/scf).

iii
TABLE OF CONTENTS
Executive Summary ........................................................................................................................................................ i Table of Contents ..........................................................................................................................................................iii Table of Figures ............................................................................................................................................................ iv 1. Introduction ............................................................................................................................................................ 1 2. Experimental........................................................................................................................................................... 2
2.1 Fluidized Bed Black Liquor Gasification Test System ................................................................................. 2 2.1.1 Steam Feed System......................................................................................................................... 4 2.1.2 Black Liquor Feed System ............................................................................................................. 5 2.1.3 Fluidized Bed Reactor .................................................................................................................... 6 2.1.4 Solids Removal System.................................................................................................................. 9 2.1.5 Product Gas Handling System........................................................................................................ 9 2.1.6 Process Control System................................................................................................................ 10
2.2 Bed Agglomeration Test Reactor ................................................................................................................ 11 2.3 Single Droplet Reactor ................................................................................................................................ 13 2.4 Fluidized Bed Gasifier Cold-Flow Model................................................................................................... 14
3. Computational Models.......................................................................................................................................... 18 3.1 Generic Steam Reformer Model (UU Model)............................................................................................. 18
3.1.1 General Description...................................................................................................................... 18 3.1.2 Treatment of Chemistry and Liquor Conversion.......................................................................... 20 3.1.3 Level-by-Level Calculations ........................................................................................................ 21
3.2 Advanced Model of Entire Reactor (REI Model) ....................................................................................... 22 3.2.1 Bubble hydrodynamics ................................................................................................................. 23 3.2.2 Overall Gas Balances.................................................................................................................... 25 3.2.3 Species Mass Balances ................................................................................................................. 26 3.2.4 Exchange Coefficients.................................................................................................................. 27 3.2.5 Energy Balance............................................................................................................................. 27 3.2.6 Boundary Conditions.................................................................................................................... 28 3.2.7 Drying and Devolatilization of Black Liquor ............................................................................... 29 3.2.8 Gasification Kinetics .................................................................................................................... 30
4. Results and Discussion ......................................................................................................................................... 34 4.1 Results of Cold Flow Model Operation ...................................................................................................... 34 4.2 Computational Modeling Results................................................................................................................ 35
4.2.1 Modeling of Georgia-Pacific's Big Island Steam Reformer ......................................................... 35 4.2.2 Estimation of Jet Penetration Depth ............................................................................................. 44 4.2.3 Prediction of Temperature History for Cold-Flow Model ............................................................ 45
5. Conclusions .......................................................................................................................................................... 49 5.1 Research Tools ............................................................................................................................................ 49 5.2 Performance of the Utah Gasifier................................................................................................................ 50 5.3 Performance of a Full-Scale Steam Reformer............................................................................................. 50
Nomenclature............................................................................................................................................................... 52 References.................................................................................................................................................................... 54 Appendix A – P&IDs of Gasification Test System...............................................................................................A1-A4
Appendix B – Select Design Drawings of the Utah Gasification Test System Reactor........................................ B1-B8
iv
TABLE OF FIGURES
Figure 1. Schematic diagram of black liquor gasifier system. ................................................................................. 2 Figure 2. 3-D model of the University of Utah black liquor gasification test system. ............................................. 3 Figure 3. 9.5-HP boiler for the gasification system. ................................................................................................ 4 Figure 4. Steam superheater and split view of same ................................................................................................ 5 Figure 5. Distributor section and split view of same................................................................................................ 6 Figure 6. Bed section of reactor and split view of same .......................................................................................... 7 Figure 7. Freeboard section of reactor, and split view of same................................................................................ 8 Figure 8. Afterburner and split view of same......................................................................................................... 10 Figure 9. Cooler/condenser and split view of same ............................................................................................... 11 Figure 10. Design and photograph of fluidized bed reactor for bed agglomeration studies..................................... 12 Figure 11. Brigham Young University's cold flow model ....................................................................................... 13 Figure 12. Rendering and photographs of the cold flow model .............................................................................. 16 Figure 13. Cold flow model distributor.................................................................................................................... 16 Figure 14. Tube section of cold flow model showing light source and detector probes. ......................................... 17 Figure 15. Screen shot of UU model interface......................................................................................................... 19 Figure 16. UU model prediction of average superficial and actual gas velocities in the Big Island reformer. ........ 37 Figure 17. UU model prediction of gas composition throughout the bed in the Big Island reformer...................... 38 Figure 18. Gas velocity and gas mass flow rate as functions of reactor height – REI model . ................................ 39 Figure 19. Variation of bubble properties with bed height – REI model ................................................................ 40 Figure 20. REI model predictions of gas and particle temperature as functions of reactor height........................... 40 Figure 21. Effect of black liquor gasification rate on carbon conversion and bed temperature. .............................. 42 Figure 22. Effect of black liquor gasification rate on heating value of syngas and carbon concentration .............. 42 Figure 23. Comparison of predicted syngas composition. ....................................................................................... 43 Figure 24. Variation of gas composition with reactor height................................................................................... 43 Figure 25. Predicted temperature history at the top of the cold flow model when hot solids are introduced .......... 47 Figure 26. Predicted temperature profile of particles for a "hot particle" experiment in the cold flow model. ....... 48
1
INVESTIGATION OF FUEL CHEMISTRY AND BED PERFORMANCE IN A FLUIDIZED BED BLACK LIQUOR STEAM REFORMER
1. INTRODUCTION
University of Utah's project entitled "Investigation of Fuel Chemistry and Bed Performance in a Fluidized Bed Black Liquor Steam Reformer" (DOE Cooperative Agreement DE-FC26-02NT41490) was developed in response to a solicitation released by the U.S. Department of Energy in December 2001, requesting proposals for projects targeted towards black liquor/biomass gasification technology support research and development. Specifically, the solicitation was seeking projects that would provide technical support for Department of Energy supported black liquor and biomass gasification demonstration projects under development at the time.
The primary objective of the project reported here is to provide technical support for the demonstration of MTCI's black liquor steam reforming process at Georgia-Pacific's paper mill in Big Island, Virginia. The project achieves this through the following technical tasks:
1. Construction of a fluidized bed black liquor gasification test system 2. Investigation of bed performance 2.1 Mapping of bed properties and chemistry 2.2 Evaluation of bed agglomeration propensity 2.3 Evaluation of titanate addition 3. Evaluation of product gas quality 3.1 Speciation of gaseous products 3.2 Characterization and destruction of tars 4. Black liquor conversion analysis and modeling 5. Modeling of the Big Island gasifier 5.1 1½-D model of entire reactor 5.2 3-D modeling of specific parts of the reactor
The project includes four subcontracts to groups that possess expertise in technical areas relevant to the project. These subcontractors and their corresponding roles within the project are:
1. Brigham Young University (Prof. Larry Baxter): bed agglomeration studies 2. University of Maine (Prof. Adriaan van Heiningen): conversion analysis and Ti addition 3. Georgia Institute of Technology (Prof. Pradeep Agrawal): catalytic destruction of tars 4. Reaction Engineering International (Dr. Adel Sarofim): gasifier modeling
This report describes the technical achievements of the first year of the project, describes the experimental equipment and computational modeling associated with the project and presents results and conclusions of the work.

Annual Report - Year 1 DE-FC26-02NT41490
2
2. EXPERIMENTAL The project has four primary experimental systems: a black liquor gasification test system, a bed agglomeration test reactor, a single particle reactor and a cold flow fluidized bed model. These systems are described in the sections that follow.
2.1 Fluidized Bed Black Liquor Gasification Test System
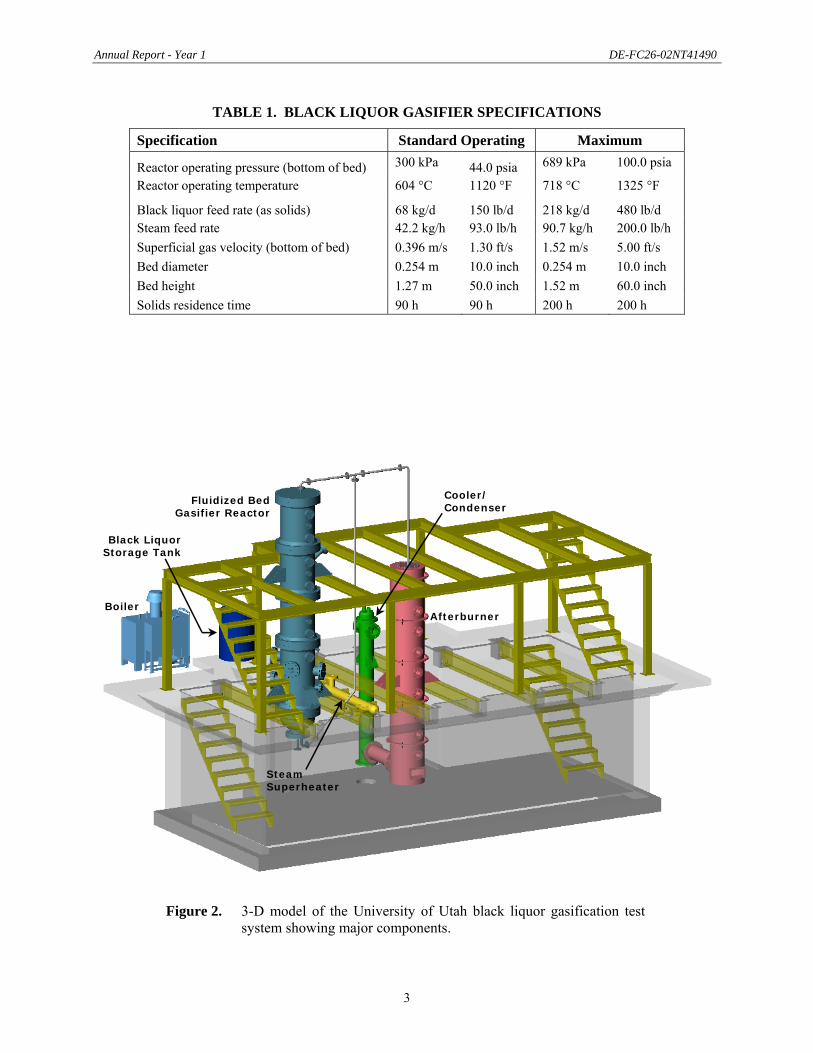
The University of Utah's pressurized fluidized bed black liquor gasification test system has been designed to simulate conditions in the bottom of Georgia-Pacific's Big Island demonstration system. Design specifications for the system are listed in Table 1.
A schematic diagram of the gasifier system is presented in Figure 1. A 3-D model showing the major components and their configuration is shown in Figure 2. The gasifier system includes five primary subsystems: (1) steam feed system, (2) black liquor feed system, (3) fluidized bed reactor, (4) solids removal system and (5) product gas (syngas) handling system. All these subsystems are necessary for the gasifier to operate. The whole system is driven by an integrated control system that monitors and controls critical process variables. The subsystems are described in detail in the sections that follow.
TITI
WaterFICFIC TICTIC
Compressed air
BL tank(heated)
Circ.pump
Eductor
Bedmaterial
PICPIC
Cyclones
TITI
TITI
TITI
PIPI
Product gas to eductorFIFI
TITI
FIFI
After-burner
Flue gas to facility's flue gas handling system,
SO2 scrubber
PIPI
TITI
FIFI
Pressure control valve
PIPI
TITI
Gas to analysis
Superheater
Freeboard
Bed heaters
TITI
TITI
TITI
CW CW
FICFIC
BoilerCond
AirNG
FIFI
TITI
PIPI
Meteringpump
Condensate
Cooler/condenser
TITI
TITI
Figure 1. Schematic diagram of black liquor gasifier system.
Annual Report - Year 1 DE-FC26-02NT41490
3
TABLE 1. BLACK LIQUOR GASIFIER SPECIFICATIONS
Specification Standard Operating Maximum
Reactor operating pressure (bottom of bed) 300 kPa 44.0 psia 689 kPa 100.0 psia
Reactor operating temperature 604 °C 1120 °F 718 °C 1325 °F
Black liquor feed rate (as solids) 68 kg/d 150 lb/d 218 kg/d 480 lb/d Steam feed rate 42.2 kg/h 93.0 lb/h 90.7 kg/h 200.0 lb/h Superficial gas velocity (bottom of bed) 0.396 m/s 1.30 ft/s 1.52 m/s 5.00 ft/s Bed diameter 0.254 m 10.0 inch 0.254 m 10.0 inch Bed height 1.27 m 50.0 inch 1.52 m 60.0 inch Solids residence time 90 h 90 h 200 h 200 h
Fluidized BedGasifier Reactor
BoilerAfterburner
Steam Superheater
Cooler/Condenser
Black LiquorStorage Tank
Figure 2. 3-D model of the University of Utah black liquor gasification test system showing major components.
Annual Report - Year 1 DE-FC26-02NT41490
4
2.1.1 Steam Feed System There are three main process units in the steam feed system: feedwater conditioner, steam generator (boiler) and steam superheater. The process and instrumentation diagram (P&ID) for the steam feed system is presented in Appendix A-1.
Feedwater conditioning. City water is brought into a water conditioning system comprising a water softener, reverse osmosis filtration system and activated carbon filter. The conditioning system removes particulates and dissolved minerals in the water, which ensures high quality steam, minimizes blowdown requirements and extends the life of the superheater.
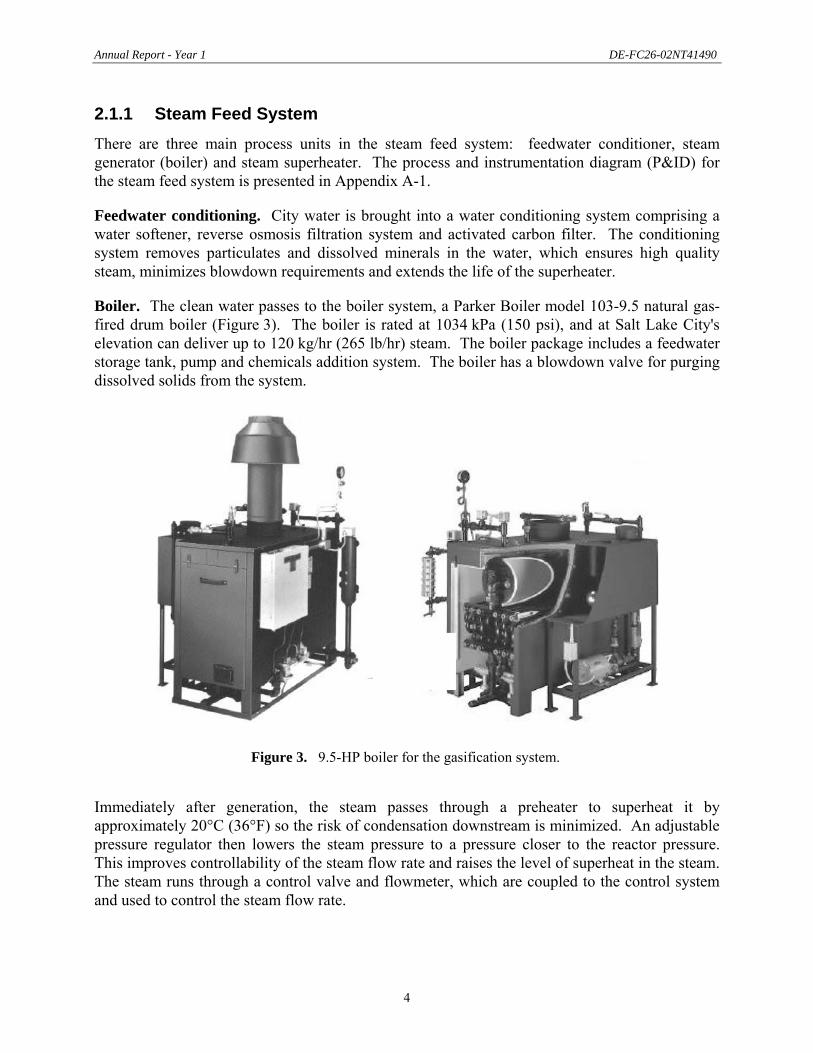
Boiler. The clean water passes to the boiler system, a Parker Boiler model 103-9.5 natural gas-fired drum boiler (Figure 3). The boiler is rated at 1034 kPa (150 psi), and at Salt Lake City's elevation can deliver up to 120 kg/hr (265 lb/hr) steam. The boiler package includes a feedwater storage tank, pump and chemicals addition system. The boiler has a blowdown valve for purging dissolved solids from the system.
Figure 3. 9.5-HP boiler for the gasification system.
Immediately after generation, the steam passes through a preheater to superheat it by approximately 20°C (36°F) so the risk of condensation downstream is minimized. An adjustable pressure regulator then lowers the steam pressure to a pressure closer to the reactor pressure. This improves controllability of the steam flow rate and raises the level of superheat in the steam. The steam runs through a control valve and flowmeter, which are coupled to the control system and used to control the steam flow rate.
Annual Report - Year 1 DE-FC26-02NT41490
5
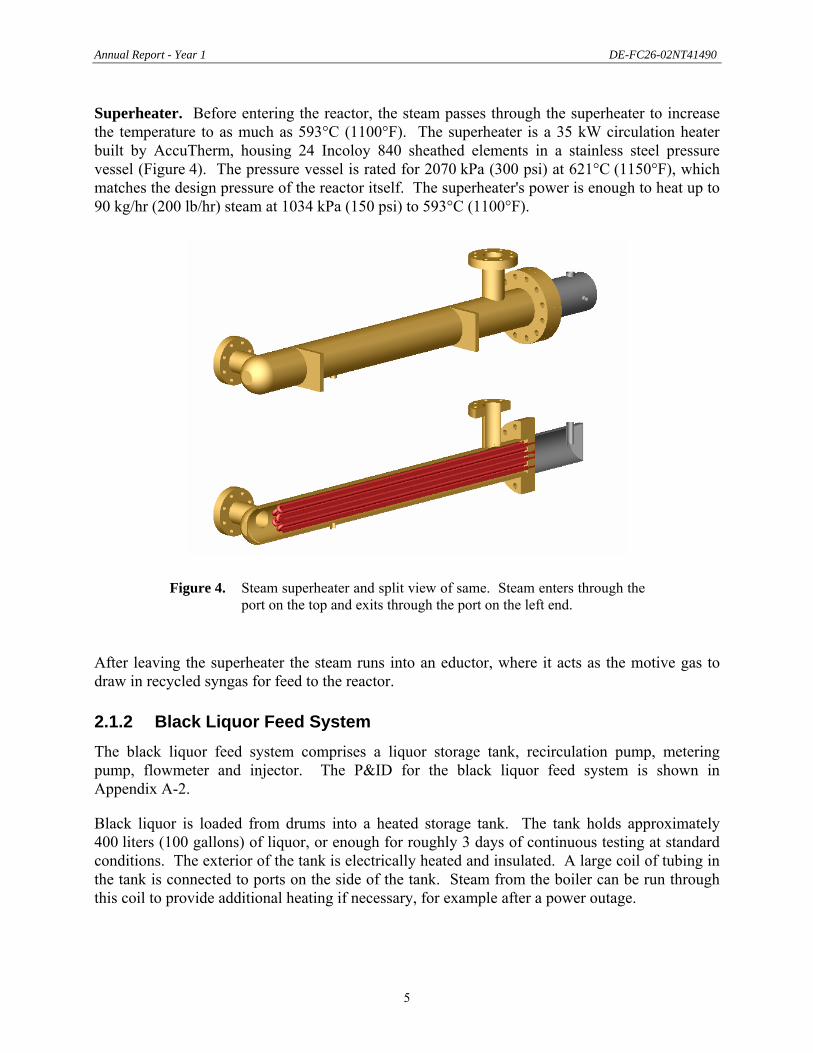
Superheater. Before entering the reactor, the steam passes through the superheater to increase the temperature to as much as 593°C (1100°F). The superheater is a 35 kW circulation heater built by AccuTherm, housing 24 Incoloy 840 sheathed elements in a stainless steel pressure vessel (Figure 4). The pressure vessel is rated for 2070 kPa (300 psi) at 621°C (1150°F), which matches the design pressure of the reactor itself. The superheater's power is enough to heat up to 90 kg/hr (200 lb/hr) steam at 1034 kPa (150 psi) to 593°C (1100°F).
Figure 4. Steam superheater and split view of same. Steam enters through the port on the top and exits through the port on the left end.
After leaving the superheater the steam runs into an eductor, where it acts as the motive gas to draw in recycled syngas for feed to the reactor.
2.1.2 Black Liquor Feed System The black liquor feed system comprises a liquor storage tank, recirculation pump, metering pump, flowmeter and injector. The P&ID for the black liquor feed system is shown in Appendix A-2.
Black liquor is loaded from drums into a heated storage tank. The tank holds approximately 400 liters (100 gallons) of liquor, or enough for roughly 3 days of continuous testing at standard conditions. The exterior of the tank is electrically heated and insulated. A large coil of tubing in the tank is connected to ports on the side of the tank. Steam from the boiler can be run through this coil to provide additional heating if necessary, for example after a power outage.
Annual Report - Year 1 DE-FC26-02NT41490
6
A positive displacement pump circulates black liquor from the tank outlet on the bottom back to the top of tank, which helps to mix the liquor. A high-pressure metering pump (FMI QV-Q1CSC) feeds the liquor to the injector at pressures up to 690 kPa (100 psi). The metering pump is calibrated using a graduated cylinder, and the flow rate can be confirmed with the flowmeter downstream of the pump. The liquor is fed to an injector near the bottom of the reactor.
2.1.3 Fluidized Bed Reactor The fluidized bed reactor is built in five sections, and consists of a gas distributor, bed section and freeboard. The reactor shell is 0.75 meter (30 inches) diameter, and the total height of the reactor is approximately 5.2 meters (17 feet). The fluidized bed itself is 0.25 meters (10 inches) diameter, 1.4 meters (55 inches) tall. The reactor is an ASME-certified pressure vessel rated at 800°F and 300 psi. All flanges on the vessel are 300-class. ASME pressure vessel code recommends that 300-class flanges be used for equipment this size that may experience temperatures in excess of 400°F. The shell will be kept hot to avoid steam condensation inside the reactor, so 300-class flanges are used. The reactor will have a much higher pressure rating than required to simulate conditions in the Big Island system. This will allow investigation of gasification behavior at higher pressures. The P&ID for the reactor subsystem is presented in Appendix A-3. Select design drawings for the reactor are presented in Appendix B.
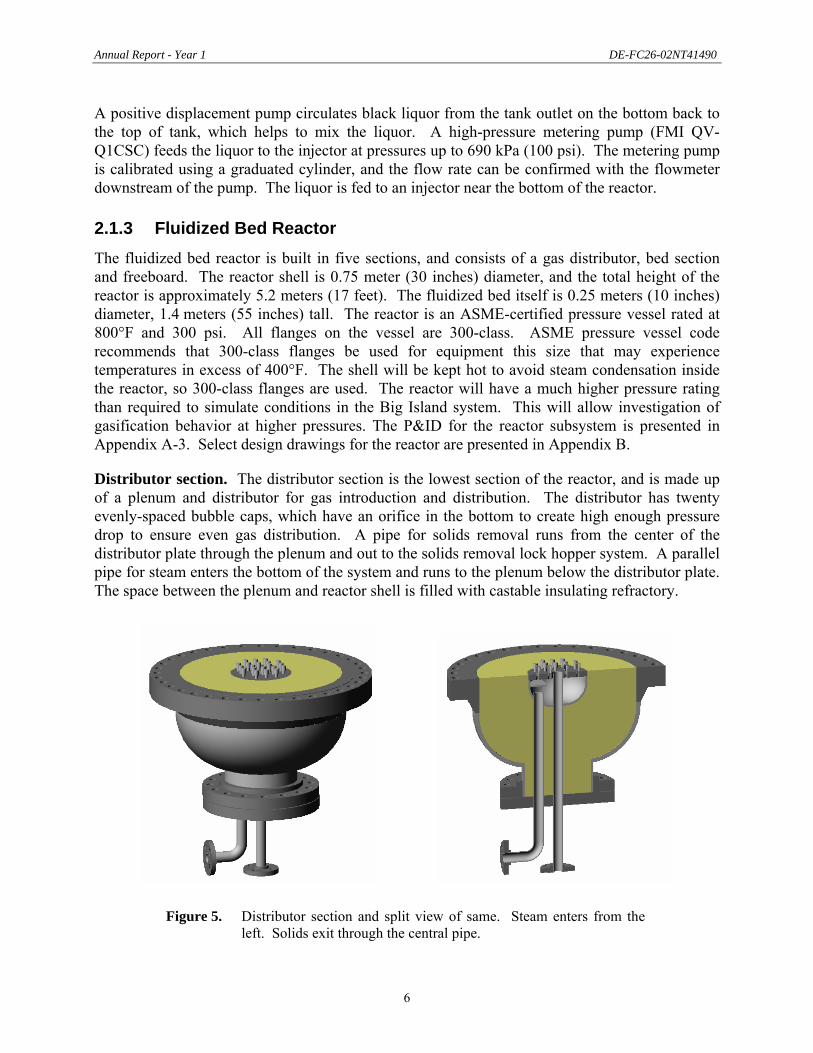
Distributor section. The distributor section is the lowest section of the reactor, and is made up of a plenum and distributor for gas introduction and distribution. The distributor has twenty evenly-spaced bubble caps, which have an orifice in the bottom to create high enough pressure drop to ensure even gas distribution. A pipe for solids removal runs from the center of the distributor plate through the plenum and out to the solids removal lock hopper system. A parallel pipe for steam enters the bottom of the system and runs to the plenum below the distributor plate. The space between the plenum and reactor shell is filled with castable insulating refractory.
Figure 5. Distributor section and split view of same. Steam enters from the left. Solids exit through the central pipe.

Annual Report - Year 1 DE-FC26-02NT41490
7
Bed section. The bed section (Figure 6) is the heart of the system. It is 1.5 meters (60 inches) tall, with the bed itself occupying the lower 1.4 meters (55 inches). Two layers of refractory are cast such that a 0.25 meter (10 inch) diameter bed cavity results.
Five 8-inch nozzles are welded to the shell, above one another and offset 90 degrees for insertion of the four in-bed heater bundles. (The top nozzle allows addition of a fifth heater bundle if desired. Alternately, the bottom bundle can be moved to the top position if, for example, it is observed that black liquor is contacting the bottom heater bundle before the liquor is fully dry.) Each bundle contains 20 thermowells in a 4x5 staggered configuration, welded to a an 8-inch blind flange. A refractory plug cast around the thermowells fits into the nozzle and a corresponding hole in the refractory of the bed section. A 0.5-inch diameter cartridge heater is inserted into each thermowell. The cartridge heater is as long as the thermowell, but only 165 mm (6.5 inches) at the end, where the thermowell is in the bed, is heated. In total, approximately 40 kW of energy can be input to the bed through the heater bundles.
The heaters each have an internal thermocouple that measures temperature in the core of the heated section. Half of these, every second heater, are connected to the system's digital control system. If necessary, the other half can be connected at a later time. The tube bundle sections each have an additional, smaller thermowell extending approximately 1.5 inches into the bed for measurement of bed temperature.
Figure 6. Bed section of reactor and split view of same. The four bundles of heater thermowells can be seen. A spare heater bundle nozzle, two 3-inch injection ports and a 1-inch port for temperature and pressure measurement can be seen in the figure on the left. Two 3-inch sample ports above and below the tube bundle section are on the opposite side.
Annual Report - Year 1 DE-FC26-02NT41490
8
Two 3-inch nozzles are welded at a 15-degree downwards angle near the bottom of the bed section. One of these is dedicated for liquor injection. The other can either be used for liquor injection, sampling or measurement of temperature and pressure. The liquor is injected approximately 3 inches above the distributor. Two 3-inch ports just above and just below the heater bundles allow for sampling or insertion of coupons for material testing. An additional 1-inch port near the top of the bed section allows temperature or pressure measurement, and will house the pressure tap used to control bed height.
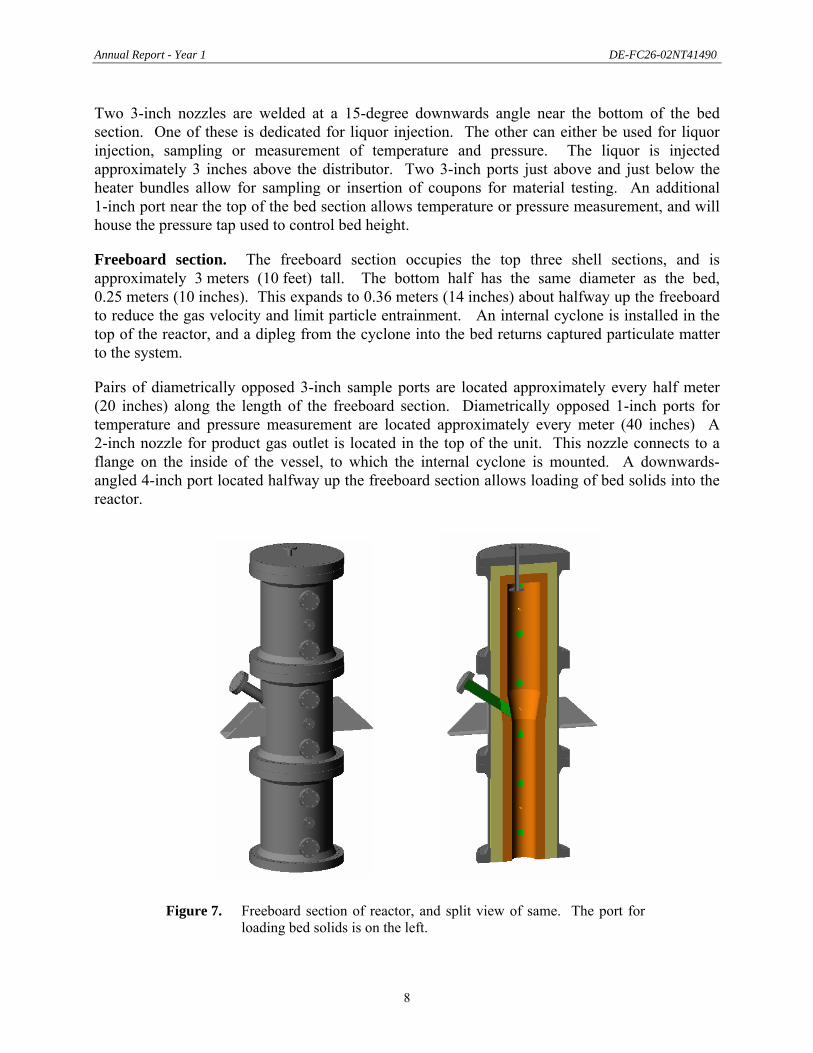
Freeboard section. The freeboard section occupies the top three shell sections, and is approximately 3 meters (10 feet) tall. The bottom half has the same diameter as the bed, 0.25 meters (10 inches). This expands to 0.36 meters (14 inches) about halfway up the freeboard to reduce the gas velocity and limit particle entrainment. An internal cyclone is installed in the top of the reactor, and a dipleg from the cyclone into the bed returns captured particulate matter to the system.
Pairs of diametrically opposed 3-inch sample ports are located approximately every half meter (20 inches) along the length of the freeboard section. Diametrically opposed 1-inch ports for temperature and pressure measurement are located approximately every meter (40 inches) A 2-inch nozzle for product gas outlet is located in the top of the unit. This nozzle connects to a flange on the inside of the vessel, to which the internal cyclone is mounted. A downwards-angled 4-inch port located halfway up the freeboard section allows loading of bed solids into the reactor.
Figure 7. Freeboard section of reactor, and split view of same. The port for loading bed solids is on the left.

Annual Report - Year 1 DE-FC26-02NT41490
9
2.1.4 Solids Removal System The solids removal system is located below the reactor and is made up of a lock hopper and nitrogen purge system. The lock hopper comprises a section of pipe between two slide valves, plus a purge valve for pressure relief. During operation, the upper slide valve opens momentarily to allow solids to fall from the reactor via a 1½-inch pipe running through the distributor into the hopper. The slide valve is then closed and the hopper purge valve is opened to depressurize the lock hopper. Once depressurized, the bottom slide valve opens to release the solids into a receiving receptacle. The section of pipe above the lock hopper is continuously purged with nitrogen so the solids and surrounding gas are cool and non-reactive when they are removed from the system.
2.1.5 Product Gas Handling System The product gas handling system safely disposes of the synthesis gas produced in the gasifier. The process and instrumentation diagram for this subsystem is presented in Appendix A-4. Product gas from the gasifier is run through an external cyclone, which delivers removed particulate material to a catch pot. The gas then runs through a control valve, coupled to a pressure transmitter in the reactor freeboard, that sets the pressure of the system. Downstream of this valve the gas is essentially at atmospheric pressure. A sample line from this atmospheric, pre-combustion section of the system feeds the product gas to the on-line analyzers.
Eductor. Georgia-Pacific's Big Island system incorporates a thermocompressor (eductor) on the steam feed line to draw in product gas for recycle to the reactor. This reduces the amount of steam required to achieve the desired fluidization velocity. The University of Utah gasification test system is also configured with a product gas recycle/eductor system. The product gas to be recycled is taken off between the external cyclone and the pressure control valve. The eductor is located between the steam superheater and the reactor plenum, and uses superheated steam as the motive gas.
Afterburner. The product gas must be combusted before being exhausted, so it is fed to a downwards natural gas-fired afterburner (Figure 8). The afterburner is a 4.6 meter (15 foot) tall vessel lined with two layers of refractory to make a 14-inch diameter reaction chamber. Gas enters the top of the vessel and is combusted by two opposing natural gas burners in the top two ports. The gas is burned at a minimum temperature of 1093°C (2000°F) for at least two seconds to ensure efficient destruction of any tars remaining in the gas at this point. Additional ports downstream are provided for sampling or viewing. The afterburner is operated under slightly negative pressure, provided by the facility's indirect-draft fan.
The syngas is not cooled before being fired in the afterburner, but kept hot to avoid tar condensation and to avoid risks associated with hydrogen sulfide in a concentrated syngas that would result if the gas were first cooled and condensed. Because the gasifier product gas is primarily steam, this results in a relatively large afterburner and natural gas requirement. This was determined to be preferable to potential operating problems and safety risks associated with cooling the gas first.
Annual Report - Year 1 DE-FC26-02NT41490
10
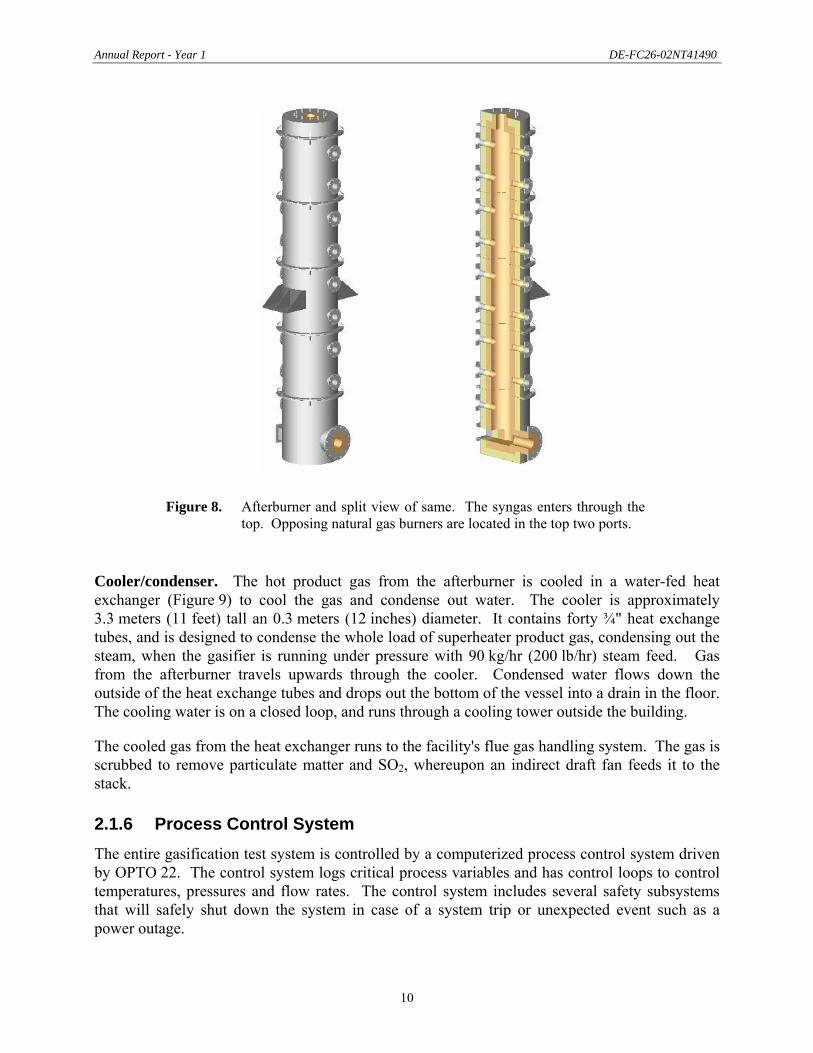
Figure 8. Afterburner and split view of same. The syngas enters through the top. Opposing natural gas burners are located in the top two ports.
Cooler/condenser. The hot product gas from the afterburner is cooled in a water-fed heat exchanger (Figure 9) to cool the gas and condense out water. The cooler is approximately 3.3 meters (11 feet) tall an 0.3 meters (12 inches) diameter. It contains forty ¾" heat exchange tubes, and is designed to condense the whole load of superheater product gas, condensing out the steam, when the gasifier is running under pressure with 90 kg/hr (200 lb/hr) steam feed. Gas from the afterburner travels upwards through the cooler. Condensed water flows down the outside of the heat exchange tubes and drops out the bottom of the vessel into a drain in the floor. The cooling water is on a closed loop, and runs through a cooling tower outside the building.
The cooled gas from the heat exchanger runs to the facility's flue gas handling system. The gas is scrubbed to remove particulate matter and SO2, whereupon an indirect draft fan feeds it to the stack.
2.1.6 Process Control System The entire gasification test system is controlled by a computerized process control system driven by OPTO 22. The control system logs critical process variables and has control loops to control temperatures, pressures and flow rates. The control system includes several safety subsystems that will safely shut down the system in case of a system trip or unexpected event such as a power outage.
Annual Report - Year 1 DE-FC26-02NT41490
11
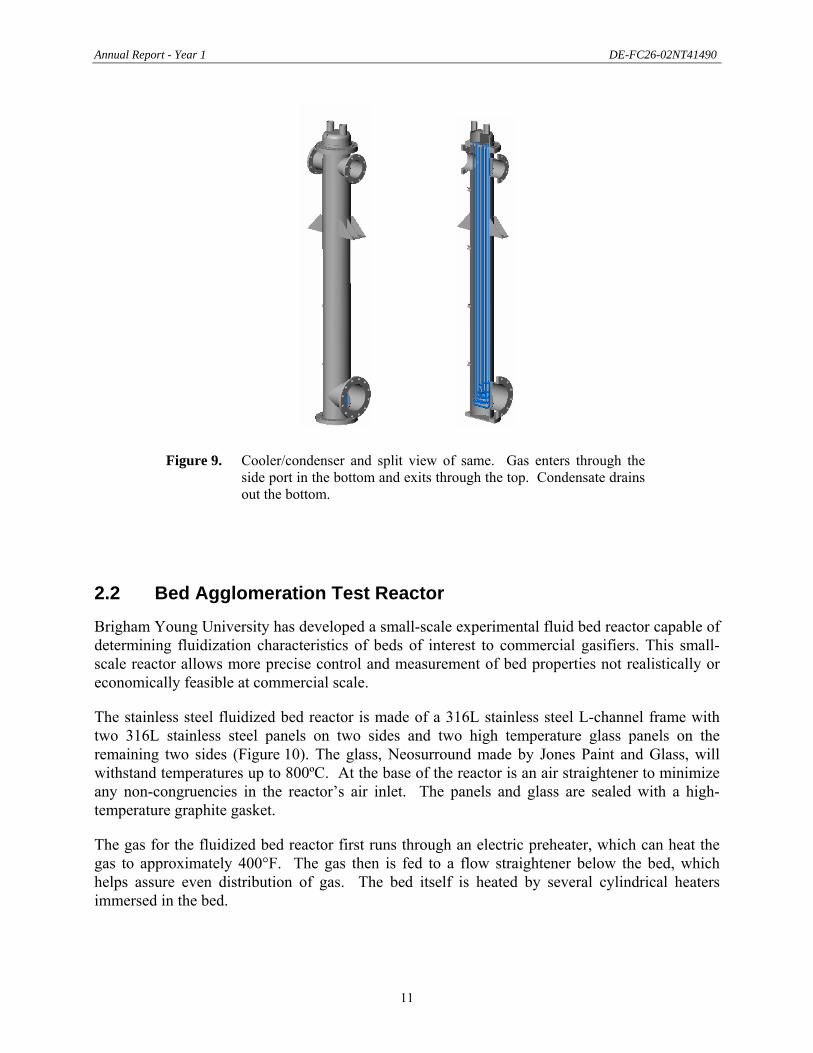
Figure 9. Cooler/condenser and split view of same. Gas enters through the side port in the bottom and exits through the top. Condensate drains out the bottom.
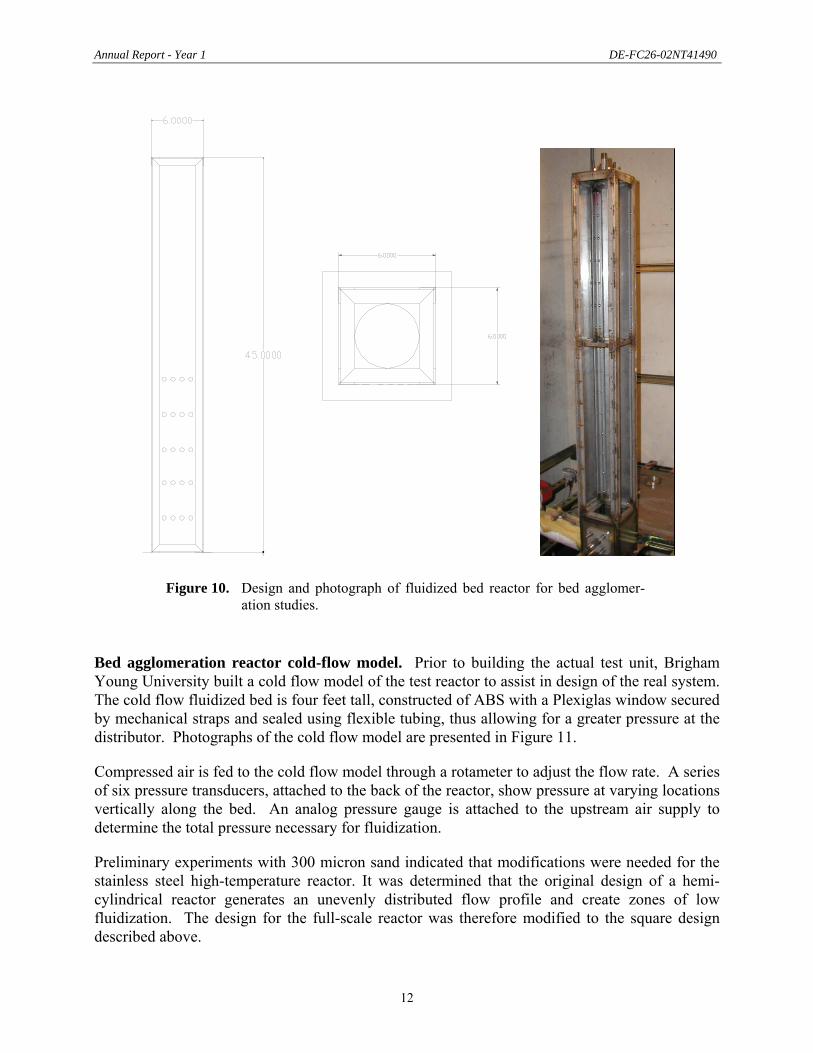
2.2 Bed Agglomeration Test Reactor
Brigham Young University has developed a small-scale experimental fluid bed reactor capable of determining fluidization characteristics of beds of interest to commercial gasifiers. This small-scale reactor allows more precise control and measurement of bed properties not realistically or economically feasible at commercial scale.
The stainless steel fluidized bed reactor is made of a 316L stainless steel L-channel frame with two 316L stainless steel panels on two sides and two high temperature glass panels on the remaining two sides (Figure 10). The glass, Neosurround made by Jones Paint and Glass, will withstand temperatures up to 800ºC. At the base of the reactor is an air straightener to minimize any non-congruencies in the reactor’s air inlet. The panels and glass are sealed with a high-temperature graphite gasket.
The gas for the fluidized bed reactor first runs through an electric preheater, which can heat the gas to approximately 400°F. The gas then is fed to a flow straightener below the bed, which helps assure even distribution of gas. The bed itself is heated by several cylindrical heaters immersed in the bed.
Annual Report - Year 1 DE-FC26-02NT41490
12
Figure 10. Design and photograph of fluidized bed reactor for bed agglomer-ation studies.
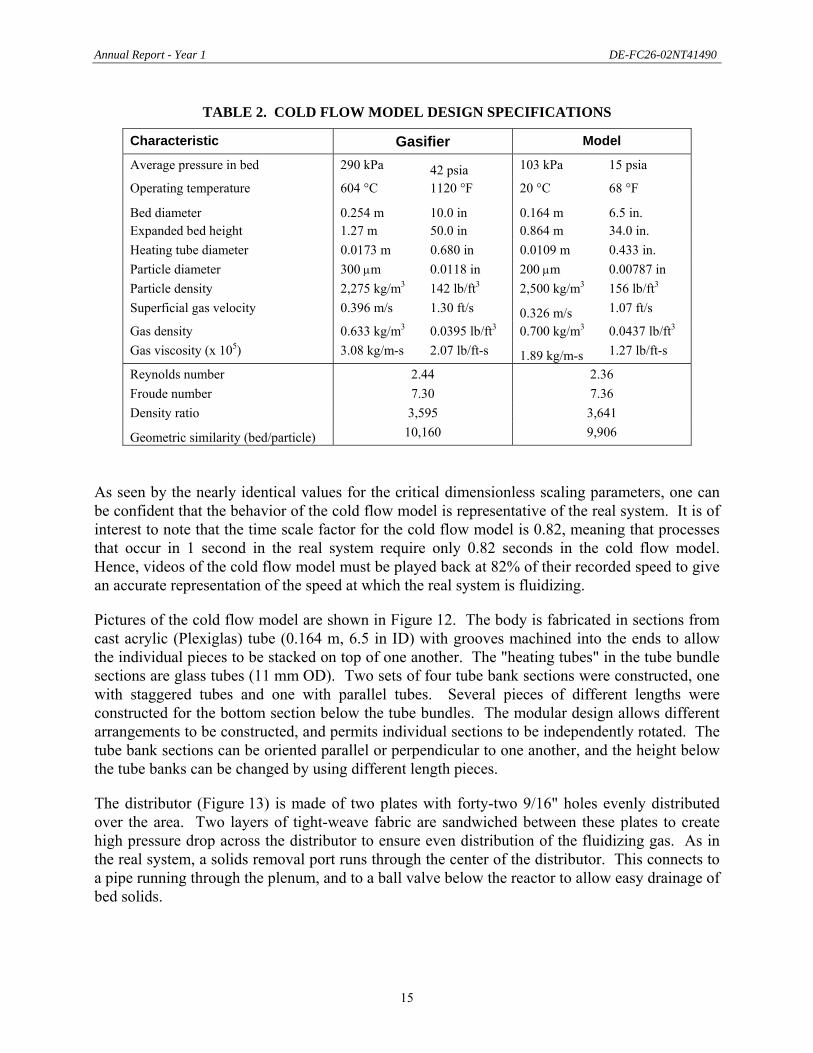
Bed agglomeration reactor cold-flow model. Prior to building the actual test unit, Brigham Young University built a cold flow model of the test reactor to assist in design of the real system. The cold flow fluidized bed is four feet tall, constructed of ABS with a Plexiglas window secured by mechanical straps and sealed using flexible tubing, thus allowing for a greater pressure at the distributor. Photographs of the cold flow model are presented in Figure 11.
Compressed air is fed to the cold flow model through a rotameter to adjust the flow rate. A series of six pressure transducers, attached to the back of the reactor, show pressure at varying locations vertically along the bed. An analog pressure gauge is attached to the upstream air supply to determine the total pressure necessary for fluidization.
Preliminary experiments with 300 micron sand indicated that modifications were needed for the stainless steel high-temperature reactor. It was determined that the original design of a hemi-cylindrical reactor generates an unevenly distributed flow profile and create zones of low fluidization. The design for the full-scale reactor was therefore modified to the square design described above.

Annual Report - Year 1 DE-FC26-02NT41490
13
Figure 11. Brigham Young University's cold flow model: side view (left) and operating (right).
2.3 Single Droplet Reactor
The University of Utah has constructed a laboratory reactor for study pyrolysis and gasification behavior of single droplets or particles of black liquor. The design is based on a similar reactor that has been successfully used for black liquor studies at Åbo Akademi University in Finland. The Utah reactor is constructed from two concentric quartz tubes positioned in a vertical tube furnace. The inner tube is approximately 1 meter (40 inches) long, 38 millimeters (1.5 inches) diameter. The outer tube is approximately 0.7 meter (28 inches) long and 63 millimeters (2.5 inches) in diameter. The outer tube is centered around the inner tube and sealed on the top and bottom. Gas is fed through a flowmeter, enters the bottom of the outer tube and flows upwards between the outer and inner tubes, where it is heated. The heated gas then enters the inner tube through a series of small holes, flows downwards through the hot part of the reactor and is exhausted through a port in the bottom of the reactor.
A purge chamber at the top of the reactor provides a cool, inert environment for sample preparation and cooling after an experiment. A small flow of nitrogen (approximately 20% of the total flow) is fed into this chamber and flows downwards through the inner tube. It meets and mixes with the preheated primary gas just inside the heated section of the furnace. This design

Annual Report - Year 1 DE-FC26-02NT41490
14
produces a sharp temperature transition, thereby maximizing heating rate. The top section of the reactor containing the purge chamber can be removed from the main body by removing a ground glass fitting, thereby facilitating sample loading and unloading.
Black liquor droplets are suspended from a hook attached to the bottom of a thick-walled, hollow glass rod. The rod is inserted into the top of the reactor and can be moved up and down, enabling droplets to be lowered into and out of the heated section of the reactor. A slender thermocouple is positioned in the rod such that the tip extends slightly from the bottom of the rod, just above the sample on the hook. This allows direct measurement of the approximate environment the sample is exposed to.
In a typical pyrolysis experiment, approximately 10 mg of concentrated black liquor is attached to a hook made of fine wire. The hook is attached to a glass ring on the bottom of the glass rod, and is pulled into position in the purge chamber. The top section of the reactor is put into place and purge and reactor gas are set to the desired setpoints. The rod is then quickly lowered into the hot zone of the furnace and kept there for the desired amount of time, after which the sample is pulled back up into the purge zone. The sample is allowed to cool and stabilize in this zone, after which it is removed and carefully weighed to determine pyrolysis yield. The resulting char is saved for possible further analysis.
2.4 Fluidized Bed Gasifier Cold-Flow Model
A cold flow model of the University of Utah fluidized bed gasifier has been built as an aid in system design, visualization of reactor flows and interpretation of data. The cold flow model is also useful as a validation tool for the program's modeling efforts.
In order to ensure that the cold flow model accurately simulates the behavior of the bed in the true gasifier system, it is important that four dimensionless scaling parameters are kept the same between the two systems [1]:
µ
ρ gpud
g
s
ρρ ( ) 5.0
pgdu
pdL
Reynolds Density Froude Geometric similarity number ratio number of distributor, bed, particle
The cold flow model was designed to keep these scaling parameters equal between the systems when the gasifier is operating at standard conditions. The final cold flow model design calls for a bed diameter of 6.5 inches, fluidizing 200 micron soda lime glass beads with a 50/50 mixture of helium and air at room temperature. A comparison of specifications for the true gasifier and the cold flow model is presented in Table 2.
Annual Report - Year 1 DE-FC26-02NT41490
15
TABLE 2. COLD FLOW MODEL DESIGN SPECIFICATIONS
Characteristic Gasifier Model
Average pressure in bed 290 kPa 42 psia 103 kPa 15 psia
Operating temperature 604 °C 1120 °F 20 °C 68 °F
Bed diameter 0.254 m 10.0 in 0.164 m 6.5 in. Expanded bed height 1.27 m 50.0 in 0.864 m 34.0 in. Heating tube diameter 0.0173 m 0.680 in 0.0109 m 0.433 in. Particle diameter 300 µm 0.0118 in 200 µm 0.00787 in Particle density 2,275 kg/m3 142 lb/ft3 2,500 kg/m3 156 lb/ft3 Superficial gas velocity 0.396 m/s 1.30 ft/s 0.326 m/s 1.07 ft/s
Gas density 0.633 kg/m3 0.0395 lb/ft3 0.700 kg/m3 0.0437 lb/ft3 Gas viscosity (x 105) 3.08 kg/m-s 2.07 lb/ft-s 1.89 kg/m-s 1.27 lb/ft-s
Reynolds number 2.44 2.36 Froude number 7.30 7.36 Density ratio 3,595 3,641
Geometric similarity (bed/particle) 10,160 9,906
As seen by the nearly identical values for the critical dimensionless scaling parameters, one can be confident that the behavior of the cold flow model is representative of the real system. It is of interest to note that the time scale factor for the cold flow model is 0.82, meaning that processes that occur in 1 second in the real system require only 0.82 seconds in the cold flow model. Hence, videos of the cold flow model must be played back at 82% of their recorded speed to give an accurate representation of the speed at which the real system is fluidizing.
Pictures of the cold flow model are shown in Figure 12. The body is fabricated in sections from cast acrylic (Plexiglas) tube (0.164 m, 6.5 in ID) with grooves machined into the ends to allow the individual pieces to be stacked on top of one another. The "heating tubes" in the tube bundle sections are glass tubes (11 mm OD). Two sets of four tube bank sections were constructed, one with staggered tubes and one with parallel tubes. Several pieces of different lengths were constructed for the bottom section below the tube bundles. The modular design allows different arrangements to be constructed, and permits individual sections to be independently rotated. The tube bank sections can be oriented parallel or perpendicular to one another, and the height below the tube banks can be changed by using different length pieces.
The distributor (Figure 13) is made of two plates with forty-two 9/16" holes evenly distributed over the area. Two layers of tight-weave fabric are sandwiched between these plates to create high pressure drop across the distributor to ensure even distribution of the fluidizing gas. As in the real system, a solids removal port runs through the center of the distributor. This connects to a pipe running through the plenum, and to a ball valve below the reactor to allow easy drainage of bed solids.

Annual Report - Year 1 DE-FC26-02NT41490
16
Figure 12. Rendering and photographs of the cold flow model of the University of Utah fluidized bed gasifier. The photo on the right shows the system during operation.
Figure 13. Cold flow model distributor.

Annual Report - Year 1 DE-FC26-02NT41490
17
During operation, compressed air and helium are fed through two separate rotameters that have been independently calibrated. The gases are mixed and fed to the plenum of the fluidized bed, below the distributor, and flow evenly through the distributor. At standard operating conditions (14.8 scfm total flow, 26" slumped bed height), pressure drop across the distributor accounts for approximately 40% of the total pressure drop across the system.
The cold flow model has a number of uses. Generally speaking, it provides visual insight into the behavior of the fluidized bed gasifier. The bed can be videotaped during operation and played back at slower speed to identify flow patterns of solids and gas. The cold flow model is a useful tool for developing and validating computerized models of the fluidized bed gasification system, particularly with regard to flow of gas and solids around and through the horizontal heat exchange tubes. One such application is shown in Figure 14. Two probes are inserted into adjacent glass tubes. One probe has a light source, either visible or infrared. The other probe has a photodetector. As bubbles pass between the tubes, light from the source is seen by the detector. By coupling the detector to a computerized data acquisition system, variations in light intensity, corresponding to bubble size and frequency, can be tracked. By setting zero and full scale intensities for a packed bed and empty bed, respectively, the average bed density between tubes can be determined and mapped for the entire tube bundle region.
Light source
Photodetector
Figure 14. Tube section of cold flow model showing light source and detector probes inserted into "heater" tubes.
Annual Report - Year 1 DE-FC26-02NT41490
18
3. COMPUTATIONAL MODELS Two computational models of fluidized bed steam reformers have developed under this project. The first, developed at the University of Utah, is a general, idealized model for any fluidized bed black liquor steam reformer that maps the gas compositions and flow rates throughout the reactor. The second model, developed by Reaction Engineering International, is a "1½-D" model of the entire Big Island reactor that predicts bubble development and rise, liquor conversion, temperature distributions and gas compositions.
3.1 Generic Steam Reformer Model (UU Model)
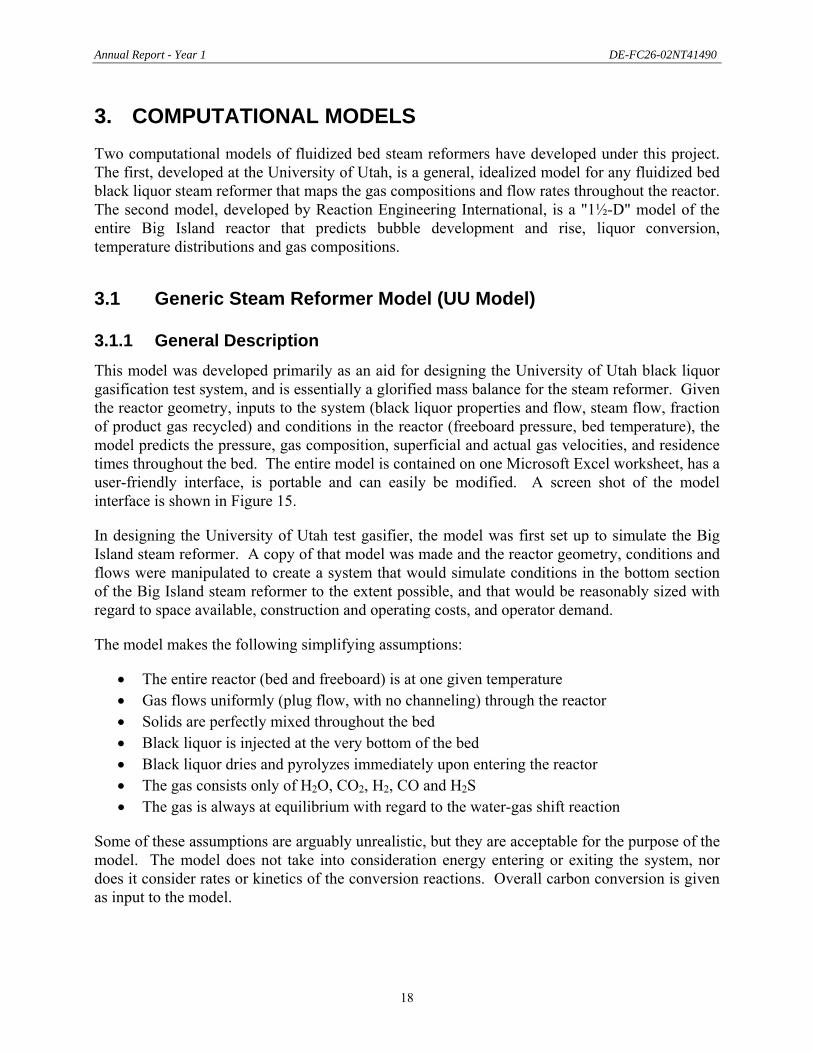
3.1.1 General Description This model was developed primarily as an aid for designing the University of Utah black liquor gasification test system, and is essentially a glorified mass balance for the steam reformer. Given the reactor geometry, inputs to the system (black liquor properties and flow, steam flow, fraction of product gas recycled) and conditions in the reactor (freeboard pressure, bed temperature), the model predicts the pressure, gas composition, superficial and actual gas velocities, and residence times throughout the bed. The entire model is contained on one Microsoft Excel worksheet, has a user-friendly interface, is portable and can easily be modified. A screen shot of the model interface is shown in Figure 15.
In designing the University of Utah test gasifier, the model was first set up to simulate the Big Island steam reformer. A copy of that model was made and the reactor geometry, conditions and flows were manipulated to create a system that would simulate conditions in the bottom section of the Big Island steam reformer to the extent possible, and that would be reasonably sized with regard to space available, construction and operating costs, and operator demand.
The model makes the following simplifying assumptions:
• The entire reactor (bed and freeboard) is at one given temperature • Gas flows uniformly (plug flow, with no channeling) through the reactor • Solids are perfectly mixed throughout the bed • Black liquor is injected at the very bottom of the bed • Black liquor dries and pyrolyzes immediately upon entering the reactor • The gas consists only of H2O, CO2, H2, CO and H2S • The gas is always at equilibrium with regard to the water-gas shift reaction
Some of these assumptions are arguably unrealistic, but they are acceptable for the purpose of the model. The model does not take into consideration energy entering or exiting the system, nor does it consider rates or kinetics of the conversion reactions. Overall carbon conversion is given as input to the model.
Annual Report - Year 1 DE-FC26-02NT41490
19
Figure 15. Screen shot of UU model interface.
All gas phase equilibrium calculations are performed by the following procedure:
1. The C, H, O and S atoms entering the system or level are totaled. 2. All S atoms and 2xS hydrogen atoms are removed from the system. 3. The equilibrium composition of H2O, CO2, H2 and CO for the remaining atoms is
calculated. 4. The H2S removed in step 2 is returned to the mixture.
In step 3, the composition is calculated by determining the equilibrium constant for the water-gas shift reaction at the specified temperature, manipulating gas species concentrations into a quadratic equation with one real root and identifying this root. The solution can thus be found directly, eliminating the need for iteration or a solver. Through this approach, the model solution updates immediately when a change is made to the inputs.
The model considers gas flow through the bed from the bottom up. The bed is divided into ten sections of equal volume, and the compositions and flows into and out of each section (labeled Levels 0 through 10) are determined. In addition, there is a "bottom" level below Level 0 that considers only the incoming steam and recycled syngas. Descriptions of the different sections and processes that take place in these sections are described in the sections that follow.
Annual Report - Year 1 DE-FC26-02NT41490
20
3.1.2 Treatment of Chemistry and Liquor Conversion
3.1.2.1 Bottom Level: Steam and Recycled Syngas Feed
The user can input the steam feed rate as well as the recycle ratio, defined as mass of recycled syngas to mass of steam introduced into the reactor. The model first performs an initial mass balance for the total system to determine the final product gas composition. The appropriate flow of this product gas (based on recycle ratio) is combined with the incoming steam flow and the equilibrium composition of this mixture is determined. This mixture is passed on to Section 0.
3.1.2.2 Section 0: Black Liquor Feeding, Drying, Pyrolysis
In the model, black liquor is fed in Section 0. It is assumed that drying and pyrolysis are instantaneous, and that all gas generated by pyrolysis and gasification impacts gas flow in this section. H2O from drying of the liquor is added to the gas phase of the system. Carbon, hydrogen, oxygen and sulfur released from the liquor during pyrolysis are added to the gas phase as described below.
Carbon: Frederick and Hupa [2] investigated black liquor pyrolysis, and offer a relation to determine the percentage of carbon retained in the char as a function of temperature:
Percentage of carbon retained in char = 645 exp(–0.00332T) (1)
where T is in °C.
Hydrogen: Historically, there has not been much interest in studying hydrogen release during pyrolysis, and no published results on this issue are available. Elemental compositions of liquor and chars are available, however. Hydrogen contents in black liquor solids are on the order of 3.5%. Reported hydrogen contents of different chars are in the range 2 wt%. The char yield during formation of such chars is roughly 65%. An estimate of hydrogen released can thus be calculated: (3.5 – (2.0 x 0.65)) / 3.5 = 63%. The release is undoubtedly affected by temperature, but until data to model this is available, a constant 63% H loss is assumed.
Oxygen: Like hydrogen, there is essentially no data on oxygen release during pyrolysis. Data on component release versus temperature are available for carbon, sodium and sulfur, and the total volatiles yield versus temperature is also available. Using this information, a relation for oxygen release as a function of temperature was back-calculated such that the total volatiles yield agrees with that estimated from Frederick and Hupa [2]:
Volatiles yield (%) = –39.7 + 0.1T (2)
Data between 700 and 900°C was fit, and the relation can comfortably be extrapolated to 600°C. The resulting relation for the percent oxygen volatilized is:
Percent oxygen release = 3.77 exp(0.00292T) (3)
Annual Report - Year 1 DE-FC26-02NT41490
21
where T is in °C.
Sulfur: Frederick et al. [3] offer a correlation for sulfur release during black liquor devolatilization. The correlation depends only on temperature. For temperatures between 250 and 1018°C,
Percent sulfur released = –163.27 + 0.9717T –1.15e–3T2 + 4.283e–7T3 (4)
Other elements: Volatilization of all other elements (Na, K, Cl, N, Ca, Si, etc.) is ignored.
3.1.2.3 Sections 1–10: Black Liquor Char Gasification
Once the liquor has devolatilized, a char remains. This char is slowly gasified until an inorganic residue (ash) remains. It is assumed that, since the bed is well mixed, this gasification occurs uniformly throughout the bed. Each of the ten bed sections thus contributes equally to C, H, O and S release through gasification. For example, if 20% of the incoming carbon is released during pyrolysis in Section 1 and 10% of the incoming carbon exits the reactor in the solids (as carbonate or unreacted carbon), the remaining 70% is released equally over the 10 sections, with 7% of the incoming carbon being released in each section.
It is assumed that the final solid product is pure sodium carbonate, Na2CO3, plus residual unreacted organic carbon. (The percent conversion of total carbon is an input variable.) Consequently, all sulfur and hydrogen are assumed to exit in the gas phase. The production rate of sodium carbonate is calculated based on the amount of incoming sodium (and potassium, which was treated as sodium). The associated carbon and oxygen in the carbonate are then calculated. The amounts of carbon and oxygen released during gasification are determined by subtracting the amounts released during pyrolysis and exiting with the solid from the amount input with the black liquor solids.
3.1.3 Level-by-Level Calculations Conditions at each level are calculated as follows:
Level 0 (below Section 1): The model starts with the bottom of Section 1 (Level 0) and adds all gas-phase C, H, O and S contributed by (1) steam and recycle gas fed to the distributor, (2) drying of the black liquor, and (3) devolatilization of the black liquor solids. The equilibrium composition is calculated, as is the pressure at this point based on the given freeboard pressure, bed height and bed density. Since the temperature, pressure, volumetric gas flow rate, reactor geometry and bed void fraction are known, the superficial and actual gas velocities (after drying/devolatilization) are calculated.
Level 1 (above Section 1): At Level 1, the gas has gone through 10% of the volume of the bed. During its passage through this section, C, H, O and S corresponding to 10% of the total char gasification (since this is one of 10 sections) are added to the gas phase. The equilibrium gas composition, pressure, superficial and actual velocities are all recomputed. The residence time in
Annual Report - Year 1 DE-FC26-02NT41490
22
Section 1 is calculated by dividing the height of the section by the average gas velocity through the section (taken as the average of the incoming and outgoing gas velocities).
Levels (and Sections) 2-10: Conditions in the rest of the bed are determined essentially the same as for Level 1. The gas composition is updated and brought to equilibrium, then pressure, gas velocity and residence time are calculated. The final gas exiting the top of the bed (Section 10) is taken to be the product gas from the reactor.
Freeboard: The geometry of the freeboard, including the expansion section at the top of the reactor, is input and the freeboard volume is calculated. The gas velocity and residence time in this section is subsequently calculated. It is assumed that no chemical reactions occur in the freeboard.
Predicted performance of the Big Island gasifier using this model are presented in the Results section of this report.
3.2 Advanced Model of Entire Reactor (REI Model)
Reaction Engineering International (REI) has developed a "1½-D" three-phase countercurrent backmixing model based on an existing fluidized bed model that REI developed under a DOE-sponsored Vision 21 program. The model takes into account vertical temperature and concentration gradients and downflow near the wall. The model for the entire Big Island reactor describes the fluid dynamics, chemistry and heat transfer in the reactor. Details of the system, such as interaction between bubbles and the pulsed heater tube bundles, are estimated from the correlations for heat exchange tubes in fluidized bed combustors.
The model uses literature data for system chemistry and fluid dynamics. This model will be improved over time by incorporating data on conversion from specific laboratory experiments and the gasification test system. As development progresses, the model will be validated through comparison with results from the Utah gasifier. Once the Big Island facility is operating, the ambition is to validate the model with data from this system.
The model assumes that the fluidized bed consists of three distinct phases:
• A particle-free bubble phase where the gas moves upward in plug flow • A wake phase where the gas and the solids move upward with the bubbles • A dense phase in which the solids move downward. The voidage in the dense phase is
assumed to be the same as that in the wake phase and is assumed to be the voidage at minimum fluidization.
The bubble sizes are calculated allowing for bubble growth by coalescence with increasing height in the bed and decrease in bubble size as a result of bubble intersection with tubes. Different bubble sizes are calculated for the bubbles in the heater tube banks, the voids between the tube banks and the confining cylindrical walls, and the bubbles that flow through the open wedges between the overlap of tube banks. In the model the bubble sizes are averaged across a cylindrical cross section. Details of the model are given in the following sections.
Annual Report - Year 1 DE-FC26-02NT41490
23
3.2.1 Bubble hydrodynamics
3.2.1.1 Bubble size.
Bubble hydrodynamics in the tube banks differ from that outside the tube banks. With the presence of tube bundles, bubbles interact with the tubes, leading to bubble splitting thereby counteracting the tendency of bubble growth by coalescence. Thus, it is necessary to estimate bubble sizes using different approaches for the regions with and without tube bundles.
Regions below and above the tube bundles of the pulse combustors. For three-dimensional fluidized beds, the Darton correlation [4] has been widely used to predict bubble growth
5/15/40
5/2mf0b g/)A4h()uu(54.0d +−= (5)
where A0 is the catchment area at the distributor plate. For the Big Island process, this is calculated to be 0.0355 m2.
Tube bundle regions of the pulse combustors. When bubbles strike tubes, the interaction between the tubes and bubbles may cause bubbles to break up. The size of the daughter bubbles can be predicted using a probabilistic approach developed by Hull et al. [5]. This approach may be summarized briefly as follows.
Assume that the parent bubble has a size, db, less than the horizontal spacing between the tubes, L. The probability of the parent bubble striking the tube and splitting to form daughter bubbles is
)Ld/()dd(p tbt ++= . The probability of the parent bubble slipping through the horizontal spacing between the tubes without splitting is then (1 − p). Assume also that on encounter with the tube, the parent bubble of size db < L breaks up at most into two daughter bubbles of equal size. Therefore, for a three-dimensional bubble, 3
d,b3b d2d = , where db,d is the size of the daughter
bubbles. The average size of the bubbles leaving the tube banks, e,bd , can now be estimated as bd,be,b d)p1(pdd −+= :
⎟⎟⎠
⎞⎜⎜⎝
⎛++
⎟⎟⎠
⎞⎜⎜⎝
⎛−−=
Lddd
2111
dd
t
bt3
b
e,b for Ld b < (6)
If L2ddL tb +<≤ , the probability of a bubble encountering two tubes simultaneously is )Ld/()Ld(p tb +−= . It is assumed that such an encounter leads to the parent bubble breaking
up into three daughter bubbles, one with diameter L, and the other two daughter bubbles being of equal size. Then, 3
d,b33
e,b d2Ld += for three-dimensional bubbles. The probability of the parent bubble striking only one tube is (1 − p). In this case, the parent bubble splits into two bubbles with equal diameters, thus, 3
d,b3
e,b d2d = . Using these relationships, the average daughter bubble size is given by
Annual Report - Year 1 DE-FC26-02NT41490
24
⎟⎟⎠
⎞⎜⎜⎝
⎛+−
−+
+⎟⎟⎠
⎞⎜⎜⎝
⎛+−+
=LdLd
32
Ld2L
LddL2d
2d
dt
b
333
b
t
bt3
be,b (7)
For L3d2dL2d tbt +<≤+ , this approach yields
⎟⎟⎠
⎞⎜⎜⎝
⎛+−−
−+
+⎟⎟⎠
⎞⎜⎜⎝
⎛+−+
−+
=Ld
L2dd2
2L2d
L
LddL3d2
32
Ld2L
dt
tb
333
b
t
bt
333
b
e,b (8)
Similarly, for L3d2dL2d tbt +<≤+ , the daughter bubble size is
⎟⎟⎠
⎞⎜⎜⎝
⎛+−−
−+
+⎟⎟⎠
⎞⎜⎜⎝
⎛+−+
−+
=Ld
L3d2d5
2L3d
2L3
LddL4d3
22
L2dL
dt
tb
333
b
t
bt
333
b
e,b (9)
For L3d2d te,b +≥ , equations similar to Equation 9 can be derived. This model has been validated through comparison of model predictions with measurements taken from a thin fluidized bed using a CCD video camera. The applicability of the model to three-dimensional bubbles was also examined. Yates and co-workers [6,7] reported measurements that relate the parent bubble size with the average size of daughter bubbles resulting from encounter with horizontal rows of tubes. Calculations using the above model compared favorably with their experimental data [5].
3.2.1.2 Bubble Rise Velocity
The most frequently adopted two-phase theory shows that bubble rise velocity is the sum of the excess gas velocity and the isolated bubble rise velocity [8]:
bmf0b gd71.0uuu +−= (10)
The excess gas velocity represents the visible bubble flow according to the two-phase theory. Several experimental investigations, however, indicate that the visible bubble flow is somewhat smaller than that predicted by the two-phase theory [9,10]. For simplicity, Equation 10 is used in this work.
3.2.1.3 Bubble Wake Fraction
Bubble wake fraction varies in a wide range as the operating conditions change. Measurements suggest that wake fraction depends on both particle and bubble sizes [11]. The scatter in the existing experimental data, however, makes it difficult to use an unequivocal correlation for
Annual Report - Year 1 DE-FC26-02NT41490
25
bubble wake fraction. In the modeling of fluidized beds, it is generally assumed that wake fraction is constant [12]; in this work, we assume that wake fraction is 0.30.
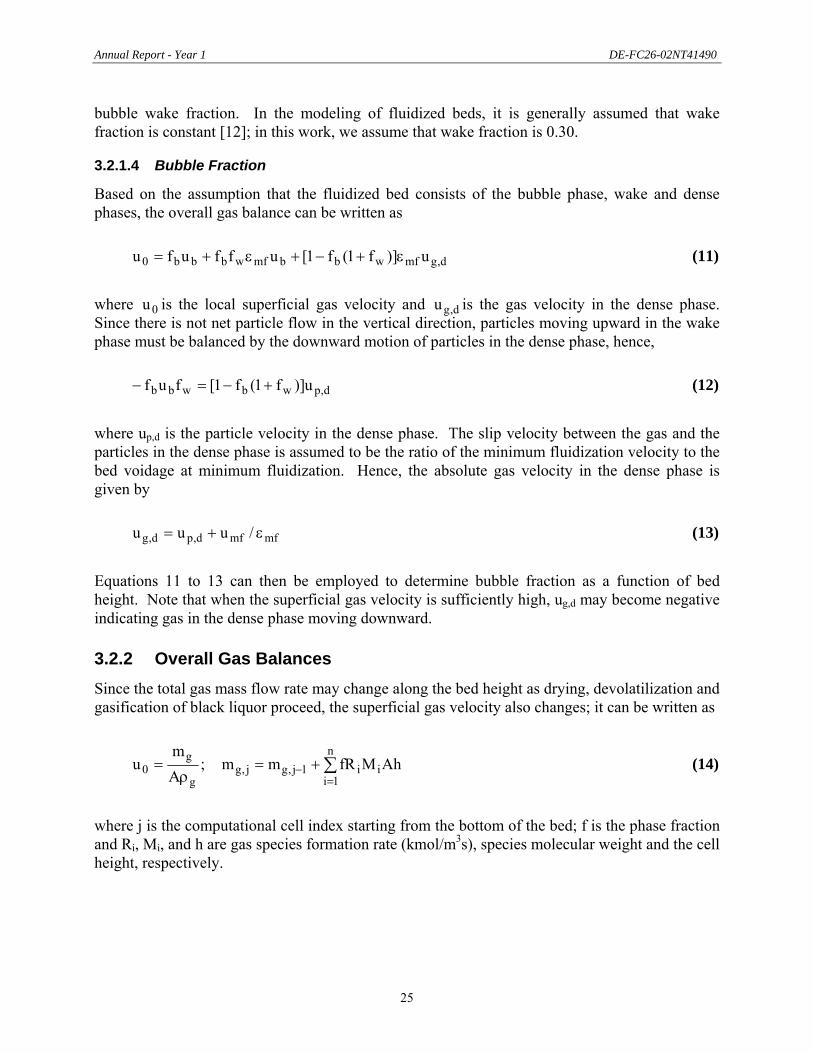
3.2.1.4 Bubble Fraction
Based on the assumption that the fluidized bed consists of the bubble phase, wake and dense phases, the overall gas balance can be written as
d,gmfwbbmfwbbb0 u)]f1(f1[uffufu ε+−+ε+= (11)
where 0u is the local superficial gas velocity and d,gu is the gas velocity in the dense phase. Since there is not net particle flow in the vertical direction, particles moving upward in the wake phase must be balanced by the downward motion of particles in the dense phase, hence,
d,pwbwbb u)]f1(f1[fuf +−=− (12)
where up,d is the particle velocity in the dense phase. The slip velocity between the gas and the particles in the dense phase is assumed to be the ratio of the minimum fluidization velocity to the bed voidage at minimum fluidization. Hence, the absolute gas velocity in the dense phase is given by
mfmfd,pd,g /uuu ε+= (13)
Equations 11 to 13 can then be employed to determine bubble fraction as a function of bed height. Note that when the superficial gas velocity is sufficiently high, ug,d may become negative indicating gas in the dense phase moving downward.
3.2.2 Overall Gas Balances Since the total gas mass flow rate may change along the bed height as drying, devolatilization and gasification of black liquor proceed, the superficial gas velocity also changes; it can be written as
∑=
− +=ρ
=n
1iii1j,gj,g
g
g0 AhMfRmm;
Am
u (14)
where j is the computational cell index starting from the bottom of the bed; f is the phase fraction and Ri, Mi, and h are gas species formation rate (kmol/m3s), species molecular weight and the cell height, respectively.
Annual Report - Year 1 DE-FC26-02NT41490
26
3.2.3 Species Mass Balances For steady state conditions, species mass balance equations in different phases can be written as follows:
3.2.3.1 Bubble phase
0RAf)CC(KAfdz
)Afu(d)CC(
dz)ACfu(d
b,ibw,ib,ibwbbb
w,i2b,ilb,ibb =+−+λ+λ− (15)
where Ci,b denotes the concentration of species i. Subscripts b, w represent the bubble and wake phases, respectively. A is the cross-sectional area of the bed; it changes along the bed height in the regions of the tube bundles and the freeboard. The first term in the above equation is the convection due to the finite velocity of the bubble phase. The second term represents the cross-flow that accounts for the variation of bubble properties along the bed height above the gas distributor. λ1 and λ2 are constant; if 0dz/)Afu(d bb ≥ , 1and0 21 =λ=λ ; if 0dz/)Afu(d bb < ,
0and1 21 =λ=λ . The third term is the exchange of gas between the bubble phase and the wake phase. The last term represents the consumption rate of species i in the bubble phase.
3.2.3.2 Wake phase
Similarly, for the wake phase, the gas species mass balance can be written as
0RA)(1ffRAff)CC(AKf)CC(AKf
zd}uA)]f(1f{[1d
)CC(dz
)Afu(d)CC(
dz)CAffu(d
pw,i,mfwbgw,i,mfwbd,iw,iwdb
b,iw,ibwbdg,mfwb
wi,4di,3
bbw,i2b,i1
w,imfwbb
=ε−+ε+−+
−+ε+−
λ+λ+
λ+λ+ε
(16)
The first term in the above equation is the convection term. The second and third terms are the cross-flow. λ3 and λ4 are constant; if 0dz/}uA)]f(1f[1{d dg,mfwb ≥ε+− , 1and0 43 =λ=λ ; if
0dz/}uA)]f(1f[1{d dg,mfwb <ε+− , 0and1 43 =λ=λ . The fourth and fifth terms are the exchange of gas between the bubble and wake phases and between the wake and dense phases, respectively. The last two terms represent species consumption rates due to homogeneous and heterogeneous reactions, respectively.
3.2.3.3 Dense phase
For the dense phase, the mass balance equation can be derived as
0R))}A(1f(1f{1RA)]f(1f[1)C-(CAKfzd
}uA)]f(1f{[1d)CC(
zd}CuA)]f(1f{[1d
pd,i,mfwbgd,i,mfwbwi,di,wdb
dg,mfwbwi,4di,3
di,dg,mfwb
=ε−+−+ε+−++
ε+−λ+λ−
ε+− (17)

Annual Report - Year 1 DE-FC26-02NT41490
27
The terms in the above equation represent convection, cross-flow, exchange of gas between the dense and wake phases, species consumption rates due to homogeneous and heterogeneous reactions, respectively.
3.2.3.4 Freeboard region
In the freeboard, homogeneous reactions, especially the water-gas shift reaction and the methane-steam reforming reaction, continue. The mass balance equation must account for these reactions. The species mass balance equation is
0RdzCd
u f,if,i
0 =+ (18)
3.2.4 Exchange Coefficients The mass exchange coefficients have been adopted from Kunii and Levenspiel [1]. The mass transfer coefficient between the bubble phase and the wake phase is
bmf25.1
b25.05.0
gbw d/u5.4)d/gD(85.5K += (19)
where Dg is the gas diffusivity and db is the bubble diameter. The mass exchange coefficient
between the wake and emulsion phases is taken as
213bmfgbwd )d/Dgd71.0(77.6K ε= (20)
3.2.5 Energy Balance Assume the gas in the bubble phase, the wake phase and the dense phase has the same temperature. An energy balance for the gas phase can be written as
0Q)RH()]f(1f[1
)RH(ffR)H(f
)T)(T)](1f(1f[1d
6h)T)(T(1ff
d6h
zdTd
uC
tn
1igd,i,gd,i,mfwb
n
1igw,i,gw,i,mfwbbi,
n
libi,b
dp,gmfwbp
dwp,gmfwb
p
wg0gpg
=+∆−ε+−+
∆−ε+∆−+
−ε−+−+−ε−+ρ
∑
∑∑
=
==
(21)
where dp is the particle diameter; hw and hd are the heat transfer coefficients between the gas and the particles in the wake phase, and between the gas and the particles in the dense phase, respectively, and can be readily estimated using correlations given in Kunii and Levenspiel [1]. The first term in the above equation arises due to particle motion. The second term represents the convective heat transfer between the gas in the wake phase and the solids in the wake phase. Similarly, the third term accounts for the convective transfer between the gas in the dense phase
Annual Report - Year 1 DE-FC26-02NT41490
28
and the solids in the dense phase. The fourth, fifth and sixth terms represent the gas phase reactions in the bubble phase, the wake phase and the dense phase, respectively. The last term is the heat transferred to the bed from the pulse combustors. Similarly, for the particles in the wake phase, the energy balance equation can be derived as
0QAR)H(-)T(Td
6h)1(Aff
zdA)ff(ud
)TT()1(C
)T(TAK)1(ffCzd
)ATff(ud)1(C
vappw,i,n
1isw,i,gwp,
p
wmfwb
wbbdp,6wp,5mfppp
dp,wp,pwd,mfwbpppwp,wbb
mfppp
=+⎪⎭
⎪⎬⎫
⎪⎩
⎪⎨⎧
∆+−ε−+
λ+λε−ρ−
−ε−ρ+ε−ρ
∑=
(22)
where Qvap is the energy required to vaporize the water in the black liquor. The second term accounts for the heat transfer due to the solids exchange between the wake phase and the dense phase. The fourth term represents heat exchange between the solids and the gas in the wake phase and the energy consumption due to the heterogeneous reactions in the wake phase. Other terms are similar to those in the previous equations. A similar energy balance equation can be written for the particles in the dense phase,
0)RH(-)T(Td
6h)]Af(1f[1
zdA)ff(ud
)TT(C
)T(TAKffCzd
))]ATf(1f-[1{udC
n
1ipd,i,pd,i,gdp,
p
dwb
wbbdp,6wp,5ppp
wp,dp,pwd,wbpppdp,wbdp,
ppp
=⎪⎭
⎪⎬⎫
⎪⎩
⎪⎨⎧
∆+−+−+
λ+λρ+
−ρ++
ρ
∑=
(23)
Assume that there is not heat exchange between the gas phase and the reactor wall in the freeboard, the energy balance for the freeboard is then given by
0R)H(dz
dTCu
f,if,i
n
li
ggpg0 =∆−+ρ ∑
= (24)
The second term represents heat of reactions due to the homogeneous reactions.
3.2.6 Boundary Conditions The boundary conditions for the energy balance equations are: at the bottom of the bed,
pmfbwb
d,ppd,pmfwb0ppw,pinlet,gg A)1(uff
TAu)1)](f1(f1[TmT;TT
ρε−
ρε−+−−== 0zat = (25)
Annual Report - Year 1 DE-FC26-02NT41490
29
at the top surface of the fluidized bed,
w,pd,p TT = tHzat = (26)
The boundary conditions for the mass balance equations depend on the direction of the gas flow in the dense phase. If 0zat0u e,g => , then, at the gas distributor,
inlet,id,iw,ib,i CCCC === 0zat = (27)
However, if 0zat0u d,g =< , then, at the bottom of the bed,
bmfwb
e,ie,gmfwbinlet,ibb0w,iinlet,ib,i uff
Cu)]f1(f1[C)ufu(C;CC
ε
ε+−−−== 0zat = (28)
and at the top of the bed,
w,id,i CC = tHzat = (29)
3.2.7 Drying and Devolatilization of Black Liquor Experimental data show that drying and devolatilization of black liquor are heat transfer controlled processes under recovery furnace conditions [13]. Experiments and model simulations also indicate that, under these conditions, drying and devolatilization take place simultaneously as black liquor droplets are heated [14,15]. However, under the conditions considered here, it is expected that drying and devolatilization occur consecutively. It is assumed that devolatilization takes place only after the droplets are completely dry. The energy balance for a single black liquor droplet can be written as
vapvappgp
wpppp m)TT(
dh6
dtdT
C λ−−=ρ (30)
where vapm is the volumetric evaporation rate (kg/m3s) of black liquor water and vapλ is the latent heat of evaporation. If drying is a heat transfer controlled process, black liquor droplets can then be assumed to be at pseudo-steady state, thus,
)TT(d
h6m pg
vapp
wvap −
λ= (31)
Annual Report - Year 1 DE-FC26-02NT41490
30
where Tg is the local gas temperature. Droplet temperature, Tp, can be assumed to be the temperature of the boiling point of water at the local pressure. Drying begins once black liquor enters the fluidized bed and is complete when all the water in black liquor vaporizes.
For simplicity, it is assumed that devolatilization time is the same as that of drying. The fraction of each component in black liquor released into the gas phase depends on the environmental temperature to which the black liquor subjects. Reported correlations [2,3] are used to determine C, H, O and S release rates. Volatiles are assumed to consist of CH4, CO, H2O and H2S. The amount of each gas species released can be determined from an elemental mass balance.
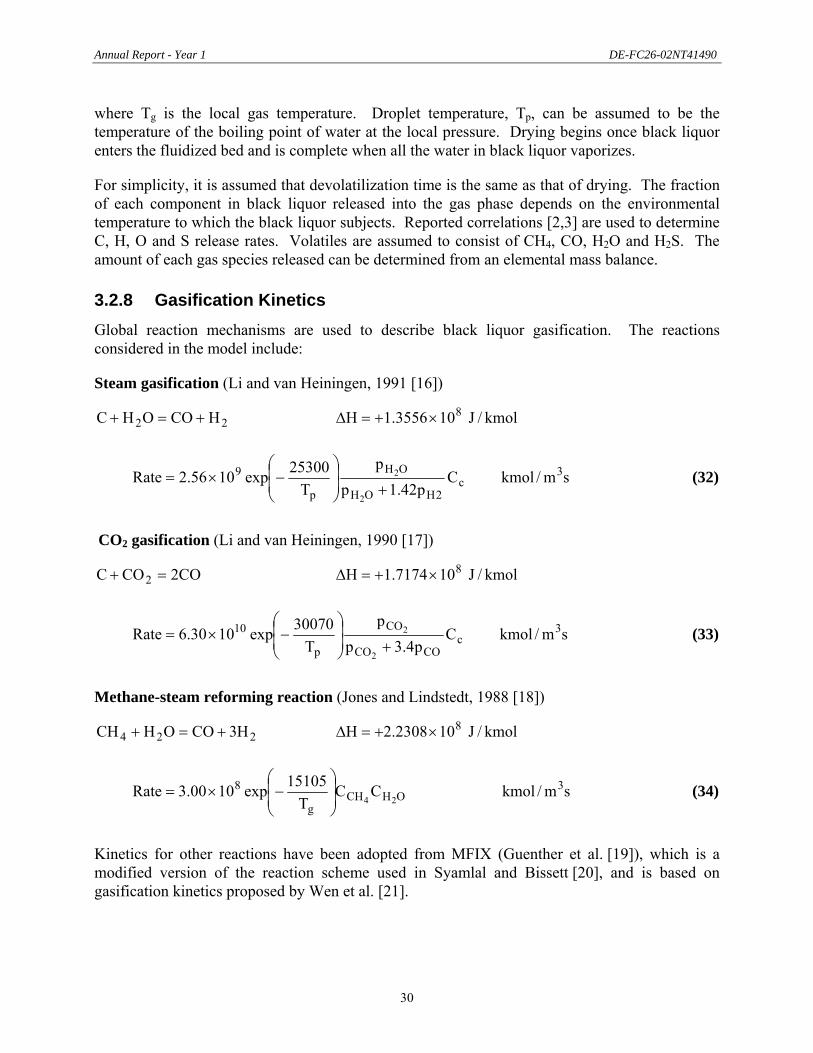
3.2.8 Gasification Kinetics Global reaction mechanisms are used to describe black liquor gasification. The reactions considered in the model include:
Steam gasification (Li and van Heiningen, 1991 [16])
22 HCOOHC +=+ kmol/J103556.1H 8×+=∆
sm/kmolCp42.1p
pT
25300exp1056.2Rate 3c
2HOH
OH
p
9
2
2
+⎟⎟⎠
⎞⎜⎜⎝
⎛−×= (32)
CO2 gasification (Li and van Heiningen, 1990 [17])
CO2COC 2 =+ kmol/J107174.1H 8×+=∆
sm/kmolCp4.3p
pT
30070exp1030.6Rate 3c
COCO
CO
p
10
2
2
+⎟⎟⎠
⎞⎜⎜⎝
⎛−×= (33)
Methane-steam reforming reaction (Jones and Lindstedt, 1988 [18])
224 H3COOHCH +=+ kmol/J102308.2H 8×+=∆
sm/kmolCCT
15105exp1000.3Rate 3OHCH
g
824⎟
⎟⎠
⎞⎜⎜⎝
⎛−×= (34)
Kinetics for other reactions have been adopted from MFIX (Guenther et al. [19]), which is a modified version of the reaction scheme used in Syamlal and Bissett [20], and is based on gasification kinetics proposed by Wen et al. [21].

Annual Report - Year 1 DE-FC26-02NT41490
31
Methanation (Wen et al. [21], Syamlal and Bissett [20])
42 CHH2C =+ kmol/J107519.8H 7×−=∆
sm/kmolC)pp(T
8078087.7exp1087.9Rate 3c
*HH
p
622
−⎟⎟⎠
⎞⎜⎜⎝
⎛−−×= − (35)
where
)T/1099943.13exp(p1001325.1
pp
CH5
*H
42 +−
×= (36)
Carbon combustion (Wen et al. [21], Syamlal and Bissett [20])
COOC 221 =+ kmol/J101129.1H 8×−=∆
skmol/m
k1
k1 d
p 109215.5 = Rate 3
rfp
O4
2
⎟⎟⎠
⎞⎜⎜⎝
⎛+
× −
(37)
where the film resistance is given by
T R d
Sh D100 = k
fOp
Of
2
2 (38)
where 2OR is the gas constant for oxygen, Kg/Pam25982.0R 3
2O ⋅⋅= ; Tf is the film temperature and can be calculated as
2/)TT(T pgf += (39)
The Sherwood number is given by (Gunn [22])
Sc Re ) 1.2 + 2.4 - (1.33 + ) Sc Re 0.7 + (1 )5 + 10 - 7 ( =Sh 1/30.72gg
1/30.22gg εεεε (40)
Annual Report - Year 1 DE-FC26-02NT41490
32
The surface reaction rate is given by (Desai and Wen [23])
smPa/g T
13587- exp 860 = k 2
pr ⋅⋅⎟
⎟⎠
⎞⎜⎜⎝
⎛ (41)
CO combustion (Westbrook and Dryer [24])
2221 COOCO =+ kmol/J108303.2H 8×−=∆
sm/kmol CCCT
20130-exp 10238.2Rate 35.0OHCO
25.0O
g
1222⎟
⎟⎠
⎞⎜⎜⎝
⎛×= (42)
CH4 combustion (Westbrook and Dryer [24])
OH2COO2CH 2224 +=+ kmol/J10005.8H 8×−=∆
sm/kmol CCT
24356-exp 1012.2Rate 32.0CH
3.1O
g
1142⎟
⎟⎠
⎞⎜⎜⎝
⎛×= (43)
H2 combustion (Peters [25])
OHOH 2221
2 =+ kmol/J104686.2H 8×−=∆
sm/kmol CCT
15100-exp 1008.1Rate 3HO
g
322⎟
⎟⎠
⎞⎜⎜⎝
⎛×= (44)
Water-gas shift reaction (Wen et al. [21])
222 COHOHCO +=+ kmol/J106176.3H 7×−=∆
sm/kmol )K/CCCC(T
13969-exp
1001325.1Pf10956.1Rate
33HCOOHCO
g
)1001325.1250
P5.0(
536
222
5
−⎟⎟⎠
⎞⎜⎜⎝
⎛
⎟⎠
⎞⎜⎝
⎛
××= ××
−
(45)
Annual Report - Year 1 DE-FC26-02NT41490
33
where
ashg3
3 )CT5553/+(-8.91exp10 = f − (46)
and the equilibrium constant is given by
)T/3955.71+61exp(-3.630 = K g3 (47)
The reactions involving oxygen are insignificant since for the system considered here, there is not oxygen in the inlet streams or oxygen formed in the bed. However, these reactions are included so that the computer code developed may also be used for combustion of black liquor. The above mechanisms only account for gasification and combustion of carbon in black liquor. Since black liquor contains significant amount of oxygen and considerable amount of hydrogen, it is important to also consider the release of elemental oxygen and hydrogen from black liquor during gasification. It is assumed that ash consists of sodium carbonate and potassium carbonate. The release rates of elemental oxygen and hydrogen are assumed to be proportional to the carbon gasification/combustion rate and the ratio of the amount of elemental oxygen or hydrogen available for release to the amount of carbon available for gasification. Elemental oxygen and elemental hydrogen are assumed to release as water vapor and hydrogen or carbon monoxide depending on the relative release rates of elemental oxygen and hydrogen.
Annual Report - Year 1 DE-FC26-02NT41490
34
4. RESULTS AND DISCUSSION During the first year of the project, efforts were focused largely on setting up experimental devices and developing computational models of fluidized bed gasifiers. The following sections present experimental results from the cold flow model and predictions of the computational models.
4.1 Results of Cold Flow Model Operation
Results from the cold flow model have so far been qualitative in nature. The system has been videotaped under conditions that simulate the standard conditions designated for the real Utah gasification test system. In addition, videos have been shot of the system operating with different bed heights and gas flow rates. These videos were digitized and stored as computer files. The conditions under which the cold flow model has been operated are summarized in Table 3.
TABLE 3. CONDITIONS OF OPERATION FOR COLD FLOW MODEL
Parameter Cold Flow Model Corresponding Real System
Slumped bed height (inch) 14.0, 18.0, 22.0, 26.0, 30.0 21.5, 27.7, 33.8, 40, 46.2
Gas flow rate (scfm) 7.4, 11.1, 14.8 20.2, 30.3, 40.4 Superficial gas velocity (ft/s) 0.53, 0.80, 1.07 0.65, 0.98, 1.30
One of the motivations for constructing the cold flow model was to determine the extent of slugging in the bed, since the reactor has a relatively tall height-to-diameter ratio. Under the operating conditions targeted as standard conditions for the gasifier, slugging was not apparent either above or below the tube bundles at all gas velocities tested. The presence of the tube bundles in the bed undoubtedly reduces slugging by breaking up larger bubbles that may have formed through coalescence in the bottom part of the bed.
Another motivation for constructing the cold flow model was to improve the understanding of gas and solid flow through the system. Though efforts are in progress to determine gas and solid flow within tube bundles and in the center of the bed, results so far are based only on what can be seen near the walls of the reactor. From these observations alone, it is clear that for the cold flow configuration and conditions, (1) in the region below the tube bundles, solids flow downwards against the walls and (2) bubbles do pass through the tube bundles, rather than all bypassing the tube bundles in the open areas on the sides. It is not clear whether solids consistently travel downwards against the walls within or above the tube bundles. These regions are much more turbulent than the lower part of the bed. It is also not clear whether solids mix well throughout the entire reactor, or whether the presence of tube bundles creates two or three zones (e.g. below the tube bundles, within the tube bundles, above the tube bundles) with the solids mixing well within a particular zone but not transferring well between zones.
Annual Report - Year 1 DE-FC26-02NT41490
35
One interesting behavior that was observed is the momentary development of voids just below the tube banks. The voids develop on the bottom sides of the tubes and then expand downwards, creating a volume free of particles that is approximately one tube diameter (11mm, 0.4") wide and up to 7-8 tube diameters (80mm, 3.2") high below and attached to the tubes. This behavior is particularly apparent at higher gas velocities and can easily be seen when videos of close-ups of the tube bundle sections are replayed in slow motion. The voids are most commonly filled with solids falling from above, thereby making this an efficient mechanism for transferring solids downwards through the reactor. The effect is not clearly associated with bubbles rising through the bed, and it tends to occur below an entire tube bank rather than below individual tubes. It is not clear whether this phenomenon occurs in the center of the bed, or if it is an effect that is restricted to the near-wall region.
It should be noted that all results from the cold flow model are specific to University of Utah's gasification test system, on which the model is based, and are not necessarily representative of what occurs in a full-scale steam reformer reactor.
4.2 Computational Modeling Results
4.2.1 Modeling of Georgia-Pacific's Big Island Steam Reformer
4.2.1.1 UU Model Results
The geometries, conditions and black liquor properties expected for Georgia-Pacific's Big Island steam reformer (standard conditions) were input to the UU model. Some key operational parameters are presented in Table 4.
The progressions of predicted superficial and actual average gas velocities through the bed are presented in Figure 16. The "bottom" level in the figure takes into consideration only the gases (steam and recycled product gas) entering through the distributor. In Level 0, where gases from liquor drying and pyrolysis are added to the system, the gas velocity nearly doubles. As the gas continues upwards through the bed, heterogeneous gasification reactions continue to take place and the products of these contribute to the overall gas volume. This gas addition, combined with a decrease in gas density as the pressure decreases higher in the bed, results in an overall increase in gas velocity. At the top of the bed (Level 10), the gas velocity is almost double what it is at the liquor injectors (Level 0) and roughly four times what it is just above the distributor.
It should be noted that the UU model does not account for the presence of the heater bundles when calculating gas velocities. Within the heater bundle sections the overall cross sectional area is less, so the gas velocity will be somewhat higher than shown in the figure.
Gas composition profiles predicted by the UU model are shown in Figure 17. As expected, steam concentration decreases as it reacts with the liquor to form the product gases of the steam-carbon reaction, hydrogen and carbon monoxide. The concentrations of these product gases increase as the gas moves upwards in the bed. Carbon monoxide and hydrogen are present already in the bottom of the reactor because some of the product gas from the system is recycled and fed into the reactor through the distributor.
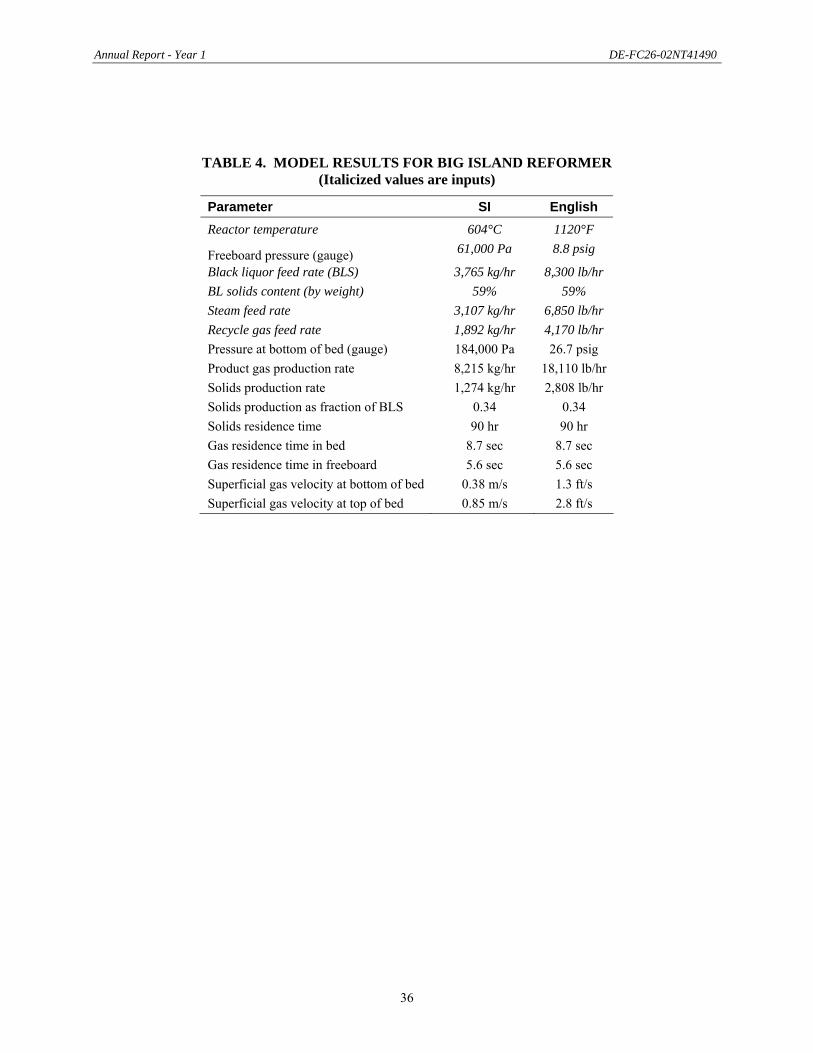
Annual Report - Year 1 DE-FC26-02NT41490
36
TABLE 4. MODEL RESULTS FOR BIG ISLAND REFORMER (Italicized values are inputs)
Parameter SI English Reactor temperature 604°C 1120°F
Freeboard pressure (gauge) 61,000 Pa 8.8 psig
Black liquor feed rate (BLS) 3,765 kg/hr 8,300 lb/hr BL solids content (by weight) 59% 59% Steam feed rate 3,107 kg/hr 6,850 lb/hr Recycle gas feed rate 1,892 kg/hr 4,170 lb/hr Pressure at bottom of bed (gauge) 184,000 Pa 26.7 psig Product gas production rate 8,215 kg/hr 18,110 lb/hr Solids production rate 1,274 kg/hr 2,808 lb/hr Solids production as fraction of BLS 0.34 0.34 Solids residence time 90 hr 90 hr Gas residence time in bed 8.7 sec 8.7 sec Gas residence time in freeboard 5.6 sec 5.6 sec Superficial gas velocity at bottom of bed 0.38 m/s 1.3 ft/s Superficial gas velocity at top of bed 0.85 m/s 2.8 ft/s
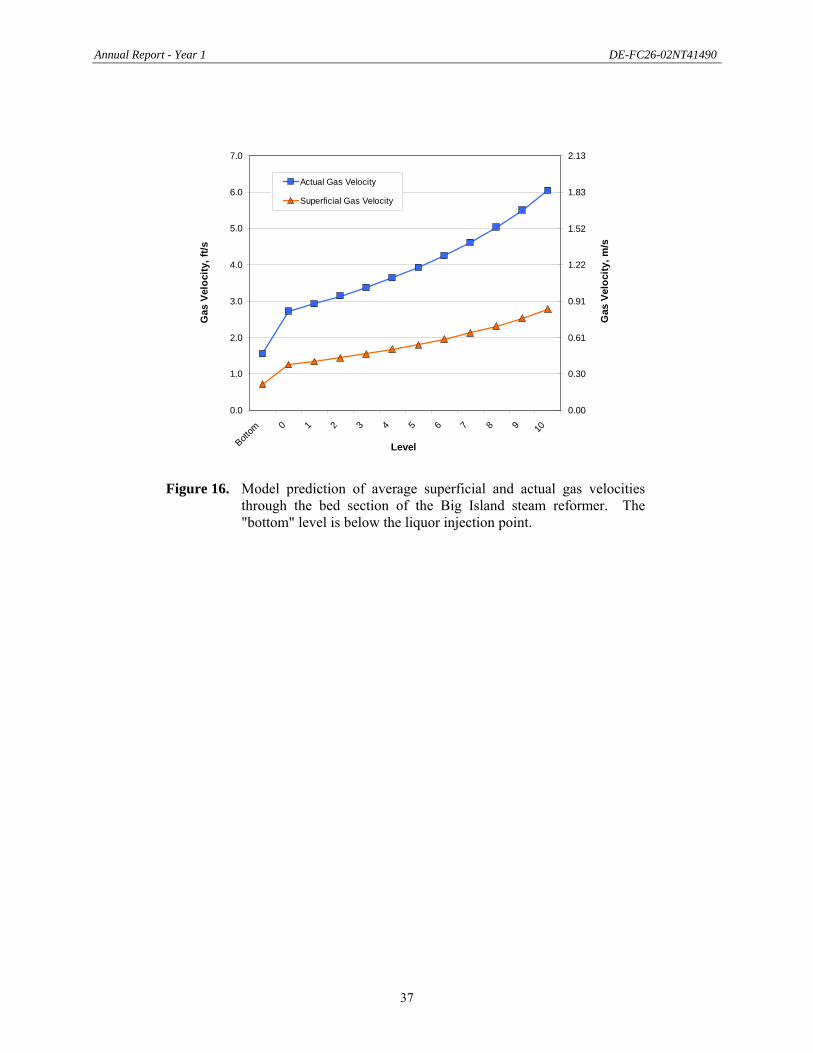
Annual Report - Year 1 DE-FC26-02NT41490
37
0.0
1.0
2.0
3.0
4.0
5.0
6.0
7.0
Bottom 0 1 2 3 4 5 6 7 8 9 10
Level
Gas
Vel
ocity
, ft/s
0.00
0.30
0.61
0.91
1.22
1.52
1.83
2.13
Gas
Vel
ocity
, m/s
Actual Gas Velocity
Superficial Gas Velocity
Figure 16. Model prediction of average superficial and actual gas velocities through the bed section of the Big Island steam reformer. The "bottom" level is below the liquor injection point.
Annual Report - Year 1 DE-FC26-02NT41490
38
0%
10%
20%
30%
40%
50%
60%
70%
80%
Bottom 0 1 2 3 4 5 6 7 8 9 10
Level
H2O
, CO
2, H
2, C
O C
once
ntra
tion,
vol
%
0.00%
0.01%
0.02%
0.03%
0.04%
0.05%
0.06%
0.07%
0.08%
H2S
Con
cent
ratio
n, v
ol%
H2OCO2H2COH2S
Figure 17. Model prediction of gas composition throughout the bed in the Big Island reformer under "standard" conditions. The "bottom" level is below the liquor injection point.
4.2.1.2 REI Model Results
Simulation of the Big Island steam reformer using the Reaction Engineering International model has been performed using the following process conditions:
• Black liquor solids: 8300 lb/hr • Liquor solids mass fraction: 0.59 • Steam flow rate: 6850 lb/hr • Recycle gas: 4170 lb/hr • Pressure in the freeboard: 8.8 psig • Solids removal rate: 2835 lb/hr • Pulse combustor energy input: 7.84 MW
These are the same conditions used in the University of Utah model (Table 4). The solids removal rate is slightly different in the two cases due to different degrees of carbon conversion for the two models. In the University of Utah model, carbon conversion is an input, and was assumed to be 99% in the results given above. In the REI model, carbon conversion is calculated based on the chemistry and reaction kinetics of the system. For the case presented here, conversion was calculated to be 98.7%.

Annual Report - Year 1 DE-FC26-02NT41490
39
Mass flow rate and gas velocity. Figure 18 depicts the superficial gas velocity and the gas mass flow rate as functions of the reactor height (including the freeboard). A jump increase in both the gas mass flow rate and the superficial gas velocity near the bottom of the fluidized bed is due to the vaporization of black liquor water and pyrolysis of black liquor, after which, the gas mass flow rate increases gradually because of gasification of black liquor. Inside the tube bundles, decreases in the cross-sectional area lead to spikes in the gas velocity. In the freeboard, the gas mass flow rate remains constant, whilst the gas velocity in the freeboard changes because of the expansion of the freeboard and changes in the gas temperature.
The superficial gas velocity profile in Figure 18 is in good agreement with that predicted by the UU model (Figure 16). The velocity increases from approximately 0.4 to 0.8 m/s over the bed section in both cases. The University of Utah model does not take into consideration the volume occupied by the heater tubes, so the velocity curve does not have the spikes seen in Figure 18.
0
0.2
0.4
0.6
0.8
1
0 0.2 0.4 0.6 0.8 1
dimensionless height
supe
rfici
al g
as v
eloc
ity, m
/s
1
1.5
2
2.5
3
gas
mas
s flo
w ra
te, k
g/s
Bed Freeboard
0
0.2
0.4
0.6
0.8
1
0 0.2 0.4 0.6 0.8 1
dimensionless height
supe
rfici
al g
as v
eloc
ity, m
/s
1
1.5
2
2.5
3
gas
mas
s flo
w ra
te, k
g/s
Bed Freeboard
Figure 18. Gas velocity and gas mass flow rate as functions of reactor height.
The bubble properties predicted by the REI model are shown in Figure 19. Inside the tube bundles, bubble size is assumed to be the same as the tube pitch. In the open space between the tube banks and the confining cylindrical walls, the maximum bubble size is assumed to be 1/3 of the open space size. In the model calculations, an area-averaged bubble size is used. Also shown in the figure are the bubble sizes for a fluidized bed without any horizontal tubes; for this case, bubbles keep growing along the bed height. The bubble fraction is in the range of 0.15 to 0.45; spikes inside the tube bundles are due to increase in the superficial gas velocity.
Temperature profiles. Figure 20 shows gas and particle temperatures as functions of the reactor height. It can be seen that particle temperature is essentially the same as the gas temperature; this is not surprising since, with a diameter of 300 microns, the solid particles have a very large surface area in contact with the gas phase. A small decrease in the temperature near the bottom

Annual Report - Year 1 DE-FC26-02NT41490
40
0
0.3
0.6
0.9
1.2
1.5
1.8
0 0.1 0.2 0.3 0.4 0.5
dimensionless height
bubb
le s
ize,
m
0
0.1
0.2
0.3
0.4
bubb
le fr
actio
n
Bubble fraction
Average bubble size
Bubble size in a tube-free bed
Bubble size in open space
Bubble size in the tube banks
0
0.3
0.6
0.9
1.2
1.5
1.8
0 0.1 0.2 0.3 0.4 0.5
dimensionless height
bubb
le s
ize,
m
0
0.1
0.2
0.3
0.4
bubb
le fr
actio
n
Bubble fraction
Average bubble size
Bubble size in a tube-free bed
Bubble size in open space
Bubble size in the tube banks
Figure 19. Variation of bubble properties with bed height.
840
850
860
870
880
890
900
0 0.2 0.4 0.6 0.8 1
dim ens ionless height
tem
pera
ture
, K
TgTp,w
Tp,d
Bed Freeboard
1160
1124
1052
1070
1088
tem
pera
ture
, °F
1142
1106
840
850
860
870
880
890
900
0 0.2 0.4 0.6 0.8 1
dim ens ionless height
tem
pera
ture
, K
TgTp,w
Tp,d
Bed Freeboard
1160
1124
1052
1070
1088
tem
pera
ture
, °F
1142
1106
Figure 20. REI model predictions of gas temperature and particle temperature as functions of reactor height.
Annual Report - Year 1 DE-FC26-02NT41490
41
of the bed is due to the evaporation of water, followed by a gradual increase in the temperature resulting from heat transferred from the pulse combustors. A marginal decrease in the temperature near the bed surface is due to the endothermic carbon gasification reactions. In the freeboard, there are two major gas phase reactions: the water-gas shift reaction and the methane-water reforming reaction; the former is an exothermic reaction and the latter is an endothermic reaction. The magnitudes of these two reactions determine the gas temperature. The gas temperature increases in the freeboard because of a higher rate of the water-gas shift reaction. Near the top of the freeboard region, however, the gas temperature decreases due to the endothermic methane-steam reforming reaction.
Carbon conversion. Using the expressions for reaction kinetics described in Section 3.2.8, carbon conversion is predicted to be 98.7%. The expressions for black liquor gasification rates (Equations 32 and 33), however, may be unrepresentatively high for Georgia-Pacific's Big Island demonstration. These expressions were developed from atmospheric pressure experiments on kraft liquor. The Big Island system operates under slightly pressurized conditions, and pressure is known to decrease gasification rates [26]. The Big Island liquor is a carbonate liquor, and it is known that char gasification rates vary between liquors and liquor types [27].
The sensitivity of carbon conversion to the char gasification rate was explored using the REI model. Black liquor reactivity was changed by multiplying the pre-exponential factor of the gasification rate expressions by a factor between 0.2 and 1.0, corresponding to 20% and 100% of the rates predicted with the van Heiningen expressions (Equations 32 and 33) for kraft liquor. The results are shown in Figure 21 and Figure 22. It can be seen that changes in temperature at the bed surface and higher heating value of the syngas are small, increasing by 10°C and decreasing by about 1.5%, respectively, as the relative rate decreases from 1.0 to 0.2. However, the average carbon concentration in the bed increases by a factor of 3.5, and conversion decreases from 98.7 to 95.6%, as the relative rate decreases from 1.0 to 0.2
Gas composition. The exit syngas compositions predicted by the current model (REI model) and the University of Utah model are compared with the design syngas composition in Figure 23. It can be seen that the present model predictions are in good agreement with other data.
Figure 24 shows variation of gas composition in the fluidized bed as calculated by the REI model. Following a small increase in the black liquor injection point, the water vapor concentration decreases gradually as the gasification proceeds along the height of the bed, while hydrogen and carbon monoxide concentrations increase. In the freeboard, due to the water gas shift reaction, both hydrogen and carbon dioxide concentrations increase and water vapor and carbon monoxide concentrations decrease.
The predicted gas compositions through the bed for the REI model (left side of Figure 24) and University of Utah model (Figure 17) do not agree well. The steam and carbon monoxide concentrations are higher in the REI model (52 versus 34% for H2O and 13 versus 8% for CO) while hydrogen and carbon monoxide are lower (29 versus 44% and 5% versus 14% for CO2). This is a consequence of the different treatments of the water-gas shift reaction. The simpler UU model assumes that this reaction is at equilibrium at all points through the reactor, and forces it to be such. Consequently, gas compositions in the UU model do not vary throughout the freeboard.
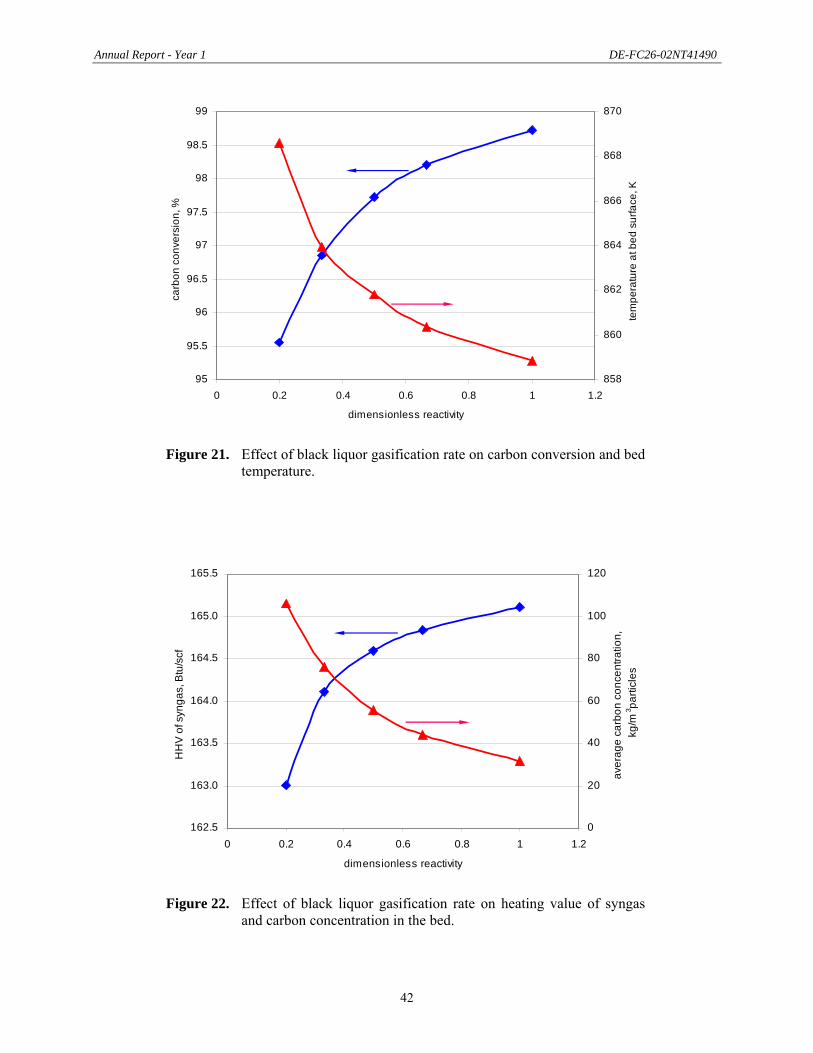
Annual Report - Year 1 DE-FC26-02NT41490
42
95
95.5
96
96.5
97
97.5
98
98.5
99
0 0.2 0.4 0.6 0.8 1 1.2
dimensionless reactivity
carb
on c
onve
rsio
n, %
858
860
862
864
866
868
870
tem
pera
ture
at b
ed s
urfa
ce, K
95
95.5
96
96.5
97
97.5
98
98.5
99
0 0.2 0.4 0.6 0.8 1 1.2
dimensionless reactivity
carb
on c
onve
rsio
n, %
858
860
862
864
866
868
870
tem
pera
ture
at b
ed s
urfa
ce, K
Figure 21. Effect of black liquor gasification rate on carbon conversion and bed temperature.
162.5
163.0
163.5
164.0
164.5
165.0
165.5
0 0.2 0.4 0.6 0.8 1 1.2
dimensionless reactivity
HH
V of
syn
gas,
Btu
/scf
0
20
40
60
80
100
120
aver
age
carb
on c
once
ntra
tion,
kg
/m3 pa
rticl
es
162.5
163.0
163.5
164.0
164.5
165.0
165.5
0 0.2 0.4 0.6 0.8 1 1.2
dimensionless reactivity
HH
V of
syn
gas,
Btu
/scf
0
20
40
60
80
100
120
aver
age
carb
on c
once
ntra
tion,
kg
/m3 pa
rticl
es
Figure 22. Effect of black liquor gasification rate on heating value of syngas and carbon concentration in the bed.
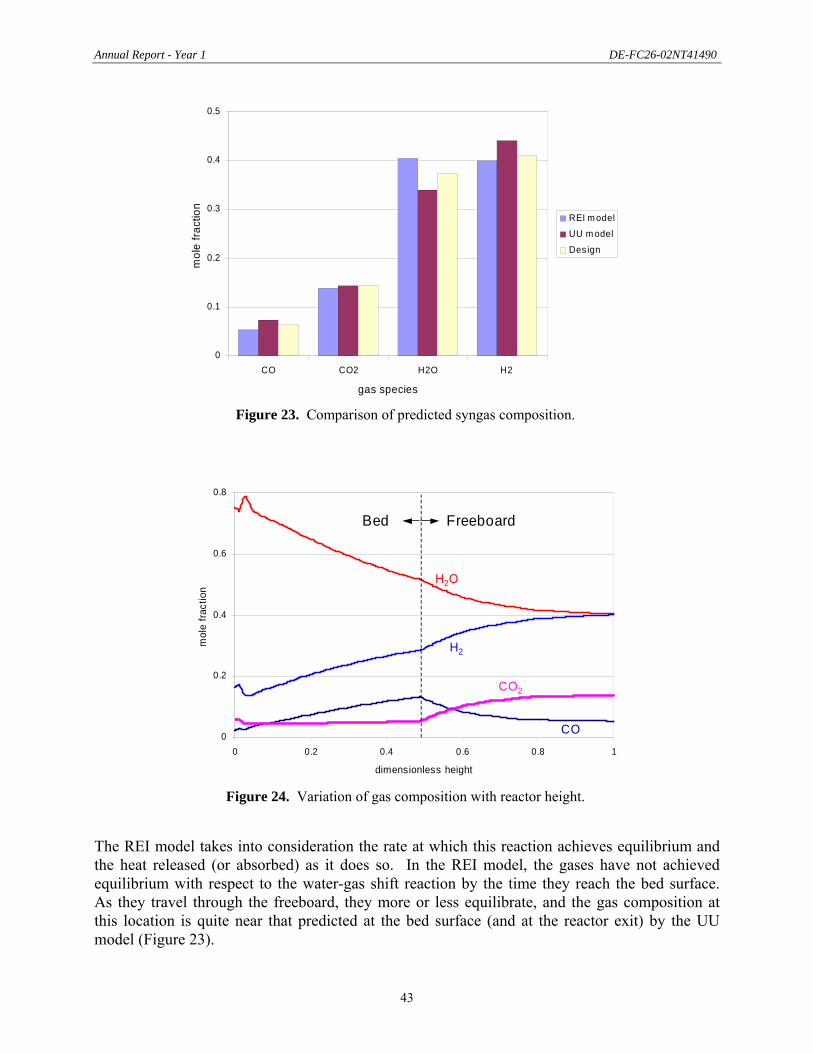
Annual Report - Year 1 DE-FC26-02NT41490
43
0
0.1
0.2
0.3
0.4
0.5
CO CO2 H2O H2
gas species
mol
e fra
ctio
n
REI m odelUU m odel
Des ign
Figure 23. Comparison of predicted syngas composition.
0
0.2
0.4
0.6
0.8
0 0.2 0.4 0.6 0.8 1
dimensionless height
mol
e fra
ctio
n
H2O
H2
CO
CO2
Bed Freeboard
0
0.2
0.4
0.6
0.8
0 0.2 0.4 0.6 0.8 1
dimensionless height
mol
e fra
ctio
n
H2O
H2
CO
CO2
Bed Freeboard
Figure 24. Variation of gas composition with reactor height.
The REI model takes into consideration the rate at which this reaction achieves equilibrium and the heat released (or absorbed) as it does so. In the REI model, the gases have not achieved equilibrium with respect to the water-gas shift reaction by the time they reach the bed surface. As they travel through the freeboard, they more or less equilibrate, and the gas composition at this location is quite near that predicted at the bed surface (and at the reactor exit) by the UU model (Figure 23).
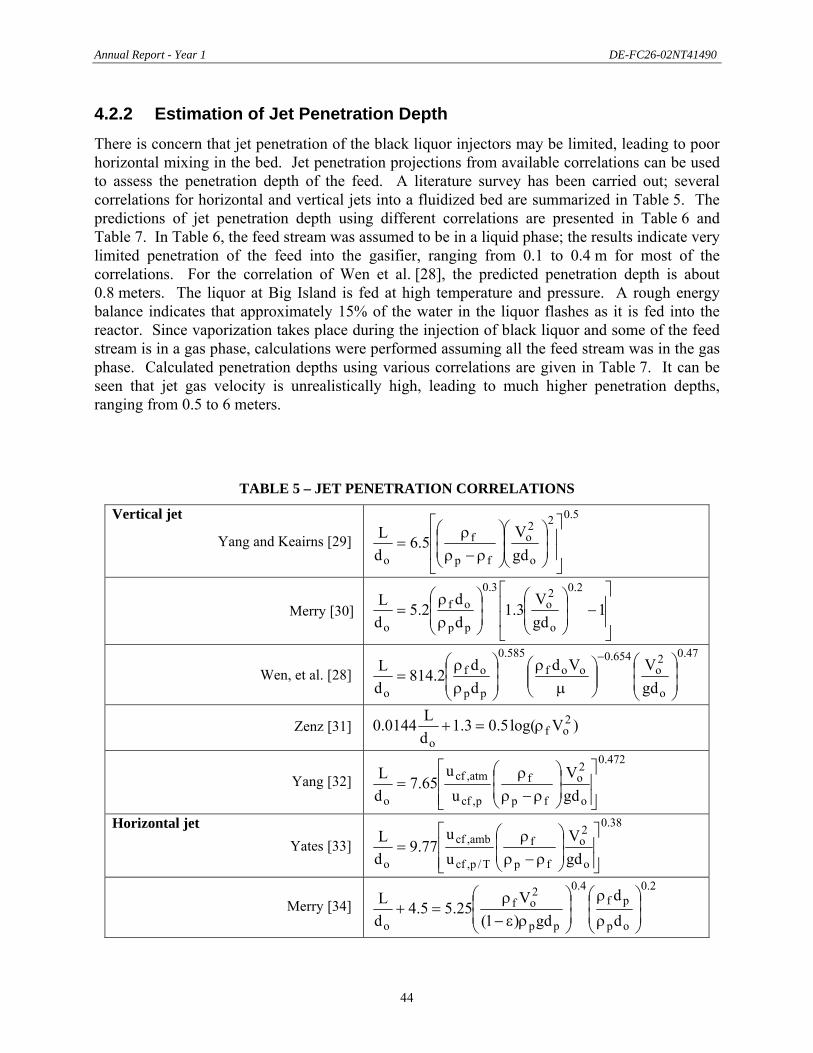
Annual Report - Year 1 DE-FC26-02NT41490
44
4.2.2 Estimation of Jet Penetration Depth There is concern that jet penetration of the black liquor injectors may be limited, leading to poor horizontal mixing in the bed. Jet penetration projections from available correlations can be used to assess the penetration depth of the feed. A literature survey has been carried out; several correlations for horizontal and vertical jets into a fluidized bed are summarized in Table 5. The predictions of jet penetration depth using different correlations are presented in Table 6 and Table 7. In Table 6, the feed stream was assumed to be in a liquid phase; the results indicate very limited penetration of the feed into the gasifier, ranging from 0.1 to 0.4 m for most of the correlations. For the correlation of Wen et al. [28], the predicted penetration depth is about 0.8 meters. The liquor at Big Island is fed at high temperature and pressure. A rough energy balance indicates that approximately 15% of the water in the liquor flashes as it is fed into the reactor. Since vaporization takes place during the injection of black liquor and some of the feed stream is in a gas phase, calculations were performed assuming all the feed stream was in the gas phase. Calculated penetration depths using various correlations are given in Table 7. It can be seen that jet gas velocity is unrealistically high, leading to much higher penetration depths, ranging from 0.5 to 6 meters.
TABLE 5 – JET PENETRATION CORRELATIONS
Vertical jet
Yang and Keairns [29]
5.02
o
2o
fp
f
o gdV
5.6dL
⎥⎥
⎦
⎤
⎢⎢
⎣
⎡
⎟⎟⎠
⎞⎜⎜⎝
⎛⎟⎟⎠
⎞⎜⎜⎝
⎛
ρ−ρρ
=
Merry [30]
⎥⎥
⎦
⎤
⎢⎢
⎣
⎡−⎟
⎟⎠
⎞⎜⎜⎝
⎛⎟⎟⎠
⎞⎜⎜⎝
⎛
ρρ
= 1gdV
3.1dd
2.5dL
2.0
o
2o
3.0
pp
of
o
Wen, et al. [28]
47.0
o
2o
654.0oof
585.0
pp
of
o gdVVd
dd
2.814dL
⎟⎟⎠
⎞⎜⎜⎝
⎛⎟⎟⎠
⎞⎜⎜⎝
⎛µ
ρ⎟⎟⎠
⎞⎜⎜⎝
⎛
ρρ
=−
Zenz [31] )Vlog(5.03.1
dL0144.0 2
ofo
ρ=+
Yang [32]
472.0
o
2o
fp
f
p,cf
atm,cf
o gdV
uu
65.7dL
⎥⎥⎦
⎤
⎢⎢⎣
⎡⎟⎟⎠
⎞⎜⎜⎝
⎛
ρ−ρρ
=
Horizontal jet
Yates [33]
38.0
o
2o
fp
f
T/p,cf
amb,cf
o gdV
uu
77.9dL
⎥⎥⎦
⎤
⎢⎢⎣
⎡⎟⎟⎠
⎞⎜⎜⎝
⎛
ρ−ρρ
=
Merry [34]
2.0
op
pf4.0
pp
2of
o dd
gd)1(V
25.55.4dL
⎟⎟⎠
⎞⎜⎜⎝
⎛
ρ
ρ⎟⎟⎠
⎞⎜⎜⎝
⎛
ρε−ρ
=+

Annual Report - Year 1 DE-FC26-02NT41490
45
TABLE 6 – JET PENETRATION DEPTH (FEED: LIQUID)
Jet diameter, d0, m 0.012 Number of jets 8 Stream density, kg/m3 1400 Velocity, m/s 0.849 Liquid L/d0 L, m Vertical jet Yang and Keairns [29] 20.48 0.24 Merry [30] 11.81 0.14 Wen, et al. [28] 68.85 0.81 Zenz [31] 8.02 0.09 Yang [32] 37.74 0.45 Horizontal Jet Yates [33] 35.31 0.42 Merry [34] 16.61 0.20
TABLE 7 – JET PENETRATION DEPTH (FEED: STEAM)
Jet diameter, d0, m 0.012 Number of jets 8 Stream density, kg/m3 1.55 Velocity, m/s 666.8 Steam L/d0 L, m Vertical jet Yang and Keairns [29] 331.67 3.93 Merry [30] 45.56 0.54 Wen, et al. [28] 95.80 1.13 Zenz [31] 106.41 1.26 Yang [32] 523.04 6.19 Horizontal Jet Yates [33] 239.17 3.47 Merry [34] 69.04 0.82
4.2.3 Prediction of Temperature History for Cold-Flow Model The University of Utah cold-flow fluidized bed described in Section 2.4 will be used to study solids mixing behavior in a bed with injection of a layer of hot particles into the top surface to better understand the overall particle circulation in the system. In response to this experiment, a transient cold-flow model which includes only the hydrodynamic model for the fluidized bed and energy balance equations for the gas phase and the particle phase has been developed. The hydrodynamic model is described in Section 3.2 (the REI model). However, the energy balance equations were modified for this study and are given below in details.
Annual Report - Year 1 DE-FC26-02NT41490
46
Heat exchange between the gas phase and the particles in the wake phase and in the dense, a transient energy balance for the gas phase can be written as
0)T)(T)](1f(1f[1d
6h
)T)(T(1ffd
6hz
TuC
tT
C
dp,gmfwbp
d
wp,gmfwbp
wg0gpg
ggpg
=−ε−+−+
−ε−+∂
∂ρ+
∂
∂ρ
(48)
For the particles in the wake phase, the transient energy balance equation is given by
0)T(Td
6hAff
zA)ff(u
)TT(C
)T(TAKffCz
)ATff(uC
t)Tf(f
AC
gwp,p
wwb
wbbdp,2wp,1ppp
dp,wp,pwd,wbpppwp,wbb
pppwp,wb
ppp
=−+∂
∂λ+λρ−
−ρ+∂
∂ρ+
∂
∂ρ
(49)
A similar energy balance equation can be written for the particles in the dense phase,
0)T(Td
6h)]Af(1f[1
zA)ff(u
)TT(C)T(TAKffCz
})]ATf(1f-[1{uC
t})]Tf(1f-{[1
AC
gdp,p
dwb
wbbdp,2wp,1pppwp,dp,pwd,wbppp
dp,wbdp,ppp
dp,wbppp
=−+−+∂
∂λ+λρ+−ρ+∂
+∂ρ+
∂
+∂ρ
(50)
The boundary conditions for the energy balance equations are: at the bottom of the bed,
d,pw,pinlet,gg TT;TT == 0zat = (51)
and, at the top surface of the fluidized bed,
w,pd,p TT = tHzat = (52)
The initial conditions are: for the gas phase, the initial gas temperature is the same as the inlet gas temperature; for the particle phase,
hotd,photw,p TT;TT == hotHzand0tat ≥= (53)
inlet,gd,pinlet,gw,p TT;TT == hotHzand0tat <= (54)
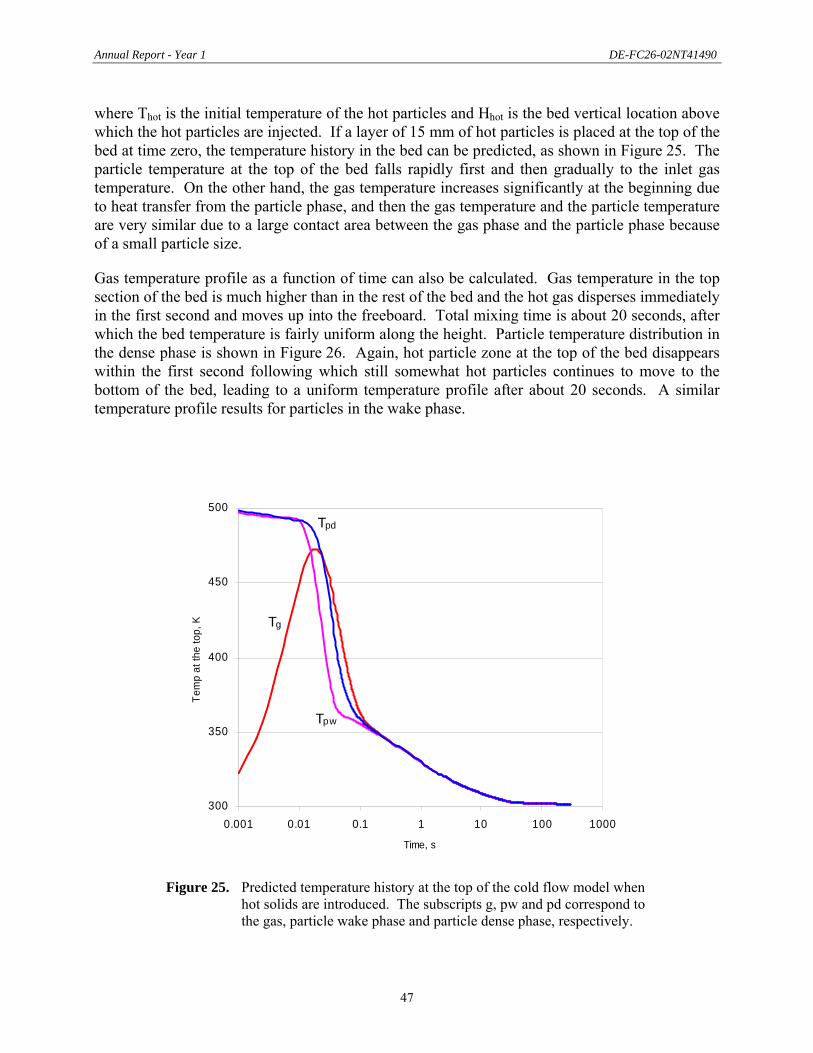
Annual Report - Year 1 DE-FC26-02NT41490
47
where Thot is the initial temperature of the hot particles and Hhot is the bed vertical location above which the hot particles are injected. If a layer of 15 mm of hot particles is placed at the top of the bed at time zero, the temperature history in the bed can be predicted, as shown in Figure 25. The particle temperature at the top of the bed falls rapidly first and then gradually to the inlet gas temperature. On the other hand, the gas temperature increases significantly at the beginning due to heat transfer from the particle phase, and then the gas temperature and the particle temperature are very similar due to a large contact area between the gas phase and the particle phase because of a small particle size.
Gas temperature profile as a function of time can also be calculated. Gas temperature in the top section of the bed is much higher than in the rest of the bed and the hot gas disperses immediately in the first second and moves up into the freeboard. Total mixing time is about 20 seconds, after which the bed temperature is fairly uniform along the height. Particle temperature distribution in the dense phase is shown in Figure 26. Again, hot particle zone at the top of the bed disappears within the first second following which still somewhat hot particles continues to move to the bottom of the bed, leading to a uniform temperature profile after about 20 seconds. A similar temperature profile results for particles in the wake phase.
300
350
400
450
500
0.001 0.01 0.1 1 10 100 1000
Time, s
Tem
p at
the
top,
K Tg
Tpw
Tpd
Figure 25. Predicted temperature history at the top of the cold flow model when hot solids are introduced. The subscripts g, pw and pd correspond to the gas, particle wake phase and particle dense phase, respectively.

Annual Report - Year 1 DE-FC26-02NT41490
48
290
300
310
320
330
340
350
0 0.2 0.4 0.6 0.8 1
bed height, m
parti
cle
tem
pera
ture
, Kt = 0 s0.1 s0.5 s1 s3 s5 s8 s10 s20 s40 s60 s300 s
Bed surface
290
300
310
320
330
340
350
0 0.2 0.4 0.6 0.8 1
bed height, m
parti
cle
tem
pera
ture
, Kt = 0 s0.1 s0.5 s1 s3 s5 s8 s10 s20 s40 s60 s300 s
Bed surface
Figure 26. Predicted temperature profile of particles in the dense phase for an experiment in which hot particles are introduced into the cold flow model of the Utah gasification test system.

Annual Report - Year 1 DE-FC26-02NT41490
49
5. CONCLUSIONS During the first year, efforts within the University of Utah project "Investigation of Fuel Chemistry and Bed Performance in a Fluidized Bed Black Liquor Steam Reformer" focused on design of a small-scale black liquor gasification test system, construction of experimental devices for study of black liquor pyrolysis and gasification behavior and computational modeling of bubbling fluidized bed black liquor steam reformers.
5.1 Research Tools
The University of Utah has designed and begun construction of a small-scale fluidized bed black liquor gasification test system. The system can operated under pressure, and is designed to simulate conditions near the bottom of a full-scale steam reformer where black liquor is injected and goes through the drying and pyrolysis stages of conversion.
A Plexiglas cold flow model of the University of Utah fluidized bed gasifier was constructed, and is approximately two-thirds the physical size of the actual system. The time scale factor for this system is 0.82, meaning that films of the cold flow system must be replayed at 82% of their recorded speed to give an accurate representation of the speed at which the real system is fluidizing. When operated on a 50/50 air/helium mix at room temperature, four critical scaling parameters of the cold flow model are nearly identical to those of the actual gasifier, indicating that behavior of the cold flow system accurately represents that taking place in the real system.
Two complimentary computational models of a fluidized bed black liquor gasifier were developed. The first, the University of Utah (UU) model, is a relatively simple, user-friendly Excel-based program that calculates the overall mass balance of the system and estimates the mass flow rate, gas velocity and gas composition at ten different levels throughout the bed. The model takes black liquor and steam flow, bed temperature and carbon conversion as input, assumes plug flow of gas, perfect mixing of solids and uniform bed temperature. The other model, the "REI model" developed by Reaction Engineering International, is much more advanced. It considers three phases within the bed (dense, bubble and wake) and takes backmixing of solids into consideration. The model calculates mass and energy balances of the system and uses drying and devolatilization rates and reaction kinetics to determine the local chemistry of the system, overall conversion and gas composition throughout the bed and freeboard. In terms of overall performance and final product gas properties, the UU model and REI model predictions are similar. The REI model is more accurate and provides more detail on conditions within the bed, however.
Two specialized experimental devices have been built for investigation of fundamental aspects of black liquor conversion during low temperature gasification. One is a single droplet reactor, which can be used for measurement of pyrolysis characteristics (volatiles yield and composition, swelling behavior), production of char and determination of char properties during conversion. The other is a lab-scale fluidized bed for studying agglomeration characteristics of bed material as a function of bed composition and temperature.
Annual Report - Year 1 DE-FC26-02NT41490
50
5.2 Performance of the Utah Gasifier
Based on results of the cold flow model and the two computational models, the following conclusions about flow patterns in the University of Utah fluidized bed gasifier can be drawn:
• Under standard operating conditions (40" slumped bed height, 1.3 ft/s superficial gas velocity in the bottom of the bed), the bed will not suffer from excessive slugging.
• Gas bubbles flowing upwards will not bypass the tube bundles.
• In the region below the bottom tube bundle, solids recirculate downwards against the walls of the reactor.
• Based on predictions of hot solids circulation in the cold flow unit, total mixing time for the bed is approximately 25 seconds in the real system (20 seconds in the cold flow system).
It should be noted that these observations do not necessarily apply to a full-scale system, such as Georgia-Pacific's Big Island demonstration. Additional modeling work is necessary to determine flow patterns in such a system.
5.3 Performance of a Full-Scale Steam Reformer
The computational models developed thus far provide insight into the expected performance of a full-scale gasifier. Expected performance of Georgia-Pacific's Big Island demonstration system is described below.
• Using best available literature data, carbon conversion is predicted to be 98.7%. Conversion and the corresponding concentration of unburned carbon in the bed are relatively sensitive to the gasification rate. Cutting the gasification rate in half reduces carbon conversion by about 1% and nearly doubles the concentration of unburned carbon in the bed. As the gasification rate is reduced further, the decrease in performance becomes even more pronounced. This sensitivity may be used to advantage in the case of poor conversion. For every 20°C (36°F) increase in temperature, the char gasification rate approximately doubles. A 20°C increase in bed temperature for a system achieving 95% carbon conversion should improve carbon conversion to above 97%. Of course, the operability of the fluidized bed at higher temperatures, particularly with regard to agglomeration risk, must be taken into consideration.
• Superficial gas velocity will increase by a factor of roughly 3 as the gas travels between the distributor and the top of the bed. This is due to a combination of steam production through liquor drying, gas production through pyrolysis, gas production through heterogeneous gasification reactions and a reduction in local pressure higher in the bed due to a lower head of bed solids.
• The presence of heater bundles in the bed results in much smaller bubbles, on average, than would exist in a tube-free bed. Within the tube bundles the bubble size is much
Annual Report - Year 1 DE-FC26-02NT41490
51
smaller, and the bubble fraction is greater, than in the rest of the bed. Bubbles in the tube banks are predicted to be no more than 3 cm (1.2 inches) in diameter while bubbles in the open areas around the tube banks can be 0.3 meter (12 inches) in diameter. Overall, the average bubble size increases through the bed, and is estimated to be 0.7 meters (28 inches) at the surface of the bed.
• As the gas flows through the bed, its composition shifts. The concentration of steam decreases while hydrogen and carbon monoxide increase. Carbon dioxide concentration remains relatively stable throughout the bed. Computational modeling suggests that the product gas has not come to equilibrium by the time it exits the bed, but that homogeneous reactions (water-gas shift and steam methane reforming) take place in the freeboard and bring the gas mixture nearly to equilibrium. At the bed surface, there is more steam, more CO, less hydrogen and less CO2 than the final product gas.
• The jets of black liquor from the injector nozzles should not penetrate very deeply into the bed. Estimated penetration depths range from 0.1 to 0.8 meter (4 to 32 inches), averaging about 0.3 meter, if the liquor is all assumed to exit as liquid. Similar estimations for liquor exiting as steam predict jet penetration depths of 0.6 to 6.2 meters (2 to 20 feet). The liquor in Georgia-Pacific's Big Island system is fed to the injectors at high temperature and pressure. Some flashing of the liquor will occur as it exits the injector, but an energy balance suggests that only about 10% of the water in the liquor will flash to steam. As such, the jet penetration depths for liquid are more representative. A reasonable estimate is that the jet from the liquor injectors will penetrate approximately 0.4 meters (16 inches) into the bed.
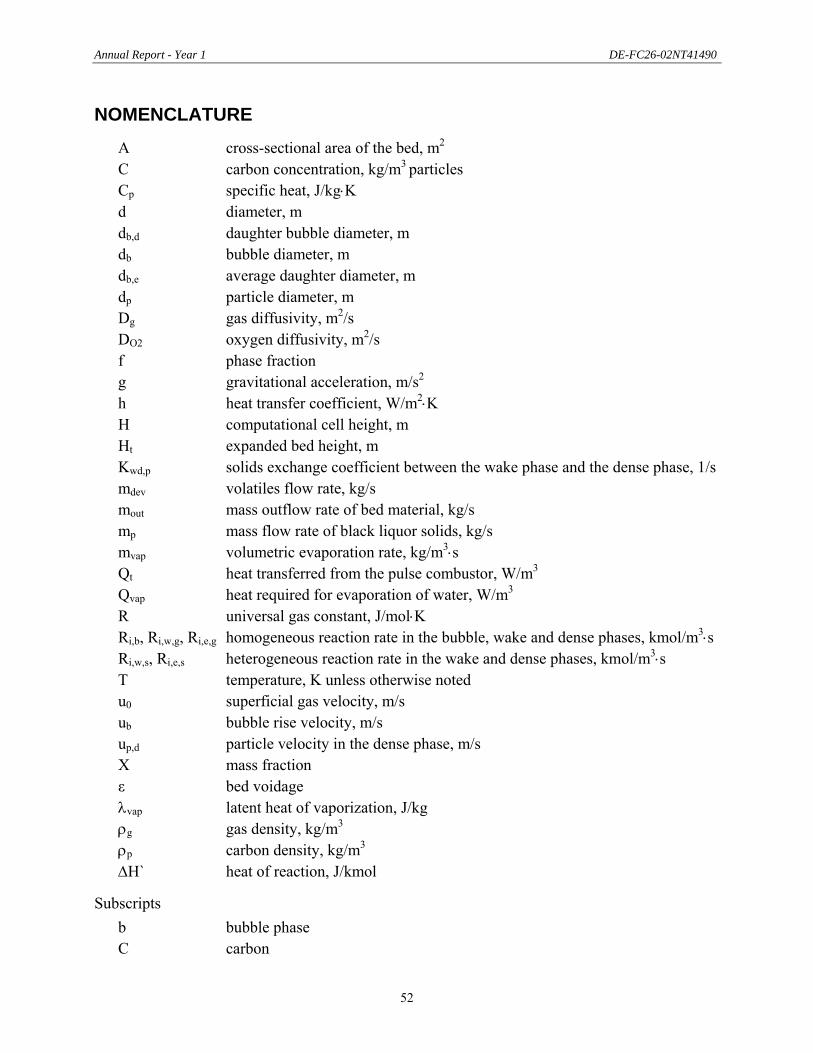
Annual Report - Year 1 DE-FC26-02NT41490
52
NOMENCLATURE
A cross-sectional area of the bed, m2 C carbon concentration, kg/m3 particles Cp specific heat, J/kg⋅K d diameter, m db,d daughter bubble diameter, m db bubble diameter, m db,e average daughter diameter, m dp particle diameter, m Dg gas diffusivity, m2/s DO2 oxygen diffusivity, m2/s f phase fraction g gravitational acceleration, m/s2 h heat transfer coefficient, W/m2⋅K H computational cell height, m Ht expanded bed height, m Kwd,p solids exchange coefficient between the wake phase and the dense phase, 1/s mdev volatiles flow rate, kg/s mout mass outflow rate of bed material, kg/s mp mass flow rate of black liquor solids, kg/s mvap volumetric evaporation rate, kg/m3⋅s Qt heat transferred from the pulse combustor, W/m3 Qvap heat required for evaporation of water, W/m3 R universal gas constant, J/mol⋅K Ri,b, Ri,w,g, Ri,e,g homogeneous reaction rate in the bubble, wake and dense phases, kmol/m3⋅s Ri,w,s, Ri,e,s heterogeneous reaction rate in the wake and dense phases, kmol/m3⋅s T temperature, K unless otherwise noted u0 superficial gas velocity, m/s ub bubble rise velocity, m/s up,d particle velocity in the dense phase, m/s X mass fraction ε bed voidage λvap latent heat of vaporization, J/kg ρg gas density, kg/m3 ρp carbon density, kg/m3 ∆H` heat of reaction, J/kmol
Subscripts b bubble phase C carbon
Annual Report - Year 1 DE-FC26-02NT41490
53
d dense (emulsion) phase g gas i reaction index K potassium mf minimum fluidization Na sodium p particle tf throughflow w wake phase
Annual Report - Year 1 DE-FC26-02NT41490
54
REFERENCES
1. KUNII, D., LEVENSPIEL, O., Fluidization Engineering, Butterworth-Heinemann Publ., Newton, MA (1991).
2. FREDERICK, J., HUPA, M., "Combustion properties of kraft black liquors," DOE Report DOE/CE/40936-T1, Washington, D.C. (1993).
3. FREDERICK, W.J., IISA, K., WÅG, K., REIS, V.V., BOONSONGSUP, L., FORSSÉN, M., HUPA, M., "Sodium and sulfur release and recapture during black liquor burning," DOE Report DOE/CE/40936-T2, Washington, D.C. (1995).
4. DARTON, R.C., LANAUZE, R.D., DAVIDSON, J.F., HARRISON, D., "Bubble growth due to coalescence in fluidized beds," Trans. Instn Chem. Engrs. 55:274-280 (1977).
5. HULL, A.S., CHEN, Z., FRITZ, J.W., AGARWAL, P.K., "Influence of horizontal tube banks on the behavior of bubbling fluidized beds. I. Bubble hydrodynamics," Powder Technology 103:230-242 (1999).
6. YATES, J.G., RUIZ-MARTINEZ R.S., "Influence between horizontal tubes and gas bubbles in a fluidized bed," Chem. Eng. Comm. 62:67-78 (1987).
7. YATES, J.G., RUIZ-MARTINEZ, R.S., CHEESMAN, D.J., "Prediction of bubble size in a fluidized bed containing horizontal tubes," Chem. Eng. Sci. 45:1105-1115 (1990).
8. DAVIDSON, J.F., HARRISON, D., Fluidized Particles, Cambridge University Press, London (1963).
9. ROWE, P.N., YACONO, C.X.R., "The bubbling behavior of fine powders when fluidized," Chem. Eng. Sci. 31:1179-1192 (1976).
10. WERTHER, J., "Bubble growth in large diameter fluidized beds," in D.L. Keairns (ed) Fluidization Technology, Vol. 1, Hemisphere Pub., 215-235 (1976).
11. ROWE, P.N., PARTRIDGE, B.A., "An x-ray study of bubbles in fluidized beds," Trans. Instn Chem. Engrs. 43:157-175 (1965).
12. CHEN, Z., LIN, M., IGNOWSKI, J., KELLY, B., LINJEWILE, T.M., AGARWAL, P.K., "Methematical modeling of fluidized bed combustion. 4. N2O and NOx emissions from the combustion of char," Fuel 80:1259-1272 (2001).
13. FREDERICK, W.J., "Combustion processes in black liquor recovery: Analysis and interpretation of combustion rate data and an engineering design model," DOE Report DOE/CE/40637-T8 (DE90012712) (1990).
14. DAYTON, D.C., FREDERICK, W.J., "The direct observation of alkali vapor release during biomass combustion and gasification. 2. Black liquor combustion at 1100°C," Energy and Fuels (1996).
15. VERRILL, C.L., WESSEL, R.A., "Sodlium loss during black liquor drying and devolatilization – application of modeling results to understanding laboratory data," Proc. 1995 Int'l. Chem.. Recovery Conf. Toronto, April 23-27, B89-B103 (1995).
16. LI, J., VAN HEININGEN, A.R.P., "Kinetics of gasification of black liquor char by steam," Ind. Eng. Chem. Res. 30(7):1594-1601 (1991).
17. LI, J., VAN HEININGEN, A.R.P., "Kinetics of CO2 gasification of fast pyrolysis black liquor char," Ind. Eng. Chem. Res. 29(9):1776-1785 (1990).
18. JONES, W.P., LINDSTEDT, R.P., "Global reaction schemes for hydrocarbon combustion," Combustion and Flame, 73:233-249 (1988).
19. GUENTHER, C., SHAHNAM, M., SYAMLAL, M., LONGANBACH, J., CICERO, D., SMITH, P.V., "CFD modeling of a transport gasifier," Proc. 19th Annual Pittsburgh Coal Conference, Sept. 23-27 (2002).
20. SYAMLAL, M., BISSETT, L.A., "METC gasifier advanced simulation (MGAS) model," Technical Note, NTIS Report No. DOE/METC-92/4108 (1992).
Annual Report - Year 1 DE-FC26-02NT41490
55
21. WEN, C.Y., CHEN, H., ONOZAKI, M., "User's manual for computer simulation and design of the moving bed
coal gasifier," DOE/MC/16474-1390, NTIS/DE83009533 (1982).
22. GUNN, D.J., "Transfer of heat or mass to particles in fixed and fluidized beds," Int. J. Heat Mass Transfer, 21:467-476 (1978).
23. DESAI, P.R., WEN, C.Y., "Computer modeling of the MERC fixed bed gasifier," MERC/CR-78/3 (1978).
24. WESTBROOK, C.K., DRYER, F.L., "Simplified mechanisms for the oxidation of hydrocarbon fuels in flames," Combustion Sci. Tech., 27:31-43 (1981).
25. PETERS, N., "Premixed burning in diffusion flames -- the flame zone model of Libby and Economos," Int. J. Heat Mass Transfer, 22:691-703 (1979).
26. WHITTY, K., "Pyrolysis and gasification behavior of black liquor under pressurized conditions," Ph.D. Thesis, Åbo Akademi University, Turku, Finland (1997).
27. WHITTY, K., BACKMAN, R., FORSSÉN, M., HUPA, M., RAINIO, J., SORVARI, V., "Liquor-to-liquor differences in combustion and gasification processes: Pyrolysis behaviour and char reactivity," J. Pulp Paper Sci. 23(3):J119-J128 (1997).
28. WEN C.Y., HORIO M., KRISHNAN R., KHOSRAVI R. RENGARAJAN P., "Jetting phenomena and dead zone formation of fluidized bed distributors," Proc. 2nd Pacific Chem. Eng. Conf., AIChE, New York (1977).
29. YANG W.C. KEAIRNS D.L., "Design and operating parameters for a fluidized bed agglomerating combustor/gasifier," Fluidization, Cambridge University Press, Cambridge (1978).
30. MERRY J.M.D., Penetration of vertical jets into fluidized beds, AIChE J. 21:507 (1975).
31. ZENZ F.A., "Bubble formation and grid design," Inst. Chem. Eng. Symp. Ser., 30:136 (1968).
32. YANG W.C., "Jet penetration in a pressurized fluidized bed," Ind. Eng. Chem. Fundam. 20:297-300 (1981).
33. YATES J.G, "Effects of temperature and pressure on gas-solid fluidization," Chem. Eng. Sci., 51:167-205 (1996).
34. MERRY J.M.D., "Penetration of a horizontal gas jet into a fluidized bed," Trans. Instn Chem. Engrs. 49:189-195 (1971).
Appendix A
Process and Instrumentation Diagrams for University of Utah's Fluidized Bed Gasification Test System
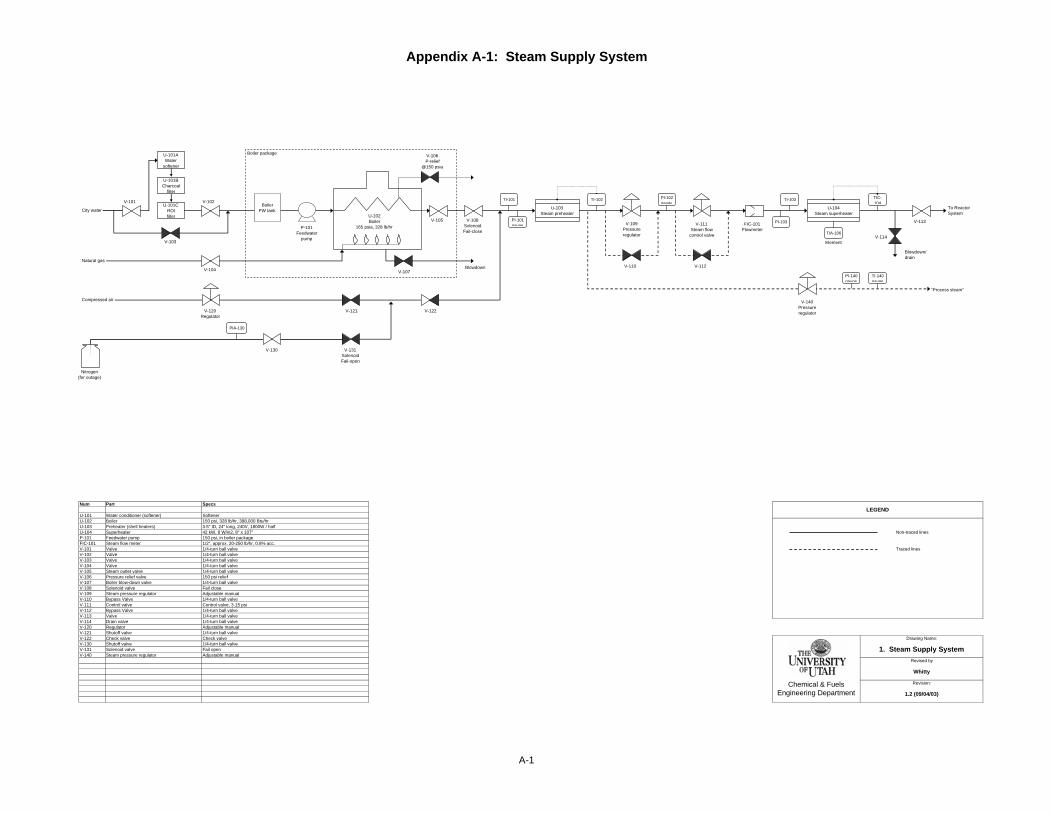
Appendix A-1: Steam Supply System
Non-traced lines
Traced lines
RegulatorV-114
Shutoff valve
Drain valveV-120V-121
Pressure relief valve
ValveValve
Feedwater pumpSteam flow meter
150 psi, 328 lb/hr, 398,000 Btu/hrU-103 3.5" ID, 24" long, 240V, 1800W / half
Num
Water conditioner (softener)
Chemical & Fuels Engineering Department
1/4-turn ball valveFail closeAdjustable manual1/4-turn ball valve
Check valve
1/4-turn ball valve1/4-turn ball valve
Check valve
Valve
U-101
Part
U-102Preheater (shell heaters)Boiler
Superheater
ValveValve
Steam pressure regulatorBypass Valve
Bypass ValveControl valve
Steam outlet valve
Boiler blow-down valve
1/4-turn ball valveAdjustable manual1/4-turn ball valve
Solenoid valve
U-104
FIC-101V-101V-102
P-101
V-103V-104V-105
Adjustable manual
V-106V-107V-108V-109V-110V-111
V-131 Solenoid valve
42 kW, 8 W/in2, 8" x 107"
1/2", approx. 20-250 lb/hr, 0.8% acc.1/4-turn ball valve
Control valve, 3-15 psi
Fail open1/4-turn ball valve
1/4-turn ball valve
Revised by
Whitty
Revision:
1.2 (09/04/03)
V-140 Steam pressure regulator
V-130 Shutoff valve
V-112V-113
V-122
150 psi, in boiler package
Drawing Name:
1. Steam Supply System
LEGEND
1/4-turn ball valve1/4-turn ball valve
1/4-turn ball valve150 psi relief
Specs
Softener
V-103
V-101 V-102
BlowdownNatural gas
U-102Boiler
165 psia, 328 lb/hrV-108
SolenoidFail-close
V-104 V-107
U-103Steam preheater
FIC-101Flowmeter
V-111Steam flow
control valve
V-109Pressure regulator
U-104Steam superheater
V-106P-relief
@150 psia
City water
Compressed air
Nitrogen(for outage)
V-121
V-131SolenoidFail-open
V-122
V-130
V-110 V-112
"Process steam"
To ReactorSystem
TI-102 TIC-104
TI-103
TIA-106
TI-101
PI-101gauge
PI-102gauge
PIA-130
V-105
V-140Pressure regulator
PI-140gauge
PI-103
TI-140gauge
Blowdown/drain
V-114
V-113
U-101AWater
softener
U-101CROlfilter
U-101BCharcoal
filter
BoilerFW tank
P-101Feedwater
pump
Boiler package
V-120Regulator
Element
A-1

Appendix A-2: Black Liquor Supply System
Non-traced lines
Traced lines
FIC-201 Black liquor flow meter Gear drive meterFIC-220 Steam flow meter Heated variable area flow meter
LEGEND
U-201 Black liquor tank
Num Part Specs
P-202 Black liquor metering pump Variable speed, 100 psi, max 30 gal/hr
100 gal, steam jacketed, SS304P-201 Black liquor recirc pump Positive displacement, 200 gal/hr max
Fail-close1/4-turn ball valve
V-201 Black liquor shutoff valve 1/4-turn ball valveV-202 Metering shutoff valveV-203 Liquor shutoff solenoid
V-205 Pressure release valve 150 psi releaseV-204 Check valve Check valve, SS
V-208 Black liquor loading valve 1/4-turn ball valve
V-206 Drain valveV-207 Calibration shutoff 1/4-turn ball valve
1/4-turn ball valve
Manual adjutable1/4-turn ball valve
V-209 Water shutoff 1/4-turn ball valveV-220 Steam shutoffV-221 Steam regulator
2. Black Liquor Supply SystemDrawing Name:
Revised by
Whitty
Revision:
1.2 (09/04/03)Chemical & Fuels
Engineering Department
"Process steam"
P-201RecircPump
V-205Pressure
relief valve
V-201
PI-202
FIC-201Flowmeter
V-203Solenoid
TI-203
TI-205
V-220 TI-201
TI-202
TI-204
Condensate out
U-201BL tank
Black liquor injector
V-204Check valve
V-206
Drain
V-221 FI-220
P-202Metering
pump
V-202
V-207
CalibrationTank
Water
V-209
Black liquor
V-208
A-2
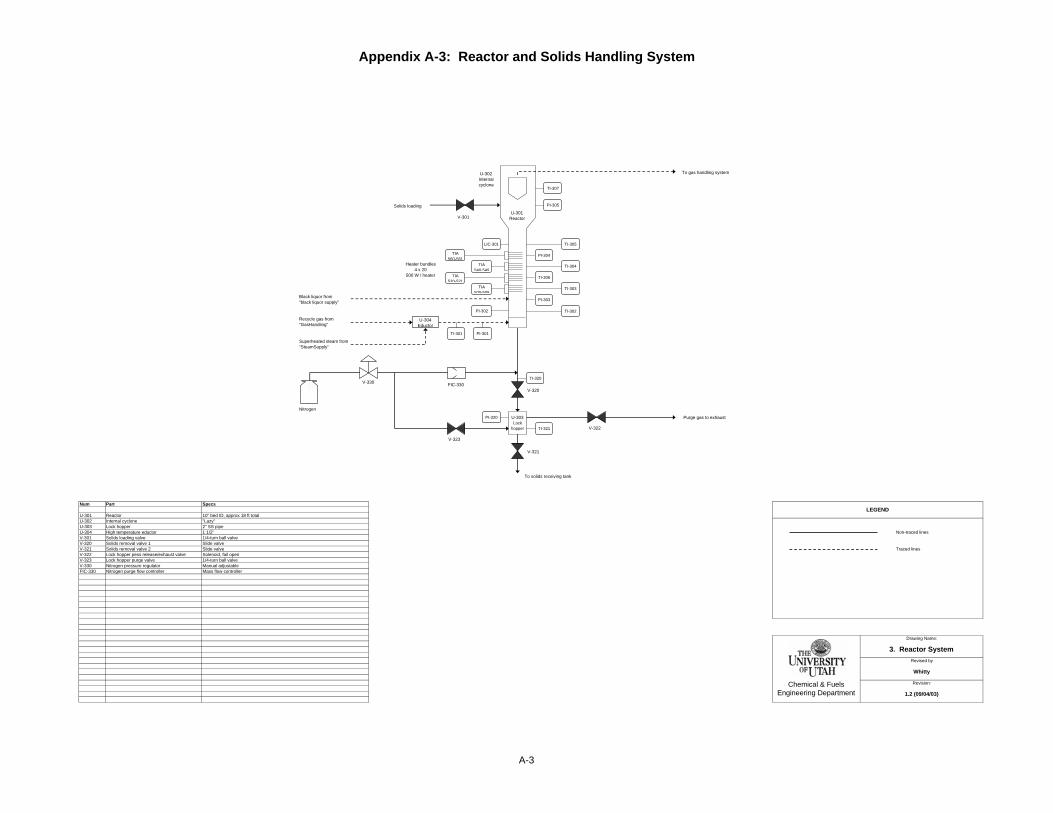
Appendix A-3: Reactor and Solids Handling System
Non-traced lines
Traced lines
Nitrogen pressure regulatorV-330FIC-330 Nitrogen purge flow controller Mass flow controller
V-301 Solids loading valve
V-323 Lock hopper purge valve
V-321 Solids removal valve 2V-320 Solids removal valve 1
V-322 Lock hopper pess release/exhaust valve
U-302 Internal cyclone
U-304 High temperature eductorU-303 Lock hopper
U-301 Reactor
Num Part Specs
1/4-turn ball valve
LEGEND10" bed ID, approx 18 ft total
2" SS pipe"Lazy"
1 1/2"
Slide valveSlide valve
1/4-turn ball valveSolenoid, fail open
Manual adjustable
Drawing Name:
3. Reactor SystemRevised by
Whitty
Chemical & Fuels Engineering Department
Revision:
1.2 (09/04/03)
U-302Internalcyclone
Black liquor from"black liquor supply"
Recycle gas from"GasHandling"
V-320
V-321
U-304Eductor
Superheated steam from"SteamSupply"
PI-301TI-301
Nitrogen
V-330 FIC-330
Solids loadingU-301
Reactor
PI-304
PI-305
TI-305
TI-307
Heater bundles4 x 20
500 W / heater
V-301
LIC-301
TI-320
U-303Lock
hopper TI-321
PI-320
V-322
To gas handling system
Purge gas to exhaust
To solids receiving tank
V-323
TIA500-509
TIA520-529
TIA540-549
TIA560-569
TI-306
TI-304
PI-303
TI-303
TI-302PI-302
A-3
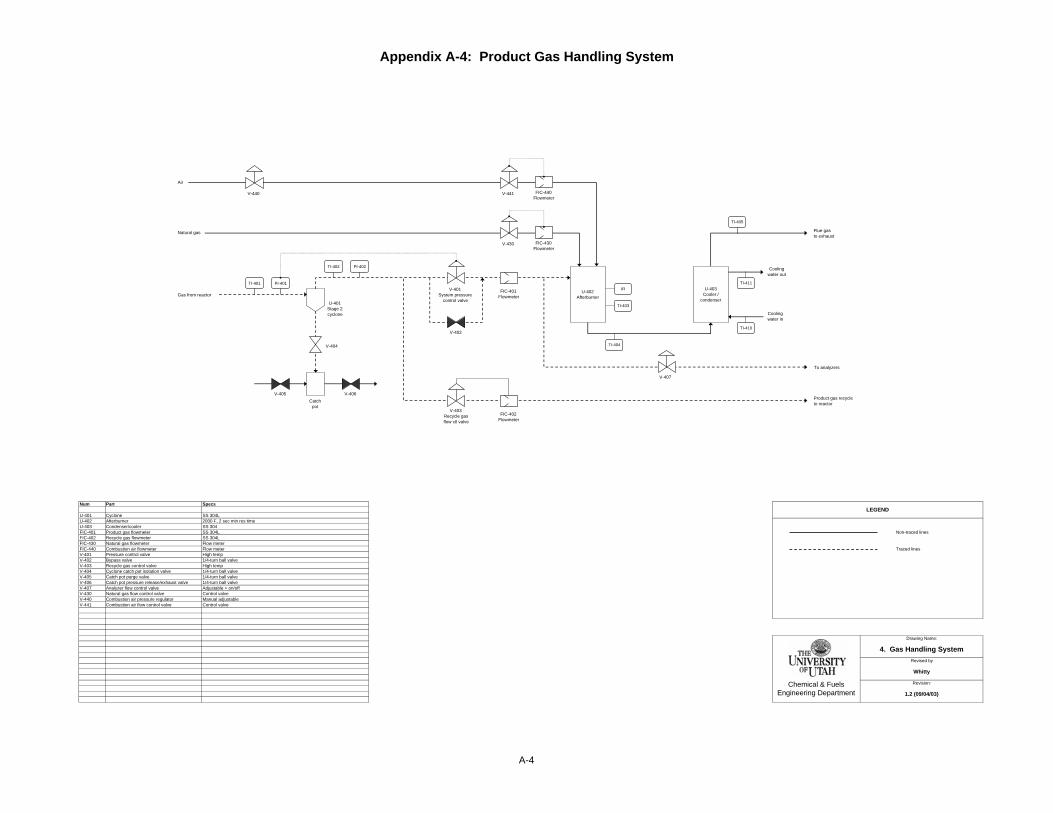
Appendix A-4: Product Gas Handling System
Non-traced lines
Traced lines
Catch pot purge valve
Combustion air flow control valveCombustion air pressure regulatorNatural gas flow control valveAnalyzer flow control valve
Drawing Name:
4. Gas Handling System
LEGEND
Revised by
Whitty
Revision:
1.2 (09/04/03)
Flow meterFlow meter
SS 304LSS 304L
High temp
Control valve
V-403V-404V-405V-406V-407V-430V-440V-441
FIC-401FIC-402
V-401V-402
FIC-440Natural gas flowmeterFIC-430Combustion air flowmeter
U-401
Part
1/4-turn ball valve
Chemical & Fuels Engineering Department
Adjustable + on/offControl valveManual adjustable
1/4-turn ball valve1/4-turn ball valve
Specs
SS 304LU-402
Condenser/coolerAfterburner 2000 F, 2 sec min res time
U-403 SS 304
Num
Cyclone
Product gas flowmeter
Pressure control valveBypass valve
Recycle gas flowmeter
1/4-turn ball valveHigh temp
Cyclone catch pot isolation valveRecycle gas control valve
Catch pot pressure release/exhaust valve
U-401Stage 2cyclone
Catchpot
Gas from reactor
TI-401 PI-401
TI-402 PI-402
FIC-401Flowmeter
V-401System pressure
control valve
V-402
U-402Afterburner
Natural gas
U-403Cooler /
condenser
Coolingwater in
Coolingwater out
TI-405
TI-404
To analyzers
Product gas recycleto reactor
Flue gasto exhaust
TI-403
IR
V-407
V-403Recycle gasflow ctl valve
V-404
V-406V-405
FIC-402Flowmeter
V-430 FIC-430Flowmeter
Air
V-441 FIC-440Flowmeter
V-440
TI-410
TI-411
A-4
Appendix B
Select Design Drawings of the Reactor for University of Utah's Fluidized Bed Gasification Test System
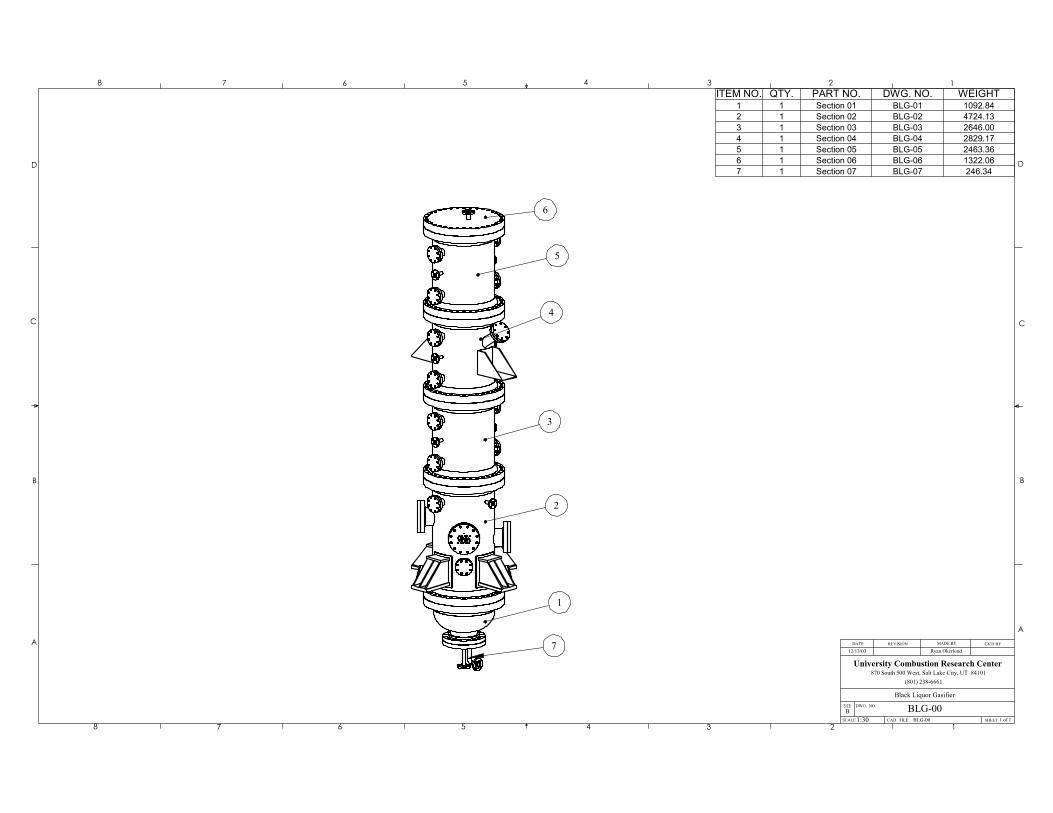
1
3
2
4
5
6
7
ITEM NO. QTY. PART NO. DWG. NO. WEIGHT1 1 Section 01 BLG-01 1092.842 1 Section 02 BLG-02 4724.133 1 Section 03 BLG-03 2646.004 1 Section 04 BLG-04 2829.175 1 Section 05 BLG-05 2463.366 1 Section 06 BLG-06 1322.067 1 Section 07 BLG-07 246.34
D
C
B
AA
B
C
D
Black Liquor GasifierSIZE
CAD FILE:
DWG. NO.B
SHEET 1 of 1
University Combustion Research Center
DATE REVISION MADE BY CK'D BY
12345678
8 7 6 5 4 3 2 1
SCALE
870 South 500 West, Salt Lake City, UT 84101(801) 238-6661
12/13/03 Ryan Okerlund
BLG-001:30 BLG-00
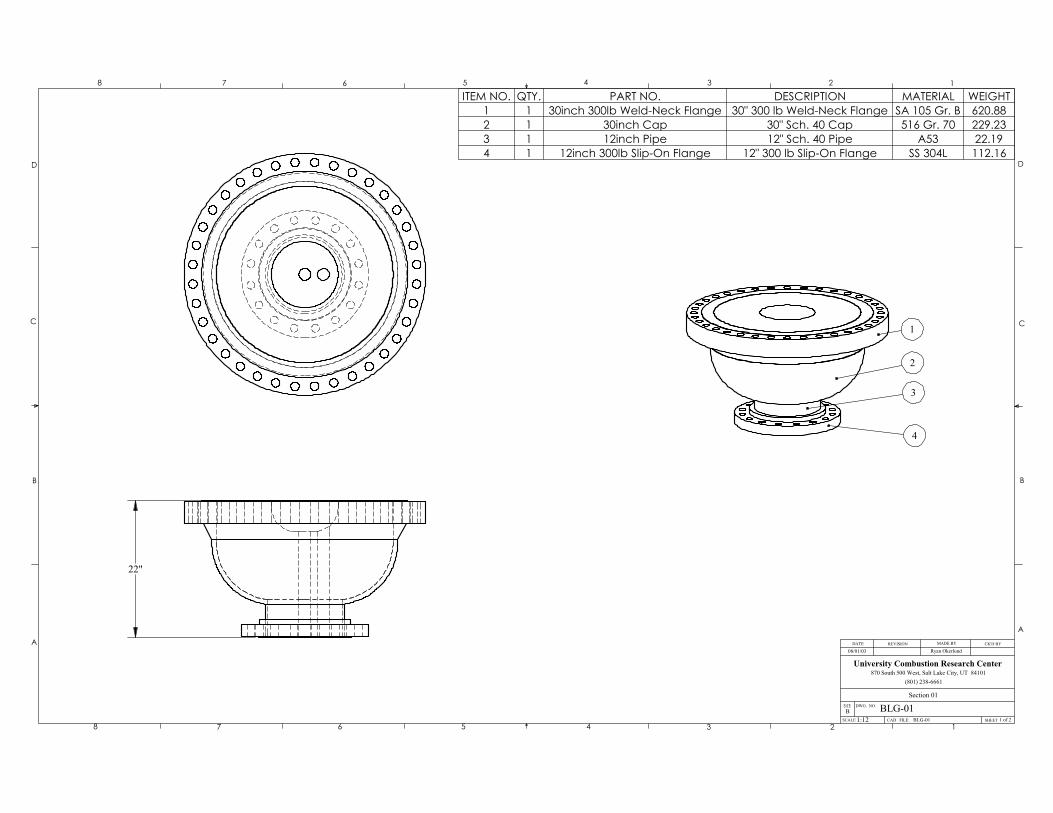
2
1
4
3
ITEM NO. QTY. PART NO. DESCRIPTION MATERIAL WEIGHT1 1 30inch 300lb Weld-Neck Flange 30" 300 lb Weld-Neck Flange SA 105 Gr. B 620.882 1 30inch Cap 30" Sch. 40 Cap 516 Gr. 70 229.233 1 12inch Pipe 12" Sch. 40 Pipe A53 22.194 1 12inch 300lb Slip-On Flange 12" 300 lb Slip-On Flange SS 304L 112.16
22"
D
C
B
AA
B
C
D
Section 01SIZE
CAD FILE:
DWG. NO.B
SHEET 1 of 2
University Combustion Research Center
DATE REVISION MADE BY CK'D BY
12345678
8 7 6 5 4 3 2 1
SCALE
870 South 500 West, Salt Lake City, UT 84101(801) 238-6661
08/01/03 Ryan Okerlund
BLG-011:12 BLG-01
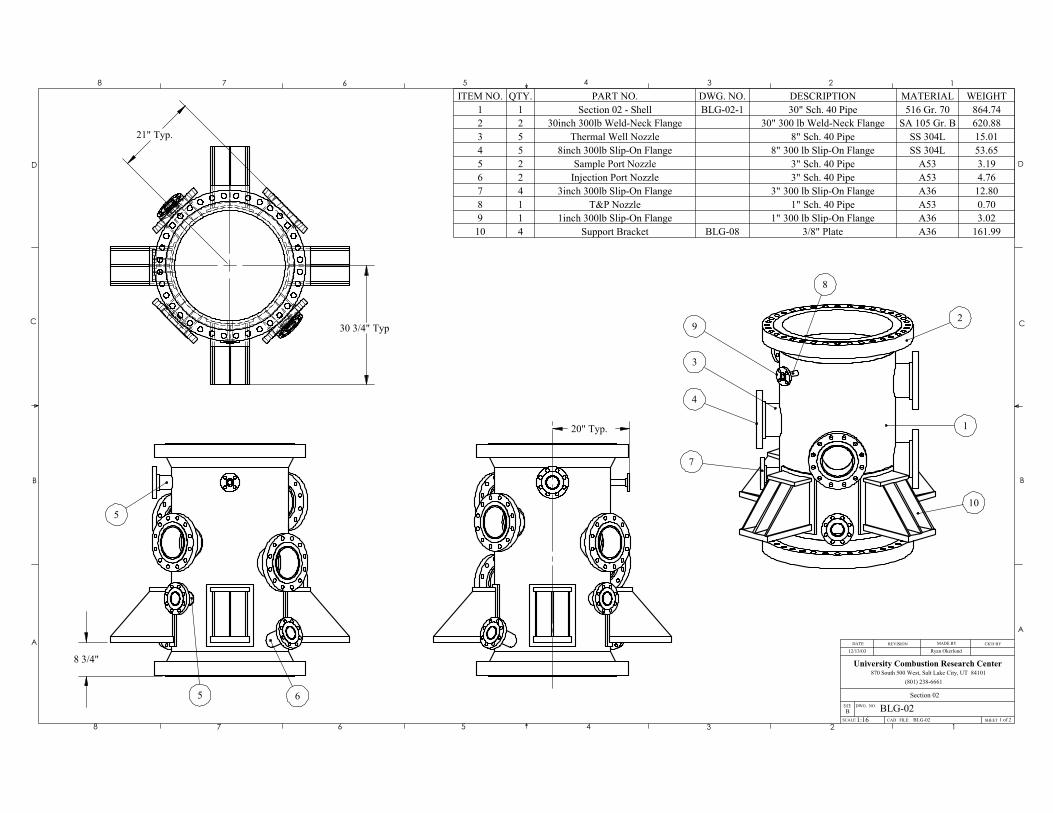
8 3/4"
65
5
21" Typ.
30 3/4" Typ
20" Typ. 1
3
4
7
2
10
8
9
ITEM NO. QTY. PART NO. DWG. NO. DESCRIPTION MATERIAL WEIGHT1 1 Section 02 - Shell BLG-02-1 30" Sch. 40 Pipe 516 Gr. 70 864.742 2 30inch 300lb Weld-Neck Flange 30" 300 lb Weld-Neck Flange SA 105 Gr. B 620.883 5 Thermal Well Nozzle 8" Sch. 40 Pipe SS 304L 15.014 5 8inch 300lb Slip-On Flange 8" 300 lb Slip-On Flange SS 304L 53.655 2 Sample Port Nozzle 3" Sch. 40 Pipe A53 3.196 2 Injection Port Nozzle 3" Sch. 40 Pipe A53 4.767 4 3inch 300lb Slip-On Flange 3" 300 lb Slip-On Flange A36 12.808 1 T&P Nozzle 1" Sch. 40 Pipe A53 0.709 1 1inch 300lb Slip-On Flange 1" 300 lb Slip-On Flange A36 3.0210 4 Support Bracket BLG-08 3/8" Plate A36 161.99
D
C
B
AA
B
C
D
Section 02SIZE
CAD FILE:
DWG. NO.B
SHEET 1 of 2
University Combustion Research Center
DATE REVISION MADE BY CK'D BY
12345678
8 7 6 5 4 3 2 1
SCALE
870 South 500 West, Salt Lake City, UT 84101(801) 238-6661
12/13/03 Ryan Okerlund
BLG-021:16 BLG-02
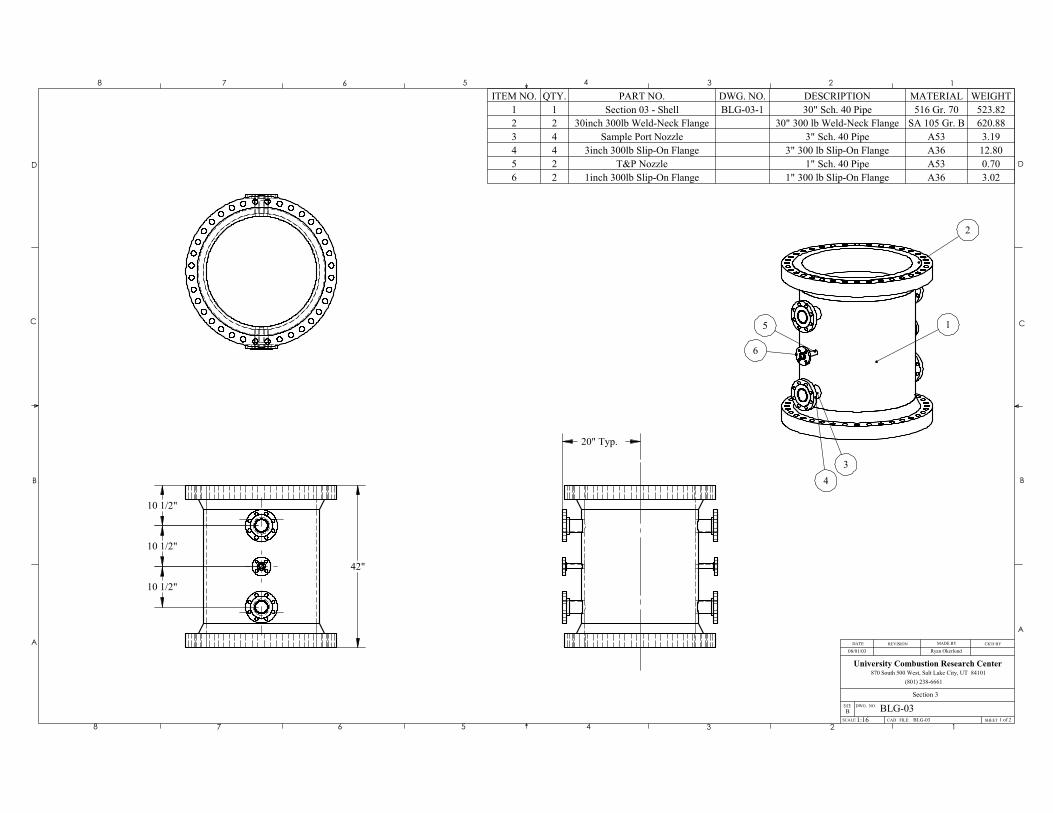
10 1/2"
10 1/2"
10 1/2"
42"
20" Typ.
3
5
6
2
1
4
ITEM NO. QTY. PART NO. DWG. NO. DESCRIPTION MATERIAL WEIGHT1 1 Section 03 - Shell BLG-03-1 30" Sch. 40 Pipe 516 Gr. 70 523.822 2 30inch 300lb Weld-Neck Flange 30" 300 lb Weld-Neck Flange SA 105 Gr. B 620.883 4 Sample Port Nozzle 3" Sch. 40 Pipe A53 3.194 4 3inch 300lb Slip-On Flange 3" 300 lb Slip-On Flange A36 12.805 2 T&P Nozzle 1" Sch. 40 Pipe A53 0.706 2 1inch 300lb Slip-On Flange 1" 300 lb Slip-On Flange A36 3.02
D
C
B
AA
B
C
D
Section 3SIZE
CAD FILE:
DWG. NO.B
SHEET 1 of 2
University Combustion Research Center
DATE REVISION MADE BY CK'D BY
12345678
8 7 6 5 4 3 2 1
SCALE
870 South 500 West, Salt Lake City, UT 84101(801) 238-6661
08/01/03 Ryan Okerlund
BLG-031:16 BLG-03

10 1/2"
10 1/2"
10 1/2"
42"
12 7/8"
55°
13 3/8"
VIEW
13 7/8"
20" Typ.
1
2
6
4
35 7
8
9
ITEM NO. QTY. PART NO. DWG. NO. DESCRIPTION MATERIAL WEIGHT1 1 Section 04 - Shell BLG-04-1 30" Sch. 40 Pipe 516 Gr. 70 566.102 2 30inch 300lb Weld-Neck Flange 30" 300 lb Weld-Neck Flange SA 105 Gr. B 620.883 4 Sample Port Nozzle 3" Sch. 40 Pipe A53 3.194 1 Solids Port Nozzle 4" Sch. 40 Pipe A53 10.625 4 3inch 300lb Slip-On Flange 3" 300 lb Slip-On Flange A36 12.806 1 4inch 300lb Slip-On Flange 4" 300 lb Slip-On Flange A36 20.927 2 T&P Nozzle 1" Sch. 40 Pipe A53 0.708 2 1inch 300lb Slip-On Flange 1" 300 lb Slip-On Flange A36 3.029 2 Support Bracket - Upper BLG-08 3/8" Plate A36 56.59
D
C
B
AA
B
C
D
Section 04SIZE
CAD FILE:
DWG. NO.B
SHEET 1 of 2
University Combustion Research Center
DATE REVISION MADE BY CK'D BY
12345678
8 7 6 5 4 3 2 1
SCALE
870 South 500 West, Salt Lake City, UT 84101(801) 238-6661
08/01/03 Ryan Okerlund
BLG-041:16 BLG-04
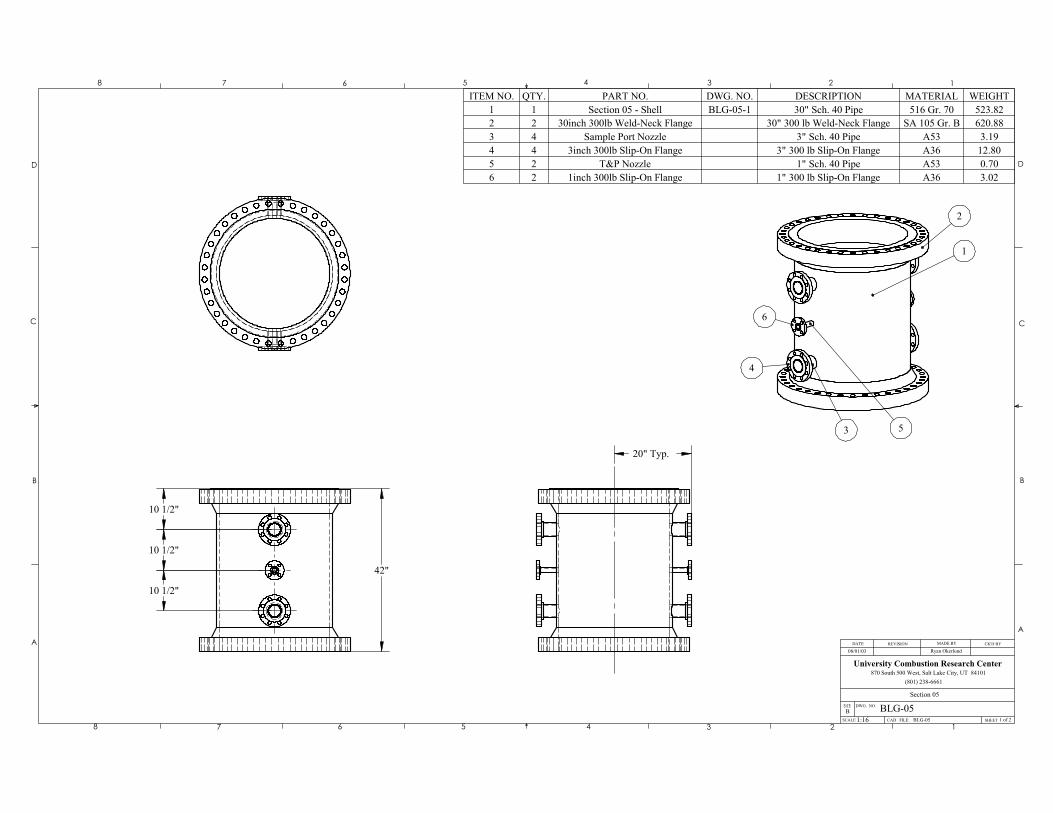
10 1/2"
10 1/2"
10 1/2"
42"
20" Typ.
1
3
4
2
6
5
ITEM NO. QTY. PART NO. DWG. NO. DESCRIPTION MATERIAL WEIGHT1 1 Section 05 - Shell BLG-05-1 30" Sch. 40 Pipe 516 Gr. 70 523.822 2 30inch 300lb Weld-Neck Flange 30" 300 lb Weld-Neck Flange SA 105 Gr. B 620.883 4 Sample Port Nozzle 3" Sch. 40 Pipe A53 3.194 4 3inch 300lb Slip-On Flange 3" 300 lb Slip-On Flange A36 12.805 2 T&P Nozzle 1" Sch. 40 Pipe A53 0.706 2 1inch 300lb Slip-On Flange 1" 300 lb Slip-On Flange A36 3.02
D
C
B
AA
B
C
D
Section 05SIZE
CAD FILE:
DWG. NO.B
SHEET 1 of 2
University Combustion Research Center
DATE REVISION MADE BY CK'D BY
12345678
8 7 6 5 4 3 2 1
SCALE
870 South 500 West, Salt Lake City, UT 84101(801) 238-6661
08/01/03 Ryan Okerlund
BLG-051:16 BLG-05
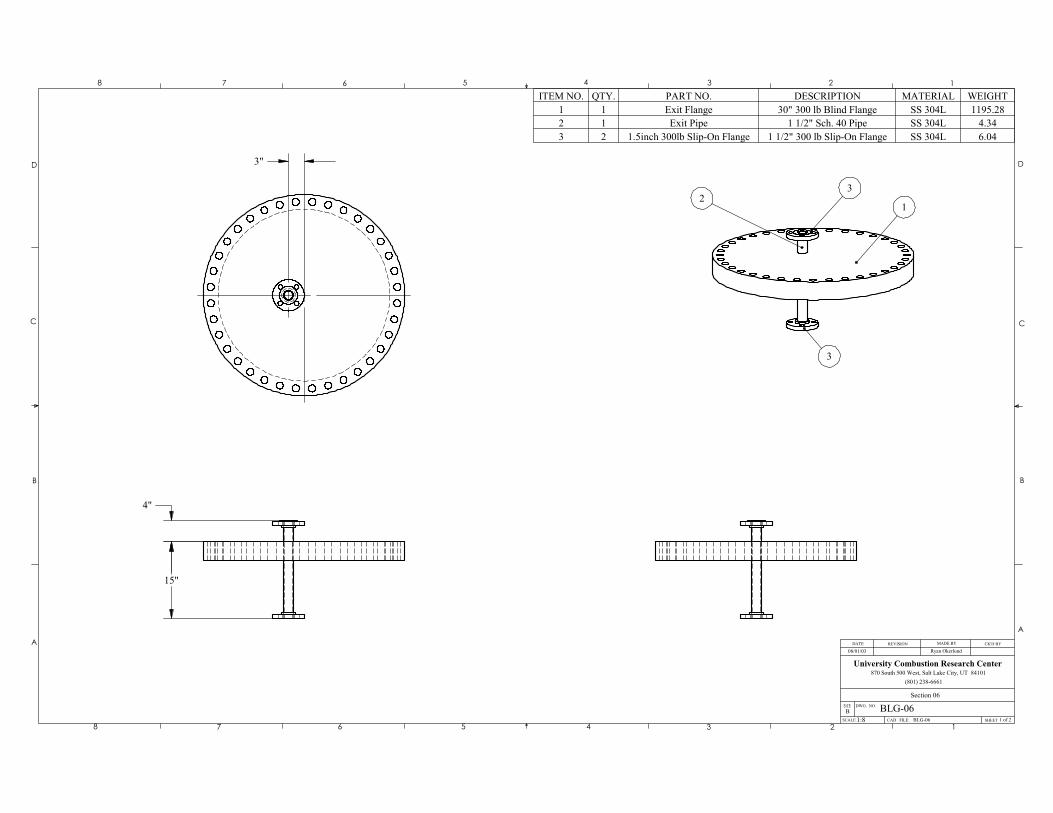
4"
15"
3"
1
32
3
ITEM NO. QTY. PART NO. DESCRIPTION MATERIAL WEIGHT1 1 Exit Flange 30" 300 lb Blind Flange SS 304L 1195.282 1 Exit Pipe 1 1/2" Sch. 40 Pipe SS 304L 4.343 2 1.5inch 300lb Slip-On Flange 1 1/2" 300 lb Slip-On Flange SS 304L 6.04
D
C
B
AA
B
C
D
Section 06SIZE
CAD FILE:
DWG. NO.B
SHEET 1 of 2
University Combustion Research Center
DATE REVISION MADE BY CK'D BY
12345678
8 7 6 5 4 3 2 1
SCALE
870 South 500 West, Salt Lake City, UT 84101(801) 238-6661
08/01/03 Ryan Okerlund
BLG-061:8 BLG-06
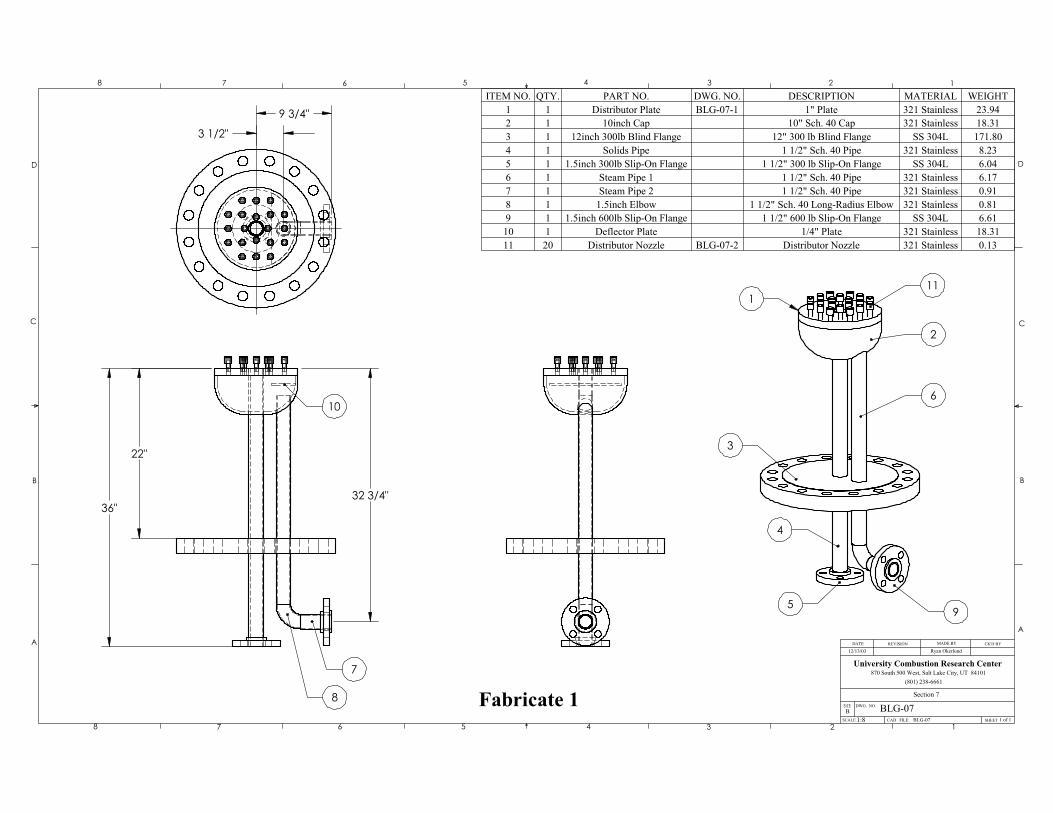
36"
22"
32 3/4"
7
8
10
9 3/4"
3 1/2"
2
1
3
4
5
11
9
6
ITEM NO. QTY. PART NO. DWG. NO. DESCRIPTION MATERIAL WEIGHT1 1 Distributor Plate BLG-07-1 1" Plate 321 Stainless 23.942 1 10inch Cap 10" Sch. 40 Cap 321 Stainless 18.313 1 12inch 300lb Blind Flange 12" 300 lb Blind Flange SS 304L 171.804 1 Solids Pipe 1 1/2" Sch. 40 Pipe 321 Stainless 8.235 1 1.5inch 300lb Slip-On Flange 1 1/2" 300 lb Slip-On Flange SS 304L 6.046 1 Steam Pipe 1 1 1/2" Sch. 40 Pipe 321 Stainless 6.177 1 Steam Pipe 2 1 1/2" Sch. 40 Pipe 321 Stainless 0.918 1 1.5inch Elbow 1 1/2" Sch. 40 Long-Radius Elbow 321 Stainless 0.819 1 1.5inch 600lb Slip-On Flange 1 1/2" 600 lb Slip-On Flange SS 304L 6.6110 1 Deflector Plate 1/4" Plate 321 Stainless 18.3111 20 Distributor Nozzle BLG-07-2 Distributor Nozzle 321 Stainless 0.13
Fabricate 1
D
C
B
AA
B
C
D
Section 7SIZE
CAD FILE:
DWG. NO.B
SHEET 1 of 1
University Combustion Research Center
DATE REVISION MADE BY CK'D BY
12345678
8 7 6 5 4 3 2 1
SCALE
870 South 500 West, Salt Lake City, UT 84101(801) 238-6661
12/13/03 Ryan Okerlund
BLG-071:8 BLG-07