Embed Size (px)
Citation preview
ASPRS 2007 Annual Conference Tampa, Florida May 7-11, 2007
INVESTIGATION OF GEOMETRIC ACCURACY AND FEATURE COMPILATION OF HIGH RESOLUTION SATELLITE IMAGERY
Orhan Altan, ITU Civil Engineering Faculty
Veysel Okan Atak, General Command of Mapping
34469 Maslak-Istanbul, Turkey 06100 Ankara, Turkey
[email protected] [email protected]
ABSTRACT High resolution satellite imagery has become very popular in remote sensing and mapping society for many applications. To test the capabilities of high resolution imagery, a study has been implemented in Gölbaşı area near Ankara. This region has an area of 10 km X 10 km’s and a height difference about 440 m. 12 ground control points were revised and signalized before recording of images. Stereo-pair Ikonos (dated August 4th, 2002), mono Quickbird (dated May 26th, 2002) and 1:16.000 scaled aerial (dated August 29th, 2002) images have been provided by Inta (Turkey), Eurimage (Italy) and General Command of Mapping (Turkey).
Using different DEMs (photogrammetric, cartographic or Ikonos), various orthophotos have been produced with different ground control points distributions. 27 well-recognizable checkpoints have been defined on the imagery and measured with GPS. Horizontal coordinates of the checkpoints were measured on all orthophotos too and compared with GPS coordinates as well.
In order to test of feature compilation in 1:5.000 scale was performed in 3 different regions. Map productions from different sources (Ikonos, Quickbird and aerial images) have been compared with each other and the compiled features have been controlled on the field.
The investigations of the geometric accuracy show that the high resolution satellite images can be used in mid/large scale mapping processes (1:6.000 to 1:10.000), but feature compilation assessment results show that these images couldn’t reach to the accuracy level of aerial imagery in determining and identifying the small features yet.
INTRODUCTION
The high quality that high resolution satellite images have reached in the last years has proved that these images could be a useful data source for the production of orthophoto images and different mapping products as well. Specifically, it is very important in areas where aerial photogrammetry is not possible/feasible due to some restrictions and mapping frequency because of the flight planning limits (Li et al., 2000).
There are two important criteria for quality assessment of the data derived from these images; geometric accuracy and object definition. Taking mapping processes into consideration, these criteria are basically dependent on the relation between pixel size and the map scale, contrast information (spectral range and colour), atmosphere and the sun elevation, the printing technology and the human eye (Topan et al., 2004).
Research activities about high resolution satellite images have been mainly focusing on the geometric accuracy aspects in ortho-image generation and digital elevation model (DEM) extraction (e.g. Grodecki and Dial, 2001; Toutin, 2004). In addition to this activities, some researches are increasingly concentrating on feature detection, recognition and reconstruction studies like automated mapping of roads (e.g. Baltsavias et al., 2004), extraction of trees and 3D buildings (e.g. Fraser et al., 2002; Kim and Muller, 2006), hazard and land/water resource monitoring (e.g. Vassilopoulou et al., 2002; Sawaya et al., 2003), coastal/cadastral mapping (e.g. Wang et al., 2004; Alexandrov et al., 2004) and updating of topographic maps (Holland et al., 2002; Holland and Marshall, 2004; Holland et al., 2006).
Actually there is nearly a consensus among photogrammetry and remote sensing society that some mapping applications from high resolution space imagery can be realized in 1:6.000-1:10.000 scale (Holland and Marshall, 2004; Volpe, 2003). Accordingly, in the literature it is very seldom to see compilation assessments in big scale mapping (e.g. 1:5.000) in which both different high resolution satellite images are used and all feature types have
ASPRS 2007 Annual Conference Tampa, Florida May 7-11, 2007
been detected. Therefore nowadays, the discussions about use of high resolution space imagery in big scale map productions are still going on.
STUDY AREA AND DATA SETS Study Area
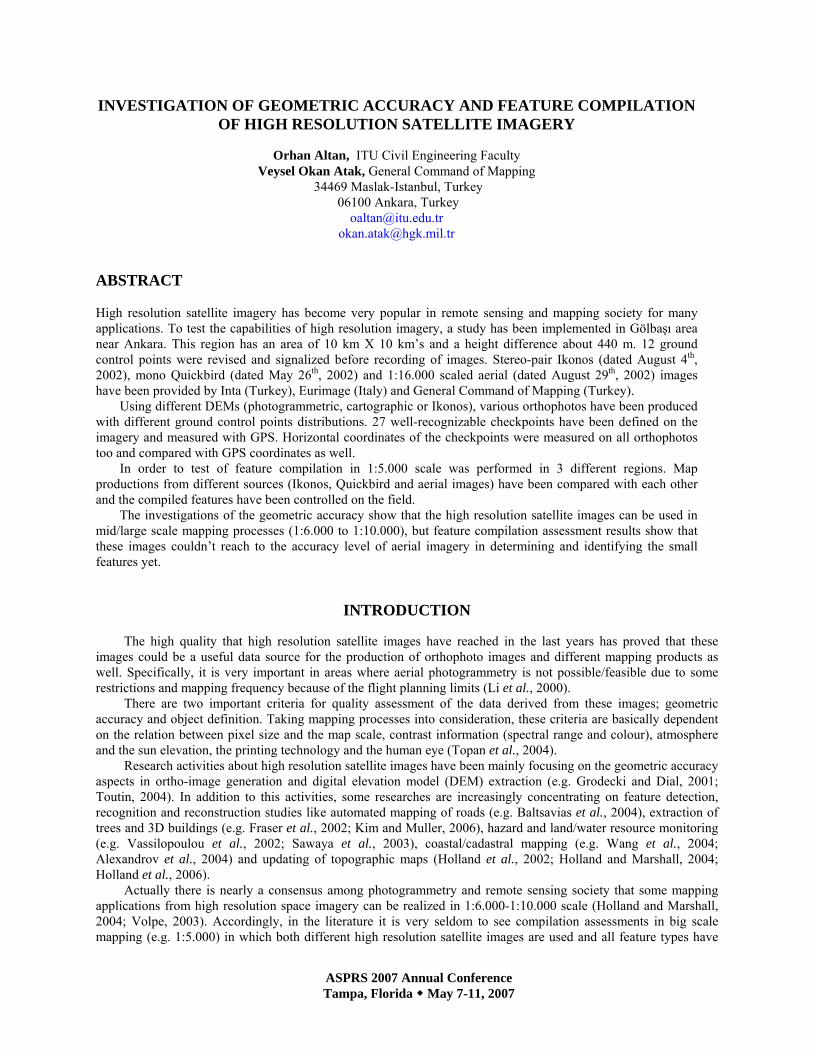
The study was carried out in Gölbaşı region near Ankara, which has 10 km X 10 km area and a height difference about 440 m. This area has been used in many photogrammetric and geodetic applications of General Command of Mapping. The region has open rural areas with different land cover types, road qualities, water features, communication and electricity transmission lines and small residential areas (Figure 1).
Figure 1. Gölbaşı test area. Ground Control Points (GCP’s)
Geometric accuracy depends on the number and distribution of GCP’s. However it is not necessary to collect a very large number of GCP’s, since the accuracy doesn’t vary in an appreciable way when considering more than 10-15 GCP’s (Volpe, 2003). In fact, the number of GCP’s down to 4/5 did not decrease the accuracy significantly and sub-meter accuracy can be achieved using only a few GCP’s and the RPC models (Baltsavias et al., 2006; Fraser et al., 2006; Michalis and Dowman, 2006). Besides, a well spread distribution of even a few GCP’s is more beneficial to accuracy improvement than a dense but poorly spread distribution (Li et al., 2000).
In this study, 12 GCP’s were established and marked in May 2002 before recording of images. The coordinates of these GCP’s have been measured with Global Positioning System (GPS). These GCP’s have been used with different distributions in the orthophoto productions.
Images
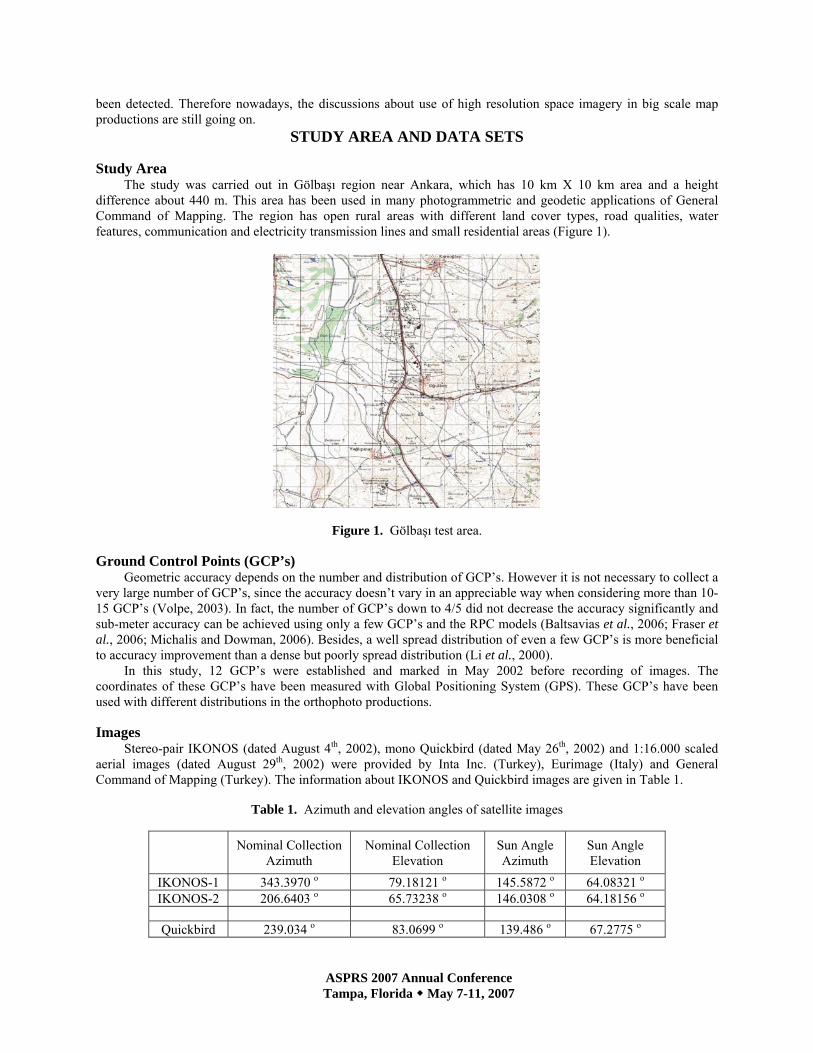
Stereo-pair IKONOS (dated August 4th, 2002), mono Quickbird (dated May 26th, 2002) and 1:16.000 scaled aerial images (dated August 29th, 2002) were provided by Inta Inc. (Turkey), Eurimage (Italy) and General Command of Mapping (Turkey). The information about IKONOS and Quickbird images are given in Table 1.
Table 1. Azimuth and elevation angles of satellite images
Nominal Collection
Azimuth Nominal Collection
Elevation Sun Angle Azimuth
Sun Angle Elevation
IKONOS-1 343.3970 o 79.18121 o 145.5872 o 64.08321 o
IKONOS-2 206.6403 o 65.73238 o 146.0308 o 64.18156 o
Quickbird 239.034 o 83.0699 o 139.486 o 67.2775 o
ASPRS 2007 Annual Conference Tampa, Florida May 7-11, 2007
1:16.000 scaled aerial images have been taken by B-200 Beechcraft airplane and with Zeiss RMK Top 15 camera. 40 photographs in 5 strips (in east-west and west-east direction) were taken during the flight using kinematic GPS technique. The overlaps between the subsequent images and the strips were % 60 and % 30 respectively. Digital Elevation Models (DEM’s)
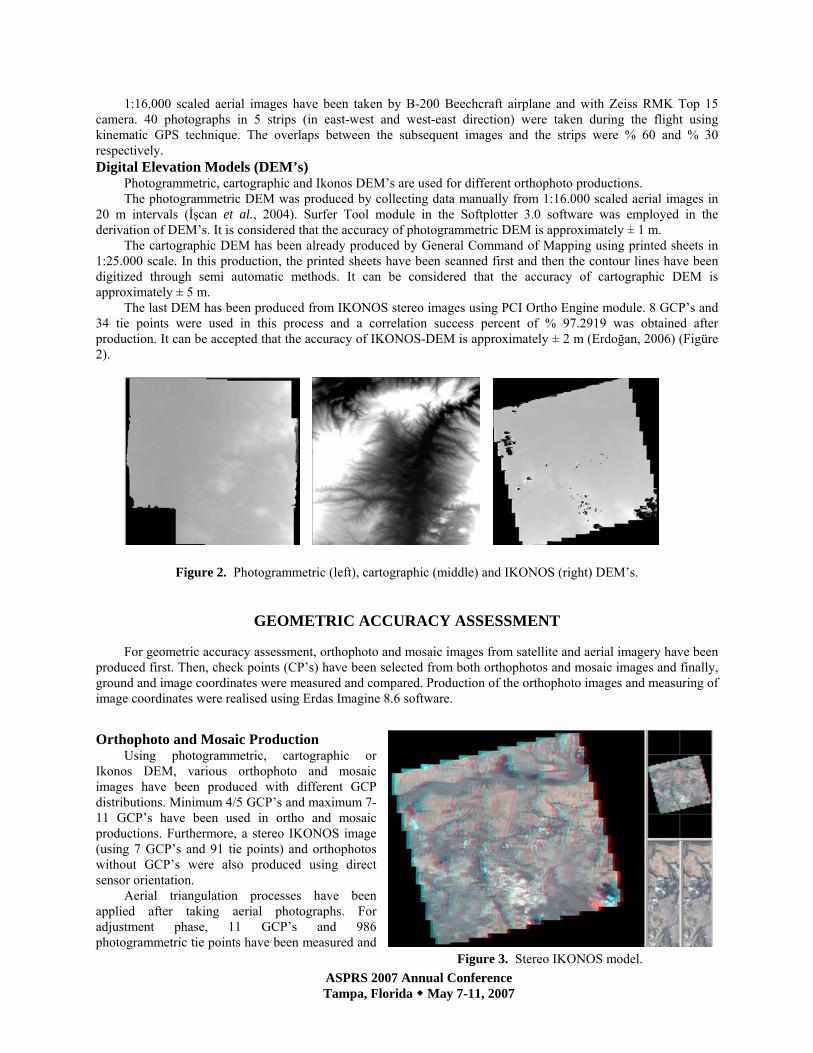
Photogrammetric, cartographic and Ikonos DEM’s are used for different orthophoto productions. The photogrammetric DEM was produced by collecting data manually from 1:16.000 scaled aerial images in
20 m intervals (İşcan et al., 2004). Surfer Tool module in the Softplotter 3.0 software was employed in the derivation of DEM’s. It is considered that the accuracy of photogrammetric DEM is approximately ± 1 m.
The cartographic DEM has been already produced by General Command of Mapping using printed sheets in 1:25.000 scale. In this production, the printed sheets have been scanned first and then the contour lines have been digitized through semi automatic methods. It can be considered that the accuracy of cartographic DEM is approximately ± 5 m.
The last DEM has been produced from IKONOS stereo images using PCI Ortho Engine module. 8 GCP’s and 34 tie points were used in this process and a correlation success percent of % 97.2919 was obtained after production. It can be accepted that the accuracy of IKONOS-DEM is approximately ± 2 m (Erdoğan, 2006) (Figüre 2).
Figure 2. Photogrammetric (left), cartographic (middle) and IKONOS (right) DEM’s.
GEOMETRIC ACCURACY ASSESSMENT
For geometric accuracy assessment, orthophoto and mosaic images from satellite and aerial imagery have been produced first. Then, check points (CP’s) have been selected from both orthophotos and mosaic images and finally, ground and image coordinates were measured and compared. Production of the orthophoto images and measuring of image coordinates were realised using Erdas Imagine 8.6 software.
Orthophoto and Mosaic Production Using photogrammetric, cartographic or
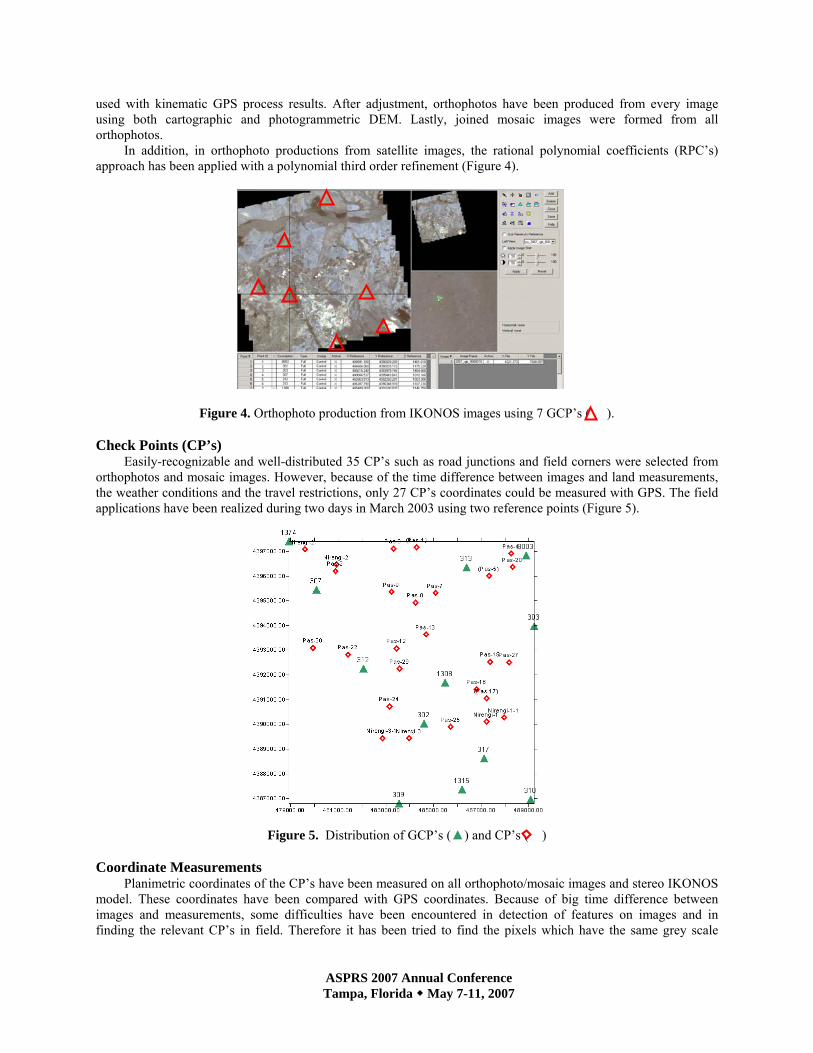
Ikonos DEM, various orthophoto and mosaic images have been produced with different GCP distributions. Minimum 4/5 GCP’s and maximum 7-11 GCP’s have been used in ortho and mosaic productions. Furthermore, a stereo IKONOS image (using 7 GCP’s and 91 tie points) and orthophotos without GCP’s were also produced using direct sensor orientation.
Aerial triangulation processes have been applied after taking aerial photographs. For adjustment phase, 11 GCP’s and 986 photogrammetric tie points have been measured and
Figure 3. Stereo IKONOS model.
ASPRS 2007 Annual Conference Tampa, Florida May 7-11, 2007
used with kinematic GPS process results. After adjustment, orthophotos have been produced from every image using both cartographic and photogrammetric DEM. Lastly, joined mosaic images were formed from all orthophotos.
In addition, in orthophoto productions from satellite images, the rational polynomial coefficients (RPC’s) approach has been applied with a polynomial third order refinement (Figure 4).
Figure 4. Orthophoto production from IKONOS images using 7 GCP’s ( ). Check Points (CP’s)
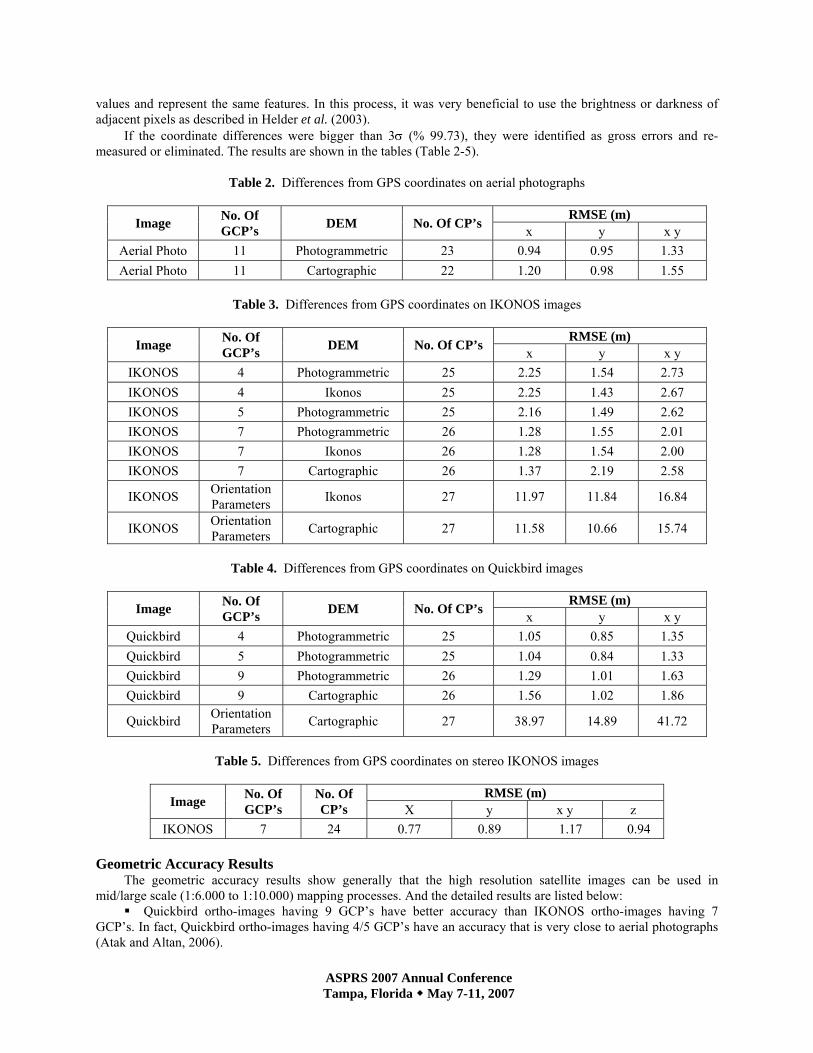
Easily-recognizable and well-distributed 35 CP’s such as road junctions and field corners were selected from orthophotos and mosaic images. However, because of the time difference between images and land measurements, the weather conditions and the travel restrictions, only 27 CP’s coordinates could be measured with GPS. The field applications have been realized during two days in March 2003 using two reference points (Figure 5).
Figure 5. Distribution of GCP’s (▲) and CP’s ( )
Coordinate Measurements Planimetric coordinates of the CP’s have been measured on all orthophoto/mosaic images and stereo IKONOS
model. These coordinates have been compared with GPS coordinates. Because of big time difference between images and measurements, some difficulties have been encountered in detection of features on images and in finding the relevant CP’s in field. Therefore it has been tried to find the pixels which have the same grey scale
ASPRS 2007 Annual Conference Tampa, Florida May 7-11, 2007
values and represent the same features. In this process, it was very beneficial to use the brightness or darkness of adjacent pixels as described in Helder et al. (2003).
If the coordinate differences were bigger than 3σ (% 99.73), they were identified as gross errors and re-measured or eliminated. The results are shown in the tables (Table 2-5).
Table 2. Differences from GPS coordinates on aerial photographs
RMSE (m) Image No. Of
GCP’s DEM No. Of CP’s x y x y Aerial Photo 11 Photogrammetric 23 0.94 0.95 1.33 Aerial Photo 11 Cartographic 22 1.20 0.98 1.55
Table 3. Differences from GPS coordinates on IKONOS images
RMSE (m) Image No. Of
GCP’s DEM No. Of CP’s x y x y IKONOS 4 Photogrammetric 25 2.25 1.54 2.73 IKONOS 4 Ikonos 25 2.25 1.43 2.67 IKONOS 5 Photogrammetric 25 2.16 1.49 2.62 IKONOS 7 Photogrammetric 26 1.28 1.55 2.01 IKONOS 7 Ikonos 26 1.28 1.54 2.00 IKONOS 7 Cartographic 26 1.37 2.19 2.58
IKONOS Orientation Parameters Ikonos 27 11.97 11.84 16.84
IKONOS Orientation Parameters Cartographic 27 11.58 10.66 15.74
Table 4. Differences from GPS coordinates on Quickbird images
RMSE (m) Image No. Of
GCP’s DEM No. Of CP’s x y x y Quickbird 4 Photogrammetric 25 1.05 0.85 1.35 Quickbird 5 Photogrammetric 25 1.04 0.84 1.33 Quickbird 9 Photogrammetric 26 1.29 1.01 1.63 Quickbird 9 Cartographic 26 1.56 1.02 1.86
Quickbird Orientation Parameters Cartographic 27 38.97 14.89 41.72
Table 5. Differences from GPS coordinates on stereo IKONOS images
RMSE (m) Image No. Of
GCP’s No. Of CP’s X y x y z
IKONOS 7 24 0.77 0.89 1.17 0.94 Geometric Accuracy Results
The geometric accuracy results show generally that the high resolution satellite images can be used in mid/large scale (1:6.000 to 1:10.000) mapping processes. And the detailed results are listed below:
Quickbird ortho-images having 9 GCP’s have better accuracy than IKONOS ortho-images having 7 GCP’s. In fact, Quickbird ortho-images having 4/5 GCP’s have an accuracy that is very close to aerial photographs (Atak and Altan, 2006).
ASPRS 2007 Annual Conference Tampa, Florida May 7-11, 2007
Moreover it has been detected that the accuracy is getting worse in IKONOS ortho-images if the number of GCP’s decreases but in the same situation the accuracy is getting better in Quickbird ortho-images. The reason of this is the GCP’s quality. Likewise the accuracy analysis using SPOT HRS stereo data by Reinartz et al. (2006) and CARTOSAT-1 pan stereo data by Michalis and Dowman (2006) imply that the same accuracy can be reached with 3/4 GCP’s as using 28/39 GCP’s.
When using direct sensor orientation parameters given by the companies (in the year 2002), IKONOS ortho-images have better accuracy than Quickbird ortho-images. But today, of course it is possible to reach better accuracy with new sensor orientation parameters.
In addition, systematic errors have been observed in the easting/north easting (across track) direction. In most studies it has been noted that the RMS geopositioning accuracy is just below ¼ pixel in the cross-track direction and close to ½ pixel in both the along-track direction and in height (Hanley and Fraser, 2004). And a significant portion of the easting errors may have been due to variations in satellite elevation, especially when the IKONOS satellite imaged at low elevation angles (Helder et al., 2003; Yamakawa and Fraser, 2004).
The results obtained from orthophotos using IKONOS-DEM and photogrammetric DEM are very close. Therefore it can be said that IKONOS-DEM can be used instead of photogrammetric DEM.
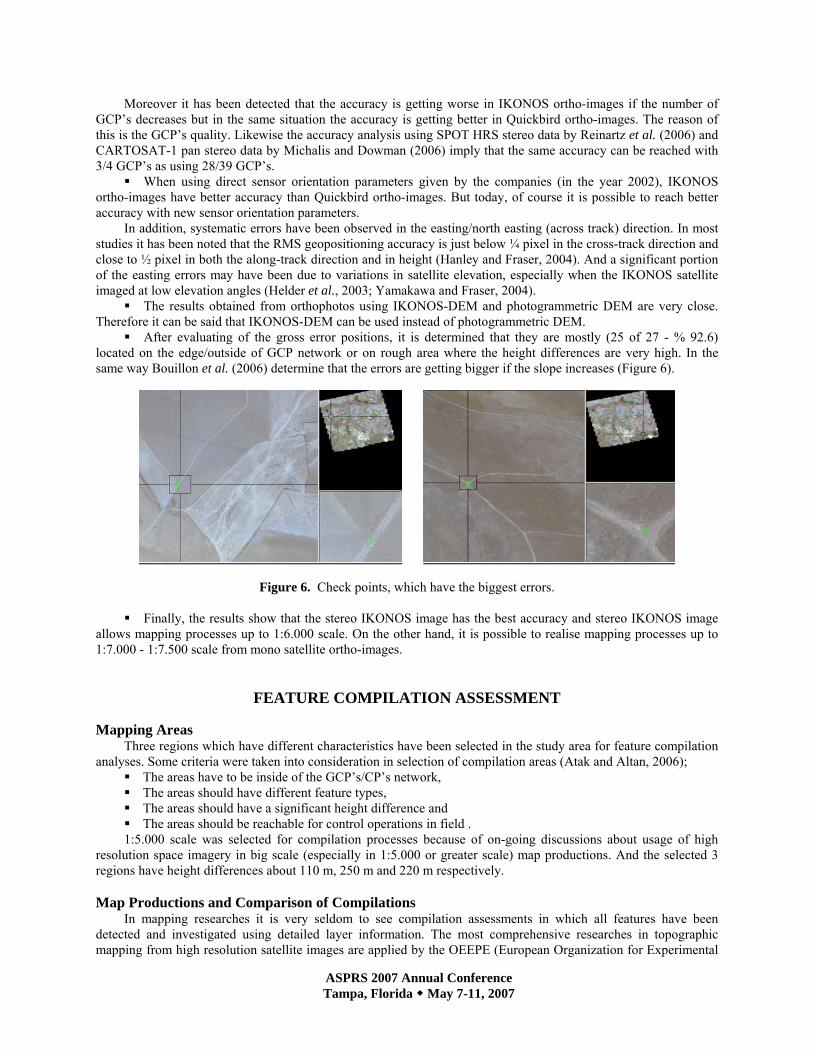
After evaluating of the gross error positions, it is determined that they are mostly (25 of 27 - % 92.6) located on the edge/outside of GCP network or on rough area where the height differences are very high. In the same way Bouillon et al. (2006) determine that the errors are getting bigger if the slope increases (Figure 6).
Figure 6. Check points, which have the biggest errors.
Finally, the results show that the stereo IKONOS image has the best accuracy and stereo IKONOS image allows mapping processes up to 1:6.000 scale. On the other hand, it is possible to realise mapping processes up to 1:7.000 - 1:7.500 scale from mono satellite ortho-images.
FEATURE COMPILATION ASSESSMENT Mapping Areas
Three regions which have different characteristics have been selected in the study area for feature compilation analyses. Some criteria were taken into consideration in selection of compilation areas (Atak and Altan, 2006);
The areas have to be inside of the GCP’s/CP’s network, The areas should have different feature types, The areas should have a significant height difference and The areas should be reachable for control operations in field .
1:5.000 scale was selected for compilation processes because of on-going discussions about usage of high resolution space imagery in big scale (especially in 1:5.000 or greater scale) map productions. And the selected 3 regions have height differences about 110 m, 250 m and 220 m respectively. Map Productions and Comparison of Compilations
In mapping researches it is very seldom to see compilation assessments in which all features have been detected and investigated using detailed layer information. The most comprehensive researches in topographic mapping from high resolution satellite images are applied by the OEEPE (European Organization for Experimental
ASPRS 2007 Annual Conference Tampa, Florida May 7-11, 2007
Photogrammetric Research, now renamed EuroSDR) using IKONOS imagery and by Ordnance Survey (UK) using Quickbird imagery. The results of these projects have been presented by Holland et al. (2002), Holland and Marshall (2004) and Holland et al. (2006).
Especially in the project applied by the Ordnance Survey, for each of the features the requirements for capture were broken down into three different levels – high, medium and low. In high level the feature must be identifiable and in medium level it would be desirable to identify the characteristic of the feature while in low level it would be of some minor interest to identify further characteristic of the feature.
And for each feature type, the cartographers recorded whether or not the features could be successfully identified from the image using the specifications of each of the different mapping scales as guidelines. Also recordings in the tables were made like; yes, no and maybe. That means; yes (y): the feature can be captured successfully, no (n): the feature cannot be captured successfully and maybe (m): in some circum-stances the feature can be captured (Holland et al., 2006).
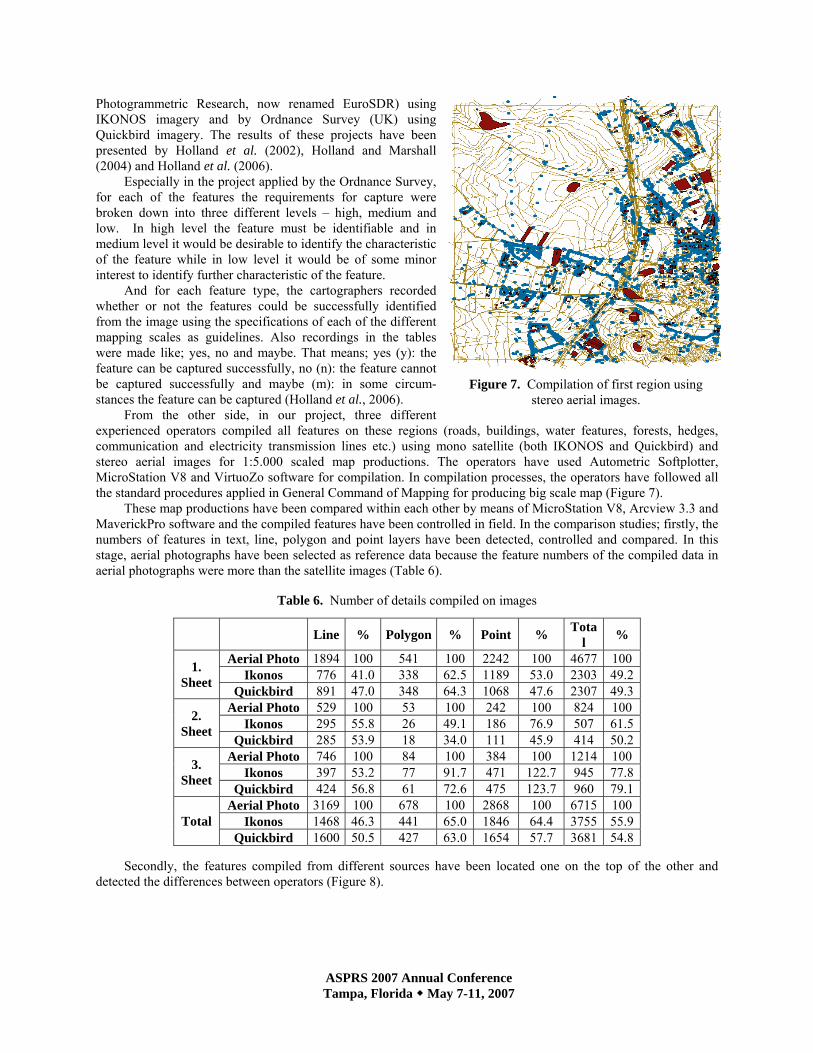
From the other side, in our project, three different experienced operators compiled all features on these regions (roads, buildings, water features, forests, hedges, communication and electricity transmission lines etc.) using mono satellite (both IKONOS and Quickbird) and stereo aerial images for 1:5.000 scaled map productions. The operators have used Autometric Softplotter, MicroStation V8 and VirtuoZo software for compilation. In compilation processes, the operators have followed all the standard procedures applied in General Command of Mapping for producing big scale map (Figure 7).
These map productions have been compared within each other by means of MicroStation V8, Arcview 3.3 and MaverickPro software and the compiled features have been controlled in field. In the comparison studies; firstly, the numbers of features in text, line, polygon and point layers have been detected, controlled and compared. In this stage, aerial photographs have been selected as reference data because the feature numbers of the compiled data in aerial photographs were more than the satellite images (Table 6).
Table 6. Number of details compiled on images
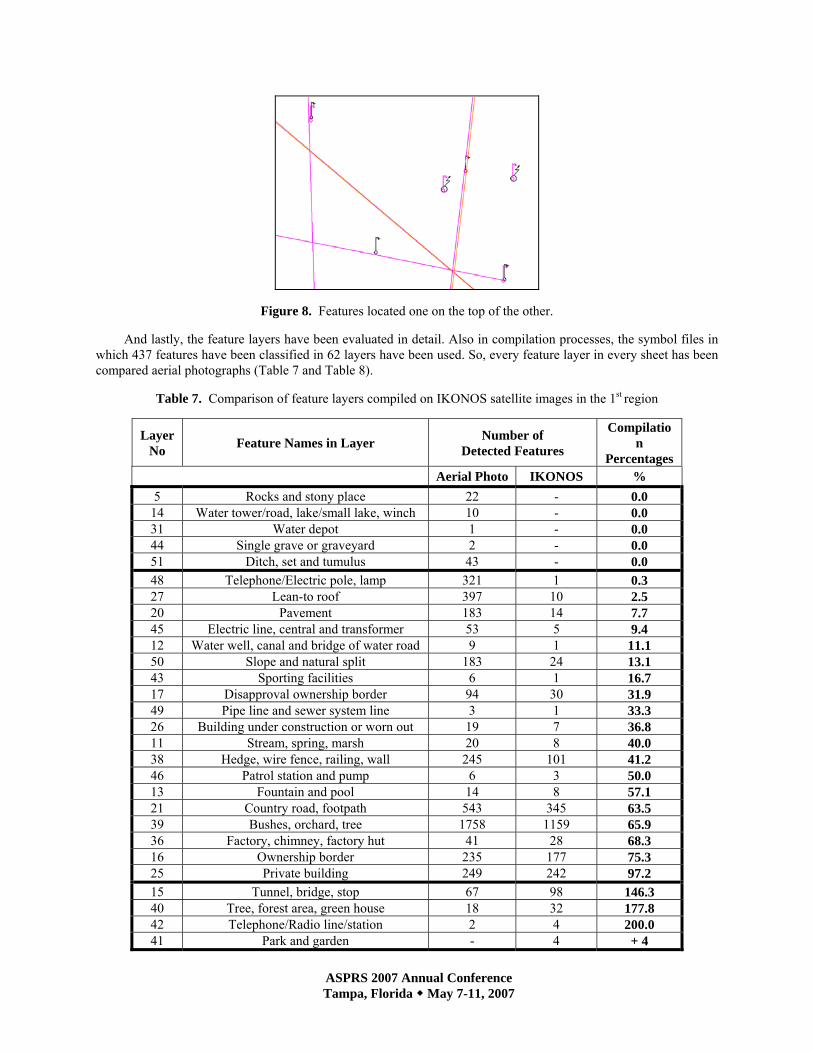
Secondly, the features compiled from different sources have been located one on the top of the other and detected the differences between operators (Figure 8).
Line % Polygon % Point % Total %
Aerial Photo 1894 100 541 100 2242 100 4677 100 Ikonos 776 41.0 338 62.5 1189 53.0 2303 49.2 1.
Sheet Quickbird 891 47.0 348 64.3 1068 47.6 2307 49.3
Aerial Photo 529 100 53 100 242 100 824 100 Ikonos 295 55.8 26 49.1 186 76.9 507 61.5 2.
Sheet Quickbird 285 53.9 18 34.0 111 45.9 414 50.2
Aerial Photo 746 100 84 100 384 100 1214 100 Ikonos 397 53.2 77 91.7 471 122.7 945 77.8 3.
Sheet Quickbird 424 56.8 61 72.6 475 123.7 960 79.1
Aerial Photo 3169 100 678 100 2868 100 6715 100 Ikonos 1468 46.3 441 65.0 1846 64.4 3755 55.9 Total
Quickbird 1600 50.5 427 63.0 1654 57.7 3681 54.8
Figure 7. Compilation of first region using stereo aerial images.
ASPRS 2007 Annual Conference Tampa, Florida May 7-11, 2007
Figure 8. Features located one on the top of the other. And lastly, the feature layers have been evaluated in detail. Also in compilation processes, the symbol files in
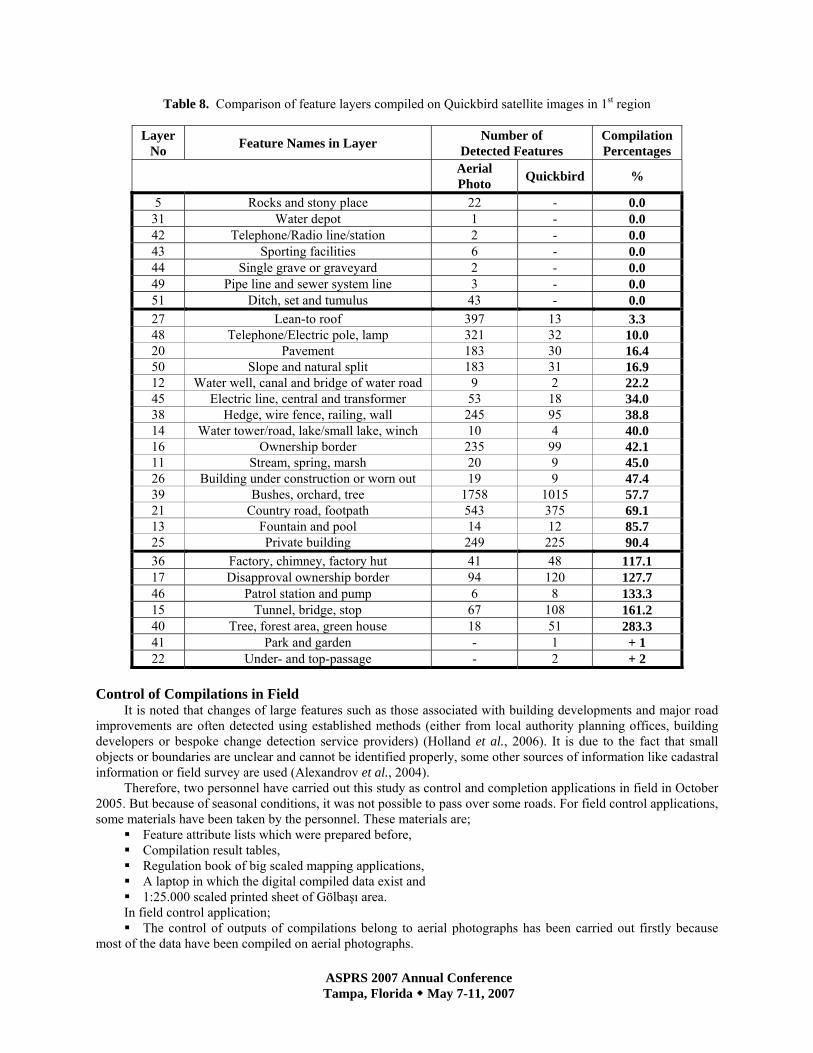
which 437 features have been classified in 62 layers have been used. So, every feature layer in every sheet has been compared aerial photographs (Table 7 and Table 8).
Table 7. Comparison of feature layers compiled on IKONOS satellite images in the 1st region
Layer No Feature Names in Layer Number of
Detected Features
Compilation
Percentages Aerial Photo IKONOS %
5 Rocks and stony place 22 - 0.0 14 Water tower/road, lake/small lake, winch 10 - 0.0 31 Water depot 1 - 0.0 44 Single grave or graveyard 2 - 0.0 51 Ditch, set and tumulus 43 - 0.0 48 Telephone/Electric pole, lamp 321 1 0.3 27 Lean-to roof 397 10 2.5 20 Pavement 183 14 7.7 45 Electric line, central and transformer 53 5 9.4 12 Water well, canal and bridge of water road 9 1 11.1 50 Slope and natural split 183 24 13.1 43 Sporting facilities 6 1 16.7 17 Disapproval ownership border 94 30 31.9 49 Pipe line and sewer system line 3 1 33.3 26 Building under construction or worn out 19 7 36.8 11 Stream, spring, marsh 20 8 40.0 38 Hedge, wire fence, railing, wall 245 101 41.2 46 Patrol station and pump 6 3 50.0 13 Fountain and pool 14 8 57.1 21 Country road, footpath 543 345 63.5 39 Bushes, orchard, tree 1758 1159 65.9 36 Factory, chimney, factory hut 41 28 68.3 16 Ownership border 235 177 75.3 25 Private building 249 242 97.2 15 Tunnel, bridge, stop 67 98 146.3 40 Tree, forest area, green house 18 32 177.8 42 Telephone/Radio line/station 2 4 200.0 41 Park and garden - 4 + 4
ASPRS 2007 Annual Conference Tampa, Florida May 7-11, 2007
Table 8. Comparison of feature layers compiled on Quickbird satellite images in 1st region
Layer No Feature Names in Layer Number of
Detected Features Compilation Percentages
Aerial Photo Quickbird %
5 Rocks and stony place 22 - 0.0 31 Water depot 1 - 0.0 42 Telephone/Radio line/station 2 - 0.0 43 Sporting facilities 6 - 0.0 44 Single grave or graveyard 2 - 0.0 49 Pipe line and sewer system line 3 - 0.0 51 Ditch, set and tumulus 43 - 0.0 27 Lean-to roof 397 13 3.3 48 Telephone/Electric pole, lamp 321 32 10.0 20 Pavement 183 30 16.4 50 Slope and natural split 183 31 16.9 12 Water well, canal and bridge of water road 9 2 22.2 45 Electric line, central and transformer 53 18 34.0 38 Hedge, wire fence, railing, wall 245 95 38.8 14 Water tower/road, lake/small lake, winch 10 4 40.0 16 Ownership border 235 99 42.1 11 Stream, spring, marsh 20 9 45.0 26 Building under construction or worn out 19 9 47.4 39 Bushes, orchard, tree 1758 1015 57.7 21 Country road, footpath 543 375 69.1 13 Fountain and pool 14 12 85.7 25 Private building 249 225 90.4 36 Factory, chimney, factory hut 41 48 117.1 17 Disapproval ownership border 94 120 127.7 46 Patrol station and pump 6 8 133.3 15 Tunnel, bridge, stop 67 108 161.2 40 Tree, forest area, green house 18 51 283.3 41 Park and garden - 1 + 1 22 Under- and top-passage - 2 + 2
Control of Compilations in Field
It is noted that changes of large features such as those associated with building developments and major road improvements are often detected using established methods (either from local authority planning offices, building developers or bespoke change detection service providers) (Holland et al., 2006). It is due to the fact that small objects or boundaries are unclear and cannot be identified properly, some other sources of information like cadastral information or field survey are used (Alexandrov et al., 2004).
Therefore, two personnel have carried out this study as control and completion applications in field in October 2005. But because of seasonal conditions, it was not possible to pass over some roads. For field control applications, some materials have been taken by the personnel. These materials are;
Feature attribute lists which were prepared before, Compilation result tables, Regulation book of big scaled mapping applications, A laptop in which the digital compiled data exist and 1:25.000 scaled printed sheet of Gölbaşı area.
In field control application; The control of outputs of compilations belong to aerial photographs has been carried out firstly because
most of the data have been compiled on aerial photographs.
ASPRS 2007 Annual Conference Tampa, Florida May 7-11, 2007
While determining an error during the controls, brief notes have been taken on the outputs about the errors. These errors have been controlled on compilation outputs belong to high-resolution satellite images. The attributes of features controlled and determined errors have been investigated on laptop. And lastly, taking all these data into consideration, it has been tried to explain the compilations (Atak and
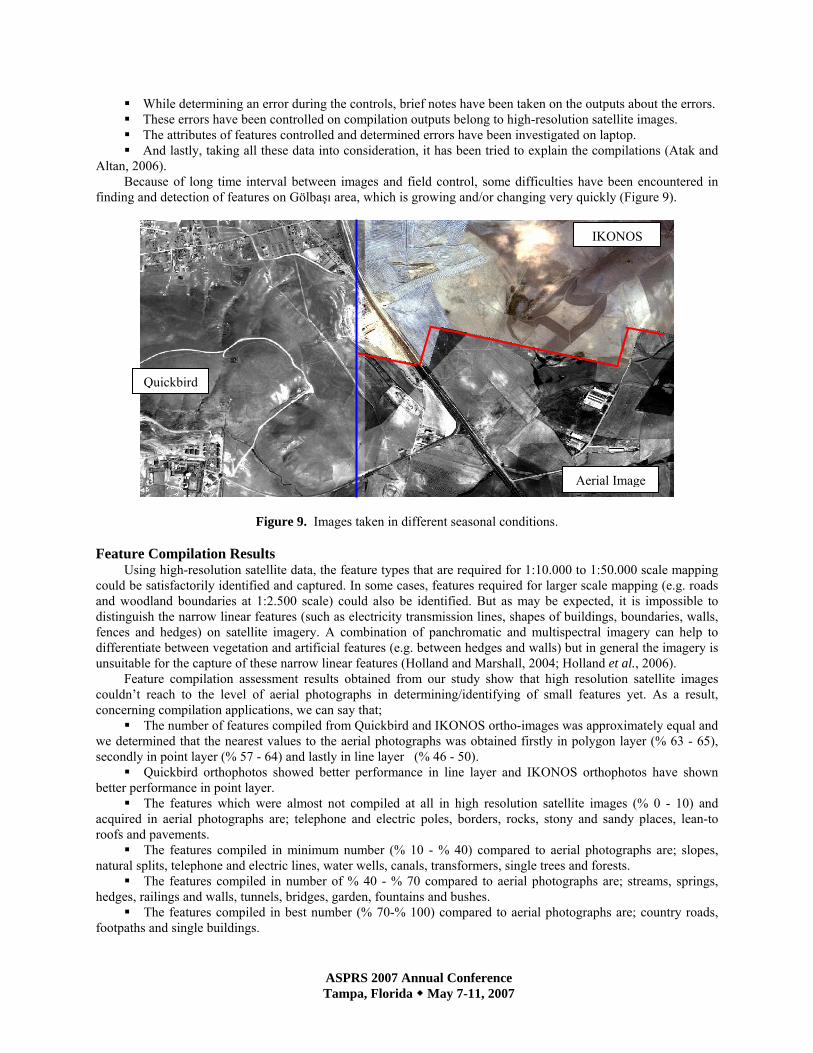
Altan, 2006). Because of long time interval between images and field control, some difficulties have been encountered in
finding and detection of features on Gölbaşı area, which is growing and/or changing very quickly (Figure 9).
Figure 9. Images taken in different seasonal conditions. Feature Compilation Results
Using high-resolution satellite data, the feature types that are required for 1:10.000 to 1:50.000 scale mapping could be satisfactorily identified and captured. In some cases, features required for larger scale mapping (e.g. roads and woodland boundaries at 1:2.500 scale) could also be identified. But as may be expected, it is impossible to distinguish the narrow linear features (such as electricity transmission lines, shapes of buildings, boundaries, walls, fences and hedges) on satellite imagery. A combination of panchromatic and multispectral imagery can help to differentiate between vegetation and artificial features (e.g. between hedges and walls) but in general the imagery is unsuitable for the capture of these narrow linear features (Holland and Marshall, 2004; Holland et al., 2006).
Feature compilation assessment results obtained from our study show that high resolution satellite images couldn’t reach to the level of aerial photographs in determining/identifying of small features yet. As a result, concerning compilation applications, we can say that;
The number of features compiled from Quickbird and IKONOS ortho-images was approximately equal and we determined that the nearest values to the aerial photographs was obtained firstly in polygon layer (% 63 - 65), secondly in point layer (% 57 - 64) and lastly in line layer (% 46 - 50).
Quickbird orthophotos showed better performance in line layer and IKONOS orthophotos have shown better performance in point layer.
The features which were almost not compiled at all in high resolution satellite images (% 0 - 10) and acquired in aerial photographs are; telephone and electric poles, borders, rocks, stony and sandy places, lean-to roofs and pavements.
The features compiled in minimum number (% 10 - % 40) compared to aerial photographs are; slopes, natural splits, telephone and electric lines, water wells, canals, transformers, single trees and forests.
The features compiled in number of % 40 - % 70 compared to aerial photographs are; streams, springs, hedges, railings and walls, tunnels, bridges, garden, fountains and bushes.
The features compiled in best number (% 70-% 100) compared to aerial photographs are; country roads, footpaths and single buildings.
Aerial Image
IKONOS
Quickbird
ASPRS 2007 Annual Conference Tampa, Florida May 7-11, 2007
As an overall assessment for field control applications, we can say that the operators have had difficulties in determining and identifying of some features existing in high resolution satellite images. These features are; water wells and transformers taking place in every private country house, communication/electricity transmission lines and sheep-folds in dense residence areas or villages, electric/illumination poles, wire hedges, small huts and lean-to roofs.
These results indicate that high-resolution satellite imagery can be used to identify topographic changes for both large- and small-scale mapping, even if this imagery cannot be used as a source of direct topographic data capture (Holland et al., 2006).
CONCLUSION
In summary, it can be said that; IKONOS-DEM can be used instead of photogrammetric DEM produced from 1:16.000 scaled aerial
images. The GCP quality, which depends on well, spread distribution and easy recognition is as important as the
number of GCP’s. When using direct sensor orientation parameters, IKONOS images have better accuracy than Quickbird
images. In addition, systematic errors have been observed in the easting/north easting (across track) direction. The compilation performance of features in Quickbird and IKONOS ortho-images were approximately the
same. And the nearest values of compilation to the aerial photographs were obtained in polygon layer. Quickbird orthophotos have shown better performance in line layer and IKONOS orthophotos exhibit
better performance in point layer. In compilation of high resolution satellite images, the operators faced difficulties in determining and
identifying of some small and complex features available. Also the geometric accuracy and feature compilation assessment results show that the high resolution satellite
images can be used in mid/large scale (1:6.000 to 1:10.000) mapping processes and these images couldn’t reach to the level of aerial images in determining and identifying of small features yet.
Lastly, in next researches, it is recommended to establish a system of artificially marked points that augment the few existing photo-identifiable man-made features. These panel markers provided clearly identifiable points for which to compare the image pixel locations to the GPS coordinates (Helder et al., 2003).
ACKNOWLEDGEMENTS
The authors express their thanks to General Command of Mapping for great contribution to this study and to Inta (Turkey) and Eurimage (Italy) for their data support.
REFERENCES Alexandrov, A., Hristova, T., Ivanova, K., Koeva, M., Madzharova, T., Petrova, V., 2004. Application of Quickbird
satellite imagery for updating cadastral information, XX. Congress of International Society for Photogrammetry and Remote Sensing (ISPRS), Commission II, Working Group II/6, 12-23 Temmuz 2004, İstanbul-Türkiye.
Atak, V. O. and Altan, M. O., 2006. Geometric accuracy and feature compilation assessment of high resolution satellite images, Proceedings of the ISPRS Commission IV Symposium on Geospatial Databases for Sustainable Development, 27-30 September 2006, Goa-India, Vol. 36, Part 4, pp. 460-465.
Baltsavias, E., O’Sullivan, L., Zhang, C., 2004. Automated road extraction and updating using the ATOMI system-performance comparison between aerial Film, ADS40, IKONOS and Quickbird orthoimagery, XX. Congress of International Society for Photogrammetry and Remote Sensing (ISPRS), Commission III, Working Group III/7, 12-23 Temmuz 2004, İstanbul-Türkiye.
Baltsavias, E., Li, Z., Eisenbeiss, H., 2006. DSM Generation and Interior Orientation Determination of Ikonos Images Using a Testfield in Switzerland, Photogrammetrie-Fernerkendung-Geoinformation, E. Schweizbart’sche Verlagsbuchhandlung, Stuttgart-Germany, 1, 41-54.

ASPRS 2007 Annual Conference Tampa, Florida May 7-11, 2007
Bouillon, A., Bernard, M., Gigord, P., Orsoni, A., Rudovski, V., Baudoin, A., 2006. Spot 5 HRS Geometric Performances: Using Block Adjustment As a Key Issue to Improve Quality of DEM Generation, ISPRS Journal of Photogrammery and Remote Sensing, 60, 134-146.
Erdoğan, M., 2006. Investigation of DEM standards according to data types, quality and production methods. Ph. D. Thesis, Istanbul Technical University, Istanbul-Türkiye (not published).
Fraser, C. S., Baltsavias, E., Gruen, A., 2002. Processing of IKONOS imagery for sub meter 3D positioning and building extraction. ISPRS Journal of Photogrammetry & Remote Sensing, No:1209, 56 (3), pp. 177-194.
Fraser, C. S., Dial, G., Grodecki, J., 2006. Sensor orientation via RPCs. ISPRS Journal of Photogrammetry & Remote Sensing, 60, pp. 182-194.
Grodecki, J. and Dial, G., 2001. IKONOS geometric accuracy. Proceedings of Joint International Workshop on High Resolution Mapping from Space, 19-21 September 2001, Hannover – Germany, pp. 77-86.
Hanley, H. B.and Fraser, C. S., 2004. Sensor orientation for high-resolution satellite imagery: Further insights into bias-compensated RPCs. XX. Congress of International Society for Photogrammetry and Remote Sensing (ISPRS), Commission I, Working Group I/2, 12-23 July 2004, Istanbul-Türkiye
Helder, D., Coan, M., Patrick, K., Gaska, P., 2003. IKONOS geometric characterization. Remote Sensing of Environment, No: 88, pp. 69-79.
Holland, D., Guilford, R., Murray, K., 2002. OEEPE Official Publication, No.44, OEEPE Project on Topographic Mapping from High Resolution Space Sensors.
Holland, D. and Marshall, P., 2004. Updating maps in a well-mapped country using high resolution satellite imagery. XX. Congress of International Society for Photogrammetry and Remote Sensing (ISPRS), Commission II, Working Group II/6, 12-23 July 2004, İstanbul-Türkiye.
Holland, D. A., Boyd, D. S., Marshall, P., 2006. Updating topographic mapping in Great Britain using imagery from high-rosolution satellite sensors. ISPRS Journal of Photogrammetry & Remote Sensing, 60, pp. 212-223.
Iscan, L., Aksu, O., Önder, M., Atak, V.O., Lenk, O., Gürdal, M.A., 2004. Accuracy assessment of high resolution satellite images. XX. Congress of International Society for Photogrammetry and Remote Sensing (ISPRS), Commission IV, Working Group IV/7, 12-23 July 2004, İstanbul-Türkiye.
Kim, J. R. and MUller. J. P., 2006. Automated tree and building detection in residential areas from stereo IKONOS images, Proceedings of the ISPRS Commission IV Symposium on Geospatial Databases for Sustainable Development, 27-30 September 2006, Goa-India, Vol. 36, Part 4, pp. 157-163.
Li, R., Zhou, G., Yang, S., Tuell, G., Schmidt, N. J., Fowler, C., 2000. A study of the potential attainable geometric accuracy of IKONOS satellite imagery. IXX., Working Group IV/6, 16-23 July 2000, Amsterdam-Holland.
Michalis, P. and Dowman, I., 2006. Sensor model evaluation and DEM generation for CARTOSAT-1, Proceedings of the ISPRS Commission IV Symposium on Geospatial Databases for Sustainable Development, 27-30 September 2006, Goa-India, IAPRS&SIS, Vol. 36, Part 4, pp. 1009-1013.
Reinartz, P., Müller, R., Lehner, M., Schröder, M., 2006. Accuracy analysis for DSM and orthoimages derived from SPOT HRS stereo data using direct georeferencing. ISPRS Journal of Photogrammetry & Remote Sensing, 60, pp. 160-169.
Sawaya, K. E., Olmanson, L. G., Heinert, N. J., Brezonik, P. L., Bauer M. E., 2003. Extending satellite remote sensing to local scales: Land and water resource monitoring using high-resolution imagery, www.sciencedirect.com ve www.elsevier.com/locate/rse (last date accessed: 20 March 2005).
Topan, H., Büyüksalih, G., Jacobsen K., 2004. Comparison of information contents of high resolution space images. XX. Congress of International Society for Photogrammetry and Remote Sensing (ISPRS), Working Group IV/7, 12-23 July 2004, Istanbul-Türkiye.
Toutin, T., 2004. DSM generation and evaluation from Quickbird stereo imaging with 3D physical modelling. International Journal of Remote Sensing, 20 November 2004, Volume 25, No: 22, pp. 5181-5193.
Vassilopoulou, S., Hurni, L., Dietrich, V., Baltsavias, E., Pateraki, M., Lagios, E., Parcharidis, L., 2002. Orthophoto generation using Ikonos imagery and high-resolution DEM: A case study on volcanic of hazard monitoring of Nisyros island (Greece), ISPRS Journal of Photogrammetry and Remote Sensing, 57, 24-38.
Volpe, F., 2003. Geometrical processing of Quickbird high resolution satellite data. Joint ISPRS/EARSEL International Workshop ‘High Resolution Mapping from Space’, 6-8 October 2003, Hannover-Germany.
Wang, L., Sousa, W. P., Gong, P., Biging, G. S., 2004. Comparison of Ikonos and QuickBird images for mapping mangrove species on the Caribbean coast of Panama, Remote Sensing of Environment, 91, 432–440.
Yamakawa, T. and Fraser, C.S., 2004. The affine projection model for sensor orientation: experiences with high-resolution satellite imagery. XX. Congress of International Society for Photogrammetry and Remote Sensing (ISPRS), Commission I, Working Group I/5, 12-23 July 2004, Istanbul-Türkiye.